3.0 assabet river data collection program description · 3.0 assabet river data collection program...
TRANSCRIPT

J:\Pubs\mw97\Projects\9000259\100\new all.doc November, 20013-1
3.0 ASSABET RIVER DATA COLLECTION PROGRAM DESCRIPTION
3.1 Overview
A nutrient TMDL is under development for the Assabet River due to the presence of summer-timeeutrophic conditions. Field measurements of hydrologic, water quality, sediment quality, and biology inthe Assabet River system were required to support development of a nutrient TMDL. Followingcompletion of a review of available data on the Assabet River (see Section 2), a data collectionprogram was designed and performed to obtain required data. A description of the Assabet River datacollection program, including the rationale for field data collection and a description of all surveysperformed, is provided in this section.
The goal of the field program was to quantify and document the presence of eutrophic conditions andto support development and application of a nutrient TMDL model of the Assabet River. The field datacollection program was designed collaboratively by ENSR, the US Army Corps of Engineers (USACE),the Massachusetts Department of Environmental Protection (MADEP), the Organization for theAssabet River (OAR), and other interested parties. Nutrient loadings and dynamics in the AssabetRiver system are a primary focus of this study. The study also focused on characterizing the aquaticbiology of the Assabet River and the interrelationship between nutrients and biology in the system.The impact of biological activity on ambient dissolved oxygen concentrations was also evaluated. Insummary, the field program was designed to gather as much information as possible about nutrientloadings and dynamics, aquatic biology, and ambient dissolved oxygen in the Assabet River system.
A significant effort was made, in collaboration with USACE, MADEP, and OAR, to design the fieldprogram to capture both worst-case conditions in terms of eutrophication in the Assabet River systemand to capture a set of nutrient loading characterizations under very different seasonal and hydrologicconditions. The field program featured collection of measurements throughout the river, in riverimpoundments, from point sources, and from tributaries. The field program was designed to providethe information necessary to determine the relative impacts of different processes affectingeutrophication.
The conceptual approach to Assabet River data collection is described in Section 3.2. The AssabetRiver study area is described in Section 3.3. A description of the data collection program is provided inSection 3.4. Data collection methods are described in Section 3.5.
3.2 Conceptual Approach to Data Collection
The conceptual approach of the data collection program was to obtain sufficient data to supportcharacterization of summer-time eutrophication conditions and to support characterization of nutrientloadings under different seasonal and hydrologic conditions throughout the Assabet River system.

J:\Pubs\mw97\Projects\9000259\100\new all.doc November, 20013-2
Characterization of summer-time eutrophication conditions will serve to quantify water qualityimpairment in the Assabet River. Characterization of time-varying nutrient loadings will supportassessment of relative impacts of individual nutrient sources and nutrient-related processes on waterquality in the Assabet River under a variety of conditions. These characterizations will contribute to anenhanced understanding of the nutrient loadings and associated system response throughout the year.
As described in Section 2, eutrophication has been observed in the Assabet River during the summermonths and nutrient loadings have been measured at levels sufficient to support eutrophication innumerous previous surveys. During the summer season, extensive nuisance aquatic vegetation hasbeen frequently observed and dissolved oxygen concentration measurements at levels below thewater quality standard of 5.0 mg/l have frequently been collected. Clearly, the summer season, whensufficient nutrients, maximum solar irradiance, and maximum water temperature are present, providesfavorable conditions for eutrophication. The data collection program was designed to quantify thehydrologic, water quality, sediment quality, and biological characteristics associated with summer-timeeutrophication events.
Characterization of nutrient loadings to the River and nutrient dynamics within the River throughout theyear was also a focus of the data collection program. Contributors to the overall nutrient budgetinclude point sources (such as wastewater treatment facilities), non-point sources (such as tributaries),river sediments, and atmospheric deposition. The data collection program was designed to collectsufficient data to support quantification of relative impacts to the river system associated with nutrientloading sources and nutrient processes.
Phosphorus and nitrogen are the two primary essential nutrients for plant growth. Phosphorus is foundin dissolved and particulate forms in the aquatic environment. Dissolved phosphorus contains ortho-phosphorus that is representative of biologically available phosphorus. Ortho-phosphorus may bereadily taken up by aquatic organisms. Total phosphorus represents both the dissolved form (includingortho-phosphorus) and the particulate form that must be converted by natural biological processesprior to aquatic plant uptake. Thus, ortho-phosphorus is readily available phosphorus and totalphosphorus represents the total amount of phosphorus that may potentially be taken up by aquaticorganisms.
Nitrogen is found in several forms in the aquatic environment. Some nitrogen forms are more readilyavailable for uptake by aquatic organisms than others. Ammonium and nitrate are the two forms ofnitrogen that are most readily accessible for biological uptake. Organic nitrogen, in contrast, is boundup in organic material and is unavailable for immediate bioligical uptake. Organic nitrogen is alsoimportant, however, because it may converted through natural biological processes into ammoniumand nitrate forms and taken up by aquatic organisms. The field program was designed to quantify allof the forms of phosphorus and nitrogen described above.

J:\Pubs\mw97\Projects\9000259\100\new all.doc November, 20013-3
The data collection program was also designed to support development and application of amathematical model of the Assabet River system. Assabet River nutrient TMDL modelingrequirements include quantification of nutrient loadings to the system throughout the year,determination of water column chemical and biological processes, and sediment nutrient/water columninteractions in the Assabet River system. The data collection program was designed to collect the datarequired to support nutrient TMDL modeling of the Assabet River.
3.3 Description of Study Area and Data Collection Activities
The Assabet River study area is shown in Figure 3-1. For a physical description of the Assabet River,please refer to Section 2.2. The study area extends from Maynard Street, Westborough, MA (RM30.7) to Park Street, in Concord, MA (RM 1.6). The study domain included 23 river sampling locations,10 tributary sampling locations, and numerous river impoundment sampling locations. Figure 3-2contains a cross-sectional view of the Assabet River with river sampling locations identified. Throughschematic physical representation, Figure 3-2 provides a sense of the relative river slope and supportscomparison of rates of water movement along the Assabet River.
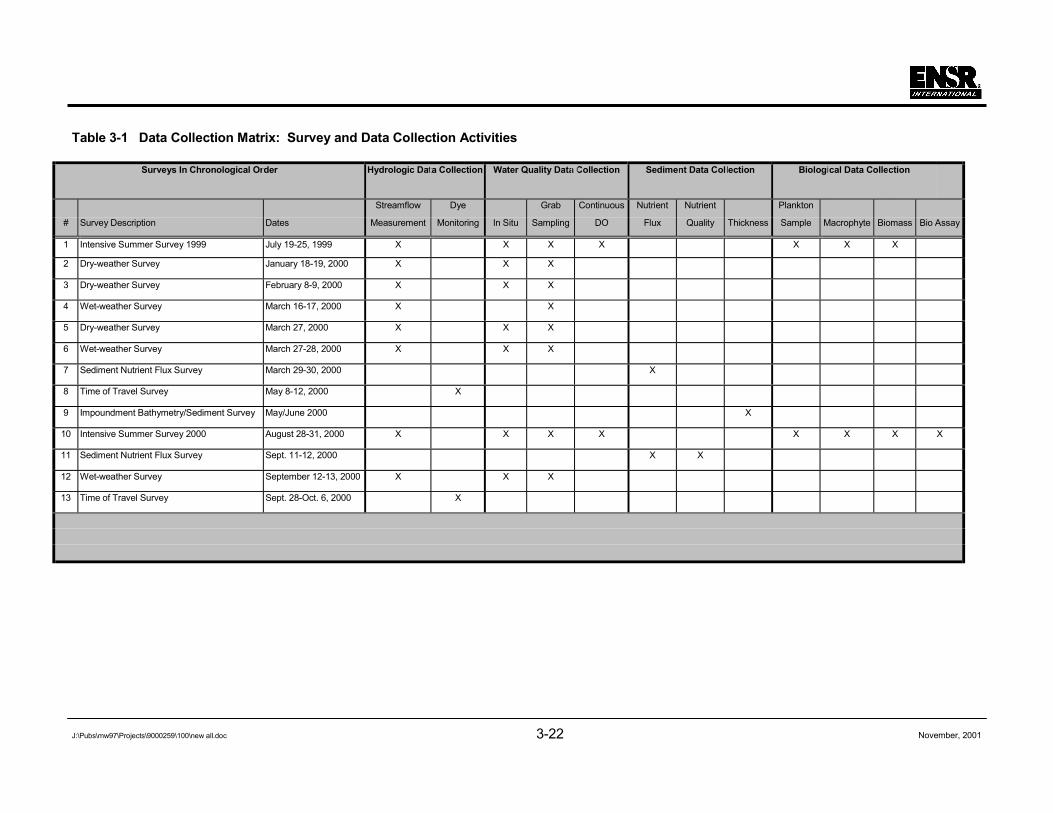
The Assabet River data collection program involved collection of hydrologic, water quality, sedimentquality, and biological data during 13 surveys performed from July 1999 through October 2000. Table3-1 provides a matrix of survey events and data collection activities. Field survey events are presentedin chronological order in Table 3-1 with an “X” signifying performance of data collection activities.
The data collection program involved collection of measurements at 23 river locations, in 5 riverimpoundments and in 10 river tributaries throughout the Assabet River system. Table 3-2 provides amatrix of field survey types and sampling locations. Sampling locations are provided along withrivermile designations and may be viewed spatially in Figure 3-1. For each survey type, data werecollected at all locations designated with an “X” in Table 3-2. Survey types are described in Section3.5 and correspond to designations provided in Table 3-1. Methods applied to collect hydrologic, waterquality, sediment quality, and bioligical data are described in Section 3.5. A summary of all datacollection results is provided in Sections 4 through 7.
3.4 Description of Field Surveys
This section provides a description of each survey type, including survey objectives, sampling designrationale, and specific sampling tasks. The 13 field surveys presented in Table 3-1 may becategorized into 6 types of surveys as follows:
• Intensive summer surveys (2) - conducted July 1999 and August 2000
• Dry-weather surveys (3) – conducted January, February, and March 2000
• Wet-weather tributary surveys (3) – conducted March (2) and September 2000

J:\Pubs\mw97\Projects\9000259\100\new all.doc November, 20013-4
• Sediment nutrient flux surveys (2) – conducted March and September 2000
• Impoundment bathymetry/sediment thickness survey (1) – conducted May/June 2000
• Time of travel surveys (2) – May and September/October 2000
Each type of survey is described below.
3.4.1 Intensive Summer Surveys
Intensive summer surveys were designed to characterize the Assabet River system during summer-time eutrophication conditions and to support calibration and validation of the Assabet River nutrientTMDL model. Summer conditions in the Assabet River are worst-case in terms of water qualitybecause the factors associated with favorable biological growth are optimal (e.g., optimal solarconditions and water temperature to support photosynthetic activity). Two intensive summer surveyswere performed to collect hydrologic, water quality, sediment quality, and biological measurementsthroughout the Assabet River mainstem, in tributaries, and in river impoundments.
The intensive summer-time surveys were performed during summer-time low flow and average flowconditions in July 1999 and August/September 2000, respectively. Data were collected during twodifferent hydrologic conditions to support model calibration and validation tasks. Low-flow summer-time conditions in the river are likely worst-case because water movement is relatively slow allowingbiomass extended exposure to available nutrients. Also, during low-flow conditions, publicly-ownedtreatment works (POTWs) effluents receive minimal dilution in ambient waters and thus likely havegreatest impact on river water quality.
Specific data collection tasks performed during the two intensive summer-time surveys are describedbelow.
3.4.1.1 Intensive Summer 1999 Survey
During the Intensive Summer 1999 Survey, water quality sampling was conducted at the locationsshown in Figure 3-1 as indicated in the data collection matrix of Table 3-2. The following datacollection activities were performed as part of the Summer 1999 survey.
Hydrologic data collection
• In the river, streamflow and average water velocity measurements were collected at 4 riverlocations.
• In tributaries, streamflow and average water velocity measurements were collected at 2tributary locations.

J:\Pubs\mw97\Projects\9000259\100\new all.doc November, 20013-5
• In point sources, average flowrates from 4 point source discharges were measured andobtained from POTWs.
Water quality data collection
• In the river, in-situ water quality measurements of temperature, dissolved oxygenconcentration, pH, and conductivity were collected at 21 river locations throughout a 3-dayperiod including early morning and late afternoon measurements to capture diurnalvariations. Also, continuous in-situ water quality measurements were collected at 5locations over an approximately 24-hour period to more intensively quantify diurnalvariations.
• In the river, grab samples were collected for laboratory analysis of nutrient-related chemicalparameters (compiled in Table 3-3) at 21 river locations and in 5 river impoundments tosupport quantification of water quality conditions on two separate days (i.e., two completerounds of sampling).
• In tributaries, in-situ water quality measurements of temperature, dissolved oxygenconcentration, pH, and conductivity were collected at 5 tributary locations.
• In tributaries, grab samples were collected for laboratory analysis of nutrient-relatedchemical parameters (Table 3-3) at 5 tributary locations to support quantification of waterquality conditions.
• In point sources, grab samples were collected for laboratory analysis of nutrient-relatedchemical parameters (Table 3-3) at 4 POTWs (obtained from POTWs).
Biological data collection
• In the river, aquatic macrophyte sampling and analysis was performed includingidentification and estimation of total biomass in 5 river impoundments. Locations of the 5river impoundments are shown in Figure 3-1.
• In the river, phytoplankton sampling and analysis was performed including identification andestimation of total biomass in 5 river impoundments.
Additional data collection
• Obtained precipitation and air temperature records for the watershed during and preceedingthe study period. These meteorologic data were collected from local airports, USGSgauging stations, and POTWs.
• Obtained USGS Maynard streamflow gauge data preceeding and concurrent with studyperiod.
J:\Pubs\mw97\Projects\9000259\100\new all.doc November, 20013-6
3.4.1.2 Intensive Summer 2000 Survey
During the Intensive Summer 2000 Survey, water quality sampling was conducted at the locationsshown in Figure 3-1 as indicated in the data collection matrix of Table 3-2. The following data collectionactivities were performed as part of the Summer 2000 survey.
Hydrologic data collection
• In the river, streamflow and average water velocity measurements were collected at 8 riverlocations.
• In tributaries, streamflow and average water velocity measurements were collected at 10tributary locations.
• In point sources, average flowrate from 4 point source discharges were measured andobtained from POTWs.
Water quality data collection
• In the river, in-situ water quality measurements of temperature, dissolved oxygenconcentration, pH, and conductivity were collected at 23 river locations throughout a 3-dayperiod including early morning and late afternoon measurements to capture diurnalvariations. Also, continuous in-situ water quality measurements were collected at 6locations over an approximately 48-hour period to more intensively quantify diurnalvariations.
• In the river, grab samples were collected for laboratory analysis of nutrient-related chemicalparameters (Table 3-3) at 23 river locations and in 5 river impoundments to supportquantification of water quality conditions.
• In tributaries, in-situ water quality measurements of temperature, dissolved oxygenconcentration, pH, and conductivity were collected at 10 tributary locations including earlymorning and late afternoon measurements to capture diurnal variations. The 10 tributarylocations were selected because they drain the largest 10 sub-basins in the watershed (seeTable 2-2).
• In tributaries, grab samples were collected for laboratory analysis of nutrient-relatedchemical parameters (Table 3-3) at 10 tributary locations.
• In point sources, grab samples were collected for laboratory analysis of nutrient-relatedchemical parameters (Table 3-3) at 4 POTWs (obtained from POTWs) discharging to theAssabet River during the week of the field survey.

J:\Pubs\mw97\Projects\9000259\100\new all.doc November, 20013-7
Biological data collection
• In the river, aquatic macrophyte sampling and analysis was performed including speciesidentification and estimation of total biomass in 5 river impoundments. Locations of the 5river impoundments are shown in Figure 3-1.
• In the river, phytoplankton sampling and analysis was performed including identification andestimation of total biomass in 5 river impoundments.
• In the river, zooplankton sampling and analysis was performed including identification andestimation of total biomass in 5 river impoundments.
Additional data collection
• Obtained precipitation and air temperature records for the watershed during and preceedingthe study period. These meteorologic data were collected from local airports, USGSgauging stations, and POTWs.
• Obtained USGS Maynard streamflow gauge data preceeding and concurrent with studyperiod.
3.4.2 Dry-weather Surveys
Dry-weather surveys were performed to measure nutrient loads from tributaries and in the rivermainstem during the winter and spring months. Nutrient loadings were measured in the 6 largestAssabet River tributaries and above and below the 5 major Assabet River impoundments. Winter-timenutrient loads were measured to support estimation of the time-varying nutrient budget of the AssabetRiver system. Tributaries and river impoundments nutrient loadings were evaluated because theyrepresent an important component of the overall nutrient budget.
Nutrient loads from tributaries were measured to support quantification of non-point source loadingsthroughout the year. Nutrient loads of waters entering and leaving 5 river impoundments were alsomeasured as part of the winter-time dry-weather surveys. Nutrient loadings associated with riverimpoundments were measured to evaluate the capacity of river impoundments to act as nutrientreservoirs. Specifically, the capacity for river impoundments to act as nutrient “sinks” (i.e., a placewhere nutrients are stored) during the winter-time and nutrient “sources” during summer-time wasevaluated through the dry-weather survey program.
During the dry-weather surveys, water quality sampling was conducted at the locations shown inFigure 3-1 as indicated in the data collection matrix of Table 3-2. The three dry-weather water qualitysurveys on the Assabet River were performed during the Winter of 2000 (Table 3-1). The surveysincluded collection of hydrologic and water quality measurements at 16 locations, 10 locations along

J:\Pubs\mw97\Projects\9000259\100\new all.doc November, 20013-8
the mainstem and 6 locations in contributing tributaries (Table 3-2). The following data collectionactivities were performed as part of the dry-weather surveys.
Hydrologic data collection
• In the river, streamflow and average water velocity measurements were collected at 10 riverlocations.
• In tributaries, streamflow and average water velocity measurements were collected at 6tributary locations
• In point sources, average flowrate from 4 point source discharges were measured andobtained from POTWs.
Water quality data collection
• In the river, in-situ water quality measurements of temperature, dissolved oxygenconcentration, pH, and conductivity were collected at 10 river locations.
• In the river, grab samples were collected for laboratory analysis of nutrient-related chemicalparameters (Table 3-3) at 10 river locations.
• In tributaries, in-situ water quality measurements of temperature, dissolved oxygenconcentration, pH, and conductivity were collected at 6 tributary locations.
• In tributaries, grab samples were collected for laboratory analysis of nutrient-relatedchemical parameters (Table 3-3) at 6 tributary locations.
• In point sources, grab samples were collected for laboratory analysis of nutrient-relatedchemical parameters (Table 3-3) at 4 POTWs (obtained from POTWs) discharging to theAssabet River during the week of the field survey.
Additional Data Collection
• Obtained precipitation and air temperature records for the watershed during and preceedingthe study period. These meteorologic data were collected from local airports, USGSgauging stations, and POTWs.
• Obtained USGS Maynard streamflow gauge data preceeding and concurrent with studyperiod.
3.4.3 Wet-weather Surveys
Wet-weather surveys were performed to measure nutrient loads from tributaries during precipitationevents. Nutrient loadings from non-point sources are highly variable over time. In general, nutrient
J:\Pubs\mw97\Projects\9000259\100\new all.doc November, 20013-9
non-point source loadings increase dramatically during precipitation events as overland andsubsurface flows carry nutrients to the receiving waterbody. Wet-weather non-point source nutrientloads were measured to evaluate the time-varying nutrient budget of the Assabet River system. Wet-weather nutrient loads were measured in the 10 largest Assabet River tributaries because theyrepresent an important component of the overall nutrient budget.
The wet-weather surveys were designed to quantify non-point nutrient loads and support assessmentof the relative contribution of non-point source loads to the overall Assabet River nutrient budget.Specifically, wet-weather surveys were designed to capture nutrient concentrations in tributaries to theAssabet River during the rising limb of storm hydrographs induced by precipitation events. Bycapturing storm induced nutrient concentrations in tributaries, nutrient loadings from overland flow maybe estimated and determinations made regarding the relationship between nutrient loads and landusepractices within the tributary watersheds.
During the wet-weather surveys, water quality sampling was conducted at the locations shown inFigure 3-1 as indicated in the data collection matrix of Table 3-2. Three wet-weather water qualitysurveys were performed during precipitation events during the Winter and Summer of 2000 (Table 3-1). The surveys included collection of hydrologic and water quality measurements at 10 tributarylocations. Wet-weather survey methods featured deployment of automated water samplingequipment. A complete description of data collection methods is provided in Section 3.5. Thefollowing data collection activities were performed as part of the wet-weather surveys.
Hydrologic Data Collection
• In tributaries, streamflow and average water velocity measurements were collected at 10tributary locations prior to the precipitation event to quantify baseflow conditions.
• In point sources, average flowrate from 4 point source discharges were measured andobtained from POTWs.
Water Quality Data Collection
• In tributaries, in-situ water quality measurements of temperature, dissolved oxygenconcentration, pH, and conductivity were collected at 10 tributary locations.
• In tributaries, grab samples were collected for laboratory analysis of nutrient-relatedchemical parameters (Table 3-3) at 10 tributary locations.
• In point sources, grab samples were collected for laboratory analysis of nutrient-relatedchemical parameters (Table 3-3) at 4 POTWs (obtained from POTWs) discharging to theAssabet River during the week of the field survey.

J:\Pubs\mw97\Projects\9000259\100\new all.doc November, 20013-10
Additional Data Collection
• Obtained precipitation and air temperature records for the watershed during and preceedingthe study period. These meteorologic data were collected from local airports, USGSgauging stations, and POTWs.
• Obtained USGS Maynard streamflow gauge data preceeding and concurrent with studyperiod.
3.4.4 Sediment Nutrient Flux Surveys
Sediment nutrient flux surveys were performed to evaluate the impact of impoundment sediments onthe nutrient budget of the Assabet River system. Nutrients are cycled between the water column andsediments in river impoundments and this process may represent a significant portion of the overallnutrient budget. The overall objective of the nutrient flux surveys was to quantify the flux of selectednutrients and oxygen between the sediments and their overlying waters. The magnitude of sedimentnutrient fluxes is influenced by many environmental factors including temperature and availability oflabile organic carbon and oxygen. In particular, the sediment nutrient flux surveys are important toquantify phosphorus retention in river impoundments including recycling rates and sediment storagecapacity.
Two sediment nutrient flux surveys were performed as part of the Assabet River data collectionprogram. The first survey, performed in March 2000, featured collection and analysis of sedimentnutrient flux from 8 sediment cores collected in the Ben Smith Impoundment. The second survey,performed in September 2000, featured collection and analysis of sediment nutrient flux from 8sediment cores from the Ben Smith Impoundment and from 8 sediment cores collected in thePowdermill Impoundment. The September 2000 survey also featured sediment quality analyses ofortho-phosphorus, ammonia, total nitrogen, total carbon, dry weight density, and porosity in the 5 majorriver impoundments; Allen St Impoundment (RM 25), Hudson Impoundment (RM 18), GleasondaleImpoundment (RM 14.5), Ben Smith Impoundment (RM 9), and Powdermill Impoundment (RM 6.5).
Sediment nutrient flux measurement methods are described in Section 3.5 below and are summarizedin Section 6.
3.4.5 Time of Travel Surveys
Time of travel surveys were performed to support hydrologic characterization of the river system. Timeof travel measurements, together with streamflow measurements, provide sufficient data to supportdevelopment and application of the hydrologic component of the Assabet River water quality model.Time of travel surveys also provide supporting information to water quality and sediment qualitycharacterizations. Specifically, time of travel surveys were performed at the same locations and undersimilar hydrologic conditions as the sediment nutrient flux surveys. Thus, time of travel surveys

J:\Pubs\mw97\Projects\9000259\100\new all.doc November, 20013-11
provide measurements of duration of exposure of water masses to impoundment sediments. Thesemeasurements will support assessment of water quality impacts associated with river impoundmentsediments.
Time of travel studies were performed in May 2000 and September/October 2000 to measure traveltime through the Ben Smith Impoundment and adjacent reaches and through the PowdermillImpoundment and adjacent reaches. The two time of travel studies were performed following methodsdescribed in Section 3.5 and are summarized in Section 4.
3.4.6 Impoundment Bathymetric and Sediment Thickness Survey
Impoundment bathymetry and sediment thickness surveys were performed to support characterizationof sediment effects on water quality in the Assabet River system. River impoundments are ofparticular interest because water is detained in impoundments for longer periods than in free-runningreaches allowing for greater impacts on the water column from underlying sediments.
A bathymetric and sediment thickness survey was performed in 5 river impoundments; Powdermill,Ben Smith/Crow Island, Gleasondale, Hudson, and Allen Street. Bathymetry measurements supportestimation of impoundment volume and average residence time. Sediment thickness measurementssupport assessment of sediment impacts on river water quality. Bathymetry and sediment thicknesssurveys were performed by volunteers from the Organization for the Assabet River (OAR) with supportfrom ENSR personnel during the Spring of 2000. The impoundment bathymetric and sedimentthickness survey was performed following methods described in Section 3.5 and are summarized inSection 6.
3.5 Data Collection Methods
This section provides a summary of data collection methods applied in performing sampling andanalysis activities associated with all of the Assabet River field surveys. A Quality Assurance ProgramPlan (QAPP) was submitted to and approved by MA DEP and US EPA Region 1 and describes datacollection methods in detail (ENSR, 1999). All data collection activities were performed in compliancewith the approved Assabet River QAPP. Methods associated with hydrologic, water quality, sedimentquality, and biological data collection are described and summarized below.
3.5.1 Field Operations
Field sampling crews and sampling equipment were mobilized from ENSR’s Acton, MA andNorthborough, MA offices for all surveys. For the intensive summer surveys, field operations wereperformed by five samplers organized in two teams of two, with one designated sample courier. Oneteam was assigned to collect measurements in the upper-half of the Assabet River and the secondteam was assigned to collect measurements in the lower-half of the Assabet River. A halfway point
J:\Pubs\mw97\Projects\9000259\100\new all.doc November, 20013-12
was arbitrarily identified as Route 85 in downtown Hudson (RM 18). Equipment provided to each teamincluded a vehicle, a canoe or skiff, a water quality meter, calibration fluids, coolers containing watersample bottles and ice, a first-aid kit, and a cellular phone.
For dry-weather and wet-weather surveys, field sampling crews were mobilized from ENSR’s Acton,MA office. Dry-weather and wet-weather surveys were each completed in two days by a two-memberteam with logistical support from a third person.
Volunteers and staff from the Organization for the Assabet River (OAR) contributed significantly tonumerous surveys including impoundment bathymetric surveys, time of travel surveys, sedimentnutrient flux surveys, and water quality sampling surveys. OAR volunteers provided essentialguidance in designing the field program and many hours of field labor. The efforts of OAR volunteersenhanced the quality and overall scope of the field program.
A health and safety meeting was held prior to each survey and all personnel were provided withappropriate health and safety instruction and gear. Health and safety instructions included use plasticgloves when collecting sampling to minimize potential for exposure to waterborne disease, use ofwaders when entering the river, and importance of working in teams. Sampling personnel followedENSR Health and Safety procedures throughout the surveys.
3.5.2 Hydrologic Data Collection Methods
Two primary hydrologic data collection methods were employed on the Assabet River; streamflowmeasurements and time of travel measurements. Each method is described below.
3.5.2.1 Streamflow Measurements
Average stream velocity and discharge measurements were collected using either a Price-pygmyrotating cup current meter or the Marsh McBirney electro-magnetic meter, in accordance with guidanceprovided by the United States Geological Survey. ENSR followed a protocol provided by the USGS(USGS, 1969) and excerpted below.
1. Select a cross-section from a straight, uniform reach with parallel streamlines and a relativelyuniform bottom. The depth of the section and the velocity of flow that can be measured arelimited by the dimensions of the current meter used. The pygmy current meter can measurevelocities in water that is approximately 2 inches deep or greater and at velocities of 0.05 feet persecond or more. If possible, the section should be free of large eddies with upstream circulationnear the banks, slack water, or excessive turbulence caused by upstream bends, radical changesin cross-section shape, and irregular obstructions such as boulders, trees, vegetation, and otherdebris in the vicinity.

J:\Pubs\mw97\Projects\9000259\100\new all.doc November, 20013-13
2. Select a time period for measurement when the flow is not expected to change. If the flowchanges rapidly during the flow measurement the reading will have to be abandoned. Thedetermination of flow variability during a measurement is made by noting water level before andafter collecting measurements.
3. String a tape measure across the stream channel perpendicular to flow. This will allow for arecord of the transverse location of the current meter during a measurement. Visually divide upthe flow through the cross-section into at least 20 compartments (depending on the width of thechannel) such that each compartment has roughly the same amount of flow passing through.
As shown in the channel cross-section diagram illustrated in Figure 3-3, measure the distances (b) anddepths (d) for each average velocity measurement. The mean velocity is measured at a point six-tenths of the depth from the stream surface at each location (b). The partial area flows are calculatedby multiplying the width of the individual areas by the corresponding depths in those areas. Thiscalculation is made according to the following equation:
x
xxxxxx d
bbbbvq
−+
−= +−
22)1()1(
where qx = volumetric flowrate, and
vx = water velocity
5. Compute the total flow as the sum of the partial flows using the equation:
xqQ Σ=
3.5.2.2 Time of Travel Measurements
A fluorescent dye was introduced to the Assabet River at concentrations capable of being measuredusing an in-situ fluorometer at a downstream location. A Turner Model 10 AU with flow-through cell,on-board temperature compensation and datalogger from the US EPA New England Regional Lab inLexington was used to collect dye concentration measurements. The dye used in the study wasRhodomime WT. The fluorometer was calibrated to Rhodamine WT prior to each survey, includingsetting temperature correction parameters. The quantity of dye required for this application wasestimated from the dye-dosage formula in Kilpatrick and Wilson (1989).
The Turner Model 110 fluorometer is capable of measuring concentration of fluorescent dye by twomethods; (1) direct measurement along the river shoreline via a flow-through cell and (2) measurement

J:\Pubs\mw97\Projects\9000259\100\new all.doc November, 20013-14
of a grab sample in a laboratory setting. Both of these methods were applied during the Assabet Rivertime of travel surveys.
For direct measurement of fluorescent dye concentration, the concentration of the dye wascontinuously monitored downstream using a recording Turner Model 110 fluorometer and a graphicrepresentation of the dye concentration over time was obtained. Measurements were recordedapproximately every 10 minutes throughout the study period.
For measurement of fluorescent dye concentration in grab samples, grab samples were collectedapproximately every hour and were transported, in a closed container to the laboratory for analysis.Samples were labeled following the protocol established for the water quality sampling protocol.Samples were decanted into a clean 40 ml cuvette and placed into a chamber of the Turnerfluorometer for dye concentration measurement. Dye concentration measurements recorded in a fieldlog book.
3.5.3 Water Quality Data Collection Methods
Two primary water quality data collection methods were employed on the Assabet River; in-situ waterquality measurements and laboratory analysis of water samples for nutrient-related parameters. Eachwater quality method is described below.
3.5.3.1 Synoptic In-Situ Water Quality Measurements
In-situ measurements of temperature, dissolved oxygen concentration (and % saturation), pH, andconductivity were collected using YSI 6820 water quality meters. The water quality meter is comprisedof two units; an instrument sonde and a display unit, with a communications cable connecting the two.The sonde unit contains several instrument probes and houses electronics to store the instrumentreadings and/or relay readings to the display unit.
The YSI meter was pre-calibrated each day of the survey prior to collection of measurements and post-calibrated each day immediately after survey operations were complete. All meter calibration activitieswere documented in field logbooks.
The water quality meter sonde was lowered into the water by a sampler on a bridge, in the river, or in asmall boat. The sonde was deployed at approximately mid-channel and mid-depth at each samplinglocation. During deployment, the sonde was held steady at a selected depth until ambient currentsresumed and meter readings equilibrated. YSI meter readings were recorded in a field log book alongwith sampling location, depth, date, time, sampler name, and other supporting information. Betweensampling events, water quality meters were stored in containers partially filled with deionized water tomaintain moisture on the sensors.

J:\Pubs\mw97\Projects\9000259\100\new all.doc November, 20013-15
3.5.3.2 Continuous In-Situ Water Quality Measurements
Continuous in-situ measurements of temperature, dissolved oxygen concentration (and % saturation),pH, and conductivity were collected using YSI 6820 XL water quality meters. The YSI 6820 XL meteris similar to the YSI 6820 meter described above and has an additional data storage capability. TheYSI 6820 XL meter comes with a battery and data storage unit within the underwater housing and asoftware/communications cable to enable direct communication between the instrument and apersonal computer.
Deployment of the continuous-recording water quality meter involved programming of the meter tocollect measurements at 10-minute intervals, attaching the sonde to a cinder block using hose clamps,and deploying the sonde in the river. The sonde was deployed at mid-channel and approximately mid-depth at each sampling location. An attempt was made to place the instrument in an inconspicuouslocation in the river to reduce the potential for vandalization.
Retrieval involved removing the sonde from the river, connecting the communications cable betweenthe sonde and a laptop computer, and downloading data from the data storage device in theinstrument. Data was reviewed in the field as a preliminary quality assurance check.
The recording YSI meter was pre-calibrated prior to each deployment and post-calibrated immediatelyfollowing retrieval. All meter calibration activities were documented in field logbooks.
3.5.3.3 Water Sample Collection for Laboratory Analysis
Ambient water samples were collected for laboratory analysis at numerous sampling locationsthroughout the study area. At each location, samples were collected at mid-channel and mid- depth.Water samples were collected primarily by samplers in waders. In some cases, such as in riverimpoundment sampling, samples were collected using teflon-coated Beta water sampling bottlesmanufactured by Wildco Inc. Each water sample collection method is described below.
Water samples were placed in sample bottles prepared and provided by the laboratory. Samplecoordination and labeling protocols were developed in advance of the surveys by personnel fromENSR and Thorstensen Laboratory of Westford, MA. All samples were labeled with informationincluding a unique sample identification alpha-numeric, analysis type, sampling time and date, andsample location. Samples were collected and labeled in a manner that uniquely identified eachindividual sample bottle. Once filled, sample bottles were immediately put in a cooler filled with ice.Samples were kept cold and hand delivered to the analytical laboratory within 4 hours or samplecollection in order to enable compliance with the shortest sample holding time of 6 hours for fecalcoliform.

J:\Pubs\mw97\Projects\9000259\100\new all.doc November, 20013-16
Water samples were primarily collected by sampling personnel wading to the river’s mid-channel andcollecting a measurement. Samples waded to mid-channel with a sample bottle and then stood still toallow ambient current to be re-established and any disturbance to subside. Personnel then lowered acapped water sample bottle (e.g., 1 liter plastic) to mid-depth and waited again. The sampler thenopened the bottle in-situ allowing it to fill and capped it. The bottle was then brought to the surface andlabeled with time and date of sample collection (other sample information was pre-entered on thelabel). Sampling information was logged in field notebooks.
Water samples collected using a Beta bottle were collected at mid-depth by lowering the bottle todepth and closing the bottle using a messenger. The messenger activates a spring which closes theBeta bottle in-situ. The full bottle was then brought the surface and drained into plastic sample bottles.The Beta bottle was de-contaminated between sampling events using mild, non-phosphorus detergentand deionized water. Sampling using Beta bottles were documented in field notebooks.
Water samples were analyzed for the suite of parameters presented in Table 3-3. Table 3-3 includesanalysis methods and holding time requirements associated with each analyte.
3.5.3.4 Automated Sample Collection for Laboratory Analysis
Wet-weather grab samples were collected using simple automated grab samplers. Wet-weather grabsamples were analyzed for the set of parameter values presented in Table 3-3. The automated grabsampler design is shown in Figure 3-4 and consists of a sample bottle equipped with a stopper withtwo tubes, one shorter (to allow water to enter) and one longer (to allow air to exit). The sample bottlewas attached to a post and placed in the river such that the shorter tube is approximately one inchabove the water line (depending on the characteristics of the tributary cross-section). When the waterlevel in the river rises due to storm water runoff, the sample bottle were filled with water.
Sampling personnel were not present at the time of automated sample collection. Personnel visitedthe sampling location within 20 hours of commencement of the storm event. Upon arrival at thesampling location, sampling personnel gathered pre-collected grab samples. All analytes werecollected using the automated sample except for fecal coliform bacteria. Fecal coliform samples werenot collected using the automated sampler because of the short holding time (6 to 8 hours) associatedwith that analyte. Rather, fecal coliform samples were collected immediately following the automatedsampling event.
3.5.4 Sediment Quality Data Collection Methods
Two primary sediment quality data collection methods were employed on the Assabet River; sedimentthickness and sediment nutrient flux. Each water quality method is described below.

J:\Pubs\mw97\Projects\9000259\100\new all.doc November, 20013-17
3.5.4.1 Bathymetry and Sediment Thickness Survey Methods
The Organization for the Assabet River performed the impoundment bathymetric and sedimentthickness surveys in accordance with the methods summarized below. Bathymetry and sedimentthicknesses were measured in river impoundments using a pole to detect the sediment/water interfaceand the soft sediment/hard sediment interface. The bathymetry/sediment thickness surveys wereboat-based and involved collection of measurements across transects to support bathmetric andsediment thickness mapping. There were no analyses conducted as part of the bathymetry andsediment thickness survey and therefore no samples or associated holding times.
In each impoundment, approximately 120 measurements of water depth and sediment thickness werecollected. In each impoundment, approximately 12 transects each containing 10 measurements werecollected. Measurements were obtained using a graduated pole placed through the water column todetermine water depth. The pole was then forced through the surface sediment to determine softsediment thickness. Water depths and thickness of soft sediments were measured by probing with agraduated rod as follows:
• Depth from water surface to sediment surface was recorded; an attachment may have beenplaced on the bottom of the rod if the sediment was too loose to allow easy detection of thesediment-water interface.
• Depth from water surface to first refusal (rock, tight sand, gravel or clay) was measured withthe same graduated rod.
• Soft sediment depth (sediment-water interface to first refusal) was calculated as thedifference between the two measurements described above.
Decontamination of equipment was not required and investigation-derived waste (IDW) were notgenerated during any part of this investigation.
The river impoundments are long and narrow in shape such that when traveling by boat the shorelineis always nearby and affords numerous landmarks as reference locations. Thus, locations ofmeasurements were identified using landmarks and recorded on topographic maps. A GeographicPositioning System was not used for the survey.
3.5.4.2 Sediment Nutrient Flux Survey Methods
The Center for Marine Science and Technology (CMAST), University of Massachusetts at Dartmouthperformed sediment nutrient flux surveys in accordance with the methods summarized below.
Measurements of benthic nutrient flux were conducted by the measurement of oxygen and nutrient fluxacross the sediment/water interface in 8 cores (6" diameter) collected from river impoundments.

J:\Pubs\mw97\Projects\9000259\100\new all.doc November, 20013-18
Sediment cores were collected by divers and were maintained at in-situ temperatures in a boat untilreturned to a shore-based laboratory. Incubations were performed at the "field" laboratory very nearthe impoundment in order to prevent disturbance to the cores in transit. All of the sediment sampleswere incubated immediately upon return to the field laboratory. CMAST provided the equipmentrequired for this purpose and has conducted these incubations in a variety of field sites (including aremote interior site in Antarctica).
The flux of nutrients and nutrient-related parameters was measured by incubating sediment cores andmonitoring sediment/water column exchange over time. Nutrient species concentrations weremeasured over time and under four scenarios; (1) ambient temperature, (2) moderately increasedtemperature, (3) summer-time temperature, and (4) anoxic conditions. These scenarios providedvaluable measurements of sediment/water column nutrient interactions during both non-summer andsummer time conditions, as well as quantifying chemical release of phosphorus from sediments. Thesediment flux surveys included measurement of sediment oxygen demand over an extended timeperiod.
3.5.5 Biological Data Collection Methods
Biological data collection was conducted as part of the summer intensive investigations of July 1999and August 2000 and was focused on determination of the types of aquatic vegetation present in thesystem and their distribution in the Assabet River impoundments. The methods applied during thisinvestigation are outlined below.
3.5.5.1 Phytoplankton Assessment Methods
Plankton samples were collected at the same stations as the impoundment surface water samples. Aswith the water samples, the phytoplankton samples are meant to be representative of the entire waterbody. These were preserved with gluteraldehyde concentrated by settling, as needed, and viewed in aPalmer-Maloney counting chamber at 400X magnification and phase contrast optics. Between theconcentration and the area scanned for identification/counting, the multiplication factor (cells recordedto cells/ml) is <50, usually <20. Counting proceeded until each successive strip does not change theratio of the dominant algal types (those comprising >50% of all cells cumulatively) by more than 10%.A detailed description of this analysis procedure is provided in the QAPP (ENSR, 1999).
3.5.5.2 Aquatic Macrophyte Assessment
Macrophyte assessment is primarily based on visual examination of the overall lake and streamhabitat. Its purpose is to determine the range of algal types in the system and relative dominance bycoverage or frequency of occurrence. Macrophytes in this case include mats found in the riverimpoundments. These samples are collected directly from mats, preserved as with phytoplankton

J:\Pubs\mw97\Projects\9000259\100\new all.doc November, 20013-19
samples, and viewed the same way but without any enumeration. Macrophyte assessment wasperformed as follows.
1. Aquatic plant distribution and density was surveyed during summer-time, with mapping ofdistribution by species, overall percent cover, and portion of the water column filled.
2. Plants were identified to species in the field or lab according to Hellquist and Crow (1980-1985).
3. Plant cover was estimated on a scale of 0-5 as follows:
• 0: No cover, plants absent
• 1: 1-25% cover
• 2: 26-50% cover
• 3: 51-75% cover
• 4: 76-99% cover
• 5: 100% cover
4. Plant biomass was estimated on a scale of 0-4 as follows:
• 0: No biomass, plants absent
• 1: Low biomass, plants growing only as a low layer on the bottom sediment
• 2: Moderate biomass, plants protruding into the water column, but rarely reaching thesurface and not at nuisance densities
• 3: High biomass, plants filling more than half the water column and often reaching thesurface, nuisance conditions and/or habitat impairment perceived
• 4: Extremely high biomass, water column filled and/or surface completely covered,nuisance conditions and habitat impairment severe
• 5. Water column completely filled with plants
Biomass based on the 0-5 scale can be converted to a mean mass in kilograms, based on the plantbiomass ratings and actual mass determined from other systems.
Biomass harvesting was also performed to provide a quantitative measure of aquatic species biomassin the river system. Biomass harvesting served to quantify species abundance ranked on a scale of 0to 5 (as described above). Biomass harvesting was performed in river impoundments and quantifiedthe 0 to 5 scale by harvesting approximately 20, ¼ square meter plots for each size range from 1
J:\Pubs\mw97\Projects\9000259\100\new all.doc November, 20013-20
through 4 (20 x 4 = 80 total harvest plots). Biomass harvesting resulted in wet weights of biomass perunit area and served to “calibrate” biomass measurements associated with both the Summer 1999 andSummer 2000 surveys.
3.5.5.3 Algal Assays
Algal assays were conducted for filamentous green algae (FGA) and duck weed (Lemna minor) in theAssabet River. These species were selected because they are dominant in the Assabet River system.Algal assay assessment involved growing each of the algal species independently in a laboratoryenvironment using various dilutions of Assabet River water. The response of the algae species to thediluted water provided an indication of species-specific response to alterations in nutrientconcentrations in Assabet River water.
There is no standard or recognized method to reference for FGA and duckweed algal assayassessment because an assay of the growth response of these species is an atypical analysis.However, the method outlined below is designed to provide an effective assay using a series ofcontrolled incubation experiments and concurrent nutrient measurements.
1) Assess the response of sampled algae to changes in P concentration and N:P ratio by measuringthe change in biomass over time in varying media.
2) Collect Assabet River water to provide a representative sample.
3) Collect algae from a river impoundment; material should be suitable for separation into distinctinocula for assays.
4) Test TKN, Nitrate-N and total P level in the collected water (analysis of water was conducted atThorstensen Laboratory in Westford, Massachusetts).
5) Dilute a portion (approx. 10 L) of the collected water such that P=0.10 mg/L, another portion toP=0.05 mg/L, and another to P=0.01 mg/L; nitrogen will also be diluted, but the ratio will remainstable.
6) Treat another portion of Assabet River water with buffered aluminum sulfate at a dose of 25 g Al/Lto coagulate P; decant and filter the supernatant and test for TKN, nitrate-N and total P level.
7) Set up 3 chambers (1-2 L each) for each of 6 treatments:
• Ambient Assabet River water
• Assabet River water @ P=0.10 mg/L
• Assabet River water @ P=0.05 mg/L
• Assabet River water @ P=0.01 mg/L
• Alum-treated Assabet River water (low P, high N)

J:\Pubs\mw97\Projects\9000259\100\new all.doc November, 20013-21
• De-ionized water (P=0.00 mg/L)
• Add 5 g (+ 0.5 g) of algae (wet weight after blotting mat with absorbent) to each chamber.
The algal assays were performed over a 7-day period.
Data collection results, presented in the following sections, were obtained following the methodsdescribed above.
J:\Pubs\mw97\Projects\9000259\100\new all.doc November, 20013-22
Table 3-1 Data Collection Matrix: Survey and Data Collection Activities
Surveys In Chronological Order Hydrologic Data Collection Water Quality Data Collection Sediment Data Collection Biological Data Collection
Streamflow Dye Grab Continuous Nutrient Nutrient Plankton
# Survey Description Dates Measurement Monitoring In Situ Sampling DO Flux Quality Thickness Sample Macrophyte Biomass Bio Assay
1 Intensive Summer Survey 1999 July 19-25, 1999 X X X X X X X
2 Dry-weather Survey January 18-19, 2000 X X X
3 Dry-weather Survey February 8-9, 2000 X X X
4 Wet-weather Survey March 16-17, 2000 X X
5 Dry-weather Survey March 27, 2000 X X X
6 Wet-weather Survey March 27-28, 2000 X X X
7 Sediment Nutrient Flux Survey March 29-30, 2000 X
8 Time of Travel Survey May 8-12, 2000 X
9 Impoundment Bathymetry/Sediment Survey May/June 2000 X
10 Intensive Summer Survey 2000 August 28-31, 2000 X X X X X X X X
11 Sediment Nutrient Flux Survey Sept. 11-12, 2000 X X
12 Wet-weather Survey September 12-13, 2000 X X X
13 Time of Travel Survey Sept. 28-Oct. 6, 2000 X

J:\Pubs\mw97\Projects\9000259\100\new all.doc November, 20013-23
Table 3-2 Data Collection Matrix: Survey Type and Sampling Locations
Sample Location Intensive Summer1999
Dry-weather
Wet-weather
Intensive Summer2000
Time ofTravel
ImpoundmentBathymetry/ Thickness
Station Rivermile Description Survey Surveys Surveys Survey Surveys Sediment Survey
R28 30.7 Maynard St. Westborough X X XR27 29.8 Rt. 9 Westborough X X
R26 28.9 Rt. 135 Westborough X X
R25 28.0 School St. Northborough X X
R24 25.9 River St. Northborough X X X
R23 25.1 Allen St. Impoundment X X X
R22 25.0 Below Allen St. Impoundment X XR21 23.9 Boundary St. Marlborough X X X
R20 23.5 Robin Hill Rd. Marlborough X X
R19 21.7 Bigelow Rd. Berlin X X X
R18 19.2 Chapin Rd. Hudson X X
R17 17.9 Hudson Center Impoundment X X X
R16 17.6 South St., Hudson X X XR15 15.9 Cox St. Hudson X X X
R14 15.8 Below Cox St. Hudson X
R13 14.1 Gleasondale Impoundment X X X
R12 13.9 Below Gleasondale Dam, Stow X X XR11 11.4 Boon Road, Stow X X
R10 9.2 White Pond Road, Maynard X X
R9 8.7 Ben Smith Impoundment X X X
R8 8.6 Rt. 117/62 Maynard X XR7 7.4 USGS Gauge, Maynard X X X
R6 6.2 Powder Mill Impoundment X X X
R5 6.1 Below Powder Mill Dam X X XR4 4.4 Damonmill, Concord X X
R3 3.1 Rt. 62, Concord X X X
R2 2.4 Rt. 2 Bridge, Concord X X
R1 1.6 Park Street, Concord X
Station Tributary Sampling Locations
T11 29.4 Hop Brook, Westborough X X X XT10 26.0 Cold Harbor Brook, Northborough X X X
T9 24.3 Stirrup Brook, Marlborough X X
T8 22.4 North Brook, Berlin X X X
T7 18.1 Hog Brook, Hudson X X X
T6 17.8 Mill Brook, Hudson X X X
T5 12.9 Ft. Meadow Brook, Hudson X X X
T4 9.4 Elizabeth Brook, Maynard X X X
T3 4.3 Second Division Brook, Concord X
T2 3.0 Nashoba Brook, Concord X X X X
T1 1.3 Spencer Brook, Concord X X
Notes:Bold horizontal line indicates approximate impoundment locations.

J:\Pubs\mw97\Projects\9000259\100\new all.doc November, 20013-24
Table 3-3 Analyses Performed in Support of the Assabet River Water Quality Surveys
Analysis Method NumberMethod Detection Limit
(mg/L) Hold TimeTotal Phosphorus EPA 365.2 0.01 28 daysOrthophosphorus EPA 365.2 0.01 2 daysAmmonia Nitrogen EPA 350.3 0.03 28 days
Nitrate EPA 300.0 0.01 28 daysTotal Kjeldahl Nitrogen EPA 351.3 0.05 28 days
BOD5 EPA 405.1 1.0 2 daysBOD30 EPA 405.1 1.0 2 daysTSS EPA 160.2 1.0 7 days
Total settleable solids EPA 160.5 0.1 7 daysChlorophyll a S.M. 10200 0.1 (frozen filter)Fecal coliform SM9222D 0 6 hours


J:\Pubs\mw97\Projects\9000259\100\new all.doc November, 20013-26
Figure 3-2 Schematic Representation of the Assabet River Rivermile vs. Elevation with Sampling Locations Identified
200210220230240250260270280290300
171819202122232425262728293031
Rive rm ile
Elevation (ft above MSL)
W ater Q uality S am pling Loc a t ionsN orm a l W ate r LevelE levat ion
Belo
w A
llen
St Im
p N
B
May
nard
St W
B
Abo
ve W
B W
WTP
Rt 9
WB
Rt 1
35 W
B
Scho
ol S
t NB
Riv
er S
t NB
Alle
n St
Impo
undm
ent
Boun
dary
St M
B
Rob
in H
ill R
d M
B
Bige
low
Rd
HS
Cha
plin
Rd
HS
Hud
son
Impo
undm
ent
Wes
tbor
o W
WTP
Mar
lbor
o W
est W
WTP
100110120130140150160170180190200
23456789101112131415161718
Rive rm ile
Elevation (ft above MSL)
W a te r Q u a l i ty S a m p lin g L o ca tio nN o rm a l W a te r L e ve lE le va tio n
Rt 85 H Cox
St.
HS
Gle
ason
dale
SW
Belo
w G
leas
onda
le
Boon
Rd.
ST
Whi
te P
ond
Rd.
MN
Ben
Smith
MN
Rt 1
17/6
2 M
N USG
S/R
t 27
MN
Pow
derm
ill AT
Belo
w P
owde
rmill
AT
Dam
on M
ill C
C
Rt
62 C
C
Rt 2
CC
Huds
May
nard
WW
TP
Con
cord
MC
I WW
TP

J:\Pubs\mw97\Projects\9000259\100\new all.doc November, 20013-27
Figure 3-3 Illustration of Channel Cross-Section Showing the Distances of the Measured Velocitiesfrom the Shore and the Depths of the Partial Area Cross-Sections (USGS, 1969).

J:\Pubs\mw97\Projects\9000259\100\new all.doc November, 20013-28
Figure 3-4 Illustration of Automated Wet-Weather Grab Sampler