30 years of polling on family and society
TRANSCRIPT

Disclaimer: Gallup Pakistan is not related to Gallup Inc. headquartered in Washington D.C. USA. We require that our surveys be credited fully as Gallup Pakistan (not Gallup or Gallup Poll). We disclaim any responsibility for surveys pertaining to Pakistani public opinion except those carried out by Gallup Pakistan, the Pakistani affiliate of Gallup International Association. For details on Gallup International Association see website: www.gallup-international.com
30 YEARS OF POLLING ON FAMILY AND SOCIETY
(1980-2010)
PERCEPTIONS OF PAKISTANI PUBLIC ABOUT WOMEN, FAMILY, COMMUNITY AND FORMATION OF CIVIL SOCIETY IN THE COUNTRY
(NOT FOR PUBLIC RELEASE OR PUBLICATION)
Presented to a select group of Professionals at Islamabad Club, Islamabad
May 27, 2010

- 2 -
CAUTION:
THIS IS A PRELIMINARY DRAFT
We are in the process of reviewing, cross-checking and revising/editing the material presented here. We will send you a revised version by email. Please feel free to use the revised version for any research and teaching purpose. DISCLAIMER The data pertain to 30 years of polling work. We have made much effort to standardize the samples and question wording wherever comparisons are made across years. However it still leaves room for improvement. We will join our readers in bringing greater refinement in all stages of research as we look ahead to future work on the same subjects. LOOKING BACK AND LOOKING AHEAD The basic purpose of this Roundtable and Report is to start a meaningful debate on the issue of Polling Research on Women, Family, Community and Society in Pakistan and identify avenues of further improvement. We admit that during the last 30 years we often asked inappropriate questions or did not maintain a time series as we should have. Moreover, our questions were not always informed by Relevant Experts knowledge. Hopefully in the future, we will frame more ‘informed questions’ in a more ‘informed framework’. While recognizing its limitations, what we have and present here, provides approximations to Perceptions on a wide variety of Social issues, which may otherwise be unavailable in a scientific fashion. We present this to generate a constructive debate between Sociologists, Anthropologists and related Professionals working on Social Issues and Survey Researchers. The two can join hands to produce valuable Research and teaching materials for Concerned Professionals.

- 3 -
Table of Contents
Introduction 4 Part 1: 30 Years of Polling on Women Issues Section 1: Views on Women Employment 7 Section 2: Views on Marriage 21 Section 3: Views on Women’s Rights 26 Part 2: 30 Years of Polling on Family Issues Section 1: Views on Family Dynamics 40 Section 2: Views on Married Life 48 Section 3: Views on Roles of Family Members/Household Chores 58 Section 4: Views on Leisure Activities 65 Part 3: 30 Years of Polling on Community Section 1: Views on Community Behavior 77 Section 2: Views on Problems of the Community 82 Section 3: Ideas concerning Life 91 Part 4: 30 Years of Polling on Civil Society Formation in the Country Section 1: Views on Poverty 102 Section 2: Views on Human Rights and Discrimination 109 Section 3: Views on Helping the Society 114 Section 4: Views on helping the children of the World 119 Section 5: Views on Foreign Aid 124 Section 6: Views on Social Organizations 129 Methodology 135

- 4 -
Introduction: Pakistan is the sixth largest country of the world with a population of approximately 174 million.(1) Women constitute nearly 50% of the population. Family is an important institution of the society. According to Pakistan Demographic Health Survey (2006-07) average household consists of 7.2 persons.* The size of family is relatively smaller in urban areas (7 persons per household). Most (92%) of households are headed by a male member.(2) A large proportion of the population is illiterate. The literacy level in age 15 and above is 50%. This is 63% for males and 36% for the female population. (2005 estimate)(1) Majority of the population lives in rural areas (64%).(1) Despite its large human resource, Pakistan is an under developed country with GDP per capita of $26,00 which is on the rank 171 in the whole world.**(1) Unemployment is widespread (15% approximately). According to 2006 estimates, 24% of the population was living below the poverty line.(1)
This document is based on Opinions of these Pakistanis spread across the four provinces. We are presenting opinions on matters that are relevant to a common man. Individuals live together and form families. These families living together constitute a Community and these communities form the fabric of a Society. When individuals and Communities work as an Organized Force for constructing their Society, the Civil Society emerges. In the page ahead, we will present opinions of individuals on issues of gender, family, living in a community and how these organized communities aspire to work for a Better Society. These are opinion of Pakistani Public and don not necessarily reflect the views of our institution or of the presenter. * A Household is defined as a group of people (related or unrelated) living together who share cooking and
eating of food. ** GDP per capita (PPP) 1. Country Profile, The World Fact book, Central Intelligence Agency 2. Pakistan Demographic and Health Survey (PDHS) 2006-07.

- 5 -
Overview: This Report has four parts: Part 1 is on opinions on Women and Gender issues. It covers women employment, women marriage, women rights, and gender characteristics etc which form respective sections of this part. Part 2 concerns polling on Family Issues. Views of the public on married life, family dynamics, sharing household chores and leisure time with family are discussed in this part. Part 3 is about public opinions regarding Community Problems and issues. It gives opinions about community behavior, problems faced in the community and the country and what people think about life in general. Part 4 tells us about public views on formation of Civil Society in the Country. It has sections on views on how poverty emerges, how people want to help their fellow beings, what is public perception about Foreign Aid and the role of Social Organizations in the society. There is a note on Methodology at the end of this Report.

- 6 -
PART 1:
30 YEARS OF POLLING ON WOMEN ISSUES
SECTION 1: VIEWS ON WOMEN EMPLOYMENT
SECTION 2: VIEWS ON MARRIAGE
SECTION 3: VIEWS ON WOMEN’S RIGHTS

Part 1: 30 Years of Polling on Women Issues
- 7 -
Part 1: 30 Years of Polling on Women Issues
SECTION 1:
VIEWS ON WOMEN EMPLOYMENT
Majority of the people think that women should be allowed to
work if they want, though under some conditions. Support for
women working with women is higher than working in a mixed
environment with men. Family is considered more important for
women than employment. Under conditions where job
opportunities are limited, most would like the men to be preferred
to women for getting a job but still nearly one third think that job
decisions should be on merit irrespective of gender. These and
other views on women employment are discussed in this Section.

Part 1: 30 Years of Polling on Women Issues Section 1: Views on Women Employment
- 8 – Note: For more details on Methodology please refer to the Methodology Section
WOMEN EMPLOYMENT
SHOULD WOMEN BE ALLOWED TO WORK?
Question: If an unmarried woman wants to go out and work, should she be given the permission?
Not at all26%
Yes only in certain
situations47%
Yes27%
Source: Gallup & Gilani / National Survey, 2009

Part 1: 30 Years of Polling on Women Issues Section 1: Views on Women Employment
- 9 – Note: For more details on Methodology please refer to the Methodology Section
WOMEN EMPLOYMENT
SHOULD WOMEN WORK? Question: Do you agree or disagree with the following statement: Both Husband and Wife should work to earn a living.
Disagree45% Agree
55%
Source: Gallup & Gilani / National Survey, 2009

Part 1: 30 Years of Polling on Women Issues Section 1: Views on Women Employment
- 10 – Note: For more details on Methodology please refer to the Methodology Section
WOMEN EMPLOYMENT
IS IT APPROPRIATE FOR WOMEN TO WORK WITH MEN? Question: In the following situations how appropriate is it for a woman to work?
38% 40% 16% 6%
20% 41% 38% 1%
0 10 20 30 40 50 60 70 80 90 100
Where only women work
Where both men andwomen work together
Good Appropriate Inappropriate No response
Source: Gallup & Gilani / National Survey, 2009
Though most people generally think that women should be given permission to work (unconditional or under certain conditions) but a large number (38%) consider it inappropriate for women to work with men. 16% say that it is inappropriate for women to work even at places where there are exclusive female workers.

Part 1: 30 Years of Polling on Women Issues Section 1: Views on Women Employment
- 11 – Note: For more details on Methodology please refer to the Methodology Section
WOMEN EMPLOYMENT
IS IT APPROPRIATE FOR WOMEN TO WORK WITH MEN? Question: In the following situations how appropriate is it for a woman to work?
Comparative Data
WHERE BOTH MEN AND WOMEN WORK
1981 2009 Good 3% 20% Appropriate 8% 41% Inappropriate 78% 38% No response 11% 1%
WHERE ONLY WOMEN WORK
1981 2009 Good 32% 38% Appropriate 34% 40% Inappropriate 23% 16% No response 11% 6%
Source: Gallup & Gilani / National Surveys 1981, 2009
Note: Caution should be taken while interpreting comparative data. Please read the note on Comparative Data in Methodology Women and Employment (single gender environment) In 1981 23% opposed women to be employed (outside home). The figure has now (2009) dropped to 16%. Employment of Women in Mixed Gender Environment: In 1981 employment of women in Mixed Gender environment was opposed by 78%. The figure has now dropped to nearly half of that at 38%.

Part 1: 30 Years of Polling on Women Issues Section 1: Views on Women Employment
- 12 – Note: For more details on Methodology please refer to the Methodology Section
WOMEN EMPLOYMENT
SHOULD MEN AND WOMEN BE PAID EQUALLY?
Question: If men and women are working in an office/factory doing the same sort of work, then do you think their salary should be equal or should males earn more?
No response1%
Males should earn more
25%
Equal74%
Source: Gallup & Gilani / National Survey, 2009

Part 1: 30 Years of Polling on Women Issues Section 1: Views on Women Employment
- 13 – Note: For more details on Methodology please refer to the Methodology Section
WOMEN EMPLOYMENT
WHOSE JOB COMES FIRST?
Question: Suppose that your country is under economic crisis. There are limited job opportunities. Unemployment is widespread. Under such circumstances a man and a woman are competing for the same job vacancy. Who do you think should be preferred for this job?
Don't Know3%
Merit / Gender doesn't matters
32%
Woman14%
Man51%
SEGMENT ANALYSIS Gender Wise: (Column %)
Males Females
Man 54% 47% Women 14% 15% Whoever is more capable (Gender doesn’t matter)
30% 34%
Don’t Know 2% 4% Trends are similar in both genders. Socioeconomic: (Row %)
Monthly Household Income
Man Woman Whoever is more capable(Gender doesn’t matter)
Don’t Know
Up to Rs. 7000 54% 16% 25% 5% 7001-15000 Rs. 47% 16% 34% 3% 15001-30000 Rs. 46% 11% 42% 1% Above 30000 Rs. 31% 18% 48% 3%
Source: Gallup & Gilani / National Survey, 2009
Preference for merit increases with increasing monthly household income

Part 1: 30 Years of Polling on Women Issues Section 1: Views on Women Employment
- 14 – Note: For more details on Methodology please refer to the Methodology Section
WOMEN EMPLOYMENT
WHAT COMES FIRST? JOB OR FAMILY
Question: Suppose that due to increase in women employment the population of your country starts decreasing as women are unable to raise children, what do you think women should do under such circumstances?
6%
37%
57%
0%
10%
20%
30%
40%
50%
60%
EMPLOYMENT FAMILY No Response
SEGMENT ANALYSIS
Gender Wise:
Males Females
Women should work no matter the population of the country continues to decrease
30% 43%
Women should quit jobs and focus more on raising children so that the population remains stable
64% 49%
Don’t Know 6% 8%
Source: Gallup & Gilani / National Survey, 2009 Though family is the top priority for both genders but relatively more females are in favor of women employment as compared to males.

Part 1: 30 Years of Polling on Women Issues Section 1: Views on Women Employment
- 15 – Note: For more details on Methodology please refer to the Methodology Section
WOMEN EMPLOYMENT
WHAT ARE THE BENEFITS OF WORKING?
Question: Some people say that if a woman works or does a job, she can improve her economic conditions whereas others oppose it. What do you think about this?
Don't Know1%
This is a wrong idea22%
This is a correct idea77%
Source: Gallup & Gilani / National Survey, 2003

Part 1: 30 Years of Polling on Women Issues Section 1: Views on Women Employment
- 16 – Note: For more details on Methodology please refer to the Methodology Section
WOMEN EMPLOYMENT
WHAT ARE THE BENEFITS OF WORKING? Question: Some people think that if a woman does a job or a business and is financially independent then she can have a comfortable old age. Others oppose this opinion. What do you think?
Oppose the opinion
33%
Agree to the idea67%
Source: Gallup & Gilani / National Survey, 2009
Majority agrees that doing a job makes a woman economically stable and more likely to have a comfortable old age.

Part 1: 30 Years of Polling on Women Issues Section 1: Views on Women Employment
- 17 – Note: For more details on Methodology please refer to the Methodology Section
WOMEN EMPLOYMENT
GENDER PREFERENCES FOR THE BOSS IN A JOB Question: Suppose you work somewhere and you are given a chance to choose your boss, what would you want his/her gender to be?
Indifferent25%
Female40%
Male35%
Source: Gallup & Gilani / National Survey, 2009
Interestingly, a large number (40%) would prefer to have a female boss. 25% think that gender doesn’t matter in this regard.

Part 1: 30 Years of Polling on Women Issues Section 1: Views on Women Employment
- 18 – Note: For more details on Methodology please refer to the Methodology Section
WOMEN EMPLOYMENT
GENDER PREFERENCES FOR DOCTORS Question: God forbid if you have to go to a doctor, would you like your doctor to be male or female?
Male37%
Female24%
No difference39%
Source: Gallup & Gilani / National Survey, 2005
24% say they would prefer a female doctor and for 38% gender doesn’t matter.

Part 1: 30 Years of Polling on Women Issues Section 1: Views on Women Employment
- 19 – Note: For more details on Methodology please refer to the Methodology Section
WOMEN EMPLOYMENT
GENDER PREFERENCES FOR TEACHERS
Question: Would you like your children’s school teacher to be male or female?
No Difference38%
Female32%
Male29%
Source: Gallup & Gilani / National Survey, 2005
32% would prefer their children to be taught by female teachers, for 38% gender of the teacher makes no difference.

Part 1: 30 Years of Polling on Women Issues
- 20 –
Part 1: 30 Years of Polling on Women Issues
SECTION 2:
VIEWS ON MARRAIGE
Majority say that parents should decide marriage issues of their daughters. If children want to marry according to their own choice; 47% say that a boy should be allowed to do so and 35% say that a girl should be allowed to do so. These and other issues are discussed in this section.

Part 1: 30 Years of Polling on Women Issues Section 2: Views on Marriage
- 21 – Note: For more details on Methodology please refer to the Methodology Section
MARRIAGE
WHOSE CHOICE SHOULD IT BE? Question: Whose choice should be preferred while deciding for the marriage of a girl?
Girl's own choice30%
Parent's choice70%
Source: Gallup & Gilani / National Survey, 2005
Most people say that parents should decide for marriage of their daughters.

Part 1: 30 Years of Polling on Women Issues Section 2: Views on Marriage
- 22 – Note: For more details on Methodology please refer to the Methodology Section
MARRIAGE
WHOSE CHOICE SHOULD IT BE?
Question: In your opinion if children want to marry someone of their own choice, should parents permit them or not?
Depends on the situation
28%
No31%
Yes41%
Source: Gallup & Gilani / National Survey, 2009 On the whole 41% say that children should be allowed to marry someone of their choice.

Part 1: 30 Years of Polling on Women Issues Section 2: Views on Marriage
- 23 – Note: For more details on Methodology please refer to the Methodology Section
MARRIAGE
SON’S MARRIAGE
Question: In you opinion if specifically a boy wants to marry by his own choice, should he be permitted or not?
Depends on the situation
25%
No28%
Yes47%
Source: Gallup & Gilani / National Survey, 2009

Part 1: 30 Years of Polling on Women Issues Section 2: Views on Marriage
- 24 – Note: For more details on Methodology please refer to the Methodology Section
MARRIAGE
DAUGHTER’S MARRIAGE
Question: In you opinion if specifically a girl wants to marry by his own choice, should She be permitted or not?
Depends on the situation
31%
No34%
Yes35%
Source: Gallup & Gilani / National Survey, 2009 Relatively less people (35% instead of 47%) think that a girl should be allowed to marry on her own choice as compared to those who think a boy should be allowed to marry on his own choice.

Part 1: 30 Years of Polling on Women Issues
- 25 –
Part 1: 30 Years of Polling on Women Issues
SECTION 3:
VIEWS ON WOMEN’S RIGHTS
Less than half of the people think that women enjoy equal rights like men in the country and majority says that women are given less respect than what is their due according to Islam. Views on involvement of women in property matters, inheritance and politics are discussed in this section.

Part 1: 30 Years of Polling on Women Issues Section 3: Views on Women’s Rights
- 26 – Note: For more details on Methodology please refer to the Methodology Section
WOMEN’S RIGHTS
ARE WOMEN GIVEN EQUAL RIGHTS? Question: In your opinion, do women enjoy equal rights as that of men in our country?
Don't Know14%
No46%
Yes40%
Source: Gallup & Gilani / National Survey, 2006

Part 1: 30 Years of Polling on Women Issues Section 3: Views on Women’s Rights
- 27 – Note: For more details on Methodology please refer to the Methodology Section
WOMEN RIGHTS
ARE WOMEN GIVEN EQUAL RIGHTS?
Question: Do men and women enjoy equal rights with respect to following aspects in your area?
Only Those who say Yes Access to education 50% Means of earning a living 26% Health facilities 46% Access to Justice 29% Participation in political activities 32%
Source: Gallup & Gilani / National Survey, 2005

Part 1: 30 Years of Polling on Women Issues Section 3: Views on Women’s Rights
- 28 – Note: For more details on Methodology please refer to the Methodology Section
WOMEN’S RIGHTS
DO WOMEN ENJOY ADEQUATE RESPECT IN SOCIETY?
Question: Do you think in our society women are given the due share of respect according to Islam, lesser or more than that?
1%
59%
18%22%
0
10
20
30
40
50
60
70
More Same Less No response
Source: Gallup & Gilani / National Survey, 2009

Part 1: 30 Years of Polling on Women Issues Section 3: Views on Women’s Rights
- 29 – Note: For more details on Methodology please refer to the Methodology Section
WOMEN’S RIGHTS
SHOULD WOMEN FIGHT FOR EACH OTHERS RIGHTS? Question: Do you agree or disagree to the statement: Rich women should raise their voice for the rights of poor women
Disagree20%
Agree80%
Source: Gallup & Gilani / National Survey, 2009

Part 1: 30 Years of Polling on Women Issues Section 3: Views on Women’s Rights
- 30 – Note: For more details on Methodology please refer to the Methodology Section
WOMEN’S RIGHTS
RIGHT OF DECISION MAKING IN LAND/ PROPERTY MATTERS
Question: Does any woman in your family or any woman in your acquaintance participates in making decisions about the land e.g. transfer, sale, division of land?
No60%
Yes40%
Source: Gallup & Gilani / National Survey, 2009

Part 1: 30 Years of Polling on Women Issues Section 3: Views on Women’s Rights
- 31 – Note: For more details on Methodology please refer to the Methodology Section
WOMEN’S RIGHTS
RIGHT OF DECISION MAKING IN LAND/ PROPERTY MATTERS Question: Do you think women should be involved in making decisions about land or not?
No45% Yes
55%
Source: Gallup & Gilani / National Survey, 2009

Part 1: 30 Years of Polling on Women Issues Section 3: Views on Women’s Rights
- 32 – Note: For more details on Methodology please refer to the Methodology Section
WOMEN’ RIGHTS
RIGHT OF DECISION MAKING IN LAND/ PROPERTY MATTERS Question: Please state whether you find the following statements closer to reality or not?
42% 44% 14%
28% 58% 14%
53% 37% 10%
0 10 20 30 40 50 60 70 80 90 100
Women are both apparently and actually involved in thedecision making of the land matters
Women are apparently not involved but actually doparticipate in the decision making of the land matters
Women are just apparently but not actually involved inthe decision making of the land matters
Yes No No response
Source: Gallup & Gilani / National Survey, 2009

Part 1: 30 Years of Polling on Women Issues Section 3: Views on Women’s Rights
- 33 – Note: For more details on Methodology please refer to the Methodology Section
WOMEN’S RIGHTS
RIGHT OF SHARE IN INHERITANCE
Question: Are the women in your family or in your acquaintance given the legal share in property according to Islam?
No44%
Yes56%
Source: Gallup & Gilani / National Survey, 2009
Comparative Data
1981 2009 Yes 71% 56% No 15% 44% No response 14% -
Source: Gallup & Gilani / National Surveys 1981, 2009
Note: Caution should be taken while interpreting comparative data. Please read the note on Comparative Data in Methodology

Part 1: 30 Years of Polling on Women Issues Section 3: Views on Women’s Rights
- 34 – Note: For more details on Methodology please refer to the Methodology Section
WOMEN’S RIGHTS
PARTICIPATION IN POLITICS Question: Some people think that according to Islamic perspective a woman cannot be the head of the state, whereas others think that if a woman is capable and popular then there is nothing wrong in her being the head of the state. What is your opinion?
No response16%
Woman cannot be the head of
the state61%
Woman can be the head of the
state23%
Source: Gallup & Gilani / National Survey, 1996
Please note that this survey was conducted when Late Mohtarma Benazir Bhutto was the Prime Minister of the Country. No recent data is available on this issue. This data might not be relevant in recent times, but is provided as part of 30 years of polling history on women issues.

Part 1: 30 Years of Polling on Women Issues Section 3: Views on Women’s Rights
- 35 – Note: For more details on Methodology please refer to the Methodology Section
WOMEN’S RIGHTS
PARTICIPATION IN POLITICS
Question: Some people are happy with the fact that a woman has become the Prime Minister of Pakistan, while others are not, and some are indifferent. Are you happy with the situation?
Indifferent18%
No opinion12%
Unhappy55%
Happy15%
Source: Gallup & Gilani / National Survey, 1996
Please note that this survey was conducted when Later Mohtarma Benazir Bhutto was the Prime Minister of the Country. No recent data is available on this issue. This data might not be relevant in recent times, but is provided as part of 30 years of polling history on women issues.

Part 1: 30 Years of Polling on Women Issues Section 3: Views on Women’s Rights
- 36 – Note: For more details on Methodology please refer to the Methodology Section
WOMEN’S RIGHTS
PARTICIPATION IN POLITICS
Question: In the next local bodies elections 1/3 (33%) seats are reserved for women. Some people favor this involvement of women in politics while others oppose. What is your opinion?
Don’t know15%
Oppose36%
Favour49%
Source: Gallup & Gilani / National Survey, 2000 People were equally divided on the issue of woman participation in Local Bodies Elections. Please note that this data might not be relevant in recent times, but is provided as part of 30 years of polling history on women issues.

Part 1: 30 Years of Polling on Women Issues Section 3: Views on Women’s Rights
- 37 – Note: For more details on Methodology please refer to the Methodology Section
WOMEN’S RIGHTS
ATTRIBUTE OF MEN AND WOMEN
Question: We will ask you about some conventional characteristics of men and women. Kindly tell for each quality whether it is present more frequently in women or men, in your opinion?
CHARACTERISTIC MALE FEMALE BOTH Rage 63% 15% 22%
Bravery 75% 10% 15%
Ease loving 19% 56% 25%
Talkative 10% 76% 14%
Patience 23% 56% 21%
Emotional 37% 29% 34%
Creativity 30% 26% 44%
Source: Gallup & Gilani / National Survey, 2005
It is interesting to note that people generally attribute rage and bravery to men, patience, talkativeness and ease to women. Majority thinks that creativity is a characteristic common to both genders.

- 38 –
PART 2:
30 YEARS OF POLLING ON FAMILY ISSUES
SECTION 1: VIEWS ON FAMILY DYNAMICS
SECTION 2: VIEWS ON MARRIED LIFE
SECTION 3: VIEWS ON THE ROLE OF FAMILY MEMBERS/ HOUSEHOLD CHORES
SECTION 4: VIEWS ON LEISURE ACTIVITIES

Part 2: 30 Years of Polling on Family Issues
- 39 –
Part 2: 30 Years of Polling on Family Issues
SECTION 1:
VIEWS ON FAMILY DYNAMIS
Generally people say that they have a friendly and respectful attitude towards their family members. Majority accepts the role of elders of the family in children’s up bringing though they say that respect towards elders has decreased in the society. People say that their parents kept a strict invigilation on them but majority says that they share similar opinions as their parents on politics, religion, social issues.

Part 2: 30 Years of Polling on Family Issues Section 1: Views on Family Dynamics
- 40 – Note: For more details on Methodology please refer to the Methodology Section
FAMILY DYNAMICS
ATTITUDE TOWARDS FAMILY MEMBERS
Question: How is your attitude towards your family members?
No Response1%
Respectful30%
Friendly49%
Authoritative20%
Source: Gallup & Gilani / National Survey, 2009

Part 2: 30 Years of Polling on Family Issues Section 1: Views on Family Dynamics
- 41 – Note: For more details on Methodology please refer to the Methodology Section
FAMILY DYNAMICS
ATTITUDE TOWARDS FAMILY MEMBERS
Question: Some parents keep a strict watch on their children and keep advising them about what to do and what not. Some other parents don’t do so. Considering your own parents how were/are they towards you?
A lot of invigilation52%
Some Invigilation30%
Very Little Invigilation
12%No Invigilation
3%Don't Know
3%
Source: Gallup & Gilani / National Survey, 2009
Comparative Data
1982 2009 A lot of invigilation 56% 53% Some invigilation 22% 30% Very little invigilation 7% 12% No invigilation 5% 3% Don’t know 10% 2%
Source: Gallup & Gilani / National Surveys 1982, 2009
Note: Caution should be taken while interpreting comparative data. Please read the note on Comparative Data in Methodology
It is interesting to note that majority says that their parents keep strict invigilation on them and this view has not changed much in last thirty years.

Part 2: 30 Years of Polling on Family Issues Section 1: Views on Family Dynamics
- 42 – Note: For more details on Methodology please refer to the Methodology Section
FAMILY DYNAMICS
GENERATION GAP
Question: Do you and your parents share or don’t share similar opinions in following aspects of life? (Only those who say they share similar opinions are shown here)
Only those who say they share similar opinions
Religion 93%
Moral Values 87%
Social Problems 72%
Politics 63%
Source: Gallup & Gilani / National Survey, 2009
Comparative Data
(Only those who say they share similar opinions are shown here)
1982 2009 Religion 88% 93%
Moral Values 85% 87%
Social Problems 80% 72%
Politics 68% 63%
Source: Gallup & Gilani / National Surveys 1982, 2009
Note: Caution should be taken while interpreting comparative data. Please read the note on Comparative Data in Methodology Interestingly, despite large change in the society with time, there isn’t much change in this issue. Majority says that they share similar opinions on religion, moral values, politics and social problems as their parents.

Part 2: 30 Years of Polling on Family Issues Section 1: Views on Family Dynamics
- 43 – Note: For more details on Methodology please refer to the Methodology Section
FAMILY DYNAMICS
ELDERS AS TEACHERS OF CHILDREN
Question: Some people believe that whatever a child learns comes mostly from elders whereas others think a child learns mainly from books and school. What is your opinion?
Mostly from books and school
16%
No response3%
Mostly from elder44%
From both37%
Source: Gallup & Gilani / National Survey, 2009
There is overwhelming realization that elders in the family play an important role in upbringing of children.

Part 2: 30 Years of Polling on Family Issues Section 1: Views on Family Dynamics
- 44 – Note: For more details on Methodology please refer to the Methodology Section
FAMILY DYNAMICS
RESPECT TOWARDS ELDERS
Question: Overall, in your opinion, has the trend of respect towards elders increased, decreased or remained the same in our society?
Increased10%
No response1%
Decreased68%
No difference21%
Source: Gallup & Gilani / National Survey, 2009
Majority thinks that respect towards elders has decreased in the society with time.

Part 2: 30 Years of Polling on Family Issues Section 1: Views on Family Dynamics
- 45 – Note: For more details on Methodology please refer to the Methodology Section
FAMILY DYNAMICS
EMOTIONS VERSUS WISDOM
Question: What would you say that how emotional are you?
Very emotional 13%
Somewhat emotional 41%
Very little emotional 28%
Not at all emotional 17%
No Response 1%
Source: Gallup & Gilani / National Survey, 2009
Question: Do you usually take decisions based on wisdom or emotions?
Wisdom 36%
Emotions 19%
Depends on situation 43%
No Response 2%
Source: Gallup & Gilani / National Survey, 2009
Despite the claim; most people consider themselves to be emotional, very few (19%) say they take decisions based on emotions.

Part 2: 30 Years of Polling on Family Issues Section 1: Views on Family Dynamics
- 46 – Note: For more details on Methodology please refer to the Methodology Section
FAMILY DYNAMICS
ANGER VERSUS PATIENCE
Question: Some people get angry quickly whereas others are more patient. In your opinion do you get angry easily? Percent of Respondents
Very easily 17%
Somewhat easily 38%
I usually don’t get angry 29%
I never get angry 16%
Source: Gallup & Gilani / National Survey, 2009

Part 2: 30 Years of Polling on Family Issues
- 47 –
Part 2: 30 Years of Polling on Family Issues
SECTION 2:
VIEWS ON MARRIED LIFE
People regard sincerity, respect and mutual understanding as characteristics most essential for a successful married life. Most of the married respondents say that they share similar opinions as those of their spouse on most issues. Majority considers having children as an important aspect of life, though support for a smaller family size has risen in last three decades.

Part 2: 30 Years of Polling on Family Issues Section 2: Views on Married Life
- 48 – Note: For more details on Methodology please refer to the Methodology Section
MARRIED LIFE
WHAT IS ESSENTIAL FOR A SUCCESSFUL MARRIED LIFE?
Question: I will enlist few things which some people regard as essential for a successful married life. Please tell for each of the following if you consider it Very Necessary, Necessary or Not Necessary?
Very Necessary
Necessary Not Necessary
No Response
Faithfulness/Sincerity 89% 8% 2% 1% Good Income 64% 27% 8% 1% Belonging to the same Family 44% 28% 27% 1% Mutual Respect and appreciation 73% 23% 4% - Good House 50% 38% 12% - Sharing similar Political Opinions 29% 34% 36% 1% Mutual Understanding 74% 19% 6% 1% Living away from In laws 32% 35% 32% 1% Sharing Household Chores 61% 26% 13% - Sharing Similar Interests 54% 35% 10% 1%
Source: Gallup & Gilani / National Survey, 2009
People regard sincerity, respect and mutual understanding as the attributes most essential for a successful married life.

Part 2: 30 Years of Polling on Family Issues Section 2: Views on Married Life
- 49 – Note: For more details on Methodology please refer to the Methodology Section
MARRIED LIFE
WHAT IS ESSENTIAL FOR A SUCCESSFUL MARRIED LIFE?
Question: I will enlist few things which some people regard as essential for a successful married life. Please tell for each of the following if you consider it Very Necessary, Necessary or Not Necessary?
Very Essential
Little Essential
Not Essential at all
No Response
Faithfulness/ Loyalty 90% 4% - 6% Good Income 58% 30% 5% 7% Belonging to the same Family 48% 26% 19% 7% Mutual Respect 71% 17% 5% 7% Good House 45% 36% 12% 7% Sharing similar Political Opinions 29% 34% 11% 26% Mutual Understanding 71% 17% 4% 8% Living away from In laws 32% 34% 26% 8% Sharing Household Chores 66% 20% 6% 9% Sharing Similar Interests 59% 24% 8% 9% Similar views about politics 33% 28% 30%
Source: Gallup & Gilani / National Survey, 1982
It is interesting to note similarities in opinions about thirty years ago on this issue.

Part 2: 30 Years of Polling on Family Issues Section 2: Views on Married Life
- 50 – Note: For more details on Methodology please refer to the Methodology Section
MARRIED LIFE
DO YOU AND YOUR SPOUSE THINK ALIKE?
Question: (Only Married Respondents) Do you and your spouse think alike in following aspects of life? (Only those who answered yes)
Comparative Data
1982 2000 Religion 76% 92% Moral Values 73% 86% Social Problems 69% 78% Politics 57% 61%
Source: Gallup & Gilani / National Surveys 1982, 2000
Note: Caution should be taken while interpreting comparative data. Please read the note on Comparative Data in Methodology

Part 2: 30 Years of Polling on Family Issues Section 2: Views on Married Life
- 51 – Note: For more details on Methodology please refer to the Methodology Section
MARRIED LIFE
VIEWS ON DIVORCE - WHEN IS IT JUSTIFIED?
Question: There are many reasons of divorce. In your view, which of the following reasons can be termed as justified from a husband's side or not?
Yes No No Response
If wife always remains unwell. 12% 80% 8%
If wife does not own wealth/ property 4% 89% 7%
If wife starts addiction. 64% 28% 8%
If wife is of high temper and quarrel-some nature 36% 60% 4%
If there is no love for wife 45% 47% 8%
If there are no working relations with wife's relations 17% 75% 8%
If wife is incapable of reproduction 28% 64% 8%
If wife's temperament is different from that of husband's 41% 51% 8% .
Source: Gallup & Gilani / National Survey, 1982

Part 2: 30 Years of Polling on Family Issues Section 2: Views on Married Life
- 52 – Note: For more details on Methodology please refer to the Methodology Section
MARRIED LIFE
VIEWS ON DIVORCE - WHEN IS IT JUSTIFIED?
Question: In your view, under what circumstances should or should not a wife seek dissolution of marriage from her husband?
Yes No No Response
If husband always remains unwell 20% 71% 9%
If husband is very poor 51% 40% 9%
If husband starts taking drugs 29% 62% 9%
If husband is of high temper and quarrel-some nature 42% 49% 9%
If there is no love for husband 15% 76% 9%
If there is no working relations with husband's in-laws 48% 44% 8%
If husband is incapable of reproduction 36% 56% 8%
If husband's temper is different from that of wife's - - -
Source: Gallup & Gilani / National Survey, 1982 About thirty years back, majority of people considered that if a woman gets indulged in habit of addiction, it is justified for the man to divorce her. Similarly lack of love for one’s wife and being of different nature/ temperament were considered as reasons which were justified to give divorce to a lady by the majority of the public. On the other hand, majority of the people considered husband’s poor economic conditions, poor relations with one’s in laws and quarrelsome nature of husband as the situations where a woman was justified to seek divorce. Despite the common belief, it is interesting to note that only 28% considered infertility in a woman (Inability to produce children) as a reason which justified for the husband to divorce his wife. Please note that no recent data is available on this issue.
Part 2: 30 Years of Polling on Family Issues Section 2: Views on Married Life
- 53 – Note: For more details on Methodology please refer to the Methodology Section
MARRIED LIFE
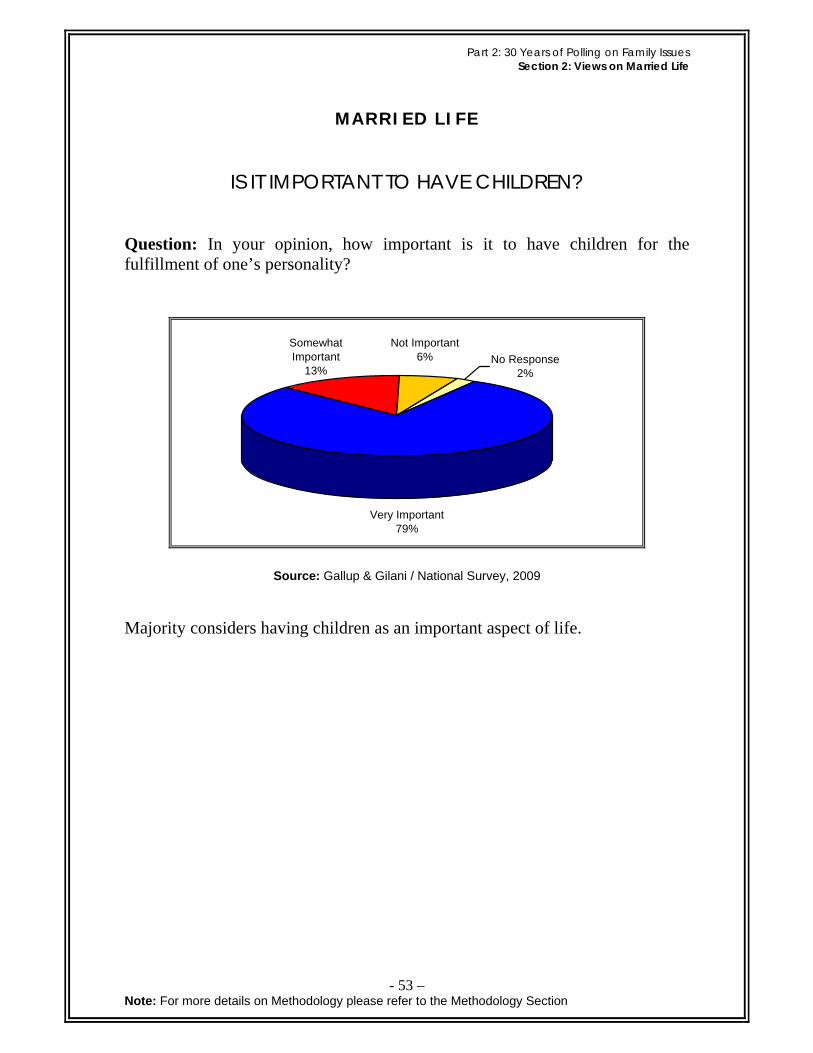
IS IT IMPORTANT TO HAVE CHILDREN?
Question: In your opinion, how important is it to have children for the fulfillment of one’s personality?
No Response2%
Somewhat Important
13%
Very Important79%
Not Important6%
Source: Gallup & Gilani / National Survey, 2009 Majority considers having children as an important aspect of life.

Part 2: 30 Years of Polling on Family Issues Section 2: Views on Married Life
- 54 – Note: For more details on Methodology please refer to the Methodology Section
WOMEN EMPLOYMENT
IS IT ESSENTIAL TO HAVE CHILDREN?
Question: Do you agree or disagree to the following statement: Women need children for a contended life.
Disagree17%
Agree83%
Source: Gallup & Gilani / National Survey, 2009

Part 2: 30 Years of Polling on Family Issues Section 2: Views on Married Life
- 55 – Note: For more details on Methodology please refer to the Methodology Section
MARRIED LIFE
VIEWS ON SIZE OF THE FAMILY
Question: Recently it was suggested in the National Assembly to impose tax on having greater number of children. Do you think that Government should impose this tax or not?
No 65%
Yes33%
No response2%
Source: Gallup & Gilani / National Survey, 2009

Part 2: 30 Years of Polling on Family Issues Section 2: Views on Married Life
- 56 – Note: For more details on Methodology please refer to the Methodology Section
MARRIED LIFE
VIEWS ON SIZE OF THE FAMILY Question: Some people say that “there should be less number of children so that they can have good training”; others say “the more the children the better it is”. What is your opinion?
Comparative Data
57%
36%
7%
72%
28%
0%0%
10%
20%
30%
40%
50%
60%
70%
80%
Small Family Large Family No Response
1983 2009
Source: Gallup & Gilani / National Surveys 1983, 2009
Note: Caution should be taken while interpreting comparative data. Please read the note on Comparative Data in Methodology Support for a small family appears to have risen in last thirty years, but still people don’t support imposition of taxes to control family size.

Part 2: 30 Years of Polling on Family Issues Section 2: Views on Married Life
- 57 – Note: For more details on Methodology please refer to the Methodology Section
MARRIED LIFE
GENDER PREFERENCE FOR CHILDREN Question: Suppose that you are a parent of one child only; would you like it to be a girl or a boy? MARRIED RESPONDENTS UNMARRIED RESPONDENTS
No Response
2%
Boy82%
Girl16%
Boy70%
Girl26%
No Response
4%
Source: Gallup & Gilani / National Survey, 2009
In case of a single child only, majority would prefer to have a son as compared to daughter.

Part 2: 30 Years of Polling on Family Issues
- 58 –
Part 2: 30 Years of Polling on Family Issues
SECTION 3:
VIEWS ON ROLE OF FAMILY MEMBERS/
HELPING IN HOUSEHOLD CHORES
Very few people have domestic help (servants/ maids) for household work. Men rarely help with household. Outdoor activities like depositing utility bills are mainly carried by male members. Shopping is shared by both males and females depending on the items.

Part 2: 30 Years of Polling on Family Issues Section 3: Views on Roles of Family Members/Households Chores
- 59 – Note: For more details on Methodology please refer to the Methodology Section
FAMILY MEMBERS/HOUSEHOLD CHORES
DOMESTIC HELP
Question: Do you have a full time / part time servant for domestic help?
None86%
Full time2%
Part time12%
Source: Gallup & Gilani / National Survey, 2005 Majority of the work in the household is done by family members. External help is a luxury available to very few.

Part 2: 30 Years of Polling on Family Issues Section 3: Views on Roles of Family Members/Households Chores
- 60 – Note: For more details on Methodology please refer to the Methodology Section
FAMILY MEMBERS/HOUSEHOLD CHORES
DO MEN HELP? Question: Some men help their family members with the household chores. Do you or the male members of your household help in household chores?
Somewhat26%
Never43%
Very little21%
A lot9%
No response1%
Source: Gallup & Gilani / National Survey, 2009
Men generally don’t help in household work

Part 2: 30 Years of Polling on Family Issues Section 3: Views on Roles of Family Members/Households Chores
- 61 – Note: For more details on Methodology please refer to the Methodology Section
FAMILY MEMBERS/HOUSEHOLD CHORES
WHO DOES THE HOUSEHOLD SHOPPING? Question: In some households men do the shopping while in others women do shopping. Please tell me that in your household, who does the shopping of following items?
SHOPPING OF ITMES DONE BY MEN DONE BY WOMEN No Response
Clothes 21% 73% 6%
Crockery 23% 69% 8%
Grocery 64% 27% 9%
Machines etc. 81% 11% 8%
Furniture etc. 73% 18% 9%
Source: Gallup & Gilani / National Survey, 2006
Shopping of clothes and crockery is mostly done by women whereas machinery, furniture and grocery shopping is done by male members of the household mostly.

Part 2: 30 Years of Polling on Family Issues Section 3: Views on Roles of Family Members/Households Chores
- 62 – Note: For more details on Methodology please refer to the Methodology Section
FAMILY MEMBERS/HOUSEHOLD CHORES
DO WOMEN HELP IN OUTDOORS CHORES? Question: In some households, women participate in outside activities like depositing utility bills, buying grocery, picking / dropping children to / from school etc. Do women in your household participate in these activities?
No Response1%
Help a lot16%
Somewhat help39%
Do not help44%
Source: Gallup & Gilani / National Survey, 2008
People say that women sometimes help in outdoor activities/ chores.

Part 2: 30 Years of Polling on Family Issues Section 3: Views on Roles of Family Members/Households Chores
- 63 – Note: For more details on Methodology please refer to the Methodology Section
FAMILY MEMBERS/HOUSEHOLD CHORES
WHO SUBMITS UTILITY BILLS?
Question: In your household, who usually deposits Utility Bills?
Others1%
Other male members of the
household32%
Head of the household
57%
Housewife8%
No response2%
Source: Gallup & Gilani / National Survey, 2009
Depositing bills is mainly considered a responsibility of head of household or men.

Part 2: 30 Years of Polling on Family Issues Section 3: Views on Roles of Family Members/Households Chores
- 64 – Note: For more details on Methodology please refer to the Methodology Section
FAMILY MEMBERS/HOUSEHOLD CHORES
A PICTURE, ALMOST THIRTY YEARS BACK
Question: I will readout before you a list of different functions to be performed. These tasks are conducted by the male members of some families and female members of other families in the country. Who is performing these functions at your place? (Ask separately about each task) Men Women Others No
Response Drawing of money from the bank 75% - - 25% Admission of children in school 83% 2% 1% 14% Routine shopping for household 81% 7% 4% 8% Important shopping (eg. Furniture etc) 86% 2% 3% 9% Building a house/purchase of property 91% 1% - 8% To arrange marriage of youngsters 67% 8% 17% 8% Supervision of agriculture and 70% 2% 9% 9%
Source: Gallup & Gilani / National Survey, 1983
It is interesting to note that according to the public opinion polls, women played very little role in shopping, education and marriage of children, financial issues etc about thirty years back. Please note that no recent data is available on this issue.

Part 2: 30 Years of Polling on Family Issues
- 65 –
Part 2: 30 Years of Polling on Family Issues
SECTION 4:
VIEWS ON LEISURE ACTIVITIES
Most of the people say that they have some leisure time. People mostly stay at home in the evenings. Activities related to family and community e.g. wedding celebrations, events related to death and birth appear to be the main activities of free time. People sometimes go out for eating but this proportion is quite small. Similarly very few people visit recreation parks. Many people have a pet at home. Views on these leisure activities are discussed in this section.

Part 2: 30 Years of Polling on Family Issues Section 4: Views on Leisure Activities
- 66 – Note: For more details on Methodology please refer to the Methodology Section
LEISURE ACTIVITIES
HOW MUCH LEISURE TIME DO YOU HAVE?
Question: How much leisure time do you have usually?
No Response1%
Not at all36%
Somewhat56%
A lot7%
Source: Gallup & Gilani / National Survey, 2008
Majority says that they have some leisure/ free time.

Part 2: 30 Years of Polling on Family Issues Section 4: Views on Leisure Activities
- 67 – Note: For more details on Methodology please refer to the Methodology Section
LEISURE ACTIVITIES
LEISURE TIME
Question: How do you spend your leisure time?
Rest / Sleep13%
Visit Friends24%
Watch TV40%
Do some activity15%
Go for outing3%
No Response5%
Source: Gallup & Gilani / National Survey, 2008 Watching Television appears to be the major leisure activity.

Part 2: 30 Years of Polling on Family Issues Section 4: Views on Leisure Activities
- 68 – Note: For more details on Methodology please refer to the Methodology Section
LEISURE ACTIVITIES
HOW DO YOU SPEND YOUR EVENINGS?
Question: Mostly, what do you do in the evening?
Study1% No response
2%
Do my hobby7% Go out with
friends12%
Stay at home40%
Go for walk/ exercise
6%
Watch TV20%
Rest11%
Work1%
Source: Gallup & Gilani / National Survey, 2009
Most of the people say that they stay at home in the evening (40%) and watch Television (20%).

Part 2: 30 Years of Polling on Family Issues Section 4: Views on Leisure Activities
- 69 – Note: For more details on Methodology please refer to the Methodology Section
LEISURE ACTIVITIES
DO PEOPLE GO OUT FOR EATING OR TRAVEL FOR RECREATION? Question: Please tell me if you have participated in following activities during the last month? (Only those who answered yes)
Eating out 29%
Domestic travel for recreation 17%
Domestic travel for work 10%
Foreign travel for recreation 2%
Foreign travel for work 3%
Source: Gallup & Gilani / National Survey, 2009

Part 2: 30 Years of Polling on Family Issues Section 4: Views on Leisure Activities
- 70 – Note: For more details on Methodology please refer to the Methodology Section
LEISURE ACTIVITIES
DO PEOPLE ATTEND CELEBRATIONS IN
FAMILY AND COMMUNITY? Question: Please tell me if you attended following celebrations in the last month? (Only those who answered yes)
Wedding/Engagement etc 47%
Funeral or similar event 33%
Birthday party 19%
On birth of a child 17%
Neighborhood meeting 11%
Professional meeting 11%
Source: Gallup & Gilani / National Survey, 2009 Activities related to family and society e.g. weddings, celebrations related to birth and death appear to be the main leisure activities in our society. More detailed study on this issue is needed to get a better insight.

Part 2: 30 Years of Polling on Family Issues Section 4: Views on Leisure Activities
- 71 – Note: For more details on Methodology please refer to the Methodology Section
LEISURE ACTIVITIES
RECREATIONAL PARK IN THE VICINITY
Question: Do you have a recreational park near your house?
No79%
Yes21%
Source: Gallup & Gilani / National Survey, 2009
Only 21% of Pakistanis say they have a recreational park near their house.

Part 2: 30 Years of Polling on Family Issues Section 4: Views on Leisure Activities
- 72 – Note: For more details on Methodology please refer to the Methodology Section
LEISURE ACTIVITIES
DO PEOPLE VISIT PARKS IN THEIR LEISURE TIME?
Question: If you have a recreational park in the vicinity, then how often do you visit it?* Percent Respondents
Daily 13%
2-3 times a week 12%
Once a week 17%
Once a month 12%
Very rarely 31%
Never 14%
No response 1%
Source: Gallup & Gilani / National Survey, 2009
Most of the people say they visit recreational parks rarely.
* Only those who say they have a Recreational Park near their house

Part 2: 30 Years of Polling on Family Issues Section 4: Views on Leisure Activities
- 73 – Note: For more details on Methodology please refer to the Methodology Section
LEISURE ACTIVITIES
PETS
Question: Do you have any Pet Animal/Bird at home?
No49%
Yes50%
No response1%
Source: Gallup & Gilani / National Survey, 2009

Part 2: 30 Years of Polling on Family Issues Section 4: Views on Leisure Activities
- 74 – Note: For more details on Methodology please refer to the Methodology Section
LEISURE ACTIVITIES
PETS Question: If you have a pet, then which one? (Only Those who say they have a pet at home)
1%
44%
29%
23%
16%
05
101520253035404550
Birds Cats/ Dogs Hens/ Chicks Cows/ Goats Others
Source: Gallup & Gilani / National Survey, 2009
Cows and goats are the pets owned by most people (44%). It is to note that this is mainly by people in the Rural settings. 50% of rural respondents who have a pet say that they have a cow/ goat. Only 16% of urban respondents who have a pet say they have a cow/ goat.

Part 2: 30 Years of Polling on Family Issues Section 4: Views on Leisure Activities
- 75 – Note: For more details on Methodology please refer to the Methodology Section
LEISURE ACTIVITIES
PETS
Question: What is the reason for keeping a pet at home? (Only those who say they have a Pet at home)
No Response2%
Personal Interest46%
Financial Benefit48%
For Business4%
Source: Gallup & Gilani / National Survey, 2009
SEGMENT ANALYSIS
Total Rural Urban Financial Benefit 48% 55% 15%
Personal Interest/ Liking 46% 38% 78%
For Business 4% 4% 4%
No Response 2% - -
Source: Gallup & Gilani / National Survey, 2009
Mostly rural population keeps a pet for financial reasons and people in urban areas generally keep a pet for personal interest

- 76 –
PART 3:
30 YEARS OF POLLING ON COMMUNITY
SECTION 1: VIEWS ON COMMUNITY BEHAVIOUR
SECTION 2: VIEWS ON PROBLEMS OF THE COMMUNITY
SECTION 3: IDEAS CONCERNING LIFE

Part 3: 30 Years of Polling on Community
- 77 –
Part 3: 30 Years of Polling on Community
SECTION 1:
VIEWS ON COMMUNITY BEHAVIOUR
People generally want to help the injured if they witness an accident. The trust in Police is little so fewer people would like to inform Police about the Accident. On the other hand if someone himself experiences some maltreatment, majority would like to report it to the Police. Though, some would take revenge on their own. People generally believe that it is essential to be cautious and not trust everyone, one meets in life. Majority of the people want a change in society.

Part 3: 30 Years of Polling on Community Section 1: Views on Community Behaviour
- 78 – Note: For more details on Methodology please refer to the Methodology Section
COMMUNITY BEHAVIOUR
RESPONSE TO WITNESSING AN ACCIDENT Question: If God forbid while going on road you witness an accident in which a person is injured, what would you do?
Help the injured without informing
the Police 35%
Cannot say anything
17%
Help the injured and inform the
police31%
Ignore and leave the spot
17%
Source: Gallup & Gilani / National Survey, 2009
People mostly want to help the injured in case of an accident. Nearly a third (35%) say they would help but not inform the Police. Another third (31%) say they would help as well as inform the Police. Remaining say that they would leave the spot (17%) or did not express any opinion about it (17%).

Part 3: 30 Years of Polling on Community Section 1: Views on Community Behaviour
- 79 – Note: For more details on Methodology please refer to the Methodology Section
COMMUNITY BEHAVIOUR
REACTION TO MALTREATMENT
Question: If someone maltreats you, what will you do in response?
No response2%
Take revenge on your own
22%
Report to Police41%
Ignore29%
Source: Gallup & Gilani / National Survey, 2009
2000 2009 Report to Police 27% 48% Take revenge on your own 34% 22% Ignore 36% 29% No Response 3% 1%
Source: Gallup & Gilani / National Surveys 2000, 2009
Note: Caution should be taken while interpreting comparative data. Please read the note on Comparative Data in Methodology
Those who say that they would inform the police in case someone maltreats them have increased in last ten years. Opinion that people want to take revenge on their own has decreased over the same time period. This is probably a reflection of growing Public Support for Rule of Law.

Part 3: 30 Years of Polling on Community Section 1: Views on Community Behaviour
- 80 – Note: For more details on Methodology please refer to the Methodology Section
COMMUNITY BEHAVIOUR
ATTITUDE TOWARDS TRUSTING PEOPLE
Question: In your opinion are most of the people trustworthy or is it essential to be cautious in dealing with people so that they cannot harm you?
Most people are Trush worthy
22%
It is essential to be cautious
72%
Don't Know6%
Source: Gallup & Gilani / National Survey, 2003

Part 3: 30 Years of Polling on Community Section 1: Views on Community Behaviour
- 81 – Note: For more details on Methodology please refer to the Methodology Section
COMMUNITY BEHAVIOUR
IDEAS ON REFORMATION OF SOCIETY
Question: There are three basic trends in our society regarding society. Which one of the following do you personally like?
8%
20%
35%37%
05
10152025303540
Our society needscomplete reformationthrough a revolution
Our society should begradually changed by
reforms
Instead of talking ofchange and revolution, weshould try to maintain thepresent society in a good
form
Don't Know
Source: Gallup & Gilani / National Survey, 2009
Majority of people want a better change in Society. 37% favor a revolutionary change and 35% want a gradual change. Only 20% say that society should remain as it is.

Part 3: 30 Years of Polling on Community
- 82 –
Part 3: 30 Years of Polling on Community
SECTION 2:
VIEWS ON PROBLEMS OF THE
COMMUNITY
Economy, law and order, health and education are the top national problems in view of the people. People mostly hold politicians to be responsible for the problems faced by the country. At the level of local community load shedding is the top problem. In personal life financial problems are biggest concern for the majority of people. Similarly at global level, again, economy and terrorism are viewed as the top problems by the majority of the public.

Part 3: 30 Years of Polling on Community Section 2: Views on Problems of the Community
- 83 – Note: For more details on Methodology please refer to the Methodology Section
COMMUNITY PROBLEMS
IMPORTANT PROBLEMS THAT PEOPLE FACE
Question: I will list some of the problems present in our society. Please tell for each, how important or unimportant do you consider the following problems? (only few responses are shown) Very
Important Somewha
t Important
Somewhat Unimporta
nt
Not at all important
Depends on the
situation
Others Don’t Know/No Response
Crime and violence 55% 24% 6% 4% 5% 0% 6%
Financial problems and uncertainty
39% 33% 9% 4% 6% 3% 6%
Poverty and homelessness 53% 17% 12% 8% 3% 2% 5%
Environmental pollution 30% 30% 17% 6% 6% 1% 10%
Unemployment 62% 13% 10% 5% 5% 1% 4%
Lack of honesty in powerful and influential people
42% 25% 13% 8% 5% 1% 6%
Education 59% 17% 9% 4% 4% 2% 5%
Health care 51% 21% 8% 7% 5% 2% 6%
Energy shortage 46% 22% 11% 6% 5% 2% 8%
Terrorism 59% 16% 5% 6% 5% 2% 7%
Source: Gallup & Gilani / National Survey, 2009
Unemployment appears as the most important problem in view of the people. It is followed by Terrorism, crimes and violence issues. Education is also a very important problem. Poverty, health care are other important problems.

Part 3: 30 Years of Polling on Community Section 2: Views on Problems of the Community
- 84 – Note: For more details on Methodology please refer to the Methodology Section
COMMUNITY PROBLEMS
WHICH IS THE MOST IMPORTANT NATIONAL PROBLEM?
Question: Suppose that you have an important position in Government, then out of the following problems which ONE will you strive to solve first?
Restoration of Judges
14%
Control Terrorism28%
Control Inflation33%
Improve economic situation of
country22%
No Response3%
Source: Gallup & Gilani / National Survey, 2008
Economic issues and terrorism ranks as the problems of priority in view of the people.

Part 3: 30 Years of Polling on Community Section 2: Views on Problems of the Community
- 85 – Note: For more details on Methodology please refer to the Methodology Section
COMMUNITY PROBLEMS
WHICH IS THE MOST IMPORTANT NATIONAL PROBLEM?
Question: What is the biggest problem faced by Pakistan these days? (Multiple response)
1%
13%
4%
31%
38%
25%
0
5
10
15
20
25
30
35
40
Unemployment Terrorism Inflation Threat of war Kashmir Issue Others
Source: Gallup & Gilani / National Survey, 2009
Again Economy and Terrorism appear as the top National Problems in view of the Public. Please note that this Survey is from one random month of the year. Perceptions on this issue might vary across the year in light of the changing political national and International situation.

Part 3: 30 Years of Polling on Community Section 2: Views on Problems of the Community
- 86 – Note: For more details on Methodology please refer to the Methodology Section
COMMUNITY PROBLEMS
WHO IS THE MOST RESPONSIBLE FOR
OUR NATIONAL PROBLEMS?
Question: Who do you consider to be most responsible for the problems faced by Pakistan?
1%1%
18%
24%
56%
0
10
20
30
40
50
60
Politicians Bureaucrats Army Others Don’t know/ Noresponse
Source: Gallup & Gilani / National Survey, 2009
Please note that this Survey is from one random month of the year. Perceptions on this issue might vary across the year in light of the changing political national and International situation.

Part 3: 30 Years of Polling on Community Section 2: Views on Problems of the Community
- 87 – Note: For more details on Methodology please refer to the Methodology Section
COMMUNITY PROBLEMS
WHO IS THE MOST RESPONSIBLE FOR
OUR NATIONAL PROBLEMS?
Question: Who do you consider to be most responsible for the problems faced by Pakistan?
COMPARATIVE DATA 1989 2000 2009 Politicians 63% 59% 56% Army 9% 10% 18% Bureaucrats 15% 22% 24% Don’t Know/No Response 13% 9% 2%
Source: Gallup & Gilani / National Surveys, 1989, 2000, 2009
Note: Caution should be taken while interpreting comparative data. Please read the note on Comparative Data in Methodology People hold Politicians to be most responsible followed by Bureaucrats and Army as the culprits for the National problems.

Part 3: 30 Years of Polling on Community Section 2: Views on Problems of the Community
- 88 – Note: For more details on Methodology please refer to the Methodology Section
COMMUNITY PROBLEMS
ISSUES OF THE LOCAL COMMUNITY
Question: In your opinion, what is the biggest problem of your area?
1%7%9%
12%
71%
0
10
20
30
40
50
60
70
80
Load shedding Lack of cleanliness Broken roads Clean water Others
Source: Gallup & Gilani / National Survey, 2009
In light of the Energy Crisis, Electricity Shortage appears as the biggest problem faced by people in their local communities. Please note that opinion on this issue might change from time to time. This is from one random month of 2009.

Part 3: 30 Years of Polling on Community Section 2: Views on Problems of the Community
- 89 – Note: For more details on Methodology please refer to the Methodology Section
COMMUNITY PROBLEMS
ISSUES IN PERSONAL LIFE
Question: What is the most important problem of your life these days?
No problems16%
Family problems14%
Financial Problems
51%Threat to life and
property18%
Others1%
Source: Gallup & Gilani / National Survey, 2009
Comparative Data
1987 2009 Financial Problems 56% 51%
Family Problems 10% 14%
Threat to life and property 15% 18%
No Problem - 16%
Other Responses 19% 1%
Source: Gallup & Gilani / National Survey, 1987, 2009 Note: Caution should be taken while interpreting comparative data. Please read the note on Comparative Data in Methodology Financial problems again appear as the top problem faced by majority of people at personal level.

Part 3: 30 Years of Polling on Community Section 2: Views on Problems of the Community
- 90 – Note: For more details on Methodology please refer to the Methodology Section
COMMUNITY PROBLEMS
GLOBAL ISSUES
Question: I will enlist few problems. Please mention which one of the following is most pertinent at Global level?
25%
5%7%7%
9%
12%
15%
20%
0
5
10
15
20
25
30
Poverty Unemployment Terrorism AmericanHegemony
War andconflicts
Governance byInternationalInstitutions
Economicdistress
Others
Source: Gallup & Gilani / National Survey, 2002
At Global level, financial problems (poverty and unemployment) appear as the top priority followed by problem of terrorism.

Part 3: 30 Years of Polling on Community
- 91 –
Part 3: 30 Years of Polling on Community
SECTION 3:
IDEAS CONCERNING LIFE
People generally aspire to lead a stable, prosperous and secure life. Majority believes themselves to be conservative in following traditional life. People generally consider themselves to be happy in most aspects of life except for the security situation in their vicinity. This dissatisfaction with the security situation has increased as compared to the polls in 1980s. 59% say that they deserve a better life. 53% take pride in their work and majority is satisfied with their profession. These and other opinions on life in general are discussed in this section.

Part 3: 30 Years of Polling on Community Section 3: Ideas Concerning Life
- 92 – Note: For more details on Methodology please refer to the Methodology Section
IDEAS CONCERNING LIFE
WHAT KIND OF LIFE DO YOU LIKE?
Question: From the options of these five kinds of lifestyles, please tell which one do you personally like the most?
Busy and thrilling life6%
Secure life25%
Life with fame26%
Family life17%
Prosperous life26%
Source: Gallup & Gilani / National Survey, 2009
People are divided on the kind of life they aspire. Some would like a prosperous life, some prefer to have a secure life. Others would like to be famous in life or lead a family life. Only 6% say they want a busy and thrilling life.

Part 3: 30 Years of Polling on Community Section 3: Ideas Concerning Life
- 93 – Note: For more details on Methodology please refer to the Methodology Section
IDEAS CONCERNING LIFE
HOW CONSERVATIVE ARE YOU?
Question: Do you consider yourself to be conservative or non conservative in different aspects of life, i.e. do you follow old traditions or do you adopt new fashions and styles?
Very Conservative
17%
Somewhat Conservative
33%
Somewhat innovative
12%
Don’t know4%
Very Innovative3%
Neither Conservative nor
innovative31%
Source: Gallup & Gilani / National Survey, 2009
50% of people consider them to be conservative in ideas i.e. prefer to follow traditional way of life. Only 15% say that they adopt new fashions and styles.

Part 3: 30 Years of Polling on Community Section 3: Ideas Concerning Life
- 94 – Note: For more details on Methodology please refer to the Methodology Section
IDEAS CONCERNING LIFE
ATTITUDE TOWARDS LIFE
Question: Please state if you agree or disagree with the following statements? (Only those who agree are shown) I give more importance to family background than money 85%
While meeting others importance should be given to personal gains 59%
There is nothing more important than money 49%
Job is more important than education 56%
Most of my expenditures are under social pressures 77%
To succeed it is necessary to adopt Society Norms 48%
Source: Gallup & Gilani / National Survey, 2002
People generally regard family background as more important than money

Part 3: 30 Years of Polling on Community Section 3: Ideas Concerning Life
- 95 – Note: For more details on Methodology please refer to the Methodology Section
IDEAS CONCERNING LIFE
HAPPINESS
Question: How happy or unhappy are you regarding following aspects of your life?
Very Happy
Happy Satisfactory
Unhappy Very Unhappy
No Response
Regarding Income 19% 36% 28% 15% 2% - Relations with others 14% 47% 32% 5% 1% 1% Regarding Health 15% 44% 32% 8% 1% - Regarding Work/Profession 13% 41% 36% 8% 1% 1% Regarding Relatives 13% 40% 38% 8% 1% - Regarding peace in your area 4% 17% 31% 36% 12% 1%
Source: Gallup & Gilani / National Survey, 2009
People generally regard themselves as happy in most aspects of life. But a large number (36%) say that they are unhappy about the security condition in their area. Please note that this is from one random month of year. Views on Security situation might be different at different times in light of the changing law and order situation.

Part 3: 30 Years of Polling on Community Section 3: Ideas Concerning Life
- 96 – Note: For more details on Methodology please refer to the Methodology Section
IDEAS CONCERNING LIFE
A PICTURE OF ALMOST THREE DECADES AGO
Question: Are you happy or un-happy regarding following matters?
Very happy
Happy Satisfied Unhappy Not happy at all
No Response
With you own income 14% 30% 30% 17% 4% 5% With your relations with others
22% 45% 24% 3% 1% 5%
With your health 24% 39% 23% 8% 1% 5% With your profession 20% 39% 25% 9% 2% 5% With your relatives 23% 43% 22% 5% 2% 5% With Law and Order Situation
17% 33% 23% 12% 10% 5%
Source: Gallup & Gilani / National Survey, 1981
As compared to 2009 in 1981; comparatively less percentage of people reported as being happy and very happy regarding their personal income (44% and 55% respectively in 1981 and 2009) But those who were unhappy with the law and order situation were 12% in 1981 as compared to 36% in 2009.

Part 3: 30 Years of Polling on Community Section 3: Ideas Concerning Life
- 97 – Note: For more details on Methodology please refer to the Methodology Section
IDEAS CONCERNING LIFE
IS LIFE “JUST” WITH YOU? Question: Overall do you think that life is treating you fairly or do you deserve better than this?
Don’t know14%
Life is fair27%
I deserve a better life
59%
Source: Gallup & Gilani / National Survey, 2009
Despite being happy with life, 59% say that they deserve a better life.

Part 3: 30 Years of Polling on Community Section 3: Ideas Concerning Life
- 98 – Note: For more details on Methodology please refer to the Methodology Section
IDEAS CONCERNING LIFE
DO YOU TAKE PRIDE IN YOUR WORK? Question: How much pride do you take in whatever work you are doing?
A lot22%
Somewhat31%
A little24%
Not at all22%
No response1%
Source: Gallup & Gilani / National Survey, 2009
People are divided on the issue of taking pride in their work. 53% say that they take some or a lot pride in their work as compared to 46% who don’t take any pride or take very little pride in their work.

Part 3: 30 Years of Polling on Community Section 3: Ideas Concerning Life
- 99 – Note: For more details on Methodology please refer to the Methodology Section
IDEAS CONCERNING LIFE
PROFESSIONAL SATISFACTION Question: To what extent are you satisfied or dissatisfied with your profession?
5%7%
18%
48%
22%
0
10
20
30
40
50
60
Satisfied to a greatextent
Satisfied to someextent
Dissatisfied to someextent
Dissatisfied to a greatextent
No response
Source: Gallup & Gilani / National Survey, 2009
Most people are satisfied with their profession

Part 3: 30 Years of Polling on Community Section 3: Ideas Concerning Life
- 100 – Note: For more details on Methodology please refer to the Methodology Section
IDEAS CONCERNING LIFE
OPTIMISM ABOUT LIFE
Question: In your view the next generation will spend a better or worse or the same life as yours in following aspects?
28% 17% 29% 26%
47% 14% 24% 15%
41% 11% 34% 14%
71% 6% 11% 12%
0 10 20 30 40 50 60 70 80 90 100
Peace
Religion
Health
Education
Better The same Worse Don’t know / No response
Source: Gallup & Gilani / National Survey, 2009
People are most optimistic regarding EDUCATION POSSIBILITIES FOR THEIR NEXT GENERATION. Question: In your view, whether your children will get more chances to succeed in life than you or less chances or nearly similar chances.
Children will get more chances 54% Children will get similar chances 15% Children will get less chances 13% No response 18%
Source: Gallup & Gilani / National Survey, 1987
Majority were optimistic about the future of their children about twenty years ago. Recent data on these issues is needed to have a better insight.

- 101 –
PART 4:
30 YEARS OF POLLING ON CIVIL SOCIETY FORMATION IN THE COUNTRY
SECTION 1: VIEWS ON PORVERTY
SECTION 2: VIEWS ON HUMAN RIGHTS AND DISCRIMINATION
SECTION 3: VIEWS ON HELPING THE SOCIETY
SECTION 4: HELPING THE CHILDREN OF THE WORLD
SECTION 5: FOREIGN AID
SECTION 6: VIEWS ON SOCIAL ORGANIZATIONS

Part 4: 30 Years of Polling on Civil Society Formation in the Country
- 102 –
Part 4: 30 Years of Polling on Civil Society Formation in the Country
SECTION 1:
VIEWS ON POVERTY
Poverty and its associated effects are one of the main problems that need to be tackled by co operation within the society as well as collaboration between countries. Hence it is an issue which is a focus for individuals and organizations working for the betterment of the society. This section gives some insight into what people think is the cause of poverty, perceptions about growing burden of poverty in the country and other related issues.

Part 4: 30 Years of Polling on Civil Society Formation in the Country Section 1: Views on Poverty
- 103 – Note: For more details on Methodology please refer to the Methodology Section
POVERTY
WHY ARE SOME COUNTRIES POOR?
Question: What do you think is the main reason for the poverty of the poor/ developing countries of the world?
Don't Know3%
God's Will11%
Personal Laziness18%
Poor National Governments
38%
International Injustice
30%
Source: Gallup & Gilani / National Survey, 2009

Part 4: 30 Years of Polling on Civil Society Formation in the Country Section 1: Views on Poverty
- 104 – Note: For more details on Methodology please refer to the Methodology Section
POVERTY
WHY ARE SOME PEOPLE RICH?
Question: Like everywhere in the world, some people in our country are rich while others are poor. What do you think is the reason for rich people being rich?
1%4%5%
16%
46%
18% 15%
0
10
20
30
40
50
Hardwork Luck Born in richfamily
Illegal wealth Earned fromabroad
Are educated No response
Source: Gallup & Gilani / National Survey, 2009
Comparative Data
1981 2009 Hard work 32% 18% Luck 18% 15% Born with a silver spoon 40% 46% Money earned by unfair means 35% 16% Money earned from abroad 27% 5% Because of being educated 18% 4% Others 4% - No response 3% 1% Total 177%* 105%**
Source: Gallup & Gilani / National Survey 1981, 2009
Note: Caution should be taken while interpreting comparative data. Please read the note on Comparative Data in Methodology People attribute wealth to being born in a rich family, generally. Only 18% attribute it to hard work and very few (4%) attribute it to education. * Two responses were solicited ** Multiple responses were permitted with no special instructions

Part 4: 30 Years of Polling on Civil Society Formation in the Country Section 1: Views on Poverty
- 105 – Note: For more details on Methodology please refer to the Methodology Section
POVERTY
WHY ARE SOME PEOPLE POOR? Question: Like everywhere in the world, some people in our country are rich while others are poor. What do you think is the reason for poor people being poor?
5%4%
12%
43%
12%
28%
05
101520253035404550
Because of beingLazy
Bad luck Born in poorfamily
No earnings byunfair means
Not beingemployed abroad
Because of beingilliterate
Source: Gallup & Gilani / National Survey, 2009
Comparative Data
1981 2009 Because of being Lazy 17% 12% Bad luck 50% 28% Born in poor family 40% 43% No earnings by unfair means 18% 12% Not being employed abroad 13% 4% Because of being illiterate 31% 5% Others 5% - No response - 1% Total 174%* 105%**
Source: Gallup & Gilani / National Surveys, 1981, 2009
Note: Caution should be taken while interpreting comparative data. Please read the note on Comparative Data in Methodology People consider that poverty is a viscous circle, those born in a poor family are likely to be poor themselves or it is just a matter of bad luck. Fewer people attribute poverty to lack of hard work (12%) and illiteracy (5%). * Two responses were solicited ** Multiple responses were permitted with no special instructions

Part 4: 30 Years of Polling on Civil Society Formation in the Country Section 1: Views on Poverty
- 106 – Note: For more details on Methodology please refer to the Methodology Section
POVERTY
CAN A POOR CHILD PROGRESS IN LIFE?
Question: In your opinion what are the chances of a child who is born in a poor family in our country, become wealthy if he works hard?
don’t know8%
very little20%
a lot30%
some28%
not at all14%
Source: Gallup & Gilani / National Survey, 2009
Comparative Data
1981 2009 A lot 42% 30% Some 20% 28% Little 22% 20% Not at all 10% 14% Don’t know 6% 8%
Source: Gallup & Gilani / National Surveys 1981, 2009
Note: Caution should be taken while interpreting comparative data. Please read the note on Comparative Data in Methodology It is unfortunate to see that in 1981 62% said that there was some or a lot of chance for a poor child to progress if he works hard. In 2009 slightly less i.e. 58% expressed this optimistic view.

Part 4: 30 Years of Polling on Civil Society Formation in the Country Section 1: Views on Poverty
- 107 – Note: For more details on Methodology please refer to the Methodology Section
POVERTY
HAVE YOU EXPERIENCED HUNGER (Shortage of Food)?
Question: Have you or your household faced any shortage of food during the last year?
Never64%
Sometimes10%
Often2%
Less frequently23%
No response1%
Source: Gallup & Gilani / National Survey, 2009
Question: Have you ever slept without having a meal?
Never64%
Sometimes10%
Often3%
Less frequently22%
No response1%
Source: Gallup & Gilani / National Survey, 2009

Part 4: 30 Years of Polling on Civil Society Formation in the Country Section 1: Views on Poverty
- 108 – Note: For more details on Methodology please refer to the Methodology Section
POVERTY
IS POVERTY ON THE RISE?
Question: In your view has the poverty increased, decreased or remained the same in Pakistan in the last decade?
1%
20%17%
62%
0
10
20
30
40
50
60
70
Increased No change Decreased Don't Know
Source: Gallup & Gilani / National Survey, 2009

Part 4: 30 Years of Polling on Civil Society Formation in the Country
- 109 –
Part 4: 30 Years of Polling on Civil Society Formation in the Country
SECTION 2:
VIEWS ON HUMAN RIGHTS AND
DISCRIMINATION
Human Rights Protection is also an important task for the Civil Society Workers. This section gives some insight into public opinion on this issue in the country. Generally most of the people say that Human Rights are being protected in the country. But there are concerns about certain specific rights. A lot of people fear discrimination on various grounds in their personal life. Majority believes that the opportunities in the country are restricted for a selected minority.

Part 4: 30 Years of Polling on Civil Society Formation in the Country Section 2: Views on Human Rights and Discrimination
- 110 – Note: For more details on Methodology please refer to the Methodology Section
HUMAN RIGHTS AND DISCRIMINATION
ARE HUMAN RIGHTS PROTECTED IN THE COUNTRY?
Question: Overall, in your opinion, to what extent Human Rights are being protected in Pakistan?
No response6%
Some protection53%
Total protection13%No protection
28%
Source: Gallup & Gilani / National Survey, 2009

Part 4: 30 Years of Polling on Civil Society Formation in the Country Section 2: Views on Human Rights and Discrimination
- 111 – Note: For more details on Methodology please refer to the Methodology Section
HUMAN RIGHTS AND DISCRIMINATION
ARE HUMAN RIGHTS PROTECTED IN THE COUNTRY?
Question: I will enlist few Human Rights. In your opinion how much are they being followed in our country?
A lot Somewhat
Not at All
No Response
No one should be subject to Torture 33% 31% 35% 1% Everyone is equal in terms of Law 24% 37% 38% 1% Marriage is possible with the consent of two people 34% 44% 21% 1% Everyone has freedom of religion 51% 39% 9% 1% Everyone has freedom of expression 41% 37% 21% 1% Everyone should get right reward for his/her work 26% 39% 33% 2%
Source: Gallup & Gilani / National Survey, 2009
On the whole, though majority thinks that human rights are protected in the country. But when we ask them about specific rights, 38% think that Equality of Law is not followed. 35% think that people are subjected to torture and 33% think that not everyone is equally rewarded for his/her work.

Part 4: 30 Years of Polling on Civil Society Formation in the Country Section 2: Views on Human Rights and Discrimination
- 112 – Note: For more details on Methodology please refer to the Methodology Section
HUMAN RIGHTS AND DISCRIMINATION
ARE YOU BEING TREATED EQUALLY?
Question: Please tell me whether you consider that you are being treated equally (economically as well as socially) in following aspects of life?
Those who think they are treated equally
On personal level 57%
Religious grounds 59%
Linguistic grounds 53%
Source: Gallup & Gilani / National Survey, 2005

Part 4: 30 Years of Polling on Civil Society Formation in the Country Section 2: Views on Human Rights and Discrimination
- 113 – Note: For more details on Methodology please refer to the Methodology Section
HUMAN RIGHTS AND DISCRIMINATION
ARE YOU BEING TREATED EQUALLY?
Question: In your opinion whether there are opportunities for the welfare of all the people in Pakistan or are they reserved for only a selected group?
For all people27%
For selected few people only
63%
Don't Know10%
Source: Gallup & Gilani / National Survey, 2003

Part 4: 30 Years of Polling on Civil Society Formation in the Country
- 114 –
Part 4: 30 Years of Polling on Civil Society Formation in the Country
SECTION 3:
VIEWS ON HELPING THE SOCIETY
There is a saying that God helps those who help themselves. In order to improve the situation of a society it is important to create an urge among the individuals to play their role in helping their fellow beings. This section gives some ideas on what people think about helping the society. Most of the people say that the trend of helping the poor has decreased in the society. Only 10% say that they had done some volunteer work in the preceding month. Most of the people say that people generally prefer personal gains to collective welfare.

Part 4: 30 Years of Polling on Civil Society Formation in the Country Section 3: Views on Helping the Society
- 115 – Note: For more details on Methodology please refer to the Methodology Section
HELPING THE SOCIETY
HELPING THE POOR Question: In your opinion, has the trend of helping the poor increased, decreased or remained the same?
Increased16%
Decreased55%
Don’t know1%
Remained the same28%
Source: Gallup & Gilani / National Survey, 2009
Comparative Data
2005 2009 Increased 25% 16% Decreased 44% 55% No Change 31% 28% Don’t Know / No Response - 1%
Source: Gallup & Gilani / National Surveys 2005, 2009
Note: Caution should be taken while interpreting comparative data. Please read the note on Comparative Data in Methodology

Part 4: 30 Years of Polling on Civil Society Formation in the Country Section 3: Views on Helping the Society
- 116 – Note: For more details on Methodology please refer to the Methodology Section
HELPING THE SOCIETY
VIEWS ON VOLUNTEER WORK Question: Have you done any volunteer work in the last few months?
No Response1%
Yes10%
No89%
Source: Gallup & Gilani / National Survey, 2008

Part 4: 30 Years of Polling on Civil Society Formation in the Country Section 3: Views on Helping the Society
- 117 – Note: For more details on Methodology please refer to the Methodology Section
HELPING THE SOCIETY
VIEWS ON VOLUNTEER WORK
Question: If you did any volunteer work in the last few months, what was the work?*
24%
15%
4%5%8%8%
36%
0
5
10
15
20
25
30
35
40
Helping Poor Helping thesick
Helpingaffectees ofBalochistan
Earthquake (NaturalDisaster)
Participated insocial work
Helpedaround the
mosque
Others No response
Source: Gallup & Gilani / National Survey, 2008
* Only those who say they have done some volunteer work in the last month

Part 4: 30 Years of Polling on Civil Society Formation in the Country Section 3: Views on Helping the Society
- 118 – Note: For more details on Methodology please refer to the Methodology Section
HELPING THE SOCIETY
IDEAS ON COLLECTIVE WELFARE Question: In your opinion, do people of our society prefer their personal interests or the collective interests?
Collective interest10%
Personal interest90%
Source: Gallup & Gilani / National Survey, 2003

Part 4: 30 Years of Polling on Civil Society Formation in the Country
- 119 –
Part 4: 30 Years of Polling on Civil Society Formation in the Country
SECTION 4:
VIEWS ON HELPING THE CHILDREN OF THE WORLD
This section is about public aspirations for helping the children of the World. Despite being a poor country, Pakistanis express very passionate opinions about helping children of the world. 47% say they can sacrifice a day’s meal to save life of an unknown child. People consider poor economic conditions to be mostly responsible for causing children deaths and thus want the World to increase its investment in this field to save children. People mostly want to help children both in the country as well as in Nations poorer than our own country.

Part 4: 30 Years of Polling on Civil Society Formation in the Country Section 4: Views on Helping the Children of the World
- 120 – Note: For more details on Methodology please refer to the Methodology Section
HELPING THE CHILDREN OF THE WORLD
SAVING A CHILD’S LIFE Question: Please tell me what would you like to sacrifice for saving life of a child you don’t know of or have never met?
11%9%
1%1%
8%
17%
47%
6%
05
101520253035404550
a cup of teaor coffee
a meal a day's pay a holiday /vacation
a new car your house nothing don’t know
Source: Gallup & Gilani / National Survey, 2009
It is very encouraging to note that despite having a large number of people who are living below the poverty line, 47% of Pakistanis express the opinion that they can sacrifice a day’s meal in order to save life of a child. 17% say they can sacrifice a day’s income to save a child.

Part 4: 30 Years of Polling on Civil Society Formation in the Country Section 4: Views on Helping the Children of the World
- 121 – Note: For more details on Methodology please refer to the Methodology Section
HELPING THE CHILDREN OF THE WORLD
THREATS TO CHILDREN
Question: Which of the following do you think is the greatest threat to children’s lives?
36%
19%16%
8% 7% 6%4% 4%
0
5
10
15
20
25
30
35
40
Poverty Economic crisis Unemployment The gapbetween rich
and poor
Crime Environment /Climate change
Corruption Don’t know
Source: Gallup & Gilani / National Survey, 2009 Poor Economic Conditions (poverty, economic crisis, unemployment etc) are viewed as the top threats which are killing a large number of children of the world.

Part 4: 30 Years of Polling on Civil Society Formation in the Country Section 4: Views on Helping the Children of the World
- 122 – Note: For more details on Methodology please refer to the Methodology Section
HELPING THE CHILDREN OF THE WORLD
INVESTMENT ON CHILDREN
Question: World leaders promised to reduce preventable child death by two-thirds between 1990 and 2015. How much extra investment would you guess is needed each year to reach that target? Is it the same as the amount of money spent worldwide each year?
21%
5%5%5%
11%
28%25%
0
5
10
15
20
25
30
Military (US$ 1.46trillion)
Tobacco products(US$ 400
Confectionary (US$150
Video games (US$ 40billion)
Bottled water (US$ 35billion)
Make-up (US$ 18billion)
Don’t know
Source: Gallup & Gilani / National Survey, 2009
As the majority considers poor economic situations to be the top killers of children, most people want the World to spend huge amounts in order to save our children.

Part 4: 30 Years of Polling on Civil Society Formation in the Country Section 4: Views on Helping the Children of the World
- 123 – Note: For more details on Methodology please refer to the Methodology Section
HELPING THE CHILDREN OF THE WORLD
CHILDREN IN OTHER
POOR COUNTRIES OF THE WORLD
Question: Each year approximately nine million under-five children and babies die, most of them from preventable diseases like malaria and pneumonia, or from hunger. The following questions refer to this as ‘preventable child death’. Do you think it is more important to end preventable child deaths in your own country, or in countries poorer than your own?
Poorer than your own country
20%
All are equally important
40%
Don’t know16%
Your own country24%
Source: Gallup & Gilani / National Survey, 2009
20% say that it is more important to end preventable child death in countries poorer than Pakistan. 40% say it is equally important to end preventable child death both in our own country and in countries poorer than us. Only 24% say that we should only help children in our own country.

Part 4: 30 Years of Polling on Civil Society Formation in the Country
- 124 –
Part 4: 30 Years of Polling on Civil Society Formation in the Country
SECTION 5:
VIEWS ON FOREIGN AID
The Nations of the World have pledged to work together for the development of Mankind. One of the goals in the Millennium Development Goals (MDGs) is international collaboration for ending poverty, in equality, ignorance, disease and environmental destruction. Foreign Aid from the Developed Countries to help the poor of the developing countries is part of these efforts. This section is about what are the public perceptions about Foreign Aid. People want the Developed Countries to increase Humanitarian Aid for poor Countries. Majority says that the Aid would be mostly wasted before reaching the Poor of the Country. Despite being a developing country, a large number of Pakistanis express the opinion that Pakistan should help the poor in other parts of the world as well in addition to poor in our own country.

Part 4: 30 Years of Polling on Civil Society Formation in the Country Section 5: Views on Foreign Aid
- 125 – Note: For more details on Methodology please refer to the Methodology Section
FOREIGN AID
IDEAS ON FOREIGN AID
Question: Some countries of the world are rich and others are poor. Do you think that the rich countries should increase their financial aid for the poor countries or is the present amount sufficient?
The present Aid is sufficient
14%More financial Aid should be
given85%
No response1%
Source: Gallup & Gilani / National Survey, 2003
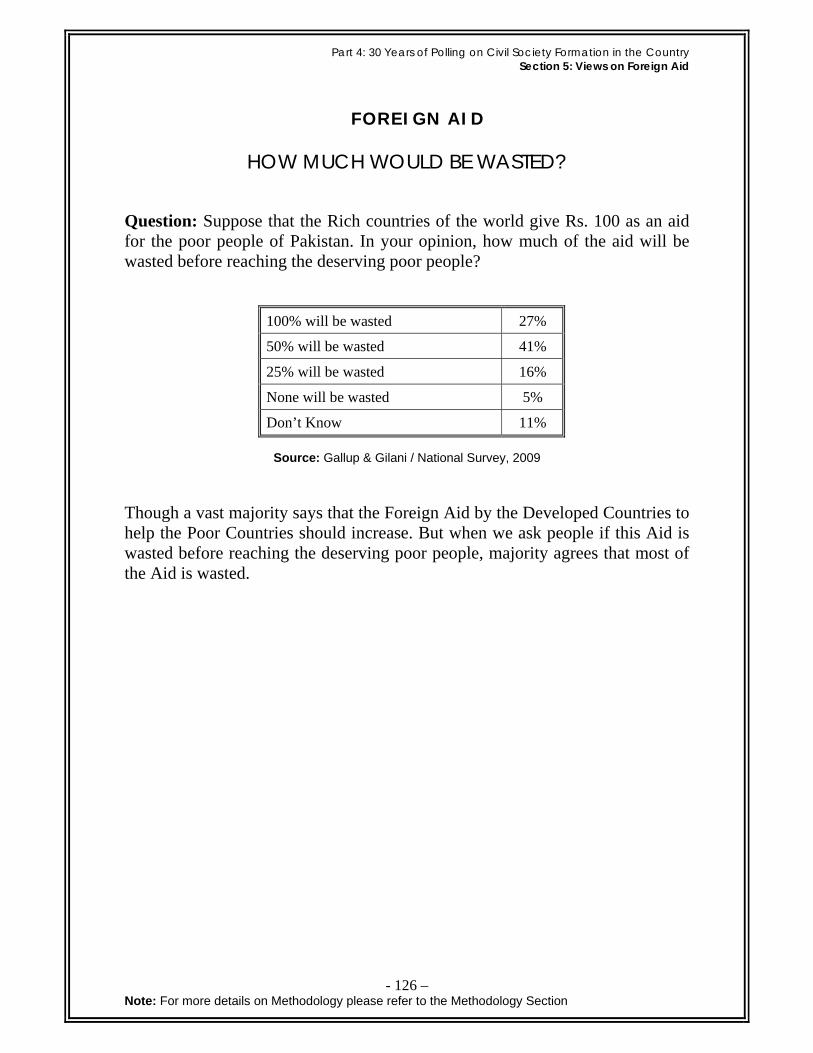
Part 4: 30 Years of Polling on Civil Society Formation in the Country Section 5: Views on Foreign Aid
- 126 – Note: For more details on Methodology please refer to the Methodology Section
FOREIGN AID
HOW MUCH WOULD BE WASTED?
Question: Suppose that the Rich countries of the world give Rs. 100 as an aid for the poor people of Pakistan. In your opinion, how much of the aid will be wasted before reaching the deserving poor people?
100% will be wasted 27%
50% will be wasted 41%
25% will be wasted 16%
None will be wasted 5%
Don’t Know 11%
Source: Gallup & Gilani / National Survey, 2009 Though a vast majority says that the Foreign Aid by the Developed Countries to help the Poor Countries should increase. But when we ask people if this Aid is wasted before reaching the deserving poor people, majority agrees that most of the Aid is wasted.

Part 4: 30 Years of Polling on Civil Society Formation in the Country Section 5: Views on Foreign Aid
- 127 – Note: For more details on Methodology please refer to the Methodology Section
FOREIGN AID
ALL COUNTRIES SHOULD BE HELPED
DESPITE THEIR CORRUPTION
Question: I will read two statements. Please indicate which one do you favor?
The developed countries should help only those poor countries which do not have corruption. 35%
Such steps should be taken that the poor people of the poor countries can be helped without taking their Governments/Administrative structures into consideration.
63%
No response 2%
Source: Gallup & Gilani / National Survey, 2003
Despite realization that Aid is wasted due to Corruption, still majority says that all Poor Countries should be helped by the Rich Countries.

Part 4: 30 Years of Polling on Civil Society Formation in the Country Section 5: Views on Foreign Aid
- 128 – Note: For more details on Methodology please refer to the Methodology Section
FOREIGN AID
SHOULD PAKISTAN ALSO HELP THE POOR OF THE WORLD?
Question: Suppose that the Government of your country has one hundred Rupees which is to be spent for poverty Alleviation of people in Pakistan and other poor countries of the world. How much of this money should the Government give to the poor people in other poor countries of the world?
8%
24%
16%14%
27%
11%
0%
5%
10%
15%
20%
25%
30%
Zero 1 Ruppee 1-4 Rs 4-10 Rs >10 Rs Don'tKnow
Source: Gallup & Gilani / National Survey, 2009 Most of the respondents say that Pakistan should also give Aid to help the Poor living in other parts of the World in addition to poor in our own country.

Part 4: 30 Years of Polling on Civil Society Formation in the Country Section 5: Views on Foreign Aid
- 129 – Note: For more details on Methodology please refer to the Methodology Section
FOREIGN AID
VIEWS ON HUMANITARIAN AID
Question: In your opinion, during war/conflict should the Humanitarian Aid Agencies work independently or should they collaborate their activities with Government and Military Agencies?
It makes no difference
7%
Military should cooperate with these
Agencies21%
Humanitarian Agencies should
work Independently38%
Political Forces should co-operate with the Agencies
11%
Don’t Know23%
Source: Gallup & Gilani / National Survey, 2005

Part 4: 30 Years of Polling on Civil Society Formation in the Country
- 130 –
Part 4: 30 Years of Polling on Civil Society Formation in the Country
SECTION 6:
VIEWS ON SOCIAL ORGANIZATIONS
Views on the Red Cross, NGOs, Trade Unions etc are briefly discussed in this section

Part 4: 30 Years of Polling on Civil Society Formation in the Country Section 6: Views on Social Organizations
- 131 – Note: For more details on Methodology please refer to the Methodology Section
VIEWS ON SOCIAL ORGANIZATIONS
VIEWS ON RED CROSS Question: In your opinion, International Committee of the Red Cross (ICRC) participates in which of the following activities? (Only those who say ICRC participates in respective activities are shown). (Multiple response question, responses might add up to more than a 100%).
22%
61%61%
70%77%
73%
0
10
20
30
40
50
60
70
80
90
Helping thepeople affected byNatural Disasters
Providing first Aid/ Medical help
Welfare ofprisoners of war
Helping therefugees
Provision of foodand other items
Don't Know
Source: Gallup & Gilani / National Survey, 2005

Part 4: 30 Years of Polling on Civil Society Formation in the Country Section 6: Views on Social Organizations
- 132 – Note: For more details on Methodology please refer to the Methodology Section
VIEWS ON SOCIAL ORGANIZATIONS
WHAT DO PEOPLE ATTRIBUTE TO ICRC?
Question: When you hear the world ICRC, what comes to your mind i.e., which of the following characteristics do you attribute to ICRC? (Only those who say each characteristic is attributable to ICRC are shown) (Multiple response question, responses might add up to more than a 100%).
P0SITIVE ATTRIBUTES:
Humanitarian 71% Global 62% Independent 50% Neutral 49% Wealthy 43% Honest / Reliable 48%
NEGATIVE ATTRIBUTES: Western 27% Religious 27% Ineffective 25% Political 30% None of the above 18% Don’t Know 33%
Source: Gallup & Gilani / National Survey, 2005

Part 4: 30 Years of Polling on Civil Society Formation in the Country Section 6: Views on Social Organizations
- 133 – Note: For more details on Methodology please refer to the Methodology Section
VIEWS ON SOCIAL ORGANIZATIONS
VIEWS ON NGOs
Question: Some people think that NGOs are doing a good job for the betterment of society and country. Others believe that they are only making their own money. What do you think about them?
They are only making money
58%
They are doing a good job
33%
Don't Know9%
Source: Gallup & Gilani / National Survey, 2001
Please note that this is only a single question and cannot depict public perception about NGOs. A detailed study on this issue is needed for a better insight.

Part 4: 30 Years of Polling on Civil Society Formation in the Country Section 6: Views on Social Organizations
- 134 – Note: For more details on Methodology please refer to the Methodology Section
VIEWS ON SOCIAL ORGANIZATIONS
VIEWS ON TRADE UNIONS
Question: Do you belong to a Trade Union?
No96%
Yes3%
No Response1%
Source: Gallup & Gilani / National Survey, 2007
Question: Does anyone else in your household belong to a Trade Union?
No97%
Yes3%
Source: Gallup & Gilani / National Survey, 2007

- 135 –
METHODOLOGY

- 136 –
METHODOLOGY
The results presented here are from multiple nation wide house hold surveys carried out by Gallup and Gilani over the last three decades (1980-2010) • SAMPLE PROFILE: The respondents in these surveys range from 1000-2500 men and women of age 18 years and above spread across the rural and urban areas of the four provinces of the country. They represent different age groups, education status and socio economic profile. Those which are urban only samples have been mentioned. • INTERVIEWING MODE: Face to Face, in-house interviews • SAMPLING METHODOLOGY: Multi-stage area probability sampling • SAMPLING TOLERANCE: Error margin is estimated to be ±2-3% at 95% Confidence level WEIGHTING:
The data have been weighted to correspond with census distribution of population for the rural and urban areas of all four provinces. • SURVEY DATES: The respective year in which these surveys were carried out has been mentioned at the bottom of all charts and tables. • VALUES/ PERCENTAGES: All values given in this report are percentages unless otherwise specified.

- 137 –
NOTE ON COMPARATIVE SECTIONS:
Caution should be taken in interpreting results in comparative sections of the report. The purpose of having comparative data is to show a broad trend in timeline rather than providing a statistical difference in opinions. This caution is based on following major considerations: • The exact question wordings may vary across the years where comparison
is drawn • The methodology and sample size may vary • The timeline is not uniform, we have provided data at two or more points
in time as available. DISCLAIMER This report is for Public Debate and not for strict policy measures or decisions. Gallup and Gilani does not take any responsibility for any loss or profit arising out of Public or Private use of this report or its findings. PROPREITORY INFORMATION The Data quoted and used in this report is the property of Gallup & Gilani Pakistan.

- 138 –
REPRESENTS Statistical Cross-section: Gender, Age, Income, Education, Region & Language Universe: ~45,000 villages; 60,000 Urban Census Blocks
15 %
5 %
55 %
25 %
Rawalpindi Division
Sargodha Division
Faisalabad Division
Gujranwala Division
Lahore Division
Multan Division
DG Khan Division
Bahawalpur Division
Karachi Division
Mirpur Khas Division
Hyderabad Division
Sukkur Division
Larkana Division
Malakand Division
Bannu, DIKhan, Kohat Division
Hazara Division
Peshawar and Mardan Division
Quetta, Zhob Division
Kalat, Nasirabad, Sibi Division
Makran Division
Gallup & Gilani Pakistan
OPINION POLLING in Pakistan
Khyber Pakhtoon Khawa/

Contact Details: Islamabad: +92 51 2655630 Lahore: +92 42 35842419 Karachi: +92 21 4537569 Email: [email protected] Web : www.gallup.com.pk www.gallup-international.com