3.04: economic development and employment programs€¦ · 1.1.1 ministry’s economic development...
TRANSCRIPT

Economic Development and Employment Programs
Chapter 3Section 3.04
Chap
ter 3
• VF
M S
ectio
n 3.
04
167
Ministry of Economic Development, Employment and Infrastructure
1.0 Background
1.1 Overview1.1.1 Ministry’s Economic Development and Employment Programs
As part of its efforts to support economic develop-ment and employment in Ontario, the provincial government provides multi-year grants and interest-free loans to businesses to help with pro-jects ranging from expansion to export growth to research and development.
Several ministries deliver these supports, but the funds that focus entirely on existing businesses flow through the Ministry of Economic Develop-ment, Employment and Infrastructure, formerly the Ministry of Economic Development, Trade and Employment (Ministry).
Since 2004 and up to May 31, 2015, the Ministry had committed through contracts with businesses to funding 374 projects with a total of $2.36 bil-lion—$1.87 billion in grants and $489 million in loans—through seven different funds, described in Figure 1. Between 2004 and May 31, 2015, the Ministry had disbursed $1.45 billion of the $2.36-billion commitment, including $130 million for the year ended March 31, 2015. The remaining $913 million in committed funds will be paid over
the next 11 years, while the projects are being com-pleted and if they meet job and investment targets.
The seven ministry funds each have distinct mandates, and focus on different industries and geographic areas of the province. In the last decade, they have assisted projects involving information and communication technology, clean/green tech-nology, financial services, life sciences, automotive, manufacturing, and research and development. The Ministry generally does not fund projects related to agriculture, forestry, mining, oil and gas, or transportation.
Ministry objectives and responsibilities are laid out in the Ministry of Economic Development and Trade Act, while its responsibility for economic development specifically in Ontario’s eastern and southwestern regions is governed by the Attracting Investment and Creating Jobs Act, 2012.
For the year ended March 31, 2015, the Ministry had about 46 full-time equivalent staff and spent $4.9 million to administer its economic develop-ment and employment programs.
Other Programs OfferedThe Ministry also administers Sector Support Funds that provide one-time grants to not-for-profit organizations for economic development, innova-tion and commercialization, science and research, and/or trade and investment. Grants have included

2015 Annual Report of the Office of the Auditor General of Ontario168
Chap
ter 3
• VF
M S
ectio
n 3.
04
Figur
e 1: D
irect
Bus
ines
s Sup
port
Prog
ram
s Adm
inist
ered
Sin
ce 2
004
by th
e Min
istry
of Ec
onom
ic De
velo
pmen
t, Em
ploy
men
t and
Infra
stru
ctur
e,
as of
May
31, 2
015
Sour
ce o
f dat
a: M
inis
try o
f Eco
nom
ic D
evel
opm
ent,
Empl
oym
ent a
nd In
frast
ruct
ure
Stra
tegi
c Job
s and
Onta
rioAd
vanc
edSo
uthw
este
rnIn
vest
men
t Fun
dAu
tom
otive
Man
ufac
turin
gEa
ster
n On
tario
Onta
rio(In
clud
ing
Inve
stm
ent
Inve
stm
ent
Next
Gen
erat
ion
Deve
lopm
ent
Deve
lopm
ent
Stra
tegi
cJo
bs a
ndSt
rate
gy
Stra
tegy
of
Jobs
Fund
Fu
nd
Fund
In
vest
men
t Fun
d)Pr
ospe
rity F
und
Tota
lTo
tal f
undi
ng
orig
inal
ly
anno
unce
d $5
00 m
illio
n$5
00 m
illio
n$1
.150
bill
ion1
$20
mill
ion
annu
ally
$20
mill
ion
annu
ally
$375
mill
ion
$2 b
illio
n2,3
Year
sta
rted–
ende
d20
04–a
pplic
atio
ns
clos
ed in
200
920
05–a
pplic
atio
ns
clos
ed in
201
020
08–a
pplic
atio
ns
clos
ed in
200
920
08–o
ngoi
ng20
12–o
ngoi
ng20
10–a
pplic
atio
ns
clos
ed in
201
320
15–o
ngoi
ng
Aver
age
cont
ract
le
ngth
5–10
yea
rs5
year
s di
sbur
sem
ent,
plus
5 y
ears
loan
re
paym
ent
5 ye
ars
3–4
year
s3–
4 ye
ars
5 ye
ars
No c
ompl
eted
co
ntra
cts
yet
Appl
icat
ion
or
invi
tatio
n4Ap
plic
atio
nIn
vita
tion
Purp
ose
of fu
ndAs
sist
s au
tom
otiv
e as
sem
bly
com
pani
es
and
parts
m
anuf
actu
rers
. Fo
cuse
s on
en
viro
nmen
tal a
nd
ener
gy te
chno
logi
es.
Prov
ides
ski
lls
train
ing
and
empl
oym
ent.
Lend
s to
m
anuf
actu
rers
fo
r inv
estm
ent
in le
adin
g-ed
ge
tech
nolo
gies
an
d pr
oces
ses
to in
crea
se
prod
uctiv
ity a
nd
com
petit
iven
ess,
wh
ile c
reat
ing/
reta
inin
g jo
bs.
Prov
ides
ass
ista
nce
to c
ompa
nies
fo
r inn
ovat
ions
in
rese
arch
, de
velo
pmen
t and
co
mm
erci
aliza
tion,
wh
ile c
reat
ing
and/
or re
tain
ing
jobs
and
in
vest
ing
in O
ntar
io.
Prov
ides
as
sist
ance
for
empl
oym
ent a
nd
regi
onal
eco
nom
ic
deve
lopm
ent t
o bu
sine
sses
and
or
gani
zatio
ns in
ea
ster
n On
tario
.
Prov
ides
as
sist
ance
for
empl
oym
ent a
nd
regi
onal
eco
nom
ic
deve
lopm
ent t
o bu
sine
sses
and
or
gani
zatio
ns in
so
uthw
este
rn
Onta
rio.
Prov
ides
ass
ista
nce
to h
elp
com
pani
es
com
pete
glo
bally
, wh
ile c
reat
ing
and
reta
inin
g sk
illed
jobs
an
d in
vest
ing
in
Onta
rio.
Prov
ides
ass
ista
nce
to c
ompa
nies
in
vest
ing
in
proj
ects
rela
ted
to p
rodu
ctiv
ity,
inno
vatio
n an
d ex
ports
to e
nabl
e th
em to
com
pete
gl
obal
ly.
Type
of f
undi
ng
and
max
imum
Gr
ants
and
loan
s up
to 1
0% o
f tot
al
elig
ible
cos
ts.
Loan
s: 5
yea
rs,
inte
rest
-free
, $1
0 m
illio
n m
ax.,
and
up to
30%
of
tota
l elig
ible
cos
ts.
Gran
ts u
p to
15%
of
tota
l elig
ible
cos
ts.
Gran
ts:
$1.5
mill
ion
max
.Lo
ans:
$5
mill
ion
max
.
Gran
ts:
$1.5
mill
ion
max
.Lo
ans:
$5
mill
ion
max
.
Gran
ts a
nd/o
r loa
ns
appr
oved
rang
ed
from
$30
0,00
0 to
$2
20 m
illio
n.
Gran
ts: u
p to
20%
of
elig
ible
cos
ts (u
p to
50%
for S
trate
gic
Partn
ersh
ips
Stre
am).
Gran
ts a
nd lo
ans:
up
to 4
0% o
f elig
ible
co
sts.
Note
: Loa
ns d
o no
t ap
ply
to S
trate
gic
Partn
ersh
ips
Stre
am.

169Economic Development and Employment Programs
Chap
ter 3
• VF
M S
ectio
n 3.
04
Stra
tegi
c Job
s and
Onta
rioAd
vanc
edSo
uthw
este
rnIn
vest
men
t Fun
dAu
tom
otive
Man
ufac
turin
gEa
ster
n On
tario
Onta
rio(In
clud
ing
Inve
stm
ent
Inve
stm
ent
Next
Gen
erat
ion
Deve
lopm
ent
Deve
lopm
ent
Stra
tegi
cJo
bs a
ndSt
rate
gy
Stra
tegy
of
Jobs
Fund
Fu
nd
Fund
In
vest
men
t Fun
d)Pr
ospe
rity F
und
Tota
l#
of c
ontra
cted
pr
ojec
ts10
4439
146
9540
—5
374
Tota
l gra
nts
cont
ract
ed$3
00 m
illio
n---
$741
mill
ion
$71
mill
ion
$70
mill
ion
$689
mill
ion
—2,
5$1
.871
bill
ion
Tota
l loa
ns
cont
ract
ed$1
76 m
illio
n$2
23 m
illio
n---
---$4
mill
ion
$86
mill
ion
—5
$489
mill
ion
Tota
l Gra
nts
and
Loan
s Co
ntra
cted
6$4
76 m
illio
n$2
23 m
illio
n$7
41 m
illio
n$7
1 m
illio
n$7
4 m
illio
n$7
75 m
illio
n—
$2.3
6 bi
llion
Tota
l dis
burs
ed
to d
ate
$465
mill
ion
$211
mill
ion
$427
mill
ion
$49
mill
ion
$14
mill
ion
$281
mill
ion
—5
$1.4
47 b
illio
n
Tota
l con
tract
ed
reci
pien
t in
vest
men
ts7
$5.7
71 b
illio
n$1
.396
bill
ion
$4.4
97 b
illio
n$6
90 m
illio
n$7
97 m
illio
n$1
1.45
2 bi
llion
—5
$24.
603
billi
on
# of
jobs
co
ntra
cted
46,3
41
5,39
7 8,
586
17,2
21
21,9
92
26,2
85
—
125,
822
(con
sist
s of
20,
896
crea
ted
and
104,
926
reta
ined
)
# of
jobs
-to-
date
8
22,2
285,
154
9,38
0 12
,068
3,
724
19,0
33
—
71,5
87
(con
sist
s of
12,
298
crea
ted
and
59,2
89 re
tain
ed)
Tota
l act
ual i
n-ve
stm
ents
mad
e by
reci
pien
ts to
da
te
$5.3
58 b
illio
n$1
.309
bill
ion
$2.7
83 b
illio
n $5
03 m
illio
n $1
44 m
illio
n $3
.327
bill
ion
—$1
3.42
4 bi
llion
1. T
otal
fund
ing
orig
inal
ly an
noun
ced
for t
he N
ext G
ener
atio
n of
Jobs
Fun
d wa
s $1
.15
billi
on. O
f tha
t, $8
50 m
illio
n is
adm
inis
tere
d un
der t
he M
inis
try’s
Jobs
and
Inve
stm
ent,
and
Biop
harm
aceu
tical
Inve
stm
ent p
rogr
ams.
The
re
mai
ning
$30
0 m
illio
n is
adm
inis
tere
d by
the
Min
istry
of R
esea
rch
and
Inno
vatio
n.
2. T
he M
inis
try tr
ansf
erre
d ap
prox
imat
ely
$780
mill
ion
of c
omm
itted
pro
ject
fund
ing
from
oth
er m
inis
try p
rogr
ams,
incl
udin
g th
e Ne
xt G
ener
atio
n of
Jobs
Fun
d, in
to th
e ne
w Jo
bs a
nd P
rosp
erity
Fun
d. T
his
char
t kee
ps th
ese
expe
nditu
res
in th
eir o
rigin
al p
rogr
ams.
3. T
otal
fund
ing
orig
inal
ly a
nnou
nced
for t
he Jo
bs a
nd P
rosp
erity
Fun
d wa
s $2
.7 b
illio
n. O
f tha
t, $2
bill
ion
will
be a
dmin
iste
red
by th
e M
inis
try u
nder
the
New
Econ
omy
Stre
am. T
he re
mai
ning
$70
0 m
illio
n wi
ll be
adm
inis
tere
d by
oth
er m
inis
tries
, inc
ludi
ng R
esea
rch
and
Inno
vatio
n, a
nd A
gric
ultu
re, F
ood
and
Rura
l Affa
irs.
4. B
usin
esse
s ca
n ap
ply
for a
pplic
atio
n-ba
sed
fund
s if
they
mee
t the
fund
’s e
ligib
ility
crit
eria
. Inv
itatio
n-ba
sed
fund
s ar
e no
t ope
n to
the
publ
ic; i
nste
ad, t
he M
inis
try s
elec
ts w
hich
bus
ines
ses
to in
vite
to s
ubm
it an
app
licat
ion.
5. A
s of
July
201
5, th
e M
inis
try w
as s
till r
evie
wing
fund
ing
appl
icat
ions
for t
he n
ew Jo
bs a
nd P
rosp
erity
Fun
d, a
nd th
ere
were
no
com
plet
ed c
ontra
cts
unde
r thi
s pr
ogra
m.
6. C
ontra
cted
am
ount
s ar
e di
sbur
sed
over
the
life
of th
e co
ntra
ct if
job
and
inve
stm
ent t
arge
ts a
re m
et.
7. T
otal
reci
pien
t inv
estm
ent i
nclu
des
all a
mou
nts
with
the
reci
pien
t, in
clud
ing
min
istry
gra
nts
and
loan
s, fo
r app
rove
d pr
ojec
ts.
8. J
obs
data
as
of M
arch
31,
201
5.

2015 Annual Report of the Office of the Auditor General of Ontario170
Chap
ter 3
• VF
M S
ectio
n 3.
04
one to a university for construction of a new research facility, and others to the Ontario Cham-ber of Commerce for seminars to help businesses increase exports. In 2014/15, total Sector Support grants were $31 million.
The Ontario government also provides economic development and employment support funding through other ministries, which then fund busi-nesses as well as other organizations such as muni-cipalities, universities, and non-profit agencies. Appendix 1 describes all economic-support fund-ing across the Ontario government, totalling almost $2 billion, in the fiscal year ended March 31, 2015.
The Ministry of Finance also provided financial assistance to businesses through corporate income-tax credits. In 2014/15, there were 17 types of cor-porate income-tax credits available to businesses, costing the province $2.877 billion as follows:
• Forgone revenue of $1.962 billion related to the general deduction for small busi-nesses—$1.595 billion; research and develop-ment-$170 million; manufacturing and processing—$175 million; and other general deductions- $22 million; and
• Refunded corporate income tax credits of $915 million relating to film and media expenditures—$422 million; research and development—$193 million; and apprentice-ship and training—$300 million.
1.1.2 Approval Process for Projects
The Ministry employs “client leads,” who have expertise in various areas of industry, to develop relationships with businesses in an effort to encour-age investments in the Ontario economy. Often, they also help businesses apply for project funding. Other ministry employees, called case managers, are responsible for project assessment, contracting, and monitoring of projects.
When a business submits a project proposal, the Ministry conducts a review to ensure it is eligible for funding. This review includes an evaluation by an external third party or an internal ministry expert.
This evaluation is to include a financial and tech-nical assessment of the viability of the project and the applicant, and an analysis of such risk factors as the experience of management, likely markets for the project’s deliverables, and any other potential obstacles to the success of the proposed project.
The Ministry is to use third-party assessments for projects of greater scope or higher dollar amounts. Funds implemented after 2010 assess proposals using a process that includes a return-on-investment model based on the net present value of the expenditures and revenues to arrive at the net finan-cial benefit and the payback period of the project.
Decisions on grants and loans are made in a ser-ies of meetings by committees composed of senior management staff from the various ministries. While approval requirements differ between pro-grams, a committee of deputy ministers generally reviews each proposal. Final approval is up to the Minister of Economic Development, Employment and Infrastructure and, when applicable, other min-isters. Treasury Board approval is required for larger projects, usually that do not meet fund criteria or for which ministry funding exceeds $25 million.
Recipients Sign Performance Contracts with Ministry
Grants and loans are governed by individually nego-tiated contracts between the Ministry and recipients that require recipients to meet certain defined deliverables. These include a requirement that the recipient invest a minimum amount of money in the project, and meet targets for creating and/or retain-ing a set number of jobs. Most projects take three to five years to complete, and funding can cover capital, labour, and research and development costs.
During the contracting stage, ministry lawyers and the recipient draft a final agreement, which typically spells out the performance targets described above. These targets are enforceable by provisions in the contract that require the recipient to reimburse some or all of the grant or loan, or pay interest on the loan, if the targets are not met.

171Economic Development and Employment Programs
Chap
ter 3
• VF
M S
ectio
n 3.
04
1.1.3 Project Monitoring and Reporting Process
Throughout the life of a project, the recipient is generally required to report back twice yearly to the Ministry on project milestones and on progress of investment and job-creation/retention goals.
Projects are rated as low-, medium- or high-risk, and these ratings determine how much monitoring the Ministry does. For example, ministry guidelines require a minimum of one site visit every 12 months for high-risk projects, one visit every 24 months for medium-risk projects, and one every 36 months for low-risk projects.
Rather than pay out the full amount of the grant or loan at the start of a project, the Ministry usually makes disbursements in instalments throughout the life of the project. Recipients must submit invoices to support eligible costs before the Ministry makes a disbursement under a contract. However, some projects may receive advance pay-ments on contract signing.
The Ministry uses its electronic Client Relations Management system (eCRM) to track direct-business-support projects. The system captures recipient and project details, such as main contacts, address, financial information about the recipient, project details, contract details such as grant and/or loan amount, and disbursement details. Various reports can be run on eCRM by case managers, including which monitoring activities are overdue.
At the end of a project, but before final pay-ment, recipients are required to provide an external auditor’s certification that investment targets were met. Projects contracted after 2012 also require an external auditor’s certification that job targets were met. Prior to 2012, the Ministry did not verify reports about jobs created and/or retained.
1.1.4 Ministry’s Internal Performance Reporting
The Ministry’s internal key performance measures and results (as per the Ministry’s eCRM system):
• Actual investments achieved: The amount of its funds that a recipient has invested in a project (also referred to as total investment leveraged). Investment targets are set as terms within the contract. Between 2004 and May 2015, recipients invested $13.42 billion in these projects, including the grants and loans of $1.45 billion that the Ministry has paid so far to these projects.
• Actual jobs created and retained: The number of jobs a recipient has created and/or retained as a result of a project. Job targets are set as terms within the contract. Between 2004 and March 31, 2015, there were 12,298 jobs created and 59,289 jobs retained, for a total of 71,587 jobs. The contracted number of jobs over the full life of the projects is expected to be 125,822, consisting of 20,896 created and 104,926 retained.
• Total contracted investment leveraged: The committed investment amount over the life of the project by a recipient for every $1 in Min-istry funding. Between 2004 and March 31, 2015, the Ministry reports that for every dollar of funding, recipients invested another $6.08 to $13.64, depending on the fund.
• Total cost per job per year: Calculated based on total grant funding contracted by the Ministry and total jobs-created targets. (If the funding is in the form of a loan, cost per job is calculated based on the Ministry’s cost of bor-rowing.) Between 2004 and March 31, 2015, the cost per job per year to the Ministry ranged from $718 to $16,981, depending on the fund.
Each year, the Ministry reports publicly on most new projects approved under each fund, indicating the recipient company, dollar amount of funding approved, committed total investment to be made by the recipient, and committed number of jobs to be created and/or retained.

2015 Annual Report of the Office of the Auditor General of Ontario172
Chap
ter 3
• VF
M S
ectio
n 3.
04
New Jobs and Prosperity FundIn January 2015, the government announced it would fold many existing programs, except the eastern Ontario and southwestern Ontario development funds, into a new $2.7-billion Jobs and Prosperity Fund, with $2 billion of these funds administered by the Ministry and $700 million by other ministries. The Jobs and Prosperity Fund has three streams:
• The New Economy Stream provides funding for private-sector organizations to build innovation and capacity, improve productiv-ity, performance and competitiveness, and increase access to global markets. This stream is available for projects with at least $10 mil-lion in eligible costs, and is aimed at such key sectors as manufacturing, life sciences, and information and communications technology. Some funding from this stream is delivered or accessed by other ministries, including Research and Innovation, Aboriginal Affairs, and Agriculture, Food and Rural Affairs.
• The Food and Beverage Growth Fund provides funding for strategic investments to create sustainable jobs, enhance innovation, pro-ductivity and market access, and strengthen supply chains in the food, beverage and bio-product processing sectors. The Fund is available for projects across the province
with more than $5 million in eligible costs, and is jointly administered by the Ministry of Economic Development, Employment and Infrastructure, and the Ministry of Agricul-ture, Food and Rural Affairs.
• The Strategic Partnerships Stream provides funding for companies partnering to develop enabling technologies for Ontario’s targeted industry sectors. This stream is available for partnerships with at least $10 million in eli-gible costs, and focuses on technologies with the potential to transform multiple industries across Ontario.
At the end of our field work in July 2015, all funding approved through the Jobs and Prosperity Fund was based on the requirements of the old funds that were folded into it. The Ministry had not yet finalized any contracts under the new Fund’s own policies.
1.2 Recent Performance of Ontario Economy
As shown in Figure 2, many different economic factors can influence Ontario’s Gross Domestic Product (GDP), which represents the total value of all finished goods and services produced in Ontario for the year. The economic downturn in 2008 affected many Ontario industries, particularly the
Figure 2: Examples of Impact on Ontario GDP Growth of Changes in Key External Factors (based on 2014 GDP of $721 billion)Prepared by Office of the Auditor General of Ontario
Estimated ImpactKey External Factors Example of Changes in External Factor ($ billions)Canadian dollar Depreciates by five cents U.S. +2.9
Crude oil prices Decrease by $10 U.S. per barrel +1.4
U.S. real GDP growth Increases by one percentage point +2.9
Canadian interest rates Decreases by one percentage point +2.2
Net Ontario exports (2014: total exports of $177 billion, less total imports of $295 billion, for a trade deficit of $118 billion )
Increase by $100 million +0.1
Infrastructure spending in Ontario* Increases by $100 million +0.1
* Infrastructure includes machinery, equipment and structures such as roads. Assumes that all spending goes to Ontario-based companies. Impact on GDP will be less if infrastructure spending goes to companies based elsewhere.

173Economic Development and Employment Programs
Chap
ter 3
• VF
M S
ectio
n 3.
04
auto, manufacturing and resource sectors, although economic indicators since then suggest there has been some recovery.
As indicated in Figure 4, according to Statistics Canada’s monthly labour force survey, for the 10-year period from June 2005 to June 2015, Ontario created 560,400 net new jobs, which is also the approximate number of jobs recovered since the recessionary low in June 2009. As of June 2015, there were 6.946 million jobs in Ontario.
However, over the last several years, Ontario’s average unemployment rate of about 7% has been slightly higher than the Canadian average, and sig-nificantly higher than that of the western provinces, as Figure 3 indicates. It also shows that Ontario’s unemployment rate increased almost 11%, from 6.6% for 2005 to 7.3% for 2014, (2014 is the latest annual figure from Statistics Canada). As Figure 4 also shows, one of the main reasons the unemploy-ment rate has not improved during a period where there are more net new jobs in Ontario is that the labour force grew at about the same rate as the number of new jobs (through, for example, immi-gration). Also, business investments in machinery
* 2003 was used as the initial year because the first direct business support program administered by the Ministry commenced in 2004. Unemployment rate is based on the average for the calendar year, so 2015 was not yet available.
Figure 3: Average Unemployment Rates for Canada, Ontario and selected other provinces, 2003–2014*Source of data: Statistics Canada
0%
1%
2%
3%
4%
5%
6%
7%
8%
9%
10%
2003 2004 2005 2006 2007 2008 2009 2010 2011 2012 2013 2014
CanadaQCONBCMBABSK
Figure 4: Number of People in Ontario Labour Force, and Number Employed, as of June 2005–2015 (000)Source of data: Statistics Canada
5,800
6,000
6,200
6,400
6,600
6,800
7,000
7,200
7,400
7,600
2005
2006
2007
2008
2009
2010
2011
2012
2013
2014
2015
Employment
Labour Force

2015 Annual Report of the Office of the Auditor General of Ontario174
Chap
ter 3
• VF
M S
ectio
n 3.
04
and equipment have increased 14% since the eco-nomic downturn.
As Figure 5 shows, Ontario’s GDP per capita has risen at a similar pace as that of other provinces over the last four years. However, while Ontario has been consistently higher than Manitoba and British Col-umbia, it has been significantly lower than Alberta and Saskatchewan. Economic growth in Ontario has been negatively impacted by the slow U.S. econ-omy, rising oil prices, higher electricity rates, and a higher-than-anticipated Canadian dollar.
While statistics for 2015 were not yet available, Ontario’s economy will likely benefit further from major drops in the price of oil, the lower Canadian dollar, and continuing low interest rates, all of which favour Ontario’s manufacturing sector.
2.0 Audit Objective and Scope
Our audit objective was to assess whether the Ministry of Economic Development, Employment
and Infrastructure (Ministry) had effective systems and procedures in place to ensure funding was used efficiently and effectively towards the development, growth and efficiency of industry and trade in goods and services, as well as the growth of pro-ductive employment, in accordance with legislative requirements, directives, and program policies and guidelines; and that funding objectives are meas-ured and reported on. Senior management at the Ministry agreed to our audit objective and criteria.
Our audit work was conducted primarily at the Ministry’s head office in Toronto between Decem-ber 2014 and June 2015, and focused on economic development and employment programs offered by the Ministry. However, we also researched economic development and employment programs administered by other ministries and agencies, and we spoke with representatives from ministry and agency programs such as the Ministry of Training Colleges and Universities, the Northern Ontario Heritage Fund Corporation, and the Ministry of Agriculture, Food and Rural Affairs, to understand how their programs are administered. We also met
Figure 5: Gross Domestic Product (GDP) per capita of Canada and its provinces, 2010–2013Sources of data: Statistics Canada
2010201120122013
$0
$10,000
$20,000
$30,000
$40,000
$50,000
$60,000
$70,000
$80,000
$90,000
Canada NL PEI NS NB QC ON MB SK AB BC

175Economic Development and Employment Programs
Chap
ter 3
• VF
M S
ectio
n 3.
04
with the Ministry of Finance to discuss refundable tax-credit incentives for business as another means of economic development and employment support provided by the province.
We reviewed or examined in more detail 62 out of the 374 projects contracted, accounting for 45% of the $2.36 billion total committed funds. We sampled from six of seven funds; the Jobs and Pros-perity Fund was excluded since it was just starting up during our field work, and no projects had been approved under the new Fund’s policies. Grants and loans for the projects we sampled ranged from $500,000 to $264 million, and were provided between 2004 and 2014. Our sample included pro-jects that had been completed, and others that were still active.
We interviewed ministry staff responsible for assessing project proposals and monitoring approved projects, and client leads responsible for forming and developing relationships with businesses to achieve investments in the Ontario economy. We also interviewed former senior ministry employees involved in approving projects, representatives from local chambers of commerce, the Canadian Manufacturers & Exporters (a trade and industry association) the Ontario Centres of Excellence (a government-funded organization that partners with academic institutions and businesses to create jobs and innovation in industry), and the Conference Board of Canada (an independent not-for-profit organization that conducts research on the economy).
In addition, we interviewed several businesses that received grants and loans in the last five years to get their perspective on the effectiveness of these funds. We also engaged an independent expert on economic development, and conducted research on similar programs offered by other jurisdictions in Canada and the U.S.
3.0 Summary
The Ministry of Economic Development, Employ-ment and Infrastructure (Ministry) has not attempted to measure whether the $1.4 billion it provided to Ontario businesses since 2004 actually strengthened the economy or made recipients more competitive.
In addition, the Ministry’s new Strategic Invest-ment Framework (Framework) does not include a plan for how to measure outcomes from future economic development and employment supports, including for its new Jobs and Prosperity Fund. For example, the Ministry’s only measures of perform-ance are jobs created and a recipient’s leveraged investment; it has not set a goal for minimum GDP growth or unemployment rate reductions. Other provinces have set such goals to guide their economic-development efforts. We expected the Ministry of Economic Development, Employment and Infrastructure (Ministry) to have had authority to oversee the funding of all ministries intended for economic development and employment purposes, but it only has authority for the programs it man-ages directly.
Even though Ontario, like most other provinces, has shown improved economic performance in each of the last four years, the need for the Ministry to ensure its programs benefit the economy is still important. Many expert reports question whether such programs or funding actually achieve any economic benefits (see Appendix 2 for a list of key expert reports we reviewed).
In addition, while the Ministry recognizes the economic benefits of promoting key regions and establishing industry “clusters”—geographic concen-trations of interconnected businesses, suppliers, and associated institutions in a particular field—it has not developed a strategy for its involvement for each region and cluster that identifies key strengths and barriers or weaknesses that it can help to address.
2015 Annual Report of the Office of the Auditor General of Ontario176
Chap
ter 3
• VF
M S
ectio
n 3.
04
The Ministry could, for example, help identify for each industry the educational institutions that would best support that industry. It could also iden-tify the training and apprenticeship skills needed; the local availability of skilled workers, suppliers of services and materials, and transportation networks; and the potential for local and foreign markets for the products or services.
Information from the above work could help it establish an action plan on how its support programs can be used to address barriers and weak-nesses; how to promote industry clusters for max-imum benefit; establish targets and timetables for expected growth; and identify the size of businesses to which it will provide grants or loans. As it does not conduct such analyses, the Ministry cannot fully identify the types of economic development and employment support projects that may most effect-ively strengthen the province’s clusters and regions.
Expert reports over the last several years have also highlighted the importance of small- and medium-sized businesses, which account for about one-third of Ontario’s GDP. While 40% of the number of projects funded by the Ministry related to existing small- and medium-sized businesses, the dollar value of that support amounted to less than 4% of its total funding. No support went to new start-ups, and projects were limited to certain areas of the province. The Ministry has neither assessed how many small- and medium-sized businesses lack access to supports, nor made it clear why its fund-ing is targeted primarily to large businesses.
Despite the Ministry’s mandate to support a strong, innovative and competitive economy that provides jobs and prosperity for all Ontarians, nine other ministries independently also provide similar funding to businesses. The Ministry does not have the authority to co-ordinate with other ministries, which deliver $1.8 billion of additional economic development and employment support funding. Although the new Framework outlined an “all-of-government” approach, each of the other nine ministries still continues to deliver support funding without the overall co-ordination that could ensure
the best use of funds. For example, the Ministry of Finance provides over $1.3 billion (excluding the small business deduction of $1.6 billion) of corporate income tax-credits specifically targeted to economic development and employment support to businesses each year, but the Ministry of Economic Development, Employment and Infrastructure rarely considers these when determining whether to provide grants and loans. We found that the Min-istry generally performed well with respect to the approval process in administering and overseeing its own economic-development and employment-support programs.
Recognizing Ontario’s unco-ordinated approach, expert reports have recommended consolidation of economic development- and employment-related funding across ministries. Consolidation may achieve efficiencies when administrative functions are combined, and could provide a more informed basis for decision-making by government on how to target funding to certain sectors or areas of the province. Without such information, the Ministry cannot assess long-term government funding pat-terns and the extent to which funding has resulted in benefits to the economy. We noted it cost about $80 million in the fiscal year ending March 31, 2015 to provide administrative functions for programs offered by other ministries that provide economic development support.
We also noted other systemic issues regard-ing the way the Ministry administered its own economic development and employment support funding. Among our findings:
• Little transparency in how funding is awarded: Since 2010, about 80% of total approved funding was made through non-publicly advertised processes in which only selected businesses were invited to apply. The Ministry determined internally which businesses were to be invited, instead of mak-ing the funding more broadly available. The Ministry could not provide us with the criteria used to identify the businesses it invited to apply for funding; neither could it provide us

177Economic Development and Employment Programs
Chap
ter 3
• VF
M S
ectio
n 3.
04
with a list of the companies it invited to apply, or a list of those whose applications were unsuccessful.
• Funding often awarded without needs assessment: The Ministry almost never assesses whether businesses need public fund-ing in order to achieve the proposed project. Furthermore, some projects were approved for funding even though there was evidence they would have proceeded even without government help.
• Ministry gets no share of project successes: None of the Ministry’s contracts with recipi-ents give the government a share of any suc-cesses. For example, in two cases—one where the Ministry committed to invest 35% in a project with a total cost of $741 million, and another where it committed 50% toward total project costs of $5.4 million—there was no indication the Ministry considered obtaining an equity stake in exchange for funding.
• Key economic goals ignored: Even though expert reports stress that economic develop-ment support funding should be focused on increasing exports, developing innovations or increasing productivity, no contracts with recipients formally require improvements in any of these areas (they only require businesses to invest in projects and to either retain or create an agreed upon number of jobs during the project). Also, the Ministry has no performance measures to indicate whether funded projects have achieved such lasting economic benefits beyond the project end date.
• No post-contract monitoring of job-creation results: One of the only measures the Ministry requires recipients to report on is jobs created and/or retained, with the Ministry reducing funding when these are not achieved. However, the Ministry does not monitor beyond the contract term, which is usually five years, and so has no informa-tion on whether jobs created or retained are long-lasting.
• Project results not made public: Although the Ministry usually, but not always, makes its initial funding decisions public, it does not publicly report overall or individual results at the expiry of projects. For example, neither the total number of jobs retained or created, nor the total funding provided to companies in exchange for investments, is made public. Furthermore, for about 60 projects with over $70 million of committed funding, no informa-tion was released about the amounts funded, or which companies received the funding.
• Some public information misleading: Over the last 10 years and as recently as January 2015, the government publicly announced almost $1 billion more of economic-develop-ment and employment-support funding projects by re-announcing the same available funding under different fund programs.
This report contains nine recommendations, consisting of 17 actions, to address the findings noted during this audit.
OVERALL MINISTRY RESPONSE
The Ministry thanks the Auditor General for her report and recommendations. We are com-mitted to addressing these recommendations as part of our ongoing work to ensure quality programs and to improve economic outcomes for the Province.
The Ministry is in the process of change as a result of the government introducing the new Jobs and Prosperity Fund and Strategic Investment Framework. These programs will significantly transform the way this Ministry and others deliver economic development and employment programs. These changes will address the recommendations you have brought forward.

2015 Annual Report of the Office of the Auditor General of Ontario178
Chap
ter 3
• VF
M S
ectio
n 3.
04
4.0 Detailed Audit Observations
4.1 Planning and Co-ordination of Economic Development Support Funding 4.1.1 Ministry Needs to Continue to Develop a Comprehensive Strategy
The Ministry of Economic Development, Employ-ment and Infrastructure (Ministry) has developed no plan for the effective use of economic-develop-ment and employment-support funding. While the Ministry conducts research on economic sectors and regions in Ontario, it has not used this research to develop a provincial- or regional-sector strategy to allow it to more effectively provide support to businesses, strategically target key business sectors, and set targets for improvements. A comprehensive and effective strategy for economic development and employment supports would help address Ontario’s lagging competitiveness compared to other Canadian and U.S. jurisdictions in areas such as private-sector job creation and high electricity rates. During our audit, the Ministry was determin-ing how it was going to implement its part of a new Strategic Investment Framework introduced by the government in January 2015, meant to co-ordinate all ministries’ approach to business supports focused on promoting productivity growth, stimu-lating innovation, and promoting exports.
4.1.2 Room to Improve Ontario’s Competitiveness in North America
While there are many reasons that foreign busi-nesses from North America and across the globe invest in Ontario, attracting investment is very competitive with other jurisdictions. Ontario has several competitive advantages relative to other jurisdictions, such as a highly educated workforce and a good standard of living. Nevertheless, there
is a need to continuously improve Ontario’s com-petitiveness to ensure businesses invest in Ontario and that existing Ontario business can effectively compete globally.
Several organizations, including the Fraser Institute and the Task Force on Competitiveness, Productivity and Economic Progress, have issued reports on Ontario’s economic competitiveness and prosperity (for a list of these reports, see Appendix 2). These studies have concluded that the Ontario economy is not as competitive or as prosperous as those of competing jurisdictions in Canada and the U.S.
In an April 2014 study, the Fraser Institute examined Ontario’s economic well-being, because there is a high correlation between the province’s performance and Canada’s as a whole. It states that since 2000, Ontario has recorded the third-lowest rate of private-sector job creation in the country, ahead only of Nova Scotia and New Brunswick, and its share of total Canadian exports has steadily declined. Further, Ontario has performed poorly in such areas as GDP growth, employment gains, and unemployment reduction. As well, on a per-capita basis, Ontario reported the second-highest net debt level of all the provinces in the fiscal year ending March 31, 2013. The report concludes that Ontario’s poor performance and growth issues have serious implications for the overall Canadian economy due to the highly integrated nature of the provinces and the fact that Ontario represents a sig-nificant percentage of Canada’s economic activity.
In two reports, entitled Course Correction (2013) and Open for Business (2015), the Institute for Com-petiveness and Prosperity also criticized Ontario’s economic performance as compared to more than 14 peer jurisdictions in North America. In 2013, Ontario had the third-lowest GDP per capita of this group, at $11,000 below the average, and this figure has remained stagnant over the past decade. Ontario has lower productivity than most of its peers, and has had low investment in manufacturing, research and development, and information technology and communications. With higher unit labour costs

179Economic Development and Employment Programs
Chap
ter 3
• VF
M S
ectio
n 3.
04
and lower infrastructure spending than competing regions, Ontario was considered a less desirable jurisdiction in which to locate a business. The reports also criticize Ontario’s tiered corporate tax structure; without a flat corporate tax, Ontario is at a disadvan-tage compared to competing jurisdictions.
In addition, industrial electricity rates in Ontario are among the highest in North America, which compromises Ontario’s ability to attract investment. The manufacturing industry, in particular, requires large amounts of electricity for their operations and large rate increases over the past decade have made Ontario less competitive. Figure 6 illustrates average electricity rates for large power customers (at least 5,000 kW) across major cities in North America. Ottawa and Toronto have the second- and fourth-highest rates, respectively, of the 19 cities in the rankings. Rates for mid-sized industrial consumers are also high, with Ottawa and Toronto ranking fourth- and seventh-highest among the 19 cities compared.
These reports suggest the Ministry has a crucial role to play in support of Ontario’s economic pros-perity and its ability to attract investment through its economic development and employment sup-port funds. In order for it to meet its mandate, the
Ministry would need to actively co-ordinate with other ministries and agencies delivering similar support programs.
4.1.3 Outcome Targets Needed for Economic Development and Employment
The 2012 Report of the Commission on the Reform of Ontario’s Public Services, commonly known as the Drummond Report, recommended that the govern-ment publish an “economic vision” for Ontario. This vision was to identify which sectors of the economy have grown in recent years, and which have declined, in order to identify the sectors to be targeted for investment.
Until late 2014, the Ministry operated without a comprehensive plan for its business support programs. In November 2014, the government approved a Strategic Investment Framework (Framework) and announced it in January 2015 as the Ministry’s new strategy. The Framework was to take an “all-of-government” broad strategic approach by aligning business supports from all ministries. It also included guiding principles for future economic-development and employment-program investments focused on promoting
Figure 6: Average Electricity Price for Large Customers (power demand of 5,000 kW) Among Major North American Cities, as of April 2014 (¢/kWh)*Sources of data: Hydro-Quebec
* Hydro-Quebec calculates these rates to include supply, transmission and distribution costs, and taxes.
0
5
10
15
20
25
Win
nipe
g, M
B
Mon
treal
, QC
Seat
tle, W
A
Vanc
ouve
r, BC
Calg
ary,
AB
Mon
cton
, NB
Det
roit,
MI
Hous
ton,
TX
Mia
mi,
FL
Regi
na, S
K
Edm
onto
n, A
B
Chic
ago,
IL
Nas
hvill
e, T
N
Halif
ax, N
S
San
Fran
cisc
o, C
A
Toro
nto,
ON
Bost
on, M
A
Otta
wa,
ON
New
Yor
k, N
Y

2015 Annual Report of the Office of the Auditor General of Ontario180
Chap
ter 3
• VF
M S
ectio
n 3.
04
productivity growth, stimulating innovation, and promoting exports.
The Framework lists the following “sector/clus-ter priorities” for several ministries:
• Ministry of Economic Development, Employ-ment and Infrastructure: auto, aerospace, information and communications technology, clean technology, financial services, and chemistry;
• Ministry of Research and Innovation: life sciences;
• Ministry of Agriculture, Food and Rural Affairs: agri-food;
• Ministry of Northern Development and Mines: mining;
• Ministry of Natural Resources and Forestry: forestry; and
• Ministry of Tourism, Culture and Sports: entertainment and creative.
While the Framework is a positive first step in establishing a co-ordinated plan for economic development and employment programs, we noted that the Ministry did not plan to establish a strategy for each sector/cluster priority in the Framework. Absent were strategic plans for the Ministry to:
• identify regions where key strengths and weaknesses exist for products, services, resources, transportation, and labour skills and workforces, to inform both the establish-ment of industry clusters and the creation of a plan to address weaknesses and promote strengths;
• assess how its support programs can be used to promote industry clusters for maximum benefit to local and provincial economies;
• establish targets and timetables of expected growth, such as improvements to businesses’ sales, employment rates, and wages;
• mitigate Ontario’s high electricity rates for industrial users; and
• identify the size of businesses to which it will provide direct support, in the form of grants or loans. For instance, the programs admin-istered by the Ministry are aimed primarily
at larger corporations that typically already have the capacity to fund large projects. The Ministry does not currently target small- and medium-sized businesses in high-growth industries, or newer companies with high-growth potential.
4.1.4 Other Provinces Set Targets
Neither the Ministry nor the Framework established for it have set any targets, either for the economy, the Ministry as a whole, or even for individual funds administered by the Ministry. However, we noted other provinces have established such measurable targets for economic and employment growth.
In 2011, British Columbia released its economic strategy to create jobs and investment in the prov-ince in a document entitled Canada Starts Here – The BC Jobs Plan. The strategy focused on enabling job creation by working with employers and com-munities, improving infrastructure, and expanding markets for its products and services, especially in Asia. Specific goals included:
• establishing a BC Jobs and Investment Board to foster economic development and hold government accountable for delivering new investments to the province and facilitating new economic opportunity;
• investing $5 million in border infrastructure and information systems; and
• placing BC in the top two spots for GDP and new job growths in Canada by 2015.
In 2014, British Columbia released its three-year progress report on the BC Jobs Plan and reported on their achievements to date, including:
• creation of more than 50,000 jobs, giving BC one of the fourth-lowest unemployment rates of any province;
• a GDP increase of $7.2 billion, or nearly 4%; and
• an increase in exports of more than 32% since 2009.
More recently, other provinces have also created similar plans.
181Economic Development and Employment Programs
Chap
ter 3
• VF
M S
ectio
n 3.
04
In early 2013, for example, Saskatchewan released the Saskatchewan Plan for Growth: Vision 2020 and Beyond, which contains several goals related to economic growth. These include 60,000 more jobs and a doubling of exports.
In 2014, Alberta released Building on Alberta’s Strengths: Alberta’s Economic Development Frame-work. Goals and targets include:
• a compound annual growth rate of 1.3% between 2012 and 2019 in real GDP per hour worked in the business sector;
• an increase in the value of Alberta mer-chandise exports to non-U.S. markets from $11.9 billion in 2013 to $21 billion in 2019;
• maintaining Alberta’s annual average unemployment rate at between 4.0% and 5.0%;
• increasing the proportion of high-growth firms (those with more than 20% annual growth over three years) from 5.8% of the total in 2011 to 9% in 2019; and
• growing employment in knowledge-intensive companies at a compounded annual growth rate of 2.0% between 2012 and 2019.
Ontario has no similar plan or publicly stated targets for job creation, wages or exports growth.
4.1.5 Ministry Support Not Yet Focused on Clusters, Strategic Partnerships or Small- and Mid-sized Businesses
Many expert reports over the last five years have recognized the importance of supporting and promoting industry clusters, which are geographic concentrations of interconnected businesses, sup-pliers, and associated institutions in a particular field, such as the automotive cluster in southern Ontario and the information technology sectors in the Kitchener-Waterloo, Ottawa, and greater Toronto areas.
However, the Ministry has not identified those businesses emerging as part of, or already func-tioning within, such clusters. As a result, it does not have an effective strategy for funding new projects
to achieve stronger clusters. Also, the Framework does not address the required ties with universities, local chambers of commerce, and other levels of government to ensure the broad development of regional industry clusters across the province.
Representatives from local chambers of com-merce told us the Ministry could help improve regional economies by inventorying these clus-ters and facilitating their development. While economic-development and employment-support funding in some cases is provided to industry clus-ters, the Ministry does not track how much of this funding has been used to strengthen them, and sets no targets to assess whether the funding is effective.
More recently, we noted the Ministry has initi-ated processes to focus on industry clusters. Since the Partnerships for Jobs and Growth Act, 2014 came into force on April 1, 2015, the Ministry has been developing the operational policy to support cluster development in the province. The Ministry has also developed an assessment framework to identify key Ontario cluster opportunities for the Minister’s consideration.
The Framework does not target small- and medium-sized businesses (those having fewer than 500 employees), particularly those in potentially high-growth industry sectors, or indicate how much funding they should get. Moreover, in spite of their potential, small- and medium-sized businesses are eligible to apply only to the two regional funds.
Our review of the recipients of the regional funds determined that while about 40% of the 374 funded projects were at small- to medium-sized businesses, such businesses have received only $90 million, or less than 4% of the Ministry’s total direct business support program funding between the Funds’ inception and May 31, 2015.
Various expert reports have noted the poten-tial of such businesses to strengthen the Ontario economy, with overall contributions by small- and medium-sized businesses accounting for about one-third of the province’s annual GDP. For example, the 2014 Ontario Made report by the Mowat Centre notes that smaller, high-growth entrepreneurial

2015 Annual Report of the Office of the Auditor General of Ontario182
Chap
ter 3
• VF
M S
ectio
n 3.
04
or the Ministry of Citizenship, Immigration and International Trade, which oversees the impact of immigration. This undermines the Framework’s relevance and usefulness, but the Ministry had no plan to address this.
The Ministry of Training, Colleges and Universi-ties is not included in the Framework, even though education-related programs are relevant to the Framework’s success. Education was a primary focus of the Premier’s Committee that established the Framework, and strategic partnerships with uni-versities were identified as one of the key measures to ensure the establishment of industry clusters.
However, the Framework does not specify how it will integrate universities and other educational facilities. The Drummond Report noted that sev-eral ministries administer economic development programs that include a training component, and recommended the government develop a “labour-market policy framework to link planning for employment and training services more strongly to economic development initiatives led by ministries such as Economic Development and Innovation; Agriculture, Food and Rural Affairs; and Northern Development and Mines.” We noted the Ministry had taken no action on this recommendation.
Furthermore, employment, training and apprenticeship programs of the Ministry of Train-ing Colleges and Universities were not included in the Framework, even though these directly affect employment and labour-force skills in Ontario. The labour force is also impacted by immigration policies of the Ministry of Citizenship, Immigration and International Trade, and the Framework makes no mention of the impact of new immigrants to the Ontario economy and how they can support further economic growth.
While the ministries of Research and Innovation and Economic Development, Employment and Infra-structure both focus on innovation and economic prosperity, their programs are not linked. In 2011, the then Ministry of Economic Development and Trade was combined with the Ministry of Research and Innovation to form the Ministry of Economic
firms add value to the economy and account for a significant share of job creation. The report states that small- and medium-sized businesses in Ontario’s manufacturing sector, for example, account for 58.3% of all employment. Most of the support to small businesses is through the income tax system, which is not directed at specific busi-nesses or industry sectors. We also noted that the Jobs and Prosperity Fund’s Strategic Partnership Stream can provide support to small- and medium- sized businesses as long as they are partnered with a large, well-established business.
While the Ministry has not assessed how many small- and medium-sized businesses lack access to economic development and employment sup-ports, the 2014 Report of the Expert Panel Examining Ontario’s Business Support Programs concluded that Ontario’s business support programs favour “the largest and oldest companies, the companies least likely to be in need of support.” The Report also observed that supports were “highly skewed” or not equitably distributed, with over 30% of fund-ing going to larger, older businesses, representing fewer than 1% of all businesses in Ontario. Further-more, the Report’s analysis showed “that in 2011 -12, total support for companies less than two years of age was about $0.2 billion, while total support for companies 10 years of age or older was $1.9 bil-lion.” Finally, the Report concluded that “support for high-potential young companies is especially important because such companies may grow to be critical to the province’s economic performance and quality of life.”
4.1.6 Framework Does Not Facilitate Integration of Other Ministry Programs
The government’s Framework does not address the impact of electricity rates in the province; nor does it integrate the activities of the Ministry of Training, Colleges and Universities, the Ministry of Research and Innovation, the Ministry of Northern Develop-ment and Mines, the Ministry of Agriculture, Food and Rural Affairs, the Ministry of Finance,

183Economic Development and Employment Programs
Chap
ter 3
• VF
M S
ectio
n 3.
04
• identifies and develops strategic partner-ships between stakeholders such as univer-sities, manufacturers and suppliers, and centres of excellence to leverage their exper-tise and help further promote and develop effective industry clusters; and
• integrates the activities of other key min-istries responsible for areas that impact on the economy, such as training, research, agriculture, northern Ontario development, corporate income tax, immigration and elec-tricity rates.
MINISTRY RESPONSE
We agree. MEDEI, in partnership with the Pre-mier’s Business Advisor, is leading the develop-ment of an industrial competitiveness strategy for the province, which includes a cross-sectoral approach to economic growth. Key recommen-dations are expected in Spring 2016.
While MEDEI currently does not set targets for regions or sectors, the 2014 Ontario Budget established a set of clear goals for 2025 to guide economic development policy, including macro-economic goals for productivity, exports, and venture capital investment. The 2025 goals sup-port the government’s plan to build Ontario up. The four-part plan includes investing in people’s talents and skills, making the largest investment in public infrastructure in Ontario’s history, creating a dynamic, innovative environment where business thrives, and building a secure retirement savings plan. The Ministry will seek to identify and incorporate additional targets reflecting our goal of supporting a dynamic and innovative economy.
The southwestern and eastern regional development funds provide funding to many small and medium size businesses, although most funding is provided to large businesses. Dir-ect business support funding is just one of many tools available to support small- and medium-sized businesses. In addition to business support
Development and Innovation in recognition of their similar responsibilities. However, in 2013, the Innovation and Economic Development components were again separated into two distinct ministries.
The Ministry of Finance sets the rules on cor-porate income tax credits that may be claimed by corporations for particular types of economic activ-ity, such as research and development. However, the Framework does not include consideration of such policies as part of a comprehensive strategy for providing supports to businesses.
The current Framework makes little mention of the Ministry of Research and Innovation, and there is no groundwork for integration of this ministry’s funded programs. For example, the Ontario Centres of Excellence works with industry and academia to create new jobs and businesses, and the Ontario Network of Entrepreneurs facilitates entrepreneur-ship efforts by centralizing the programs to support a new business.
Electricity rates significantly impact the com-petitiveness of operating certain businesses. In this regard, the Ministry of Northern Development and Mines administers an electricity rate relief program for businesses in northern Ontario as an economic development activity. Consideration of how electri-city rates can be used to support economic develop-ment is not addressed in the Framework.
RECOMMENDATION 1
To foster the best use of government funding to help businesses succeed within a prosperous Ontario economy, the Ministry of Economic Development, Employment and Infrastructure should develop a comprehensive strategy for economic development and employment pro-grams that:
• establishes and publicly communicates targets by sector and geographic region to enable an evaluation of the effectiveness of the funding it provides;
• considers the benefits of financial supports for small- and medium-sized businesses;

2015 Annual Report of the Office of the Auditor General of Ontario184
Chap
ter 3
• VF
M S
ectio
n 3.
04
programs, MEDEI and other ministries provide support to business through instruments such as business advisory services (MEDEI), small business tax deduction (MOF), Education and Training programs (MTCU) and Entrepreneur-ship and Commercialization programs (MRI). To ensure the proper mix of businesses is sup-ported by this Ministry, the Ministry will conduct an evaluation of the sizes of business funded, along with considering other available supports from all levels of government to businesses. It is expected that this evaluation will allow us to further target our funds and business supports to those businesses that will leverage the most benefits to the economy.
The Partnerships for Jobs and Growth Act, 2014, came into force on April 1, 2015 and sets out a legislative process for government to meaningfully collaborate with industry on sec-tor cluster planning. The Ministry is supporting the implementation of the Act, including development of an assessment framework to identify competitive clusters and set out cluster guidelines, and will be introducing a pilot cluster development seed fund that will enable consortia to network and undertake founda-tional research to help determine where cluster competitiveness strategies should be developed. The assessment framework will include con-sideration of the benefits of establishing link-ages early in a project between businesses and support organizations, such as universities and business development organizations, to help ensure projects are successful.
The Ministry has made recent progress co-ordinating economic development activities with other ministries on sector priorities and plans to further co-ordinate with other minis-tries as the new Strategic Framework and Jobs and Prosperity Fund are fully implemented over the next year or so. The Ministry supports that the Strategy will be more effective with greater co-ordination and involvement with other key ministries that impact the economy,
and the Ministry will be taking the lead to forge these linkages in the Strategy. Some progress in integrating the activities of other ministries has been made already. For instance, the new Jobs and Prosperity Fund currently or will be managing and co-ordinating the program administration for some programs of three other ministries: the ministries of Natural Resources and Forestry, Agriculture, Food and Rural Affairs, and Research and Innovation. The approval process includes representation from all ministries which provides for greater communication, discussion and co-ordination of economic development priorities. In addition, MEDEI is working with other ministries to assist with their sector priorities. For example, MEDEI recently supported the Ministry of Northern Development and Mines to attract a company willing to bring new jobs to the north with the support of government.
4.2 No Lead Appointed for Economic Development and Employment Programs Across Ontario
No government lead was appointed to take respon-sibility for the delivery of economic development and employment programs in Ontario. We expected that the Ministry of Economic Development, Employment and Infrastructure (Ministry) would have the authority to oversee all ministries’ funding intended for economic development and employ-ment purposes, but it only has authority for the pro-grams it manages directly. However, even though the Ministry provides most direct funding in these areas, other ministries and agencies offer many other similar programs. These include the Min-istry of Agriculture, Food and Rural Affairs’ Rural Economic Development program, the Northern Ontario Heritage Fund Corporation of the Ministry of Northern Development and Mines, and several Ministry of Training, Colleges and Universities pro-grams (see Appendix 1 for a full list). We did note,

185Economic Development and Employment Programs
Chap
ter 3
• VF
M S
ectio
n 3.
04
however, that the Ministry has taken the initiative to increase its leadership and co-ordination role for business support program delivery when it co-ordinates with other ministries.
The Drummond Report observed that “Ontario’s hodge-podge of direct and indirect [business support] programs is fragmented and lacks clear and coherent objectives.” Furthermore, while the Ministry’s Framework is described as an “all-of-government approach,” it does not delegate responsibility for ensuring a co-ordinated approach to all economic development and support pro-grams. Instead, each ministry and government organization will continue to make its own deci-sions on economic-development and employment-support funding.
The 2011 Cross-Ministry Support to Ontario Businesses Final Report noted a trend in other juris-dictions toward consolidating program delivery resources and using a lead agency working with third-party organizations. For example, the report observed that Michigan consolidated its economic-development initiatives under the Michigan Economic Development Corporation. While no Canadian provinces had created a separate entity along these lines, Alberta, British Columbia and Nova Scotia have advisory councils on economic policy. Ontario has no such council, and the Min-istry has never had an advisory council or official advisors on the economy. However, a Premier’s Business Advisor was appointed in June 2015 to provide advice on a strategic framework and a cross-sectoral approach to growing the economy, as well as recommendations on how the govern-ment can help the province move toward a more knowledge-based economy. Key recommendations are expected by spring 2016.
4.2.1 Government Program Delivery not Fully Co-ordinated
As noted in Appendix 1, various ministries offer separate economic development and employment programs. However, these are delivered without
any overall co-ordinating information about what individual businesses, areas of the province, or sec-tors receive funding. For example:
• Programs of the ministries of Agriculture, Food and Rural Affairs, and of Northern Development and Mines, both offer grants and loans for economic development. While the Ministry and these two may informally discuss potential overlaps in funding, there are no formal processes to ensure a provin-cially co-ordinated effort, and the Ministry had no way to readily determine if other gov-ernment funds were being provided.
• The Ministry has a mandate to cover all of Ontario, but has only ever funded one project in northern Ontario (in 2008). The Ministry indicated this is because most northern com-panies are too small to qualify for the larger ministry funds, but it could not provide us with a list of all potential eligible northern candidates (the Northern Ontario Heritage Fund Corporation does provide funding for smaller projects). Furthermore, the Ministry has done no assessment of the benefits of funding companies in the north as compared to the south. Also, one local chamber of com-merce in northern Ontario told us that when it reached out to the Ministry for help to develop their local economy, it was told to contact instead the Ministry of Northern Develop-ment and Mines. This chamber of commerce expressed concern that the northern economy is being lost in the overall economic develop-ment picture.
• The Ministry has not assessed its own job-creation efforts in relation to similar ones offered by the Ministry of Training Colleges and Universities to determine how the pro-grams could be co-ordinated to raise employ-ment in high-need areas. Similarly, it has not co-ordinated its employment efforts with the immigration activities of the Ministry of Citizenship, Immigration and International Trade to, for example, ensure that the skills of

2015 Annual Report of the Office of the Auditor General of Ontario186
Chap
ter 3
• VF
M S
ectio
n 3.
04
new immigrants match those identified by the Ministry as needed for economic development.
• Certain government initiatives, such as the clean/green technology initiatives, involve more than one ministry. However, once a project has been approved, the Ministry of Economic Development, Employment and Infrastructure is usually the only one that continues to be involved with it. This lack of co-ordinated approach can result in project failures. For example, the Ministry approved a project to build small wind turbines for residential use in 2009, awarding a grant of $2.7 million over five years under the Next Generation of Jobs Fund. This type of clean/green technology was new to Ontario, and a third-party expert warned the Ministry of risks such as legal and regulatory constraints on placement of turbines atop residential buildings. For example, the company indi-cated it set up operations in Ontario because the provincial government promised to estab-lish a subsidized market for small wind tech-nologies to help develop demand for the wind turbines. However, there was no evidence on file that the Ministry of Energy provided any support to help this project succeed, either at the approval stage or during the first three years of operation, and no subsidized market was established. Consequently, three years into the project, and after having received $2.25 million in funding, the company noti-fied the Ministry that it was leaving Ontario and abandoning the project due to limited sales. The company ceased operations in 2013 and the Ministry recovered no money.
The Ontario government has reorganized its oversight of economic development and employ-ment programs seven times since 2002. At various times, it combined these programs with ministries that also include trade, tourism, research and innovation. At present, they are combined with infrastructure spending. We noted that no other province currently has integrated government
responsibilities in this manner; other provinces either had stand-alone economic ministries (Saskatchewan, Alberta and Manitoba), or linked economic development and employment support programs with tourism (British Columbia), or innovation and exports (Quebec). A more stable ministry structure would likely have helped the Ministry to develop long-term plans, and relation-ships both within and external to government, and measure performance, which would support better co-ordination and promotion of the direct to busi-ness support programs.
4.2.2 Some Program Overlap Exists
The Cross-Ministry Support to Ontario Businesses Final Report of 2011 also observed that there is overlap among Ontario funding programs, particu-larly regionally based ones.
The Rural Economic Development Program of the Ministry of Agriculture, Food and Rural Affairs, for example, had similar objectives, such as modernization of older legacy industries, to the Advanced Manufacturing Investment Strategy and the Southwestern and Eastern Ontario Develop-ment Funds of the Ministry. While the Advanced Manufacturing Investment Strategy stopped accepting applications at least five years ago and continues to monitor unfinished projects, the Ministry has not evaluated the overlap between the ongoing Rural Economic Development Program and its Southwestern and Eastern Ontario Develop-ment Funds. Each of these three funds had annual expenditures of $15 million or more.
Lack of Information About the Impact of Corporate Tax Credits
Corporate income-tax credits can be a significant source of provincial government support to busi-nesses. In 2014/15, there were 17 types of corporate income tax credits available to businesses that cost the province $2.9 billion in forgone tax revenues.
Both the Drummond Report and the Expert Panel questioned the effectiveness of corporate

187Economic Development and Employment Programs
Chap
ter 3
• VF
M S
ectio
n 3.
04
ever, no other ministry or government program funds were discontinued or rolled into the Jobs and Prosperity Fund. Rather, when the govern-ment introduced the Jobs and Prosperity Fund two years later, the fragmented approach to economic development and employment support program administration remained unchanged.
A 2013 report by the Ontario Chamber of Com-merce and the Mowat Centre noted that businesses are still confronted by a “hodge-podge of direct and indirect programs,” and that “governments need to better co-ordinate their activities and resources to attract large-scale investments in Ontario.” The Ministry indicated that most direct business-only programs have been brought under its manage-ment. However, we noted programs administered by the Northern Ontario Heritage Fund Corpora-tion of the Ministry of Northern Development and Mines, and the Rural Economic Development Pro-gram of the Ministry of Agriculture, Food and Rural Affairs both still offered economic development programs to businesses, as well as to municipalities, universities, and non-profit agencies.
RECOMMENDATION 2
To ensure appropriate oversight and co-ordina-tion of economic development and employment funding, the Ministry of Economic Develop-ment, Employment and Infrastructure should seek to become the lead ministry responsible for overseeing and achieving a comprehensive prov-incial strategy for economic development and employment programs and corporate income tax incentives for businesses.
MINISTRY RESPONSE
The current model for delivering economic development programs is decentralized with several ministries each delivering programs, and the Ministry agrees that overall co-ordin-ation of economic development and employ-ment programs can lead to earlier success or better results, and greater integration and
income tax credits, with the Drummond Report rec-ommending the government phase out all refund-able corporate income-tax credits and place the resultant tax expenditure savings into a single envel-ope to fund business support programs. The Expert Panel noted specific effectiveness issues: compared to “peer jurisdictions, Canada and Ontario already rely heavily on R & D tax credits, and yet exhibit low levels of business expenditures on R & D.”
The Auditor General of Canada’s spring 2015 report entitled Tax-Based Expenditures recom-mended that the federal Department of Finance conduct systematic, ongoing evaluations of all tax-based expenditures, including tax credits. The report noted that tax expenditures have not been subject to strategic review, and recommended evaluations of tax-based costs to determine the most effective and efficient way to meet policy objectives and deliver outcomes. We noted that Ontario’s Ministry of Finance is currently reviewing corporate tax credits to determine the changes needed to improve effectiveness and achieve bet-ter outcomes. In particular, it is reviewing several corporate tax credits to eliminate duplicate support for the same activity. In July 2015, the Ministry of Finance advised us that it was in the process of obtaining preliminary feedback from other affected ministries that provide grants or loans to busi-nesses, such as those listed in Appendix 1.
4.2.3 Separate Government Funds Lead To Unco-ordinated Approach
Both the Drummond Report and the Jobs and Prosperity Council recommended in 2012 that all government support funding should be combined into a single Fund. This would allow for a more co-ordinated approach, and enable easier oversight of economic development and employment programs.
The Ministry of Economic Development, Employment and Infrastructure began working with the Ministry of Agriculture, Food and Rural Affairs on the Food and Beverage Stream of the Jobs and Prosperity Fund in January 2015. How-

2015 Annual Report of the Office of the Auditor General of Ontario188
Chap
ter 3
• VF
M S
ectio
n 3.
04
co-operation. The Ministry will discuss with its partner ministries the benefits of it becoming the lead responsible for overseeing and achieving a comprehensive provincial strategy for economic development and employment programs, includ-ing tax expenditures for businesses.
4.3 Lack of Centralized Administration Results in Inefficiencies
In addition to making decisions on funding for eco-nomic development and employment support, each ministry and government organization maintains its own staff to review applications for funding, monitor contract deliverables, and process and track payments and budgeted costs.
The Drummond Report, the Jobs and Prosperity Council, and the more recent Expert Panel Report all noted the inefficiency of this approach, and rec-ommended one back office for all support programs.
The Jobs and Prosperity Council, for example, noted that the current system is “cumbersome” and drives up administrative costs. The Drummond report said that “a single, shared back-office would support all ministries in the delivery of their busi-ness assistance programs to eliminate duplicated functions” and that they could “retain lead respon-sibility for current clients, but centralize their con-tract administration and payment processing in one branch.” The Drummond Report also referred to the Ministry’s merger with the Ministry of Research and Innovation as a step towards a public service that is better able to deliver business assistance programs, and that it should achieve efficiencies by consolidating the processing of transfer payments. However, this merger was reversed in a 2013 gov-ernment restructuring.
The Ministry indicated that it is moving towards a more centralized process for back-office func-tions for the Jobs and Prosperity Fund. However, we found most of the administrative processes supporting the various economic development and employment programs continued to be deliv-
ered separately across the government. The total funding provided to businesses and organizations by other ministries was approximately $1.8 bil-lion, and these ministries incurred costs of about $80 million in the year ended March 31, 2015, to administer these programs.
4.3.1 Ministry Unable to Track Other Government Funding or Corporate Income-tax Incentives to Recipients
The Ministry has incomplete data on how much grant and loan funding and refundable corporate income-tax incentives have gone to recipients from other ministries and agencies, or from other levels of government, which can lead to inefficiencies. Businesses are required to indicate on their applica-tions if they are getting other funding from any of the three levels of government. However, the Min-istry has no way to verify this information without contacting the other organizations. Businesses are not required to indicate if they are in receipt of or eligible to receive provincial refundable corporate income tax credits, which are paid to corporations that incur qualifying expenditures for certain types of activities, such as training and research and development.
The Ministry maintains the eCRM information system to track economic development and employ-ment projects. The system includes recipient and contract details, and actual project results, such as the amount invested by the recipient. However, none of the projects from other Ministries are cap-tured in this system. Consequently, ministry staff cannot readily determine whether an organization applying for support is already getting funding from a government, or has gotten it in the past.
On the other hand, the Ministry has made prog-ress in sharing its information system. Starting in early 2015, the Ministry granted access to eCRM to the Ministry of Agriculture, Food and Rural Affairs to enable them to enter and access project infor-mation for the Food and Beverage Growth Fund stream of the new Jobs and Prosperity Fund.

189Economic Development and Employment Programs
Chap
ter 3
• VF
M S
ectio
n 3.
04
recipients received corporate income tax-credit refunds ranging from $15,000 to $3.5 million. The Ministry does not have information on the amounts of corporate income tax credits the companies were able to claim from Ministry-funded project expendi-tures. But it did indicate that tax-credit information and determining whether corporations’ are eligible for tax credits would be useful to help it make deci-sions about funding allocations.
Lack of Unique Business Number Weakens Ability to Track Funding
A further obstacle in tracking funding by recipient is the lack of a unique business number. Businesses may apply for support funding under their business name, corporate name, a parent corporation name, or a subsidiary name. As businesses may move their administrative offices around the province, it can be difficult to conclusively match up businesses by name or address alone. The Ministry of Finance’s Expert Panel Report remarked on the difficulties inherent in this matching process as the greatest challenge in conducting their review. In particular, it recommended the use of a unique company identifier, “possibly the Business Number assigned by the Canada Revenue Agency, to facilitate the matching of multiple records that pertain to a single company.”
RECOMMENDATION 3
To ensure direct-to-business support funding is administered efficiently and cost effectively, the Ministry of Economic Development, Employ-ment and Infrastructure should seek govern-ment approval to take on the responsibility to centralize the back-office administrative func-tions of all other ministries that provide direct-to-business support. It should also work towards ensuring all businesses have a common unique identifying number that is used throughout government to allow for tracking of government support by various ministries.
Because funding is provided to many different industries, including energy production, informa-tion technology, food manufacturing and pharma-ceuticals, ministry staff are required to determine which other ministry might have provided funding. They then need to identify a contact person at the other ministry and email or call to ask about a par-ticular company.
The Ministry did not have any policies on standard methods of communicating with other ministries (for example, by email or phone call) or even a list of staff at other ministries to contact. For our sample of projects, there was documentation in only about 45% of the cases indicating that another ministry was contacted when it made sense to do so. However, had all grants and loans been access-ible on one system, ministry staff would have been able to instantly access the required information.
Despite the significant amount of project costs that may be recovered through corporate income tax incentives, we found only one case in our review where the Ministry considered corporate income tax credits as a potential source of project funding prior to contracting with a recipient. In all other cases, there was no evidence that the Ministry had considered the amount of tax credits that a recipi-ent would be eligible to receive when calculating an appropriate amount of grant or loan funding.
The Ministry needs to be aware of all sources of government funding available for a given project, whether it be grants, loans or tax credits. This information can be used to support an informed determination of the amount of grant or loan that is needed for the project, and also helps ensure the recipient has invested enough in the project to be fully committed to ensure its success by also putting its own funds at risk.
We reviewed the corporate income-tax credits claimed by businesses over the five years from 2010 to 2014, and found that for two-thirds of the projects we sampled, recipients also received refundable income-tax credits—that is, a refund for certain eligible expenditures incurred, similar to a grant. We noted that between 2010 and 2014, these

2015 Annual Report of the Office of the Auditor General of Ontario190
Chap
ter 3
• VF
M S
ectio
n 3.
04
MINISTRY RESPONSE
The Ministry agrees with this recommendation and currently provides back-office administra-tive functions for other ministry programs and will seek to further realize the benefits of an enterprise-wide service delivery model. The Ministry currently supports programs for MEDEI, MRI, OMAFRA, and MNRF.
The Ministry is developing an IT solution that will enable onboarding of programs for other ministries. This solution will provide better track-ing, co-ordination and information about busi-ness support recipients and benefit all ministries engaged in economic development activities.
RECOMMENDATION 4
To ensure an appropriate amount of grant and loan funding is calculated for each project, the Ministry of Economic Development, Employ-ment and Infrastructure should take measures to ensure program staff are aware of all sources of government funding available for a given project, including corporate income tax credits, and consider these amounts when determining grant or loan funding.
MINISTRY RESPONSE
The Ministry agrees that program staff need reliable and complete information on the actual and potential sources of funding business have available to them for new projects. While the Ministry program staff are aware of the various sources of funds available to businesses, there is often limited means for validating all potential funding sources for a particular project, particu-larly corporate tax incentives. The Ministry will work with MOF to find tools that will enable staff to become aware of other funding sources. Contracts with funding recipients already have penalties and claw back provisions should the Ministry learn that a company has not disclosed a significant other source of funding for the project.
4.4 Administration and Oversight of Ministry Programs
We noted that the Ministry generally performed well with respect to the approval process in the administration and oversight of economic-develop-ment and employment-support programs.
All of the projects we reviewed received approvals from the appropriate level of senior ministry man-agement. Project files and documents, such as signed application forms, final assessment forms, and fund-ing contracts, were generally complete and properly stored on the Ministry’s computer network.
In instances where the recipients did not meet contract job targets, we noted that the Ministry was diligent in its efforts to recover funds, usually by reducing the amount paid to recipients in subsequent disbursements. Finally, the Ministry consistently ensured that the required final audit reports were provided by recipients upon project completion.
However, we noted other systemic issues, includ-ing the lack of transparency in the decision-making process that awards grants and loans, the process by which the Ministry determines how much to award to recipients, and ways the Ministry ensures that the benefits to the economy are adequately and accurately measured, and reported to the public.
4.4.1 Invitation-based Funding Approach Needs Greater Transparency
An impediment to businesses accessing funding is the fact that most of the Ministry’s recent economic-development and employment-support programs, including the Strategic Jobs and Investment Fund and the Jobs and Prosperity Fund, are “invitation-based.” This means they are not available to the general public; instead, the Ministry invites com-panies to formally submit a funding application. Consequently, approximately 80% of total funding approved by the Ministry since 2010 has been based on an unclear process for selecting applicants.
The Ministry reported to Treasury Board in November 2014 when it was establishing the Jobs and Prosperity Fund that it could lower Fund costs

191Economic Development and Employment Programs
Chap
ter 3
• VF
M S
ectio
n 3.
04
The Ministry’s submission to the Treasury Board indicated the company would invest $800 million, including the establishment of a production studio in Ontario, and create “employment of approxi-mately 800 highly-skilled, highly-paid individuals in Toronto.”
The Ministry indicated that, while considera-tion had been given to this company applying for the Ontario Interactive Digital Media refundable corporate income tax credit instead, there was no evidence that the Ministry had determined whether the company would have been eligible for this refund. The Ministry decided that it would, as an alternative, offer the company funding under the Next Generation of Jobs Fund, even though the project did not meet the Fund criteria and would therefore need Treasury Board approval for the exemption. The project was approved by the Treas-ury Board following Ministry negotiations with the recipient over the length of the contract and the amount to be funded, even though the grant exceeded the Fund’s limit of a maximum 15% of eligible project costs.
We also noted that the Ministry’s third-party expert recommended against approving the project because it contained no technological innovation, a key Fund requirement. Moreover, the terms of the contract did not set any performance targets, such as employment or project milestones, and payments to the recipient were based solely on the recipient mak-ing investments of its own and remaining in Ontario.
We noted that all the Ministry’s contracts with other recipients made funding contingent on the recipient meeting specific job creation targets, and included provisions to reduce future payments if it failed to meet the targets. As of May 31, 2015, the project was still ongoing and the Ministry had disbursed $42 million for the project based on the recipient reporting it had spent $106 million and cre-ated 322 jobs. Notwithstanding these results, we felt that the Ministry assumed a high degree of risk with less assurance of benefits for the economy by not establishing job targets and project milestones in the contract, especially since it was providing higher lev-els of funding compared to any other funded project.
compared to similar programs (such as the Next Generation of Jobs Fund) and leverage higher levels of private investment by using the invitation-based approach, and that this approach demonstrates the best value for money in terms of leveraging new investment in the province.
However, it is our view that this approach lacks transparency, fairness and equitable access for the businesses that may want to apply for funding, and increases the risk that the Ministry may not iden-tify all suitable and qualifying businesses when it selects those businesses it invites to submit applica-tions. We also noted that the Ministry’s evaluation of program costs that indicated the invitation-based approach was the best value essentially compared application-based programs that had defined-fund-ing criteria (such as maximum dollars awarded per project) with the only invitation-based program it had used (the Strategic Jobs and Investment Fund), that also had no funding criteria established, which provided the Ministry complete discretion in the amount of grants or loans it could award.
Furthermore, we noted the Ministry’s invitation-only approach lacked other essential elements of accountability in that the Ministry could not support the process it used to identify and select Fund recipients. For instance, the Ministry could not provide selection criteria or otherwise provide a list of companies invited to apply for funding. Additionally, the Ministry does not maintain a list of the businesses rejected for funding, or those that withdrew their applications. As a result, we were unable to review the number of applicants or rea-sonableness of the process that lead to applications being rejected or withdrawn.
We also noted that the largest funding com-mitment made in the last 10 years, a $264-million grant approved in 2009 and payable over 10 years to cover 35% of a company’s investment to establish video game operations in Ontario, was funded under the open-application-based Next Generation of Jobs Fund. However, the Ministry invited the company to apply for the grant without having to make a formal application.

2015 Annual Report of the Office of the Auditor General of Ontario192
Chap
ter 3
• VF
M S
ectio
n 3.
04
RECOMMENDATION 5
The Ministry of Economic Development, Employ-ment and Infrastructure should consider adding greater transparency in accepting applications from all qualifying businesses. Such an approach could entail publicly communicating informa-tion on Funds to the general public, associations, and targeted industries to ensure that all qualify-ing businesses are aware of the programs. It should then use a fair and consistent process for selecting businesses to provide funding based on the merits of the applications, and ensure that the process used is clearly documented.
MINISTRY RESPONSE
The Ministry agrees that businesses that qualify for support funding should be considered for funding support. In the past, the Ministry has been cognizant that advertising these funds could create a mistaken expectation that these supports are available to all companies with little discretion. Given the limited funds and staff resources available, MEDEI has chosen to use an invitation-based approach that has a rigorous evaluation process which is consistent in application and fair in awarding support. Notwithstanding, the Ministry agrees that better record keeping was needed to demonstrate how businesses are selected for the invitation-only approach and those companies that were con-sidered but were unsuccessful.
The Ministry will assess how it can improve its application intake processes for making qualifying business more aware of funding sup-ports available, such as more targeting of select business associations for disseminating program availability information, and how its processes can be perceived as more open and transparent to applicants.
Ontario is engaged in a fierce global com-petition to attract new strategic investments. None of these competitors provide a significant
level of detail around their support programs simply because it would provide their competi-tors (including Ontario) with an advantage when negotiating with companies. For similar reasons, the flexibility of Ontario’s invitation-based approach is often necessary to attract strategic investments.
4.5 Ministry Did Not Establish Whether Recipients Actually Needed Help
In assessing applications for funding, there was no evidence that the Ministry considered whether a loan, which costs less, would have sufficed in place of a grant. Because the Ministry does not determine an applicant’s actual needs, there is a risk that fund-ing is being provided unnecessarily.
For most funds we reviewed in the past five years, a needs assessment was not part of the assessment process. Consequently, in over 90% of these projects, there was no documentation to indi-cate that government help was required to support the proposed projects. Even for the older Ontario Automotive Investment Strategy, which specifically required a needs assessment, only three of the 10 projects approved explicitly indicated that the pro-ject was contingent on ministry funding.
While the Ministry indicated in some cases that funds were provided to ensure the company chose Ontario over another jurisdiction, this risk was not documented for any of the projects we reviewed.
4.5.1 Projects Would Have Gone Ahead Anyway
Similarly, there was no evidence that financial sup-port was needed to fund the projects for the smaller regional programs. In one case, a manufacturer was approved for a $1-million grant in 2013 to install a new $14-million production line, even though there was documentation on file saying “it appears the project will move ahead regardless of the South-western Ontario Development Fund support.”

193Economic Development and Employment Programs
Chap
ter 3
• VF
M S
ectio
n 3.
04
MINISTRY RESPONSE
The Ministry agrees that decisions in the past to approve funding under its older legacy Funds could have better documented the reasons why funding was provided. The new Jobs and Prosperity Fund has introduced a comprehen-sive scorecard as part of its assessment process which the Ministry believes will address the auditor’s recommendation. This evaluates the incremental impact of the proposed investment and the need for government support.
The scorecard seeks to identify projects that will have the largest impact on growing the economy, including evaluating contributions to productivity, innovation and new market access, which provides guidance on which projects should be supported and at what level.
The scorecard includes a Return on Invest-ment (ROI) analysis that evaluates the cost of funding against expected returns to Ontario. The ROI is used as one factor to determine whether loan funding should be considered for projects.
Business support funding is offered to incent companies to invest, expand and innovate in Ontario. In some cases, the Province is also competing against other jurisdictions for stra-tegic investments and must counter incentives offered by competing jurisdictions. As a result, funding may be offered to companies that may or not have sufficient resources for the project to proceed. The Ministry will ensure that deci-sions made to provide incentive funding are well documented as part of the approval process.
4.5.2 Ministry Does Not Consider Equity in Exchange for Funding
Regardless of whether a grant, a loan, or a combin-ation of the two, is approved to support a project, the Ministry does not evaluate whether Ontario should receive an equity stake from the recipient, or otherwise share in the success of a project, in return for funding.
One of the companies we interviewed received a grant of more than $800,000 to implement a new, $16-million production line. The project manager indicated that the company’s Board of Directors had already approved the project prior to the applica-tion for funding. Evidence on file also indicated that the Ministry knew the applicant was a subsidiary of an established international company that would have supported the project even if the Ministry didn’t provide the grant. Our review of the Min-istry’s assessment form indicates that this grant, was not provided based on need, but rather because the funding was “important to the investors to pro-vide confidence to remain in Canada.”
As a result, we question whether the funding pro-vided to this company would have been more pro-ductive to the economy had it been instead awarded to another company’s expansion project that would not have proceeded without financial assistance.
The issue of financial support to companies that may not need it was further emphasized in a 2015 report by the Institute for Competitiveness and Prosperity that warned that “jurisdictions need to be careful [because] there have been cases where firms have been offered large incentives, when they were planning on locating in the particular jurisdic-tion even in the absence of such a deal.”
We were advised by the Ministry that going forward with the new Jobs and Prosperity Fund, evaluation criteria will include more focus on whether a project would not happen without gov-ernment support—in other words, whether govern-ment funding is actually needed.
RECOMMENDATION 6
In ensuring that business support funding is allocated to companies that need it and have the largest impact on growing the economy, the Ministry of Economic Development, Employ-ment and Infrastructure should establish evaluation criteria that better assesses whether funding for projects is needed in order for the project to proceed.

2015 Annual Report of the Office of the Auditor General of Ontario194
Chap
ter 3
• VF
M S
ectio
n 3.
04
The cases of General Motors and Chrysler offer recent examples of the Ontario government receiving equity in return for providing assistance. In 2009, both companies were facing significant financial difficulties, and received $4.6 billion from the Ontario Financing Authority as part of a wider North American agreement that included the Canadian and U.S. governments. Over the period of 2010 to 2015, the Ontario Financing Authority recovered a total of $3.6 billion of its investment, about 70% of which was through equity considera-tions, with the remaining one billion dollars written off. Had the funding arrangements not included equity, the cost to Ontario could have been signifi-cantly higher.
However, the Ministry has not taken any shares or partial ownership in any business that it has funded; nor has it shared in patents or rights in exchange for financial support. While the Ministry funds most projects at a relatively small percent-age compared to the recipient, which would not justify taking an equity stake, in some cases it funds projects at higher levels. For instance, the Ministry funded about 35% of one project and over 50% of another, but took no equity considerations in return. While other ministries and agencies have shared in some projects they helped fund, it was not evident in any of the projects we reviewed that Min-istry staff even considered this type of arrangement during contracting.
RECOMMENDATION 7
The Ministry of Economic Development, Employment and Infrastructure should estab-lish project evaluation criteria that identify circumstances where it should require equity in projects in return for funding.
MINISTRY RESPONSE
The Ministry will evaluate the circumstances, criteria, and benefits of offering funding in exchange for equity in a project. Most projects have a high leverage level, which means the
amount the company invests is significantly higher than the amount the province invests. In these cases, the Ministry would not consider requiring any equity in the project. Projects requesting funding at higher levels may sup-port a business case where the Ministry shares directly in the project benefits, or alternatively the Ministry sets higher expectations for project benefits to the economy.
4.6 Benefits of Support Programs Should Be Monitored, Reported On
As Figure 7 indicates, most funds did not achieve as many jobs as originally committed to in the con-tracts for completed projects. In this regard, we also found that the Ministry was diligent in ensuring that funding was recovered when job targets were not met.
However, we noted systemic weaknesses in monitoring processes that needed to be addressed. One is the need for the Ministry to measure the impact of Ontario’s economic-development and employment-support programs to ensure they are effective in generating benefits to the overall econ-omy. Additionally, the Ministry does not publicly report on project results, and when the Ministry did report internally on the results of the funded projects, the underlying data was often incomplete, inaccurate, or overstated.
4.6.1 No Evaluation Done of Whether Programs Positively Impact the Ontario Economy
Other than measuring the specific achievements of employment targets and the amount of recipient investment that Ministry funding has leveraged, there is no evidence to suggest that the Ministry has evaluated or reported on the overall impact of the funded projects, or the effectiveness of its economic-development and employment-support programs on Ontario’s economy.

195Economic Development and Employment Programs
Chap
ter 3
• VF
M S
ectio
n 3.
04
For example, as noted earlier, the largest grant approved was $264 million in 2009 over 10 years for a video game company to come to Ontario. The grant covered the cost of furnishing and operating an office in Toronto, but no deliverables were stated in the contract. Ministry documents indicate that bringing this company to Ontario was considered an opportunity to build an industry cluster and increase Ontario’s international profile.
However, in the five years that the project has been going, the Ministry never evaluated the impact of the project on the digital media industry or on the planned industry cluster development, even though $42 million has since been provided to the company.
The Ministry also does not measure how much of its funding to recipients goes to equipment or ser-vices purchased outside Ontario. This information is necessary to determine the impact of a project on Ontario’s GDP. Any purchases of services or equip-ment outside Ontario reduces the benefits to the
economy. We noted that for many the projects we reviewed, equipment or machinery was purchased from outside Ontario. The Conference Board of Canada has also noted the high rate of imported machinery and equipment by Ontario businesses, and that this has less impact on growing the GDP.
Given that the Ministry committed more than $2 billion to funding such programs since 2004, it should carry out an overall evaluation of the per-formance of the programs and their impact on the economy, and not just the number of jobs created or retained.
None of the contracts we reviewed required increases in exports or improvements in innovation or productivity, even though expert reports such as the Jobs and Prosperity Council’s Advantage Ontario stressed the importance of such measures. For example, the Ministry should assess whether projects with an initial objective of increasing exports or creating an innovative product actually achieved those objectives.
Figure 7: Job and Investment Commitments, Results, for Completed Projects from 2004 to May 31, 2015Sources of data: Ministry of Economic Development, Employment and Infrastructure
Recipient Job Commitments# of # of % of Contracted
Funding Program Contracted Jobs Actual Jobs Variance Target MetAdvanced Manufacturing Investment Strategy 5,949 5,592 (357) 94
Ontario Automotive Investment Strategy* 35,147 22,228 (12,919) 63
Next Generation of Jobs Fund 7,695 9,307 (1,612) 121
Eastern Ontario Development Fund 14,879 11,846 (3,033) 80
Strategic Jobs and Investment Fund 7,814 10,162 2,348 130
Total 71,484 59,135 (12,349) 83
Recipient Investment CommitmentsContracted Actual Investments Variance % of Contracted
Funding Program Investments ($ million) ($ million) ($ million) Target MetAdvanced Manufacturing Investment Strategy 1,396 1,309 (87) 94
Ontario Automotive Investment Strategy 5,771 5,358 (413) 93
Next Generation of Jobs Fund 3,486 2,580 (906) 74
Eastern Ontario Development Fund 635 491 (144) 77
Strategic Jobs and Investment Fund 1,287 1,420 133 110
Total 12,575 11,158 (1,417) 89
* Projects funded by older programs, such as the Ontario Automotive Investment Strategy, were more likely to not meet job targets due to the 2008 economic downturn.

2015 Annual Report of the Office of the Auditor General of Ontario196
Chap
ter 3
• VF
M S
ectio
n 3.
04
Ministry monitoring of project achievements does not extend beyond the contract term: The Ministry indicated it does no monitoring of projects after contracts expire, because it holds recipients accountable only for achieving investment and job targets during the term of the contract. In all but two of the projects we reviewed, none of the recipients was obligated to report on the job targets beyond the contract end date. As a result, it is uncer-tain whether the jobs created or retained during the contract term continued to exist afterwards. While the projects may be fully implemented, the Ministry should continue to monitor jobs created or retained for periods beyond a project’s completion date to assess the long-term impact of the funding provided and the achievement of sustainable employment.
In addition to the suggested performance measures noted above, another possible measure of project success is return on investment of ministry funds. The Ministry began calculating return on investment in 2010 when assessing potential pro-jects under the Strategic Jobs and Investment Fund. It compared the estimated increase in Ontario’s income-tax revenues from newly hired employees of a project to the funding awarded the project. However, these calculations were only performed during a project’s assessment phase, and were not updated to reflect actual results upon completion. Additionally, the return-on-investment calculation was never introduced to the Ministry’s other sup-port programs.
As a result of the above weaknesses in its monitoring and reporting processes, the Ministry is unable to conclude on whether its economic-development and employment-support programs are effective in ensuring sustainable benefits for Ontario. Many expert reports have also questioned the benefits of such programs to the economy, with the Drummond Report observing that “business support programs are fragmented and lack clear and coherent objectives,” and “it is unclear whether the programs are achieving any economic benefits for Ontario.”
For two projects that we reviewed with total contract commitments of $340 million, both signed in 2014, the deliverables outlined in the contracts were to spend a certain amount of money and to either maintain or create a targeted number of jobs in the area of research and development. While the contracts both refer to increasing productivity and innovation in the form of new product develop-ment, there are no specific requirements to hold the companies accountable for these and no references to increasing exports as part of these contracts.
Additionally, the Ministry should evaluate the size of the return on its investment by, for example, calculating how much of the anticipated additional income tax the province actually collects from the new jobs created by the projects.
Our review of the Ministry’s current monitoring and reporting processes identified the following areas as needing improvement:
Performance measures used by the Ministry are too narrow: None of the projects we reviewed included, for example outcome measures to assess the impact of its support programs in strengthening Ontario’s economy. The Ministry should consider other measures to assess program performance, including the number of jobs created or retained by industry sector or region; changes in GDP; fluctuations in unemployment rates for the region; increases in exports; commercialization of new products or services; and increases in productivity of the recipient’s processes. Performance measures included in contracts with recipients should link to measures used to assess performance of the Funds. We understand that the Ministry plans to introduce new performance measures related to productivity, innovation and exports under the new Jobs and Prosperity Fund. However, there are no current plans for introducing other broader economic meas-urements, such as changes in GDP or unemployment rates. Also, even though the Ministry measures the cost it has incurred to create or retain a job, it does not obtain any information on the salaries of employees hired under these projects, which is necessary to evaluate whether the funding provided to support a job was cost effective.
197Economic Development and Employment Programs
Chap
ter 3
• VF
M S
ectio
n 3.
04
RECOMMENDATION 8
In order to measure the success of its programs in strengthening the Ontario economy and achieving sustainable benefits, the Ministry of Economic Development, Employment and Infra-structure should:
• expand its current performance measures to include factors other than a project’s invest-ment and employment targets; and
• consider monitoring performance measures beyond the term of funding contracts to assess whether benefits to the economy con-tinue after project completion.
MINISTRY RESPONSE
The Ministry agrees that a broader set of measures are needed to more fully assess the impact and effectiveness of economic develop-ment programs. More recently, the Ministry has been evaluating projects against factors other than jobs and investment. The new Strategic Investment Framework will ensure that all new applicants are measured against the Productiv-ity, Innovation and Exports principles at the outset through criteria set out in the Jobs and Prosperity Fund’s scorecard, which is a key part of the approval process. In this respect, all new projects to be funded under the Jobs and Prosperity Fund must support the productivity, innovation and exports objectives to receive funding. Reporting on these new performance measures will be part of the contractual com-mitments of the recipient.
The Ministry will consider what additional broader measures might be introduced to assess the full extent of impact that funded projects have had on the local and provincial economies.
The Ministry is aware that successful projects continue to provide benefits to the economy, such as job retention or creation, after project completion and agrees that it should consider ways to measure these continuing benefits as
part of our continuous program evaluation pro-cesses. The Ministry will consider best to gather this information, either by making it a require-ments in contracts with funding recipients to beyond the contract term, or to develop other possible means such as post evaluation surveys.
4.7 More Care Needed in Reporting Results Publicly
While the Ministry publicly announces newly con-tracted investment and job targets for most of its projects, it does not subsequently report their actual results. As a result, the public is unaware of the status of projects, or whether objectives were met.
New projects are usually announced at public events involving MPPs, and then through the Ministry’s annual planning reports, published on its website. However, for approximately 60 projects with ministry commitments totalling over $70 mil-lion, no public announcements were made. The Drummond Report recommended greater transpar-ency in this process, and suggested that the Ministry should publish a list of companies that receive gov-ernment financial support, and how much they get.
We also noted the Ministry approved and announced a $10-million loan in 2006 to an Advanced Manufacturing Investment Strategy fund project. The recipient completed the project, achiev-ing both job and investment targets in 2011 (though with no assurance that the jobs lasted past the end of the project since the contract did not require this), and was required to repay the loan by 2018. However, it repaid only $4.1 million of the loan. The Ministry wrote off the remaining $5.9 million in 2015, when it determined the company was no longer financially capable of repaying the remainder of the loan. The Ministry has not publicly updated the progress of the project or the expected cost to the province of the company’s default.
We further noted that the Ministry’s annual planning report normally announced jobs created without sufficient explanation of whether these were actual or planned targets. For example, the

2015 Annual Report of the Office of the Auditor General of Ontario198
Chap
ter 3
• VF
M S
ectio
n 3.
04
2014/15 report notes the following regarding the Eastern Ontario Development Fund for the fiscal year ending March 31, 2014: “Since the Fund was established in 2008, the government has invested $70 million in 144 projects leveraging a total investment of approximately $683 million. These investments have created 2,987 new jobs.” Our comparison of these figures to the Ministry’s inter-nal data indicates the following:
• The $70 million represents the total fund-ing committed to the 144 projects by the Ministry, as per the funding contracts. As of the 2013/14 reporting period, total actual dis-bursements by the Ministry to these projects was approximately $45 million or 36% less than announced by MPPs and reflected in the annual planning report.
• The $683 million represents total commit-ted investments by recipients as per funding contracts. As of the 2013/14 reporting period, total investments actually reported by the recipients was $434 million or 36% less.
• The 2,987 jobs represents total job creation commitments by recipients as per funding contracts. As of the 2013/14 reporting period, total actual jobs created by these projects was 2,538 or 15% less.
While the investment and job statistics in the annual planning report are all based on planned results, as opposed to actual achievements, neither this fact nor the actual results was communicated publicly. We understand that the new Jobs and Prosperity Fund will require that the Ministry report publicly each year on the status of business support programs, including actual results achieved to date.
We noted that the eCRM computer system used by the Ministry to track funded projects lacks certain functionality, including the ability to track actual data by year. This could be one of the causes of inaccurate or incomplete reporting.
Ministry staff compensate for the system’s weak-ness by using it in conjunction with spreadsheets. In addition, because eCRM was not always accurately updated by Ministry staff, monitoring reports
generated using system data were often inaccurate. In over half of the projects we reviewed, we noted errors in eCRM that would affect the accuracy of monitoring reports, including incorrect disburse-ment amounts or dates for site visits. Consequently, this could also affect the accuracy and complete-ness of the information reported to the public.
Finally, the government has not provided the public with complete information on how much funding it has actually allocated to economic development and support programs. Overall, it has over-stated its funding by more than $1 billion as follows:
• The Advanced Manufacturing Investment Strategy fund was announced in 2005 with estimated planned commitments of $500 million in repayable loans. However, only $223 million was actually committed to recipients up until 2010, and the fund is no longer accepting applications.
• The Next Generation of Jobs Fund was announced in 2008 with total funding of $1.15 billion. However, total commitments made under the fund by 2009 were only about $810 million and the fund is no longer accepting applications.
• The Jobs and Prosperity Fund was announced in January 2015 as a 10-year program with total funding of approximately $2.5 bil-lion. However, the government transferred approximately $780 million of commitments previously announced under older programs into the Jobs and Prosperity Fund. Con-sequently, the total amount flowed under this fund will include $780 million of funding that was already included under other funds.
The Ministry indicated that it is a general prac-tice to transfer funding between programs as new ones are introduced. We believe that over-stating available funding provides inaccurate information to the public regarding the extent of the govern-ment’s investment in economic-development and employment-support programs.

199Economic Development and Employment Programs
Chap
ter 3
• VF
M S
ectio
n 3.
04
RECOMMENDATION 9
To ensure that communications of project results to the public are accurate and complete, the Ministry of Economic Development, Employ-ment and Infrastructure (Ministry) should publicly report on its website:
• all funding commitments and the names of all projects and companies contracted with, including clarifying whether announcements are duplicate to previous ones made; and
• accurate actual results for each project compared to commitments and targets previ-ously announced.
MINISTRY RESPONSE
As part of the new Jobs and Prosperity Fund, the Ministry is assessing the various approaches available to providing the public with improved information on the funding support it provides to businesses. While we plan to continue to issue public news releases and reports that highlight details of specific projects and recipients as well as program commitments, the Ministry will consider what improvements can be made to ensure more accurate reporting going forward, and any enhancements that can be made to its public website.
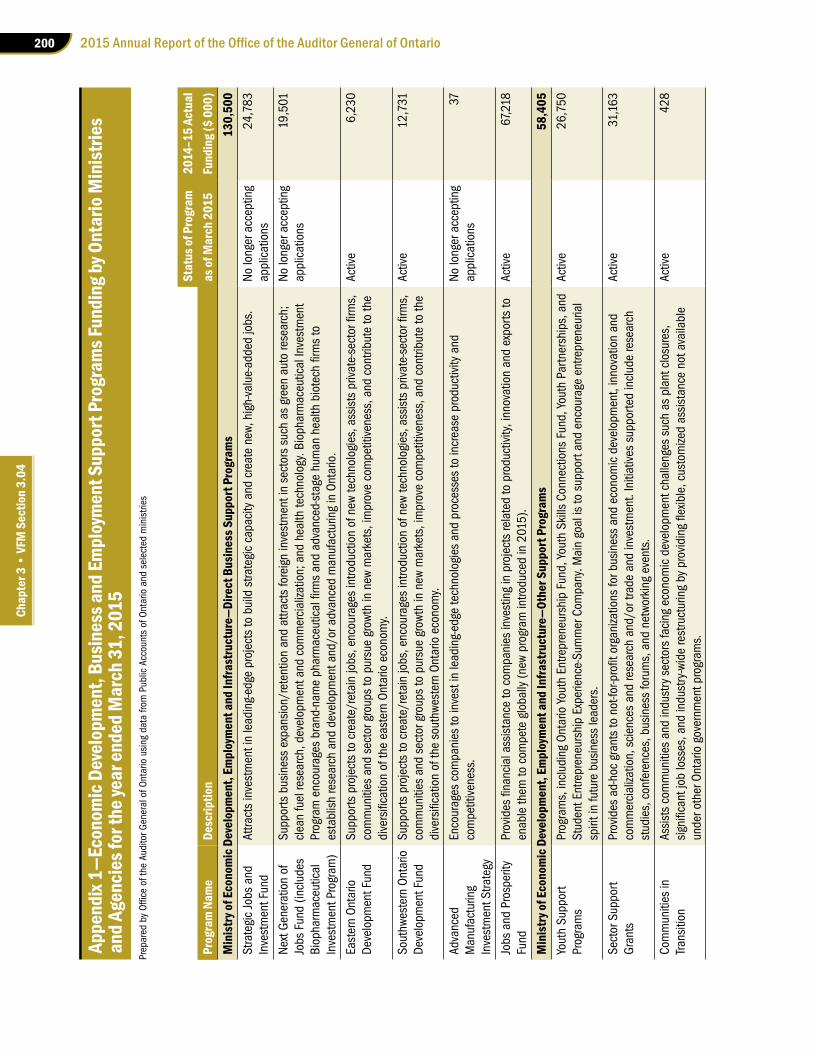
2015 Annual Report of the Office of the Auditor General of Ontario200
Chap
ter 3
• VF
M S
ectio
n 3.
04
Appe
ndix
1—Ec
onom
ic D
evel
opm
ent,
Busin
ess a
nd Em
ploy
men
t Sup
port
Prog
ram
s Fun
ding
by O
ntar
io M
inist
ries
and A
genc
ies f
or th
e yea
r end
ed M
arch
31, 2
015
Prep
ared
by
Offi
ce o
f the
Aud
itor G
ener
al o
f Ont
ario
usi
ng d
ata
from
Pub
lic A
ccou
nts
of O
ntar
io a
nd s
elec
ted
min
istri
es
Stat
us of
Pro
gram
2014
–15
Actu
alPr
ogra
m N
ame
Desc
riptio
nas
of M
arch
201
5Fu
ndin
g ($
000)
Min
istry
of E
cono
mic
Dev
elop
men
t, Em
ploy
men
t and
Infra
stru
ctur
e—Di
rect
Bus
ines
s Sup
port
Prog
ram
s13
0,50
0St
rate
gic
Jobs
and
In
vest
men
t Fun
dAt
tract
s in
vest
men
t in
lead
ing-
edge
pro
ject
s to
bui
ld s
trate
gic
capa
city
and
cre
ate
new,
hig
h-va
lue-
adde
d jo
bs.
No lo
nger
acc
eptin
g ap
plic
atio
ns24
,783
Next
Gen
erat
ion
of
Jobs
Fun
d (in
clud
es
Biop
harm
aceu
tical
In
vest
men
t Pro
gram
)
Supp
orts
bus
ines
s ex
pans
ion/
rete
ntio
n an
d at
tract
s fo
reig
n in
vest
men
t in
sect
ors
such
as
gree
n au
to re
sear
ch;
clea
n fu
el re
sear
ch, d
evel
opm
ent a
nd c
omm
erci
aliza
tion;
and
hea
lth te
chno
logy
. Bio
phar
mac
eutic
al In
vest
men
t Pr
ogra
m e
ncou
rage
s br
and-
nam
e ph
arm
aceu
tical
firm
s an
d ad
vanc
ed-s
tage
hum
an h
ealth
bio
tech
firm
s to
es
tabl
ish
rese
arch
and
dev
elop
men
t and
/or a
dvan
ced
man
ufac
turin
g in
Ont
ario
.
No lo
nger
acc
eptin
g ap
plic
atio
ns19
,501
East
ern
Onta
rio
Deve
lopm
ent F
und
Supp
orts
pro
ject
s to
cre
ate/
reta
in jo
bs, e
ncou
rage
s in
trodu
ctio
n of
new
tech
nolo
gies
, ass
ists
priv
ate-
sect
or fi
rms,
co
mm
uniti
es a
nd s
ecto
r gro
ups
to p
ursu
e gr
owth
in n
ew m
arke
ts, i
mpr
ove
com
petit
iven
ess,
and
con
tribu
te to
the
dive
rsifi
catio
n of
the
east
ern
Onta
rio e
cono
my.
Activ
e6,
230
Sout
hwes
tern
Ont
ario
De
velo
pmen
t Fun
d Su
ppor
ts p
roje
cts
to c
reat
e/re
tain
jobs
, enc
oura
ges
intro
duct
ion
of n
ew te
chno
logi
es, a
ssis
ts p
rivat
e-se
ctor
firm
s,
com
mun
ities
and
sec
tor g
roup
s to
pur
sue
grow
th in
new
mar
kets
, im
prov
e co
mpe
titiv
enes
s, a
nd c
ontri
bute
to th
e di
vers
ifica
tion
of th
e so
uthw
este
rn O
ntar
io e
cono
my.
Activ
e12
,731
Adva
nced
M
anuf
actu
ring
Inve
stm
ent S
trate
gy
Enco
urag
es c
ompa
nies
to in
vest
in le
adin
g-ed
ge te
chno
logi
es a
nd p
roce
sses
to in
crea
se p
rodu
ctiv
ity a
nd
com
petit
iven
ess.
No lo
nger
acc
eptin
g ap
plic
atio
ns37
Jobs
and
Pro
sper
ity
Fund
Prov
ides
fina
ncia
l ass
ista
nce
to c
ompa
nies
inve
stin
g in
pro
ject
s re
late
d to
pro
duct
ivity
, inn
ovat
ion
and
expo
rts to
en
able
them
to c
ompe
te g
loba
lly (n
ew p
rogr
am in
trodu
ced
in 2
015)
.Ac
tive
67,2
18
Min
istry
of E
cono
mic
Dev
elop
men
t, Em
ploy
men
t and
Infra
stru
ctur
e—Ot
her S
uppo
rt Pr
ogra
ms
58,4
05Yo
uth
Supp
ort
Prog
ram
sPr
ogra
ms,
incl
udin
g On
tario
You
th E
ntre
pren
eurs
hip
Fund
, You
th S
kills
Con
nect
ions
Fun
d, Y
outh
Par
tner
ship
s, a
nd
Stud
ent E
ntre
pren
eurs
hip
Expe
rienc
e-Su
mm
er C
ompa
ny. M
ain
goal
is to
sup
port
and
enco
urag
e en
trepr
eneu
rial
spiri
t in
futu
re b
usin
ess
lead
ers.
Activ
e26
,750
Sect
or S
uppo
rt Gr
ants
Prov
ides
ad-
hoc
gran
ts to
not
-for-p
rofit
org
aniza
tions
for b
usin
ess
and
econ
omic
dev
elop
men
t, in
nova
tion
and
com
mer
cial
izatio
n, s
cien
ces
and
rese
arch
and
/or t
rade
and
inve
stm
ent.
Initi
ativ
es s
uppo
rted
incl
ude
rese
arch
st
udie
s, c
onfe
renc
es, b
usin
ess
foru
ms,
and
net
work
ing
even
ts.
Activ
e31
,163
Com
mun
ities
in
Tran
sitio
n As
sist
s co
mm
uniti
es a
nd in
dust
ry s
ecto
rs fa
cing
eco
nom
ic d
evel
opm
ent c
halle
nges
suc
h as
pla
nt c
losu
res,
si
gnifi
cant
job
loss
es, a
nd in
dust
ry-w
ide
rest
ruct
urin
g by
pro
vidi
ng fl
exib
le, c
usto
mize
d as
sist
ance
not
ava
ilabl
e un
der o
ther
Ont
ario
gov
ernm
ent p
rogr
ams.
Activ
e42
8

201Economic Development and Employment Programs
Chap
ter 3
• VF
M S
ectio
n 3.
04
Stat
us of
Pro
gram
2014
–15
Actu
alPr
ogra
m N
ame
Desc
riptio
nas
of M
arch
201
5Fu
ndin
g ($
000)
Inve
stm
ent R
eady
: Ce
rtifie
d Si
te P
rogr
amPr
ovid
es fi
nanc
ial a
nd in
tern
atio
nal m
arke
ting
supp
ort t
o pu
blic
and
priv
ate
indu
stria
l lan
d ow
ners
who
su
cces
sful
ly c
ompl
ete
a se
t of r
equi
rem
ents
and
due
dili
genc
e on
thei
r pro
perty
to e
nsur
e it
is c
ertifi
ed fo
r de
velo
pmen
t. Th
e ce
rtifie
d pr
oper
ties
are
used
to a
ttrac
t inv
estm
ents
to O
ntar
io.
Activ
e64
Min
istry
of A
borig
inal
Affa
irs7,
980
Mét
is E
cono
mic
De
velo
pmen
t Fun
dPr
ovid
es fu
ndin
g an
d su
ppor
t for
Mét
is b
usin
esse
s. T
his
fund
was
cre
ated
pur
suan
t to
the
term
s of
the
Mét
is
Econ
omic
Dev
elop
men
t Agr
eem
ent w
ith th
e M
étis
Voy
ageu
r Dev
elop
men
t Fun
d, In
c.Ac
tive
3,00
0
Abor
igin
al E
cono
mic
De
velo
pmen
t Fun
dAs
sist
s Ab
orig
inal
com
mun
ities
in th
e de
velo
pmen
t of l
ong-
term
eco
nom
ic s
trate
gies
, pro
vide
s gr
ants
and
fin
anci
ng fo
r Abo
rigin
al b
usin
esse
s, a
nd s
uppo
rts p
rovi
nce-
wide
and
regi
onal
ski
lls tr
aini
ng a
nd p
roje
ct fi
nanc
ing.
Th
is p
rogr
am is
und
er th
e au
thor
ity o
f the
Jobs
and
Pro
sper
ity F
und.
Activ
e4,
980
Min
istry
of Fi
nanc
e50
0Gr
ants
in S
uppo
rt of
Eco
nom
ic a
nd
Fina
ncia
l Ser
vice
s Po
licy
Rese
arch
Thre
e-ye
ar a
gree
men
t with
Toro
nto
Fina
ncia
l Ser
vice
s Al
lianc
e to
hel
p im
plem
ent a
Fin
anci
al S
ervi
ces
Sect
or
Stra
tegy
pub
lic-p
rivat
e pa
rtner
ship
to im
prov
e co
mpe
titiv
enes
s an
d gr
owth
of fi
nanc
ial s
ervi
ces
sect
or.
Activ
e50
0
Min
istry
of N
atur
al R
esou
rces
and
Fore
stry
972
Onta
rio W
ood
Prom
otio
n Pr
ogra
m
Supp
orts
not
-for-p
rofit
org
aniza
tions
and
pos
t-sec
onda
ry in
stitu
tions
in e
duca
tion
and
rese
arch
to e
xpan
d m
arke
ts
for w
ood
prod
ucts
, enc
oura
ge th
e de
velo
pmen
t of v
alue
-add
ed w
ood
prod
ucts
, and
incr
ease
pub
lic a
ware
ness
of
sust
aina
ble
fore
st m
anag
emen
t pra
ctic
es. P
rogr
am a
lso
aim
s to
fost
er a
cul
ture
of w
ood
use
in O
ntar
io th
roug
h tra
inin
g fo
r arc
hite
cts,
eng
inee
rs a
nd o
ther
bui
lder
s on
inno
vativ
e an
d ef
fect
ive
uses
of w
ood
in c
onst
ruct
ion.
Activ
e97
2
Min
istry
of N
orth
ern
Deve
lopm
ent a
nd M
inin
g16
9,40
9No
rther
n In
dust
rial
Elec
trici
ty R
ate
Prog
ram
Help
s No
rther
n On
tario
’s la
rges
t ind
ustri
al e
lect
ricity
use
rs re
duce
thei
r pow
er c
osts
, sus
tain
jobs
and
mai
ntai
n gl
obal
com
petit
iven
ess.
The
pro
gram
offe
rs a
reba
te o
n el
ectri
city
exp
endi
ture
s ba
sed
on 2
cen
ts/k
Wh
with
a
max
imum
ann
ual r
ebat
e of
$20
mill
ion
per c
ompa
ny.
Activ
e10
7,85
7
North
ern
Onta
rio
Herit
age
Fund
Co
rpor
atio
n
Offe
rs a
var
iety
of p
rogr
ams
to s
uppo
rt bu
sine
ss p
rodu
ctiv
ity a
nd e
xpan
sion
, and
glo
bal i
nves
tmen
t in
north
ern
com
mun
ities
. Als
o su
ppor
ts d
evel
opm
ent a
nd c
omm
erci
aliza
tion
of n
ew te
chno
logi
es th
at w
ill c
ontri
bute
to
pros
perit
y in
Nor
ther
n On
tario
, and
fost
ers
colla
bora
tion
and
partn
ersh
ips
amon
g th
e pr
ivat
e se
ctor
, aca
dem
ic
inst
itutio
ns, a
nd re
sear
ch in
stitu
tes.
Activ
e60
,000
Smal
l Bus
ines
s En
terp
rise
Cent
rePr
ovid
es a
ssis
tanc
e to
ent
repr
eneu
rs a
nd s
mal
l bus
ines
ses
to s
tart
and
grow
thei
r bus
ines
ses
in c
omm
uniti
es
acro
ss n
orth
ern
Onta
rio. E
ligib
le b
usin
esse
s ar
e th
ose
with
less
than
five
yea
rs o
f ope
ratio
ns a
nd fe
wer t
han
10 e
mpl
oyee
s.
Activ
e70
0
Vet A
ssis
tanc
e Pr
ogra
mPr
omot
es v
iabi
lity
of th
e liv
esto
ck in
dust
ry b
y su
ppor
ting
prov
isio
n of
vet
erin
ary
serv
ices
to li
vest
ock
prod
ucer
s in
des
igna
ted
unde
rser
vice
d ar
eas
in n
orth
ern
and
sout
hern
Ont
ario
. Con
ditio
nal g
rant
s ar
e pr
ovid
ed to
offs
et
trave
l, te
mpo
rary
ser
vice
, and
con
tinui
ng e
duca
tion
cost
s of
par
ticip
atin
g ve
terin
aria
ns. T
he p
rogr
am is
del
iver
ed
in c
olla
bora
tion
with
par
ticip
atin
g pr
oduc
ers
and
vete
rinar
ian
asso
ciat
ions
.
Activ
e85
2

2015 Annual Report of the Office of the Auditor General of Ontario202
Chap
ter 3
• VF
M S
ectio
n 3.
04
Stat
us of
Pro
gram
2014
–15
Actu
alPr
ogra
m N
ame
Desc
riptio
nas
of M
arch
201
5Fu
ndin
g ($
000)
Min
istry
of R
esea
rch
and
Inno
vatio
n11
9,61
6Co
mm
erci
aliza
tion
and
Inno
vatio
n Ne
twor
k Su
ppor
t
Prov
ides
pro
gram
s an
d se
rvic
es to
tech
nolo
gy-b
ased
inno
vativ
e en
trepr
eneu
rs a
nd fi
rms
to g
ener
ate
new
bu
sine
ss, c
ompa
nies
, and
jobs
. Als
o pr
ovid
es e
duca
tiona
l and
fund
ing
prog
ram
s th
at fo
cus
on s
treng
then
ing
entre
pren
euria
l tal
ent,
crea
ting
glob
ally
com
petit
ive
busi
ness
es a
nd s
uppo
rt in
nova
tors
thro
ugho
ut th
eir p
roce
ss.
Activ
e59
,929
Yout
h Jo
b St
rate
gySu
ppor
ts c
ampu
s-lin
ked
indu
stria
l res
earc
h, d
evel
opm
ent,
com
mer
cial
izatio
n, a
nd e
ntre
pren
eurs
hip
by y
outh
.Ac
tive
26,0
00
Busi
ness
Eco
syst
em
Supp
ort F
und
Supp
orts
indu
stry
-aca
dem
ic p
artn
ersh
ips
to a
ccel
erat
e pr
oduc
t dev
elop
men
t and
sal
es in
glo
bal m
arke
ts,
incl
udin
g gr
een
chem
istry
sol
utio
ns, c
omm
unic
atio
n-en
able
d ap
plic
atio
ns, d
igita
l med
ia, m
obile
com
putin
g ap
plic
atio
ns, a
nd a
dvan
ced
med
ical
ass
istiv
e te
chno
logi
es.
Activ
e2,
019
Onta
rio E
mer
ging
Te
chno
logi
es F
und
Supp
orts
inno
vativ
e, h
igh-
grow
th c
ompa
nies
with
ven
ture
cap
ital i
nves
tmen
ts m
ade
in p
artn
ersh
ip w
ith q
ualifi
ed
inve
stor
s.
Activ
e8,
000
Gran
ts in
Sup
port
of R
esea
rch
and
Inno
vatio
n
Deliv
ers
appr
oved
com
mer
cial
izatio
n pr
ogra
ms
and
busi
ness
dev
elop
men
t pro
gram
s, a
nd d
evel
ops
and
impl
emen
ts a
ven
ture
-cap
ital s
trate
gy.
Activ
e7,
970
Inno
vatio
n De
mon
stra
tion
Fund
Su
ppor
ts e
mer
ging
tech
nolo
gy c
ompa
nies
at t
he p
ilot-
or d
emon
stra
tion-
proj
ect s
tage
, with
focu
s on
new
bio
-ba
sed,
env
ironm
enta
l and
alte
rnat
ive
tech
nolo
gies
. Pro
gram
put
on
hold
in S
epte
mbe
r 201
3 an
d no
t acc
eptin
g ne
w ap
plic
atio
ns.
On h
old
10,0
00
Onta
rio L
ife S
cien
ces
Com
mer
cial
izatio
n St
rate
gy
Com
bine
s ex
istin
g an
d ne
w On
tario
life
sci
ence
s in
itiat
ives
into
a c
o-or
dina
ted
plan
, and
sup
ports
ear
ly-s
tage
bi
otec
h fir
ms,
co-
ordi
natio
n of
clin
ical
tria
ls a
nd c
reat
ion
of a
n in
dust
ry a
ssoc
iatio
n.Ac
tive
1,48
3
Smal
l Bus
ines
s En
terp
rise
Cent
res
Prov
ides
pro
gram
s an
d se
rvic
es th
at s
uppo
rt st
art-u
p bu
sine
sses
and
gro
wth
in c
omm
uniti
es, i
nclu
ding
trai
ning
an
d m
ento
ring
for e
ntre
pren
eurs
and
sm
all b
usin
esse
s.Ac
tive
4,21
5
Min
istry
of To
urism
, Cul
ture
and
Spo
rt97
,843
Gran
ts in
Sup
port
of
Tour
ism
Reg
ions
Pr
ovid
es fu
ndin
g to
13
Regi
onal
Tour
ism
Org
aniza
tions
, whi
ch a
re in
depe
nden
t, in
dust
ry-le
d, n
ot-fo
r-pro
fit
orga
niza
tions
with
a m
anda
te to
enh
ance
regi
onal
tour
ism
dev
elop
men
t by
colla
bora
ting
with
indu
stry
par
tner
s in
m
arke
ting,
pro
duct
dev
elop
men
t, wo
rkfo
rce
deve
lopm
ent a
nd in
vest
men
t attr
actio
ns.
Activ
e38
,971
Onta
rio M
edia
De
velo
pmen
t Co
rpor
atio
n Fu
ndin
g
Prom
otes
, enh
ance
s, a
nd le
vera
ges
inve
stm
ent,
jobs
and
orig
inal
con
tent
cre
atio
n in
film
and
tele
visi
on,
inte
ract
ive
digi
tal m
edia
, mus
ic, a
nd b
ook
and
mag
azin
e pu
blis
hing
.Ac
tive
22,9
90
Onta
rio M
usic
Fun
d He
lps
crea
te jo
bs, b
uild
s on
opp
ortu
nitie
s fo
r gro
wth
in th
e m
usic
indu
stry
, and
adv
ance
s go
vern
men
t’s L
ive
Mus
ic S
trate
gy to
pos
ition
Ont
ario
as
a le
adin
g ju
risdi
ctio
n in
whi
ch to
reco
rd a
nd p
erfo
rm m
usic
.Ac
tive
15,0
00
Tour
ism
Dev
elop
men
t Fu
ndSu
ppor
ts p
roje
cts
that
gen
erat
e ec
onom
ic b
enefi
ts th
roug
h in
crea
sed
tour
ism
, vis
itor s
pend
ing,
inve
stm
ent,
and
impr
oved
cus
tom
er s
ervi
ce.
Activ
e75
8
Cele
brat
e On
tario
Prov
ides
pro
ject
-bas
ed fu
ndin
g to
new
or e
xistin
g On
tario
eve
nts
to e
nhan
ce p
rogr
ams,
act
ivitie
s an
d se
rvic
es. A
lso
supp
orts
inno
vatio
ns th
at w
ill le
ad to
long
-term
impr
ovem
ents
, sus
tain
abili
ty, a
nd a
ttrac
tion
of a
dditi
onal
tour
ists
.Ac
tive
20,
124

203Economic Development and Employment Programs
Chap
ter 3
• VF
M S
ectio
n 3.
04
Stat
us of
Pro
gram
2014
–15
Actu
alPr
ogra
m N
ame
Desc
riptio
nas
of M
arch
201
5Fu
ndin
g ($
000)
Min
istry
of Tr
aini
ng, C
olle
ges a
nd U
nive
rsiti
es98
3,01
3Em
ploy
men
t Tra
inin
g an
d Su
ppor
t Pr
ogra
ms
Vario
us p
rogr
ams
assi
st O
ntar
io re
side
nts
with
job
train
ing
and
oppo
rtuni
ties.
Fin
anci
al s
uppo
rts a
lso
prov
ided
to
bus
ines
ses
for a
ppre
ntic
eshi
p pr
ogra
ms.
Em
ploy
men
t Ont
ario
pro
gram
pro
vide
s em
ploy
men
t ser
vice
s to
bot
h em
ploy
ers
and
indi
vidu
als
seek
ing
a jo
b.
Activ
e98
3,01
3
Min
istry
of A
gric
ultu
re, F
ood
and
Rura
l Affa
irs39
4,35
0Bu
sine
ss R
isk
Man
agem
ent
Prog
ram
s
Com
preh
ensi
ve s
uite
of f
eder
al-p
rovi
ncia
l-ter
ritor
ial B
usin
ess
Risk
Man
agem
ent p
rogr
ams
offe
rs p
rote
ctio
n to
fa
rmer
s ag
ains
t sev
ere
mar
ket v
olat
ility
and
dis
aste
rs. C
ore
prog
ram
s in
clud
e: A
griS
tabi
lity,
AgriI
nsur
ance
, and
Ag
riInv
est.
In O
ntar
io, A
gric
orp,
an
Onta
rio a
genc
y, ad
min
iste
rs A
griS
tabi
lity
and
AgriI
nsur
ance
(als
o kn
own
as
Prod
uctio
n In
sura
nce)
. Agr
iInve
st is
adm
inis
tere
d by
the
fede
ral g
over
nmen
t. Th
ese
prog
ram
s ar
e fu
nded
40%
pr
ovin
cial
ly, 6
0% fe
dera
lly.
Activ
e77
,500
Risk
Man
agem
ent
Prog
ram
Prog
ram
allo
ws O
ntar
io p
rodu
cers
to o
ffset
loss
es c
ause
d by
fact
ors
outs
ide
farm
ers’
con
trol,
such
as
low
co
mm
odity
pric
es a
nd ri
sing
pro
duct
ion
cost
s. T
he p
rogr
am is
fund
ed u
p to
$10
0 m
illio
n pe
r yea
r, in
clud
ing
adm
inis
trativ
e co
sts.
It c
ompl
emen
ts th
e Bu
sine
ss R
isk
Man
agem
ent P
rogr
ams
fund
ed jo
intly
by
the
Onta
rio a
nd
fede
ral g
over
nmen
ts.
Activ
e11
9,50
0
Hors
e Ra
cing
Tr
ansi
tion
Assi
stan
ce
Prog
ram
Help
s ra
cetra
cks
trans
ition
to a
new
long
-term
fund
ing
mod
el fo
llowi
ng th
e wi
ndin
g do
wn o
f the
Ont
ario
Lot
tery
an
d Ga
min
g Co
rpor
atio
n’s
Slot
s-At
-Rac
etra
ck P
rogr
am.
Activ
e10
0,00
0
Onta
rio E
than
ol
Grow
th F
und
Supp
orts
con
stru
ctio
n an
d op
erat
ion
of e
than
ol p
lant
s to
hel
p m
eet d
eman
d cr
eate
d by
gov
ernm
ent e
than
ol
regu
latio
ns.
Activ
e25
,718
Grow
ing
Forw
ard
Help
s fa
rm, f
ood
and,
agr
i-pro
duct
bus
ines
ses
and
orga
niza
tions
iden
tify
oppo
rtuni
ties
to g
row
profi
ts a
nd
mar
kets
, and
man
age
risks
.Ac
tive
45,2
22
Rura
l Eco
nom
ic
Deve
lopm
ent a
nd
Loca
l Foo
ds
Rura
l Eco
nom
ic D
evel
opm
ent,
esta
blis
hed
in 2
001,
hel
ps d
iver
sify
rura
l bus
ines
s cl
imat
es; c
reat
e/re
tain
long
-te
rm jo
bs; d
evel
op c
o-or
dina
ted
loca
l/re
gion
al a
ppro
ach
to e
cono
mic
dev
elop
men
t; fo
ster
cre
atio
n of
alli
ance
s an
d pa
rtner
ship
s; a
nd d
evel
op to
ols
and
reso
urce
s to
enh
ance
rura
l eco
nom
ic d
evel
opm
ent.
Activ
e23
,551
Loca
l Foo
ds, e
stab
lishe
d in
201
3, p
rom
otes
loca
l foo
d as
par
t of a
bro
ader
stra
tegy
to s
treng
then
Ont
ario
’s a
gri-
food
indu
stry
.
Rura
l Sum
mer
Jobs
Help
s ru
ral e
mpl
oyer
s cr
eate
stu
dent
sum
mer
jobs
.Ac
tive
2,85
9
Tota
l1,
962,
588

2015 Annual Report of the Office of the Auditor General of Ontario204
Chap
ter 3
• VF
M S
ectio
n 3.
04
Appendix 2—Selected Recent Studies into the Ontario EconomyPrepared by the Office of the Auditor General of Ontario
Ontario Chamber of Commerce. (2015). Ontario: Constraining Costs and Staying Competitive in the Electricity Market.The Chamber is an independent, non-partisan network that represents businesses across Ontario, as well as the province’s 136 local chambers of commerce and boards of trade. This report examined trends for elec-tricity prices in Ontario through consultations with key stakeholders, including sector experts, businesses and government organizations. The report includes recommendations for the government to help mitigate rising electricity costs in Ontario.
Ontario Chamber of Commerce and the Mowat Centre. (2015). Emerging Stronger, Ontario’s Path from Recovery to Growth.The Chamber and the Mowat Centre jointly publish the annual Emerging Stronger report, a five-year project aimed at spurring growth and prosperity in Ontario by providing clear and achievable recommen-dations to business, government, and the not-for-profit sector. The Mowat Centre, an independent public-policy think tank at the University of Toronto, is funded by the Ontario government.
Institute for Competitiveness and Prosperity. (2013). Course Correction: Charting a New Road Map for Ontario.Institute for Competitiveness and Prosperity. (2015). Open for Business: Strategies for Improving Ontario’s Business Attractiveness.The Institute for Competitiveness and Prosperity, an independent, not-for-profit organization funded by the government of Ontario, has a mandate to increase public understanding of macro- and microeconomic factors behind Ontario’s economic progress. It serves as the research arm of the Task Force on Competitive-ness, Productivity and Economic Progress, announced in the April 2001 Speech from the Throne. Course Cor-rection evaluates Ontario’s progress as it seeks to increase its competitiveness and prosperity, and assesses whether it is meeting the Task Force’s Road to Prosperity 2020 goals set in 2001. Open for Business is based on research comparing Ontario to regional competitors to identify areas where the government should act to improve business attractiveness. The report aims to advise government on how to get the best return on investment for its new Jobs and Prosperity Fund, while improving long-term business conditions in the province.
Education, Skills and Economy Policy Committee. (2015). Ontario’s Strategic Investment Framework.In November 2014, a Strategic Investment Framework (Framework) was developed by the Education, Skills and Economy Policy Committee, composed of ministers and members of caucus appointed by the Premier. In January 2015, the government announced the Framework as the Ministry’s new strategy. The Frame-work consisted of guiding principles for future economic development and employment investments that focus on productivity growth, stimulating innovation, and promoting exports. At the time of our field work in July 2015, the Ministry had not yet finalized any contracts under the new Framework.

205Economic Development and Employment Programs
Chap
ter 3
• VF
M S
ectio
n 3.
04
Business Support Programs Review Panel. (2014). Report of the Expert Panel Examining Ontario’s Business Support Programs (Expert Panel). The ministries of Finance and Economic Development, Employment and Infrastructure jointly appointed a panel of experts to review the province’s business support programs. The report provided 26 recommenda-tions to the Ontario government.
The Fraser Institute. (2014). Can Canada Prosper Without a Prosperous Ontario?The Fraser Institute is an independent Canadian public policy research and education organization whose mission is to measure the quality of life of Canadians by examining the effects of government policies and entrepreneurship on the welfare of Canadians. This report examined the influence of Ontario on Canada’s economic performance as a whole.
The Commission on the Reform of Ontario’s Public Services, commonly known as the Drummond Report. (2012). Public Services for Ontarians: A Path to Sustainability and Excellence.The report, written by economist Don Drummond, was intended to advise the government on how to reduce the province’s debt. It provided recommendations on how to improve the value for money of a wide range of government programs, including business supports, transfer payments, corporate income-tax credits, and employment and training services.
Jobs and Prosperity Council. (2012). Advantage Ontario.The Council, composed of 14 leaders from business, labour and other sectors appointed by the Premier, was asked to advise on the action Ontario needed to take to seize new opportunities. Its report included recom-mendations that centred on more international trade, increased productivity, and more innovation.
Ministry of Economic Development and Trade, now Ministry of Economic Development, Employ-ment and Infrastructure. (2011). Cross-Ministry Support to Ontario Businesses Final Report.Produced by an external firm hired by the Ministry to assess the performance of direct business-support programs by all ministries, the Report researched economic development initiatives in Michigan, New York, California, and Quebec, and provided an analysis of various options, such as the phasing out of pro-grams with lower performance ratings across, and within, ministries.