3.08 cultural competency
TRANSCRIPT
3.08 Cultural competency This measure reports on aspects of cultural competency of health services, including discrimination and barriers to accessing services for Indigenous Australians
Introduction This is no. 54 of 68 measures in the Aboriginal and Torres Strait Islander Health Performance Framework 2014 report: detailed analyses. This report provides information on a range of measures of health status, determinants of health and the health system performance relating to Aboriginal and Torres Strait Islander people.
The Framework comprises 3 tiers:
Tier 1—Health status and outcomes
Tier 2—Determinants of health
Tier 3—Health system performance.
The full report, including a comprehensive description of all data sources used in the report, and notes about the data quality is available from <http://www.aihw.gov.au/publication-detail/?id=60129550779>.
Tables referenced are available from <http://www.aihw.gov.au/indigenous-data/health-performance-framework/>.
Measure 54 of 68
Aboriginal and Torres Strait Islander Health Performance Framework 2014 report: detailed analyses
2 Measure 3.08: Cultural competency
Data sources • Australian Aboriginal and Torres Strait Islander Health Survey • National Aboriginal and Torres Strait Islander Social Survey • National Aboriginal and Torres Strait Islander Health Survey • National Hospital Morbidity Database • Census of Population and Housing • Online Services Report data collection. For more information, see ‘Data sources and quality’ at the end of this measure.
Data analyses For more information related to cultural competency, see measures 1.05, 1.11, 1.18, 1.23, 1.24, 3.03, 3.09, 3.10, 3.12, 3.13 and 3.22. See also ‘Other related information’ at the end of this measure.
The following data are presented for this measure:
• Self-reported data on cultural competency, see tables 3.08.1–13, 3.08.17, 3.13.8 and 3.13.9 • Discharge from hospital against medical advice, see Table 3.09.1 • Primary health care services, see tables 3.08.14, 3.03.12, 3.12.1 and 3.22.11 • Languages spoken at home, see tables 3.08.15–16.
Self-reported data on cultural competency
Current period In 2012–13:
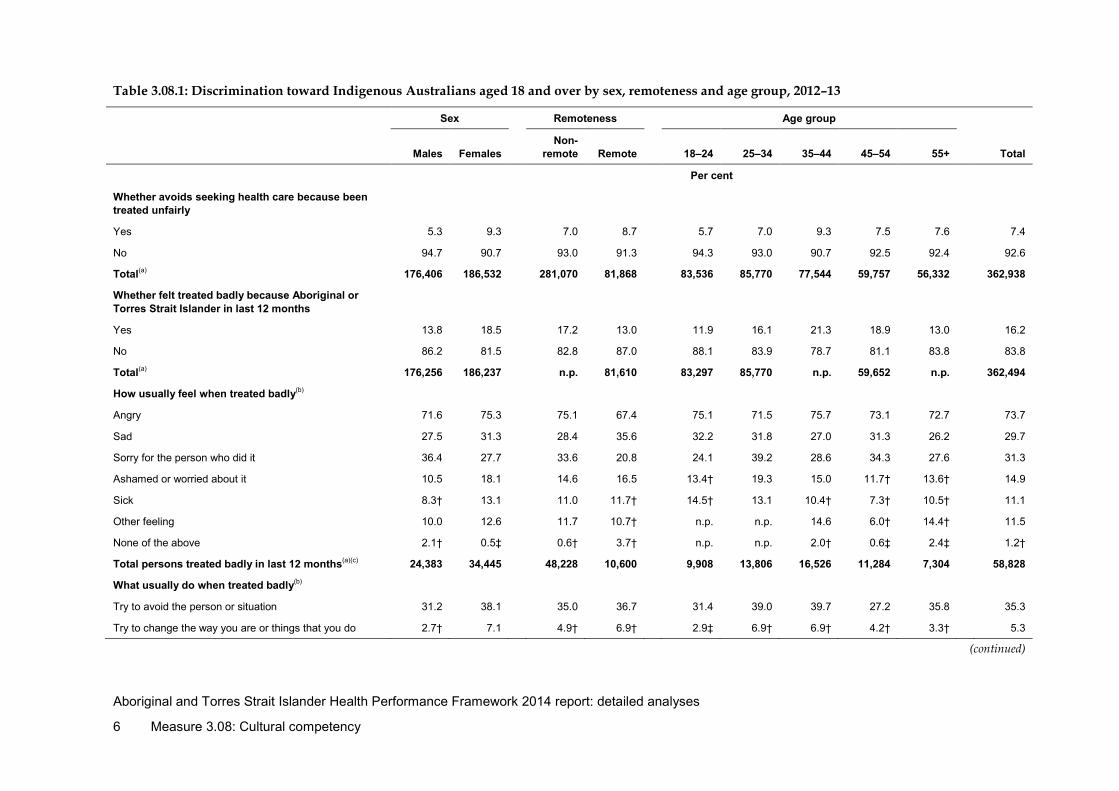
• An estimated 16% of Indigenous Australians felt they were treated badly in the last 12 months because they were Indigenous. Of these, 20% felt they were treated badly by doctors, nurses or other hospital staff (Table 3.08.1).
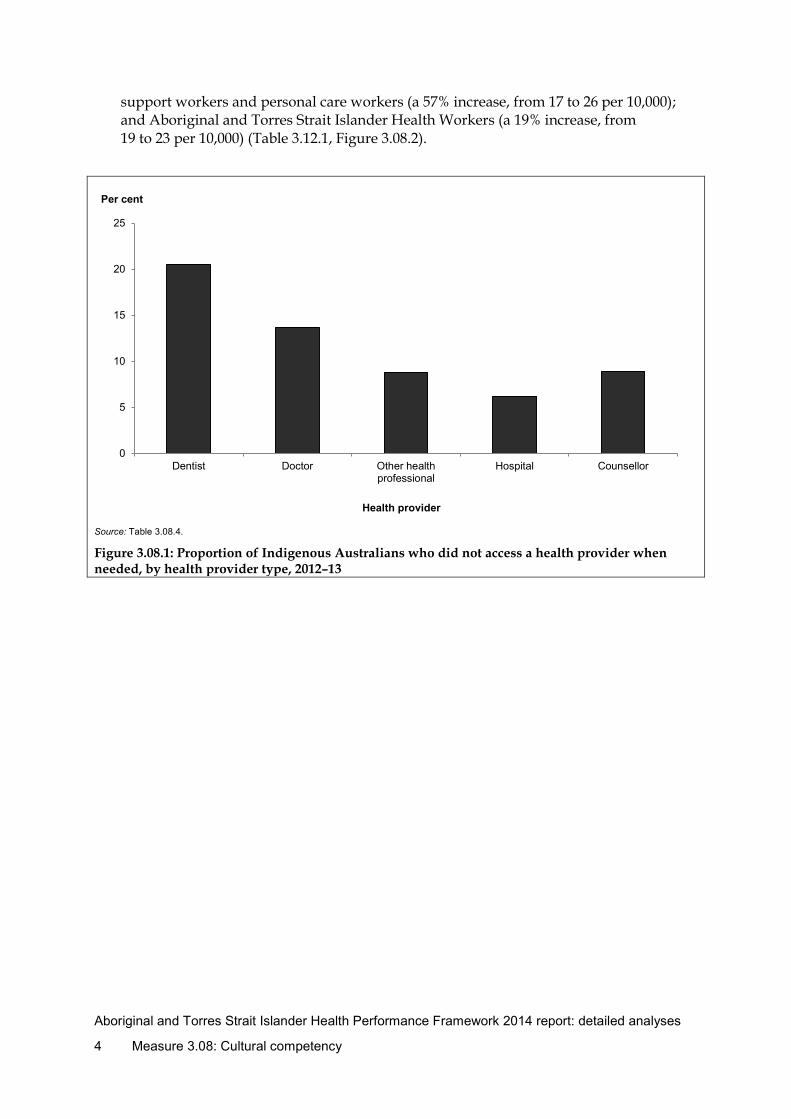
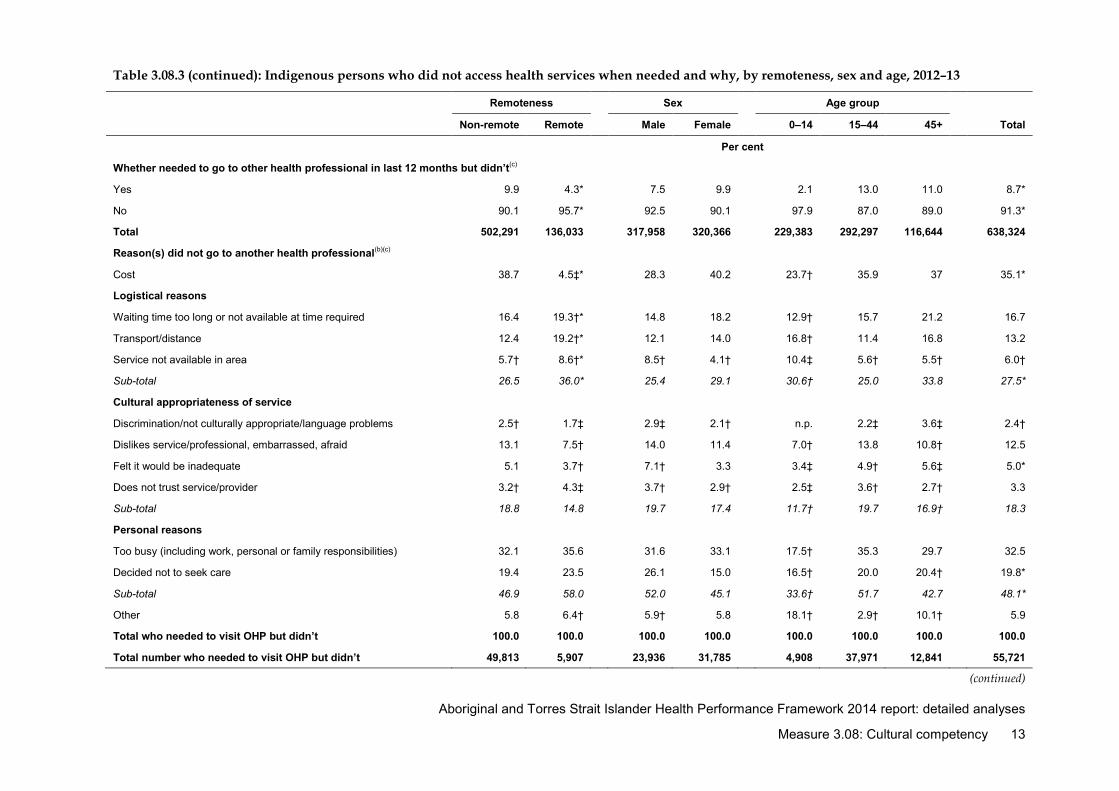
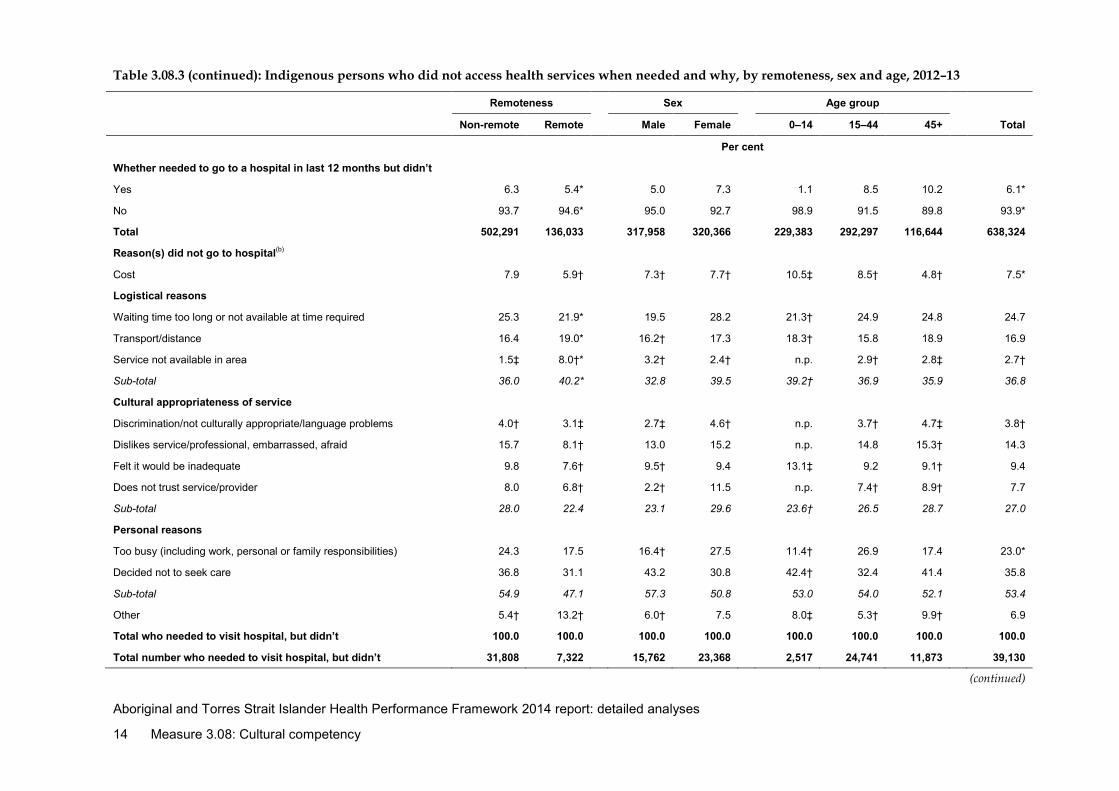
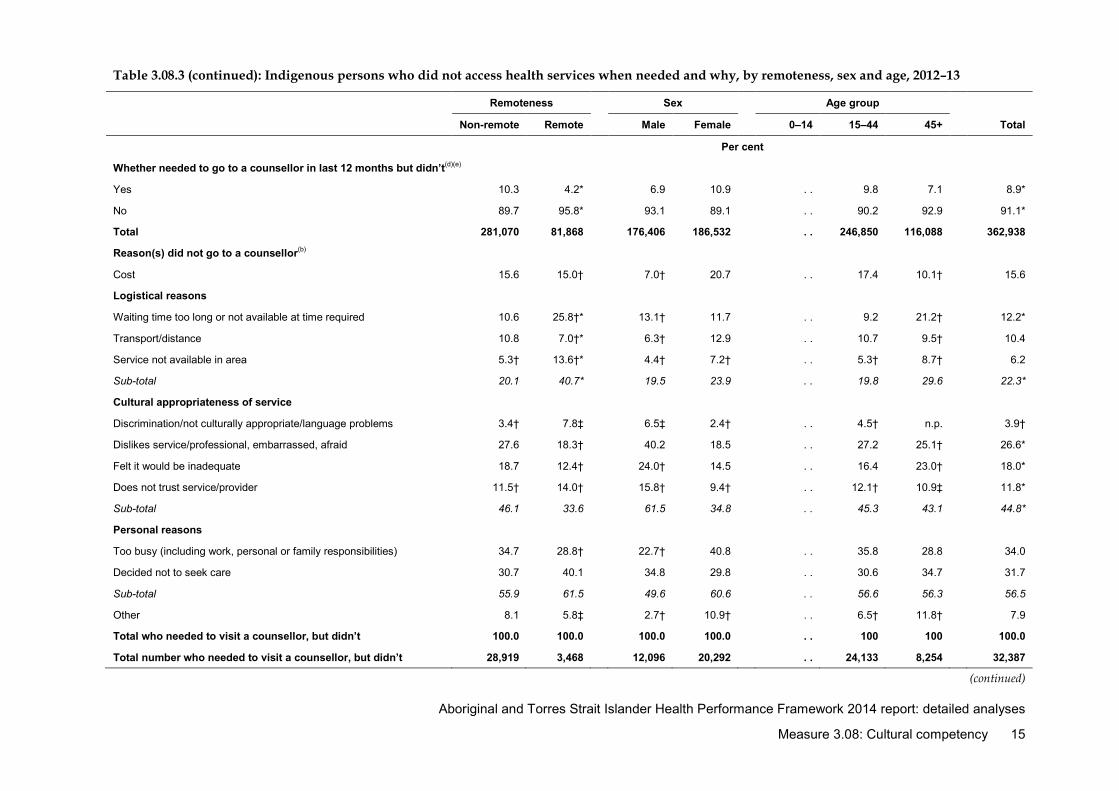
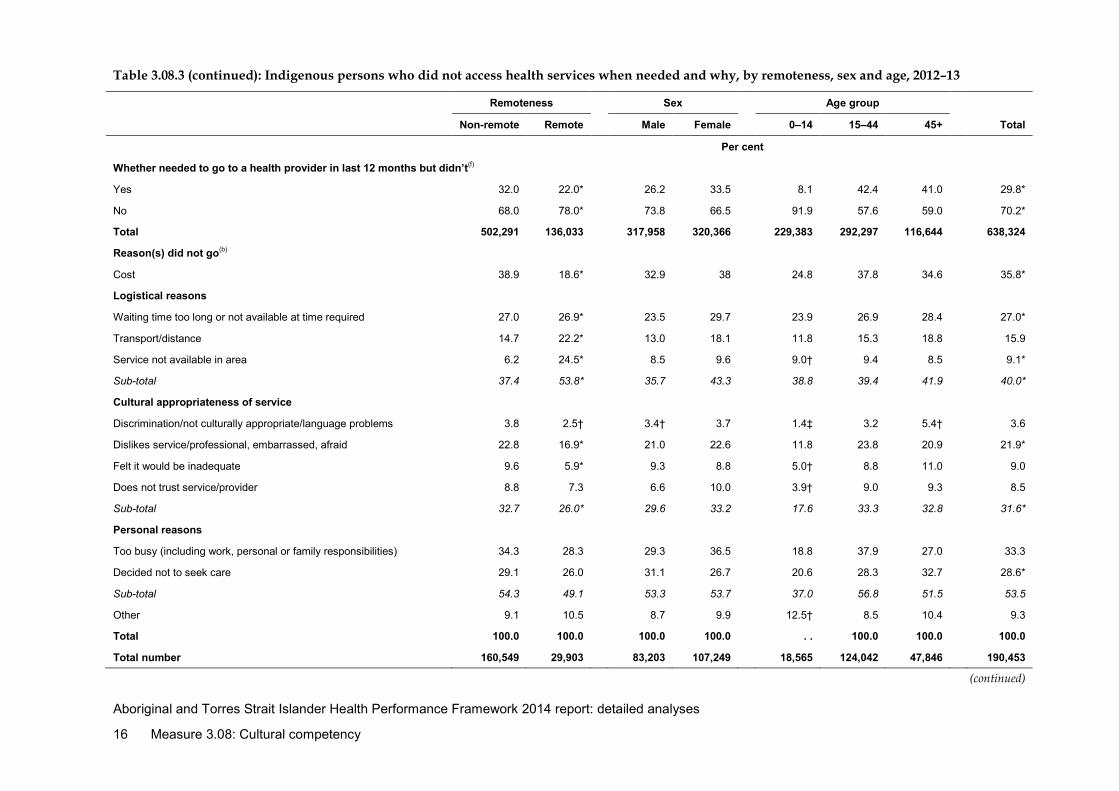
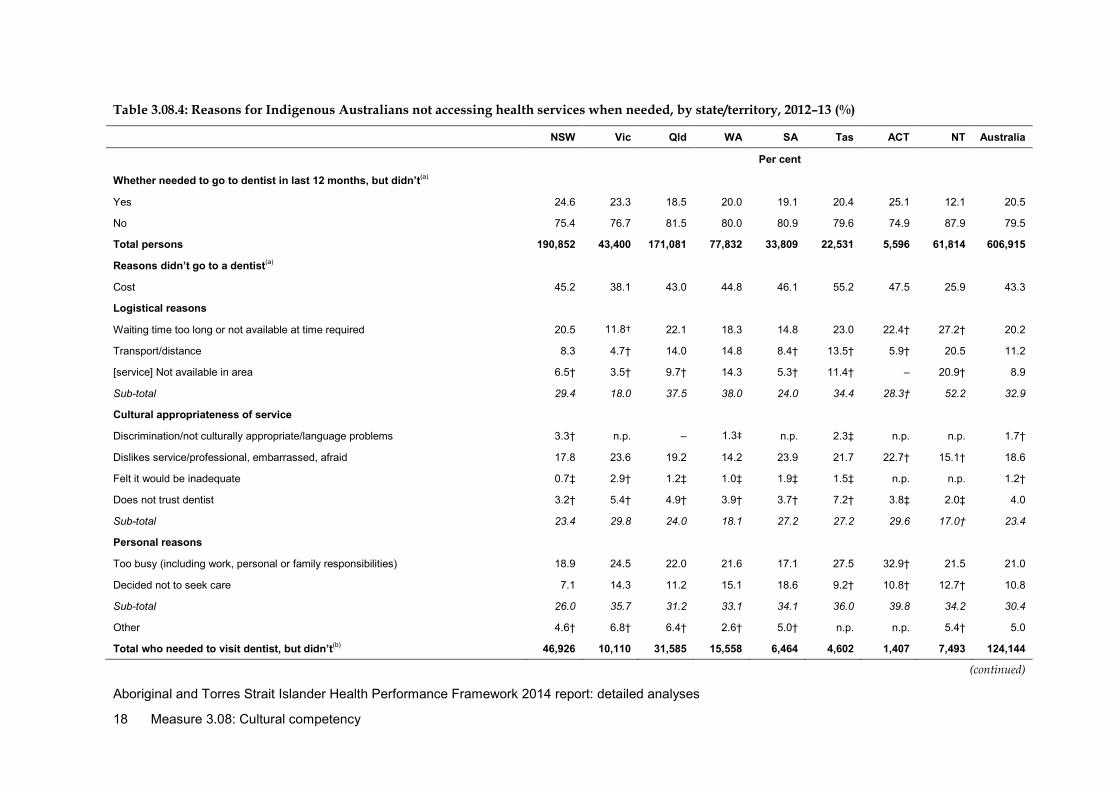
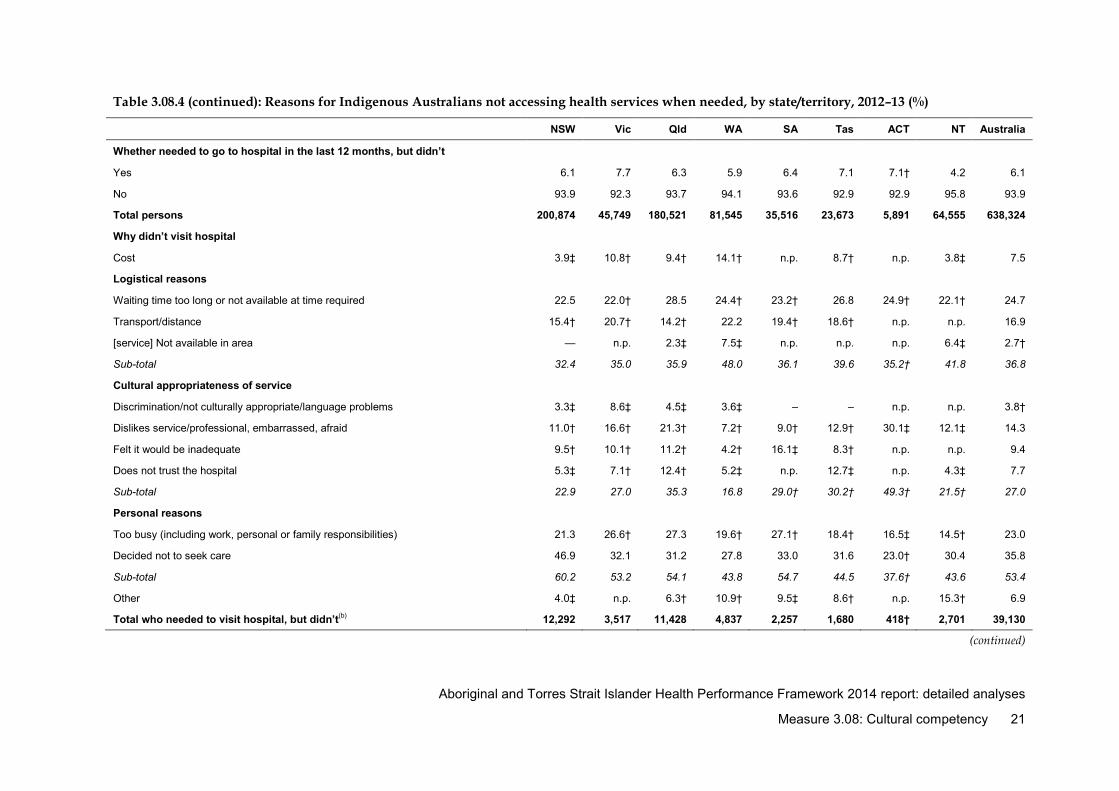
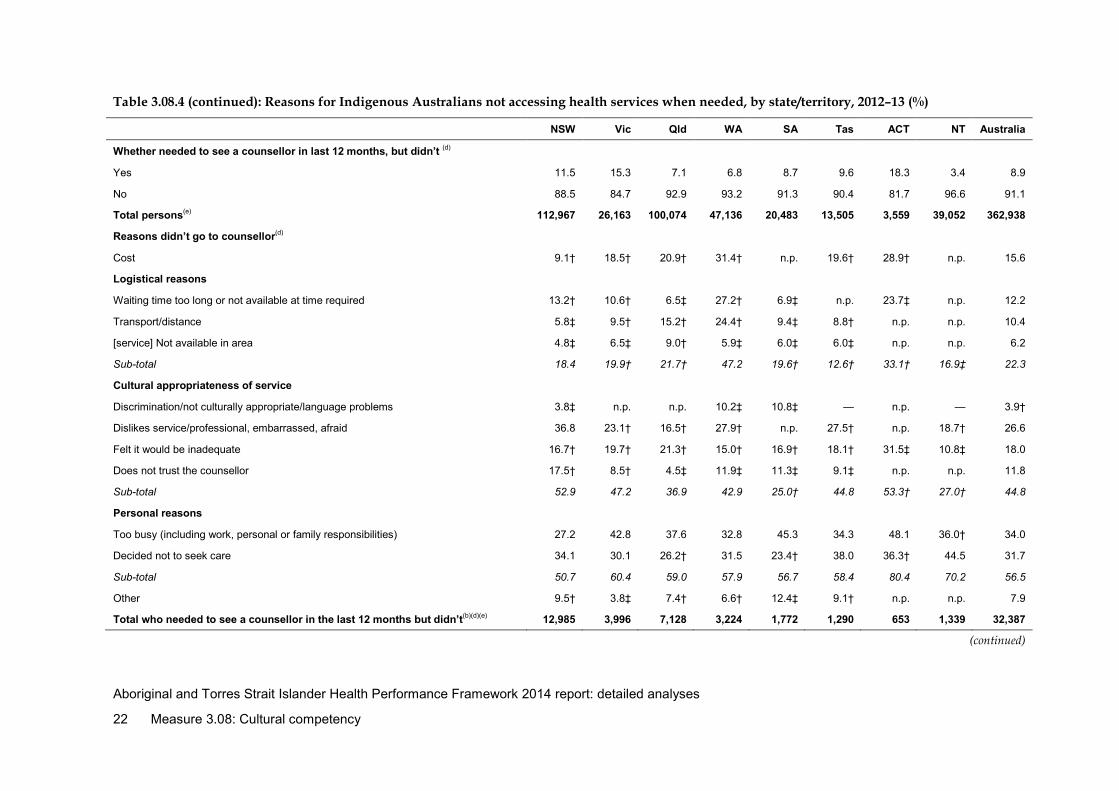
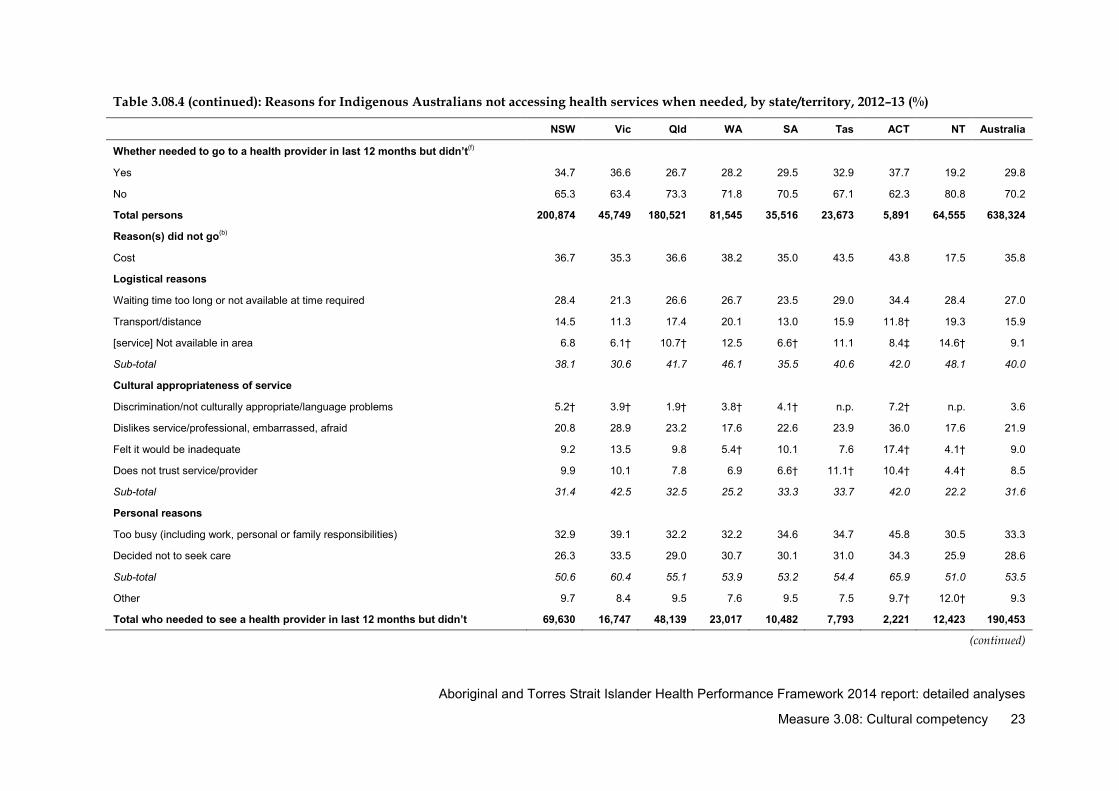
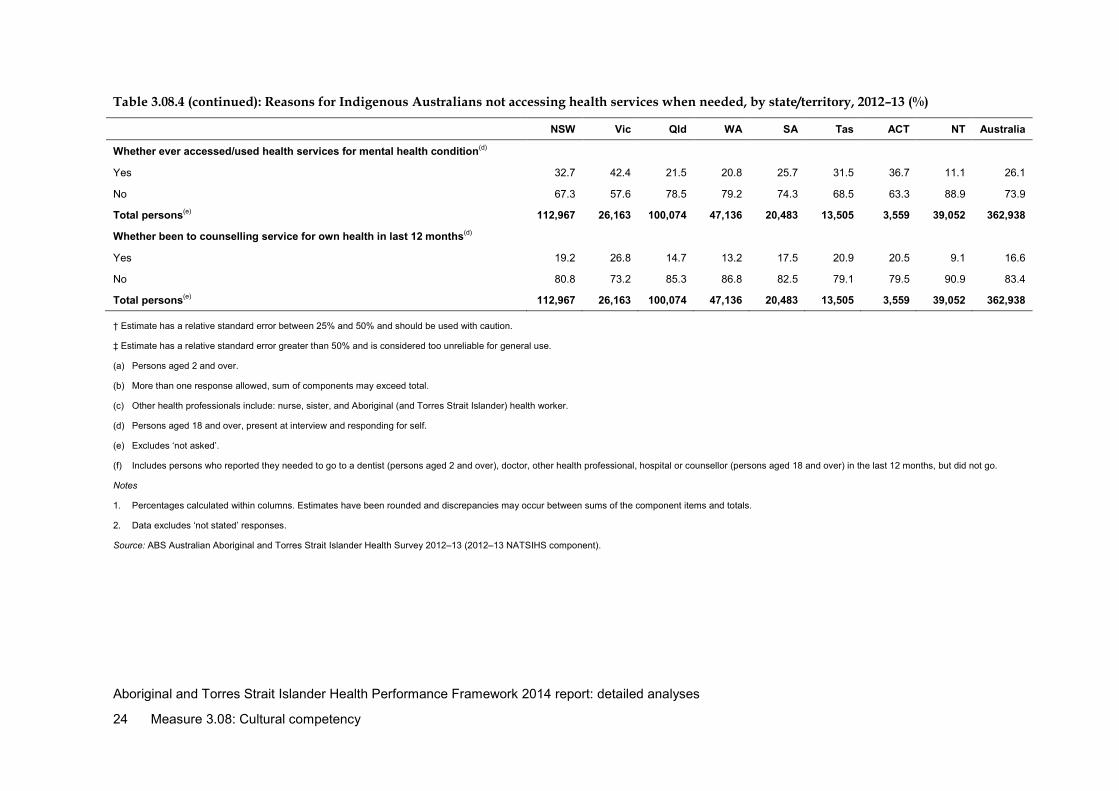
• An estimated 30% of those Indigenous Australians who needed to see a health professional in the last 12 months did not see a health provider when needed. The proportions were highest for those who did not see dentists when needed (21%) and doctors (14%) (Table 3.08.4, Figure 3.08.1).
In 2008, among Indigenous Australians aged 15 and over:
• 8% disagreed or strongly disagreed with the statement, ‘Your doctor can be trusted’ (Table 3.13.8).
• 17% disagreed or strongly disagreed with the statement, ‘Hospitals can be trusted to do the right thing by you’ (Table 3.13.9).
Aboriginal and Torres Strait Islander Health Performance Framework 2014 report: detailed analyses
Measure 3.08: Cultural competency 3
Discharges from hospital against medical advice
Current period In the period July 2011 to June 2013:
• There were 17,494 hospitalisations for Indigenous Australians where the patient left hospital against medical advice or were discharged at their own risk (4.5% of all hospitalisations of Indigenous Australians).
• Indigenous patients were 8 times as likely as non-Indigenous patients to leave hospital against medical advice or be discharged at their own risk (3.6% compared with 0.5%), after taking into account differences in age. The gap was 3.1 percentage points (Table 3.09.1).
Primary health care services
Current period In 2012–13:
• Of 205 Aboriginal and Torres Strait Islander primary health care services: – 95% had accessible and appropriate client and communication feedback mechanisms
– 86% had a formal organisational commitment to achieving culturally safe health care
– 84% had mechanisms for gaining high-level advice on cultural matters affecting service delivery
– 45% included cultural competency in staff performance appraisal processes
– 88% ran a cultural orientation for non-Indigenous staff members (Table 3.08.14).
As at 30 June 2013:
• 14% of all full-time equivalent (FTE) positions within Aboriginal and Torres Strait Islander primary health care services were Aboriginal health workers (Table 3.22.11).
• Indigenous Australians filled 54% of paid FTE positions in Australian Government-funded Aboriginal and Torres Strait Islander primary health care services (AIHW 2014).
• 57% of Aboriginal and Torres Strait Islander substance-use-specific services ran cultural groups (Table 3.03.12).
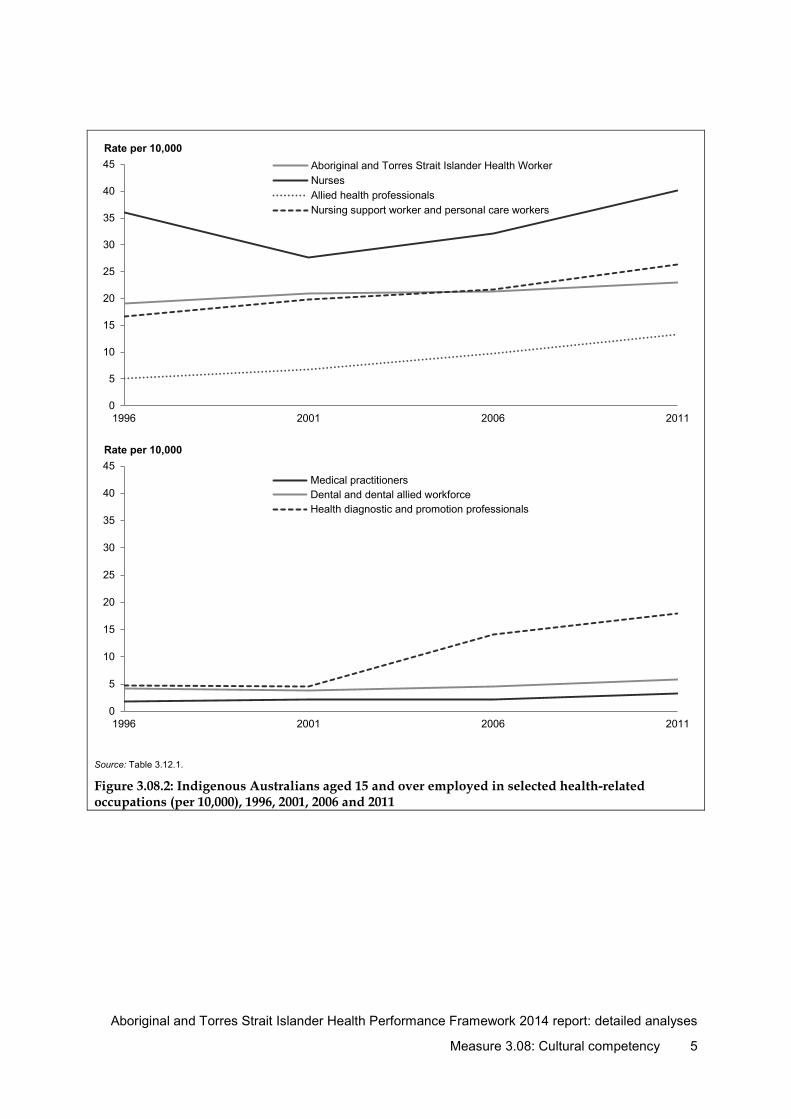
Trend From 1996 to 2011:
• The rate of Indigenous Australians aged 15 and over employed in the health workforce increased from 96 per 10,000 in 1996 to 155 per 10,000 in 2011. This was a significant increase of 70% over the period.
• There was a significant increase in the rate of Indigenous Australians employed as an allied health professional, from 5 per 10,000 in 1996 to 13 per 10,000 in 2011. This was a significant increase of 180% over the period.
• There were also significant increases in the rate of Indigenous Australians employed as: medical practitioners (a 78% increase over the period, from 1.7 to 3.2 per 10,000); nursing
Aboriginal and Torres Strait Islander Health Performance Framework 2014 report: detailed analyses
4 Measure 3.08: Cultural competency
support workers and personal care workers (a 57% increase, from 17 to 26 per 10,000); and Aboriginal and Torres Strait Islander Health Workers (a 19% increase, from 19 to 23 per 10,000) (Table 3.12.1, Figure 3.08.2).
Source: Table 3.08.4.
Figure 3.08.1: Proportion of Indigenous Australians who did not access a health provider when needed, by health provider type, 2012–13
0
5
10
15
20
25
Dentist Doctor Other healthprofessional
Hospital Counsellor
Per cent
Health provider
Aboriginal and Torres Strait Islander Health Performance Framework 2014 report: detailed analyses
Measure 3.08: Cultural competency 5
Source: Table 3.12.1.
Figure 3.08.2: Indigenous Australians aged 15 and over employed in selected health-related occupations (per 10,000), 1996, 2001, 2006 and 2011
0
5
10
15
20
25
30
35
40
45
1996 2001 2006 2011
Rate per 10,000 Aboriginal and Torres Strait Islander Health WorkerNursesAllied health professionalsNursing support worker and personal care workers
0
5
10
15
20
25
30
35
40
45
1996 2001 2006 2011
Rate per 10,000
Medical practitionersDental and dental allied workforceHealth diagnostic and promotion professionals
Aboriginal and Torres Strait Islander Health Performance Framework 2014 report: detailed analyses
6 Measure 3.08: Cultural competency
Table 3.08.1: Discrimination toward Indigenous Australians aged 18 and over by sex, remoteness and age group, 2012–13
Sex
Remoteness
Age group
Males Females
Non-remote Remote 18–24 25–34 35–44 45–54 55+ Total
Per cent
Whether avoids seeking health care because been treated unfairly
Yes 5.3 9.3
7.0 8.7
5.7 7.0 9.3 7.5 7.6
7.4
No 94.7 90.7
93.0 91.3
94.3 93.0 90.7 92.5 92.4
92.6
Total(a) 176,406 186,532
281,070 81,868
83,536 85,770 77,544 59,757 56,332
362,938
Whether felt treated badly because Aboriginal or Torres Strait Islander in last 12 months
Yes 13.8 18.5
17.2 13.0
11.9 16.1 21.3 18.9 13.0
16.2
No 86.2 81.5
82.8 87.0
88.1 83.9 78.7 81.1 83.8
83.8
Total(a) 176,256 186,237
n.p. 81,610
83,297 85,770 n.p. 59,652 n.p.
362,494
How usually feel when treated badly(b)
Angry 71.6 75.3
75.1 67.4
75.1 71.5 75.7 73.1 72.7
73.7
Sad 27.5 31.3
28.4 35.6
32.2 31.8 27.0 31.3 26.2
29.7
Sorry for the person who did it 36.4 27.7
33.6 20.8
24.1 39.2 28.6 34.3 27.6
31.3
Ashamed or worried about it 10.5 18.1
14.6 16.5
13.4† 19.3 15.0 11.7† 13.6†
14.9
Sick 8.3† 13.1
11.0 11.7†
14.5† 13.1 10.4† 7.3† 10.5†
11.1
Other feeling 10.0 12.6
11.7 10.7†
n.p. n.p. 14.6 6.0† 14.4†
11.5
None of the above 2.1† 0.5‡
0.6† 3.7†
n.p. n.p. 2.0† 0.6‡ 2.4‡
1.2†
Total persons treated badly in last 12 months(a)(c) 24,383 34,445
48,228 10,600
9,908 13,806 16,526 11,284 7,304
58,828
What usually do when treated badly(b)
Try to avoid the person or situation 31.2 38.1
35.0 36.7
31.4 39.0 39.7 27.2 35.8
35.3
Try to change the way you are or things that you do 2.7† 7.1
4.9† 6.9†
2.9‡ 6.9† 6.9† 4.2† 3.3†
5.3
(continued)
Aboriginal and Torres Strait Islander Health Performance Framework 2014 report: detailed analyses
Measure 3.08: Cultural competency 7
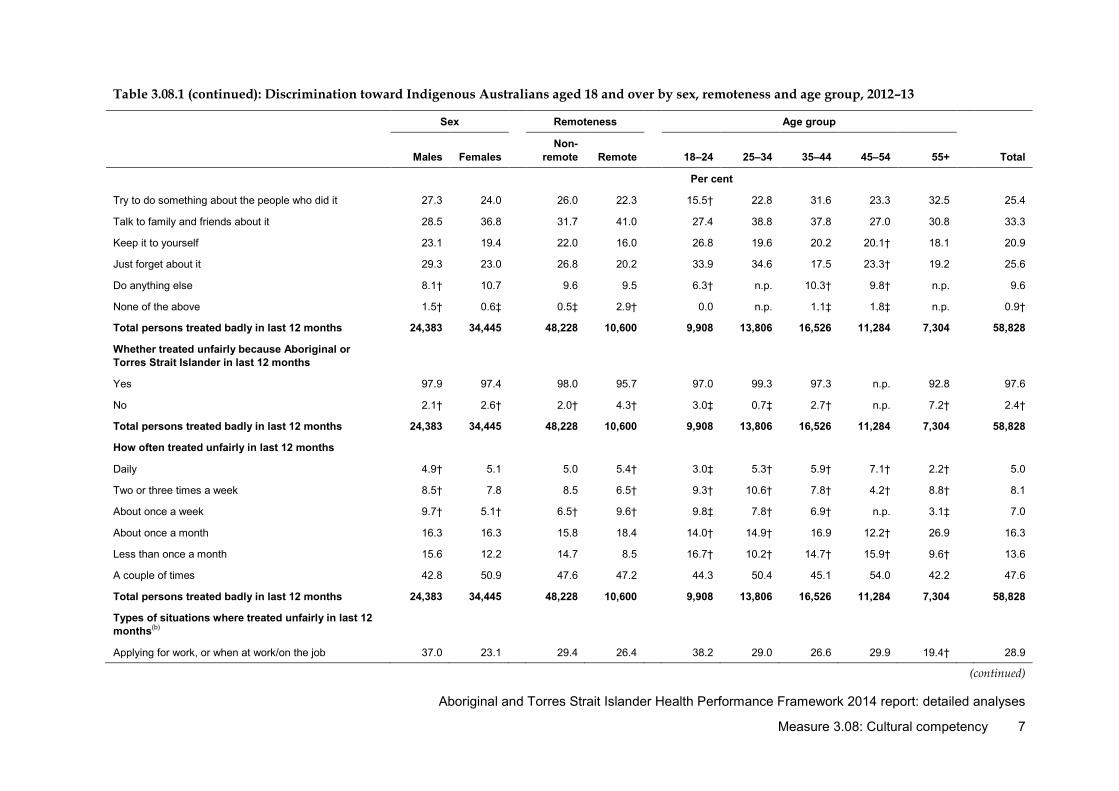
Table 3.08.1 (continued): Discrimination toward Indigenous Australians aged 18 and over by sex, remoteness and age group, 2012–13
Sex
Remoteness
Age group
Males Females
Non-remote Remote 18–24 25–34 35–44 45–54 55+ Total
Per cent
Try to do something about the people who did it 27.3 24.0
26.0 22.3
15.5† 22.8 31.6 23.3 32.5
25.4
Talk to family and friends about it 28.5 36.8
31.7 41.0
27.4 38.8 37.8 27.0 30.8
33.3
Keep it to yourself 23.1 19.4
22.0 16.0
26.8 19.6 20.2 20.1† 18.1
20.9
Just forget about it 29.3 23.0
26.8 20.2
33.9 34.6 17.5 23.3† 19.2
25.6
Do anything else 8.1† 10.7
9.6 9.5
6.3† n.p. 10.3† 9.8† n.p.
9.6
None of the above 1.5† 0.6‡
0.5‡ 2.9†
0.0 n.p. 1.1‡ 1.8‡ n.p.
0.9†
Total persons treated badly in last 12 months 24,383 34,445
48,228 10,600
9,908 13,806 16,526 11,284 7,304
58,828
Whether treated unfairly because Aboriginal or Torres Strait Islander in last 12 months
Yes 97.9 97.4
98.0 95.7
97.0 99.3 97.3 n.p. 92.8
97.6
No 2.1† 2.6†
2.0† 4.3†
3.0‡ 0.7‡ 2.7† n.p. 7.2†
2.4†
Total persons treated badly in last 12 months 24,383 34,445
48,228 10,600
9,908 13,806 16,526 11,284 7,304
58,828
How often treated unfairly in last 12 months
Daily 4.9† 5.1
5.0 5.4†
3.0‡ 5.3† 5.9† 7.1† 2.2†
5.0
Two or three times a week 8.5† 7.8
8.5 6.5†
9.3† 10.6† 7.8† 4.2† 8.8†
8.1
About once a week 9.7† 5.1†
6.5† 9.6†
9.8‡ 7.8† 6.9† n.p. 3.1‡
7.0
About once a month 16.3 16.3
15.8 18.4
14.0† 14.9† 16.9 12.2† 26.9
16.3
Less than once a month 15.6 12.2
14.7 8.5
16.7† 10.2† 14.7† 15.9† 9.6†
13.6
A couple of times 42.8 50.9
47.6 47.2
44.3 50.4 45.1 54.0 42.2
47.6
Total persons treated badly in last 12 months 24,383 34,445
48,228 10,600
9,908 13,806 16,526 11,284 7,304
58,828
Types of situations where treated unfairly in last 12 months(b)
Applying for work, or when at work/on the job 37.0 23.1
29.4 26.4
38.2 29.0 26.6 29.9 19.4†
28.9
(continued)
Aboriginal and Torres Strait Islander Health Performance Framework 2014 report: detailed analyses
8 Measure 3.08: Cultural competency
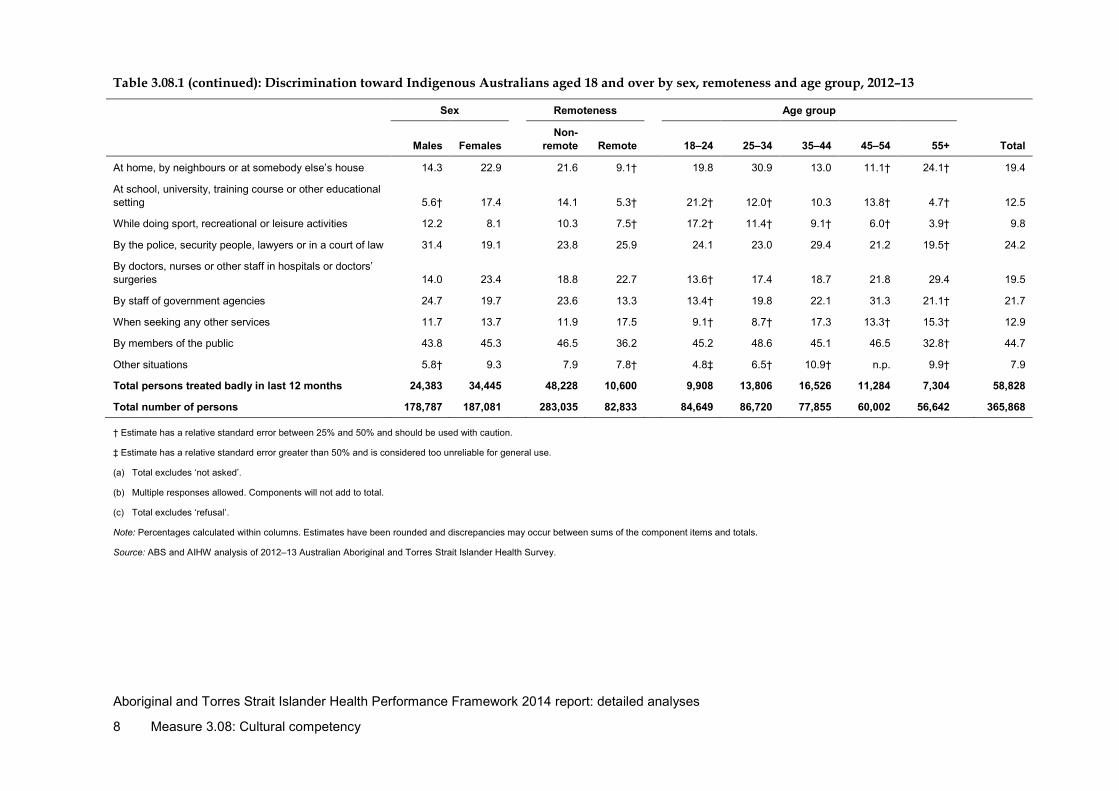
Table 3.08.1 (continued): Discrimination toward Indigenous Australians aged 18 and over by sex, remoteness and age group, 2012–13
Sex
Remoteness
Age group
Males Females
Non-remote Remote 18–24 25–34 35–44 45–54 55+ Total
At home, by neighbours or at somebody else’s house 14.3 22.9
21.6 9.1†
19.8 30.9 13.0 11.1† 24.1†
19.4
At school, university, training course or other educational setting 5.6† 17.4
14.1 5.3†
21.2† 12.0† 10.3 13.8† 4.7†
12.5
While doing sport, recreational or leisure activities 12.2 8.1
10.3 7.5†
17.2† 11.4† 9.1† 6.0† 3.9†
9.8
By the police, security people, lawyers or in a court of law 31.4 19.1
23.8 25.9
24.1 23.0 29.4 21.2 19.5†
24.2
By doctors, nurses or other staff in hospitals or doctors’ surgeries 14.0 23.4
18.8 22.7
13.6† 17.4 18.7 21.8 29.4
19.5
By staff of government agencies 24.7 19.7
23.6 13.3
13.4† 19.8 22.1 31.3 21.1†
21.7
When seeking any other services 11.7 13.7
11.9 17.5
9.1† 8.7† 17.3 13.3† 15.3†
12.9
By members of the public 43.8 45.3
46.5 36.2
45.2 48.6 45.1 46.5 32.8†
44.7
Other situations 5.8† 9.3
7.9 7.8†
4.8‡ 6.5† 10.9† n.p. 9.9†
7.9
Total persons treated badly in last 12 months 24,383 34,445
48,228 10,600
9,908 13,806 16,526 11,284 7,304
58,828
Total number of persons 178,787 187,081 283,035 82,833 84,649 86,720 77,855 60,002 56,642 365,868
† Estimate has a relative standard error between 25% and 50% and should be used with caution.
‡ Estimate has a relative standard error greater than 50% and is considered too unreliable for general use.
(a) Total excludes ‘not asked’.
(b) Multiple responses allowed. Components will not add to total.
(c) Total excludes ‘refusal’.
Note: Percentages calculated within columns. Estimates have been rounded and discrepancies may occur between sums of the component items and totals.
Source: ABS and AIHW analysis of 2012–13 Australian Aboriginal and Torres Strait Islander Health Survey.
Aboriginal and Torres Strait Islander Health Performance Framework 2014 report: detailed analyses
Measure 3.08: Cultural competency 9
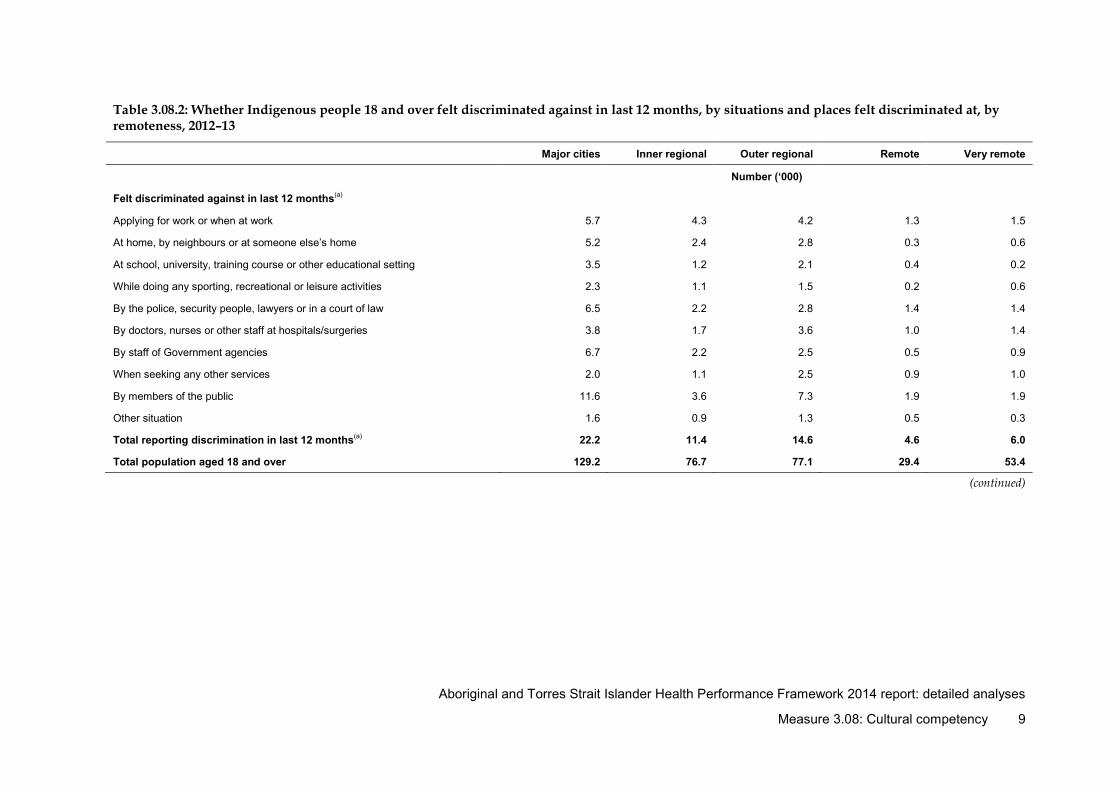
Table 3.08.2: Whether Indigenous people 18 and over felt discriminated against in last 12 months, by situations and places felt discriminated at, by remoteness, 2012–13
Major cities Inner regional Outer regional Remote Very remote
Number (‘000)
Felt discriminated against in last 12 months(a)
Applying for work or when at work 5.7 4.3 4.2 1.3 1.5
At home, by neighbours or at someone else’s home 5.2 2.4 2.8 0.3 0.6
At school, university, training course or other educational setting 3.5 1.2 2.1 0.4 0.2
While doing any sporting, recreational or leisure activities 2.3 1.1 1.5 0.2 0.6
By the police, security people, lawyers or in a court of law 6.5 2.2 2.8 1.4 1.4
By doctors, nurses or other staff at hospitals/surgeries 3.8 1.7 3.6 1.0 1.4
By staff of Government agencies 6.7 2.2 2.5 0.5 0.9
When seeking any other services 2.0 1.1 2.5 0.9 1.0
By members of the public 11.6 3.6 7.3 1.9 1.9
Other situation 1.6 0.9 1.3 0.5 0.3
Total reporting discrimination in last 12 months(a) 22.2 11.4 14.6 4.6 6.0
Total population aged 18 and over 129.2 76.7 77.1 29.4 53.4
(continued)
Aboriginal and Torres Strait Islander Health Performance Framework 2014 report: detailed analyses
10 Measure 3.08: Cultural competency
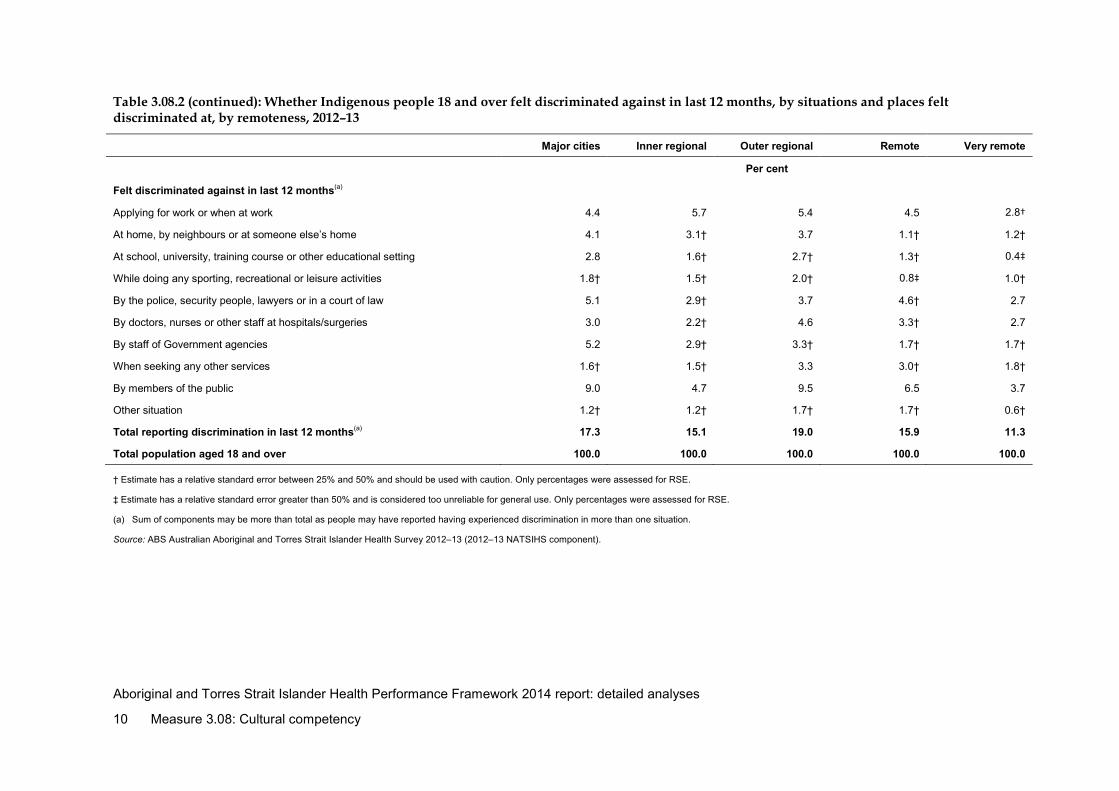
Table 3.08.2 (continued): Whether Indigenous people 18 and over felt discriminated against in last 12 months, by situations and places felt discriminated at, by remoteness, 2012–13
Major cities Inner regional Outer regional Remote Very remote
Per cent
Felt discriminated against in last 12 months(a)
Applying for work or when at work 4.4 5.7 5.4 4.5 2.8†
At home, by neighbours or at someone else’s home 4.1 3.1† 3.7 1.1† 1.2†
At school, university, training course or other educational setting 2.8 1.6† 2.7† 1.3† 0.4‡
While doing any sporting, recreational or leisure activities 1.8† 1.5† 2.0† 0.8‡ 1.0†
By the police, security people, lawyers or in a court of law 5.1 2.9† 3.7 4.6† 2.7
By doctors, nurses or other staff at hospitals/surgeries 3.0 2.2† 4.6 3.3† 2.7
By staff of Government agencies 5.2 2.9† 3.3† 1.7† 1.7†
When seeking any other services 1.6† 1.5† 3.3 3.0† 1.8†
By members of the public 9.0 4.7 9.5 6.5 3.7
Other situation 1.2† 1.2† 1.7† 1.7† 0.6†
Total reporting discrimination in last 12 months(a) 17.3 15.1 19.0 15.9 11.3
Total population aged 18 and over 100.0 100.0 100.0 100.0 100.0
† Estimate has a relative standard error between 25% and 50% and should be used with caution. Only percentages were assessed for RSE.
‡ Estimate has a relative standard error greater than 50% and is considered too unreliable for general use. Only percentages were assessed for RSE.
(a) Sum of components may be more than total as people may have reported having experienced discrimination in more than one situation.
Source: ABS Australian Aboriginal and Torres Strait Islander Health Survey 2012–13 (2012–13 NATSIHS component).
Aboriginal and Torres Strait Islander Health Performance Framework 2014 report: detailed analyses
Measure 3.08: Cultural competency 11
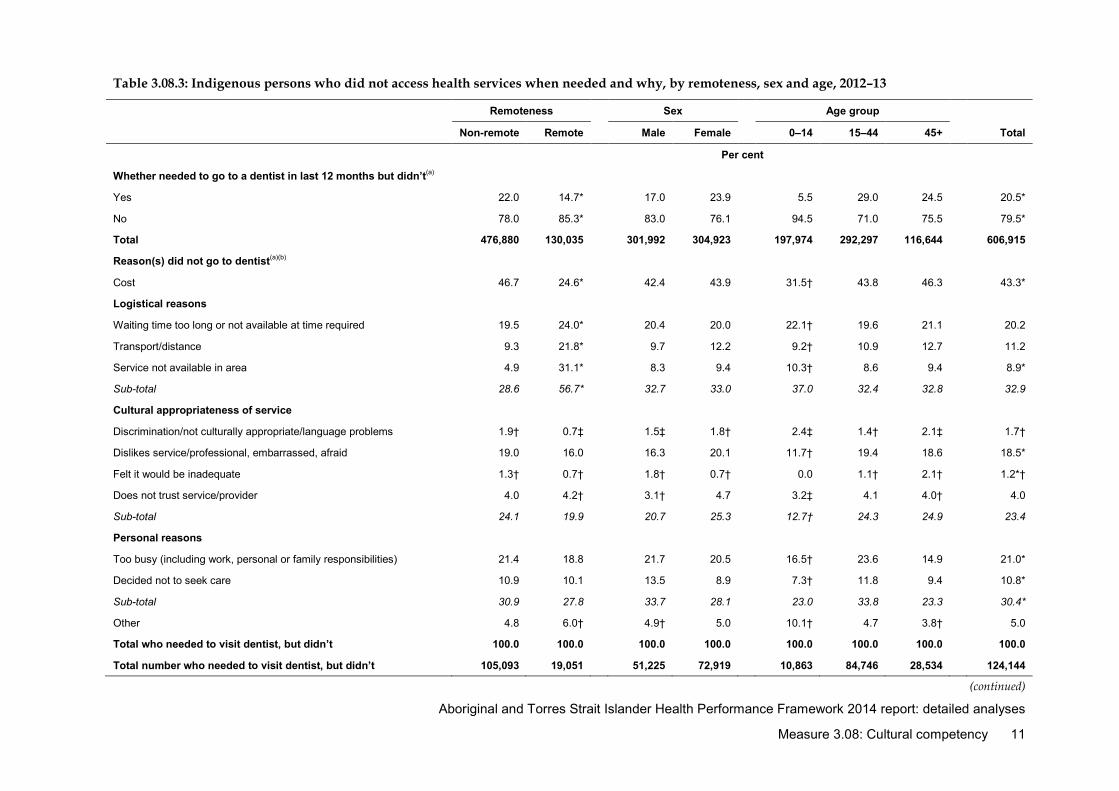
Table 3.08.3: Indigenous persons who did not access health services when needed and why, by remoteness, sex and age, 2012–13
Remoteness
Sex
Age group
Non-remote Remote Male Female 0–14 15–44 45+ Total
Per cent
Whether needed to go to a dentist in last 12 months but didn’t(a)
Yes 22.0 14.7*
17.0 23.9
5.5 29.0 24.5
20.5*
No 78.0 85.3*
83.0 76.1
94.5 71.0 75.5
79.5*
Total 476,880 130,035
301,992 304,923
197,974 292,297 116,644
606,915
Reason(s) did not go to dentist(a)(b)
Cost 46.7 24.6*
42.4 43.9
31.5† 43.8 46.3
43.3*
Logistical reasons
Waiting time too long or not available at time required 19.5 24.0*
20.4 20.0
22.1† 19.6 21.1
20.2
Transport/distance 9.3 21.8*
9.7 12.2
9.2† 10.9 12.7
11.2
Service not available in area 4.9 31.1*
8.3 9.4
10.3† 8.6 9.4
8.9*
Sub-total 28.6 56.7*
32.7 33.0
37.0 32.4 32.8
32.9
Cultural appropriateness of service
Discrimination/not culturally appropriate/language problems 1.9† 0.7‡
1.5‡ 1.8†
2.4‡ 1.4† 2.1‡
1.7†
Dislikes service/professional, embarrassed, afraid 19.0 16.0
16.3 20.1
11.7† 19.4 18.6
18.5*
Felt it would be inadequate 1.3† 0.7†
1.8† 0.7†
0.0 1.1† 2.1†
1.2*†
Does not trust service/provider 4.0 4.2†
3.1† 4.7
3.2‡ 4.1 4.0†
4.0
Sub-total 24.1 19.9
20.7 25.3
12.7† 24.3 24.9
23.4
Personal reasons
Too busy (including work, personal or family responsibilities) 21.4 18.8
21.7 20.5
16.5† 23.6 14.9
21.0*
Decided not to seek care 10.9 10.1
13.5 8.9
7.3† 11.8 9.4
10.8*
Sub-total 30.9 27.8
33.7 28.1
23.0 33.8 23.3
30.4*
Other 4.8 6.0†
4.9† 5.0
10.1† 4.7 3.8†
5.0
Total who needed to visit dentist, but didn’t 100.0 100.0
100.0 100.0
100.0 100.0 100.0
100.0
Total number who needed to visit dentist, but didn’t 105,093 19,051 51,225 72,919 10,863 84,746 28,534 124,144
(continued)
Aboriginal and Torres Strait Islander Health Performance Framework 2014 report: detailed analyses
12 Measure 3.08: Cultural competency
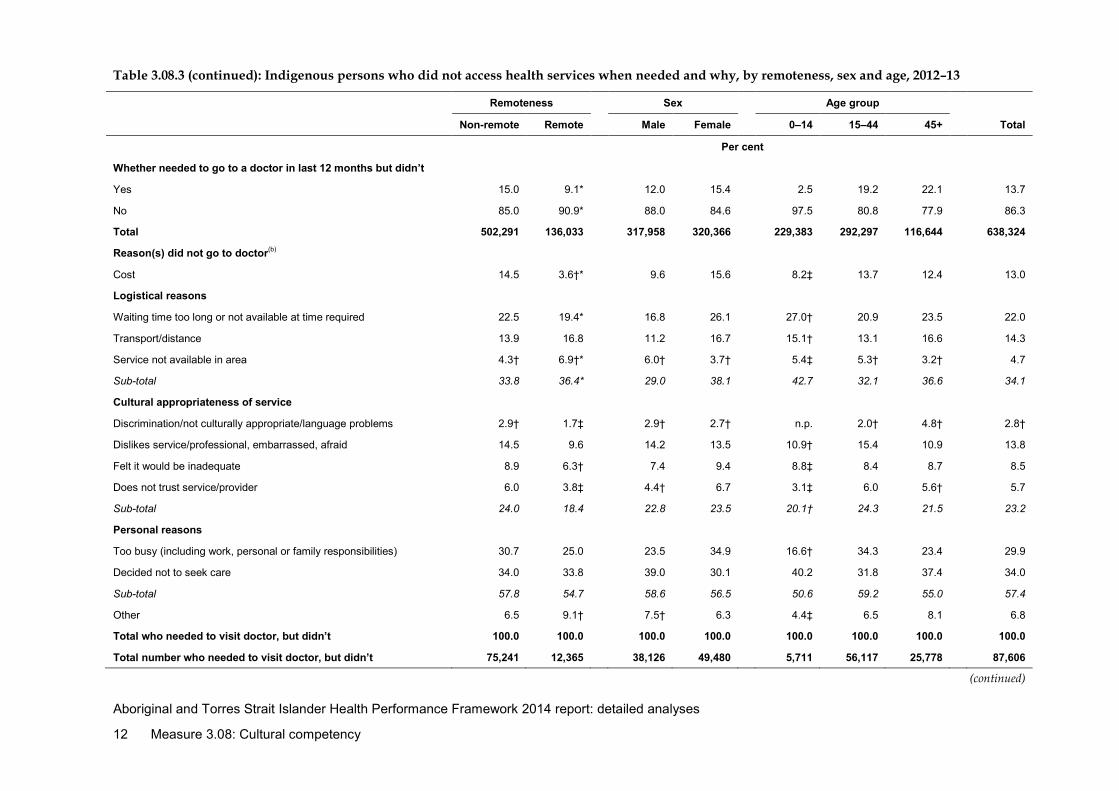
Table 3.08.3 (continued): Indigenous persons who did not access health services when needed and why, by remoteness, sex and age, 2012–13
Remoteness
Sex
Age group
Non-remote Remote Male Female 0–14 15–44 45+ Total
Per cent
Whether needed to go to a doctor in last 12 months but didn’t
Yes 15.0 9.1*
12.0 15.4
2.5 19.2 22.1
13.7
No 85.0 90.9*
88.0 84.6
97.5 80.8 77.9
86.3
Total 502,291 136,033
317,958 320,366
229,383 292,297 116,644
638,324
Reason(s) did not go to doctor(b)
Cost 14.5 3.6†*
9.6 15.6
8.2‡ 13.7 12.4
13.0
Logistical reasons
Waiting time too long or not available at time required 22.5 19.4*
16.8 26.1
27.0† 20.9 23.5
22.0
Transport/distance 13.9 16.8
11.2 16.7
15.1† 13.1 16.6
14.3
Service not available in area 4.3† 6.9†*
6.0† 3.7†
5.4‡ 5.3† 3.2†
4.7
Sub-total 33.8 36.4*
29.0 38.1
42.7 32.1 36.6
34.1
Cultural appropriateness of service
Discrimination/not culturally appropriate/language problems 2.9† 1.7‡
2.9† 2.7†
n.p. 2.0† 4.8†
2.8†
Dislikes service/professional, embarrassed, afraid 14.5 9.6
14.2 13.5
10.9† 15.4 10.9
13.8
Felt it would be inadequate 8.9 6.3†
7.4 9.4
8.8‡ 8.4 8.7
8.5
Does not trust service/provider 6.0 3.8‡
4.4† 6.7
3.1‡ 6.0 5.6†
5.7
Sub-total 24.0 18.4
22.8 23.5
20.1† 24.3 21.5
23.2
Personal reasons
Too busy (including work, personal or family responsibilities) 30.7 25.0
23.5 34.9
16.6† 34.3 23.4
29.9
Decided not to seek care 34.0 33.8
39.0 30.1
40.2 31.8 37.4
34.0
Sub-total 57.8 54.7
58.6 56.5
50.6 59.2 55.0
57.4
Other 6.5 9.1†
7.5† 6.3
4.4‡ 6.5 8.1
6.8
Total who needed to visit doctor, but didn’t 100.0 100.0
100.0 100.0
100.0 100.0 100.0
100.0
Total number who needed to visit doctor, but didn’t 75,241 12,365 38,126 49,480 5,711 56,117 25,778 87,606
(continued)
Aboriginal and Torres Strait Islander Health Performance Framework 2014 report: detailed analyses
Measure 3.08: Cultural competency 13
Table 3.08.3 (continued): Indigenous persons who did not access health services when needed and why, by remoteness, sex and age, 2012–13
Remoteness
Sex
Age group
Non-remote Remote Male Female 0–14 15–44 45+ Total
Per cent
Whether needed to go to other health professional in last 12 months but didn’t(c)
Yes 9.9 4.3*
7.5 9.9
2.1 13.0 11.0
8.7*
No 90.1 95.7*
92.5 90.1
97.9 87.0 89.0
91.3*
Total 502,291 136,033
317,958 320,366
229,383 292,297 116,644
638,324
Reason(s) did not go to another health professional(b)(c)
Cost 38.7 4.5‡*
28.3 40.2
23.7† 35.9 37
35.1*
Logistical reasons
Waiting time too long or not available at time required 16.4 19.3†*
14.8 18.2
12.9† 15.7 21.2
16.7
Transport/distance 12.4 19.2†*
12.1 14.0
16.8† 11.4 16.8
13.2
Service not available in area 5.7† 8.6†*
8.5† 4.1†
10.4‡ 5.6† 5.5†
6.0†
Sub-total 26.5 36.0*
25.4 29.1
30.6† 25.0 33.8
27.5*
Cultural appropriateness of service
Discrimination/not culturally appropriate/language problems 2.5† 1.7‡
2.9‡ 2.1†
n.p. 2.2‡ 3.6‡
2.4†
Dislikes service/professional, embarrassed, afraid 13.1 7.5†
14.0 11.4
7.0† 13.8 10.8†
12.5
Felt it would be inadequate 5.1 3.7†
7.1† 3.3
3.4‡ 4.9† 5.6‡
5.0*
Does not trust service/provider 3.2† 4.3‡
3.7† 2.9†
2.5‡ 3.6† 2.7†
3.3
Sub-total 18.8 14.8
19.7 17.4
11.7† 19.7 16.9†
18.3
Personal reasons
Too busy (including work, personal or family responsibilities) 32.1 35.6
31.6 33.1
17.5† 35.3 29.7
32.5
Decided not to seek care 19.4 23.5
26.1 15.0
16.5† 20.0 20.4†
19.8*
Sub-total 46.9 58.0
52.0 45.1
33.6† 51.7 42.7
48.1*
Other 5.8 6.4†
5.9† 5.8
18.1† 2.9† 10.1†
5.9
Total who needed to visit OHP but didn’t 100.0 100.0
100.0 100.0
100.0 100.0 100.0
100.0
Total number who needed to visit OHP but didn’t 49,813 5,907 23,936 31,785 4,908 37,971 12,841 55,721
(continued)
Aboriginal and Torres Strait Islander Health Performance Framework 2014 report: detailed analyses
14 Measure 3.08: Cultural competency
Table 3.08.3 (continued): Indigenous persons who did not access health services when needed and why, by remoteness, sex and age, 2012–13
Remoteness
Sex
Age group
Non-remote Remote Male Female 0–14 15–44 45+ Total
Per cent
Whether needed to go to a hospital in last 12 months but didn’t
Yes 6.3 5.4*
5.0 7.3
1.1 8.5 10.2
6.1*
No 93.7 94.6*
95.0 92.7
98.9 91.5 89.8
93.9*
Total 502,291 136,033
317,958 320,366
229,383 292,297 116,644
638,324
Reason(s) did not go to hospital(b)
Cost 7.9 5.9†
7.3† 7.7†
10.5‡ 8.5† 4.8†
7.5*
Logistical reasons
Waiting time too long or not available at time required 25.3 21.9*
19.5 28.2
21.3† 24.9 24.8
24.7
Transport/distance 16.4 19.0*
16.2† 17.3
18.3† 15.8 18.9
16.9
Service not available in area 1.5‡ 8.0†*
3.2† 2.4†
n.p. 2.9† 2.8‡
2.7†
Sub-total 36.0 40.2*
32.8 39.5
39.2† 36.9 35.9
36.8
Cultural appropriateness of service
Discrimination/not culturally appropriate/language problems 4.0† 3.1‡
2.7‡ 4.6†
n.p. 3.7† 4.7‡
3.8†
Dislikes service/professional, embarrassed, afraid 15.7 8.1†
13.0 15.2
n.p. 14.8 15.3†
14.3
Felt it would be inadequate 9.8 7.6†
9.5† 9.4
13.1‡ 9.2 9.1†
9.4
Does not trust service/provider 8.0 6.8†
2.2† 11.5
n.p. 7.4† 8.9†
7.7
Sub-total 28.0 22.4
23.1 29.6
23.6† 26.5 28.7
27.0
Personal reasons
Too busy (including work, personal or family responsibilities) 24.3 17.5
16.4† 27.5
11.4† 26.9 17.4
23.0*
Decided not to seek care 36.8 31.1
43.2 30.8
42.4† 32.4 41.4
35.8
Sub-total 54.9 47.1
57.3 50.8
53.0 54.0 52.1
53.4
Other 5.4† 13.2†
6.0† 7.5
8.0‡ 5.3† 9.9†
6.9
Total who needed to visit hospital, but didn’t 100.0 100.0
100.0 100.0
100.0 100.0 100.0
100.0
Total number who needed to visit hospital, but didn’t 31,808 7,322 15,762 23,368 2,517 24,741 11,873 39,130
(continued)
Aboriginal and Torres Strait Islander Health Performance Framework 2014 report: detailed analyses
Measure 3.08: Cultural competency 15
Table 3.08.3 (continued): Indigenous persons who did not access health services when needed and why, by remoteness, sex and age, 2012–13
Remoteness
Sex
Age group
Non-remote Remote Male Female 0–14 15–44 45+ Total
Per cent
Whether needed to go to a counsellor in last 12 months but didn’t(d)(e)
Yes 10.3 4.2*
6.9 10.9
. . 9.8 7.1
8.9*
No 89.7 95.8*
93.1 89.1
. . 90.2 92.9
91.1*
Total 281,070 81,868
176,406 186,532
. . 246,850 116,088
362,938
Reason(s) did not go to a counsellor(b)
Cost 15.6 15.0†
7.0† 20.7
. . 17.4 10.1†
15.6
Logistical reasons
Waiting time too long or not available at time required 10.6 25.8†*
13.1† 11.7
. . 9.2 21.2†
12.2*
Transport/distance 10.8 7.0†*
6.3† 12.9
. . 10.7 9.5†
10.4
Service not available in area 5.3† 13.6†*
4.4† 7.2†
. . 5.3† 8.7†
6.2
Sub-total 20.1 40.7*
19.5 23.9
. . 19.8 29.6
22.3*
Cultural appropriateness of service
Discrimination/not culturally appropriate/language problems 3.4† 7.8‡
6.5‡ 2.4†
. . 4.5† n.p.
3.9†
Dislikes service/professional, embarrassed, afraid 27.6 18.3†
40.2 18.5
. . 27.2 25.1†
26.6*
Felt it would be inadequate 18.7 12.4†
24.0† 14.5
. . 16.4 23.0†
18.0*
Does not trust service/provider 11.5† 14.0†
15.8† 9.4†
. . 12.1† 10.9‡
11.8*
Sub-total 46.1 33.6
61.5 34.8
. . 45.3 43.1
44.8*
Personal reasons
Too busy (including work, personal or family responsibilities) 34.7 28.8†
22.7† 40.8
. . 35.8 28.8
34.0
Decided not to seek care 30.7 40.1
34.8 29.8
. . 30.6 34.7
31.7
Sub-total 55.9 61.5
49.6 60.6
. . 56.6 56.3
56.5
Other 8.1 5.8‡
2.7† 10.9†
. . 6.5† 11.8†
7.9
Total who needed to visit a counsellor, but didn’t 100.0 100.0
100.0 100.0
. . 100 100
100.0
Total number who needed to visit a counsellor, but didn’t 28,919 3,468 12,096 20,292 . . 24,133 8,254 32,387
(continued)
Aboriginal and Torres Strait Islander Health Performance Framework 2014 report: detailed analyses
16 Measure 3.08: Cultural competency
Table 3.08.3 (continued): Indigenous persons who did not access health services when needed and why, by remoteness, sex and age, 2012–13
Remoteness
Sex
Age group
Non-remote Remote Male Female 0–14 15–44 45+ Total
Per cent
Whether needed to go to a health provider in last 12 months but didn’t(f)
Yes 32.0 22.0*
26.2 33.5
8.1 42.4 41.0
29.8*
No 68.0 78.0*
73.8 66.5
91.9 57.6 59.0
70.2*
Total 502,291 136,033
317,958 320,366
229,383 292,297 116,644
638,324
Reason(s) did not go(b)
Cost 38.9 18.6*
32.9 38
24.8 37.8 34.6
35.8*
Logistical reasons
Waiting time too long or not available at time required 27.0 26.9*
23.5 29.7
23.9 26.9 28.4
27.0*
Transport/distance 14.7 22.2*
13.0 18.1
11.8 15.3 18.8
15.9
Service not available in area 6.2 24.5*
8.5 9.6
9.0† 9.4 8.5
9.1*
Sub-total 37.4 53.8*
35.7 43.3
38.8 39.4 41.9
40.0*
Cultural appropriateness of service
Discrimination/not culturally appropriate/language problems 3.8 2.5†
3.4† 3.7
1.4‡ 3.2 5.4†
3.6
Dislikes service/professional, embarrassed, afraid 22.8 16.9*
21.0 22.6
11.8 23.8 20.9
21.9*
Felt it would be inadequate 9.6 5.9*
9.3 8.8
5.0† 8.8 11.0
9.0
Does not trust service/provider 8.8 7.3
6.6 10.0
3.9† 9.0 9.3
8.5
Sub-total 32.7 26.0*
29.6 33.2
17.6 33.3 32.8
31.6*
Personal reasons
Too busy (including work, personal or family responsibilities) 34.3 28.3
29.3 36.5
18.8 37.9 27.0
33.3
Decided not to seek care 29.1 26.0
31.1 26.7
20.6 28.3 32.7
28.6*
Sub-total 54.3 49.1
53.3 53.7
37.0 56.8 51.5
53.5
Other 9.1 10.5
8.7 9.9
12.5† 8.5 10.4
9.3
Total 100.0 100.0
100.0 100.0
. . 100.0 100.0
100.0
Total number 160,549 29,903 83,203 107,249 18,565 124,042 47,846 190,453
(continued)
Aboriginal and Torres Strait Islander Health Performance Framework 2014 report: detailed analyses
Measure 3.08: Cultural competency 17
Table 3.08.3 (continued): Indigenous persons who did not access health services when needed and why, by remoteness, sex and age, 2012–13 * Represents statistically significant differences in proportions at the p < 0.05 level, for comparison between remote and non-remote (using non-remote as the reference category), and comparison of equivalent responses in total column between provider types with ‘doctor’ as reference category.
† Estimate has a relative standard error between 25% and 50% and should be used with caution.
‡ Estimate has a relative standard error greater than 50% and is considered too unreliable for general use.
(a) Persons aged 2 and over.
(b) More than one response allowed, sum of components may exceed total.
(c) Other health professionals include: nurse, sister, and Aboriginal (and Torres Strait Islander) health worker.
(d) Persons aged 18 and over, present at interview and responding for self.
(e) Excludes ‘not asked’.
(f) Includes persons who reported that they needed to go to a dentist (persons aged 2 and over), Doctor, Other Health Professional, Hospital or Counsellor (persons aged 18 and over) in the last 12 months, but did not go.
Notes
1. Estimates have been rounded and discrepancies may occur between sums of the component items and totals.
2. Data excludes ‘not stated’ responses.
Source: ABS and AIHW analysis of 2012–13 Australian Aboriginal and Torres Strait Islander Health Survey.
Aboriginal and Torres Strait Islander Health Performance Framework 2014 report: detailed analyses
18 Measure 3.08: Cultural competency
Table 3.08.4: Reasons for Indigenous Australians not accessing health services when needed, by state/territory, 2012–13 (%)
NSW Vic Qld WA SA Tas ACT NT Australia
Per cent
Whether needed to go to dentist in last 12 months, but didn’t(a)
Yes 24.6 23.3 18.5 20.0 19.1 20.4 25.1 12.1 20.5
No 75.4 76.7 81.5 80.0 80.9 79.6 74.9 87.9 79.5
Total persons 190,852 43,400 171,081 77,832 33,809 22,531 5,596 61,814 606,915
Reasons didn’t go to a dentist(a)
Cost 45.2 38.1 43.0 44.8 46.1 55.2 47.5 25.9 43.3
Logistical reasons
Waiting time too long or not available at time required 20.5 11.8† 22.1 18.3 14.8 23.0 22.4† 27.2† 20.2
Transport/distance 8.3 4.7† 14.0 14.8 8.4† 13.5† 5.9† 20.5 11.2
[service] Not available in area 6.5† 3.5† 9.7† 14.3 5.3† 11.4† – 20.9† 8.9
Sub-total 29.4 18.0 37.5 38.0 24.0 34.4 28.3† 52.2 32.9
Cultural appropriateness of service
Discrimination/not culturally appropriate/language problems 3.3† n.p. – 1.3‡ n.p. 2.3‡ n.p. n.p. 1.7†
Dislikes service/professional, embarrassed, afraid 17.8 23.6 19.2 14.2 23.9 21.7 22.7† 15.1† 18.6
Felt it would be inadequate 0.7‡ 2.9† 1.2‡ 1.0‡ 1.9‡ 1.5‡ n.p. n.p. 1.2†
Does not trust dentist 3.2† 5.4† 4.9† 3.9† 3.7† 7.2† 3.8‡ 2.0‡ 4.0
Sub-total 23.4 29.8 24.0 18.1 27.2 27.2 29.6 17.0† 23.4
Personal reasons
Too busy (including work, personal or family responsibilities) 18.9 24.5 22.0 21.6 17.1 27.5 32.9† 21.5 21.0
Decided not to seek care 7.1 14.3 11.2 15.1 18.6 9.2† 10.8† 12.7† 10.8
Sub-total 26.0 35.7 31.2 33.1 34.1 36.0 39.8 34.2 30.4
Other 4.6† 6.8† 6.4† 2.6† 5.0† n.p. n.p. 5.4† 5.0
Total who needed to visit dentist, but didn’t(b) 46,926 10,110 31,585 15,558 6,464 4,602 1,407 7,493 124,144
(continued)
Aboriginal and Torres Strait Islander Health Performance Framework 2014 report: detailed analyses
Measure 3.08: Cultural competency 19
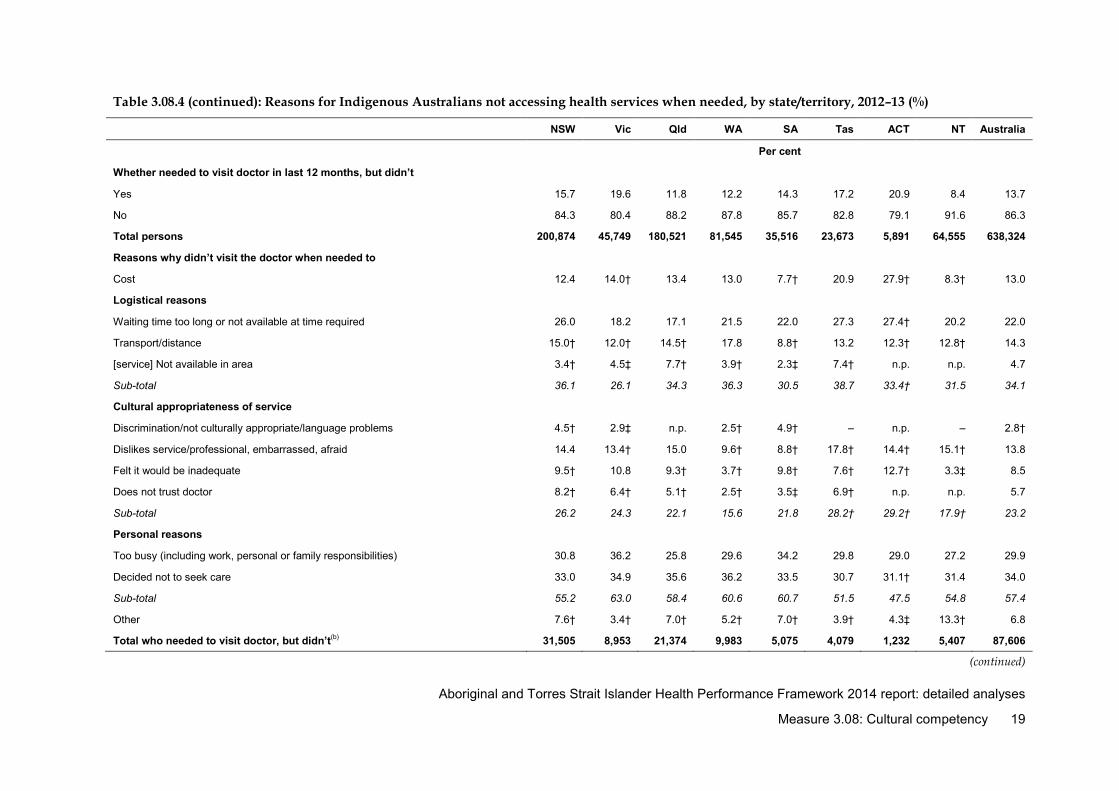
Table 3.08.4 (continued): Reasons for Indigenous Australians not accessing health services when needed, by state/territory, 2012–13 (%)
NSW Vic Qld WA SA Tas ACT NT Australia
Per cent
Whether needed to visit doctor in last 12 months, but didn’t Yes 15.7 19.6 11.8 12.2 14.3 17.2 20.9 8.4 13.7
No 84.3 80.4 88.2 87.8 85.7 82.8 79.1 91.6 86.3
Total persons 200,874 45,749 180,521 81,545 35,516 23,673 5,891 64,555 638,324
Reasons why didn’t visit the doctor when needed to
Cost 12.4 14.0† 13.4 13.0 7.7† 20.9 27.9† 8.3† 13.0
Logistical reasons
Waiting time too long or not available at time required 26.0 18.2 17.1 21.5 22.0 27.3 27.4† 20.2 22.0
Transport/distance 15.0† 12.0† 14.5† 17.8 8.8† 13.2 12.3† 12.8† 14.3
[service] Not available in area 3.4† 4.5‡ 7.7† 3.9† 2.3‡ 7.4† n.p. n.p. 4.7
Sub-total 36.1 26.1 34.3 36.3 30.5 38.7 33.4† 31.5 34.1
Cultural appropriateness of service
Discrimination/not culturally appropriate/language problems 4.5† 2.9‡ n.p. 2.5† 4.9† – n.p. – 2.8†
Dislikes service/professional, embarrassed, afraid 14.4 13.4† 15.0 9.6† 8.8† 17.8† 14.4† 15.1† 13.8
Felt it would be inadequate 9.5† 10.8 9.3† 3.7† 9.8† 7.6† 12.7† 3.3‡ 8.5
Does not trust doctor 8.2† 6.4† 5.1† 2.5† 3.5‡ 6.9† n.p. n.p. 5.7
Sub-total 26.2 24.3 22.1 15.6 21.8 28.2† 29.2† 17.9† 23.2
Personal reasons
Too busy (including work, personal or family responsibilities) 30.8 36.2 25.8 29.6 34.2 29.8 29.0 27.2 29.9
Decided not to seek care 33.0 34.9 35.6 36.2 33.5 30.7 31.1† 31.4 34.0
Sub-total 55.2 63.0 58.4 60.6 60.7 51.5 47.5 54.8 57.4
Other 7.6† 3.4† 7.0† 5.2† 7.0† 3.9† 4.3‡ 13.3† 6.8
Total who needed to visit doctor, but didn’t(b) 31,505 8,953 21,374 9,983 5,075 4,079 1,232 5,407 87,606
(continued)
Aboriginal and Torres Strait Islander Health Performance Framework 2014 report: detailed analyses
20 Measure 3.08: Cultural competency
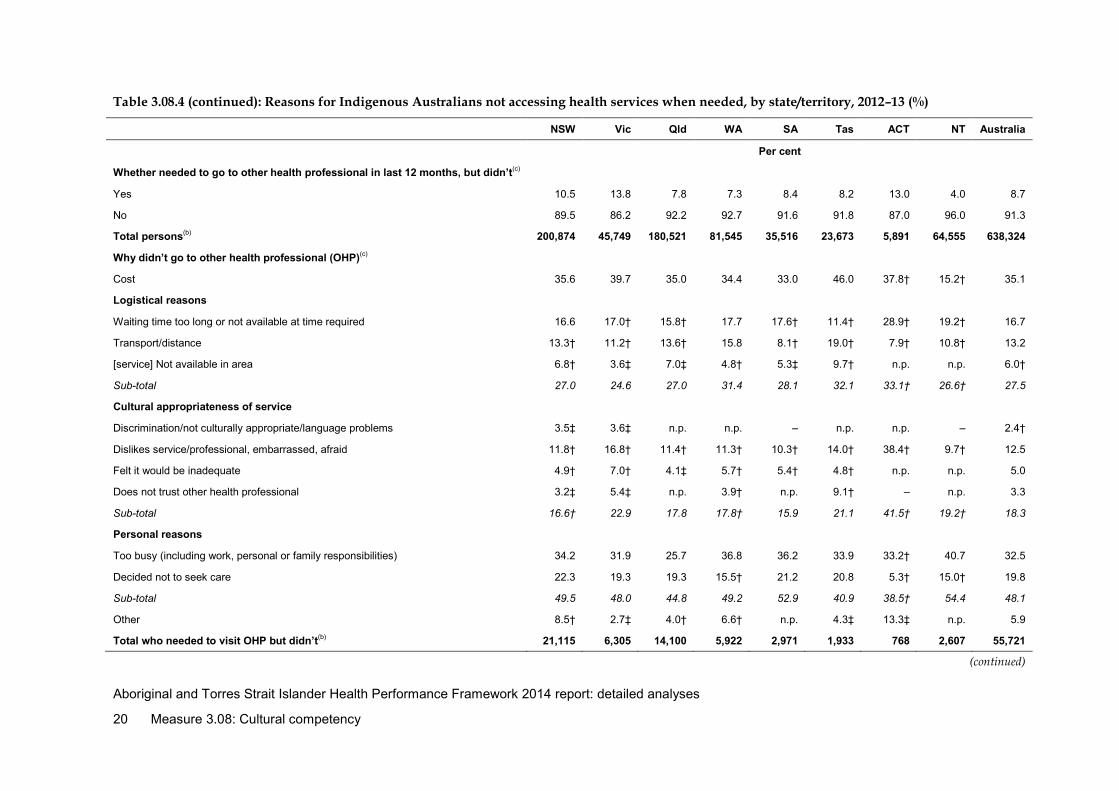
Table 3.08.4 (continued): Reasons for Indigenous Australians not accessing health services when needed, by state/territory, 2012–13 (%)
NSW Vic Qld WA SA Tas ACT NT Australia
Per cent
Whether needed to go to other health professional in last 12 months, but didn’t(c)
Yes 10.5 13.8 7.8 7.3 8.4 8.2 13.0 4.0 8.7
No 89.5 86.2 92.2 92.7 91.6 91.8 87.0 96.0 91.3
Total persons(b) 200,874 45,749 180,521 81,545 35,516 23,673 5,891 64,555 638,324
Why didn’t go to other health professional (OHP)(c)
Cost 35.6 39.7 35.0 34.4 33.0 46.0 37.8† 15.2† 35.1
Logistical reasons
Waiting time too long or not available at time required 16.6 17.0† 15.8† 17.7 17.6† 11.4† 28.9† 19.2† 16.7
Transport/distance 13.3† 11.2† 13.6† 15.8 8.1† 19.0† 7.9† 10.8† 13.2
[service] Not available in area 6.8† 3.6‡ 7.0‡ 4.8† 5.3‡ 9.7† n.p. n.p. 6.0†
Sub-total 27.0 24.6 27.0 31.4 28.1 32.1 33.1† 26.6† 27.5
Cultural appropriateness of service
Discrimination/not culturally appropriate/language problems 3.5‡ 3.6‡ n.p. n.p. – n.p. n.p. – 2.4†
Dislikes service/professional, embarrassed, afraid 11.8† 16.8† 11.4† 11.3† 10.3† 14.0† 38.4† 9.7† 12.5
Felt it would be inadequate 4.9† 7.0† 4.1‡ 5.7† 5.4† 4.8† n.p. n.p. 5.0
Does not trust other health professional 3.2‡ 5.4‡ n.p. 3.9† n.p. 9.1† – n.p. 3.3
Sub-total 16.6† 22.9 17.8 17.8† 15.9 21.1 41.5† 19.2† 18.3
Personal reasons
Too busy (including work, personal or family responsibilities) 34.2 31.9 25.7 36.8 36.2 33.9 33.2† 40.7 32.5
Decided not to seek care 22.3 19.3 19.3 15.5† 21.2 20.8 5.3† 15.0† 19.8
Sub-total 49.5 48.0 44.8 49.2 52.9 40.9 38.5† 54.4 48.1
Other 8.5† 2.7‡ 4.0† 6.6† n.p. 4.3‡ 13.3‡ n.p. 5.9
Total who needed to visit OHP but didn’t(b) 21,115 6,305 14,100 5,922 2,971 1,933 768 2,607 55,721
(continued)
Aboriginal and Torres Strait Islander Health Performance Framework 2014 report: detailed analyses
Measure 3.08: Cultural competency 21
Table 3.08.4 (continued): Reasons for Indigenous Australians not accessing health services when needed, by state/territory, 2012–13 (%)
NSW Vic Qld WA SA Tas ACT NT Australia
Whether needed to go to hospital in the last 12 months, but didn’t
Yes 6.1 7.7 6.3 5.9 6.4 7.1 7.1† 4.2 6.1
No 93.9 92.3 93.7 94.1 93.6 92.9 92.9 95.8 93.9
Total persons 200,874 45,749 180,521 81,545 35,516 23,673 5,891 64,555 638,324
Why didn’t visit hospital
Cost 3.9‡ 10.8† 9.4† 14.1† n.p. 8.7† n.p. 3.8‡ 7.5
Logistical reasons
Waiting time too long or not available at time required 22.5 22.0† 28.5 24.4† 23.2† 26.8 24.9† 22.1† 24.7
Transport/distance 15.4† 20.7† 14.2† 22.2 19.4† 18.6† n.p. n.p. 16.9
[service] Not available in area — n.p. 2.3‡ 7.5‡ n.p. n.p. n.p. 6.4‡ 2.7†
Sub-total 32.4 35.0 35.9 48.0 36.1 39.6 35.2† 41.8 36.8
Cultural appropriateness of service
Discrimination/not culturally appropriate/language problems 3.3‡ 8.6‡ 4.5‡ 3.6‡ – – n.p. n.p. 3.8†
Dislikes service/professional, embarrassed, afraid 11.0† 16.6† 21.3† 7.2† 9.0† 12.9† 30.1‡ 12.1‡ 14.3
Felt it would be inadequate 9.5† 10.1† 11.2† 4.2† 16.1‡ 8.3† n.p. n.p. 9.4
Does not trust the hospital 5.3‡ 7.1† 12.4† 5.2‡ n.p. 12.7‡ n.p. 4.3‡ 7.7
Sub-total 22.9 27.0 35.3 16.8 29.0† 30.2† 49.3† 21.5† 27.0
Personal reasons
Too busy (including work, personal or family responsibilities) 21.3 26.6† 27.3 19.6† 27.1† 18.4† 16.5‡ 14.5† 23.0
Decided not to seek care 46.9 32.1 31.2 27.8 33.0 31.6 23.0† 30.4 35.8
Sub-total 60.2 53.2 54.1 43.8 54.7 44.5 37.6† 43.6 53.4
Other 4.0‡ n.p. 6.3† 10.9† 9.5‡ 8.6† n.p. 15.3† 6.9
Total who needed to visit hospital, but didn’t(b) 12,292 3,517 11,428 4,837 2,257 1,680 418† 2,701 39,130
(continued)
Aboriginal and Torres Strait Islander Health Performance Framework 2014 report: detailed analyses
22 Measure 3.08: Cultural competency
Table 3.08.4 (continued): Reasons for Indigenous Australians not accessing health services when needed, by state/territory, 2012–13 (%)
NSW Vic Qld WA SA Tas ACT NT Australia
Whether needed to see a counsellor in last 12 months, but didn’t (d)
Yes 11.5 15.3 7.1 6.8 8.7 9.6 18.3 3.4 8.9
No 88.5 84.7 92.9 93.2 91.3 90.4 81.7 96.6 91.1
Total persons(e) 112,967 26,163 100,074 47,136 20,483 13,505 3,559 39,052 362,938
Reasons didn’t go to counsellor(d)
Cost 9.1† 18.5† 20.9† 31.4† n.p. 19.6† 28.9† n.p. 15.6
Logistical reasons
Waiting time too long or not available at time required 13.2† 10.6† 6.5‡ 27.2† 6.9‡ n.p. 23.7‡ n.p. 12.2
Transport/distance 5.8‡ 9.5† 15.2† 24.4† 9.4‡ 8.8† n.p. n.p. 10.4
[service] Not available in area 4.8‡ 6.5‡ 9.0† 5.9‡ 6.0‡ 6.0‡ n.p. n.p. 6.2
Sub-total 18.4 19.9† 21.7† 47.2 19.6† 12.6† 33.1† 16.9‡ 22.3
Cultural appropriateness of service
Discrimination/not culturally appropriate/language problems 3.8‡ n.p. n.p. 10.2‡ 10.8‡ — n.p. — 3.9†
Dislikes service/professional, embarrassed, afraid 36.8 23.1† 16.5† 27.9† n.p. 27.5† n.p. 18.7† 26.6
Felt it would be inadequate 16.7† 19.7† 21.3† 15.0† 16.9† 18.1† 31.5‡ 10.8‡ 18.0
Does not trust the counsellor 17.5† 8.5† 4.5‡ 11.9‡ 11.3‡ 9.1‡ n.p. n.p. 11.8
Sub-total 52.9 47.2 36.9 42.9 25.0† 44.8 53.3† 27.0† 44.8
Personal reasons
Too busy (including work, personal or family responsibilities) 27.2 42.8 37.6 32.8 45.3 34.3 48.1 36.0† 34.0
Decided not to seek care 34.1 30.1 26.2† 31.5 23.4† 38.0 36.3† 44.5 31.7
Sub-total 50.7 60.4 59.0 57.9 56.7 58.4 80.4 70.2 56.5
Other 9.5† 3.8‡ 7.4† 6.6† 12.4‡ 9.1† n.p. n.p. 7.9
Total who needed to see a counsellor in the last 12 months but didn’t(b)(d)(e) 12,985 3,996 7,128 3,224 1,772 1,290 653 1,339 32,387
(continued)
Aboriginal and Torres Strait Islander Health Performance Framework 2014 report: detailed analyses
Measure 3.08: Cultural competency 23
Table 3.08.4 (continued): Reasons for Indigenous Australians not accessing health services when needed, by state/territory, 2012–13 (%)
NSW Vic Qld WA SA Tas ACT NT Australia
Whether needed to go to a health provider in last 12 months but didn’t(f)
Yes 34.7 36.6 26.7 28.2 29.5 32.9 37.7 19.2 29.8
No 65.3 63.4 73.3 71.8 70.5 67.1 62.3 80.8 70.2
Total persons 200,874 45,749 180,521 81,545 35,516 23,673 5,891 64,555 638,324
Reason(s) did not go(b)
Cost 36.7 35.3 36.6 38.2 35.0 43.5 43.8 17.5 35.8
Logistical reasons
Waiting time too long or not available at time required 28.4 21.3 26.6 26.7 23.5 29.0 34.4 28.4 27.0
Transport/distance 14.5 11.3 17.4 20.1 13.0 15.9 11.8† 19.3 15.9
[service] Not available in area 6.8 6.1† 10.7† 12.5 6.6† 11.1 8.4‡ 14.6† 9.1
Sub-total 38.1 30.6 41.7 46.1 35.5 40.6 42.0 48.1 40.0
Cultural appropriateness of service
Discrimination/not culturally appropriate/language problems 5.2† 3.9† 1.9† 3.8† 4.1† n.p. 7.2† n.p. 3.6
Dislikes service/professional, embarrassed, afraid 20.8 28.9 23.2 17.6 22.6 23.9 36.0 17.6 21.9
Felt it would be inadequate 9.2 13.5 9.8 5.4† 10.1 7.6 17.4† 4.1† 9.0
Does not trust service/provider 9.9 10.1 7.8 6.9 6.6† 11.1† 10.4† 4.4† 8.5
Sub-total 31.4 42.5 32.5 25.2 33.3 33.7 42.0 22.2 31.6
Personal reasons
Too busy (including work, personal or family responsibilities) 32.9 39.1 32.2 32.2 34.6 34.7 45.8 30.5 33.3
Decided not to seek care 26.3 33.5 29.0 30.7 30.1 31.0 34.3 25.9 28.6
Sub-total 50.6 60.4 55.1 53.9 53.2 54.4 65.9 51.0 53.5
Other 9.7 8.4 9.5 7.6 9.5 7.5 9.7† 12.0† 9.3
Total who needed to see a health provider in last 12 months but didn’t 69,630 16,747 48,139 23,017 10,482 7,793 2,221 12,423 190,453
(continued)
Aboriginal and Torres Strait Islander Health Performance Framework 2014 report: detailed analyses
24 Measure 3.08: Cultural competency
Table 3.08.4 (continued): Reasons for Indigenous Australians not accessing health services when needed, by state/territory, 2012–13 (%)
NSW Vic Qld WA SA Tas ACT NT Australia
Whether ever accessed/used health services for mental health condition(d)
Yes 32.7 42.4 21.5 20.8 25.7 31.5 36.7 11.1 26.1
No 67.3 57.6 78.5 79.2 74.3 68.5 63.3 88.9 73.9
Total persons(e) 112,967 26,163 100,074 47,136 20,483 13,505 3,559 39,052 362,938
Whether been to counselling service for own health in last 12 months(d)
Yes 19.2 26.8 14.7 13.2 17.5 20.9 20.5 9.1 16.6
No 80.8 73.2 85.3 86.8 82.5 79.1 79.5 90.9 83.4
Total persons(e) 112,967 26,163 100,074 47,136 20,483 13,505 3,559 39,052 362,938
† Estimate has a relative standard error between 25% and 50% and should be used with caution.
‡ Estimate has a relative standard error greater than 50% and is considered too unreliable for general use.
(a) Persons aged 2 and over.
(b) More than one response allowed, sum of components may exceed total.
(c) Other health professionals include: nurse, sister, and Aboriginal (and Torres Strait Islander) health worker.
(d) Persons aged 18 and over, present at interview and responding for self.
(e) Excludes ‘not asked’.
(f) Includes persons who reported they needed to go to a dentist (persons aged 2 and over), doctor, other health professional, hospital or counsellor (persons aged 18 and over) in the last 12 months, but did not go.
Notes
1. Percentages calculated within columns. Estimates have been rounded and discrepancies may occur between sums of the component items and totals.
2. Data excludes ‘not stated’ responses.
Source: ABS Australian Aboriginal and Torres Strait Islander Health Survey 2012–13 (2012–13 NATSIHS component).
Aboriginal and Torres Strait Islander Health Performance Framework 2014 report: detailed analyses
Measure 3.08: Cultural competency 25
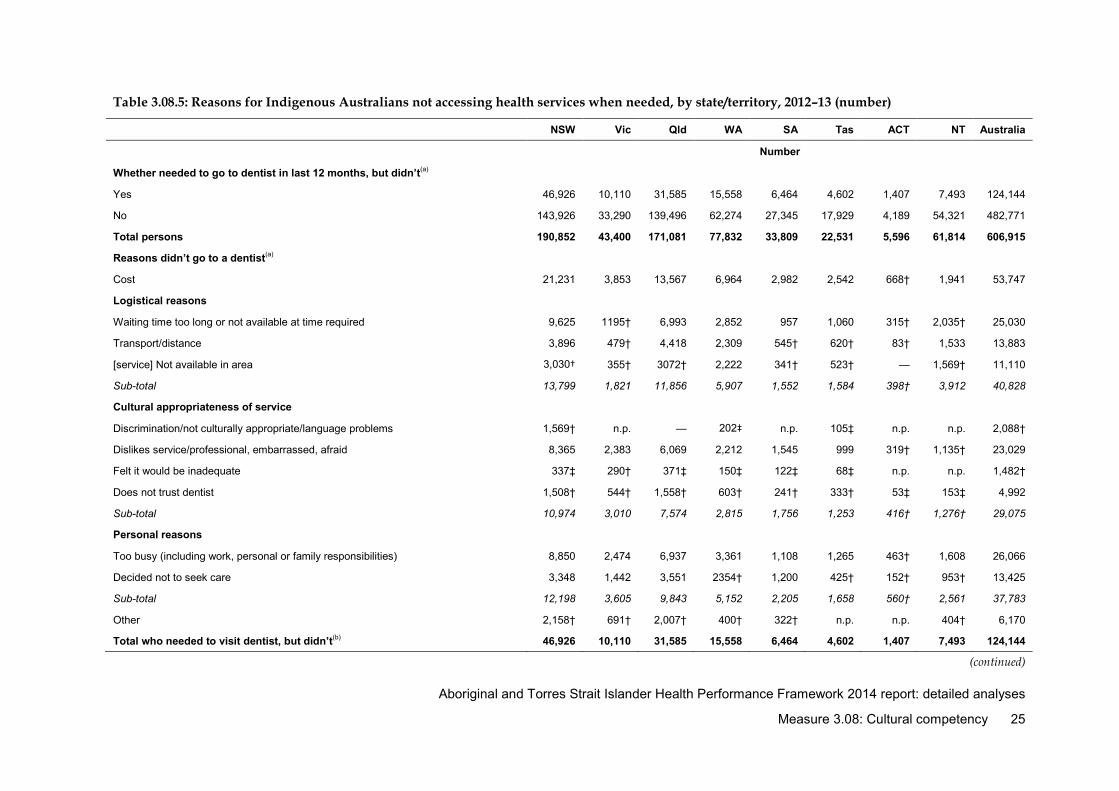
Table 3.08.5: Reasons for Indigenous Australians not accessing health services when needed, by state/territory, 2012–13 (number)
NSW Vic Qld WA SA Tas ACT NT Australia
Number
Whether needed to go to dentist in last 12 months, but didn’t(a)
Yes 46,926 10,110 31,585 15,558 6,464 4,602 1,407 7,493 124,144
No 143,926 33,290 139,496 62,274 27,345 17,929 4,189 54,321 482,771
Total persons 190,852 43,400 171,081 77,832 33,809 22,531 5,596 61,814 606,915
Reasons didn’t go to a dentist(a)
Cost 21,231 3,853 13,567 6,964 2,982 2,542 668† 1,941 53,747
Logistical reasons
Waiting time too long or not available at time required 9,625 1195† 6,993 2,852 957 1,060 315† 2,035† 25,030
Transport/distance 3,896 479† 4,418 2,309 545† 620† 83† 1,533 13,883
[service] Not available in area 3,030† 355† 3072† 2,222 341† 523† — 1,569† 11,110
Sub-total 13,799 1,821 11,856 5,907 1,552 1,584 398† 3,912 40,828
Cultural appropriateness of service
Discrimination/not culturally appropriate/language problems 1,569† n.p. — 202‡ n.p. 105‡ n.p. n.p. 2,088†
Dislikes service/professional, embarrassed, afraid 8,365 2,383 6,069 2,212 1,545 999 319† 1,135† 23,029
Felt it would be inadequate 337‡ 290† 371‡ 150‡ 122‡ 68‡ n.p. n.p. 1,482†
Does not trust dentist 1,508† 544† 1,558† 603† 241† 333† 53‡ 153‡ 4,992
Sub-total 10,974 3,010 7,574 2,815 1,756 1,253 416† 1,276† 29,075
Personal reasons
Too busy (including work, personal or family responsibilities) 8,850 2,474 6,937 3,361 1,108 1,265 463† 1,608 26,066
Decided not to seek care 3,348 1,442 3,551 2354† 1,200 425† 152† 953† 13,425
Sub-total 12,198 3,605 9,843 5,152 2,205 1,658 560† 2,561 37,783
Other 2,158† 691† 2,007† 400† 322† n.p. n.p. 404† 6,170
Total who needed to visit dentist, but didn’t(b) 46,926 10,110 31,585 15,558 6,464 4,602 1,407 7,493 124,144
(continued)
Aboriginal and Torres Strait Islander Health Performance Framework 2014 report: detailed analyses
26 Measure 3.08: Cultural competency
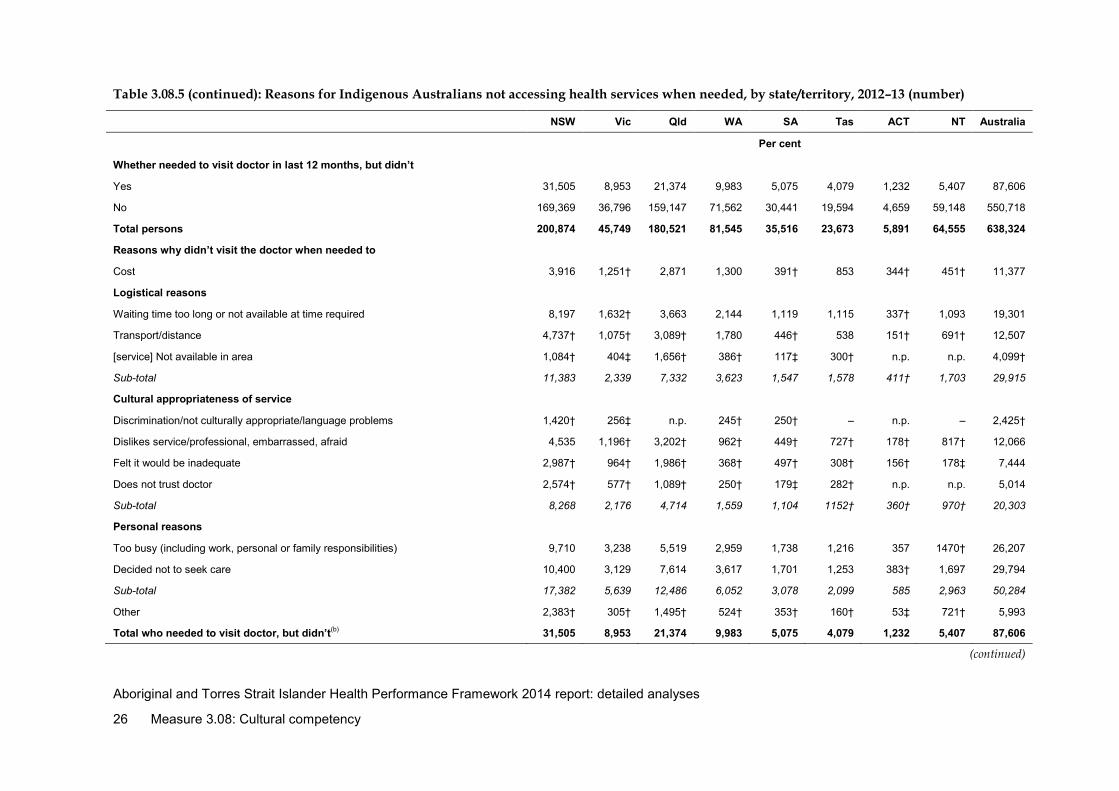
Table 3.08.5 (continued): Reasons for Indigenous Australians not accessing health services when needed, by state/territory, 2012–13 (number)
NSW Vic Qld WA SA Tas ACT NT Australia
Per cent
Whether needed to visit doctor in last 12 months, but didn’t Yes 31,505 8,953 21,374 9,983 5,075 4,079 1,232 5,407 87,606
No 169,369 36,796 159,147 71,562 30,441 19,594 4,659 59,148 550,718
Total persons 200,874 45,749 180,521 81,545 35,516 23,673 5,891 64,555 638,324
Reasons why didn’t visit the doctor when needed to
Cost 3,916 1,251† 2,871 1,300 391† 853 344† 451† 11,377
Logistical reasons
Waiting time too long or not available at time required 8,197 1,632† 3,663 2,144 1,119 1,115 337† 1,093 19,301
Transport/distance 4,737† 1,075† 3,089† 1,780 446† 538 151† 691† 12,507
[service] Not available in area 1,084† 404‡ 1,656† 386† 117‡ 300† n.p. n.p. 4,099†
Sub-total 11,383 2,339 7,332 3,623 1,547 1,578 411† 1,703 29,915
Cultural appropriateness of service
Discrimination/not culturally appropriate/language problems 1,420† 256‡ n.p. 245† 250† – n.p. – 2,425†
Dislikes service/professional, embarrassed, afraid 4,535 1,196† 3,202† 962† 449† 727† 178† 817† 12,066
Felt it would be inadequate 2,987† 964† 1,986† 368† 497† 308† 156† 178‡ 7,444
Does not trust doctor 2,574† 577† 1,089† 250† 179‡ 282† n.p. n.p. 5,014
Sub-total 8,268 2,176 4,714 1,559 1,104 1152† 360† 970† 20,303
Personal reasons
Too busy (including work, personal or family responsibilities) 9,710 3,238 5,519 2,959 1,738 1,216 357 1470† 26,207
Decided not to seek care 10,400 3,129 7,614 3,617 1,701 1,253 383† 1,697 29,794
Sub-total 17,382 5,639 12,486 6,052 3,078 2,099 585 2,963 50,284
Other 2,383† 305† 1,495† 524† 353† 160† 53‡ 721† 5,993
Total who needed to visit doctor, but didn’t(b) 31,505 8,953 21,374 9,983 5,075 4,079 1,232 5,407 87,606
(continued)
Aboriginal and Torres Strait Islander Health Performance Framework 2014 report: detailed analyses
Measure 3.08: Cultural competency 27
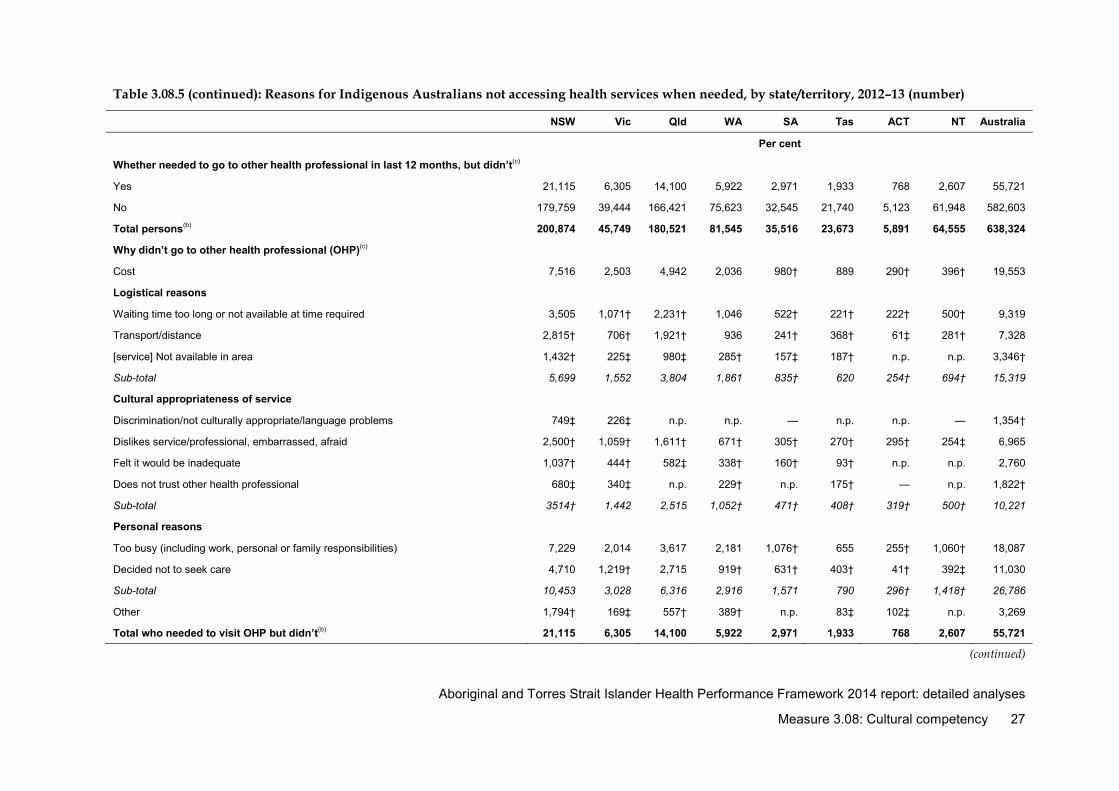
Table 3.08.5 (continued): Reasons for Indigenous Australians not accessing health services when needed, by state/territory, 2012–13 (number)
NSW Vic Qld WA SA Tas ACT NT Australia
Per cent
Whether needed to go to other health professional in last 12 months, but didn’t(c)
Yes 21,115 6,305 14,100 5,922 2,971 1,933 768 2,607 55,721
No 179,759 39,444 166,421 75,623 32,545 21,740 5,123 61,948 582,603
Total persons(b) 200,874 45,749 180,521 81,545 35,516 23,673 5,891 64,555 638,324
Why didn’t go to other health professional (OHP)(c)
Cost 7,516 2,503 4,942 2,036 980† 889 290† 396† 19,553
Logistical reasons
Waiting time too long or not available at time required 3,505 1,071† 2,231† 1,046 522† 221† 222† 500† 9,319
Transport/distance 2,815† 706† 1,921† 936 241† 368† 61‡ 281† 7,328
[service] Not available in area 1,432† 225‡ 980‡ 285† 157‡ 187† n.p. n.p. 3,346†
Sub-total 5,699 1,552 3,804 1,861 835† 620 254† 694† 15,319
Cultural appropriateness of service
Discrimination/not culturally appropriate/language problems 749‡ 226‡ n.p. n.p. — n.p. n.p. — 1,354†
Dislikes service/professional, embarrassed, afraid 2,500† 1,059† 1,611† 671† 305† 270† 295† 254‡ 6,965
Felt it would be inadequate 1,037† 444† 582‡ 338† 160† 93† n.p. n.p. 2,760
Does not trust other health professional 680‡ 340‡ n.p. 229† n.p. 175† — n.p. 1,822†
Sub-total 3514† 1,442 2,515 1,052† 471† 408† 319† 500† 10,221
Personal reasons
Too busy (including work, personal or family responsibilities) 7,229 2,014 3,617 2,181 1,076† 655 255† 1,060† 18,087
Decided not to seek care 4,710 1,219† 2,715 919† 631† 403† 41† 392‡ 11,030
Sub-total 10,453 3,028 6,316 2,916 1,571 790 296† 1,418† 26,786
Other 1,794† 169‡ 557† 389† n.p. 83‡ 102‡ n.p. 3,269
Total who needed to visit OHP but didn’t(b) 21,115 6,305 14,100 5,922 2,971 1,933 768 2,607 55,721
(continued)
Aboriginal and Torres Strait Islander Health Performance Framework 2014 report: detailed analyses
28 Measure 3.08: Cultural competency
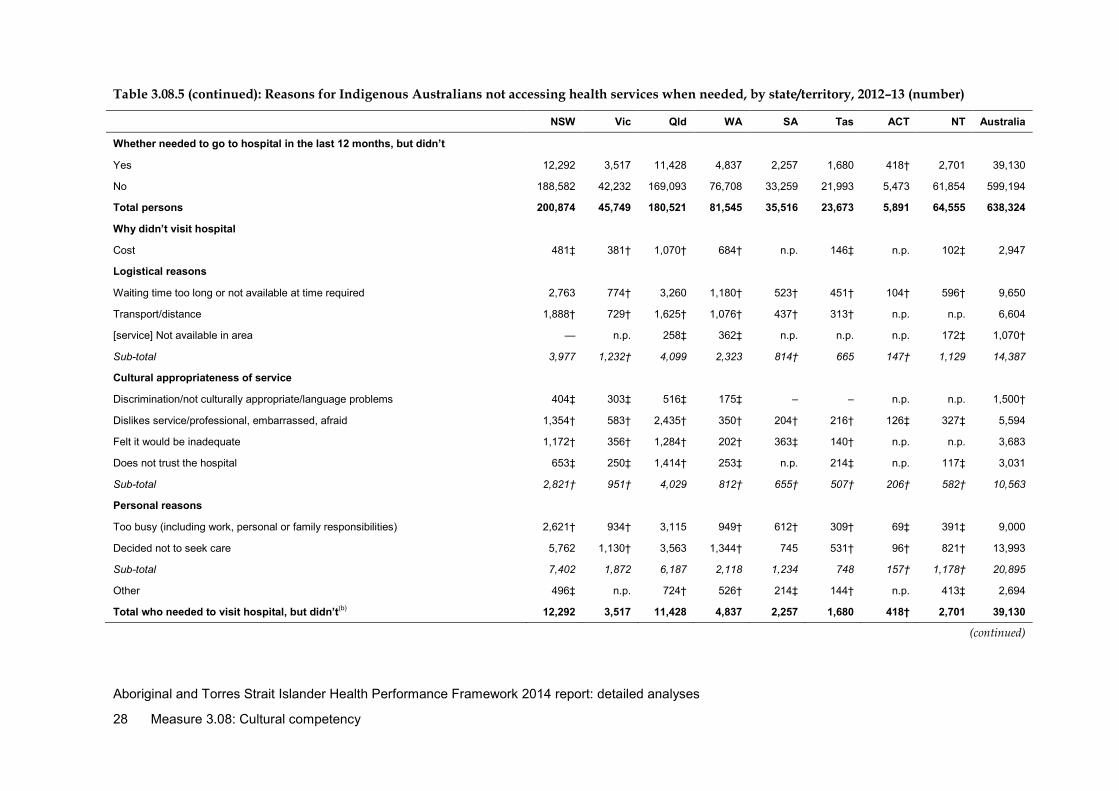
Table 3.08.5 (continued): Reasons for Indigenous Australians not accessing health services when needed, by state/territory, 2012–13 (number)
NSW Vic Qld WA SA Tas ACT NT Australia
Whether needed to go to hospital in the last 12 months, but didn’t
Yes 12,292 3,517 11,428 4,837 2,257 1,680 418† 2,701 39,130
No 188,582 42,232 169,093 76,708 33,259 21,993 5,473 61,854 599,194
Total persons 200,874 45,749 180,521 81,545 35,516 23,673 5,891 64,555 638,324
Why didn’t visit hospital
Cost 481‡ 381† 1,070† 684† n.p. 146‡ n.p. 102‡ 2,947
Logistical reasons
Waiting time too long or not available at time required 2,763 774† 3,260 1,180† 523† 451† 104† 596† 9,650
Transport/distance 1,888† 729† 1,625† 1,076† 437† 313† n.p. n.p. 6,604
[service] Not available in area — n.p. 258‡ 362‡ n.p. n.p. n.p. 172‡ 1,070†
Sub-total 3,977 1,232† 4,099 2,323 814† 665 147† 1,129 14,387
Cultural appropriateness of service
Discrimination/not culturally appropriate/language problems 404‡ 303‡ 516‡ 175‡ – – n.p. n.p. 1,500†
Dislikes service/professional, embarrassed, afraid 1,354† 583† 2,435† 350† 204† 216† 126‡ 327‡ 5,594
Felt it would be inadequate 1,172† 356† 1,284† 202† 363‡ 140† n.p. n.p. 3,683
Does not trust the hospital 653‡ 250‡ 1,414† 253‡ n.p. 214‡ n.p. 117‡ 3,031
Sub-total 2,821† 951† 4,029 812† 655† 507† 206† 582† 10,563
Personal reasons
Too busy (including work, personal or family responsibilities) 2,621† 934† 3,115 949† 612† 309† 69‡ 391‡ 9,000
Decided not to seek care 5,762 1,130† 3,563 1,344† 745 531† 96† 821† 13,993
Sub-total 7,402 1,872 6,187 2,118 1,234 748 157† 1,178† 20,895
Other 496‡ n.p. 724† 526† 214‡ 144† n.p. 413‡ 2,694
Total who needed to visit hospital, but didn’t(b) 12,292 3,517 11,428 4,837 2,257 1,680 418† 2,701 39,130
(continued)
Aboriginal and Torres Strait Islander Health Performance Framework 2014 report: detailed analyses
Measure 3.08: Cultural competency 29
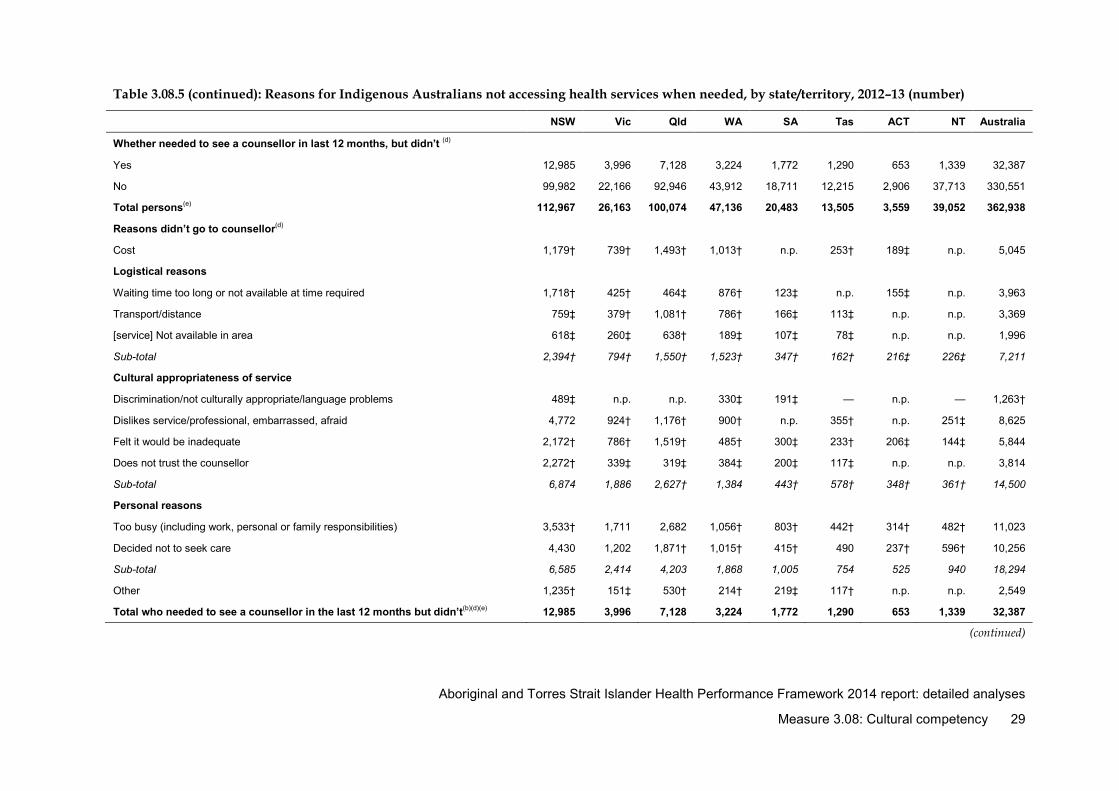
Table 3.08.5 (continued): Reasons for Indigenous Australians not accessing health services when needed, by state/territory, 2012–13 (number)
NSW Vic Qld WA SA Tas ACT NT Australia
Whether needed to see a counsellor in last 12 months, but didn’t (d)
Yes 12,985 3,996 7,128 3,224 1,772 1,290 653 1,339 32,387
No 99,982 22,166 92,946 43,912 18,711 12,215 2,906 37,713 330,551
Total persons(e) 112,967 26,163 100,074 47,136 20,483 13,505 3,559 39,052 362,938
Reasons didn’t go to counsellor(d)
Cost 1,179† 739† 1,493† 1,013† n.p. 253† 189‡ n.p. 5,045
Logistical reasons
Waiting time too long or not available at time required 1,718† 425† 464‡ 876† 123‡ n.p. 155‡ n.p. 3,963
Transport/distance 759‡ 379† 1,081† 786† 166‡ 113‡ n.p. n.p. 3,369
[service] Not available in area 618‡ 260‡ 638† 189‡ 107‡ 78‡ n.p. n.p. 1,996
Sub-total 2,394† 794† 1,550† 1,523† 347† 162† 216‡ 226‡ 7,211
Cultural appropriateness of service
Discrimination/not culturally appropriate/language problems 489‡ n.p. n.p. 330‡ 191‡ — n.p. — 1,263†
Dislikes service/professional, embarrassed, afraid 4,772 924† 1,176† 900† n.p. 355† n.p. 251‡ 8,625
Felt it would be inadequate 2,172† 786† 1,519† 485† 300‡ 233† 206‡ 144‡ 5,844
Does not trust the counsellor 2,272† 339‡ 319‡ 384‡ 200‡ 117‡ n.p. n.p. 3,814
Sub-total 6,874 1,886 2,627† 1,384 443† 578† 348† 361† 14,500
Personal reasons
Too busy (including work, personal or family responsibilities) 3,533† 1,711 2,682 1,056† 803† 442† 314† 482† 11,023
Decided not to seek care 4,430 1,202 1,871† 1,015† 415† 490 237† 596† 10,256
Sub-total 6,585 2,414 4,203 1,868 1,005 754 525 940 18,294
Other 1,235† 151‡ 530† 214† 219‡ 117† n.p. n.p. 2,549
Total who needed to see a counsellor in the last 12 months but didn’t(b)(d)(e) 12,985 3,996 7,128 3,224 1,772 1,290 653 1,339 32,387
(continued)
Aboriginal and Torres Strait Islander Health Performance Framework 2014 report: detailed analyses
30 Measure 3.08: Cultural competency
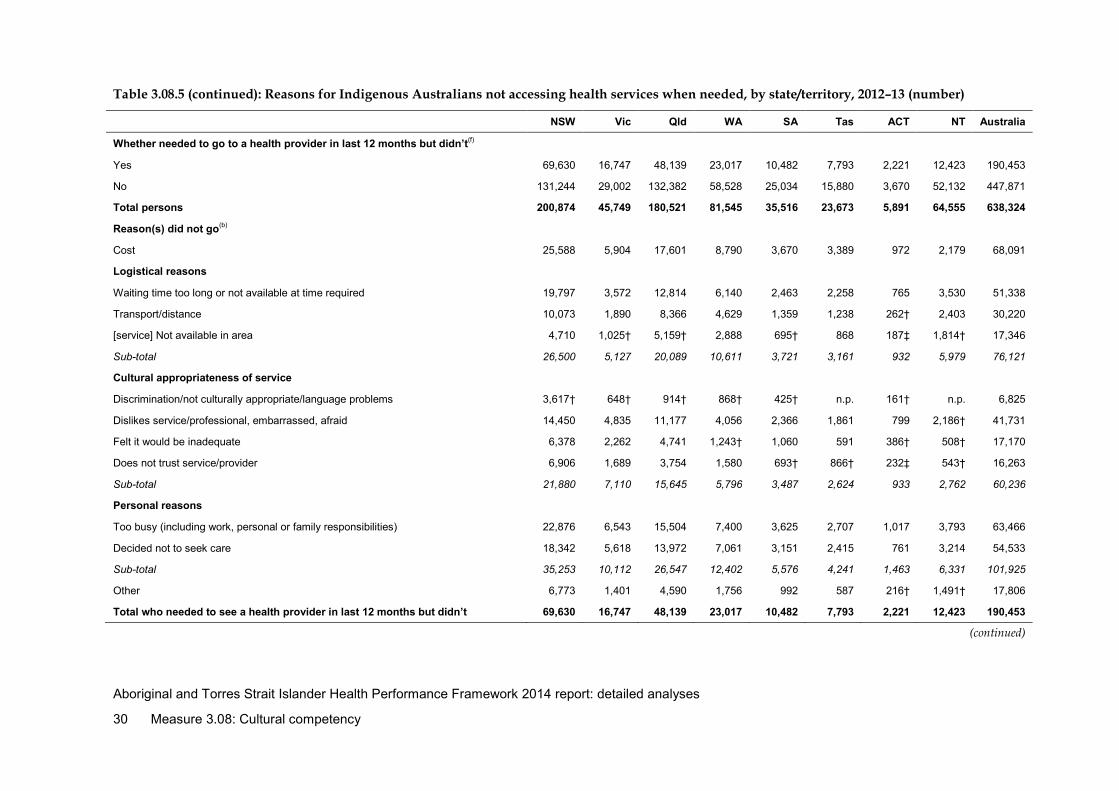
Table 3.08.5 (continued): Reasons for Indigenous Australians not accessing health services when needed, by state/territory, 2012–13 (number)
NSW Vic Qld WA SA Tas ACT NT Australia
Whether needed to go to a health provider in last 12 months but didn’t(f)
Yes 69,630 16,747 48,139 23,017 10,482 7,793 2,221 12,423 190,453
No 131,244 29,002 132,382 58,528 25,034 15,880 3,670 52,132 447,871
Total persons 200,874 45,749 180,521 81,545 35,516 23,673 5,891 64,555 638,324
Reason(s) did not go(b)
Cost 25,588 5,904 17,601 8,790 3,670 3,389 972 2,179 68,091
Logistical reasons
Waiting time too long or not available at time required 19,797 3,572 12,814 6,140 2,463 2,258 765 3,530 51,338
Transport/distance 10,073 1,890 8,366 4,629 1,359 1,238 262† 2,403 30,220
[service] Not available in area 4,710 1,025† 5,159† 2,888 695† 868 187‡ 1,814† 17,346
Sub-total 26,500 5,127 20,089 10,611 3,721 3,161 932 5,979 76,121
Cultural appropriateness of service
Discrimination/not culturally appropriate/language problems 3,617† 648† 914† 868† 425† n.p. 161† n.p. 6,825
Dislikes service/professional, embarrassed, afraid 14,450 4,835 11,177 4,056 2,366 1,861 799 2,186† 41,731
Felt it would be inadequate 6,378 2,262 4,741 1,243† 1,060 591 386† 508† 17,170
Does not trust service/provider 6,906 1,689 3,754 1,580 693† 866† 232‡ 543† 16,263
Sub-total 21,880 7,110 15,645 5,796 3,487 2,624 933 2,762 60,236
Personal reasons
Too busy (including work, personal or family responsibilities) 22,876 6,543 15,504 7,400 3,625 2,707 1,017 3,793 63,466
Decided not to seek care 18,342 5,618 13,972 7,061 3,151 2,415 761 3,214 54,533
Sub-total 35,253 10,112 26,547 12,402 5,576 4,241 1,463 6,331 101,925
Other 6,773 1,401 4,590 1,756 992 587 216† 1,491† 17,806
Total who needed to see a health provider in last 12 months but didn’t 69,630 16,747 48,139 23,017 10,482 7,793 2,221 12,423 190,453
(continued)
Aboriginal and Torres Strait Islander Health Performance Framework 2014 report: detailed analyses
Measure 3.08: Cultural competency 31
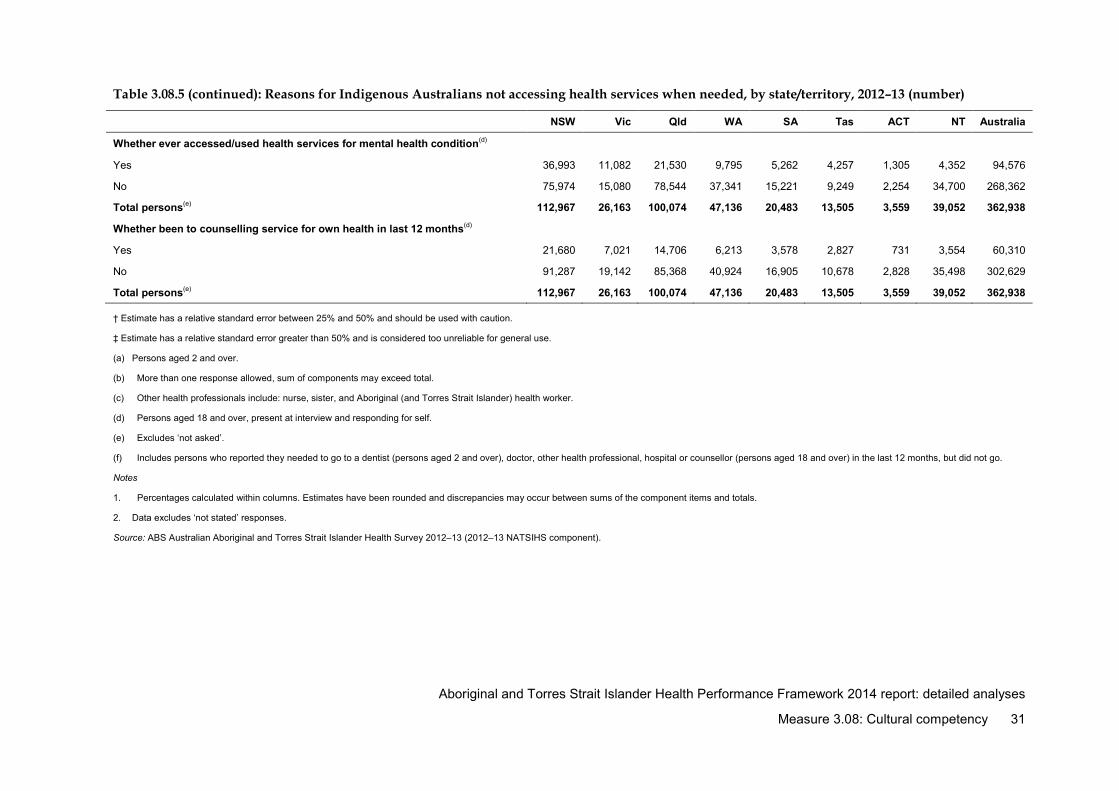
Table 3.08.5 (continued): Reasons for Indigenous Australians not accessing health services when needed, by state/territory, 2012–13 (number)
NSW Vic Qld WA SA Tas ACT NT Australia
Whether ever accessed/used health services for mental health condition(d)
Yes 36,993 11,082 21,530 9,795 5,262 4,257 1,305 4,352 94,576
No 75,974 15,080 78,544 37,341 15,221 9,249 2,254 34,700 268,362
Total persons(e) 112,967 26,163 100,074 47,136 20,483 13,505 3,559 39,052 362,938
Whether been to counselling service for own health in last 12 months(d)
Yes 21,680 7,021 14,706 6,213 3,578 2,827 731 3,554 60,310
No 91,287 19,142 85,368 40,924 16,905 10,678 2,828 35,498 302,629
Total persons(e) 112,967 26,163 100,074 47,136 20,483 13,505 3,559 39,052 362,938
† Estimate has a relative standard error between 25% and 50% and should be used with caution.
‡ Estimate has a relative standard error greater than 50% and is considered too unreliable for general use.
(a) Persons aged 2 and over.
(b) More than one response allowed, sum of components may exceed total.
(c) Other health professionals include: nurse, sister, and Aboriginal (and Torres Strait Islander) health worker.
(d) Persons aged 18 and over, present at interview and responding for self.
(e) Excludes ‘not asked’.
(f) Includes persons who reported they needed to go to a dentist (persons aged 2 and over), doctor, other health professional, hospital or counsellor (persons aged 18 and over) in the last 12 months, but did not go.
Notes
1. Percentages calculated within columns. Estimates have been rounded and discrepancies may occur between sums of the component items and totals.
2. Data excludes ‘not stated’ responses.
Source: ABS Australian Aboriginal and Torres Strait Islander Health Survey 2012–13 (2012–13 NATSIHS component).
Aboriginal and Torres Strait Islander Health Performance Framework 2014 report: detailed analyses
32 Measure 3.08: Cultural competency
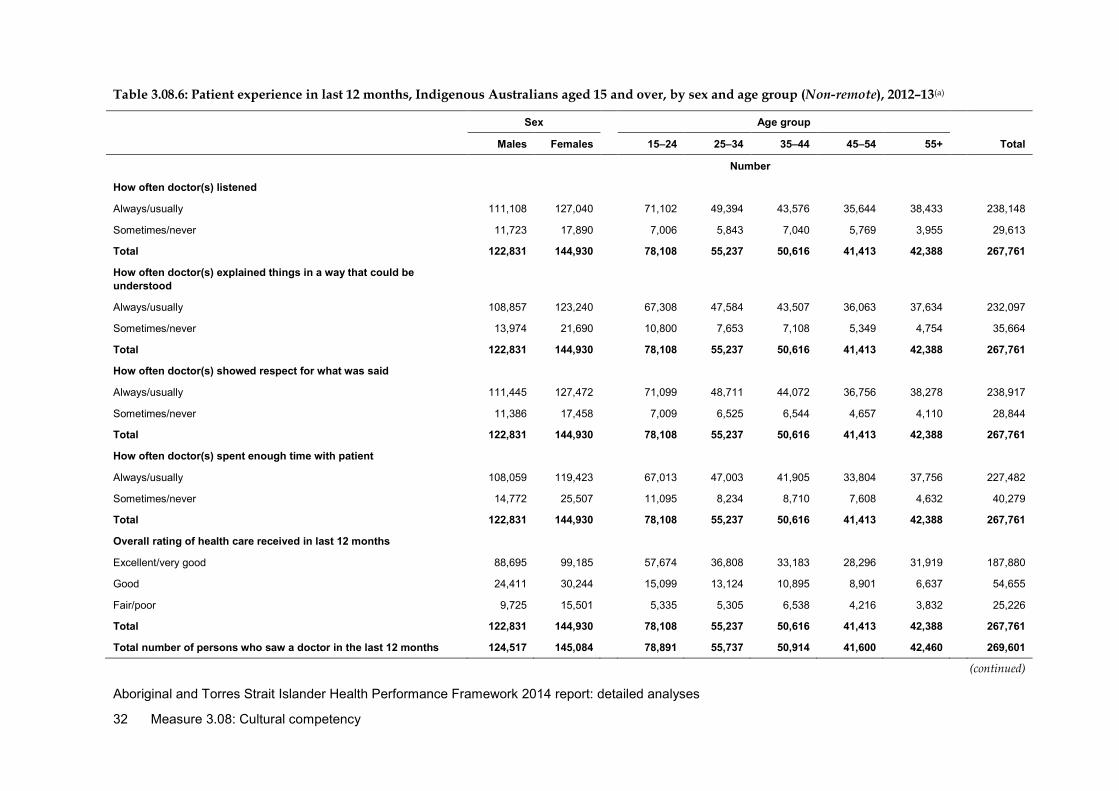
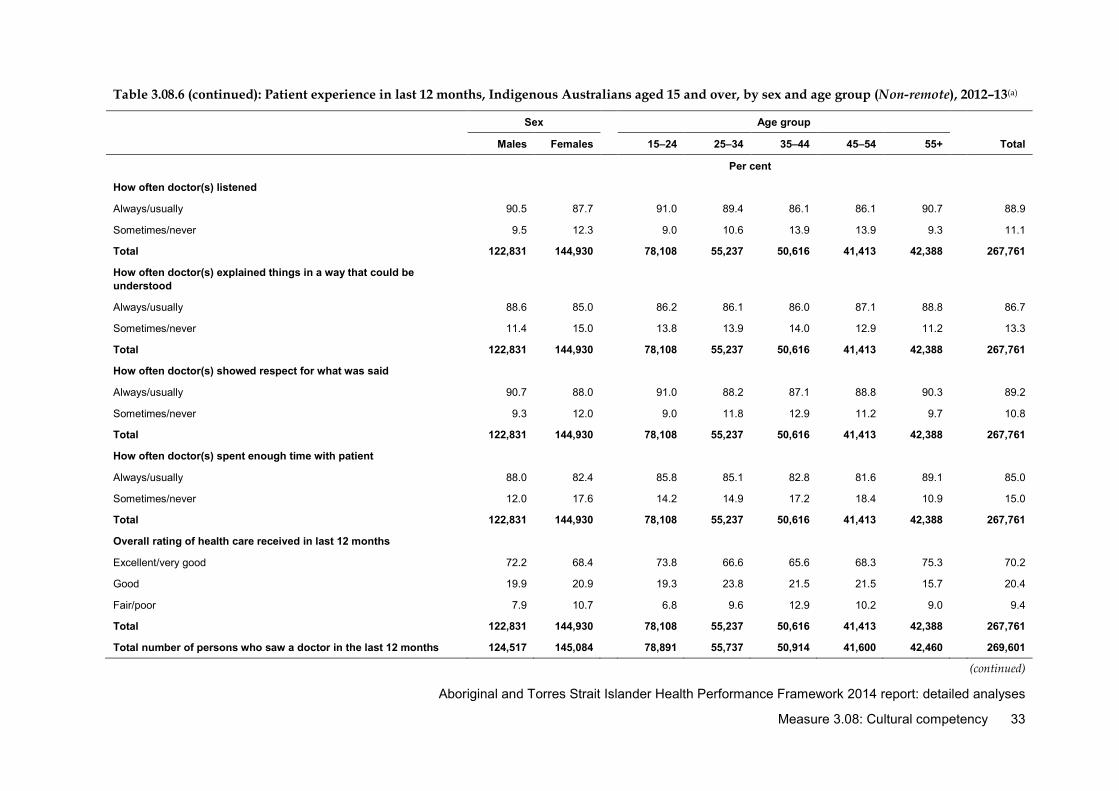
Table 3.08.6: Patient experience in last 12 months, Indigenous Australians aged 15 and over, by sex and age group (Non-remote), 2012–13(a)
Sex
Age group
Males Females 15–24 25–34 35–44 45–54 55+ Total
Number
How often doctor(s) listened
Always/usually 111,108 127,040
71,102 49,394 43,576 35,644 38,433
238,148
Sometimes/never 11,723 17,890
7,006 5,843 7,040 5,769 3,955
29,613
Total 122,831 144,930
78,108 55,237 50,616 41,413 42,388
267,761
How often doctor(s) explained things in a way that could be understood
Always/usually 108,857 123,240
67,308 47,584 43,507 36,063 37,634
232,097
Sometimes/never 13,974 21,690
10,800 7,653 7,108 5,349 4,754
35,664
Total 122,831 144,930
78,108 55,237 50,616 41,413 42,388
267,761
How often doctor(s) showed respect for what was said
Always/usually 111,445 127,472
71,099 48,711 44,072 36,756 38,278
238,917
Sometimes/never 11,386 17,458
7,009 6,525 6,544 4,657 4,110
28,844
Total 122,831 144,930
78,108 55,237 50,616 41,413 42,388
267,761
How often doctor(s) spent enough time with patient
Always/usually 108,059 119,423
67,013 47,003 41,905 33,804 37,756
227,482
Sometimes/never 14,772 25,507
11,095 8,234 8,710 7,608 4,632
40,279
Total 122,831 144,930
78,108 55,237 50,616 41,413 42,388
267,761
Overall rating of health care received in last 12 months
Excellent/very good 88,695 99,185
57,674 36,808 33,183 28,296 31,919
187,880
Good 24,411 30,244
15,099 13,124 10,895 8,901 6,637
54,655
Fair/poor 9,725 15,501
5,335 5,305 6,538 4,216 3,832
25,226
Total 122,831 144,930
78,108 55,237 50,616 41,413 42,388
267,761
Total number of persons who saw a doctor in the last 12 months 124,517 145,084 78,891 55,737 50,914 41,600 42,460 269,601
(continued)
Aboriginal and Torres Strait Islander Health Performance Framework 2014 report: detailed analyses
Measure 3.08: Cultural competency 33
Table 3.08.6 (continued): Patient experience in last 12 months, Indigenous Australians aged 15 and over, by sex and age group (Non-remote), 2012–13(a)
Sex
Age group
Males Females 15–24 25–34 35–44 45–54 55+ Total
Per cent
How often doctor(s) listened
Always/usually 90.5 87.7
91.0 89.4 86.1 86.1 90.7
88.9
Sometimes/never 9.5 12.3
9.0 10.6 13.9 13.9 9.3
11.1
Total 122,831 144,930
78,108 55,237 50,616 41,413 42,388
267,761
How often doctor(s) explained things in a way that could be understood
Always/usually 88.6 85.0
86.2 86.1 86.0 87.1 88.8
86.7
Sometimes/never 11.4 15.0
13.8 13.9 14.0 12.9 11.2
13.3
Total 122,831 144,930
78,108 55,237 50,616 41,413 42,388
267,761
How often doctor(s) showed respect for what was said
Always/usually 90.7 88.0
91.0 88.2 87.1 88.8 90.3
89.2
Sometimes/never 9.3 12.0
9.0 11.8 12.9 11.2 9.7
10.8
Total 122,831 144,930
78,108 55,237 50,616 41,413 42,388
267,761
How often doctor(s) spent enough time with patient
Always/usually 88.0 82.4
85.8 85.1 82.8 81.6 89.1
85.0
Sometimes/never 12.0 17.6
14.2 14.9 17.2 18.4 10.9
15.0
Total 122,831 144,930
78,108 55,237 50,616 41,413 42,388
267,761
Overall rating of health care received in last 12 months
Excellent/very good 72.2 68.4
73.8 66.6 65.6 68.3 75.3
70.2
Good 19.9 20.9
19.3 23.8 21.5 21.5 15.7
20.4
Fair/poor 7.9 10.7
6.8 9.6 12.9 10.2 9.0
9.4
Total 122,831 144,930
78,108 55,237 50,616 41,413 42,388
267,761
Total number of persons who saw a doctor in the last 12 months 124,517 145,084 78,891 55,737 50,914 41,600 42,460 269,601
(continued)
Aboriginal and Torres Strait Islander Health Performance Framework 2014 report: detailed analyses
34 Measure 3.08: Cultural competency
Table 3.08.6 (continued): Patient experience in last 12 months, Indigenous Australians aged 15 and over, by sex and age group (Non-remote), 2012–13(a) (a) Self-reported data for people aged 15 and over in non-remote areas who consulted a doctor or specialist in the last 12 months. Data excludes a small number of people who were not present at interview for whom
responses were provided by a proxy.
Note: Percentages add within columns. Estimates have been rounded and discrepancies may occur between sums of the component items and totals.
Source: ABS Australian Aboriginal and Torres Strait Islander Health Survey 2012–13 (2012–13 NATSIHS component).
Aboriginal and Torres Strait Islander Health Performance Framework 2014 report: detailed analyses
Measure 3.08: Cultural competency 35
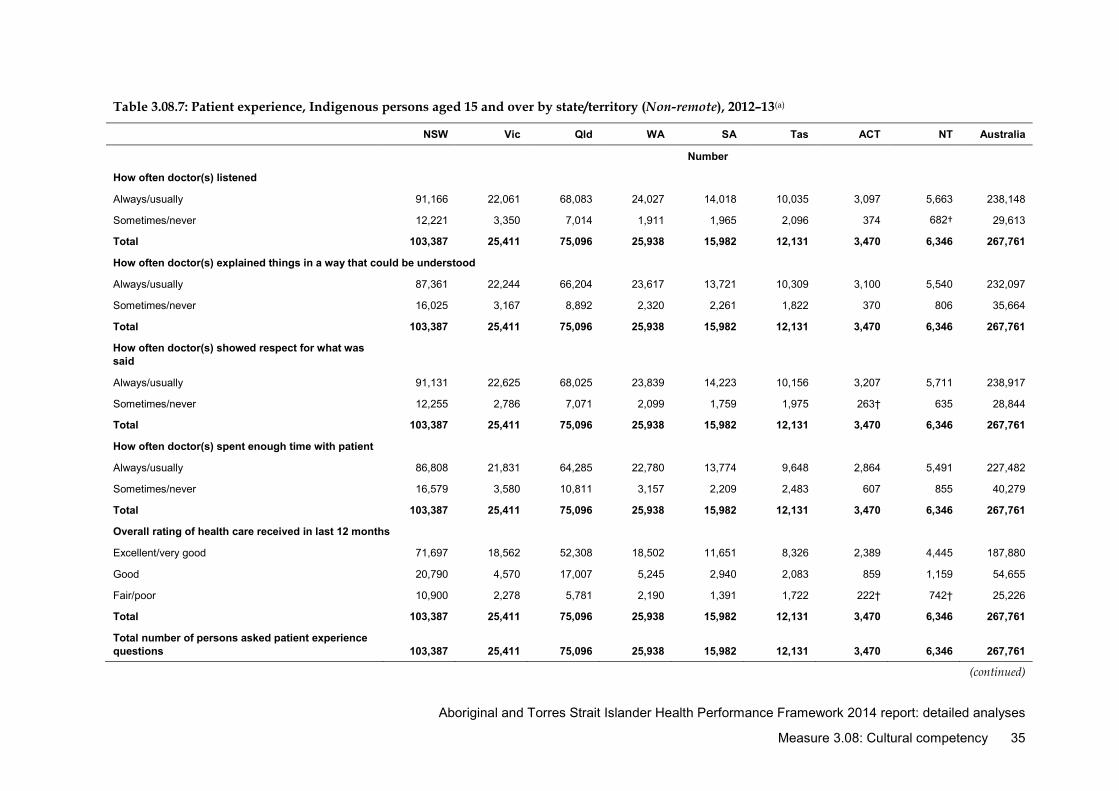
Table 3.08.7: Patient experience, Indigenous persons aged 15 and over by state/territory (Non-remote), 2012–13(a)
NSW Vic Qld WA SA Tas ACT NT Australia
Number
How often doctor(s) listened
Always/usually 91,166 22,061 68,083 24,027 14,018 10,035 3,097 5,663 238,148
Sometimes/never 12,221 3,350 7,014 1,911 1,965 2,096 374 682† 29,613
Total 103,387 25,411 75,096 25,938 15,982 12,131 3,470 6,346 267,761
How often doctor(s) explained things in a way that could be understood
Always/usually 87,361 22,244 66,204 23,617 13,721 10,309 3,100 5,540 232,097
Sometimes/never 16,025 3,167 8,892 2,320 2,261 1,822 370 806 35,664
Total 103,387 25,411 75,096 25,938 15,982 12,131 3,470 6,346 267,761
How often doctor(s) showed respect for what was said
Always/usually 91,131 22,625 68,025 23,839 14,223 10,156 3,207 5,711 238,917
Sometimes/never 12,255 2,786 7,071 2,099 1,759 1,975 263† 635 28,844
Total 103,387 25,411 75,096 25,938 15,982 12,131 3,470 6,346 267,761
How often doctor(s) spent enough time with patient
Always/usually 86,808 21,831 64,285 22,780 13,774 9,648 2,864 5,491 227,482
Sometimes/never 16,579 3,580 10,811 3,157 2,209 2,483 607 855 40,279
Total 103,387 25,411 75,096 25,938 15,982 12,131 3,470 6,346 267,761
Overall rating of health care received in last 12 months
Excellent/very good 71,697 18,562 52,308 18,502 11,651 8,326 2,389 4,445 187,880
Good 20,790 4,570 17,007 5,245 2,940 2,083 859 1,159 54,655
Fair/poor 10,900 2,278 5,781 2,190 1,391 1,722 222† 742† 25,226
Total 103,387 25,411 75,096 25,938 15,982 12,131 3,470 6,346 267,761
Total number of persons asked patient experience questions 103,387 25,411 75,096 25,938 15,982 12,131 3,470 6,346 267,761
(continued)
Aboriginal and Torres Strait Islander Health Performance Framework 2014 report: detailed analyses
36 Measure 3.08: Cultural competency
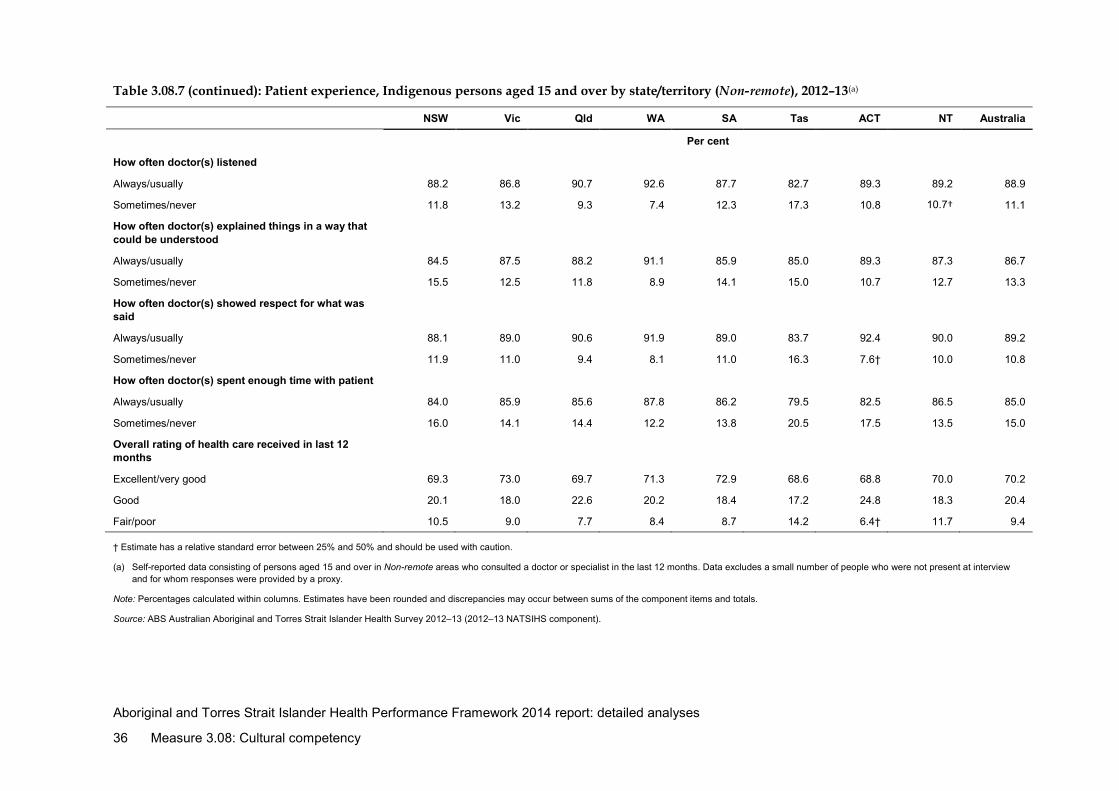
Table 3.08.7 (continued): Patient experience, Indigenous persons aged 15 and over by state/territory (Non-remote), 2012–13(a)
NSW Vic Qld WA SA Tas ACT NT Australia
Per cent
How often doctor(s) listened
Always/usually 88.2 86.8 90.7 92.6 87.7 82.7 89.3 89.2 88.9
Sometimes/never 11.8 13.2 9.3 7.4 12.3 17.3 10.8 10.7† 11.1
How often doctor(s) explained things in a way that could be understood
Always/usually 84.5 87.5 88.2 91.1 85.9 85.0 89.3 87.3 86.7
Sometimes/never 15.5 12.5 11.8 8.9 14.1 15.0 10.7 12.7 13.3
How often doctor(s) showed respect for what was said
Always/usually 88.1 89.0 90.6 91.9 89.0 83.7 92.4 90.0 89.2
Sometimes/never 11.9 11.0 9.4 8.1 11.0 16.3 7.6† 10.0 10.8
How often doctor(s) spent enough time with patient
Always/usually 84.0 85.9 85.6 87.8 86.2 79.5 82.5 86.5 85.0
Sometimes/never 16.0 14.1 14.4 12.2 13.8 20.5 17.5 13.5 15.0
Overall rating of health care received in last 12 months
Excellent/very good 69.3 73.0 69.7 71.3 72.9 68.6 68.8 70.0 70.2
Good 20.1 18.0 22.6 20.2 18.4 17.2 24.8 18.3 20.4
Fair/poor 10.5 9.0 7.7 8.4 8.7 14.2 6.4† 11.7 9.4
† Estimate has a relative standard error between 25% and 50% and should be used with caution.
(a) Self-reported data consisting of persons aged 15 and over in Non-remote areas who consulted a doctor or specialist in the last 12 months. Data excludes a small number of people who were not present at interview and for whom responses were provided by a proxy.
Note: Percentages calculated within columns. Estimates have been rounded and discrepancies may occur between sums of the component items and totals.
Source: ABS Australian Aboriginal and Torres Strait Islander Health Survey 2012–13 (2012–13 NATSIHS component).
Aboriginal and Torres Strait Islander Health Performance Framework 2014 report: detailed analyses
Measure 3.08: Cultural competency 37
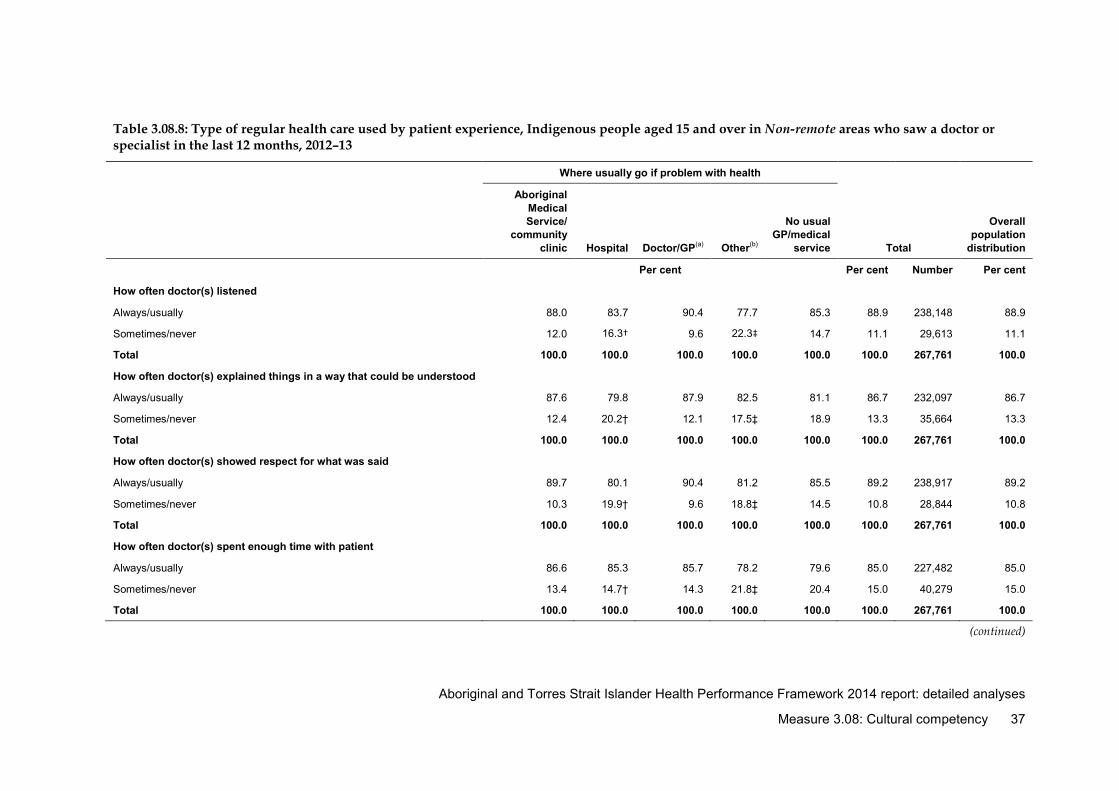
Table 3.08.8: Type of regular health care used by patient experience, Indigenous people aged 15 and over in Non-remote areas who saw a doctor or specialist in the last 12 months, 2012–13
Where usually go if problem with health
Aboriginal Medical Service/
community clinic Hospital Doctor/GP(a) Other(b)
No usual GP/medical
service Total
Overall population
distribution
Per cent Per cent Number Per cent
How often doctor(s) listened
Always/usually 88.0 83.7 90.4 77.7 85.3 88.9 238,148 88.9
Sometimes/never 12.0 16.3† 9.6 22.3‡ 14.7 11.1 29,613 11.1
Total 100.0 100.0 100.0 100.0 100.0 100.0 267,761 100.0
How often doctor(s) explained things in a way that could be understood
Always/usually 87.6 79.8 87.9 82.5 81.1 86.7 232,097 86.7
Sometimes/never 12.4 20.2† 12.1 17.5‡ 18.9 13.3 35,664 13.3
Total 100.0 100.0 100.0 100.0 100.0 100.0 267,761 100.0
How often doctor(s) showed respect for what was said
Always/usually 89.7 80.1 90.4 81.2 85.5 89.2 238,917 89.2
Sometimes/never 10.3 19.9† 9.6 18.8‡ 14.5 10.8 28,844 10.8
Total 100.0 100.0 100.0 100.0 100.0 100.0 267,761 100.0
How often doctor(s) spent enough time with patient
Always/usually 86.6 85.3 85.7 78.2 79.6 85.0 227,482 85.0
Sometimes/never 13.4 14.7† 14.3 21.8‡ 20.4 15.0 40,279 15.0
Total 100.0 100.0 100.0 100.0 100.0 100.0 267,761 100.0
(continued)
Aboriginal and Torres Strait Islander Health Performance Framework 2014 report: detailed analyses
38 Measure 3.08: Cultural competency
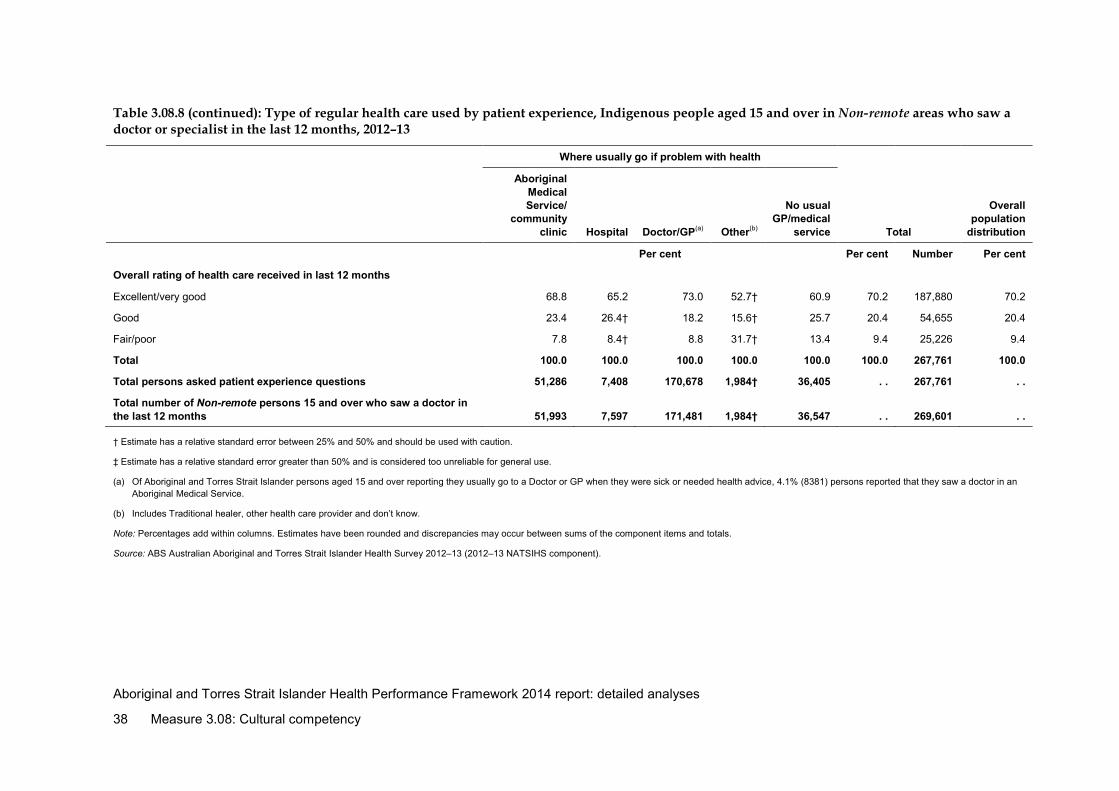
Table 3.08.8 (continued): Type of regular health care used by patient experience, Indigenous people aged 15 and over in Non-remote areas who saw a doctor or specialist in the last 12 months, 2012–13
Where usually go if problem with health
Aboriginal Medical Service/
community clinic Hospital Doctor/GP(a) Other(b)
No usual GP/medical
service Total
Overall population
distribution
Per cent Per cent Number Per cent
Overall rating of health care received in last 12 months
Excellent/very good 68.8 65.2 73.0 52.7† 60.9 70.2 187,880 70.2
Good 23.4 26.4† 18.2 15.6† 25.7 20.4 54,655 20.4
Fair/poor 7.8 8.4† 8.8 31.7† 13.4 9.4 25,226 9.4
Total 100.0 100.0 100.0 100.0 100.0 100.0 267,761 100.0
Total persons asked patient experience questions 51,286 7,408 170,678 1,984† 36,405 . . 267,761 . .
Total number of Non-remote persons 15 and over who saw a doctor in the last 12 months 51,993 7,597 171,481 1,984† 36,547 . . 269,601 . .
† Estimate has a relative standard error between 25% and 50% and should be used with caution.
‡ Estimate has a relative standard error greater than 50% and is considered too unreliable for general use.
(a) Of Aboriginal and Torres Strait Islander persons aged 15 and over reporting they usually go to a Doctor or GP when they were sick or needed health advice, 4.1% (8381) persons reported that they saw a doctor in an Aboriginal Medical Service.
(b) Includes Traditional healer, other health care provider and don’t know.
Note: Percentages add within columns. Estimates have been rounded and discrepancies may occur between sums of the component items and totals.
Source: ABS Australian Aboriginal and Torres Strait Islander Health Survey 2012–13 (2012–13 NATSIHS component).
Aboriginal and Torres Strait Islander Health Performance Framework 2014 report: detailed analyses
Measure 3.08: Cultural competency 39
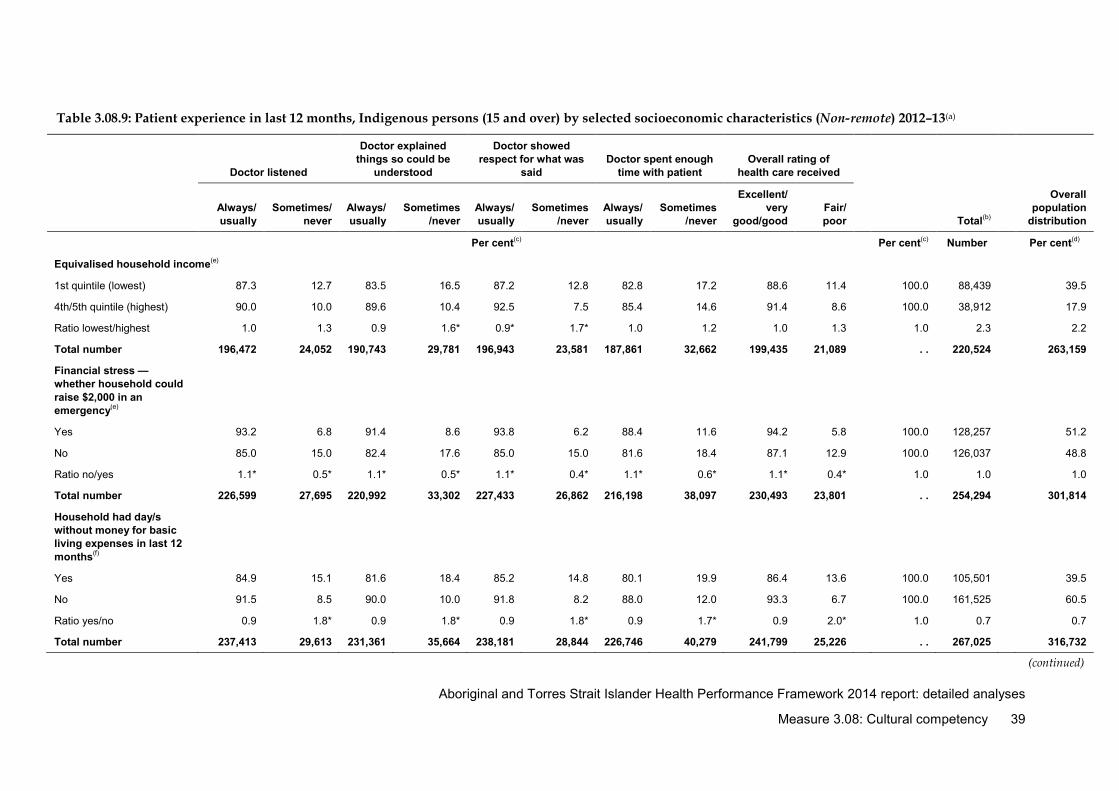
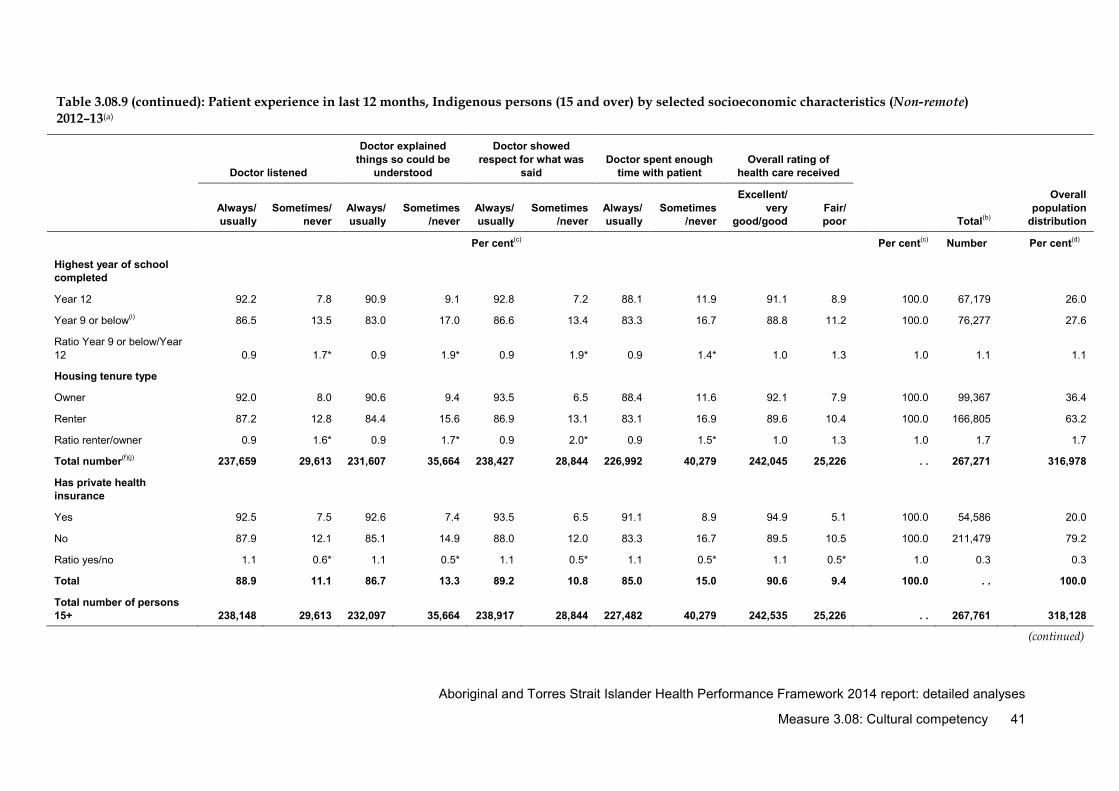
Table 3.08.9: Patient experience in last 12 months, Indigenous persons (15 and over) by selected socioeconomic characteristics (Non-remote) 2012–13(a)
Doctor listened
Doctor explained things so could be
understood
Doctor showed respect for what was
said Doctor spent enough
time with patient Overall rating of
health care received
Always/ usually
Sometimes/ never
Always/ usually
Sometimes/never
Always/ usually
Sometimes/never
Always/ usually
Sometimes/never
Excellent/ very
good/good Fair/ poor Total(b)
Overall population
distribution
Per cent(c)
Per cent(c) Number
Per cent(d)
Equivalised household income(e)
1st quintile (lowest) 87.3 12.7 83.5 16.5 87.2 12.8 82.8 17.2 88.6 11.4
100.0 88,439
39.5
4th/5th quintile (highest) 90.0 10.0 89.6 10.4 92.5 7.5 85.4 14.6 91.4 8.6
100.0 38,912
17.9
Ratio lowest/highest 1.0 1.3 0.9 1.6* 0.9* 1.7* 1.0 1.2 1.0 1.3
1.0 2.3
2.2
Total number 196,472 24,052 190,743 29,781 196,943 23,581 187,861 32,662 199,435 21,089
. . 220,524
263,159
Financial stress — whether household could raise $2,000 in an emergency(e)
Yes 93.2 6.8 91.4 8.6 93.8 6.2 88.4 11.6 94.2 5.8 100.0 128,257 51.2
No 85.0 15.0 82.4 17.6 85.0 15.0 81.6 18.4 87.1 12.9 100.0 126,037 48.8
Ratio no/yes 1.1* 0.5* 1.1* 0.5* 1.1* 0.4* 1.1* 0.6* 1.1* 0.4* 1.0 1.0 1.0
Total number 226,599 27,695 220,992 33,302 227,433 26,862 216,198 38,097 230,493 23,801 . . 254,294 301,814
Household had day/s without money for basic living expenses in last 12 months(f)
Yes 84.9 15.1 81.6 18.4 85.2 14.8 80.1 19.9 86.4 13.6
100.0 105,501
39.5
No 91.5 8.5 90.0 10.0 91.8 8.2 88.0 12.0 93.3 6.7
100.0 161,525
60.5
Ratio yes/no 0.9 1.8* 0.9 1.8* 0.9 1.8* 0.9 1.7* 0.9 2.0*
1.0 0.7
0.7
Total number 237,413 29,613 231,361 35,664 238,181 28,844 226,746 40,279 241,799 25,226
. . 267,025
316,732
(continued)
Aboriginal and Torres Strait Islander Health Performance Framework 2014 report: detailed analyses
40 Measure 3.08: Cultural competency
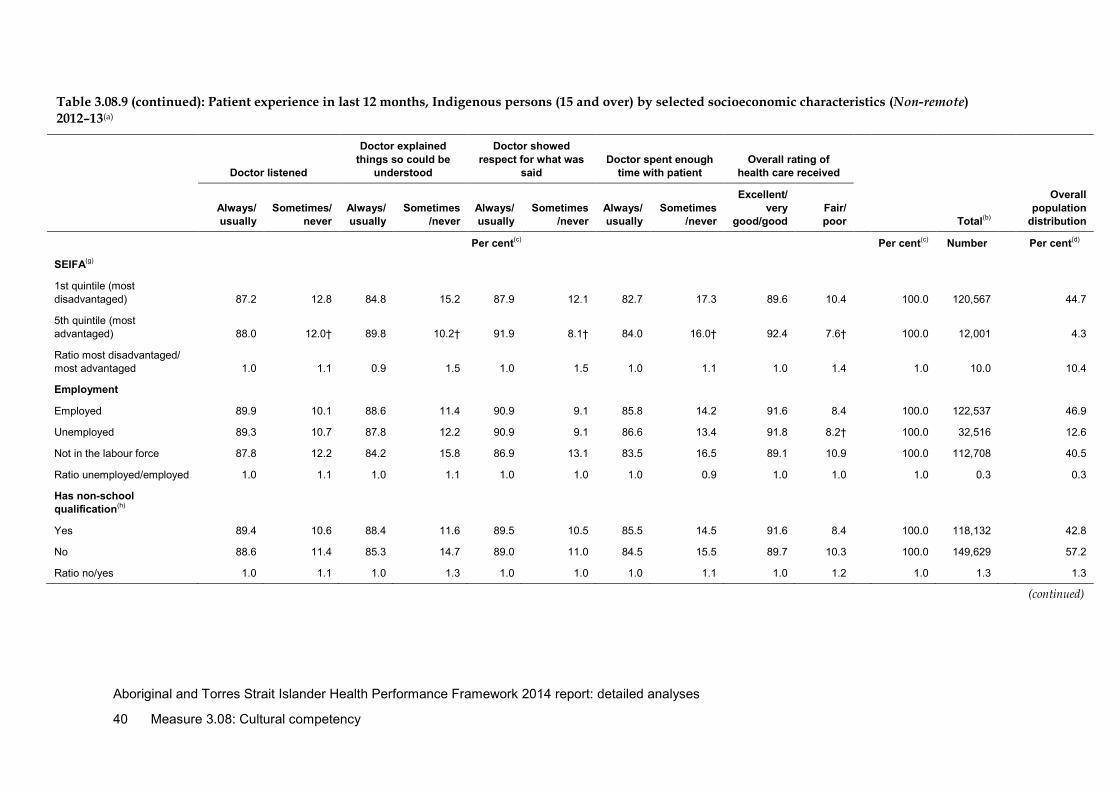
Table 3.08.9 (continued): Patient experience in last 12 months, Indigenous persons (15 and over) by selected socioeconomic characteristics (Non-remote) 2012–13(a)
Doctor listened
Doctor explained things so could be
understood
Doctor showed respect for what was
said Doctor spent enough
time with patient Overall rating of
health care received
Always/ usually
Sometimes/ never
Always/ usually
Sometimes/never
Always/ usually
Sometimes/never
Always/ usually
Sometimes/never
Excellent/ very
good/good Fair/ poor Total(b)
Overall population
distribution
Per cent(c)
Per cent(c) Number
Per cent(d)
SEIFA(g)
1st quintile (most disadvantaged) 87.2 12.8 84.8 15.2 87.9 12.1 82.7 17.3 89.6 10.4
100.0 120,567
44.7
5th quintile (most advantaged) 88.0 12.0† 89.8 10.2† 91.9 8.1† 84.0 16.0† 92.4 7.6†
100.0 12,001
4.3
Ratio most disadvantaged/ most advantaged 1.0 1.1 0.9 1.5 1.0 1.5 1.0 1.1 1.0 1.4
1.0 10.0
10.4
Employment
Employed 89.9 10.1 88.6 11.4 90.9 9.1 85.8 14.2 91.6 8.4
100.0 122,537
46.9
Unemployed 89.3 10.7 87.8 12.2 90.9 9.1 86.6 13.4 91.8 8.2†
100.0 32,516
12.6
Not in the labour force 87.8 12.2 84.2 15.8 86.9 13.1 83.5 16.5 89.1 10.9
100.0 112,708
40.5
Ratio unemployed/employed 1.0 1.1 1.0 1.1 1.0 1.0 1.0 0.9 1.0 1.0
1.0 0.3
0.3
Has non-school qualification(h)
Yes 89.4 10.6 88.4 11.6 89.5 10.5 85.5 14.5 91.6 8.4
100.0 118,132
42.8
No 88.6 11.4 85.3 14.7 89.0 11.0 84.5 15.5 89.7 10.3
100.0 149,629
57.2
Ratio no/yes 1.0 1.1 1.0 1.3 1.0 1.0 1.0 1.1 1.0 1.2
1.0 1.3
1.3
(continued)
Aboriginal and Torres Strait Islander Health Performance Framework 2014 report: detailed analyses
Measure 3.08: Cultural competency 41
Table 3.08.9 (continued): Patient experience in last 12 months, Indigenous persons (15 and over) by selected socioeconomic characteristics (Non-remote) 2012–13(a)
Doctor listened
Doctor explained things so could be
understood
Doctor showed respect for what was
said Doctor spent enough
time with patient Overall rating of
health care received
Always/ usually
Sometimes/ never
Always/ usually
Sometimes/never
Always/ usually
Sometimes/never
Always/ usually
Sometimes/never
Excellent/ very
good/good Fair/ poor Total(b)
Overall population
distribution
Per cent(c)
Per cent(c) Number
Per cent(d)
Highest year of school completed
Year 12 92.2 7.8 90.9 9.1 92.8 7.2 88.1 11.9 91.1 8.9
100.0 67,179
26.0
Year 9 or below(i) 86.5 13.5 83.0 17.0 86.6 13.4 83.3 16.7 88.8 11.2
100.0 76,277
27.6
Ratio Year 9 or below/Year 12 0.9 1.7* 0.9 1.9* 0.9 1.9* 0.9 1.4* 1.0 1.3
1.0 1.1
1.1
Housing tenure type
Owner 92.0 8.0 90.6 9.4 93.5 6.5 88.4 11.6 92.1 7.9
100.0 99,367
36.4
Renter 87.2 12.8 84.4 15.6 86.9 13.1 83.1 16.9 89.6 10.4
100.0 166,805
63.2
Ratio renter/owner 0.9 1.6* 0.9 1.7* 0.9 2.0* 0.9 1.5* 1.0 1.3
1.0 1.7
1.7
Total number(f)(j) 237,659 29,613 231,607 35,664 238,427 28,844 226,992 40,279 242,045 25,226
. . 267,271
316,978
Has private health insurance
Yes 92.5 7.5 92.6 7.4 93.5 6.5 91.1 8.9 94.9 5.1
100.0 54,586
20.0
No 87.9 12.1 85.1 14.9 88.0 12.0 83.3 16.7 89.5 10.5
100.0 211,479
79.2
Ratio yes/no 1.1 0.6* 1.1 0.5* 1.1 0.5* 1.1 0.5* 1.1 0.5*
1.0 0.3
0.3
Total 88.9 11.1 86.7 13.3 89.2 10.8 85.0 15.0 90.6 9.4
100.0 . .
100.0
Total number of persons 15+ 238,148 29,613 232,097 35,664 238,917 28,844 227,482 40,279 242,535 25,226 . . 267,761 318,128
(continued)
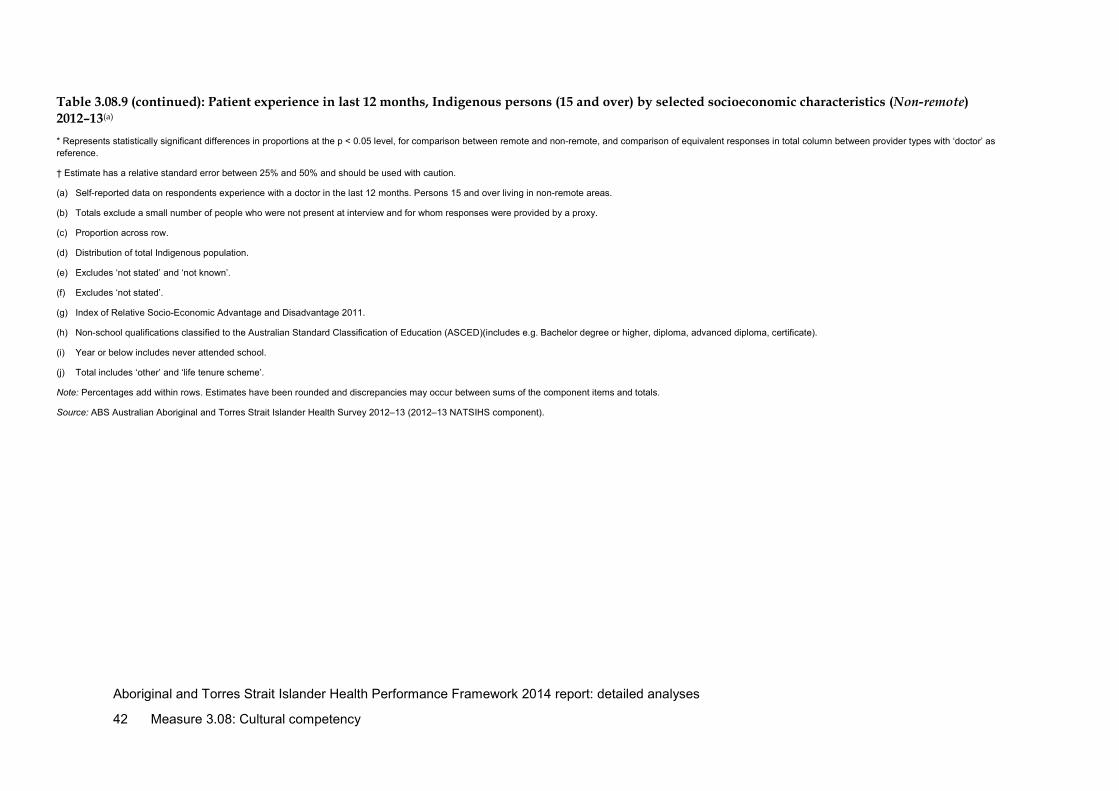
Aboriginal and Torres Strait Islander Health Performance Framework 2014 report: detailed analyses
42 Measure 3.08: Cultural competency
Table 3.08.9 (continued): Patient experience in last 12 months, Indigenous persons (15 and over) by selected socioeconomic characteristics (Non-remote) 2012–13(a) * Represents statistically significant differences in proportions at the p < 0.05 level, for comparison between remote and non-remote, and comparison of equivalent responses in total column between provider types with ‘doctor’ as reference.
† Estimate has a relative standard error between 25% and 50% and should be used with caution.
(a) Self-reported data on respondents experience with a doctor in the last 12 months. Persons 15 and over living in non-remote areas.
(b) Totals exclude a small number of people who were not present at interview and for whom responses were provided by a proxy.
(c) Proportion across row.
(d) Distribution of total Indigenous population.
(e) Excludes ‘not stated’ and ‘not known’.
(f) Excludes ‘not stated’.
(g) Index of Relative Socio-Economic Advantage and Disadvantage 2011.
(h) Non-school qualifications classified to the Australian Standard Classification of Education (ASCED)(includes e.g. Bachelor degree or higher, diploma, advanced diploma, certificate).
(i) Year or below includes never attended school.
(j) Total includes ‘other’ and ‘life tenure scheme’.
Note: Percentages add within rows. Estimates have been rounded and discrepancies may occur between sums of the component items and totals.
Source: ABS Australian Aboriginal and Torres Strait Islander Health Survey 2012–13 (2012–13 NATSIHS component).
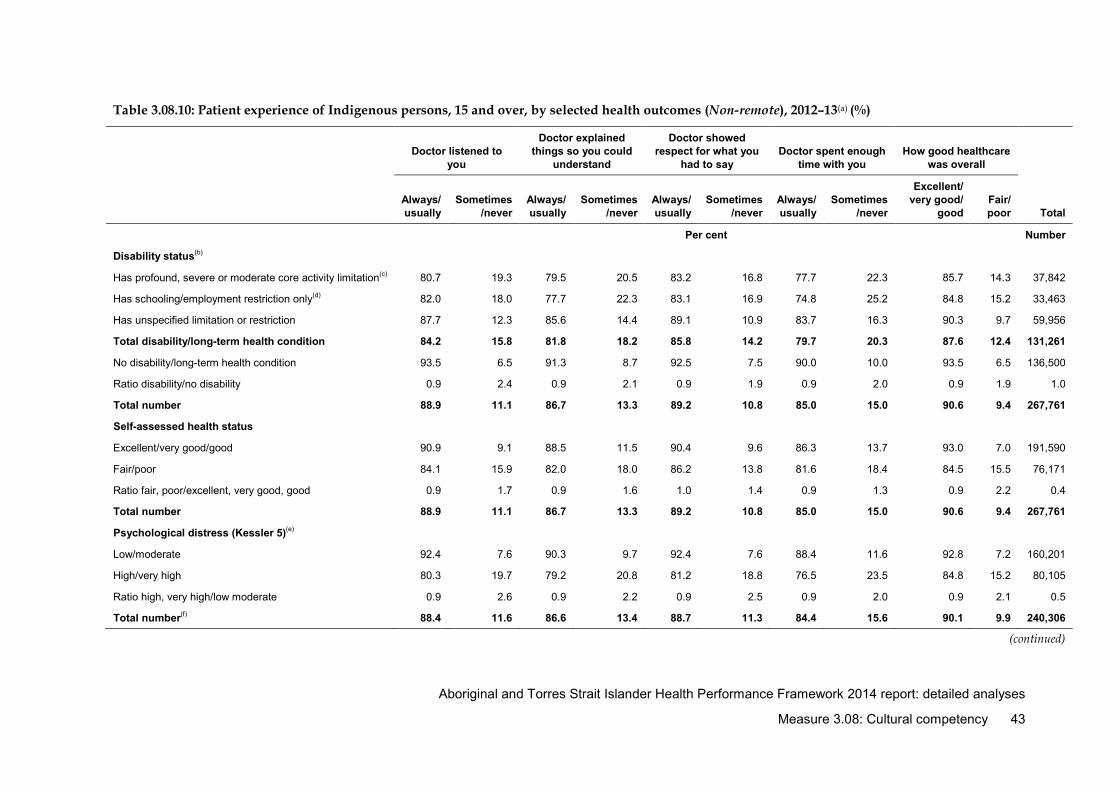
Aboriginal and Torres Strait Islander Health Performance Framework 2014 report: detailed analyses
Measure 3.08: Cultural competency 43
Table 3.08.10: Patient experience of Indigenous persons, 15 and over, by selected health outcomes (Non-remote), 2012–13(a) (%)
Doctor listened to you
Doctor explained things so you could
understand
Doctor showed respect for what you
had to say Doctor spent enough
time with you How good healthcare
was overall
Always/ usually
Sometimes /never
Always/ usually
Sometimes /never
Always/ usually
Sometimes /never
Always/ usually
Sometimes /never
Excellent/ very good/
good Fair/ poor Total
Per cent Number
Disability status(b)
Has profound, severe or moderate core activity limitation(c) 80.7 19.3 79.5 20.5 83.2 16.8 77.7 22.3 85.7 14.3 37,842
Has schooling/employment restriction only(d) 82.0 18.0 77.7 22.3 83.1 16.9 74.8 25.2 84.8 15.2 33,463
Has unspecified limitation or restriction 87.7 12.3 85.6 14.4 89.1 10.9 83.7 16.3 90.3 9.7 59,956
Total disability/long-term health condition 84.2 15.8 81.8 18.2 85.8 14.2 79.7 20.3 87.6 12.4 131,261
No disability/long-term health condition 93.5 6.5 91.3 8.7 92.5 7.5 90.0 10.0 93.5 6.5 136,500
Ratio disability/no disability 0.9 2.4 0.9 2.1 0.9 1.9 0.9 2.0 0.9 1.9 1.0
Total number 88.9 11.1 86.7 13.3 89.2 10.8 85.0 15.0 90.6 9.4 267,761
Self-assessed health status
Excellent/very good/good 90.9 9.1 88.5 11.5 90.4 9.6 86.3 13.7 93.0 7.0 191,590
Fair/poor 84.1 15.9 82.0 18.0 86.2 13.8 81.6 18.4 84.5 15.5 76,171
Ratio fair, poor/excellent, very good, good 0.9 1.7 0.9 1.6 1.0 1.4 0.9 1.3 0.9 2.2 0.4
Total number 88.9 11.1 86.7 13.3 89.2 10.8 85.0 15.0 90.6 9.4 267,761
Psychological distress (Kessler 5)(e)
Low/moderate 92.4 7.6 90.3 9.7 92.4 7.6 88.4 11.6 92.8 7.2 160,201
High/very high 80.3 19.7 79.2 20.8 81.2 18.8 76.5 23.5 84.8 15.2 80,105
Ratio high, very high/low moderate 0.9 2.6 0.9 2.2 0.9 2.5 0.9 2.0 0.9 2.1 0.5
Total number(f) 88.4 11.6 86.6 13.4 88.7 11.3 84.4 15.6 90.1 9.9 240,306
(continued)
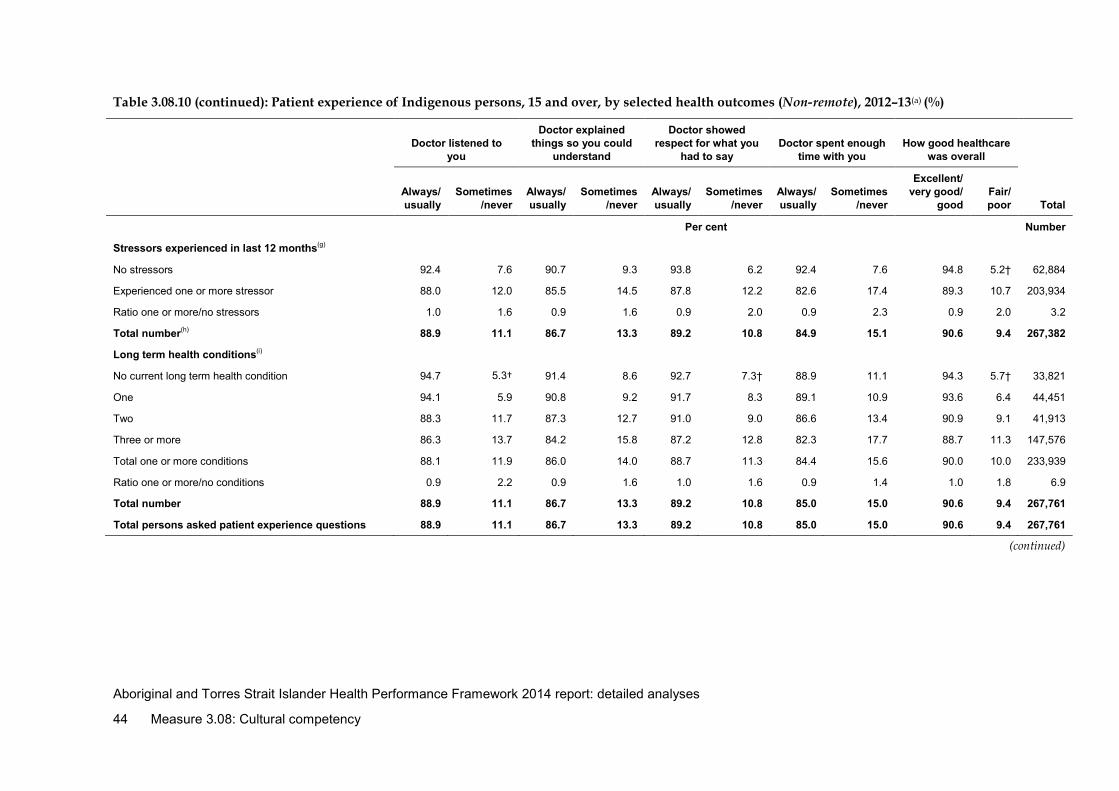
Aboriginal and Torres Strait Islander Health Performance Framework 2014 report: detailed analyses
44 Measure 3.08: Cultural competency
Table 3.08.10 (continued): Patient experience of Indigenous persons, 15 and over, by selected health outcomes (Non-remote), 2012–13(a) (%)
Doctor listened to you
Doctor explained things so you could
understand
Doctor showed respect for what you
had to say Doctor spent enough
time with you How good healthcare
was overall
Always/ usually
Sometimes /never
Always/ usually
Sometimes /never
Always/ usually
Sometimes /never
Always/ usually
Sometimes /never
Excellent/ very good/
good Fair/ poor Total
Per cent Number
Stressors experienced in last 12 months(g)
No stressors 92.4 7.6 90.7 9.3 93.8 6.2 92.4 7.6 94.8 5.2† 62,884
Experienced one or more stressor 88.0 12.0 85.5 14.5 87.8 12.2 82.6 17.4 89.3 10.7 203,934
Ratio one or more/no stressors 1.0 1.6 0.9 1.6 0.9 2.0 0.9 2.3 0.9 2.0 3.2
Total number(h) 88.9 11.1 86.7 13.3 89.2 10.8 84.9 15.1 90.6 9.4 267,382
Long term health conditions(i)
No current long term health condition 94.7 5.3† 91.4 8.6 92.7 7.3† 88.9 11.1 94.3 5.7† 33,821
One 94.1 5.9 90.8 9.2 91.7 8.3 89.1 10.9 93.6 6.4 44,451
Two 88.3 11.7 87.3 12.7 91.0 9.0 86.6 13.4 90.9 9.1 41,913
Three or more 86.3 13.7 84.2 15.8 87.2 12.8 82.3 17.7 88.7 11.3 147,576
Total one or more conditions 88.1 11.9 86.0 14.0 88.7 11.3 84.4 15.6 90.0 10.0 233,939
Ratio one or more/no conditions 0.9 2.2 0.9 1.6 1.0 1.6 0.9 1.4 1.0 1.8 6.9
Total number 88.9 11.1 86.7 13.3 89.2 10.8 85.0 15.0 90.6 9.4 267,761
Total persons asked patient experience questions 88.9 11.1 86.7 13.3 89.2 10.8 85.0 15.0 90.6 9.4 267,761
(continued)
Aboriginal and Torres Strait Islander Health Performance Framework 2014 report: detailed analyses
Measure 3.08: Cultural competency 45
Table 3.08.10 (continued): Patient experience of Indigenous persons, 15 and over, by selected health outcomes (Non-remote), 2012–13(a) (%) † Estimate has a relative standard error between 25% and 50% and should be used with caution.
(a) Self-reported data for people aged 15 and over in Non-remote areas who consulted a doctor or specialist in the last 12 months. Data excludes a small number of people who were not present at interview for whom responses were provided by a proxy.
(b) Self-reported data consisting of persons who report having a disability or restrictive long-term health condition where a limitation, restriction, impairment, disease or disorder has lasted, or is expected to last for six months or more, and restricts everyday activities.
(c) Self-reported data consisting of persons who reported having a disability or restrictive long-term health condition where a limitation, restriction, impairment, disease or disorder has lasted, or is expected to last for six months or more, and restricts everyday activities. Levels of activity limitation (profound, severe, moderate, and school/employment restriction only) are based on whether, and how often, a person needs help, has difficulty, or uses aids or equipment with any core activities (self-care, mobility or communication). A person’s overall level of core activity limitation is determined by their highest level of limitation in any of these activities.
(d) Only current difficulties with education and/or employment were collected. Respondents aged 65 and over were not asked about employment restrictions and so some may be categorised as not having a specific limitation or restriction that would otherwise have been assigned ‘schooling/employment restriction only’ had they been asked the question.
(e) Based on the Kessler-5 (K5) measure of psychological distress. Overall levels of distress are based on how often respondents reported experiencing each feeling. Low/moderate is a score of 5–11. High/very high is a score of 12–25. Total population is 18 and over.
(f) Totals for Aboriginal and Torres Strait Islander people exclude a small number of people who were not present at interview and for whom responses were provided by a proxy, and persons for whom level of psychological distress was unable to be determined.
(g) Stressors experienced by self, family or friends.
(h) Total excludes ‘refused’.
(i) Self-reported data consisting of persons reporting a current medical condition which has lasted, or is expected to last, for 6 months or more.
Note: Percentages add within rows. Estimates have been rounded and discrepancies may occur between sums of the component items and totals.
Source: ABS Australian Aboriginal and Torres Strait Islander Health Survey 2012–13 (2012–13 NATSIHS component).
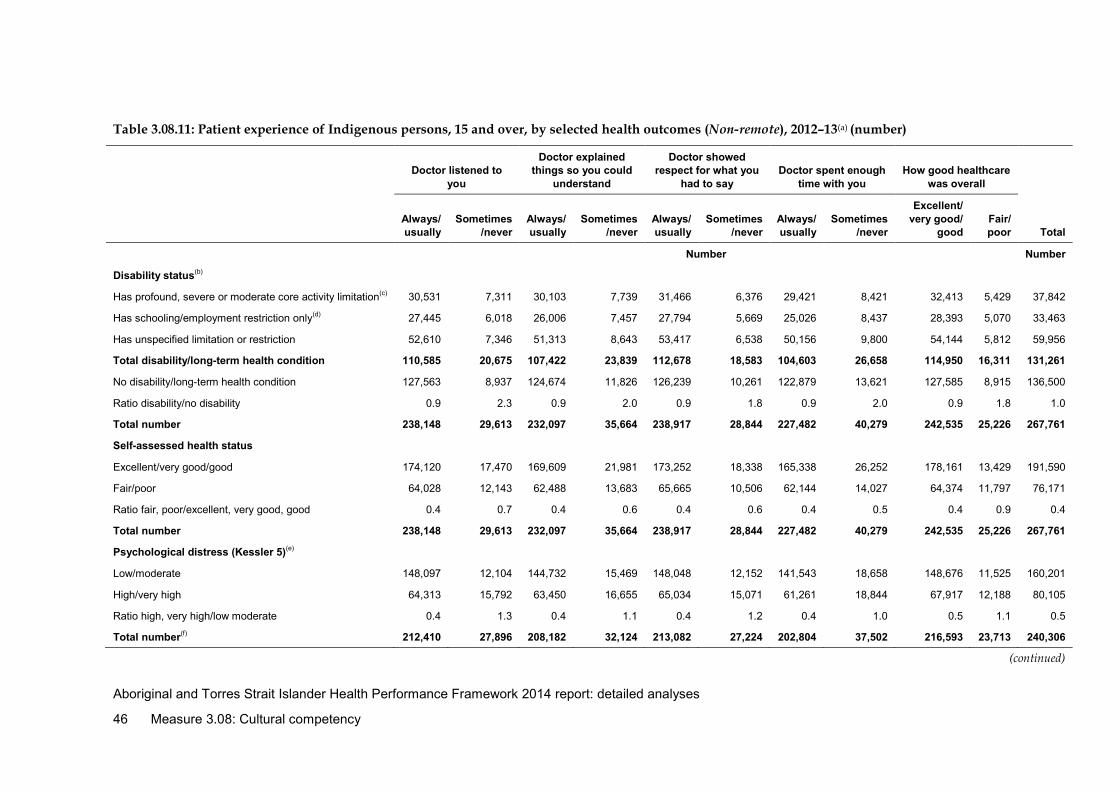
Aboriginal and Torres Strait Islander Health Performance Framework 2014 report: detailed analyses
46 Measure 3.08: Cultural competency
Table 3.08.11: Patient experience of Indigenous persons, 15 and over, by selected health outcomes (Non-remote), 2012–13(a) (number)
Doctor listened to you
Doctor explained things so you could
understand
Doctor showed respect for what you
had to say Doctor spent enough
time with you How good healthcare
was overall
Always/ usually
Sometimes /never
Always/ usually
Sometimes /never
Always/ usually
Sometimes /never
Always/ usually
Sometimes /never
Excellent/ very good/
good Fair/ poor Total
Number Number
Disability status(b)
Has profound, severe or moderate core activity limitation(c) 30,531 7,311 30,103 7,739 31,466 6,376 29,421 8,421 32,413 5,429 37,842
Has schooling/employment restriction only(d) 27,445 6,018 26,006 7,457 27,794 5,669 25,026 8,437 28,393 5,070 33,463
Has unspecified limitation or restriction 52,610 7,346 51,313 8,643 53,417 6,538 50,156 9,800 54,144 5,812 59,956
Total disability/long-term health condition 110,585 20,675 107,422 23,839 112,678 18,583 104,603 26,658 114,950 16,311 131,261
No disability/long-term health condition 127,563 8,937 124,674 11,826 126,239 10,261 122,879 13,621 127,585 8,915 136,500
Ratio disability/no disability 0.9 2.3 0.9 2.0 0.9 1.8 0.9 2.0 0.9 1.8 1.0
Total number 238,148 29,613 232,097 35,664 238,917 28,844 227,482 40,279 242,535 25,226 267,761
Self-assessed health status
Excellent/very good/good 174,120 17,470 169,609 21,981 173,252 18,338 165,338 26,252 178,161 13,429 191,590
Fair/poor 64,028 12,143 62,488 13,683 65,665 10,506 62,144 14,027 64,374 11,797 76,171
Ratio fair, poor/excellent, very good, good 0.4 0.7 0.4 0.6 0.4 0.6 0.4 0.5 0.4 0.9 0.4
Total number 238,148 29,613 232,097 35,664 238,917 28,844 227,482 40,279 242,535 25,226 267,761
Psychological distress (Kessler 5)(e)
Low/moderate 148,097 12,104 144,732 15,469 148,048 12,152 141,543 18,658 148,676 11,525 160,201
High/very high 64,313 15,792 63,450 16,655 65,034 15,071 61,261 18,844 67,917 12,188 80,105
Ratio high, very high/low moderate 0.4 1.3 0.4 1.1 0.4 1.2 0.4 1.0 0.5 1.1 0.5
Total number(f) 212,410 27,896 208,182 32,124 213,082 27,224 202,804 37,502 216,593 23,713 240,306
(continued)
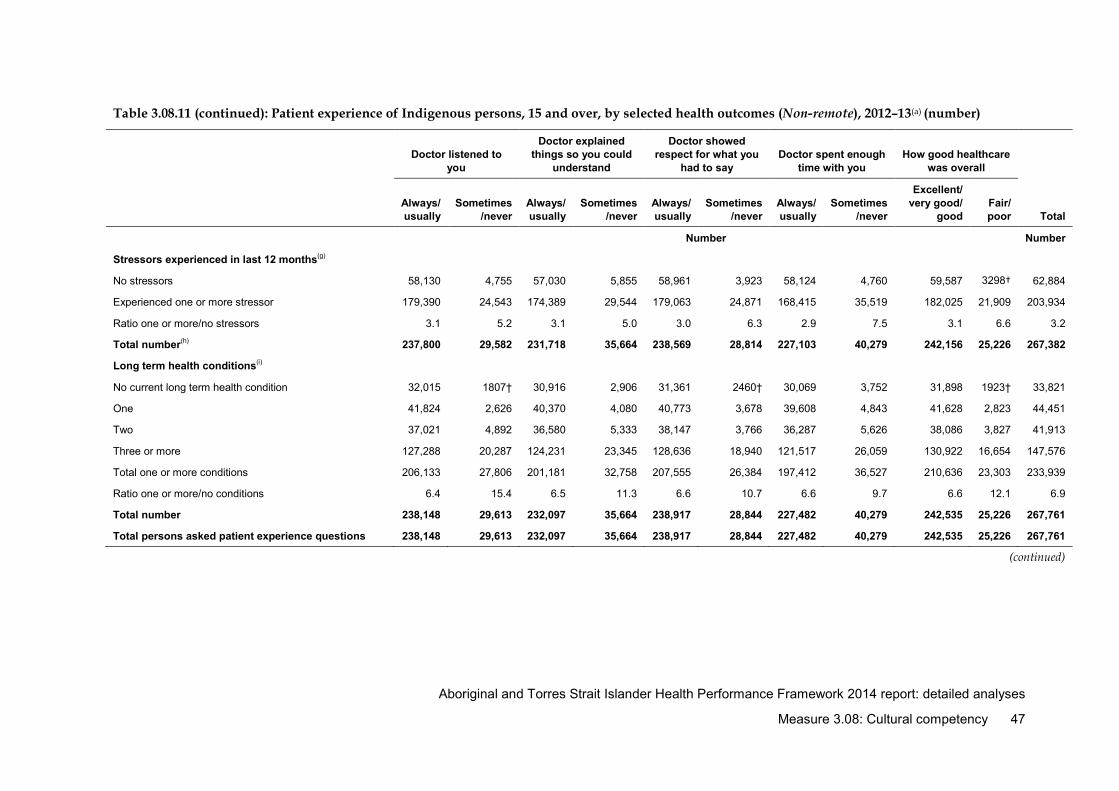
Aboriginal and Torres Strait Islander Health Performance Framework 2014 report: detailed analyses
Measure 3.08: Cultural competency 47
Table 3.08.11 (continued): Patient experience of Indigenous persons, 15 and over, by selected health outcomes (Non-remote), 2012–13(a) (number)
Doctor listened to you
Doctor explained things so you could
understand
Doctor showed respect for what you
had to say Doctor spent enough
time with you How good healthcare
was overall
Always/ usually
Sometimes /never
Always/ usually
Sometimes /never
Always/ usually
Sometimes /never
Always/ usually
Sometimes /never
Excellent/ very good/
good Fair/ poor Total
Number Number
Stressors experienced in last 12 months(g)
No stressors 58,130 4,755 57,030 5,855 58,961 3,923 58,124 4,760 59,587 3298† 62,884
Experienced one or more stressor 179,390 24,543 174,389 29,544 179,063 24,871 168,415 35,519 182,025 21,909 203,934
Ratio one or more/no stressors 3.1 5.2 3.1 5.0 3.0 6.3 2.9 7.5 3.1 6.6 3.2
Total number(h) 237,800 29,582 231,718 35,664 238,569 28,814 227,103 40,279 242,156 25,226 267,382
Long term health conditions(i)
No current long term health condition 32,015 1807† 30,916 2,906 31,361 2460† 30,069 3,752 31,898 1923† 33,821
One 41,824 2,626 40,370 4,080 40,773 3,678 39,608 4,843 41,628 2,823 44,451
Two 37,021 4,892 36,580 5,333 38,147 3,766 36,287 5,626 38,086 3,827 41,913
Three or more 127,288 20,287 124,231 23,345 128,636 18,940 121,517 26,059 130,922 16,654 147,576
Total one or more conditions 206,133 27,806 201,181 32,758 207,555 26,384 197,412 36,527 210,636 23,303 233,939
Ratio one or more/no conditions 6.4 15.4 6.5 11.3 6.6 10.7 6.6 9.7 6.6 12.1 6.9
Total number 238,148 29,613 232,097 35,664 238,917 28,844 227,482 40,279 242,535 25,226 267,761
Total persons asked patient experience questions 238,148 29,613 232,097 35,664 238,917 28,844 227,482 40,279 242,535 25,226 267,761
(continued)
Aboriginal and Torres Strait Islander Health Performance Framework 2014 report: detailed analyses
48 Measure 3.08: Cultural competency
Table 3.08.11 (continued): Patient experience of Indigenous persons, 15 and over, by selected health outcomes (non-remote), 2012–13(a) (number) † Estimate has a relative standard error between 25% and 50% and should be used with caution.
(a) Self-reported data for people aged 15 and over in Non-remote areas who consulted a doctor or specialist in the last 12 months. Data excludes a small number of people who were not present at interview for whom responses were provided by a proxy.
(b) Self-reported data consisting of persons who report having a disability or restrictive long-term health condition where a limitation, restriction, impairment, disease or disorder has lasted, or is expected to last for six months or more, and restricts everyday activities.
(c) Self-reported data consisting of persons who reported having a disability or restrictive long-term health condition where a limitation, restriction, impairment, disease or disorder has lasted, or is expected to last for six months or more, and restricts everyday activities. Levels of activity limitation (profound, severe, moderate, and school/employment restriction only) are based on whether, and how often, a person needs help, has difficulty, or uses aids or equipment with any core activities (self-care, mobility or communication). A person’s overall level of core activity limitation is determined by their highest level of limitation in any of these activities.
(d) Only current difficulties with education and/or employment were collected. Respondents aged 65 and over were not asked about employment restrictions and so some may be categorised as not having a specific limitation or restriction that would otherwise have been assigned ‘schooling/employment restriction only’ had they been asked the question.
(e) Based on the Kessler-5 (K5) measure of psychological distress. Overall levels of distress are based on how often respondents reported experiencing each feeling. Low/moderate is a score of 5–11. High/very high is a score of 12–25. Total population is 18 and over.
(f) Totals for Aboriginal and Torres Strait Islander people exclude a small number of people who were not present at interview and for whom responses were provided by a proxy, and persons for whom level of psychological distress was unable to be determined.
(g) Stressors experienced by self, family or friends.
(h) Total excludes ‘refused’.
(i) Self-reported data consisting of persons reporting a current medical condition which has lasted, or is expected to last, for 6 months or more.
Note: Percentages add within rows. Estimates have been rounded and discrepancies may occur between sums of the component items and totals.
Source: ABS Australian Aboriginal and Torres Strait Islander Health Survey 2012–13 (2012–13 NATSIHS component).
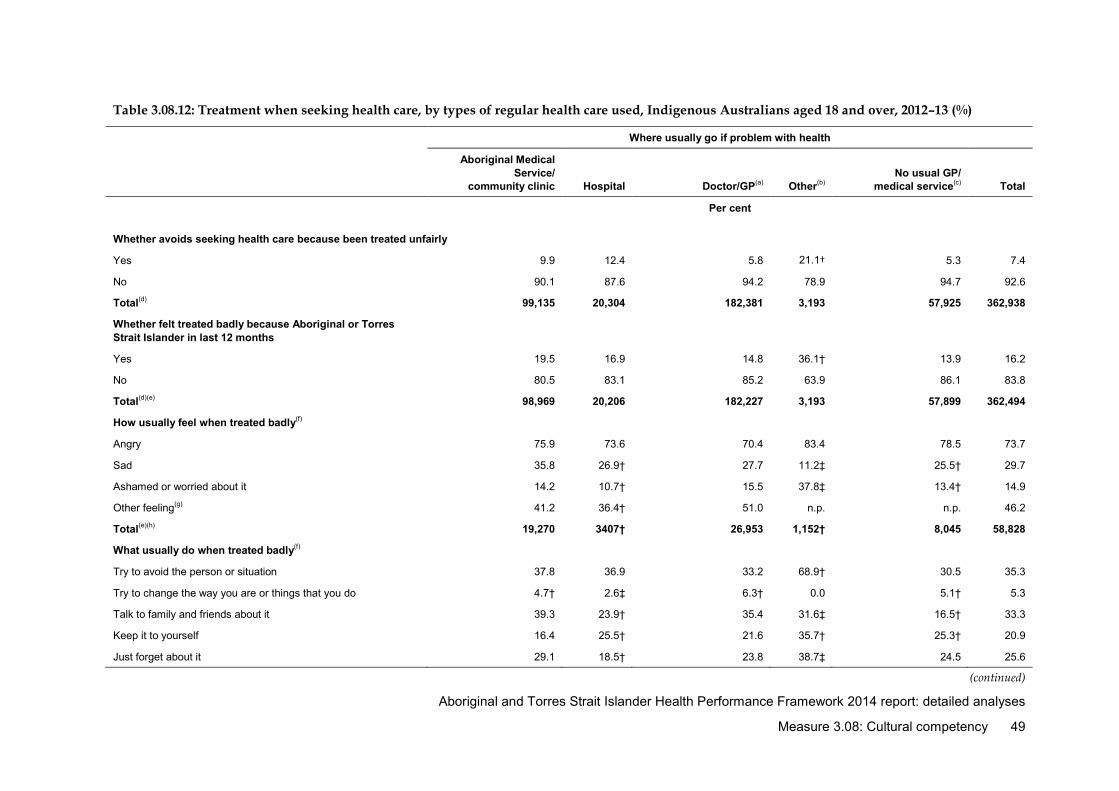
Aboriginal and Torres Strait Islander Health Performance Framework 2014 report: detailed analyses
Measure 3.08: Cultural competency 49
Table 3.08.12: Treatment when seeking health care, by types of regular health care used, Indigenous Australians aged 18 and over, 2012–13 (%)
Where usually go if problem with health
Aboriginal Medical Service/
community clinic Hospital Doctor/GP(a) Other(b) No usual GP/
medical service(c) Total
Per cent
Whether avoids seeking health care because been treated unfairly
Yes 9.9 12.4 5.8 21.1† 5.3 7.4
No 90.1 87.6 94.2 78.9 94.7 92.6
Total(d) 99,135 20,304 182,381 3,193 57,925 362,938
Whether felt treated badly because Aboriginal or Torres Strait Islander in last 12 months
Yes 19.5 16.9 14.8 36.1† 13.9 16.2
No 80.5 83.1 85.2 63.9 86.1 83.8
Total(d)(e) 98,969 20,206 182,227 3,193 57,899 362,494
How usually feel when treated badly(f)
Angry 75.9 73.6 70.4 83.4 78.5 73.7
Sad 35.8 26.9† 27.7 11.2‡ 25.5† 29.7
Ashamed or worried about it 14.2 10.7† 15.5 37.8‡ 13.4† 14.9
Other feeling(g) 41.2 36.4† 51.0 n.p. n.p. 46.2
Total(e)(h) 19,270 3407† 26,953 1,152† 8,045 58,828
What usually do when treated badly(f)
Try to avoid the person or situation 37.8 36.9 33.2 68.9† 30.5 35.3
Try to change the way you are or things that you do 4.7† 2.6‡ 6.3† 0.0 5.1† 5.3
Talk to family and friends about it 39.3 23.9† 35.4 31.6‡ 16.5† 33.3
Keep it to yourself 16.4 25.5† 21.6 35.7† 25.3† 20.9
Just forget about it 29.1 18.5† 23.8 38.7‡ 24.5 25.6
(continued)
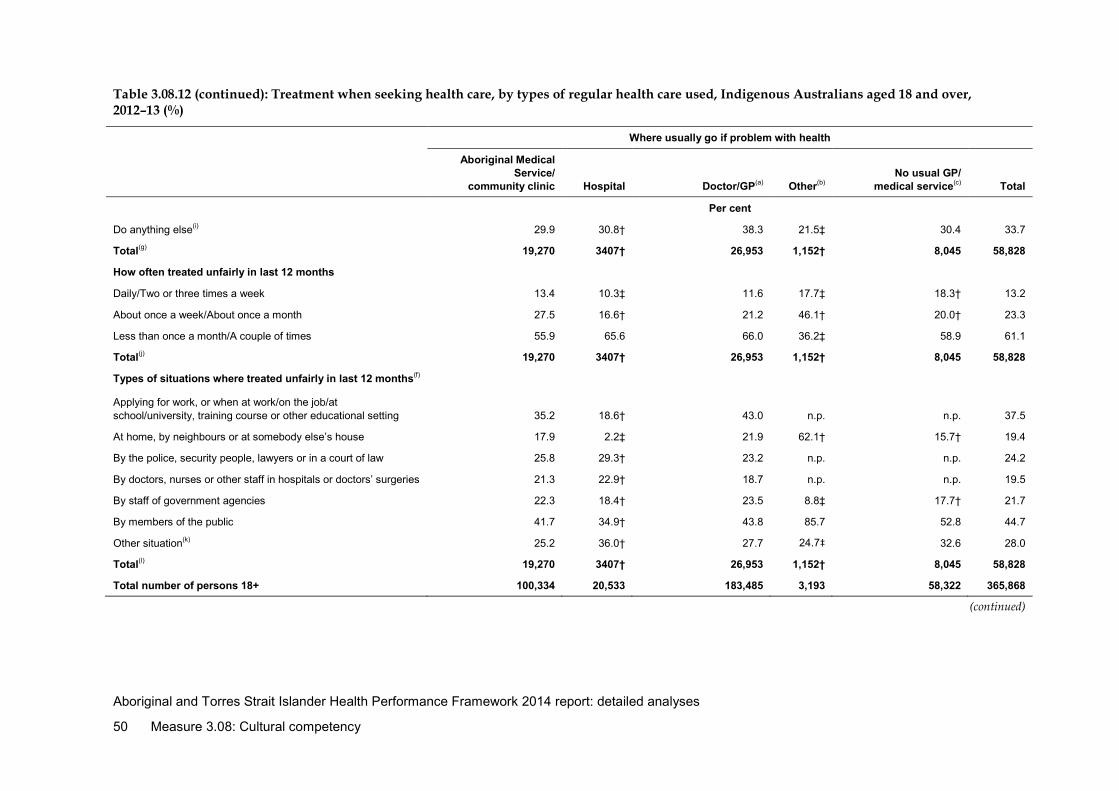
Aboriginal and Torres Strait Islander Health Performance Framework 2014 report: detailed analyses
50 Measure 3.08: Cultural competency
Table 3.08.12 (continued): Treatment when seeking health care, by types of regular health care used, Indigenous Australians aged 18 and over, 2012–13 (%)
Where usually go if problem with health
Aboriginal Medical Service/
community clinic Hospital Doctor/GP(a) Other(b) No usual GP/
medical service(c) Total
Per cent
Do anything else(i) 29.9 30.8† 38.3 21.5‡ 30.4 33.7
Total(g) 19,270 3407† 26,953 1,152† 8,045 58,828
How often treated unfairly in last 12 months
Daily/Two or three times a week 13.4 10.3‡ 11.6 17.7‡ 18.3† 13.2
About once a week/About once a month 27.5 16.6† 21.2 46.1† 20.0† 23.3
Less than once a month/A couple of times 55.9 65.6 66.0 36.2‡ 58.9 61.1
Total(j) 19,270 3407† 26,953 1,152† 8,045 58,828
Types of situations where treated unfairly in last 12 months(f)
Applying for work, or when at work/on the job/at school/university, training course or other educational setting 35.2 18.6† 43.0 n.p. n.p. 37.5
At home, by neighbours or at somebody else’s house 17.9 2.2‡ 21.9 62.1† 15.7† 19.4
By the police, security people, lawyers or in a court of law 25.8 29.3† 23.2 n.p. n.p. 24.2
By doctors, nurses or other staff in hospitals or doctors’ surgeries 21.3 22.9† 18.7 n.p. n.p. 19.5
By staff of government agencies 22.3 18.4† 23.5 8.8‡ 17.7† 21.7
By members of the public 41.7 34.9† 43.8 85.7 52.8 44.7
Other situation(k) 25.2 36.0† 27.7 24.7‡ 32.6 28.0
Total(l) 19,270 3407† 26,953 1,152† 8,045 58,828
Total number of persons 18+ 100,334 20,533 183,485 3,193 58,322 365,868
(continued)
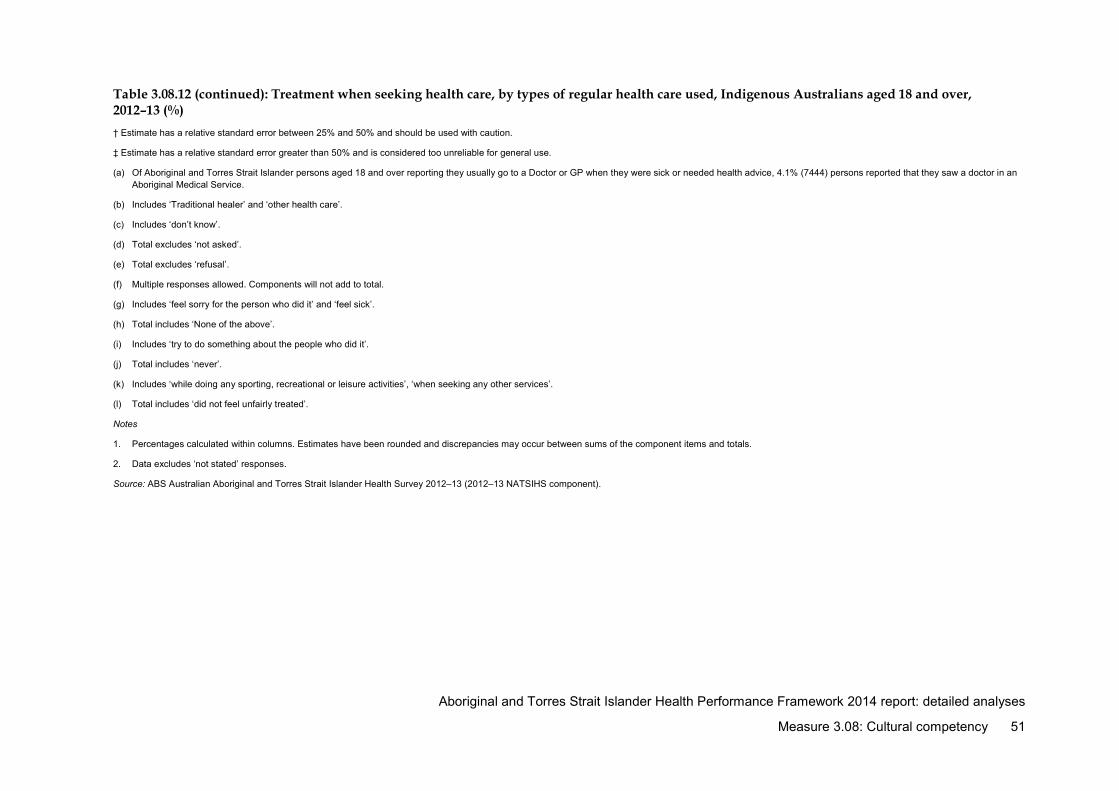
Aboriginal and Torres Strait Islander Health Performance Framework 2014 report: detailed analyses
Measure 3.08: Cultural competency 51
Table 3.08.12 (continued): Treatment when seeking health care, by types of regular health care used, Indigenous Australians aged 18 and over, 2012–13 (%) † Estimate has a relative standard error between 25% and 50% and should be used with caution.
‡ Estimate has a relative standard error greater than 50% and is considered too unreliable for general use.
(a) Of Aboriginal and Torres Strait Islander persons aged 18 and over reporting they usually go to a Doctor or GP when they were sick or needed health advice, 4.1% (7444) persons reported that they saw a doctor in an Aboriginal Medical Service.
(b) Includes ‘Traditional healer’ and ‘other health care’.
(c) Includes ‘don’t know’.
(d) Total excludes ‘not asked’.
(e) Total excludes ‘refusal’.
(f) Multiple responses allowed. Components will not add to total.
(g) Includes ‘feel sorry for the person who did it’ and ‘feel sick’.
(h) Total includes ‘None of the above’.
(i) Includes ‘try to do something about the people who did it’.
(j) Total includes ‘never’.
(k) Includes ‘while doing any sporting, recreational or leisure activities’, ‘when seeking any other services’.
(l) Total includes ‘did not feel unfairly treated’.
Notes
1. Percentages calculated within columns. Estimates have been rounded and discrepancies may occur between sums of the component items and totals.
2. Data excludes ‘not stated’ responses.
Source: ABS Australian Aboriginal and Torres Strait Islander Health Survey 2012–13 (2012–13 NATSIHS component).
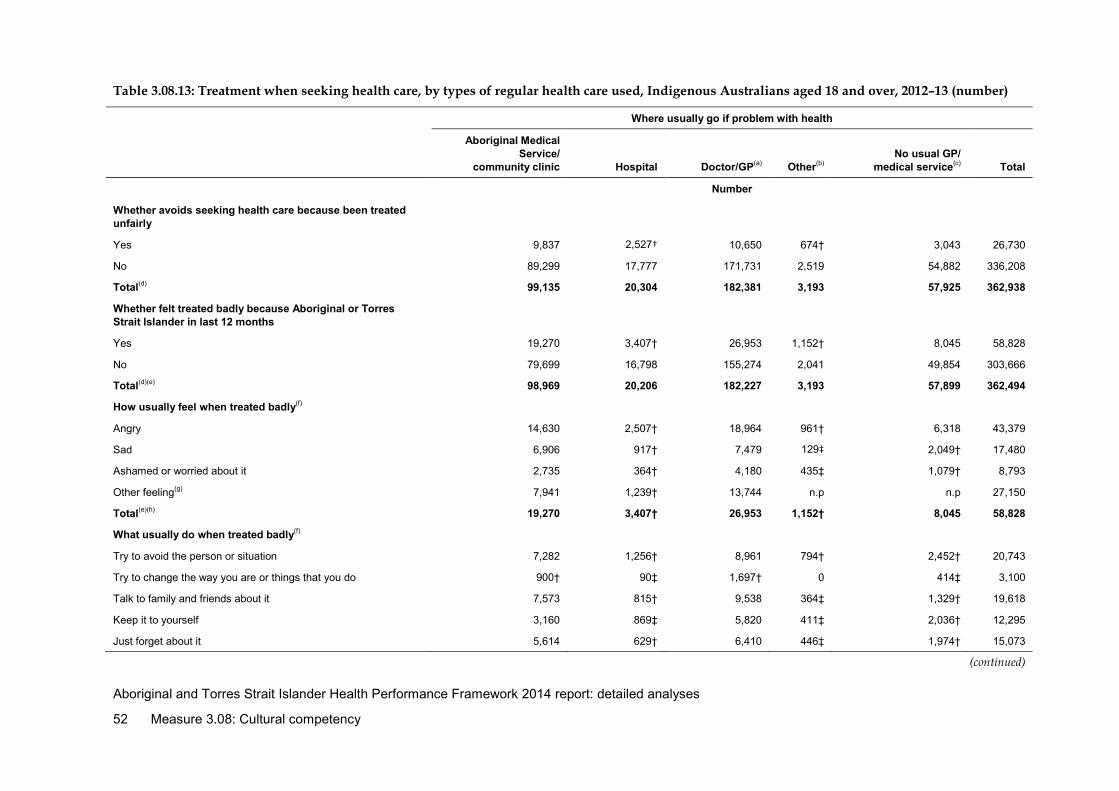
Aboriginal and Torres Strait Islander Health Performance Framework 2014 report: detailed analyses
52 Measure 3.08: Cultural competency
Table 3.08.13: Treatment when seeking health care, by types of regular health care used, Indigenous Australians aged 18 and over, 2012–13 (number)
Where usually go if problem with health
Aboriginal Medical Service/
community clinic Hospital Doctor/GP(a) Other(b) No usual GP/
medical service(c) Total
Number
Whether avoids seeking health care because been treated unfairly
Yes 9,837 2,527† 10,650 674† 3,043 26,730
No 89,299 17,777 171,731 2,519 54,882 336,208
Total(d) 99,135 20,304 182,381 3,193 57,925 362,938
Whether felt treated badly because Aboriginal or Torres Strait Islander in last 12 months
Yes 19,270 3,407† 26,953 1,152† 8,045 58,828
No 79,699 16,798 155,274 2,041 49,854 303,666
Total(d)(e) 98,969 20,206 182,227 3,193 57,899 362,494
How usually feel when treated badly(f)
Angry 14,630 2,507† 18,964 961† 6,318 43,379
Sad 6,906 917† 7,479 129‡ 2,049† 17,480
Ashamed or worried about it 2,735 364† 4,180 435‡ 1,079† 8,793
Other feeling(g) 7,941 1,239† 13,744 n.p n.p 27,150
Total(e)(h) 19,270 3,407† 26,953 1,152† 8,045 58,828
What usually do when treated badly(f)
Try to avoid the person or situation 7,282 1,256† 8,961 794† 2,452† 20,743
Try to change the way you are or things that you do 900† 90‡ 1,697† 0 414‡ 3,100
Talk to family and friends about it 7,573 815† 9,538 364‡ 1,329† 19,618
Keep it to yourself 3,160 869‡ 5,820 411‡ 2,036† 12,295
Just forget about it 5,614 629† 6,410 446‡ 1,974† 15,073
(continued)
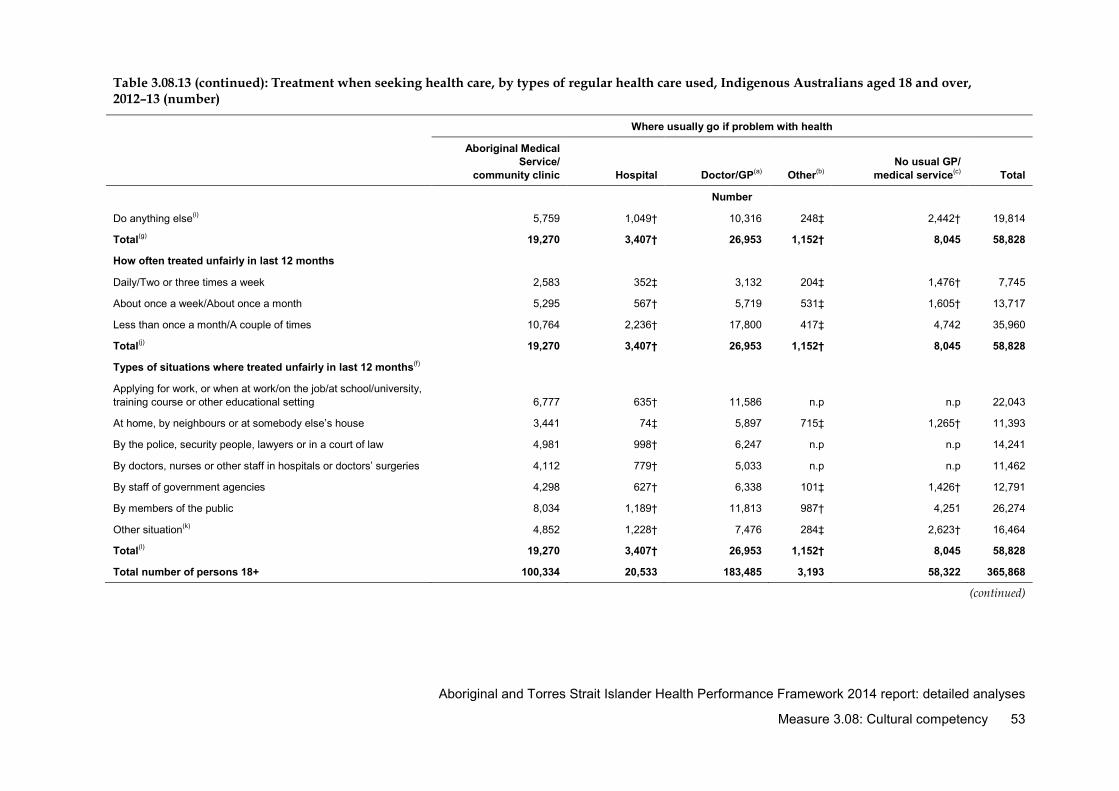
Aboriginal and Torres Strait Islander Health Performance Framework 2014 report: detailed analyses
Measure 3.08: Cultural competency 53
Table 3.08.13 (continued): Treatment when seeking health care, by types of regular health care used, Indigenous Australians aged 18 and over, 2012–13 (number)
Where usually go if problem with health
Aboriginal Medical Service/
community clinic Hospital Doctor/GP(a) Other(b) No usual GP/
medical service(c) Total
Number
Do anything else(i) 5,759 1,049† 10,316 248‡ 2,442† 19,814
Total(g) 19,270 3,407† 26,953 1,152† 8,045 58,828
How often treated unfairly in last 12 months
Daily/Two or three times a week 2,583 352‡ 3,132 204‡ 1,476† 7,745
About once a week/About once a month 5,295 567† 5,719 531‡ 1,605† 13,717
Less than once a month/A couple of times 10,764 2,236† 17,800 417‡ 4,742 35,960
Total(j) 19,270 3,407† 26,953 1,152† 8,045 58,828
Types of situations where treated unfairly in last 12 months(f)
Applying for work, or when at work/on the job/at school/university, training course or other educational setting 6,777 635† 11,586 n.p n.p 22,043
At home, by neighbours or at somebody else’s house 3,441 74‡ 5,897 715‡ 1,265† 11,393
By the police, security people, lawyers or in a court of law 4,981 998† 6,247 n.p n.p 14,241
By doctors, nurses or other staff in hospitals or doctors’ surgeries 4,112 779† 5,033 n.p n.p 11,462
By staff of government agencies 4,298 627† 6,338 101‡ 1,426† 12,791
By members of the public 8,034 1,189† 11,813 987† 4,251 26,274
Other situation(k) 4,852 1,228† 7,476 284‡ 2,623† 16,464
Total(l) 19,270 3,407† 26,953 1,152† 8,045 58,828
Total number of persons 18+ 100,334 20,533 183,485 3,193 58,322 365,868
(continued)
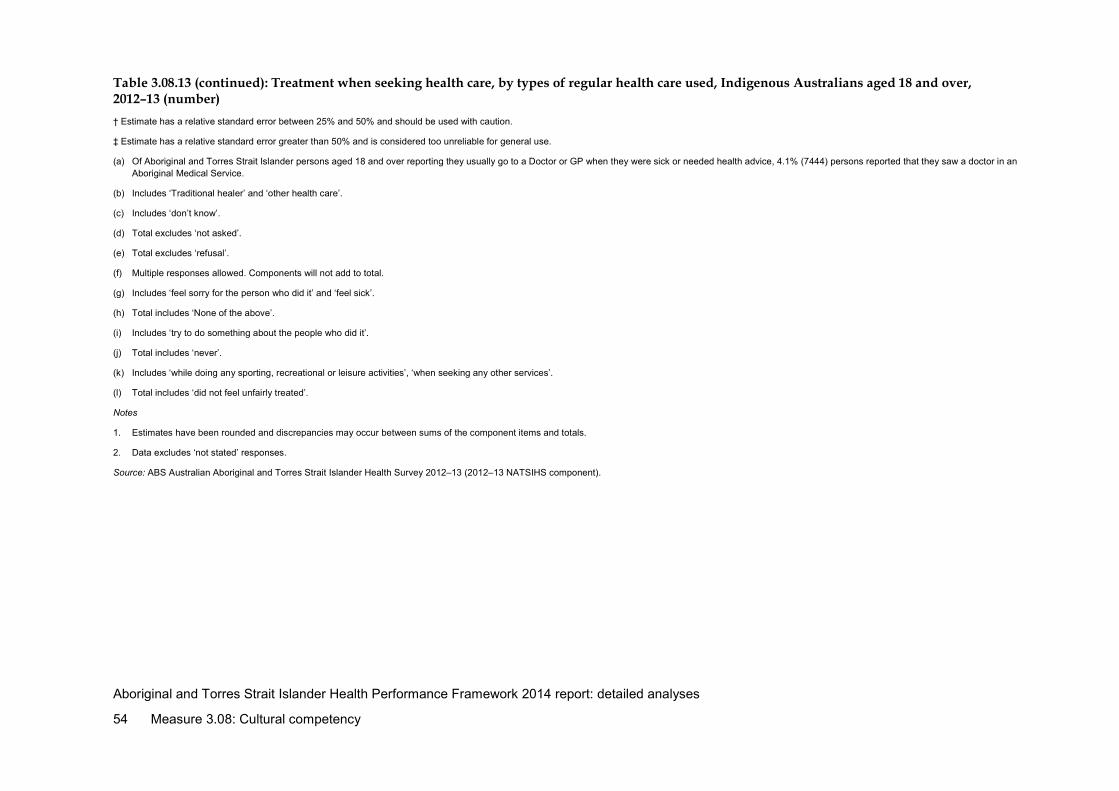
Aboriginal and Torres Strait Islander Health Performance Framework 2014 report: detailed analyses
54 Measure 3.08: Cultural competency
Table 3.08.13 (continued): Treatment when seeking health care, by types of regular health care used, Indigenous Australians aged 18 and over, 2012–13 (number) † Estimate has a relative standard error between 25% and 50% and should be used with caution.
‡ Estimate has a relative standard error greater than 50% and is considered too unreliable for general use.
(a) Of Aboriginal and Torres Strait Islander persons aged 18 and over reporting they usually go to a Doctor or GP when they were sick or needed health advice, 4.1% (7444) persons reported that they saw a doctor in an Aboriginal Medical Service.
(b) Includes ‘Traditional healer’ and ‘other health care’.
(c) Includes ‘don’t know’.
(d) Total excludes ‘not asked’.
(e) Total excludes ‘refusal’.
(f) Multiple responses allowed. Components will not add to total.
(g) Includes ‘feel sorry for the person who did it’ and ‘feel sick’.
(h) Total includes ‘None of the above’.
(i) Includes ‘try to do something about the people who did it’.
(j) Total includes ‘never’.
(k) Includes ‘while doing any sporting, recreational or leisure activities’, ‘when seeking any other services’.
(l) Total includes ‘did not feel unfairly treated’.
Notes
1. Estimates have been rounded and discrepancies may occur between sums of the component items and totals.
2. Data excludes ‘not stated’ responses.
Source: ABS Australian Aboriginal and Torres Strait Islander Health Survey 2012–13 (2012–13 NATSIHS component).
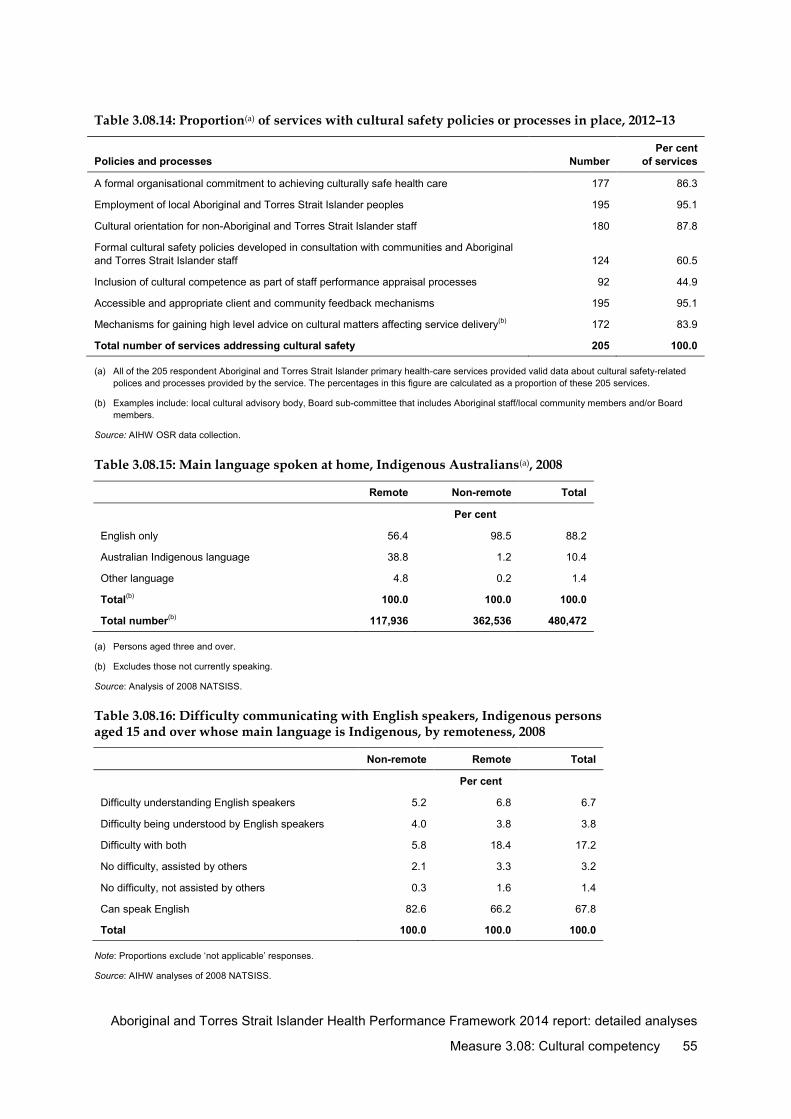
Aboriginal and Torres Strait Islander Health Performance Framework 2014 report: detailed analyses
Measure 3.08: Cultural competency 55
Table 3.08.14: Proportion(a) of services with cultural safety policies or processes in place, 2012–13
Policies and processes Number Per cent
of services
A formal organisational commitment to achieving culturally safe health care 177 86.3
Employment of local Aboriginal and Torres Strait Islander peoples 195 95.1
Cultural orientation for non-Aboriginal and Torres Strait Islander staff 180 87.8
Formal cultural safety policies developed in consultation with communities and Aboriginal and Torres Strait Islander staff 124 60.5
Inclusion of cultural competence as part of staff performance appraisal processes 92 44.9
Accessible and appropriate client and community feedback mechanisms 195 95.1
Mechanisms for gaining high level advice on cultural matters affecting service delivery(b) 172 83.9
Total number of services addressing cultural safety 205 100.0
(a) All of the 205 respondent Aboriginal and Torres Strait Islander primary health-care services provided valid data about cultural safety-related polices and processes provided by the service. The percentages in this figure are calculated as a proportion of these 205 services.
(b) Examples include: local cultural advisory body, Board sub-committee that includes Aboriginal staff/local community members and/or Board members.
Source: AIHW OSR data collection.
Table 3.08.15: Main language spoken at home, Indigenous Australians(a), 2008
Remote Non-remote Total
Per cent
English only 56.4 98.5 88.2
Australian Indigenous language 38.8 1.2 10.4
Other language 4.8 0.2 1.4
Total(b) 100.0 100.0 100.0
Total number(b) 117,936 362,536 480,472
(a) Persons aged three and over.
(b) Excludes those not currently speaking.
Source: Analysis of 2008 NATSISS.
Table 3.08.16: Difficulty communicating with English speakers, Indigenous persons aged 15 and over whose main language is Indigenous, by remoteness, 2008
Non-remote Remote Total
Per cent
Difficulty understanding English speakers 5.2 6.8 6.7
Difficulty being understood by English speakers 4.0 3.8 3.8
Difficulty with both 5.8 18.4 17.2
No difficulty, assisted by others 2.1 3.3 3.2
No difficulty, not assisted by others 0.3 1.6 1.4
Can speak English 82.6 66.2 67.8
Total 100.0 100.0 100.0
Note: Proportions exclude ‘not applicable’ responses.
Source: AIHW analyses of 2008 NATSISS.
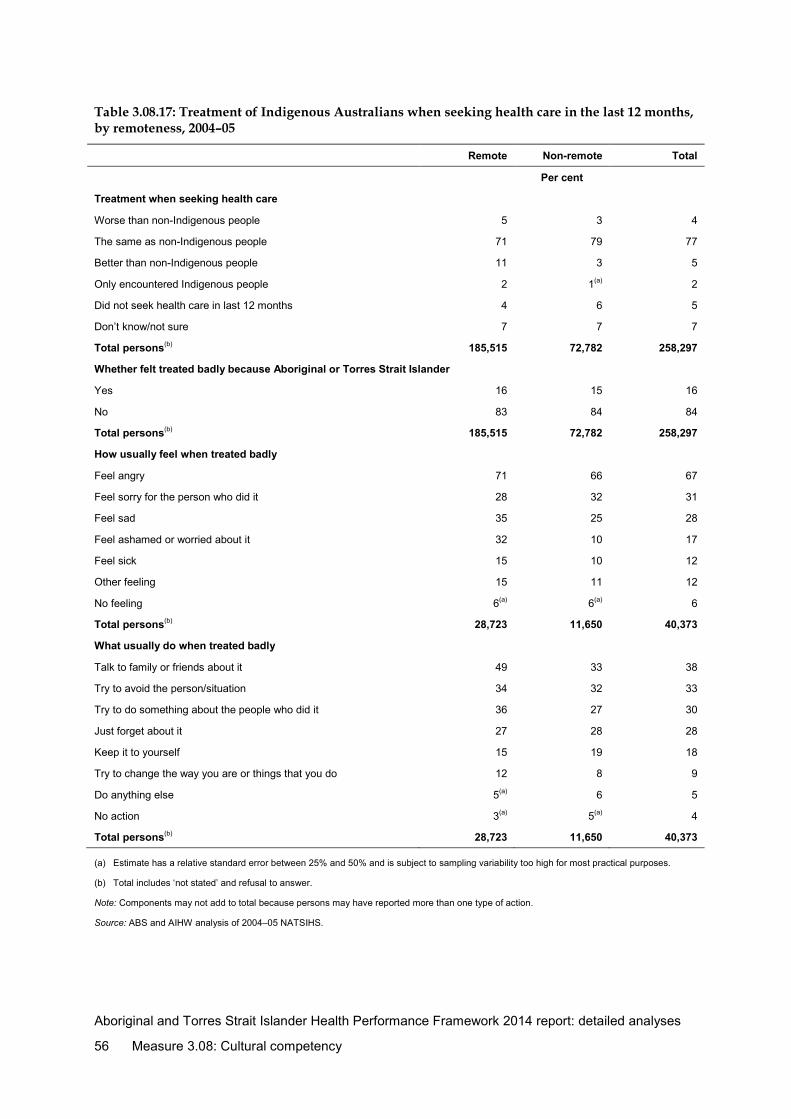
Aboriginal and Torres Strait Islander Health Performance Framework 2014 report: detailed analyses
56 Measure 3.08: Cultural competency
Table 3.08.17: Treatment of Indigenous Australians when seeking health care in the last 12 months, by remoteness, 2004–05
Remote Non-remote Total
Per cent
Treatment when seeking health care
Worse than non-Indigenous people 5 3 4
The same as non-Indigenous people 71 79 77
Better than non-Indigenous people 11 3 5
Only encountered Indigenous people 2 1(a) 2
Did not seek health care in last 12 months 4 6 5
Don’t know/not sure 7 7 7
Total persons(b) 185,515 72,782 258,297
Whether felt treated badly because Aboriginal or Torres Strait Islander
Yes 16 15 16
No 83 84 84
Total persons(b) 185,515 72,782 258,297
How usually feel when treated badly
Feel angry 71 66 67
Feel sorry for the person who did it 28 32 31
Feel sad 35 25 28
Feel ashamed or worried about it 32 10 17
Feel sick 15 10 12
Other feeling 15 11 12
No feeling 6(a) 6(a) 6
Total persons(b) 28,723 11,650 40,373
What usually do when treated badly
Talk to family or friends about it 49 33 38
Try to avoid the person/situation 34 32 33
Try to do something about the people who did it 36 27 30
Just forget about it 27 28 28
Keep it to yourself 15 19 18
Try to change the way you are or things that you do 12 8 9
Do anything else 5(a) 6 5
No action 3(a) 5(a) 4
Total persons(b) 28,723 11,650 40,373
(a) Estimate has a relative standard error between 25% and 50% and is subject to sampling variability too high for most practical purposes.
(b) Total includes ‘not stated’ and refusal to answer.
Note: Components may not add to total because persons may have reported more than one type of action.
Source: ABS and AIHW analysis of 2004–05 NATSIHS.
Aboriginal and Torres Strait Islander Health Performance Framework 2014 report: detailed analyses
Measure 3.08: Cultural competency 57
Data sources and quality
National Aboriginal and Torres Strait Islander Social Survey The NATSISS is conducted in all states and territories and includes Remote and Non-remote areas. The 2008 survey was undertaken between August 2008 and April 2009, with a sample size of 13,300 persons (5,500 aged 0–14 and 7,800 aged 15 and over) in 6,900 households, and a response rate of 82% of households. Up to 3 randomly selected Indigenous Australians were chosen from selected households to participate in the survey. Trained ABS interviewers conducted the survey using face-to-face interviews. In Non-remote areas interviewers used a notebook computer to record responses, while in Remote areas a paper questionnaire was used. Interviewers obtained the consent of a parent or guardian before interviewing those aged 15–17. Indigenous persons usually resident in non-private dwellings, such as hotels, motels, hostels, hospitals, short-stay caravan parks, prisons and other correctional facilities were excluded.
The NATSISS uses the standard Indigenous status question. The NATSISS sample was specifically designed to select a representative sample of Indigenous Australians.
As with other surveys, the NATSISS is subject to sampling and non-sampling errors.
Care has been taken to ensure that the results of this survey are as accurate as possible. Trained ABS officers conducted all interviews. However, some factors may affect the reliability of the data.
Information recorded in this survey is ‘as reported’ by respondents, and therefore may differ from information available from other sources or collected using different methodologies.
Data on health-related indicators have been age-standardised to the 2001 total Australian population to account for differences in the age structures of the states and territories and the Indigenous and non-Indigenous population.
Time series comparisons for the 2008 survey are available through the 1994 National Aboriginal and Torres Strait Islander Survey and the 2002 NATSISS. However not all data elements align across the 3 (1994, 2001 and 2008) NATSISS surveys, hence care is required when reviewing results across the 3 surveys.
There are no strictly comparable non-Indigenous results available for the 2008 NATSISS. Where possible, the ABS has provided recommendations for non-Indigenous data comparisons (such as the 2007–08 National Health Survey) and these have been adopted in this report.
The 2008 NATSISS had a relatively large level of under-coverage when compared with other ABS surveys. There was also an increase in under-coverage compared to previous ABS Indigenous surveys. For example, the estimated under-coverage in the 2004–05 National Aboriginal and Torres Strait Islander Health Survey (NATSIHS) was 42%. The overall under-coverage rate for the 2008 NATSISS was approximately 53% of the in-scope population at the national level. This rate varied across the states and territories (ABS 2010).
Further information on NATSISS data quality issues can be found in the National Aboriginal and Torres Strait Islander Social Survey: User’s guide, 2008 (ABS 2010).
Aboriginal and Torres Strait Islander Health Performance Framework 2014 report: detailed analyses
58 Measure 3.08: Cultural competency
Australian Aboriginal and Torres Strait Islander Health Survey The 2012–13 Australian Aboriginal and Torres Strait Islander Health Survey (AATSIHS) included a sample of 12,000 Indigenous Australians for the core sample and sub-samples for various components of the survey such as voluntary biomedical data for adults. The AATSIHS sample was specifically designed to select a representative sample of Indigenous Australians and therefore overcome the problem inherent in most national surveys (that is, small and unrepresentative Indigenous samples).
Survey results are subject to sampling errors as only a small proportion of the population is used to produce estimates that represent the whole population. Non-sampling errors may occur where there is non-response to the survey or questions in the survey, misunderstanding of questions or errors in recording, coding or processing the survey. Information recorded in this survey is ‘as reported’ by respondents. Responses may be affected by imperfect recall or individual interpretation of survey questions. Any data that are self-reported are also likely to under-estimate circumstances about which the respondent is unaware, or may be reluctant to report (for example, certain health conditions, weight, drug use).
Selected non-Indigenous comparisons are available from the 2011–13 Australian Health Survey (AHS). The AHS was conducted in Major cities, Regional and Remote areas, but Very remote areas were excluded from the sample.
Further information on AATSIHS data quality issues can be found in the user guide for the survey (ABS 2013). Time series comparisons for some indicators are available from the 2004–05 NATSIHS, 2008 NATSISS, 2002 NATSISS, 2001 NHS and the 1994 National Aboriginal and Torres Strait Islander Survey (NATSIS).
Australian Health Survey The Australian Health Survey (AHS) combines the existing ABS National Health Survey (NHS) and the National Aboriginal and Torres Strait Islander Health Survey (NATSIHS) together with 2 new elements: a National Nutrition and Physical Activity Survey (NNPAS) and a National Health Measures Survey (NHMS).
For more information see:
• National Health Survey <http://www.abs.gov.au/AUSSTATS/[email protected]/Lookup/4363.0.55.001Main+Features12011-13?OpenDocument>.
• National Aboriginal and Torres Strait Islander Health Survey <http://www.abs.gov.au/ausstats/[email protected]/mf/4715.0/>.
• National Nutrition and Physical Activity Survey <http://www.abs.gov.au/ausstats/[email protected]/Lookup/by%20Subject/4364.0.55.007~2011-12~Main%20Features~About%20the%20National%20Nutrition%20and%20Physical% 20Activity%20Survey~731>.
• National Health Measures Survey <http://www.abs.gov.au/ausstats/[email protected]/Lookup/4364.0.55.005Chapter1102011-12>.
Aboriginal and Torres Strait Islander Health Performance Framework 2014 report: detailed analyses
Measure 3.08: Cultural competency 59
National Hospital Morbidity Database The scope of the NMDS is episodes of care for admitted patients in essentially all hospitals in Australia, including public and private acute and psychiatric hospitals, free-standing day hospital facilities, alcohol and drug treatment hospitals and dental hospitals. Hospitals operated by the Australian Defence Force, corrections authorities and in Australia’s off-shore territories are not included. Hospitals specialising in ophthalmic aids and other specialised acute medical or surgical care are included. The NHMD does not include episodes of non-admitted patient care provided in outpatient clinics or emergency departments.
For 2012–13, almost all public hospitals provided data for the NHMD. The exception was a mothercraft hospital in the ACT. The great majority of private hospitals also provided data, the exceptions being the private free-standing day hospital facilities in the ACT, the single private free-standing day hospital in the Northern Territory, and a private free-standing day hospital in Victoria.
Hospitalisations Data are a count of hospital separations (episodes of admitted patient care, which can be a total hospital stay or a portion of a hospital stay that begins or ends in a change of type of care) and not patients. Patients who separated from hospital more than once in the year will be counted more than once in the data set.
The number and pattern of hospitalisations can be affected by differing admission practices among the jurisdictions and from year to year, and differing levels and patterns of service delivery.
Records for newborn episodes that did not include qualified days, and records for hospital boarders and posthumous organ procurement have been excluded as these activities are not considered to be admitted patient care.
Indigenous status information Approximately 2% of hospital records have Indigenous status of ‘not stated’, though this proportion varies across the jurisdictions (see Table 1.02.1). These records are excluded from analyses of hospital data in this report. Note that for hospitals in Western Australia, records with an unknown status are reported as non-Indigenous.
Under-identification The incompleteness of Indigenous identification means the number of hospital separations recorded as Indigenous is an underestimate of hospitalisations involving Indigenous Australians.
The AIHW completed an assessment of the level of Indigenous under-identification in selected public hospitals in all states and territories in 2007–08. Results from this assessment indicate that New South Wales, Victoria, Queensland, Western Australia, South Australia and the Northern Territory had adequate Indigenous identification (20% or less overall under-identification of Indigenous patients) in their hospital separations data (AIHW 2010). The study estimated that 89% of Indigenous patients were correctly identified in Australian public hospital admission records in 2007–08.
In 2011–12, the AIHW completed a second study to reassess the level of under-identification in public hospitals data, and found that all jurisdictions had sufficient quality Indigenous identification for reporting from 2010–11 (AIHW 2013). The study estimated that 88% of
Aboriginal and Torres Strait Islander Health Performance Framework 2014 report: detailed analyses
60 Measure 3.08: Cultural competency
Indigenous patients were correctly identified in Australian public hospital admission records in 2011–12, and a correction factor of 1.09 is used at the national level to adjust for under-identification in hospital data. Interpretation of results should take into account the relative quality of the data from the jurisdictions.
Time series analysis may be affected by changes in the quality of Indigenous identification over time. The second AIHW study found no statistically significant change in identification rates at the national level, although there were some changes at the jurisdictional level. Time series presentations in this report include data from both public and private hospitals across several jurisdictions, so the overall effect of changes in Indigenous identification over time is unclear. This should be taken into account when interpreting the results of time series analysis.
Change in coding and coding practices Between 2009–10 and 2010–11, there were significant changes in the coding of diagnoses for diabetes, obstetrics, and imaging procedures. There were also significant changes made to coding practices for diabetes and related conditions for the 2012–13 year, resulting in increased counts for these conditions. Caution should be used in comparing 2011–12 and 2012–13 data with data from previous Health Performance Framework reports.
For more information about the quality of the NHMD and emergency department care data, please refer to Database quality statement summaries in the report Australian Hospital Statistics 2012–13, available at <http://www.aihw.gov.au/publication-detail/?id=60129546922>.
Census of Population and Housing The Census uses the standard Indigenous status question and it is asked for each household member. There are 4 principal sources of error in Census data: respondent error, processing error, partial response and undercount. Quality management of the Census program aims to reduce error as much as possible, and to provide a measure of the remaining error to data users, to allow them to use the data in an informed way.
The Census form may be completed by 1 household member on behalf of others. Incorrect answers can be introduced to the Census form if the respondent does not understand the question or does not know the correct information about other household members. Many of these errors remain in the final data.
The processing of information from Census forms is now mostly automated. Quality assurance procedures are used during Census processing to ensure processing errors are minimised. Sample checking is undertaken during coding operations, and corrections are made where necessary.
When completing their Census form, some people do not answer all the questions that apply to them. In these instances, a ‘not stated’ code is allocated during processing, with the exception of non-response to age, sex, marital status and place of usual residence. These variables are needed for population estimates, so they are imputed using other information on the Census form, as well as information from the previous Census.
Other Census data issues relate to the accuracy of the Census count itself, for example, whether people are counted more than once, or not at all.
Aboriginal and Torres Strait Islander Health Performance Framework 2014 report: detailed analyses
Measure 3.08: Cultural competency 61
The significant volatility in Indigenous Census counts and the variable quality of data on births, deaths and migration of Indigenous Australians do not support the use of the standard approach to population estimation. Due to the inherent uncertainties in estimating the Indigenous population, data that use these estimates should be interpreted with caution (for example, life-expectancy estimates and mortality rates). Given these uncertainties, changes in health outcomes such as mortality rates are difficult to assess.
Following each Census, assumptions are made about past levels of mortality to produce back cast population estimates.
In the 2011 Census, the ABS implemented improvements to the 2011 Census Indigenous enumeration procedures and enhanced the Census Post-Enumeration Survey. There was a 30% increase in the estimate of the Indigenous population between the 2006 and 2011 Censuses (ABS 2014). Population rates used in this edition of the Health Performance Framework were based on the updated population estimates.
Online Services Report data collection The OSR collects organisation-level information from Aboriginal and Torres Strait Islander health organisations that received Australian Government funding in 2012–13.
Data were collected using a web-based reporting tool designed specifically to capture information on inputs and health processes at primary health-care organisations funded to deliver care to Indigenous Australians.
AIHW examined all data submissions to identify missing data and data quality issues. The most common data quality issues were inaccurate recording (for example, staff were reported in terms of their total number rather than in full-time equivalent positions), and discrepancies between 2 or more questions (for example, the number of clients exceeded the number of episodes of care).
Where needed, AIHW staff contacted the relevant health organisation to follow up on data quality issues and to request additional or corrected data. The AIHW detected at least 1 issue for follow-up in around 239 (92%) of organisations. Of these, 207 (87%) resubmitted data. Data with remaining significant quality issues were excluded from national analyses.
From 2012–13 a new online questionnaire started. Major questions (for example, around episodes of care, clients and contacts) remained the same. Some other questions were revised or restructured.
For more information see <http://meteor.aihw.gov.au/content/index.phtml/itemId/561251>.
Aboriginal and Torres Strait Islander Health Performance Framework 2014 report: detailed analyses
62 Measure 3.08: Cultural competency
List of Symbols used in tables — rounded to zero (including null cells)
0 zero
. . not applicable
n.p. not available for publication but included in totals where applicable, unless otherwise indicated
* represents results with statistically significant differences at the p < 0.05 level, between the categories specified in table footnotes
† estimate has a relative standard error between 25% and 50% and should be used with caution
‡ estimate has a relative standard error greater than 50% and is considered too unreliable for general use
Aboriginal and Torres Strait Islander Health Performance Framework 2014 report: detailed analyses
Measure 3.08: Cultural competency 63
List of tables Table 3.08.1: Discrimination toward Indigenous Australians aged 18 and over by sex,
remoteness and age group, 2012–13 ....................................................................................... 6
Table 3.08.2: Whether Indigenous people 18 and over felt discriminated against in last 12 months, by situations and places felt discriminated at, by remoteness, 2012–13 ........ 9
Table 3.08.3: Indigenous persons who did not access health services when needed and why, by remoteness, sex and age, 2012–13 .................................................................................... 11
Table 3.08.4: Reasons for Indigenous Australians not accessing health services when needed, by state/territory, 2012–13 (%) .............................................................................................. 18
Table 3.08.5: Reasons for Indigenous Australians not accessing health services when needed, by state/territory, 2012–13 (number) ................................................................................... 25
Table 3.08.6: Patient experience in last 12 months, Indigenous Australians aged 15 and over, by sex and age group (Non-remote), 2012–13 ....................................................................... 32
Table 3.08.7: Patient experience, Indigenous persons aged 15 and over by state/territory (Non-remote), 2012–13.............................................................................................................. 35
Table 3.08.8: Type of regular health care used by patient experience, Indigenous people aged 15 and over in Non-remote areas who saw a doctor or specialist in the last 12 months, 2012–13 ................................................................................................................. 37
Table 3.08.9: Patient experience in last 12 months, Indigenous persons (15 and over) by selected socioeconomic characteristics (Non-remote) 2012–13 ........................................... 39
Table 3.08.10: Patient experience of Indigenous persons, 15 and over, by selected health outcomes (Non-remote), 2012–13 (%) ..................................................................................... 43
Table 3.08.11: Patient experience of Indigenous persons, 15 and over, by selected health outcomes (Non-remote), 2012–13(a) (number)........................................................................ 46
Table 3.08.12: Treatment when seeking health care, by types of regular health care used, Indigenous Australians aged 18 and over, 2012–13 (%) .................................................... 49
Table 3.08.13: Treatment when seeking health care, by types of regular health care used, Indigenous Australians aged 18 and over, 2012–13 (number) .......................................... 52
Table 3.08.14: Proportion of services with cultural safety policies or processes in place, 2012–13 ...... 55
Table 3.08.15: Main language spoken at home, Indigenous Australians, 2008 ....................................... 55
Table 3.08.16: Difficulty communicating with English speakers, Indigenous persons aged 15 and over whose main language is Indigenous, by remoteness, 2008 .............................. 55
Table 3.08.17: Treatment of Indigenous Australians when seeking health care in the last 12 months, by remoteness, 2004–05 ...................................................................................... 56
List of figures Figure 3.08.1: Proportion of Indigenous Australians who did not access a health provider when
needed, by health provider type, 2012–13 ............................................................................ 4
Figure 3.08.2: Indigenous Australians aged 15 and over employed in select health-related occupations (per 10,000), 1996, 2001, 2006 and 2011 ........................................................... 5
Aboriginal and Torres Strait Islander Health Performance Framework 2014 report: detailed analyses
64 Measure 3.08: Cultural competency
References ABS (Australian Bureau of Statistics) 2006. National Aboriginal and Torres Strait Islander Health Survey 2004–05. ABS cat. no. 4715.0. Canberra: ABS.
ABS 2010. National Aboriginal and Torres Strait Islander Social Survey: Users’ Guide, 2008. ABS cat. no. 4720.0. Canberra: ABS.
ABS 2013. Australian Aboriginal and Torres Strait Islander Health Survey: users’ guide, 2012–13. ABS cat. no. 4727.0.55.002. Canberra: ABS.
ABS 2014. Estimates and Projections, Aboriginal and Torres Strait Islander Australians, 2001 to 2026, May 2014. Viewed on 17 March 2015 <http://www.abs.gov.au/ausstats/[email protected]/Products/6694405ADBF2B03BCA257CC9001439A6?opendocument>.
AIHW (Australian Institute of Health and Welfare) 2010. Indigenous identification in hospital separations data: quality report. Health services series no. 35. Cat. no. HSE 85. Canberra: AIHW.
AIHW 2013. Indigenous identification in hospital separations data: quality report. Cat. no. IHW 90. Canberra: AIHW.
Other related information ABS 2014. Patient Experiences in Australia: Summary of Findings, 2013–14. ABS cat. No. 4839.0. Canberra: ABS.
AIHW 2014. Aboriginal and Torres Strait Islander health organisations: Online Services Report—key results 2012-13. Cat. no. IHW 139. Canberra: AIHW.
Dudgeon P, Wright M & Coffin J 2010. Talking It and Walking It: Cultural Competence. Journal of Australian Indigenous Issues 13:29–44.
Freeman T, Edwards T, Baum F, Lawless A, Jolley G, Javanparast S et al. 2014. Cultural respect strategies in Australian Aboriginal primary health care services: beyond education and training of practitioners. Australian and New Zealand journal of public health 38:355–61.
Johanson RP & Hill P 2011. Indigenous health: A role for private general practice. Australian Family Physician 40.
Kelaher M, Ferdinand A & Paradies Y 2014. Experiencing racism in health care: The mental health impacts for Victorian Aboriginal communities. Medical Journal of Australia 201:44–7.
Liaw ST, Lau P, Pyett P, Furler J, Burchill M, & Rowley K et al. 2011. Successful chronic disease care for Aboriginal Australians requires cultural competence. Australian and New Zealand Journal of Public Health 35:238–48.
National Heart Foundation and Australian Health Care and Hospitals Association 2010. Better hospital care for Aboriginal and Torres Strait Islander people experiencing heart attack.
Paradies Y, Truong M & Priest N 2014. A systematic review of the extent and measurement of healthcare provider racism. Journal of general internal medicine 29:364–87.
Aboriginal and Torres Strait Islander Health Performance Framework 2014 report: detailed analyses
Measure 3.08: Cultural competency 65
Taylor KP, Thompson SC, Wood MM, Ali M & Dimer L 2009. Exploring the impact of an Aboriginal Health Worker on hospitalised Aboriginal experiences: lessons from cardiology. Australian Health Review 33:549–57.
Thompson S, Shahid S, Greville H & Bessarab D 2011. ‘A whispered sort of stuff’ a community report on research around Aboriginal people’s beliefs about cancer and experiences of cancer care in Western Australia. Perth: Cancer Council Western Australia.
Truong M, Paradies Y & Priest N 2014. Interventions to improve cultural competency in healthcare: a systematic review of reviews. BMC (BioMed Central) health services research 14:99