31-p nmr spectroscopy
TRANSCRIPT

1
2
By
MUHAMMAD AKRAM
PhD Chemistry
Worthy Teacher : Dr. UZMA YUNUS
(Associate Professor)
Allama Iqbal Open University Islamabad

Presentation Layout
3
Introduction to 31P NMR Spectroscopy
Chemical Shifts , Coupling Constants
Coupling other Nuclei
Applications
4
Phosporus-31 nuclear magnetic resonance is an analytical
technique used to identify phosphorus-containing compounds,
such as organic compounds and metal complexes.
Phosphorus -31 nuclear magnetic resonance (31P NMR)
conceptually same as (1H NMR).
31P is one of the most important nuclei for NMR spectroscopy
due to its nuclear spin of 1/2, high gyromagnetic ratio ( 17.235
M Hz T-1 ) and has100% natural isotopic abundance.
Introduction of 31P NMR Spectroscopy
5
I Atomic Mass Atomic Number Nuclei
Half-integer Odd Odd 1 1H(½), 31
15P(½)
Half-integer Odd Even 136 C(½), 73
32Ge(9/2)
Integer Even Odd 147 N(1), 2
1 H(1)
Zero Even Even 12 6 C(0), 16
8 O(0), 3216S(0)
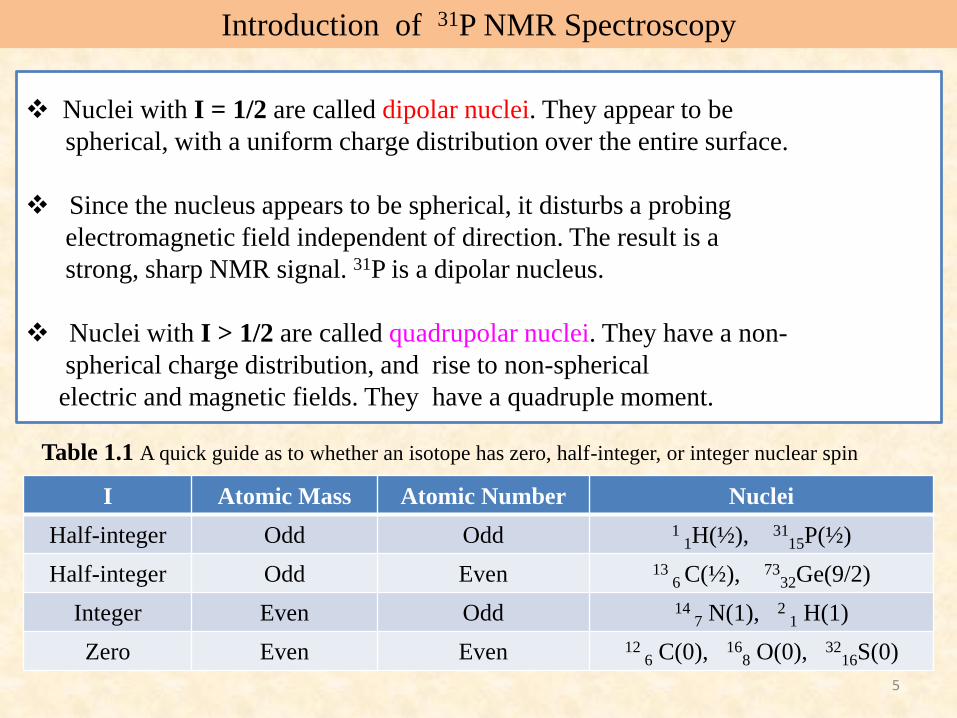
Table 1.1 A quick guide as to whether an isotope has zero, half-integer, or integer nuclear spin
Nuclei with I = 1/2 are called dipolar nuclei. They appear to be
spherical, with a uniform charge distribution over the entire surface.
Since the nucleus appears to be spherical, it disturbs a probing
electromagnetic field independent of direction. The result is a
strong, sharp NMR signal. 31P is a dipolar nucleus.
Nuclei with I > 1/2 are called quadrupolar nuclei. They have a non-
spherical charge distribution, and rise to non-spherical
electric and magnetic fields. They have a quadruple moment.
Introduction of 31P NMR Spectroscopy

6
Nucleus Natural
Abundance
[%]
Magnetic Moment
μ [μ N]
Magnetogyric Ratio
γ[107 rad T−1 s−1]
NMR frequency
MHz
Standard
1H 99.985 4.83724 26.7519 100.000000 TMS
13C 1.108 1.2166 6.7283 25.145004 TMS
15N 0.37 −0.4903 −2.712 10.136783 MeNO2,
[NO3
19F 100 4.5532 25.181 94.094003 CCl3F
9Si 4.70 −0.96174 −5.3188 19.867184 TMS
31P 100 1.9602 10.841 40.480737 85%
H3PO4
From Table, it can be seen that the magnetogyric ratio for phosphorus is
about 2.5 times smaller than that for hydrogen.
The required radiofrequency is therefore also about 2.5 times smaller than that of
the spectrometer. For a 400 MHz NMR spectrometer, that would calculate to
approximately 161 MHz
Introduction of 31P NMR Spectroscopy
7
Normally chemical shifts in 31P NMR is typically reported relative
to 85% phosphoric acid ( δ = 0 ppm) which is used as external
standard due its reactivity.
They are also sensitive to temperature (and pressure). Reference
standard for 31P-NMR spectroscopy is 85% H3 PO4(external),
meaning that a sealed ampule containing 85% aqueous
H3 PO4 submerged in a NMR tube filled with D2O is measured and
stored on the NMR spectrometer’s hard drive as a reference.
Standard in 31P NMR Spectroscopy

8
200 150 100 50 0 -50 -100 RPH2
R2PH
R3P
R2PX
P(NR)3
P(OR)3
P(SR)3
PX3
P(OR)2X
CPX2
CPXN
O=PX3
O=P(OR)X2
O=P(OR)2X
O=P(OR)3
S=P(OR)3
O=P(R)(OR)
S=P(R))(OR)
O=P(R)(OH)
(RO)2POH
200 150 100 50 0 -50 -100 ( δ ppm)
.Chemical shift range of different type of phosphorus compounds

9
The range of 31P chemical shifts in diamagnetic compounds covers some
2000 ppm, and is thus one order of magnitude larger than that of carbon, and two
orders of magnitude larger than proton.
The upfield end in 31P –NMR is due to white phosphorus P4 at δP= −527 to −488
ppm, depending on solvent and water content of the sample.
Chemical shift values of Phosphorus resonance also dependence upon the bond
angle, electronegativity of the substituent's and the p-bonding character of the
substituent's .
From 13C-NMR, we know that an olefin resonates downfield from an alkane,
and an acetylene is found in between, but closer to the alkane. This is explained
by diamagnetic anisotropy and the behavior of P-C, P=C, and P≡C bonds also
same.
Chemical Shift Values in 31P NMR Spectroscopy
10
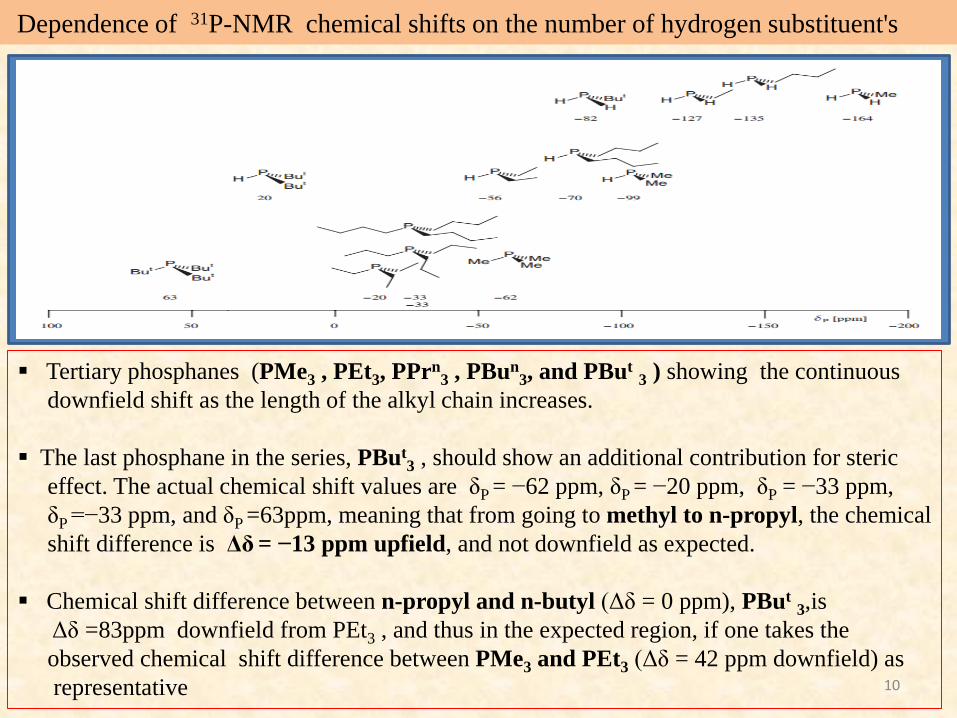
Tertiary phosphanes (PMe3 , PEt3, PPrn3 , PBun
3, and PBut3 ) showing the continuous
downfield shift as the length of the alkyl chain increases.
The last phosphane in the series, PBut3 , should show an additional contribution for steric
effect. The actual chemical shift values are δP = −62 ppm, δP = −20 ppm, δP = −33 ppm,
δP =−33 ppm, and δP =63ppm, meaning that from going to methyl to n-propyl, the chemical
shift difference is Δδ= −13 ppm upfield, and not downfield as expected.
Chemical shift difference between n-propyl and n-butyl (Δδ = 0 ppm), PBut3,is
Δδ =83ppm downfield from PEt3 , and thus in the expected region, if one takes the
observed chemical shift difference between PMe3 and PEt3 (Δδ = 42 ppm downfield) as
representative
Dependence of 31P-NMR chemical shifts on the number of hydrogen substituent's

11
At the upfield end, white phosphorus P4 resonates at δP = −488 ppm. This is readily
explained by an electron rich cluster structure with P-P-P angles of 60°.
Coordination to a transition metal causes a reduction in electron density on phosphorus, as
a P4 lone pair is used to create a donor bond.
Coordinating the phosphane PMe3 to a transition metal again results in the expected
downfield shift of Δδ = 107 ppm, since the phosphorus lone pair is utilized for the donor
bond, resulting in a decrease of electron density on phosphorus.
Similarly, substitution of a phosphorus atom by an isolobal transition metal fragment
causes a downfield shift, as electron density is transferred from the electron rich
phosphorus atoms to the “poorer” transition metal. In general, negative coordination
shifts are possible.
The 31P chemical shift range for phosphorus
12
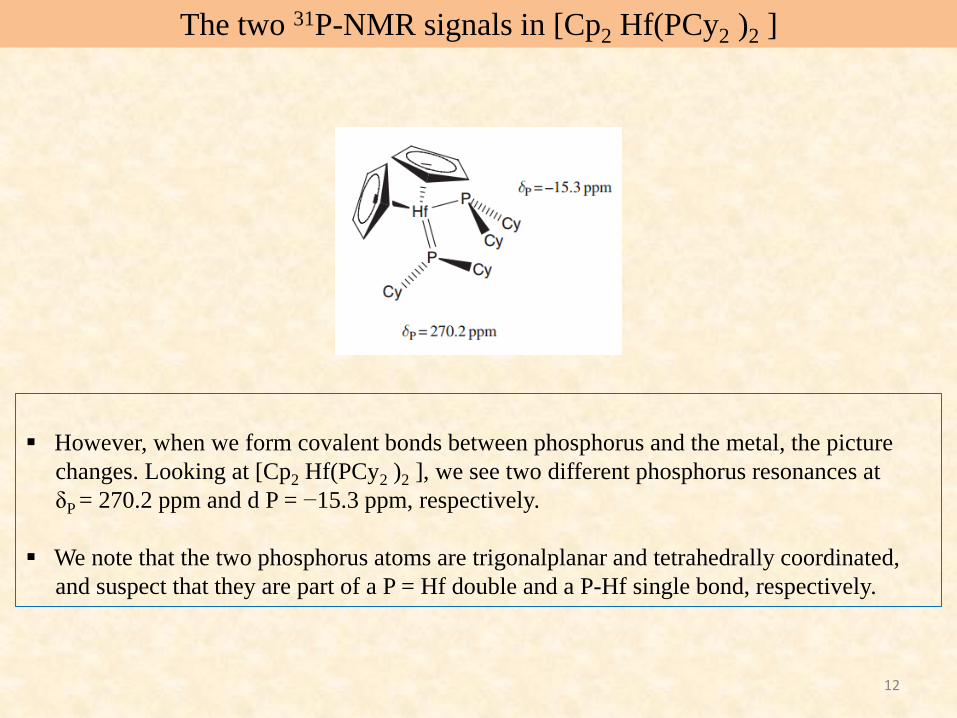
However, when we form covalent bonds between phosphorus and the metal, the picture
changes. Looking at [Cp2 Hf(PCy2 )2 ], we see two different phosphorus resonances at
δP = 270.2 ppm and d P = −15.3 ppm, respectively.
We note that the two phosphorus atoms are trigonalplanar and tetrahedrally coordinated,
and suspect that they are part of a P = Hf double and a P-Hf single bond, respectively.
The two 31P-NMR signals in [Cp2 Hf(PCy2 )2 ]

13
31P-NMR chemical shift values for phosphorus carbon multiple bonds
Normally five membered heteroaromatic ring systems ( i.e. pyrrole ) are electron rich, and the corresponding
six membered (pyridine) ones are electron poor. The 1,3,5-triphosphabenzene resonates at δP = 232.6 ppm,
considerably downfield from the benzazaphosphole at d P = 69.8 ppm, as expected.
Interestingly, the 3,4 diphosphinidene-cyclobutene, featuring a conjugated, non-aromatic π-electron system with
resonance structures, has a P chemical shift of δP = 147.0 ppm midway between the two. The analog to
1,3,5-triphosphabenzene is stable, and shows P resonances at δP = 93.6 and 336.8 ppm.
These 31P chemical shifts are evidence for the folded roof-like structure of the compound, featuring a
tertiary phosphane phosphorus atom at δP = 93.6 ppm, and an isolated P=C at δP = 336.8ppm, respectively.
In 13C-NMR, chemical shift of benzene at δP = 128 ppm with that of the cyclopentadienide ligand Cp− at
δP = 118–136 ppm, depending on the cationic metal that it binds to. In 31P-NMR, 1,3,5-triphosphabenzene with a P
resonate at δP = 232.6 ppm, and 1,3,6 triphosphafulvenide anion, the relevant P atoms resonating at δP = 216, 223 ppm.
14
The influence of coordination to a Lewis acid on the 31P chemical shift
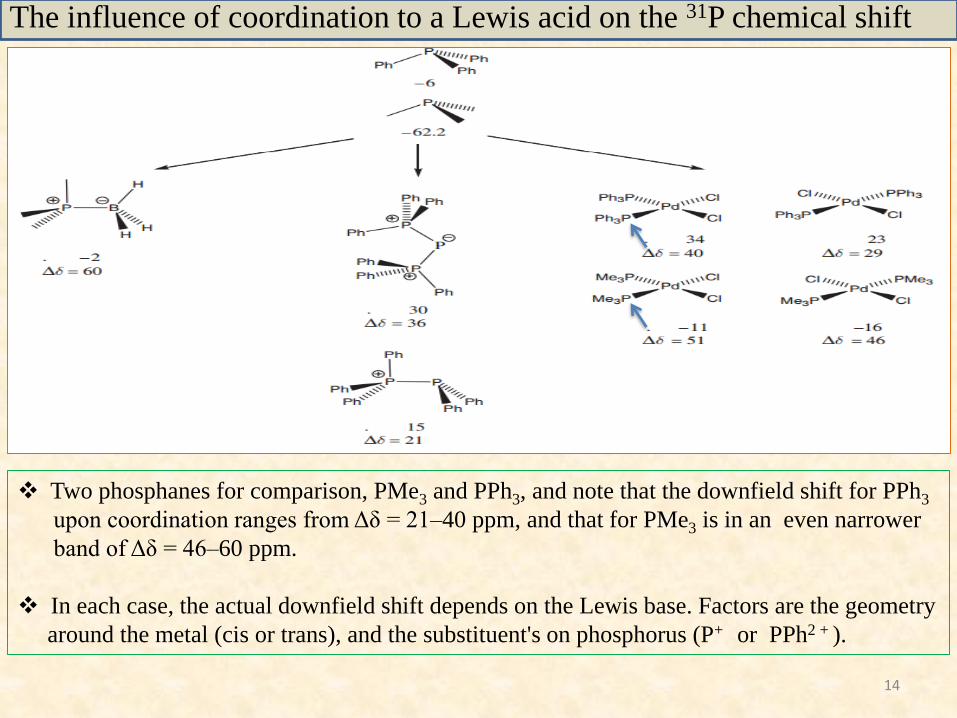
Two phosphanes for comparison, PMe3 and PPh3, and note that the downfield shift for PPh3
upon coordination ranges from Δδ = 21–40 ppm, and that for PMe3 is in an even narrower
band of Δδ = 46–60 ppm.
In each case, the actual downfield shift depends on the Lewis base. Factors are the geometry
around the metal (cis or trans), and the substituent's on phosphorus (P+ or PPh2 + ).
15
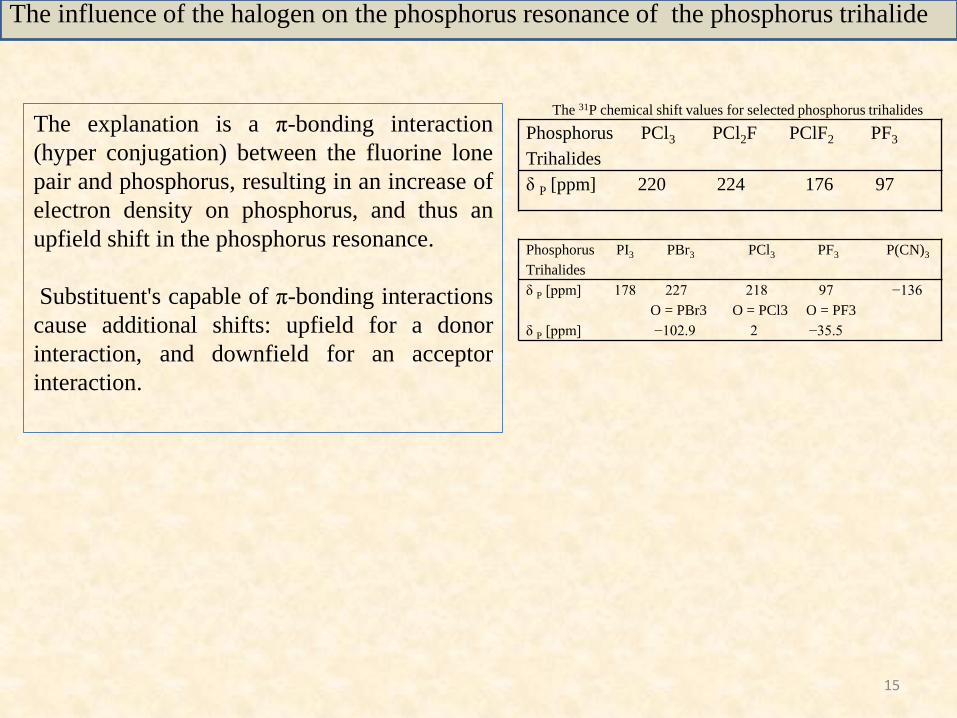
Phosphorus PCl3 PCl2F PClF2 PF3
Trihalides
δ P [ppm] 220 224 176 97
Phosphorus PI3 PBr3 PCl3 PF3 P(CN)3
Trihalides
δ P [ppm] 178 227 218 97 −136
O = PBr3 O = PCl3 O = PF3
δ P [ppm] −102.9 2 −35.5
The 31P chemical shift values for selected phosphorus trihalides
The explanation is a π-bonding interaction
(hyper conjugation) between the fluorine lone
pair and phosphorus, resulting in an increase of
electron density on phosphorus, and thus an
upfield shift in the phosphorus resonance.
Substituent's capable of π-bonding interactions
cause additional shifts: upfield for a donor
interaction, and downfield for an acceptor
interaction.
The influence of the halogen on the phosphorus resonance of the phosphorus trihalide

16
Generally larger in magnitude than those in 1 H- or 13C-NMR spectroscopy, but they are
governed by the same principles. 1 J coupling constants of 1000 Hz are readily observed.
Coupling is facilitated through the s-bonds of the backbone. There is no pronounced
π-effect as the one observed for the chemical shift values, but there are examples for
which a limited π-effect is indeed observed.
As with the more common nuclei, 1 H and 13C, the phosphorus coupling constants
decrease with an increase of bonds between the coupling nuclei.
However, it is frequently observed that 3 JPX coupling constants are larger than 2 JPX
coupling constants. In the following we will examine the trends in the coupling
constants of phosphorus with the more common nuclei 1 H, 13C, and 31P.
The coupling constants in 31P-NMR spectroscopy
17
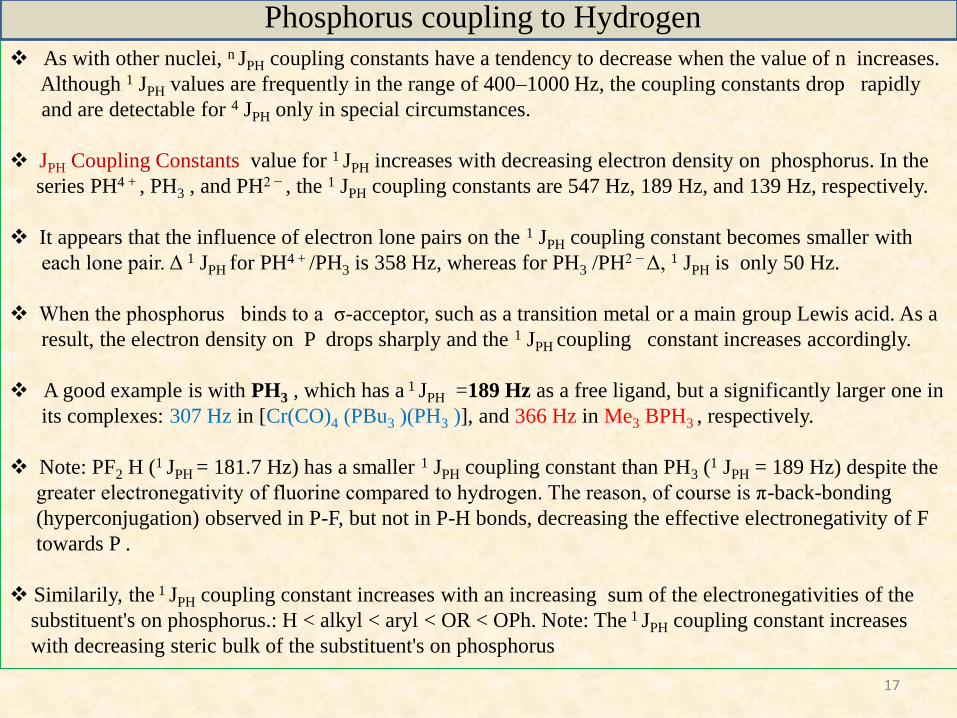
As with other nuclei, n JPH coupling constants have a tendency to decrease when the value of n increases.
Although 1 JPH values are frequently in the range of 400–1000 Hz, the coupling constants drop rapidly
and are detectable for 4 JPH only in special circumstances.
JPH Coupling Constants value for 1 JPH increases with decreasing electron density on phosphorus. In the
series PH4 + , PH3 , and PH2 − , the 1 JPH coupling constants are 547 Hz, 189 Hz, and 139 Hz, respectively.
It appears that the influence of electron lone pairs on the 1 JPH coupling constant becomes smaller with
each lone pair. Δ 1 JPH for PH4 + /PH3 is 358 Hz, whereas for PH3 /PH2 − Δ, 1 JPH is only 50 Hz.
When the phosphorus binds to a σ-acceptor, such as a transition metal or a main group Lewis acid. As a
result, the electron density on P drops sharply and the 1 JPH coupling constant increases accordingly.
A good example is with PH3 , which has a 1 JPH =189 Hz as a free ligand, but a significantly larger one in
its complexes: 307 Hz in [Cr(CO)4 (PBu3 )(PH3 )], and 366 Hz in Me3 BPH3 , respectively.
Note: PF2 H (1 JPH = 181.7 Hz) has a smaller 1 JPH coupling constant than PH3 (1 JPH = 189 Hz) despite the
greater electronegativity of fluorine compared to hydrogen. The reason, of course is π-back-bonding
(hyperconjugation) observed in P-F, but not in P-H bonds, decreasing the effective electronegativity of F
towards P .
Similarily, the 1 JPH coupling constant increases with an increasing sum of the electronegativities of the
substituent's on phosphorus.: H < alkyl < aryl < OR < OPh. Note: The 1 JPH coupling constant increases
with decreasing steric bulk of the substituent's on phosphorus
Phosphorus coupling to Hydrogen

18
In 2 JPH (H-A1-P) and 3 JPH ( H-A1-A1-P) commonly feature is a minimum of
the coupling constant around Θ = 90° with maxima at Θ = 0° and Θ = 180°,
respectively. Typically, the maximum at Θ = 180° is larger than at Θ = 0°.
The relationship between the magnitudes of 2 JPH (gem) and 3 JPH (cis and trans)
coupling constants is similar to that observed in JHH coupling constants.3 JPH (trans) is frequently larger than 3 JPH (cis), but 2 JPH (gem) can be larger than
3 JPH (trans).
The electron density on phosphorus has a pronounced effect on 2 JPH (gem) and3 JPH (cis). Coordination to a transition metal markedly increases both, whereas
electronegative substituent's on phosphorus effect only 3 JPH (cis) in a variable
manner.
The effect on 3 JPH (trans) is small, but nonetheless significant. The coupling
constants for 3 JPH (trans) are typically 10–30 Hz, 2 JPH (gem) up to 25 Hz, and3 JPH (cis) up to 15 Hz. Without electronegative substituent's on phosphorus, the
values for 2 JPH (gem) and 3 JPH (cis) remain well under 10 Hz.
Phosphorus coupling to Hydrogen

19
2,6,7-trioxa-1,4-
dicyclo[2.2.2.]OctanePhosphorus shifts at 90.0 ppm for Pά
and -67.0 ppm for Pβ
Phosphorus coupling to Hydrogen

20
Phosphorus coupling to Hydrogen

21
(PhCH2 ) 2 PPh PhCH2 (Ph)2 P Ph3 P Ph4 P+ Ph3 P = O
1 JPC [Hz] 20.6 16.2 −12.5 88.4 104.4
2JPC [Hz] 19.8 18.9 19.6 10.9 9.8
3 JPC [Hz] 7.0 6.4 6.8 12.8 12.1
4JPC [Hz] 0.6 0.2 0.3 2.9 2.8
Coupling to Carbon
The coupling of phosphorus to carbon follows the general trends observed with other
nuclei. The magnitude of n J PC is dependent on the oxidation state and the
coordination number of phosphorus .The electronegativity of substituent's on
phosphorus also plays an important role.
The magnitude of 1JPC increases dramatically upon loss of the lone pair on phosphorus.3JPC becomes larger than 2 JPC upon loss of the lone pair on phosphorus. For methyl
phosphorus derivatives, the 1JPC coupling constant for compounds with phosphorus in the
oxidation state +III is generally found to be small or even negative, whereas the
corresponding 1 JPC coupling constant for phosphorus compounds where the phosphorus is in
the oxidation state +V is usually substantially larger and positive.

22
Coordinated
1JPC
2 JPC
3 JPC 2 JPC
1JPC
3 JPC
n JPC
Free ligand
Influence of coordination on n JPC
Upon coordination to transition metals, the nJPC coupling constants in trialkyl phosphanes are
influenced differently. The 1JPC coupling constant increases substantially, the 2JPC coupling
constant decreases substantially, and the 3JPC coupling constant increases slightly. A typical
example is shown in Fig.
Coupling to Carbon

23
Coupling to Hydrogen and Carbon
24
Coupling to Phosphorus
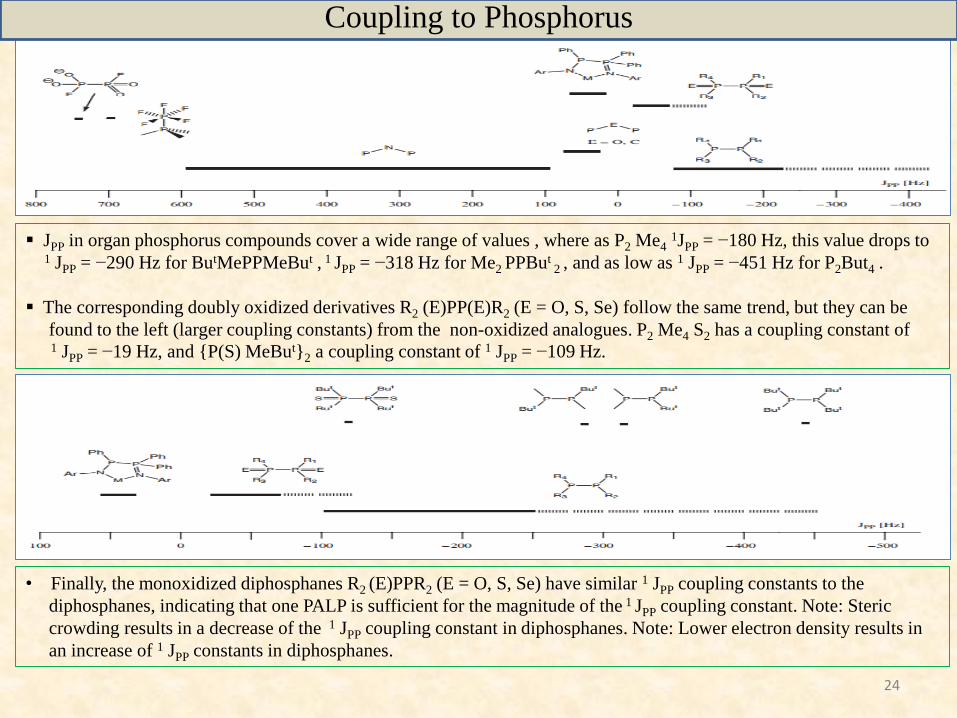
JPP in organ phosphorus compounds cover a wide range of values , where as P2 Me41JPP = −180 Hz, this value drops to
1 JPP = −290 Hz for ButMePPMeBut , 1 JPP = −318 Hz for Me2 PPBut2 , and as low as 1 JPP = −451 Hz for P2But4 .
The corresponding doubly oxidized derivatives R2 (E)PP(E)R2 (E = O, S, Se) follow the same trend, but they can be
found to the left (larger coupling constants) from the non-oxidized analogues. P2 Me4 S2 has a coupling constant of1 JPP = −19 Hz, and {P(S) MeBut}2 a coupling constant of 1 JPP = −109 Hz.
• Finally, the monoxidized diphosphanes R2 (E)PPR2 (E = O, S, Se) have similar 1 JPP coupling constants to the
diphosphanes, indicating that one PALP is sufficient for the magnitude of the 1 JPP coupling constant. Note: Steric
crowding results in a decrease of the 1 JPP coupling constant in diphosphanes. Note: Lower electron density results in
an increase of 1 JPP constants in diphosphanes.
25
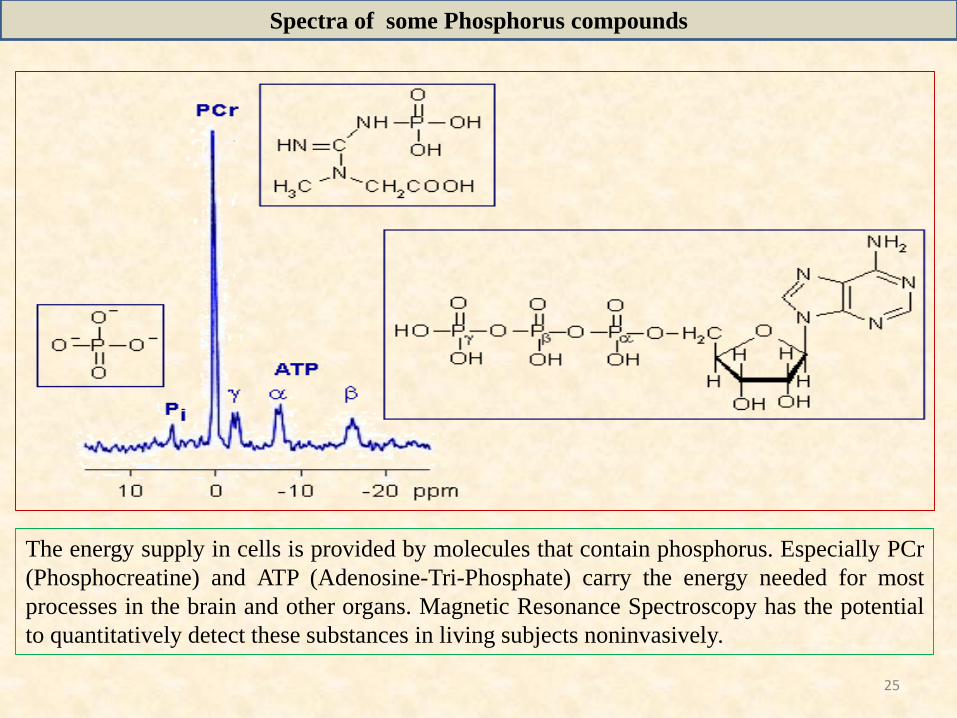
The energy supply in cells is provided by molecules that contain phosphorus. Especially PCr
(Phosphocreatine) and ATP (Adenosine-Tri-Phosphate) carry the energy needed for most
processes in the brain and other organs. Magnetic Resonance Spectroscopy has the potential
to quantitatively detect these substances in living subjects noninvasively.
Spectra of some Phosphorus compounds
26
Spectra of some Phosphorus compounds

27
Pt Coupling to Phosphorus

28
NMR Spectra of some other Nuclei having Phosphorus

29
Applications: Monitoring the Reaction
Single signal at -4.40 ppm
corresponding to free
diphosphine ligand. After an
hour a new signal appear at
40.05 ppm , corresponding
to diphosphine nickel
complex. The downfield
peak grows as the reaction
proceeds relative to the up
field peak. No change is
observed between four and
five hours, suggesting the
conclusion of the reaction.
-4.40 ppm
40.05 ppm
Coskran J.K.; Verkade G.j. Inorganic. Chem. 1965, 4,1665.
30
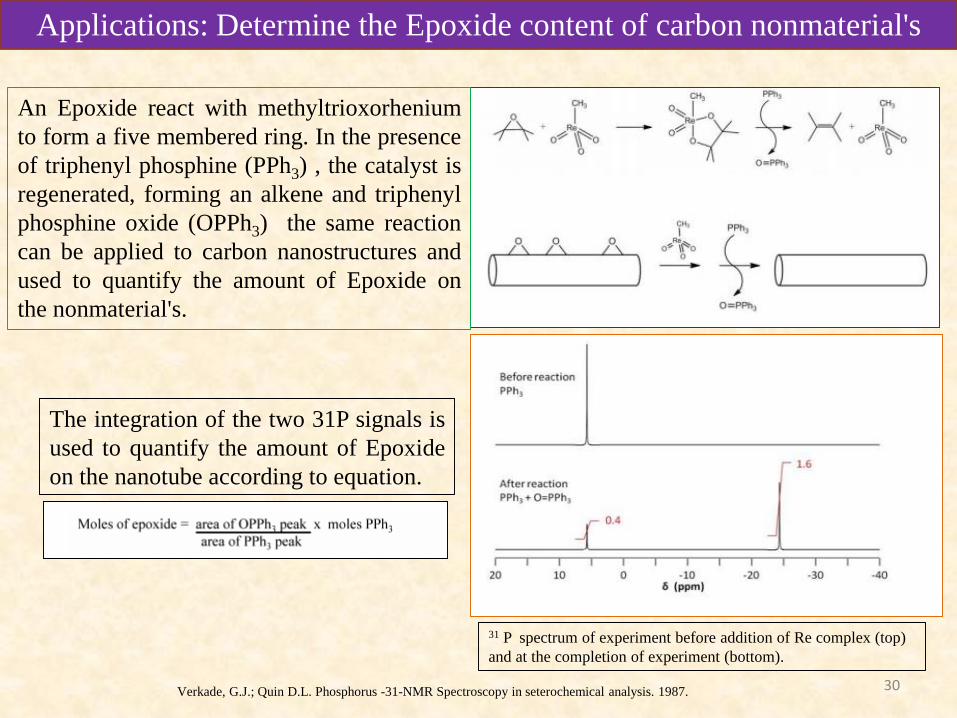
Applications: Determine the Epoxide content of carbon nonmaterial's
An Epoxide react with methyltrioxorhenium
to form a five membered ring. In the presence
of triphenyl phosphine (PPh3) , the catalyst is
regenerated, forming an alkene and triphenyl
phosphine oxide (OPPh3) the same reaction
can be applied to carbon nanostructures and
used to quantify the amount of Epoxide on
the nonmaterial's.
31 P spectrum of experiment before addition of Re complex (top)
and at the completion of experiment (bottom).
The integration of the two 31P signals is
used to quantify the amount of Epoxide
on the nanotube according to equation.
Verkade, G.J.; Quin D.L. Phosphorus -31-NMR Spectroscopy in seterochemical analysis. 1987.

31
Applications
31P NMR spectra of the reaction products catalysed
by PhnI, PhnM and PhnJ. a, RPnTP from the reaction
of methylphosphonate and MgATP catalysed by PhnI
in the presence of PhnG, PhnH, and PhnL at pH 8.5.
The methylphosphonyl group is labelled as 1-Pn.
Inset, 31P–31P coupling of the triphosphate portion of
the RPnTP product (the ά, β and γ phosphoryl
groups).
b, The formation of PRPn from RPnTP in the
presence of PhnM. Inset, protoncoupled spectrum at
pH 8.5 showing the multiplet that corresponds to 1-Pn
and the triplet that corresponds to the 5-phosphate
(5P). Pi , inorganic phosphate.
c, The formation of PRcP from PRPn in the presence
of PhnJ at pH 6.8. Inset, proton-coupled spectrum
showing the formation of a new triplet that
corresponds to the 1,2-cyclic moiety of PRcP (1,2-
cP). The chemical shifts for the phosphate moiety at
the fifth carbon atom of PRcP and PRPn are
coincident with one another (3.4 ppm).
Reaction pathway for
the conversion of
methylphosphonate to
PRcP. The proteins
PhnG, PhnH, PhnI,
PhnJ, PhnL and PhnM
are required for this
transformation. The
role of PhnK is
unknown. PhnGHL
denotes PhnG, PhnH
and PhnL.
Siddhesh S. K.; , Howard J.; Frank M. R.; Intermediates in the transformation of phosphonates to phosphate by bacteria. Nature. 2011 , 480, 570- 573.
32
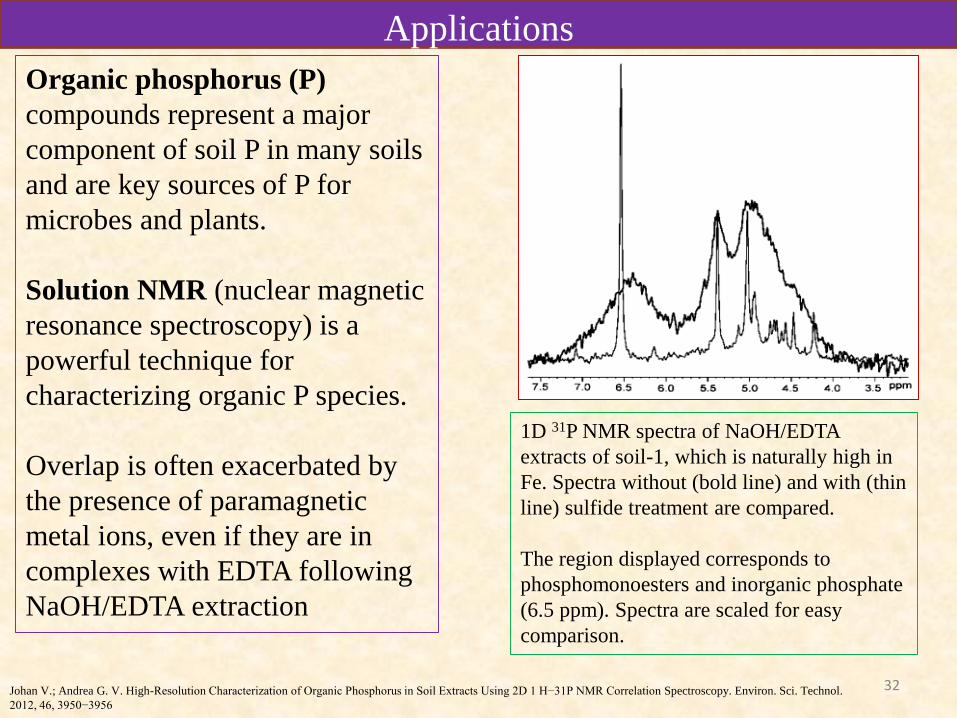
1D 31P NMR spectra of NaOH/EDTA
extracts of soil-1, which is naturally high in
Fe. Spectra without (bold line) and with (thin
line) sulfide treatment are compared.
The region displayed corresponds to
phosphomonoesters and inorganic phosphate
(6.5 ppm). Spectra are scaled for easy
comparison.
Applications
Organic phosphorus (P)
compounds represent a major
component of soil P in many soils
and are key sources of P for
microbes and plants.
Solution NMR (nuclear magnetic
resonance spectroscopy) is a
powerful technique for
characterizing organic P species.
Overlap is often exacerbated by
the presence of paramagnetic
metal ions, even if they are in
complexes with EDTA following
NaOH/EDTA extraction
Johan V.; Andrea G. V. High-Resolution Characterization of Organic Phosphorus in Soil Extracts Using 2D 1 H−31P NMR Correlation Spectroscopy. Environ. Sci. Technol.
2012, 46, 3950−3956
33
Applications
34
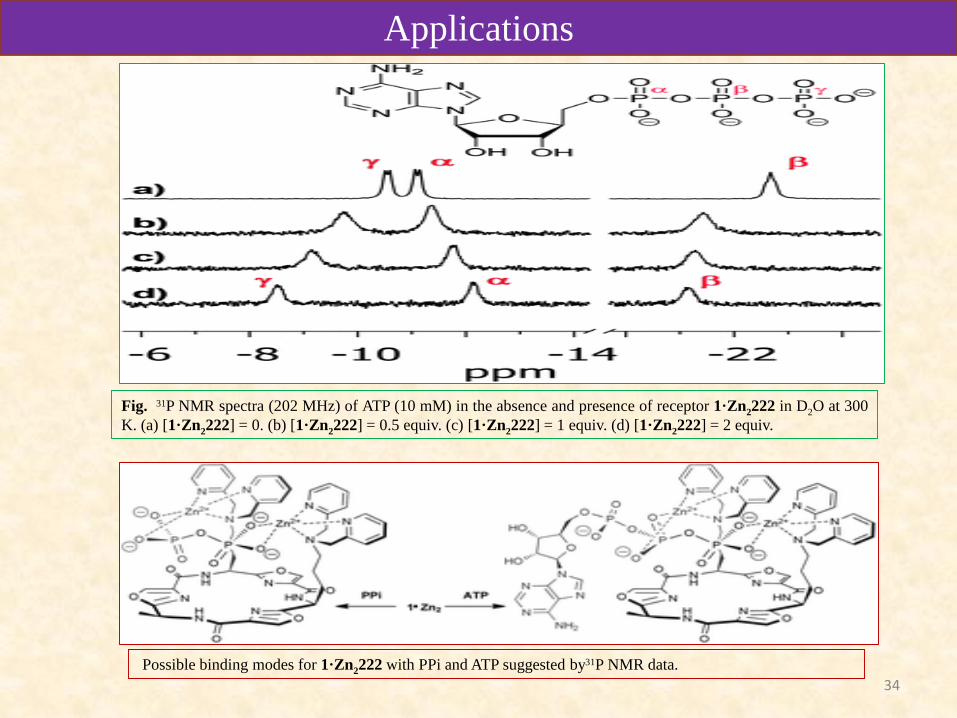
Possible binding modes for 1·Zn2222 with PPi and ATP suggested by31P NMR data.
Fig. 31P NMR spectra (202 MHz) of ATP (10 mM) in the absence and presence of receptor 1·Zn2222 in D2O at 300
K. (a) [1·Zn2222] = 0. (b) [1·Zn2222] = 0.5 equiv. (c) [1·Zn2222] = 1 equiv. (d) [1·Zn2222] = 2 equiv.
Applications

35
Enlarged portions of in vivo
proton-decoupled 31P-NMR
spectra of sycamore cells. (A)
Cells harvested after a 2-wk
preincubation in Mg2+ -free NM
and perfused with Mg2+-free
NM. Acquisition time, 4 h
(24,000 scans). The spectrum is
the sum of four successive
comparable 1-h spectra. Peak 1
was attributed to the γ-signal of
mitochondrial ATP, and the
broad peak 2 was attributed to
the β-signal of ADP pools
present in mitochondria and
cytosol.
(B) Spectrum accumulated 1 h after the addition of 1 mM MgSO4 to NM. Perfusion
conditions are as with standard NM. Acquisition time, 1 h (6,000 scans). Horizontal arrows
indicate the downfield shift (toward the left of the spectra) of the different ATP resonance
peaks after the addition of MgSO4 to NM. (Insets) Centered on γ-ATP at −6.2 ppm, portions
of PCA extract spectra prepared from cells incubated outside the magnet under the same
conditions. Acquisition time, 1 h (1,024 scans)
Elisabeth G.; Fabrice R.; Roland D.; Richard B. Interplay of Mg2+, ADP, and ATP in the cytosol and mitochondria: Unravelling the role of Mg2+ in cell respiration 19, 2014.
Applications

36
Applications
37
Applications
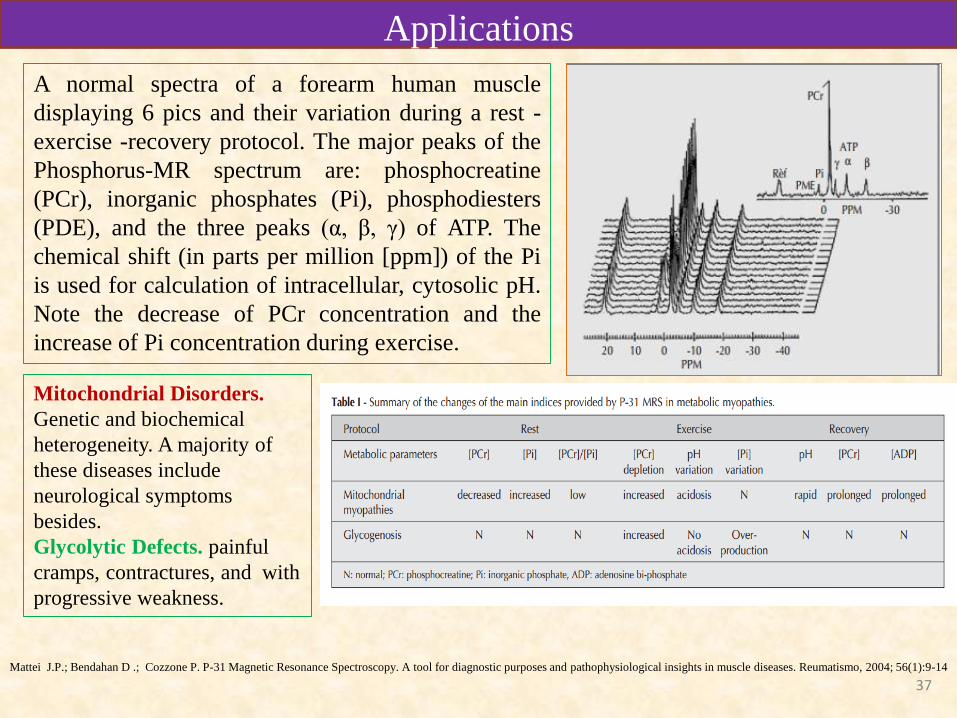
A normal spectra of a forearm human muscle
displaying 6 pics and their variation during a rest -
exercise -recovery protocol. The major peaks of the
Phosphorus-MR spectrum are: phosphocreatine
(PCr), inorganic phosphates (Pi), phosphodiesters
(PDE), and the three peaks (α, β, γ) of ATP. The
chemical shift (in parts per million [ppm]) of the Pi
is used for calculation of intracellular, cytosolic pH.
Note the decrease of PCr concentration and the
increase of Pi concentration during exercise.
Mattei J.P.; Bendahan D .; Cozzone P. P-31 Magnetic Resonance Spectroscopy. A tool for diagnostic purposes and pathophysiological insights in muscle diseases. Reumatismo, 2004; 56(1):9-14
Mitochondrial Disorders.
Genetic and biochemical
heterogeneity. A majority of
these diseases include
neurological symptoms
besides.
Glycolytic Defects. painful
cramps, contractures, and with
progressive weakness.
38
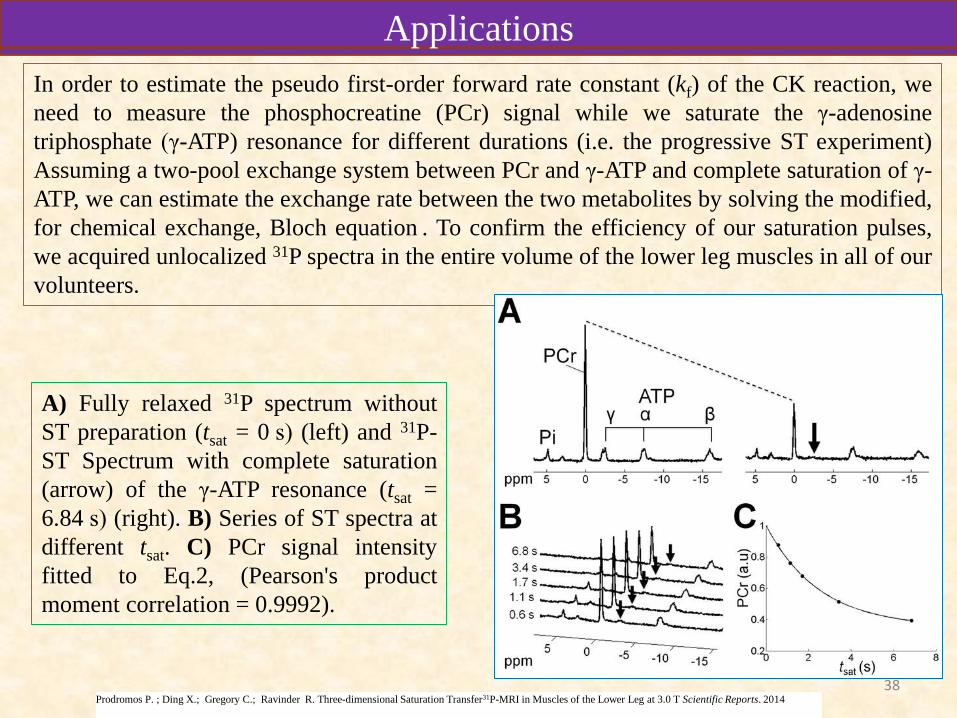
A) Fully relaxed 31P spectrum without
ST preparation (tsat = 0 s) (left) and 31P-
ST Spectrum with complete saturation
(arrow) of the γ-ATP resonance (tsat =
6.84 s) (right). B) Series of ST spectra at
different tsat. C) PCr signal intensity
fitted to Eq.2, (Pearson's product
moment correlation = 0.9992).
In order to estimate the pseudo first-order forward rate constant (kf) of the CK reaction, we
need to measure the phosphocreatine (PCr) signal while we saturate the γ-adenosine
triphosphate (γ-ATP) resonance for different durations (i.e. the progressive ST experiment)
Assuming a two-pool exchange system between PCr and γ-ATP and complete saturation of γ-
ATP, we can estimate the exchange rate between the two metabolites by solving the modified,
for chemical exchange, Bloch equation . To confirm the efficiency of our saturation pulses,
we acquired unlocalized 31P spectra in the entire volume of the lower leg muscles in all of our
volunteers.
Prodromos P. ; Ding X.; Gregory C.; Ravinder R. Three-dimensional Saturation Transfer31P-MRI in Muscles of the Lower Leg at 3.0 T Scientific Reports. 2014
ApplicationsApplications
39
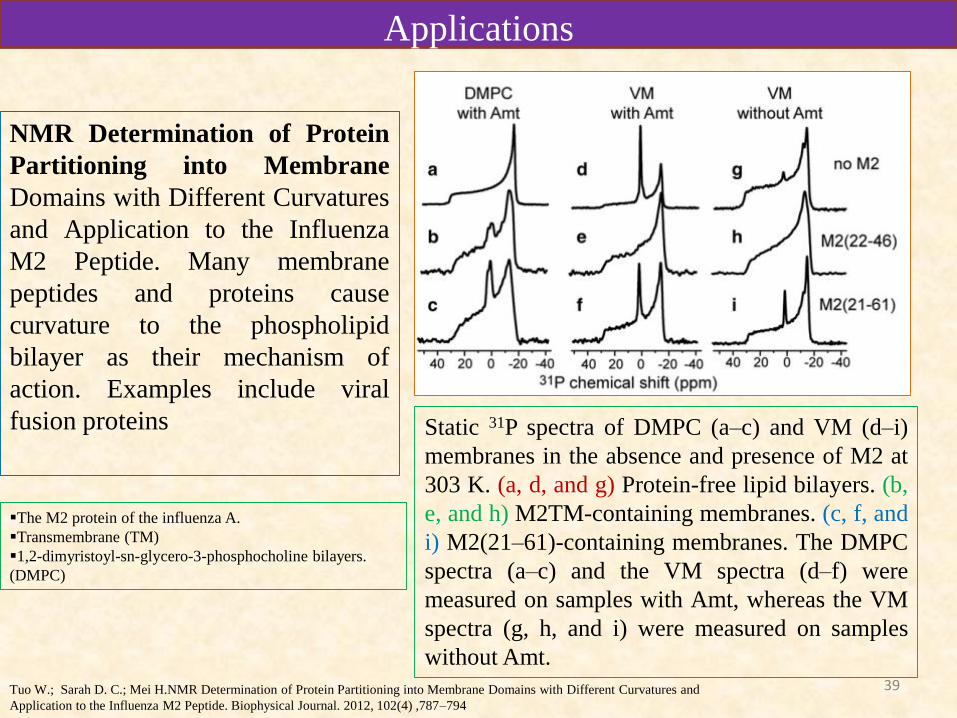
Static 31P spectra of DMPC (a–c) and VM (d–i)
membranes in the absence and presence of M2 at
303 K. (a, d, and g) Protein-free lipid bilayers. (b,
e, and h) M2TM-containing membranes. (c, f, and
i) M2(21–61)-containing membranes. The DMPC
spectra (a–c) and the VM spectra (d–f) were
measured on samples with Amt, whereas the VM
spectra (g, h, and i) were measured on samples
without Amt.
Applications
NMR Determination of Protein
Partitioning into Membrane
Domains with Different Curvatures
and Application to the Influenza
M2 Peptide. Many membrane
peptides and proteins cause
curvature to the phospholipid
bilayer as their mechanism of
action. Examples include viral
fusion proteins
The M2 protein of the influenza A.
Transmembrane (TM)
1,2-dimyristoyl-sn-glycero-3-phosphocholine bilayers.
(DMPC)
Tuo W.; Sarah D. C.; Mei H.NMR Determination of Protein Partitioning into Membrane Domains with Different Curvatures and
Application to the Influenza M2 Peptide. Biophysical Journal. 2012, 102(4) ,787–794

40
Applications
Single-voxel 1 H MRS and 31P MRSI
overlaid on MRI acquired from the second
patient during neoadjuvant chemotherapy. Not
only can the conventionally obtained
modulation in total choline (tCho) (spectra,
left) and tumor volume (indicated by the dotted
area) be observed, but also alterations in the
levels of phosphoethanolamine (PE), glycerol
phosphocholine (GPC), glycerol
phosphoethanolamine (GPE) and inorganic
phosphate (Pi) (spectra, right). Prior to
treatment, 31P resonances of PE, GPC, GPE and Pi were
restricted to the tumor area, whereas, after the
first dose of chemotherapy, mainly levels of Pi
remained detectable. As can be seen, these Pi
levels were not restricted to the tumor region,
but were similarly elevated in glandular tissue.
At the end of the last dose of chemotherapy, but
prior to surgery, the recurrence of phospholipid
levels was detected in the tumor.
Dennis W. J. K.; Bart B.D. 31P MRSI and 1 H MRS at 7 T: initial results in human breast cancer. NMR Biomed. 2011; 24: 1337–1342.

41