315 labs contents - northwestern universitymsecore.northwestern.edu/315/315labs.pdf · 315 labs...
TRANSCRIPT
315 Labs
Contents
315 Labs 1Lab Schedule . . . . . . . . . . . . . . . . . . . . . . . . . . . . . . . . . . . . . . . . . . . . . 2Safety Guidelines . . . . . . . . . . . . . . . . . . . . . . . . . . . . . . . . . . . . . . . . . . 3Worksheet 1 . . . . . . . . . . . . . . . . . . . . . . . . . . . . . . . . . . . . . . . . . . . . . 5Worksheet 2 . . . . . . . . . . . . . . . . . . . . . . . . . . . . . . . . . . . . . . . . . . . . . 6315 Lab 1: Binary Phase Diagrams . . . . . . . . . . . . . . . . . . . . . . . . . . . . . . . . 10Worksheet 3 . . . . . . . . . . . . . . . . . . . . . . . . . . . . . . . . . . . . . . . . . . . . . 13315 Lab 2:Bi-Sn Alloys . . . . . . . . . . . . . . . . . . . . . . . . . . . . . . . . . . . . . . . 15Worksheet 4 . . . . . . . . . . . . . . . . . . . . . . . . . . . . . . . . . . . . . . . . . . . . . 18Worksheet 5 . . . . . . . . . . . . . . . . . . . . . . . . . . . . . . . . . . . . . . . . . . . . . 19315 Lab 3: Pack-Carburization . . . . . . . . . . . . . . . . . . . . . . . . . . . . . . . . . . . 22
1
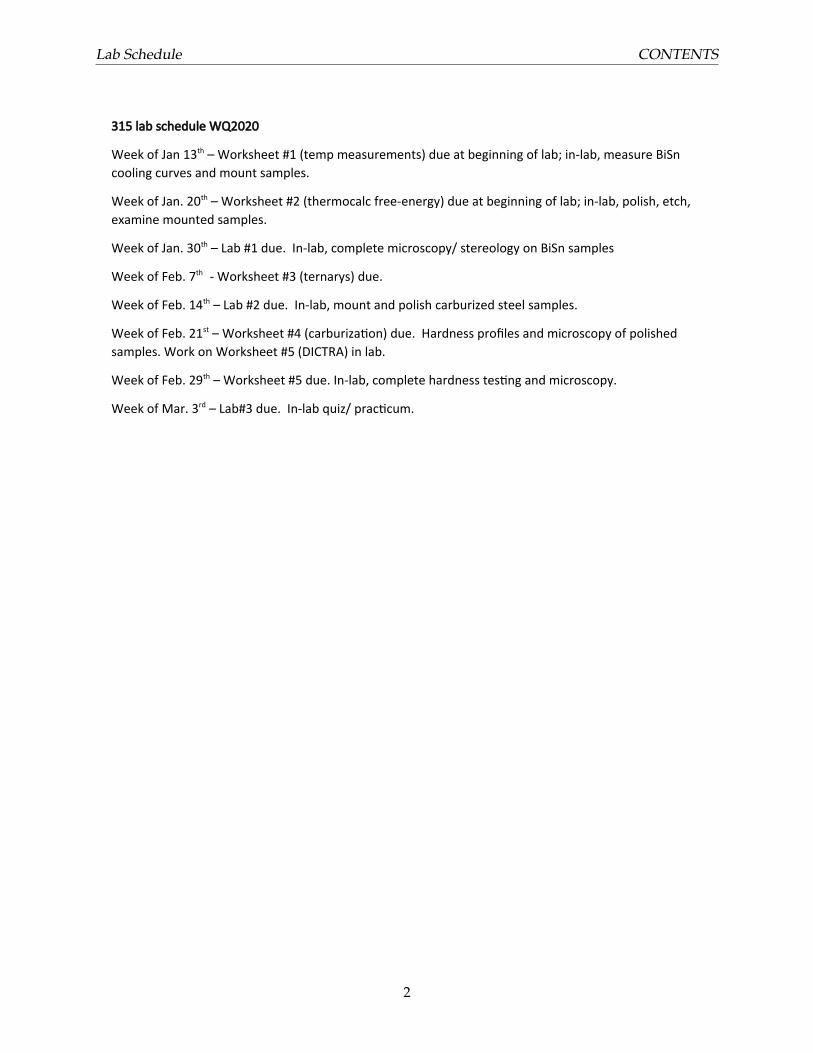
315 lab schedule WQ2020
Week of Jan 13th – Worksheet #1 (temp measurements) due at beginning of lab; in-lab, measure BiSn
cooling curves and mount samples.
Week of Jan. 20th – Worksheet #2 (thermocalc free-energy) due at beginning of lab; in-lab, polish, etch,
examine mounted samples.
Week of Jan. 30th – Lab #1 due. In-lab, complete microscopy/ stereology on BiSn samples
Week of Feb. 7th - Worksheet #3 (ternarys) due.
Week of Feb. 14th – Lab #2 due. In-lab, mount and polish carburized steel samples.
Week of Feb. 21st – Worksheet #4 (carburization) due. Hardness profiles and microscopy of polished
samples. Work on Worksheet #5 (DICTRA) in lab.
Week of Feb. 29th – Worksheet #5 due. In-lab, complete hardness testing and microscopy.
Week of Mar. 3rd – Lab#3 due. In-lab quiz/ practicum.
Lab Schedule CONTENTS
2
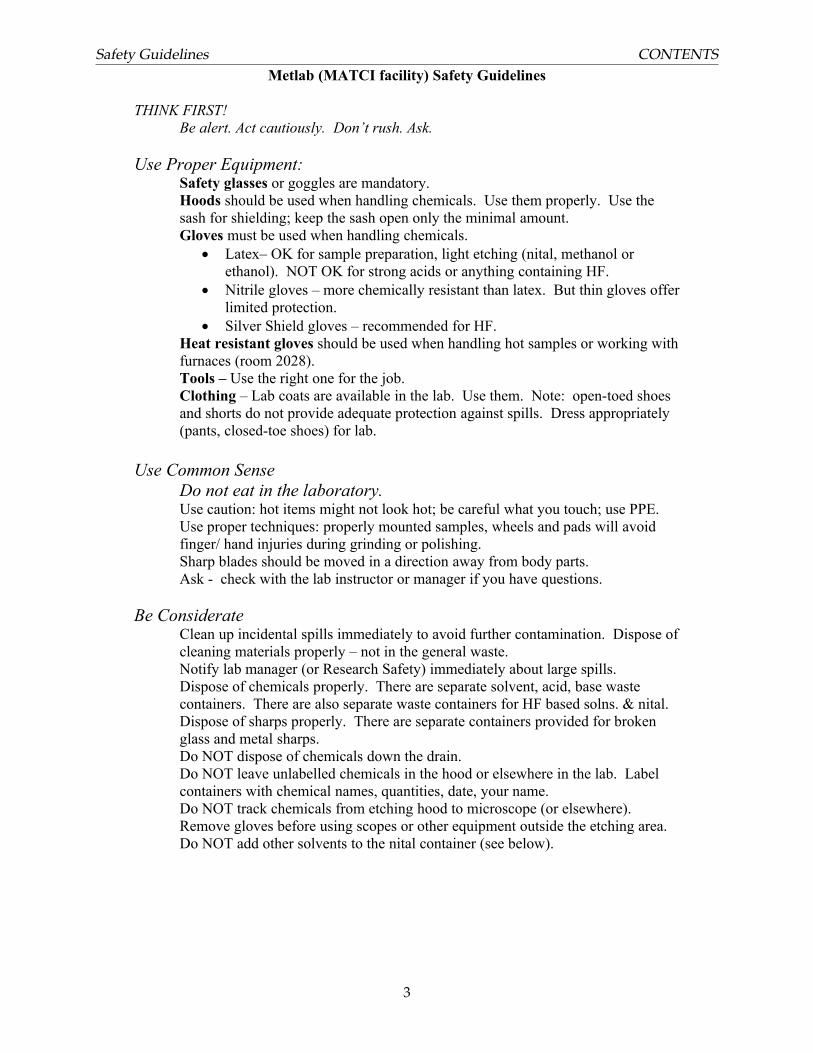
Metlab (MATCI facility) Safety Guidelines
THINK FIRST!Be alert. Act cautiously. Don’t rush. Ask.
Use Proper Equipment:Safety glasses or goggles are mandatory.Hoods should be used when handling chemicals. Use them properly. Use the sash for shielding; keep the sash open only the minimal amount. Gloves must be used when handling chemicals.
Latex– OK for sample preparation, light etching (nital, methanol or ethanol). NOT OK for strong acids or anything containing HF.
Nitrile gloves – more chemically resistant than latex. But thin gloves offerlimited protection.
Silver Shield gloves – recommended for HF.Heat resistant gloves should be used when handling hot samples or working withfurnaces (room 2028).Tools – Use the right one for the job. Clothing – Lab coats are available in the lab. Use them. Note: open-toed shoes and shorts do not provide adequate protection against spills. Dress appropriately (pants, closed-toe shoes) for lab.
Use Common SenseDo not eat in the laboratory. Use caution: hot items might not look hot; be careful what you touch; use PPE.Use proper techniques: properly mounted samples, wheels and pads will avoid finger/ hand injuries during grinding or polishing. Sharp blades should be moved in a direction away from body parts.Ask - check with the lab instructor or manager if you have questions.
Be ConsiderateClean up incidental spills immediately to avoid further contamination. Dispose ofcleaning materials properly – not in the general waste. Notify lab manager (or Research Safety) immediately about large spills.Dispose of chemicals properly. There are separate solvent, acid, base waste containers. There are also separate waste containers for HF based solns. & nital. Dispose of sharps properly. There are separate containers provided for broken glass and metal sharps. Do NOT dispose of chemicals down the drain.Do NOT leave unlabelled chemicals in the hood or elsewhere in the lab. Label containers with chemical names, quantities, date, your name.Do NOT track chemicals from etching hood to microscope (or elsewhere). Remove gloves before using scopes or other equipment outside the etching area.Do NOT add other solvents to the nital container (see below).
Safety Guidelines CONTENTS
3
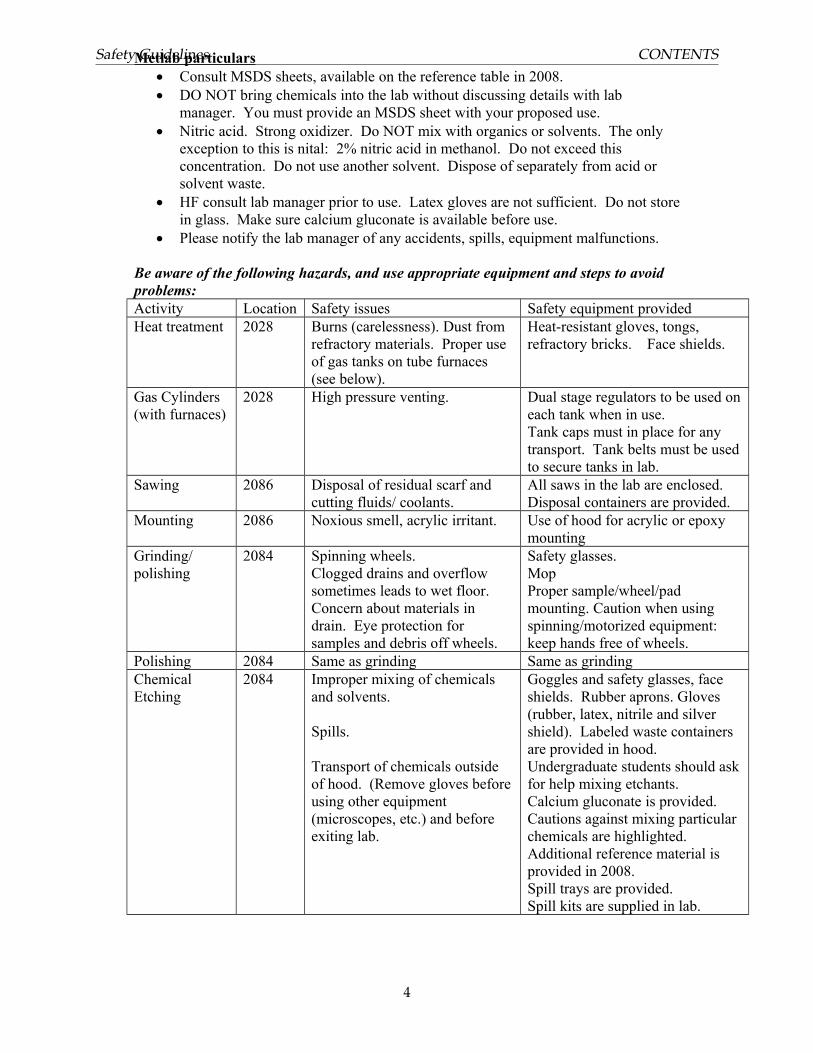
Metlab particulars Consult MSDS sheets, available on the reference table in 2008. DO NOT bring chemicals into the lab without discussing details with lab
manager. You must provide an MSDS sheet with your proposed use. Nitric acid. Strong oxidizer. Do NOT mix with organics or solvents. The only
exception to this is nital: 2% nitric acid in methanol. Do not exceed this concentration. Do not use another solvent. Dispose of separately from acid or solvent waste.
HF consult lab manager prior to use. Latex gloves are not sufficient. Do not storein glass. Make sure calcium gluconate is available before use.
Please notify the lab manager of any accidents, spills, equipment malfunctions.
Be aware of the following hazards, and use appropriate equipment and steps to avoid problems: Activity Location Safety issues Safety equipment providedHeat treatment 2028 Burns (carelessness). Dust from
refractory materials. Proper use of gas tanks on tube furnaces (see below).
Heat-resistant gloves, tongs, refractory bricks. Face shields.
Gas Cylinders (with furnaces)
2028 High pressure venting. Dual stage regulators to be used oneach tank when in use. Tank caps must in place for any transport. Tank belts must be usedto secure tanks in lab.
Sawing 2086 Disposal of residual scarf and cutting fluids/ coolants.
All saws in the lab are enclosed. Disposal containers are provided.
Mounting 2086 Noxious smell, acrylic irritant. Use of hood for acrylic or epoxy mounting
Grinding/polishing
2084 Spinning wheels.Clogged drains and overflow sometimes leads to wet floor. Concern about materials in drain. Eye protection for samples and debris off wheels.
Safety glasses.MopProper sample/wheel/pad mounting. Caution when using spinning/motorized equipment: keep hands free of wheels.
Polishing 2084 Same as grinding Same as grindingChemical Etching
2084 Improper mixing of chemicals and solvents.
Spills.
Transport of chemicals outside of hood. (Remove gloves beforeusing other equipment (microscopes, etc.) and before exiting lab.
Goggles and safety glasses, face shields. Rubber aprons. Gloves (rubber, latex, nitrile and silver shield). Labeled waste containers are provided in hood. Undergraduate students should askfor help mixing etchants. Calcium gluconate is provided. Cautions against mixing particular chemicals are highlighted. Additional reference material is provided in 2008.Spill trays are provided. Spill kits are supplied in lab.
Safety Guidelines CONTENTS
4
NAME:___________________________________________________________
MATSCI 315: Phase Equilibria and Diffusion in MaterialsLaboratory Instructor: Dr. Kathleen Stair, Cook 2039, [email protected]
Lab Worsheet#1: Binary Alloy Phase Diagrams
DUE at the beginning of lab week of Jan 9th. Please write neatly.
In the first lab of 315, we’ll experimentally determine the phase diagram for a binary alloy (BiSn) and then look at the corresponding microstructure. To measure temperature in the range of room temperature to ~ 300 degrees Celsius, we’ll use thermocouples.
Before coming to lab, please answer the following questions (you may include sketches) and bring these to lab:
1) What is a thermocouple?
2) How does it work? (What is actually measured?)
3) What type of thermocouple would you choose for the measurements we will make? Why? (What are your design criteria?)
4) Name and describe at least two other methods of measuring temperature, excluding thermometers.
Worksheet 1 CONTENTS
5
NAME:____________________________________________________________
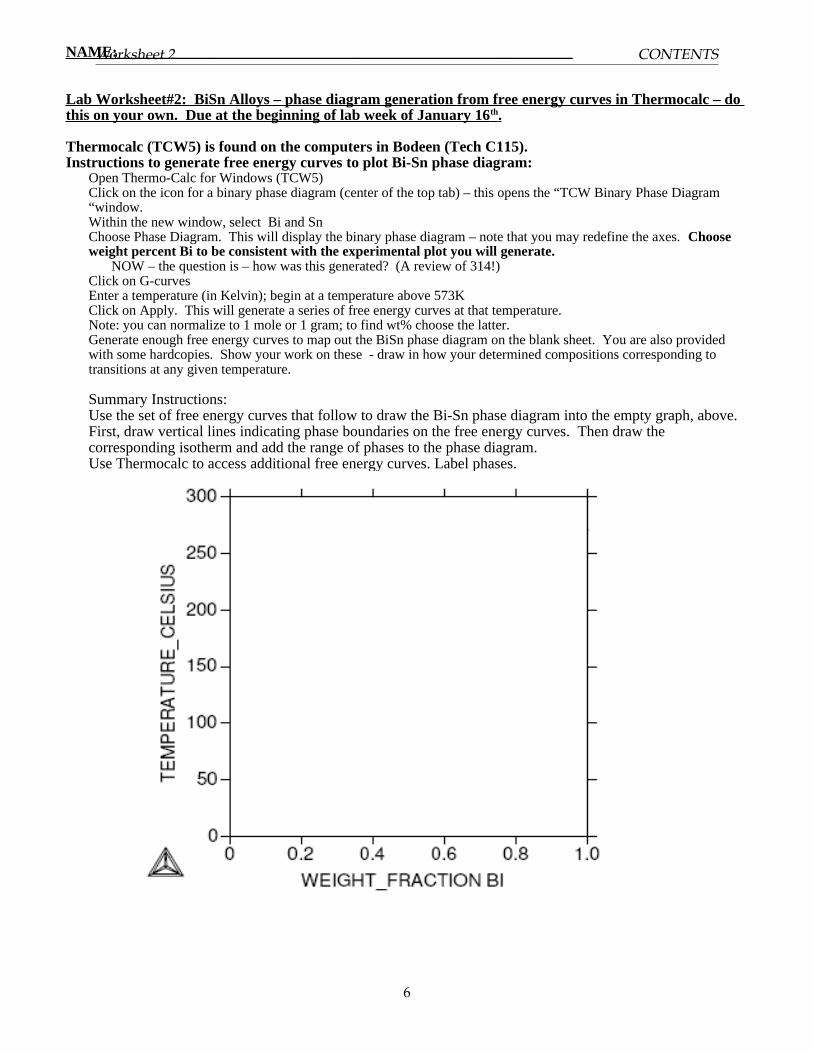
Lab Worksheet#2: BiSn Alloys – phase diagram generation from free energy curves in Thermocalc – do this on your own. Due at the beginning of lab week of January 16 th .
Thermocalc (TCW5) is found on the computers in Bodeen (Tech C115).Instructions to generate free energy curves to plot Bi-Sn phase diagram:
Open Thermo-Calc for Windows (TCW5)Click on the icon for a binary phase diagram (center of the top tab) – this opens the “TCW Binary Phase Diagram “window.Within the new window, select Bi and SnChoose Phase Diagram. This will display the binary phase diagram – note that you may redefine the axes. Choose weight percent Bi to be consistent with the experimental plot you will generate.
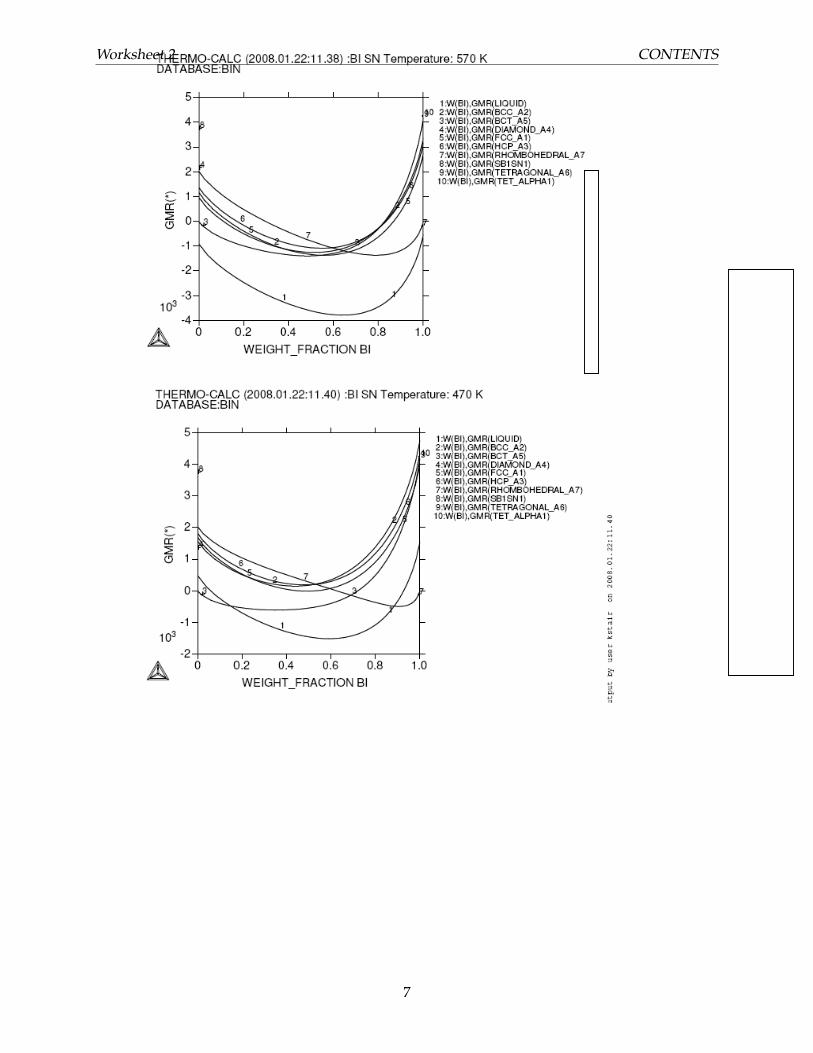
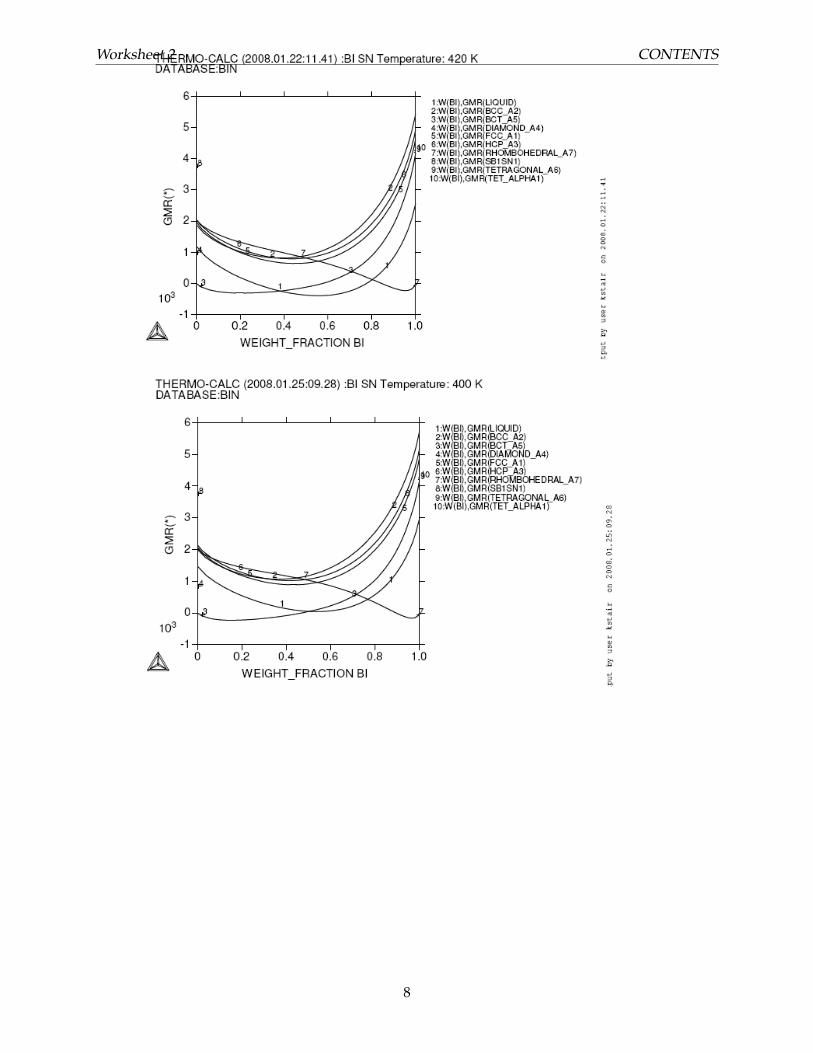
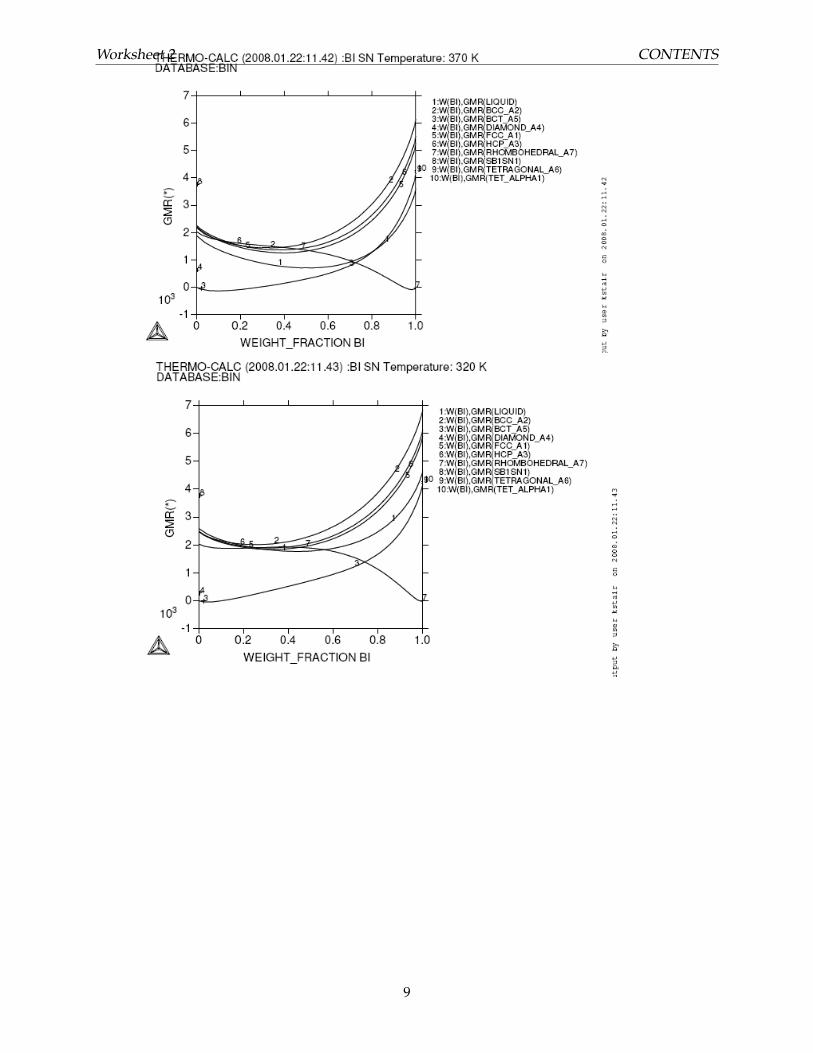
NOW – the question is – how was this generated? (A review of 314!)Click on G-curvesEnter a temperature (in Kelvin); begin at a temperature above 573KClick on Apply. This will generate a series of free energy curves at that temperature.Note: you can normalize to 1 mole or 1 gram; to find wt% choose the latter.Generate enough free energy curves to map out the BiSn phase diagram on the blank sheet. You are also provided with some hardcopies. Show your work on these - draw in how your determined compositions corresponding to transitions at any given temperature.
Summary Instructions: Use the set of free energy curves that follow to draw the Bi-Sn phase diagram into the empty graph, above. First, draw vertical lines indicating phase boundaries on the free energy curves. Then draw the corresponding isotherm and add the range of phases to the phase diagram. Use Thermocalc to access additional free energy curves. Label phases.
Worksheet 2 CONTENTS
6
Worksheet 2 CONTENTS
7
Worksheet 2 CONTENTS
8
Worksheet 2 CONTENTS
9
MATSCI 315: Phase Equilibria and Diffusion in MaterialsLaboratory Instructor: Dr. Kathleen Stair, Cook 2039, [email protected]
Lab#1: Binary Alloy Phase Diagrams
REMINDER: Laboratory Notebook: You should be prepared to take notes in a notebook (not on loose paper) during lab. Keep notes and lab handouts in order. You will need to refer to these when writing your lab reports.
Lab 1 Objectives: To understand the experimental generation of phase diagrams. To understand the relationship between phase diagrams and free energy curves.To measure, analyze and interpret data.
There are three parts to Lab1:Lab Worksheet #1 – pre-lab on temperature measurement. Due at beginning of lab week of January 9.
Lab Worksheet #2 - Generating a BiSn phase diagram using free energy curves in Thermocalc. Outside of class – generate the phase diagram using TCW5 found on computers in the Bodeen lab.Tech C115. (Start in lab, if time permits.) Due in lab week of Jan. 18th.
Lab1 – In lab exercise week of Jan. 9th: generate a BiSn phase diagram from experimental cooling curves. Individual write-up based on pooled class data. Due at the beginning of lab, week of Jan. 23.
Lab #1: BiSn Alloys – phase diagram generation from Cooling Curves
Checking calibration: We will be using type K thermocouples and data-logging devicesto measure temperature in the range of 100-300°C as a function of time for Bi, Sn and a series of binary alloys of BiSn. The change in the rate of change in temperature as a function of time indicates changes in phases, as described by the Gibbs Phase Rule (also see http://www.doitpoms.ac.uk/tlplib/phase-diagrams/cooling.php)How accurate and precise is your measurement device? Think about how you might check this and anticipate that you will discuss this in your report.
Part i: EndpointsStart by measuring a cooling curve of either Bi or Sn. Plan to pool group data.
Use the Easy-Log program to setup a data-logger. Use a ring-stand and clamp to secure a data-logger and thermocouple near
your hotplate. You don’t want the data logger too close to the heat; you do want the thermocouple to “spring-load” into the melt. Make sure the thermocouple leads are not touching anywhere along the length, except at the join.
Heat the crucible on a hotplate until the endpoint metal has melted. (This might not be obvious if there is an oxide on the surface. You can remove surface oxides by skimming the melt with a stirring rod.)
Make sure the thermocouple is in the melt and double-check that it is not shorted along its length.
Turn off the power to the hotplate and use the data-logger to record temperature down to ~ 100°C. Re-heat your sample, again measuring temperature vs. time to remove your thermocouple.
750-315 WQ17
315 Lab 1: Binary Phase Diagrams CONTENTS
10
Download your data to a common group folder using the EasyLog software. You may save the curves in Excel for export. Use a logically formatted filename for easy identification, .eg. Sn_Mon3_KS or 40Bi_Thurs1_KS
Determine the transition temperatures and record these.
Part ii: AlloysRepeat the procedure, above, for an alloy. These are designated by wt% Bi. Determine the changes in slope that correspond to phase transitions. Record these on the pooled data sheets.
Lab 1 Write-up
1) Write a short paragraph describing the theory behind cooling curve measurements. Include relevant equation(s).
2) Write a second short paragraph describing what was measured and how and include some mention of measurement uncertainty.
3) Using a plotting program (Excel or Matlab…or other) plot your endpoint (Bi or Sn) and alloy cooling curves. Indicate what phases are present in what temperature ranges by labeling the two curves with phase and temperature information.
4) Use the tabulated data, as well as the posted raw data, to determine all phase transition temperatures that can be determined for alloys in the Bi-Sn system. Again, using a plotting program, plot these transition temperatures as a function of wt% Bismuth, to determine the phase diagram. You will need to decide which points form a set corresponding to the same phase transition, i.e. a given liquidus line, for instance. Add appropriate fit(s), label phases, label axes, etc.....in order to generate a neat, complete, self-explanatory phase diagram.
5) Write a paragraph discussing the results. Also discuss what assumptions were made and how your plot does/doesn't agree with theory and other experimentally-determined Bi-Sn phase diagrams. (Be especially aware of what assumptions youmake in compositional ranges where no measurements were made.) You will find a calculated Bi-Sn plot at: http://www.metallurgy.nist.gov/phase/solder/bisn.html.Note that the temperature and composition that correspond to the invariant reaction (that is the eutectic temperature and composition) are listed in a table below this figure.
Notes on graphing:
i) You are gathering discrete data points, hence plot the data as such. (In Excel, choose ascatter-plot, without additional lines.) When you fit the data (i.e. by adding a trendline) use a line. Always consider your options: which points should you include or not include when fitting a given line? Should you let the program find the best regressive fit?Or should you fix the slope? Is the fit linear? Non-linear? Can you use data to determine all the liquidus, solidus and solvus lines in the system? Are there any you cannot determine? (You could indicate an approximation as dashed lines.) The details should be discussed in paragraph II of your text.
ii) Represent data with the appropriate number of significant figures. If you are averaging 321 °C, 323 °C, 324 °C the average value is 323 °C. (Do not add false significance when computing an average value.) If there is uncertainty in determination of a transition temperature, it is OK to indicate this as a range. Likewise, if you have
750-315 WQ17
315 Lab 1: Binary Phase Diagrams CONTENTS
11

several data points for a single value, i.e. the melting temperatures of the endpoints, then you could plot all the points, or plot the average but indicate the range which was measured. Assuming a normal (Gaussian) distribution of these values, you can find the uncertainty of the mean to within a 95% confidence level by determining 2X the standard error of the mean: 2x the standard deviation (STDEV in Exel) divided by the square root of the number of points measured. Indicate these values on your plots by adding error bars: left click the data set and choose Format data series > Y error bars.
iii) Label axes appropriately AND label all phases present in different regimes.
750-315 WQ17
315 Lab 1: Binary Phase Diagrams CONTENTS
12
MSc 750-315: Applications of ThermodynamicsWorksheet #3 - Ternary diagrams using Thermo-Calc
You will find the TCW5 program and the NIST_solder database installed on the computers in the Bodeen lab (Tech C115). You can login using your netid and password – though you may need to change your password.
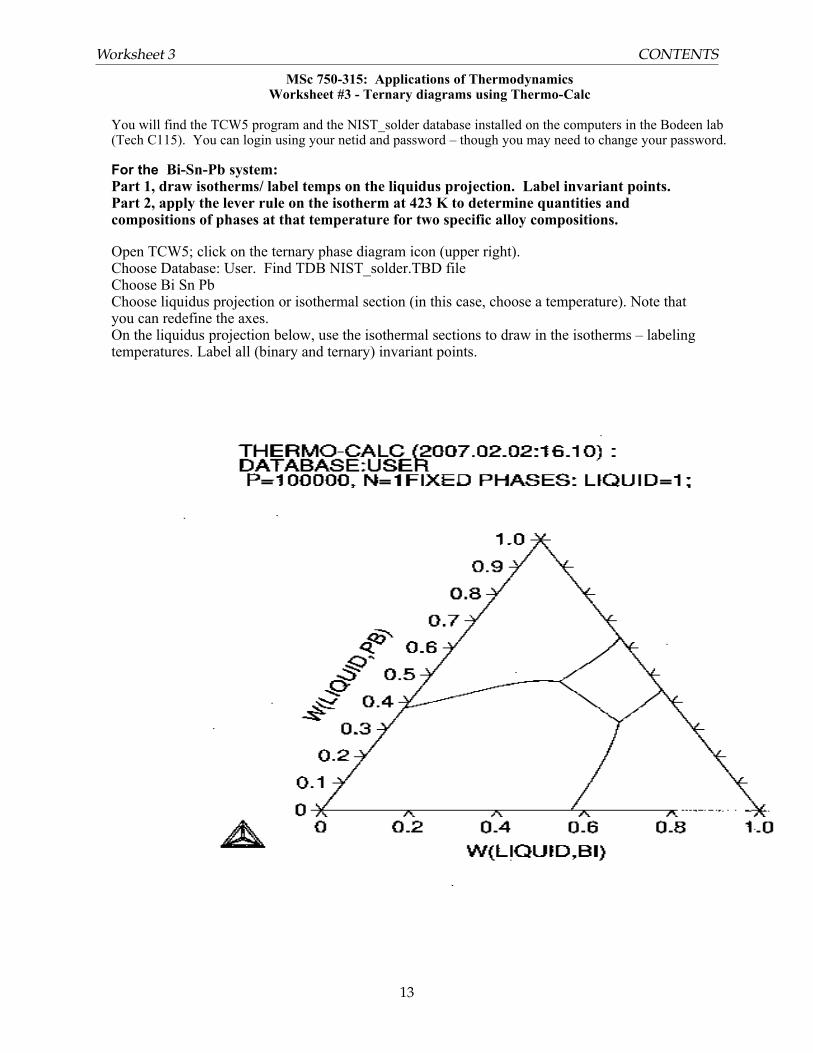
For the Bi-Sn-Pb system:Part 1, draw isotherms/ label temps on the liquidus projection. Label invariant points.Part 2, apply the lever rule on the isotherm at 423 K to determine quantities and compositions of phases at that temperature for two specific alloy compositions.
Open TCW5; click on the ternary phase diagram icon (upper right).Choose Database: User. Find TDB NIST_solder.TBD fileChoose Bi Sn PbChoose liquidus projection or isothermal section (in this case, choose a temperature). Note that you can redefine the axes. On the liquidus projection below, use the isothermal sections to draw in the isotherms – labeling temperatures. Label all (binary and ternary) invariant points.
Worksheet 3 CONTENTS
13
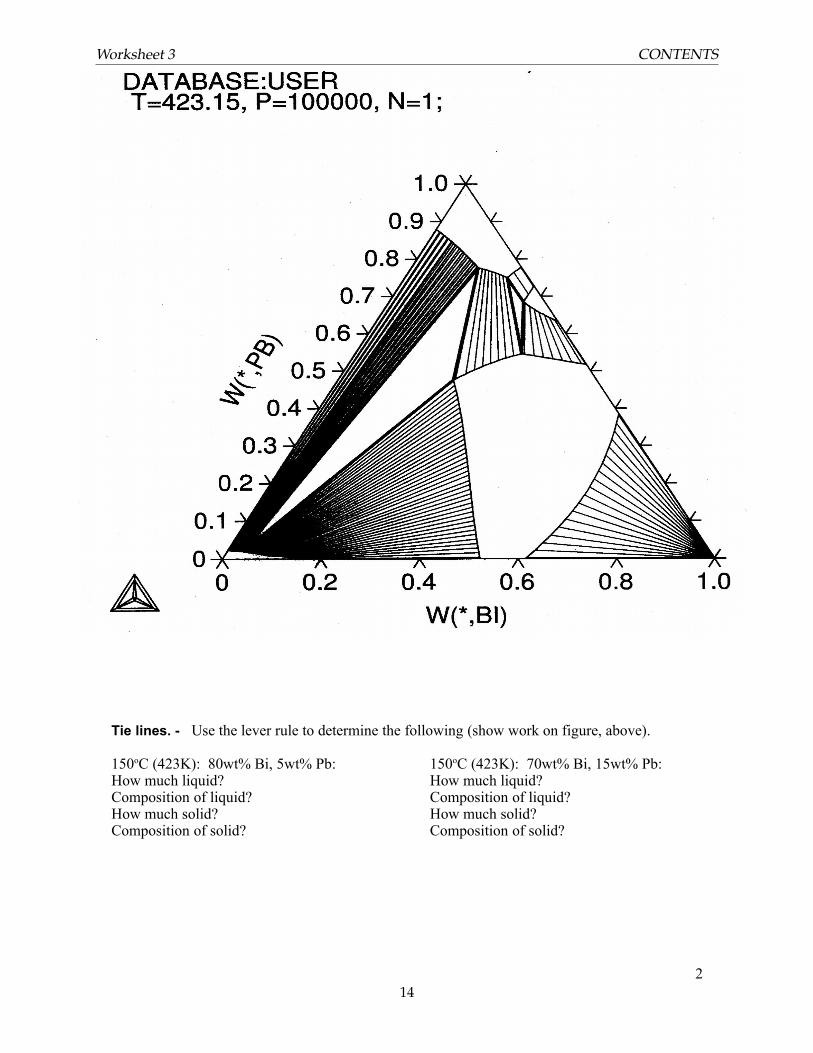
Tie lines. - Use the lever rule to determine the following (show work on figure, above).
150oC (423K): 80wt% Bi, 5wt% Pb: How much liquid? Composition of liquid? How much solid?Composition of solid?
150oC (423K): 70wt% Bi, 15wt% Pb: How much liquid? Composition of liquid? How much solid?Composition of solid?
2
Worksheet 3 CONTENTS
14
315 Lab #2 BiSn alloys: Metallographic preparation and microstructural examination
Recall that we determined the phase diagram of Bi-Sn using cooling curves. In this lab we will examine microstructuresof the alloys. Part of the learning objective is to become familiar with metallographic preparation procedures and use ofthe optical microscope, as well as correlating microstructure to the phase diagram. Read through all steps before starting.
1. Put on safety glasses. Choose a sectioned sample of Bi-Sn; make sure each group (every subgroup of 2-3) in the labsection selects a different composition. Record the composition. Each of these samples contains saw-cut damage.Your objective is to reveal the true microstructure of the sample by removing this damage, as well as sequentiallyremoving damage from the initial grinding steps.
2. The samples will be mounted in acrylic using 1 ¼” diameter molds. Make a label for your sample (composition,your initials) that will fit in the mold, under the surface of the acrylic, before it hardens. . A small piece of paper stuckjust under the surface will suffice.
3. Gloves are located in the two drawers to the left of the hood in 2084. Set the side of the sample to be examinedface down in a Sampl Kup (blue) mold. Measure two parts acrylic powder into a small paper cup. Add one partacrylic resin. Mix (or more appropriately, “fold” – to avoid mixing in too many air bubbles) the powder and liquid (itshould have a consistency of honey or syrup), then pour the mixture over the sample in a Sampl Kup. Add a label tothe back of your mount before the acrylic solidifies. The acrylic will harden in about 15 minutes.
4. Round the sharp edge of the sample by rotating the edge on a piece of grit paper. This helps keep the samples from“grabbing” the paper or cloths on the autopolisher. Use the autopolisher to sequentially grind with SiC grit (~ 1-2minutes for each size), then polish diamond suspension. (Note that this is slightly modified from the recommended“universal” autopolishing sequence; the diamond suspensions tend to become embedded in the soft metals you arepolishing, and the surfaces become gummy and discolored when using the normally-recommended 0.05 micronalumina final step. Also you can use lower force – 4 or 5 lbs – and shorter times than are recommended for hardermaterials.) It is critical that you wash and ultrasonically clean the samples between each polishing step (but not eachgrinding step) to avoid contaminating the polishing pad with larger sized grit or sample debris.
5. Before looking at samples on the light microscope, make sure they are clean and DRY. Use ethanol as a final rinse,and then dry the samples under the hand dryer. Please be careful. Moisture or solvents will ruin the objective lenses.Set the samples face down on a piece of paper to make sure water does not seep from between the sample and mount.Microscope instructions are attached.
6. Use the autopolisher to sequentially grind and polish the samples to a final grit size of 1 micron diamond.
7. Etch (using the assigned etchant) to reveal microstructure. The etchant for this lab is 5% HCl in methanol, by volume– prepared by your TA or lab instructor. Make sure you are wearing your safety glasses and add gloves – rubbergloves or latex gloves are OK – before working with the etchant. The etchant should remain in the hood. (Youshould remain entirely outside the hood.) You are etching until you rinse the sample. Use tongs to dip the sample inthe etchant for ~ 5 seconds; rinse; examine the surface by eye. It will become slightly cloudy as etching occurs.
8. Record images that are representative of your sample, to be included in your lab report. Be sure to mark eachmicrograph with a micron bar.
9. Share images of all the final polished, etched samples between all members of your lab group.
10. Analyze the volume fraction of the different phases present using a point grid. Note: you could measure the relativeamount of each phase or the relative amount of primary phase vs. eutectic (remember, the eutectic is a two-phasemicro-constituent). Make a careful note of what you measured and why.
315 Lab 2:Bi-Sn Alloys CONTENTS
15
Lab#2: WRITE_UP: Due beginning of lab week of Feb 6th – groups of two or three.
Metallographic preparation and microstructure of BiSn alloys
This (short memo-style) report will be a truncated version of a formal lab report. The intent is to document your samplepreparation and relate the final microstructures to the phase diagram.
Title, authors
Methods and Materials: Describe your samples and how you prepared them. Include any images that show theprogression of grinding, polishing, etching steps. Include details about grit size, diamond suspension size, loads, etchantand etching times. Label images as figure 1, etc. and include captions. Note that figure captions are placed below a figure.(The convention for tables is that the title is above the table.)
Results & Discussion: (Begin this section with text.) Discuss the alloys that were prepared by your group. Showcorresponding images. Include figure numbers and captions and label the phases present. Include a discussion of thevolume fraction analysis and conversion to weight percent and how it agrees (or doesn’t) with the known composition ofyour alloy.
315 Lab 2:Bi-Sn Alloys CONTENTS
16
Using Stereology to measure Volume Fraction(for more details, see ASTM E562 – 83)
Often, when viewing cross-section of metallography (or ceramic, etc) samples under a microscope, it is desirable to make quantitative measurements of such values as the grain size and volume fraction of particular phases.
The latter is easily accomplished using point-counting techniques. In this case, a test grid is superimposed uponthe image of the sample and the number of points falling within the microstructural constituent of interest is counted. This, divided by the total number of points in the grid, provide an estimate of the volume fraction of the constituent of interest.
VV = P(alpha)/PT
Size of grid/ Number of MeasurementsThe size of the test gird is typically 4x4 or 5x5 points. In order to lower the uncertainty in the measurements, one should count approximately 100 points on the constituent of interest, P (alpha). This means overlaying the grid many times, on different areas of the sample. Often, an eyepiece reticle is used to facilitate this counting.
MagnificationThe magnification should be high enough to avoid adjacent grid points falling on the same microconstituent feature. Choose a magnification giving an average constituent size of ~ ½ the grid spacing.
Counting Count and record the number of points on the microconstituent in each application of the grid. Count points falling on a boundary between constituents as ½.
Uncertainty in measurementYou can easily determine the standard deviation, standard error of the mean and confidence levels by tabulating all the values measured. In theory, the value of the coefficient of variation (the standard deviation / mean) is:
σ (V v)V v
=√ 1−V V
Pα
Comparison to mass fractionNote that the volume fraction and mass fraction are not equivalent, but one may convert from one to the other using the densities of the respective phases (see Callister, chapter 9):
W α=V α ρα
V α ρα+V β ρβ
315 Lab 2:Bi-Sn Alloys CONTENTS
17
Materials Science and Engineering Dept.315 - Phase Equilibria and Diffusion
Worksheet #4 Diffusion of Carbon into 1018 steel using pack-carburization
These are questions to answer during lab and after – and include in your final report.These answers will be due in the beginning of lab, week of Feb. 13th
1. What equations (solutions to the diffusion equations) describe diffusion from a plane source, i.e. carburization? That is, equations that describe the concentration profile (concentration vs. distance) as a function of time, temperature and diffusivity?
2. Re-write these equations to describe the change in hardness. What assumptions are madein our experiment?
3. Briefly describe the following hardness measurements:
Rockwell
Vickers
Knoop.
4. What are the units for Vickers and Knoop testing? Assuming a ductile material, hardness ~ 3 x yield strength. What units will you use for the comparison between hardness and yield strength? Explain the conversion.
5. You will be experimentally determining the diffusivity of carbon in steel at 940 and 960°C, the temperatures at which class samples were prepared. Find some comparison values or an equation you can solve – that is values from the literature to which you will be able to compare your results:
Worksheet 4 CONTENTS
18
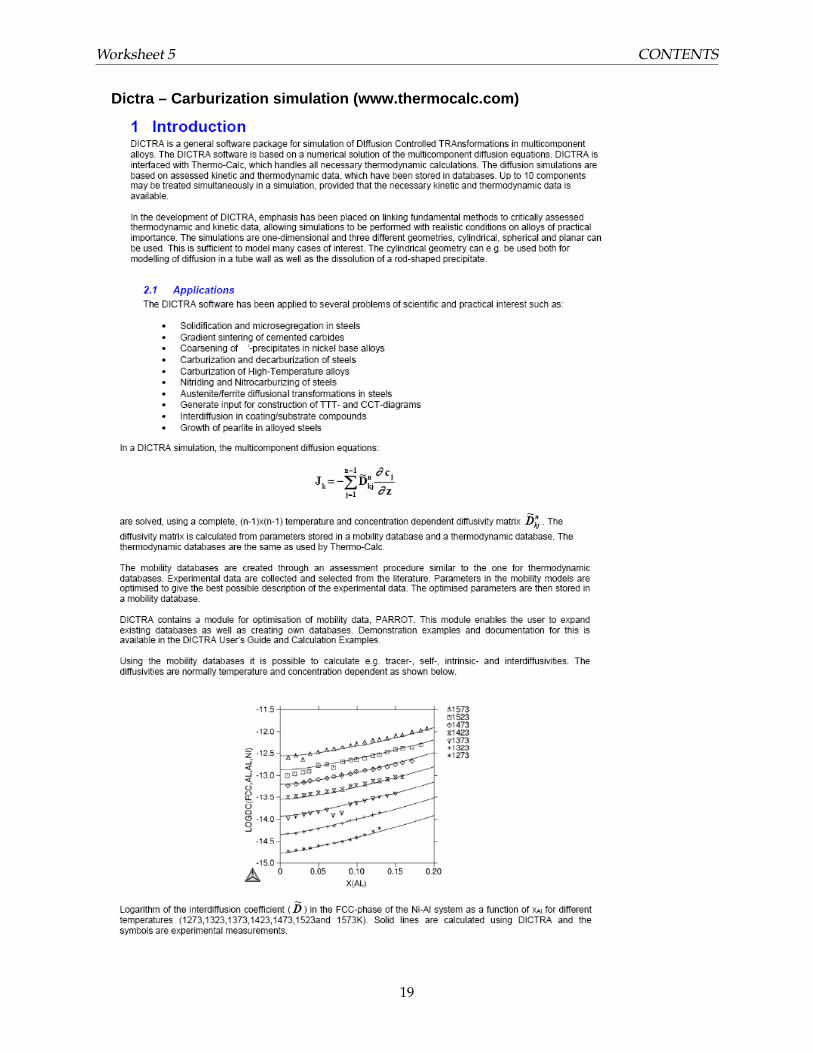
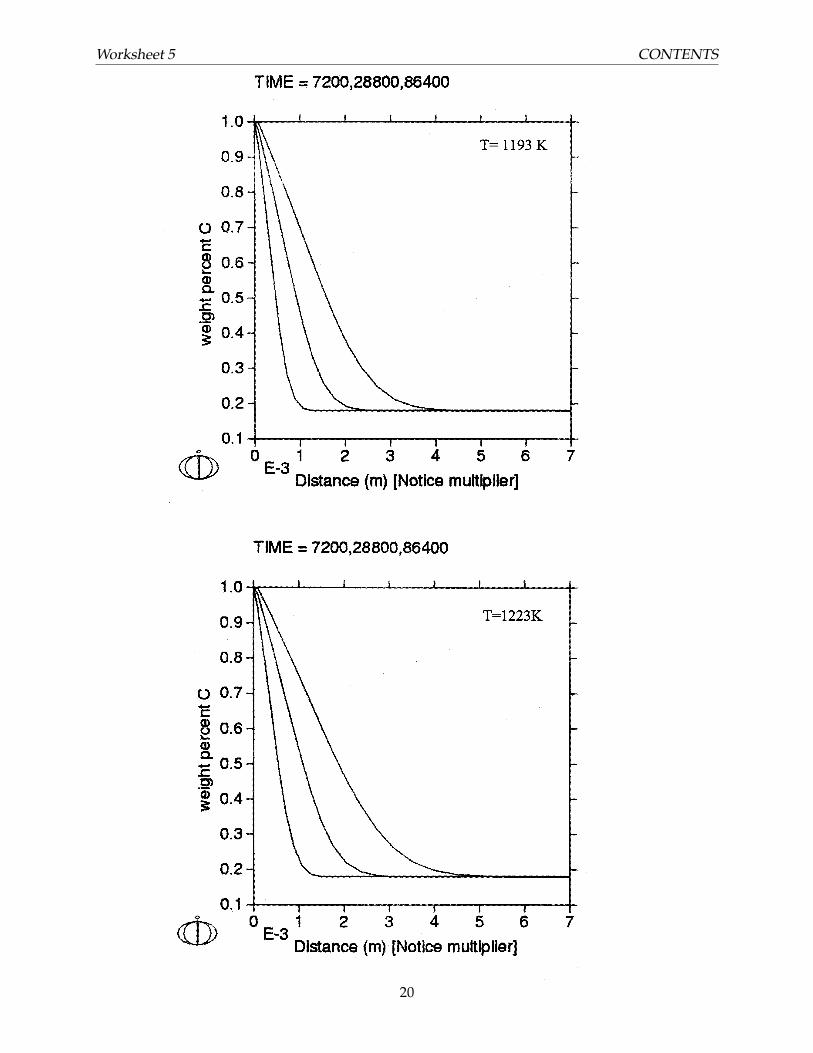
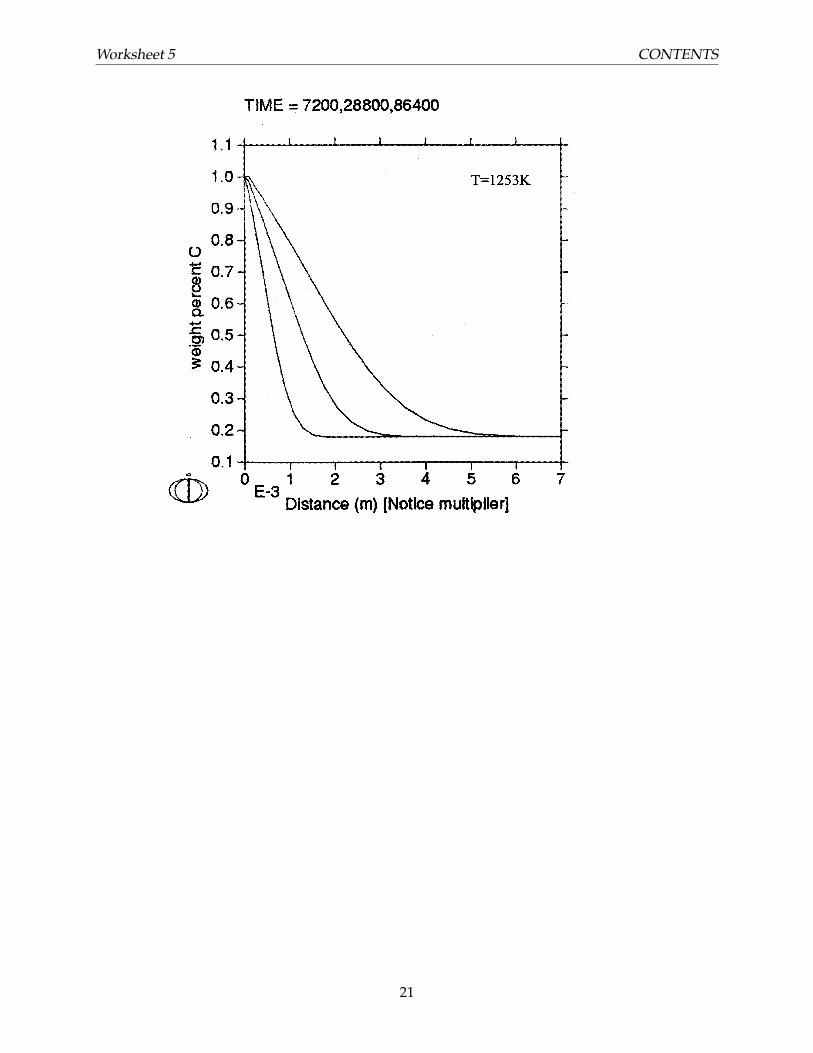
Dictra – Carburization simulation (www.thermocalc.com)
Worksheet 5 CONTENTS
19
Worksheet 5 CONTENTS
20
Worksheet 5 CONTENTS
21
Materials Science and Engineering Dept.315 - Phase Equilibria and Diffusion
Diffusion of Carbon into 1018 steel using pack-carburization
Samples of 1018 steel were packed in a mixture of 85wt% activated charcoal and 15wt% calciumcarbonate in steel bags. Samples were subsequently pack-carburized for three times at three temperatures (915°C, 940°C and 960°C). Each lab group will examine three samples from a single carburization temperature.
Part I: Mount the samples in thermo-setting resin and label. Grind (320, 400, 600, 800 girt SiC)then polish with 3µ and 1µ diamond suspension on a microcloth pad. Briefly (1-3 seconds) etch with nital (2% nitric acid in methanol). You might swab the etchant on the surface with a cotton-tipped swab. Rinse with water, then with solvent; dry. Examine the microstructure across the sample. Gather images that you can relate to the change in composition from center-to-edge of the samples.
Part II: Measure a hardness profile from edge toward the center of the sample. (Note that this might work best on an unetched sample. If you have already etched, return to the 1 micron diamond wheel to remove the etched layer from the surface.) Use the Struers semi-automated microhardness tester to measure Vickers hardness from the carburized surface toward the center of the specimen in increments of ~50-100 microns for the first ~2 mm, then ~200 microns until the values clearly plateau. Use the 10X objective to focus; use the 40X objective to measure the indent. Rotating between objectives and indenter is best done using the automated program (Duramin5). To avoid interference between indentations, spacing should be about 3x the indent size -- but zig-zagging is allowed. You want to obtain 10-20 points to define your hardness profile. In addition, you should measure ~ 10 points near the center (undiffused region of the sample) to determine what uncertainty is associated with the measurement on these samples, independent of the change in hardness.
Write-up (groups of 2 or 3):Introduction – brief background on pack-carburization of steel and literature values of the diffusivities which you will solve for experimentally.
Methods – how did you prepare and characterize samples? Well-written and concise, with enough detail to repeat the experiments.
Results - Your results will include micrographs with appropriate captions that describe the effectof carburization on the steel microstructure. You will need images from both the center and the edge of your sample(s). Label phases/ microconstituents, add micron bars, etc. on these. Estimate the carbon content at the surface, and explain your rationale.
Results, cont’d - Your results will also include experimental hardness profiles along with a fit from which you estimate the diffusivity of carbon in steel. The experimental data should be represented as points; the fit should be represented as a smooth curve. (Note that this curve will NOT be a polynomial; you know the functionality based on the solutions to planar diffusion -see in-lab handout from week 1 of this lab. USE THESE, NOT a polynomial, which will give a very poor fit. ERF and ERFC functions are available in Excel and Matlab.
Discussion – place your results in the context of literature values and those determined from the Dictra plots. Clearly state any assumptions you made in your analysis. (Use the DICTRA solutions (in-lab handout week 2 of this lab) as a starting point to determine D and also for
315 Lab 3: Pack-Carburization CONTENTS
22
comparison. Also include values of D based on other sources (Porter & Easterling, Callister, etc.). Show the comparison graphically.)
Conclusions – provide a summary of the main points/ values determined in the lab, how well they matched expected values and some assessment about the agreement or lack thereof.
Quick Microhardness Instructions: Vickers (Knoop)
Turn on microhardness tester (rear) and restart computer.
Insert specimen into holder.VERY IMPORTANT: THE SAMPLE MUST BE FLUSH WITH THE TOP OF THE HOLDER.Note that the tip clearance is very small. IF the sample is at all recessed, when you focus you will be below the tip clearance level. If the tip runs into the sample holder this is a VERY COSTLY and TIME-CONSUMING repair. (The equipment must be shipped back to Struers for repair.)
Inspect with 10X objective to focus and find the test area. Also, focus the eyepeice. Set the loadto 300gm. (Note on load selection -- you want a large enough indent to measure accurately; but use a load that does not cause excessive damage to your sample, such as deformation or cracking at the indent tips.)
Vickers is chosen, and the processor load is set to 300gm; objective to 40X
Select “indent.” Do NOT move the indentor with the start button illuminated. Note that for a Vickers test the indent should be an equiaxed pyramid.
Change to the 40X objective.
You may use (or over-ride as necessary) the Automeasure feature.
Make sure you record both hardness and distance from the edge of the sample.
NOTE: Use the Struers semi-automated microhardness tester to measure Vickers hardness fromthe carburized surface toward the center of the specimen in increments of ~50-100 microns for the first ~2 mm, then ~200 microns until the values clearly plateau. Use the 10X objective to focus; use the 40X objective to measure the indent. Rotating between objectives and indenter is best done using the automated program (Duramin5). To avoid interference between indentations,spacing should be about 3x the indent size -- but zig-zagging is allowed. You want to obtain 10-20 points to define your hardness profile. In addition, you should measure ~ 10 points near the center (undiffused region of the sample) to determine what uncertainty is associated with the measurement on these samples, independent of the change in hardness.
315 Lab 3: Pack-Carburization CONTENTS
23