3.2 on-land solar ponds and enhanced evaporation systems
TRANSCRIPT

Chapter 3: Overview of Restoration Options
19
3.2 On-Land Solar Ponds and Enhanced Evaporation Systems On-land solar ponds would be constructed using standard construction procedures for earthen berms or embankments. With the solar evaporation pond process, a series of shallow ponds would be constructed as shown in Figure 3-2. Salt water would be pumped to the upper-most pond and flow by gravity through the system. Evaporation would cause the water to become saltier from pond to pond. Concentrated brine from the final pond would be pumped to disposal ponds where crystallization would occur and residual salts would be disposed. The pond systems could be made smaller by adding ground-based enhanced evaporation system (EES) units that operate similar to snowmaking equipment as illustrated in Figure 3-3. A tower style enhanced evaporation system has also been considered.
Since land-based systems would not reduce the evaporative surface of the Sea, but would require water withdrawals, they would tend to lower the elevation of the Sea by 5- to 10-feet below any reductions that occur because of reduced inflows. Coupled with reduced inflow conditions, the Sea elevation could drop 30 feet below its current elevation during a transitional period and ultimately settle at an elevation 20 to 22 feet lower than the current level. Salinity would also exceed 60,000 mg/L during part of the transition, and would take 20 to 25 years until it returned to present levels (44,000 mg/L) or lower. In addition, on-land systems would need to be very large. Without enhanced evaporation units, on-land
evaporation pond systems would need to occupy 60 or more square miles.
For methods requiring on-land salt disposal, the disposal options would involve crystallizing salts in an impoundment. Following concentration of salts through evaporative process or other processes, saturated brines would be conveyed to disposal ponds that would be constructed using earthen berms. Salts would crystallize in the ponds forming a rock salt similar to pea gravel that would cause the bottom of the pond to rise over time. As the pond bottom rises, berms containing the pond would have to also be raised. After about 30 years, the height of the berms would be about 25 feet. From the ground, the disposal facility would look like a large desert landfill. Salt disposal modules on land and on flat terrain would be the least expensive salt disposal method. Not all alternatives discussed below would require construction of disposal facilities.
Figure 3-2. Sketch of On-Land Solar Pond System.
Figure 3-3. Sketch of Ground-Based EES Units.

Salton Sea Restoration: Preferred Project Report
20
Impoundments, such as those for either the salt removal or disposal components of solar pond systems, have the potential for accumulation of contaminants. A study (Tetra Tech, 2004) of constituent concentrations in solar pond pilot projects at the Salton Sea indicates that constituents including selenium will tend to concentrate in such ponds, particularly in those with the highest concentrations of salts. This finding is contrary to results from locations such as Kesterson Reservoir and numerous evaporation ponds in California’s Central Valley where selenium was observed at the greatest concentrations in the initial few impoundments, probably due to high primary productivity. Primary and secondary productivity were observed to be very low in the solar pond pilot project at the Salton Sea. However, this study indicates that there could be some low-level ecological risks associated with concentration of constituents such as selenium in ponds with the highest salt concentrations.
During the recent stages of alternative development, specific locations where facilities could be sited were not identified. Instead, a siting analysis was conducted to identify areas that would be generally suitable for locating salt removal and disposal facilities. About 60 square miles of suitable area were identified for possible siting of facilities that would use enhanced evaporation salt removal methods, and more than 400 square miles were identified as suitable for on-land solar pond siting. More than 100 square miles were identified as suitable for on-land salt disposal.
In its 2003 Status Report, Interior estimated that for the reduced inflow conditions evaluated, the present value cost for on-land ponds could be as much as $1.3 billion; and with enhanced evaporation systems, the present value costs could be as high as $2.4 billion.
3.3 Desalination From a purely technical perspective, desalination of Salton Sea water has long been considered to be one of the most desirable strategies for controlling salinity in the Sea. A photo simulation of a desalination plant is illustrated in Figure 3-4. Desalination offers the ability to remove salt, while removing very little water. The desalination technologies that have been evaluated in the past have been eliminated from further consideration because of the high cost of
Figure 3-4. Representation of Desalination Plant.

Chapter 3: Overview of Restoration Options
21
energy associated with most processes. Recently an evaporative technology emerged that would take advantage of waste steam from geothermal operations at the south end of the Sea.
Applying desalination technologies would replace 70 to 80 percent or more of the feed water with fresh distilled water and would produce a concentrated brine stream of about 20 percent of the feed water. This fresh water could be returned to the Sea so that the process would have little effect on the elevation of the Sea or it could be sold to help pay for the restoration effort. Returning fresh water to the Sea would help with salinity control and would also help maintain the water surface elevation. The Sea elevation would still decline as a result of reduced inflow, but not much from the desalination process.
The brine concentrate, amounting to 20 or 30 percent of the feed-water flow, could be disposed of in one of three ways: (1) pumping the concentrate through a pipe into a suitable basin remote from the Sea for its evaporation over time, away from wildlife; (2) processing the brine through crystallizing evaporators to remove saleable sodium sulfate and other sulfates and injecting the sodium chloride and mixed salt residue into the geothermal aquifer, and (3) evaporating the brine to a salt residue using crystallizers and disposing the salt by landfill procedures. The gypsum precipitate could be disposed of at an approved disposal facility or sold for other commercial uses.
Interior (2003) estimated that an evaporative desalination system of the size needed at the Salton Sea would have a present value on the order of $1.2 to 1.5 billion. This estimate includes only the desalination system and brine disposal and not any other elements of a total restoration program. With this type of action, the Sea’s water surface elevation would still decline by about 20 feet under an inflow scenario that would be expected with the QSA in place. Therefore, additional funds would need to be expended for control of dust and/or habitat enhancement in the roughly 100 sq. mi. of bottom sediments that would be exposed.
3.4 In-Sea Solar Evaporation Ponds This alternative would involve the construction of in-Sea solar pond systems with in-Sea salt disposal as illustrated in Figure 3-5. The systems would operate similar to the on-land solar ponds discussed in Section 3.2 above. Salt water would be diverted by gravity flow or pumps through a series of ponds where salts would concentrate from evaporation until ultimately concentrated brine would be formed. Figure 3-5. Sketch of In-Sea Solar Ponds.

Salton Sea Restoration: Preferred Project Report
22
The brine would be diverted to disposal ponds where salts would crystallize and build up over time. An advantage of in-Sea systems over similar on-land systems is that they reduce the surface area of the Sea. The surface reduction compensates for the water that is withdrawn. Therefore, operation of in-Sea pond systems potentially would not affect the elevation of the Sea. A second advantage is that on-land salt disposal areas would not be needed. Eventually salt disposal areas within the Sea could possibly be capped and converted to islands or peninsulas and used for recreational purposes.
Unfortunately, in-Sea construction would be much more expensive than construction on land. In addition, the cost of in-Sea pond systems would go up under reduced inflow conditions. Pond systems would need to be larger to remove more salt that would otherwise concentrate in the shrinking Sea. For the reduced inflow conditions investigated by Interior (2003), they put the price tag of in-Sea pond systems at between $2 and $3.5 billion.
In addition to the added size and cost of in-Sea pond systems with reduced inflow, there is a technical challenge. Under an inflow scenario as expected with the QSA in place, the Sea would drop by about 18 feet. Pond systems constructed in shallow water with today’s elevations, would be well above the new water line of a smaller Sea. The surface area reduction benefit of constructing in-Sea would be eliminated and continued operation of the pond system would tend to further reduce the elevation of the Sea in that water would need to be pumped out of the Sea and into the pond system. Under this scenario, the added cost of constructing within the Sea would help with elevation and salinity control during the transition phase, but would not result in a long-term benefit. Alternatively, new ponds could be constructed within the smaller Sea, thus adding cost to the program.
3.5 Replacement Water The salt removal systems discussed above do not function very well without replacement water. Various sources of replacement water have been evaluated in the past to compensate for reduced inflows to the Sea. Three potential sources that have been considered in the past are discussed below. These potential sources may not be available. Even if available, they would likely not be able to provide reliable and sustainable water in sufficient quantities to make up for inflow reductions.
Flood Flows. One source of replacement water that has been considered previously is flood flows from the Colorado River (flows in excess of the amount of the 1944 Treaty obligation to Mexico that cannot be used or stored within the U.S.). The quantity of these flood flows is expected to decrease over time as the storage and diversion capacity within the U.S. expands. It is very unlikely that this expanded diversion or storage capacity would be available to provide additional water to the Salton Sea.

Chapter 3: Overview of Restoration Options
23
Central Arizona Salinity Interceptor Project (CASI). Brine reject from the proposed CASI system was considered as a possible future source of water and included as part of some of the alternatives analyzed in the January 2000 Salton Sea EIS/EIR. Subsequently, uncertainties associated with this potential source removed it from consideration. However, if conditions change in the future, it could possibly be reconsidered.
Plan for Desalting the Colorado River Aqueduct Proposed by the City of Brawley, CA. The City of Brawley has proposed a plan to improve the quality of water flowing in the Colorado River Aqueduct. The plan would involve construction of a desalination plant along the Aqueduct. Reject water from the plant could be routed to the Salton Sea to help sustain the lake. The latest estimates indicate that about 60,000 acre-feet/year could be available to the Sea at a salt concentration of about 10,000 mg/L. There is uncertainty as to whether this project will be approved and funded for construction.
Groundwater Sources. Other sources of replacement water that have been studied include the use of brackish groundwater from the surrounding watershed. In the past, no cost-effective groundwater sources were identified. However, recently the East Mesa area of the Imperial Valley has been investigated as a possible transitional source that could be useful during periods of changing inflows. This potential source is also being investigated as a possible means of mitigation for the IID-San Diego Water Transfer Project.
East Mesa represents the triangular area east of East Highline Canal (EHC), West of the Algodones Dunes, and north of the U.S. border. Water quality for much of East Mesa is fairly good at 500 to 1000 mg/L TDS, but there is a large area with a TDS anomaly where the TDS levels are 2,500 mg/L or more. Groundwater of such quality would not be suitable for drinking and would be of little value for most applications. However, this quality of water would likely be acceptable as a source of import water for the Salton Sea.
Preliminary analysis suggests that up to 75,000 acre-feet/year could be imported into the Salton Sea for a period of 10 to 12 years. Depending on which part of the aquifer is tapped, conveyance distances could range from about 10 miles to nearly 50 miles. Preliminary cost estimates suggest that the present value cost of importing East Mesa area groundwater could range from $100 to $400 per acre-foot.
Lawrence Livermore National Laboratory has been provided federal funding to conduct a groundwater study in Fiscal Year 2004. This study may provide additional insight into groundwater storage capacity of aquifers surrounding the Sea. However, based on the current knowledge of groundwater availability it is generally believed that the brackish groundwater available could help the Sea during a transitional period, but would not serve a long-term replacement for reductions in base flow plus an annual transfer of up to 300,000 acre-feet.

Salton Sea Restoration: Preferred Project Report
24
3.6 Brackish Water Impoundments The options discussed in Sections 3.1 through 3.4 have been considered for the Salton Sea in various reports over the past several decades. As discussed above, these methods do not perform well under reduced inflow scenarios. Therefore, in the early part of the present decade, other ideas began to emerge.
In October 2001, the Pacific Institute proposed a solution to the problems at the Salton Sea that they suggested would provide environmental and recreational benefits at the Sea, but would not control salinity or preserve the fishery within the main body of the Sea itself. The Pacific Institute for Studies in Development, Environment, and Security is an independent, non-profit center created in 1987 to conduct research and policy analysis in the areas of environment, sustainable development, and international security. The proposal was posted on their website at http://www.pacinst.org/saltonsea. html.
This proposal would involve placing treatment wetlands along the New and Alamo rivers and constructing dikes within the Sea near the north and south shores (Figure 3-6) to capture inflows and stabilize the water surface elevation at –230 feet. Water above elevation –230 feet would flow via gravity through pipes in the dikes to the main body of the Sea. Such a gravity fed system requires a reduction in inflows. The impounded north and south shore areas would transition to brackish, estuarine conditions. Actual salinity in these impounded areas would depend on several factors, including the volume and salinity of inflows (salinity of the Alamo and New rivers is currently about 2,900 mg/L) and the total volume of the impounded area.
A detailed review of the proposal was conducted by the Salton Sea Science Office (2002). The review was conducted by a group of nearly 30 scientists and engineers with diverse backgrounds in all aspects of the ecology of the Sea as well as the appropriate engineering disciplines to review the feasibility of the proposal. The review included an assessment of the costs associated with the dikes and other aspects of the proposal. The Pacific Institute estimated that the full proposal could
Residual
Brine
Pool
Figure 3-6. Impoundment Locations in Pacific Institute Proposal.

Chapter 3: Overview of Restoration Options
25
cost $400 million, based on cost factors from an earlier Salton Sea Restoration Project report; however, the more recent estimate of the present value of the full dike construction program would be over $1 billion. This more recent estimate involves 45 miles of dike most of which would be constructed in 15 feet of water.
The review also identified a number of ecological concerns related to the proposal. The following paragraphs are extracted from the Executive Summary of the Salton Sea Science Office (2002) review:
The ecological and recreational values of the impoundments would be determined primarily by salinity and contaminant levels and the fact that they would represent only about 12 percent of the area of the present Sea. As freshwater systems, they would quickly be colonized by large numbers of freshwater plants, invertebrates, and fish, with carp, tilapia, catfish, threadfin shad, and possibly largemouth bass dominating among the latter. These fish would be much more heavily infested with parasites than are present Salton Sea fish. As the impoundments would effectively be sluggish extensions of the rivers that feed them, they would have contaminant levels similar to those of the rivers. Selenium levels in impoundment waters would be roughly six times those in the present Sea. Fish and invertebrates in impoundments thus would be likely also to have much higher selenium concentrations than do fish and invertebrates of the present Salton Sea. These would pose significant increased risk to both sport fisherman and to fish- and invertebrate-eating birds, such as pelicans, grebes, ducks and shorebirds. The fish-eating birds would have fewer but more contaminated fish available to them than they do now.
Even after flowing through treatment wetlands, inflow waters would have higher concentrations of microbial pathogens than does the present Salton Sea. These would further inhibit or advise against various types of recreational use of the impoundments. Dense aquatic and terrestrial vegetation would colonize possibly 50 miles of now barren shoreline within the impoundments. This would serve as excellent habitat for certain birds but also for mosquitoes, including Culex tarsalis. The latter is a known vector in the region of western equine encephalomyelitis, St. Louis encephalitis, and, potentially, West Nile encephalitis, as soon as that gets to California from eastern U.S. The 9000 ac of treatment wetlands could also serve as major new mosquito-producing habitat and might also be sites of selenium concentration in the food web. Other biting insects (horseflies, biting midges) would also likely increase in abundance.
The residual Salton Sea would soon go fishless as salinity rose. The current aquatic invertebrate assemblage would also die out. For some years afterward, high densities of brine shrimp, brine flies and water boatmen would be found here and serve to attract large numbers of invertebrate-eating waterbirds. However, with increasing salinity the production of even such salinity tolerant

Salton Sea Restoration: Preferred Project Report
26
species drops rapidly. A residual Salton Sea at a salinity of 200 g/L would be as barren of birds as is most of The Great Salt Lake of Utah. Selenium levels in these salinity tolerant invertebrates would also be much higher than those in invertebrates of the present Salton Sea.
Though under the project proposed by the Pacific Institute the ecosystems in the region would initially continue to be as attractive to birdwatchers as the present ones, by most other criteria they probably would be less valuable for wildlife or human recreation and have negative economic repercussions for the region. Fishing, boating, swimming, and camping at the Sea would be less attractive options than they are now. Increased particulate matter air pollution would occur, might affect human health over a large region, and might affect agriculture as well.
A second concept for freshwater impoundments was proposed by US Filter Corporation in 2002. Under this concept, a dike would ring the Sea separating better quality water along the shoreline from hyper-saline water in the center. US Filter’s proposal included a desalination plant at the north end of the Sea that would produce approximately 500,000 acre-feet/year of water with low salinity (< 150 mg/L total dissolved solids). This water would be transferred to urban water users via the Coachella Canal and the Colorado River Aqueduct. The concentrate from the Reverse Osmosis (RO) plant would be returned to the central Sea. This concept is illustrated in Figure 3-7.
A review of the US Filter proposal was conducted by Tetra Tech, Inc. (2003) in cooperation with the Salton Sea Science Office and a Citizens Advisory Committee. The review included an assessment of feasibility and cost. US Filter estimated that the costs of dikes for this option would be about $600 million. However, this estimate was based on cost factors from several years ago for dikes that were not designed to have differences in water surface elevation from one side to the other. In addition, US Filter estimated that the length of dikes would be about 80 miles. Current design concepts for impervious dikes that have differential water surfaces would be more costly. In addition, the actual length of dikes along the shoreline would be 95 miles if constructed in 10 feet of water, and 92 miles if constructed in 15 feet of water. Therefore, estimates of the current dike costs alone for the US Filter Corporation proposal, without the treatment plant, are $1.9 billion if constructed in 10-feet of water and $2.6 billion if constructed in 15-feet of water.
The review of the US Filter proposal also suggested that the shallow brackish water impoundments would have many of the ecological problems that would be associated with the Pacific Institute Proposal as discussed above in Section 3.6.

Chapter 3: Overview of Restoration Options
27
3.7 Multiple-Dike Proposals Over the years, a large variety of diking schemes have been proposed at the Salton Sea. The 2000 EIS/EIR evaluated several alternatives that included diked impoundments. Under constant inflow conditions, dikes would serve to isolate saltier water from less salty water, and the water surface in the main Sea and in the diked impoundment areas would be at almost the same elevation. Under reduced inflows, dikes could be used in a different manner. Under such conditions, dikes could be used to help maintain the Sea’s water surface at or near its current levels while the impounded areas would be dry or could be used for other purposes.
In 2003, representatives of the consulting firm Black & Veatch made a series of presentations involving various configurations of dikes. The proposals for stabilizing the Sea would utilize evaporation or brine ponds, created by dredging sand to create dikes that would be up to 1,000 ft wide. An evaluation of the Black & Veatch proposals (Brownlie and Kirk, 2003) suggested that for the reduced inflows under consideration, areas surrounded by dikes would need to be as large as those shown in Figure 3-8. The diked areas would provide an outlet for water to help lower salinity levels in the Sea. In addition, by reducing inflows into the Sea, a supply of
Figure 3-7. Sketch of US Filter Corporation Concept.

Salton Sea Restoration: Preferred Project Report
28
agricultural drainage water could be captured and treated at a proposed treatment plant, creating a water supply to be used for other purposes. These uses could include transfer to local water agencies or the Colorado River Aqueduct. Black & Veatch estimated that up to 400,000 acre-feet of transferred water could be produced under this concept. A shoreline canal would surround the dike system and evaporation/brine ponds to ensure continuity of the existing shoreline. A goal of this concept would be to maintain a significant portion of the overall Sea and its existing shoreline.
The Authority evaluated this concept (Brownlie and Kirk, 2003) and estimated the cost to range from $2.3 to $5 billion to construct the project. Subsequent to the Black & Veatch
proposal, a preliminary geotechnical investigation of Salton Sea sediments was conducted by the Authority (URS and Tetra Tech, 2004). The investigation showed that bottom material consisted primarily of fine materials that may not be suitable to serve as hydraulically dredged and placed fill material for dikes. The cost estimates quoted for the Black & Veatch proposal could be updated with the latest design information, but the cost would still be expected to be well in excess of $1 billion because of the significantly greater length and amount of material.
3.8 Central Causeway Options The reviews of the dike concepts discussed in Sections 3.6 and 3.7, above, suggested that the use of dikes to create a smaller marine lake coupled with other uses of water were worthy of further consideration. These considerations led to a concept that a causeway could be constructed across the central portion of the Sea to create a marine lake on one side and an area for habitat enhancement or other uses on the other side.
Concepts similar to this had been considered and highly rated several years ago but had been eliminated from further consideration because of costs. However, with the rising cost of other alternatives because of inflow reductions, this concept seemed worthy of renewed consideration and further development. There are several ways in which a central causeway could be used. For example, a central causeway could be
Figure 3-8. A Review of the Black & Veatch Concepts Suggested that the Area Needed to Achieve a Water
Balance Would be Like the Gray Areas.

Chapter 3: Overview of Restoration Options
29
used to serve as a salt barrier with no elevation control. Under such a scenario, the water level would be about the same on either side of the barrier, but one side could be maintained at ocean-like salinity while the salinity on the other side would continue to rise. Over time, with the QSA in place, the water on both sides of the barrier would decrease to about 18 feet lower than the current level Sea.
An alternative to the barrier concept discussed above, would be to build the causeway as an impoundment structure to maintain a managed lake level on one side and allow the water level on the other side to adjust according to inflows. The Salton or North Lake concept illustrated in Figure 3-9 would follow this premise and utilize a mid-Sea impoundment to create a marine lake in the north and a variety of habitat and recreational features in the south. The concept would also allow for the expansion of geothermal energy in the south, in an area that is now under water.
The Salton or North Lake concept was presented to the Authority Board of Directors in early 2003. The Board endorsed the concept as a highly promising solution to the problems at the Sea and authorized further development of the concept. Further discussion of the evolution and enhancement of this basic concept is provided later in this report.
Figure 3-9. Salton or North Lake Concept.

Salton Sea Restoration: Preferred Project Report
30
This page intentionally left blank.

Chapter 4: Logical Process for Screening Alternatives
31
Chapter 4: LOGICAL PROCESS FOR ALTERNATIVE SCREENING The various categories of alternatives for solving the problems at the Salton Sea can be reviewed through a logical sequence of decisions given the current and likely future conditions at the Sea. The process begins by developing a series of questions which provide a roadmap through a sequence of decision points leading to a logical preferred project. The questions and logical decision points are discussed below and diagramed in Figure 4-1.
4.1 Would pump-in/pump-out systems work? Probably the largest and most critical issue for achieving a broad range of project objectives is the control of salinity. This is a far-reaching concern that has implications for both the ecology and the economy and recreational value of the area. Thus, probably the first logical question is: could we create an outlet to the Gulf of California or Pacific Ocean to remove salt and at the same time bring ocean water back in to help sustain the Sea? From the perspective of those interested in preserving the Sea, export of salts to a distant location is very appealing. In addition, a pipeline or pipelines combined with canals to the Gulf or Ocean would also offer the opportunity of developing a return line that would bring water with ocean-like salinity back into the Sea to help control the water surface elevation of the Sea. Pipelines for pumping water uphill from the Sea and the Gulf coupled with a canal system on the downslope side could also possibly provide a navigable waterway to the ocean.
As appealing as the pipeline/canal approaches may seem to be on the surface, there are many drawbacks, including extremely high costs. Ocean water is about 20 times more salty than the Sea’s current inflow. To achieve a salt balance, and thereby control salinity, and also maintain the elevation of the Sea in a decreasing inflow environmental, massive amounts of water would have to be exchanged. The Interior’s 2003 Status Report estimated that pipeline or pipeline and canal systems to exchange water between the Salton Sea and the Gulf of California could cost anywhere from more than $10 billion to $40 billion depending on the system and the extent of inflow reductions.
In addition to shear size and cost factors, the exchange of water with the Gulf or Ocean has other problems. For example, exotic species from the Sea could be introduced into the Gulf and vise versa. It is also possible that bacteria that create red tides in the ocean could be imported that would cause large fish mortality incidents in the Salton Sea. In addition, there would be a number of logistical and international issues that would need to be addressed related to construction in a channel in Mexico to the Gulf of California. Therefore, for the reasons discussed above, pump-in/pump-out systems are impractical. If pump-in/pump-out systems are impractical, would simple pump-out systems work?

Salton Sea Restoration: Preferred Project Report
32
4.2 Would pump-out only systems work? The next question to be answered with respect to salt removal and disposal is: would systems that rely only on pumping salty water out of the Sea work without any pump-in features? A variety of pump-out systems have been investigated. The main problem associated with any of these systems would be size. Under historical inflow conditions, a pump-out system would need to be sized to remove about 5 million tons of salt each year to stabilize and gradually reduce salinity. For the assumed inflow conditions under the QSA, the systems would need to remove 10 to 15 million tons per year or more during the transitional period when the Sea is shrinking. During at least part of the transition period, it is likely that salinities would be too high to support the current fish population; therefore, the fishery would need to be re-established in the future. Eventually, after about 20 to 25 years, operation of any of the systems could be reduced to remove 4 to 5 million tons per year for long term maintenance of lower salinities. Removal of large quantities of salt water would further reduce elevations of the Sea below what would occur with transfers only. The Sea would drop in elevation to about 25 feet lower than its current level.
Some specific features of the various pump-out approaches are discussed below.
On-Land Solar Ponds or Solar Ponds with EES—The primary drawback to using on-land solar evaporation ponds would be the large areas of land that would be needed. It is estimated that the size of a multiple-pond system that could effectively manage salinity in the Sea is on the order of 60 square miles. This large an area presents unique challenges from acquisition and land ownership issues to the high cost of maintenance, volume of water displaced from the Sea and impacts to the fishery. The use of on-land solar evaporation ponds is estimated at around $1 billion. Enhanced evaporation systems (EES) could be added to reduce the land area required. These systems use spray techniques to enhance natural solar evaporation. Interior (2003) estimated that with about 1,000 or more ground-based spray units operating constantly, the area required for evaporation and disposal of salts would be reduced to about 20 square miles. However, there would be significant added cost as well as high on-going operating and energy costs. The cost to construct, operate, and maintain this system for 30 years, expressed as a present value, is estimated at between $1.7 and $1.9 billion for the assumed inflow conditions under the QSA.
Pump-Out to the Gulf of California, Pacific Ocean, or a Dry Lakebed—Pipelines to far-away locations would avoid the in-basin land area requirements that would be associated with solar ponds and their disposal areas. Functionally, they would affect the Sea in a manner similar to solar pond systems in that they would create an artificial outlet for the Sea and thereby remove salty water. The capacity of a one-way pipeline would be about one-tenth that required by the export component of a pump-in/pump-out system. This is because the large volumes of water needed

Chapter 4: Logical Process for Screening Alternatives
33
Figure 4-1. Logical Process for Screening Salton Sea Restoration Alternatives (Part 1 of 2).
Pump In/Pump Out?
Pipelines or Channels to Gulf or Ocean
o With reduced inflows, ocean exchange systems become extremely large
o Price tags in excess of $10B o Environmental concerns at
discharge point in Gulf or Ocean: may create dead zone
o Invasive species issues at both sides
o Possible red tides in Salton Sea o International issues
Pump-in/pump-out systems: extremely expensive with serious problems How about one-way pump out?
Pump Out Only?
On-Land Solar Ponds or EES o With reduced inflows, on-land
systems become extremely large – 60+ sq mi
o EES would need 1,000+ units with expensive O&M
o Salt disposal would occupy ~10 sq mi
Pump-out solutions not effective Better to keep water and salt within Sea
Pump to Gulf/Ocean/Dry Lakes o High cost of pumping to remote
locations o Environmental concerns at
discharge points o No return flows to provide
replacement water
All Pump-Out Systems o The Sea would drop about 25 ft o Fishery lost for 15-20 yrs
Desalination/Sell Water o With reduced inflows,
desalting systems become large and expensive
o Extensive pre-treatment systems would be needed
o Annual OMER would be high
Desalination/Return Water to Sea o Water return keeps systems somewhat
smaller than with sale of product water, but still large and expensive
o Price tags exceed $1B o Annual OMER would be high
In-Sea or Return Systems?
In-Sea Solar Pond Systems o With reduced inflows, in-Sea pond
systems become extremely large o In-Sea construction costly, but ponds
stranded as Sea recedes o Price tags in excess of $2B o Without very robust design, large ponds
could fail during earthquake
Neither pump-out nor in-Sea or return systems work well without replacement water
Either System o Sea would drop 15-20 feet because of transfer o Fishery lost for 10-15 yrs
Replacement water?
Colorado R. Flood Flows, CASI, Brackish Groundwater
o Make-up water not readily available o Significant uncertainty on extent,
availability, and frequency of flood flows
o Brackish groundwater supplies limited o Brackish groundwater supplies are not
sustainable o Uncertainty/low/volume/quality of
brine from CASI
Fallowing o Institutional barriers to
implementation o Cumulative economic impacts o High degree of uncertainty to
implement
Replacement water not readily available in sufficient quantities – need smaller lake
[Continues on next page]

Salton Sea Restoration: Preferred Project Report
34
Multiple dikes to create smaller marine lake?
Multiple Dike Systems o With dike lengths of 30 to 40
miles, cost likely to exceed reasonable funding resources (over $2 billion)
o Latest geotechnical data suggests potential problems with building dikes from dredge fill
o Large areas of sediments exposed (>100 sq mi)
Problems with multiple dikes Simplify dike configuration
Create Smaller Brackish Water Lake(s)?
Pacific Institute Proposal o 100+ sq mi of exposed sediments o Technical/cost issues with 30+ mi. of dikes
US Filter Proposal o Up to 200 sq mi of exposed sediments o Technical/cost issues with 95 mi of dikes
Problems with brackish systems Better to maintain marine lake
Either Proposal o Negative effects from creation of brackish water habitat o Harmful selenium concentrations in impoundments o Sediment/turbidity problems o Do not preserve or enhance existing fishery o Lost recreational and economic development potential o Large hypersaline residual Sea
Figure 4-1. Logical Process for Screening Salton Sea Restoration Alternatives (Part 2 of 2).
Central Dike o Total dike length 8.5 mi or less o Less costly than other dike
concepts o Cost can be reduced with lower
lake level o Allows partitioning of the Sea to
preserve deep marine habitat
Single dike to create smaller marine lake?
Central dike most efficient
[Continues from previous page]
Chapter 4: Logical Process for Screening Alternatives
35
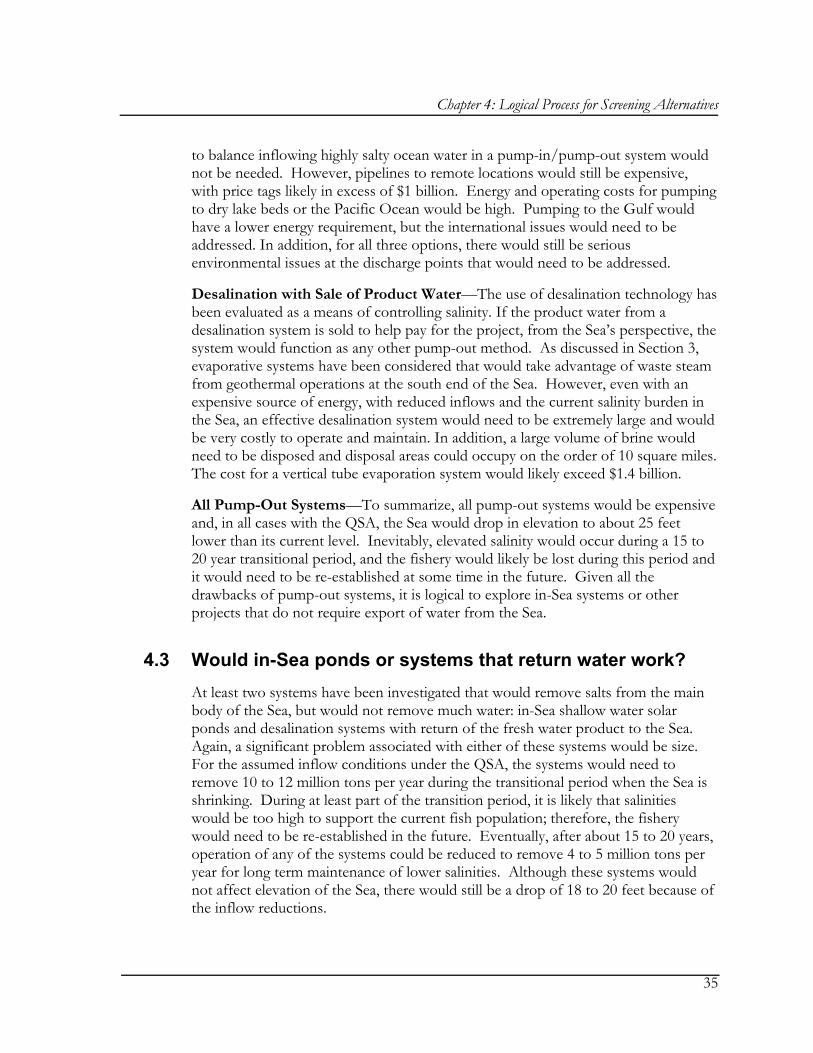
to balance inflowing highly salty ocean water in a pump-in/pump-out system would not be needed. However, pipelines to remote locations would still be expensive, with price tags likely in excess of $1 billion. Energy and operating costs for pumping to dry lake beds or the Pacific Ocean would be high. Pumping to the Gulf would have a lower energy requirement, but the international issues would need to be addressed. In addition, for all three options, there would still be serious environmental issues at the discharge points that would need to be addressed.
Desalination with Sale of Product Water—The use of desalination technology has been evaluated as a means of controlling salinity. If the product water from a desalination system is sold to help pay for the project, from the Sea’s perspective, the system would function as any other pump-out method. As discussed in Section 3, evaporative systems have been considered that would take advantage of waste steam from geothermal operations at the south end of the Sea. However, even with an expensive source of energy, with reduced inflows and the current salinity burden in the Sea, an effective desalination system would need to be extremely large and would be very costly to operate and maintain. In addition, a large volume of brine would need to be disposed and disposal areas could occupy on the order of 10 square miles. The cost for a vertical tube evaporation system would likely exceed $1.4 billion.
All Pump-Out Systems—To summarize, all pump-out systems would be expensive and, in all cases with the QSA, the Sea would drop in elevation to about 25 feet lower than its current level. Inevitably, elevated salinity would occur during a 15 to 20 year transitional period, and the fishery would likely be lost during this period and it would need to be re-established at some time in the future. Given all the drawbacks of pump-out systems, it is logical to explore in-Sea systems or other projects that do not require export of water from the Sea.
4.3 Would in-Sea ponds or systems that return water work? At least two systems have been investigated that would remove salts from the main body of the Sea, but would not remove much water: in-Sea shallow water solar ponds and desalination systems with return of the fresh water product to the Sea. Again, a significant problem associated with either of these systems would be size. For the assumed inflow conditions under the QSA, the systems would need to remove 10 to 12 million tons per year during the transitional period when the Sea is shrinking. During at least part of the transition period, it is likely that salinities would be too high to support the current fish population; therefore, the fishery would need to be re-established in the future. Eventually, after about 15 to 20 years, operation of any of the systems could be reduced to remove 4 to 5 million tons per year for long term maintenance of lower salinities. Although these systems would not affect elevation of the Sea, there would still be a drop of 18 to 20 feet because of the inflow reductions.

Salton Sea Restoration: Preferred Project Report
36
Features of the various pump-out approaches are discussed in the following paragraphs.
In-Sea Solar Pond Systems—Due to reduced inflows, in-Sea pond systems would need to occupy around 55 square miles within the Sea. Since in-Sea ponds would reduce the surface area of the main body of the Sea, the water removed would be balanced by a reduction in the evaporative from the main Sea and there would be no effect on elevation. However, as discussed earlier, a drawback to in-Sea ponds is that the ponds would be stranded away from the Sea as it recedes under reduced inflow conditions thus requiring pumping or relocation of the ponds. The surface area reduction benefit of constructing in-Sea would be eliminated and continued operation of the pond system would tend to further reduce the elevation of the Sea in that water would need to be pumped out of the Sea and into the pond system. Cost to implement this approach has been estimated at over $2 billion. The added cost of relocating ponds as the Sea recedes has not been considered in this estimate.
Desalination with Return of Product Water to Sea—If the product water from a desalination system is returned to the Sea, salt could be removed without removing much water and the system would have little effect on the Sea’s water surface elevation. The system could be perhaps 10 to 15 percent smaller than a system where the product water would be sold because the return water would provide some dilution effect. However, the system would still be large and nearly as expensive as where product water would be sold as discussed above and in this case there would be no sale of water to offset the cost. If brine from the process were disposed in in-Sea ponds, there would be no effect on elevation. However, again the Sea would drop because of inflow reductions.
Either System—Either in-Sea solar ponds or desalination systems would be effective under historical inflow conditions. In addition, they could be designed at about 1/3 the size required with QSA inflows at about 1/3 the cost. Therefore, they could be effective if replacement water were available to make-up for inflow reductions from the QSA transfers and other factors that may reduce inflow. Nearly 400,000 acre-feet/year would be needed. Is replacement water available?
4.4 Would pump-out or in-Sea systems work with replacement water? If a reliable source of water to replace the volume that will be transferred could be identified, then restoration planning could be simplified. The potential sources of replacement water are described below.
Colorado River Flood Flows, CASI or Brawley Desalting Proposals, Brackish Groundwater—The use of Colorado River flood flows has been identified as a potential source of replacement water. Several limitations to this being a feasible solution include the highly uncertain nature of volume or frequency of flood flows in

Chapter 4: Logical Process for Screening Alternatives
37
excess of currently allocated water on the Lower Colorado River and whether these flows could be made available to the Sea over the long term. The use of flood flows for habitat enhancement along the Lower Colorado River is currently under consideration and this use may supercede uses for the Salton Sea.
The use of brine reject streams from the proposed CASI system and the City of Brawley proposal for a desalting plant on the Colorado River Aqueduct have been considered in the past as a possible future source of water. The project is in the planning stages and may not come on-line for another 10 to 20 years. Uncertainties associated with this potential source removed it from consideration. The Brawley proposal could supply 60,000 acre-feet/year at about 10,000 mg/L, but its implementation is also uncertain and this quantity of water would not compensate for the projected flow reductions.
There is currently a study underway by Lawrence Livermore National Laboratory to evaluate the potential to use groundwater from the Imperial Valley Watershed as replacement water for the Salton Sea. However, based on currently available information, it is believed that this source of water could provide about 50,000 acre-feet/year for about 10 years, and would not be sustainable over the long-term. Thus, while this water could be helpful for restoration efforts, this source of replacement water would not be a viable means of making some of the above mentioned technologies more feasible.
Fallowing—Fallowing of farmland currently under production has been considered as a source of replacement water. Under this scenario, farmland that is currently under production would be taken out of production and the water normally used to irrigate the crops could be used as replacement water for the Salton Sea. This approach is expected to be used until on-farm conservation techniques are developed to such a degree as to achieve efficiencies approaching total land fallowing. Unfortunately, over the long term this approach has significant social and political challenges due to the resistance of local farmers to fallow even more land than is currently envisioned under the QSA. Large blocks of land would need to be taken out of production and would result in a loss of jobs and other socioeconomic impacts. It is highly unlikely given current conditions within the Imperial Valley that this approach could be implemented with certainty.
General Availability of Replacement Water—It does not appear that replacement water is available in sufficient quantities to make up for inflow reductions. Therefore, since the available methods discussed above do not work well with reduced inflows, it is necessary to consider ways to create a smaller lake.

Salton Sea Restoration: Preferred Project Report
38
4.5 Would it make sense to create one or more smaller brackish water lakes? Two approaches to developing a smaller brackish water lake or lakes have been proposed…the Pacific Institute and US Filter concepts. While novel concepts, these proposals have significant drawbacks due to the reliance on brackish water systems as the primary habitat to sustain the ecosystem of the Sea, the negative effects of such a habitat in an arid desert environment, and the lost recreational and economic benefits from a large hyper-saline Sea. The US Filter concept first introduced the idea of desalinating water flowing into the Sea and to make this water available for transfer to other water users. The desalination concept is attractive because it creates a revenue stream that could be applied to restoration costs and could be incorporated into other restoration concepts. The Pacific Institute and US Filter concepts are discussed below.
Pacific Institute Proposal—The Pacific Institute proposal relies on creating brackish water impoundments at the north and south end of the Sea to utilize inflows from the main sources of water to the Sea (i.e., New, Alamo, and Whitewater Rivers). A group of more than a dozen scientist and engineers convened by the Salton Sea Science Office to review this proposal identified many serious concerns. The main body of the Sea would continue to increase in salinity eventually becoming hyper-saline and devoid of a viable fishery. This would result in loss of recreational opportunities for the vast majority of the Sea and would likely preclude economic development in communities surrounding the Sea. The impoundment of inflows to the Sea would create a brackish water habitat that would result in increased abundance of biting insects, parasites and pathogens, and an environment for selenium to concentrate at levels harmful to wildlife and humans. This would also significantly impact the sustainability and diversity of the fishery in the Sea. The resulting brackish water fishery would not resemble the current one and fish in the impoundments could pose health risks to humans and wildlife due to elevated selenium levels. Recent cost estimates are that this proposal would cost on the order of $1.2 billion.
US Filter Proposal—As with the Pacific Institute proposal, the US Filter proposal would create a large brackish water environment; however, the US Filter proposal would create this habitat around the entire periphery of the Sea. The Authority commissioned a technical review of this proposal that was conducted in association with the Salton Sea Science Office and a Citizens Advisory Group. The technical review identified many of the same concerns related to the ecosystem, recreation, and the local economy that surfaced during the review of the Pacific Institute Proposal.
The shallow brackish habitat would exacerbate the problems related to fish, bird, and human diseases associated with water borne parasites, contaminants, and mosquitoes. Because the brackish water ring around the Sea would be the primary habitat, the current food web would change to a fresh water web with algae as the

Chapter 4: Logical Process for Screening Alternatives
39
major food base. Extensive growth of vegetation would occur along the shoreline. Temperature ranges in the brackish water ring would be similar to the inflowing rivers, but more extreme than the current Sea. The average water depth in the brackish water ring would be on the order of 5 feet. There would be a loss of recreational and economic development potential due to the loss of the Sea as a hyper-saline water body. It has been estimated that this restoration alternative could cost between $1.9 and $2.6 billion.
Brackish Water Lakes—The brackish-water-lake concepts considered above have serious drawbacks and also would be very expensive to implement. Therefore, it is logical to explore methods to maintain a smaller marine lake.
4.6 Could multiple dike configurations be used to create a smaller marine lake? In the past, most concepts involving dikes had involved construction of dikes as a means of controlling salinity. Salty water would flow into the area surrounded by dikes and salts would concentrate through solar evaporation. In most cases, there would be no elevation difference between the main Sea and the area behind the dikes. As shown in Figure 3-6, the Salton Sea EIS/EIR (2000) also included alternatives that coupled dikes such as these with a displacement dike at the south end of the Sea. The displacement dike would be used to reduce the evaporative surface area of the Sea to help maintain elevation under reduced inflow scenarios. The area behind such a dike would be dry.
More recently, as discussed in Section 3.7, the consulting firm Black & Veatch proposed creating impoundments at various areas within the Sea to isolate and concentrate salt, thereby controlling salinity increases in the main body of the Sea. The size of the impoundments would be large, about 88,000 acres, and would require extensive dikes to contain the hyper-saline water. Because of the length of dikes required (34-51 miles) the costs associated with these dike configurations have been estimated at between $2.3 billion and $5 billion. The Black & Veatch concept also included desalination and water transfer components similar to the US Filter concept that are not included in these cost estimates. In addition, Black & Veatch assumed that the dikes could be constructed by using fill material from hydraulic dredging operations. Recent geotechnical information from the Salton Sea has shown that because of the fine material on the Sea bottom, this method may be impractical or at least more costly than previously anticipated.
In addition to high price tags and feasibility concerns, multiple dike schemes would have another drawback. They would not be sensitive to inflow reductions. A multi-billion dollar dike scheme could be designed for a certain inflow, but if the inflow was reduced in the future, additional dikes would be needed in the future to continue to stabilize elevation. Given these concerns, it is then logical to investigate a simpler

Salton Sea Restoration: Preferred Project Report
40
configuration of a single structure across the middle of the Sea, that would be at most 8.5-miles long, compared to up to 51 miles for multiple-dike configurations.
4.7 Would the use of a central dike to create a smaller lake work? Rather than creating extensive ring dikes within the Sea and the resulting high cost, a concept that bisects the Sea in half has been proposed. This concept relies on building a retention structure, barrier, or dike across the midsection of the Sea to separate hyper-saline and marine basins of the Sea from one another. The advantage of this concept is the reduction in distance needed to effectively separate these two basins. For example, if the structure is placed at the approximate midsection of the Sea where the west and east shorelines are nearest, the length of the barrier would be around 8.5 miles, and less if it is designed to work with the Sea at a lower elevation than the current situation. A major challenge to this concept is the feasibility of constructing a facility that is cost effective. The foundation conditions of the Sea have been investigated and found to be composed of a relatively thick layer of fine-grained sediments that create an engineering design challenge. However, alternative designs of a mid-Sea facility are currently underway and based on preliminary engineering evaluations it is believed that a suitable structure could be constructed at a reasonable cost.

Chapter 5: Evaluation of Reasonable Alternatives
41
Chapter 5: EVALUATION OF REASONABLE ALTERNATIVES The logical process for reviewing alternatives discussed in Chapter 4 led to the conclusion that alternatives that employ a central dike or retention structure are worthy of further investigation. This chapter addresses how the individual components could be combined into alternatives. It also provides an evaluation of those alternatives with respect to the program objectives. All of the alternatives discussed in this chapter would include a wide range of habitat and recreational features that would need to be part of a complete alternative. Chapter 6 presents these features and how they would be integrated into the preferred alternative.
5.1 Formulation of Reasonable Alternatives A smaller marine lake concept could be developed along one of two options using a central dike or retention structure: a marine lake in the north or a marine lake in the south. A logical location for dividing the Sea is an east-west orientation across central area of the lake. Here, the distance between shorelines is the least and the water depth is 5 to 8 feet shallower than deepest portions of the north and south basins. The features and benefits of south and north marine lake concepts based on a dividing structure at this location are described briefly below. There is also a choice about whether or not to control elevation.
South marine lake—A marine lake in the south would have a maximum area on the order of 200 square miles and require an inflow of 980,000 acre feet per year to sustain it at current elevation (about -227 feet msl). The area would be smaller if the lake was to be maintained at a lower elevation. A southern marine lake would be consistent with current wildlife refuge boundaries. The southern marine lake would also take advantage of inflows from the New and Alamo Rivers such that rerouting or transporting these flows would not be necessary. Concentrations of selenium and other contaminants in the sediments are highest in the northern half of the Sea. Allowing portions of this basin to recede would expose the sediments creating the potential for human health and wildlife impacts.
North marine lake—A marine lake in the northern portion of the Sea would be on the order of 140 square miles and require an inflow of around 800,000 acre feet per year. A marine lake in the north would reduce the concern over selenium sediment effects by effectively capping the sediments with the marine lake. There are also established communities in the northern portion of the Sea such as Desert Shores, Salton City, and North Shore that would benefit from a restored Sea. These communities would likely experience renewed economic development such as commercial, recreational, and residential developments. The Torres Martinez Tribe would also benefit from a restored Sea and could implement various economic and natural resource projects. The exposure of the shoreline in the south would allow

Salton Sea Restoration: Preferred Project Report
42
geothermal exploration and development of the known geothermal resources in this area.
Elevation control—The next issue to be addressed is whether or not to control the water elevation in the marine lake, and if so, what approach to use. A barrier could be used with no elevation control. A retention structure could be used that maintains elevation at current levels. Or, a retention structure could be used that takes advantage of a reduced water surface level.
Given the above considerations, four alternative configurations have been identified for evaluation:
• South Marine Lake without Elevation Control—The simplest configuration would be to construct a central barrier and allow the New and Alamo rivers to flow into the south basin and create a marine lake with hyper-saline conditions in the north.
• South Marine Lake with Elevation Control—This configuration would be similar to the previous alternative, except that the central barrier would need to be taller and more robust to impound water in the south and create a higher water surface than in the north.
• North Marine Lake with Elevation Control— This concept would be similar to the previous alternative with the north-south configuration reversed. In this case, the New and Alamo rivers would need to be extended to the north to provide freshwater inflows to control salinity in the north basin.
• No Marine Lake—This alternative is considered in case a mid-Sea barrier or impoundment structure proves to be infeasible or too costly. It would include wetland and habitat restoration elements to achieve as many objectives as possible without maintaining a large lake with a marine fishery.
South Marine Lake Without Elevation Control: Example Configuration As an example, a preliminary configuration for the first alternative listed above is illustrated in Figure 5-1 and discussed here. This alternative would involve construction of a low barrier across the middle of the Sea, thus creating two distinct bodies of water. The South portion of the Sea could be maintained at ocean-like salinities (35,000 mg/L), as it would be fed directly from the New and Alamo Rivers. The north portion of the Sea would become hyper-saline. Precise salinity levels could be maintained in the south by allowing some backflow of hyper-saline water from the north. There would be minimum elevation difference between the two bodies of water, but their habitat characteristics would be different.

Chapter 5: Evaluation of Reasonable Alternatives
43
Figure 5-1. Possible Configuration for the South Lake without Elevation Control.

Salton Sea Restoration: Preferred Project Report
44
There would be several kinds of constructed habitats associated with this alternative. The canal on the east side of the Sea would deliver water to saltgrass and waterfowl habitats, and would also supply a recreational pool at Bombay Beach. The canal on the west side, which would consist of fresh water blended with Sea water pumped from the South portion of the Sea, would supply additional saltgrass and waterfowl habitat areas. It would also provide water for a recreational pool at Salton City. The west canal could double as pupfish connectivity habitat as well. Additional flooded saltgrass stands would be present at the north, provided with water blended from the west transmission canal and water from the Whitewater River. Saline waterfowl habitat at the north end would be supplied from the same blended water, arriving in the canals from both the east and the west. The outflow from all habitat types would be used to create solar salt concentrators and crystallizers downslope of the saline habitats.
This example alternative includes freshwater habitat in the forebays only, with short lengths of freshwater canals. There would be at least three pump stations required. One would be north of the Alamo River to supply the canals flowing north to Bombay Beach and south to the saltgrass and waterfowl habitats. A blending station would be required at both the New and Alamo Rivers to blend saline and river waters for the canals. Another pump would be at Niland, to augment flows to the north end of the Sea. The third would be near Salton City, to provide additional water to the canal and recreational pool on the west shore. A low mid-Sea barrier would also be required.
Similar examples can be developed for the other alternatives. Examples of how habitat areas could be developed for other alternatives are provided in Appendix A to be supplied.

Chapter 5: Evaluation of Reasonable Alternatives
45
5.2 Evaluation of Reasonable Alternatives
The four reasonable alternatives discussed above were evaluated against the current program objectives presented in Chapter 1. For each objective, the alternatives were ranked on the basis of best judgment as to how they would perform under inflows that would be expected with the QSA in place. Finally, an overall composite ranking was developed. Each of the objectives and the rankings are discussed below. As discussed in Chapter 1, the current objectives were derived from the goals identified in the Salton Sea Reclamation Act of 1998 as shown in Table 1-1 of Chapter 1.
Preserve the Sea as a Repository for Agricultural Runoff The continued use of the Salton Sea as a repository for agricultural drainage is a fundamental component of the Salton Sea Restoration Project. All alternatives would preserve the Sea as an agricultural drainage repository. All alternatives are considered equal with respect to this objective, and therefore, all have been assigned a ranking of 1.
Provide Large Marine Lake with Stable Elevation The South Marine Lake with Elevation Control is ranked slightly higher than the North Lake with Elevation Control because it would be 42 square miles larger. Elevation stability would be essentially the same for those two alternatives as the elevation control afforded by a mid-Sea barrier and other facilities would allow for management of Sea surface levels. Conversely, the South Marine Lake without Elevation Control is ranked third because of the lack of the ability to manage Sea surface level. The No Marine Lake scenario scores fourth because it would not meet either of the objectives of a large marine lake or provide any mechanism for stabilizing elevation.
Improve Water Quality: Salinity With the exception of the No Marine Lake scenario, all of the remaining alternatives perform equally well with respect to salinity control. The South Marine Lake without Elevation Control achieves salinity control through the use of a permeable barrier that distributes higher saline water to the northern basin while taking advantage of the relatively fresh water entering the Sea through the New and Alamo Rivers. The South Marine Lake with Elevation Control and North Lake with Elevation Control
3 1 2 4
1 1 1 4
Restoration Alternative
Sou
th M
arin
e La
kew
o El
evat
ion
Con
trol
Sou
th M
arin
e La
kew
Ele
vatio
n C
ontro
l
Nor
th M
arin
e La
kew
Ele
vatio
n C
ontro
l
No
Mar
ine
Lake
1 1 1 1
Salton Sea Restoration: Preferred Project Report
46
likewise control salinity through the use of a mid-Sea barrier that uses either a north or south saline basin as a repository for salinity control.
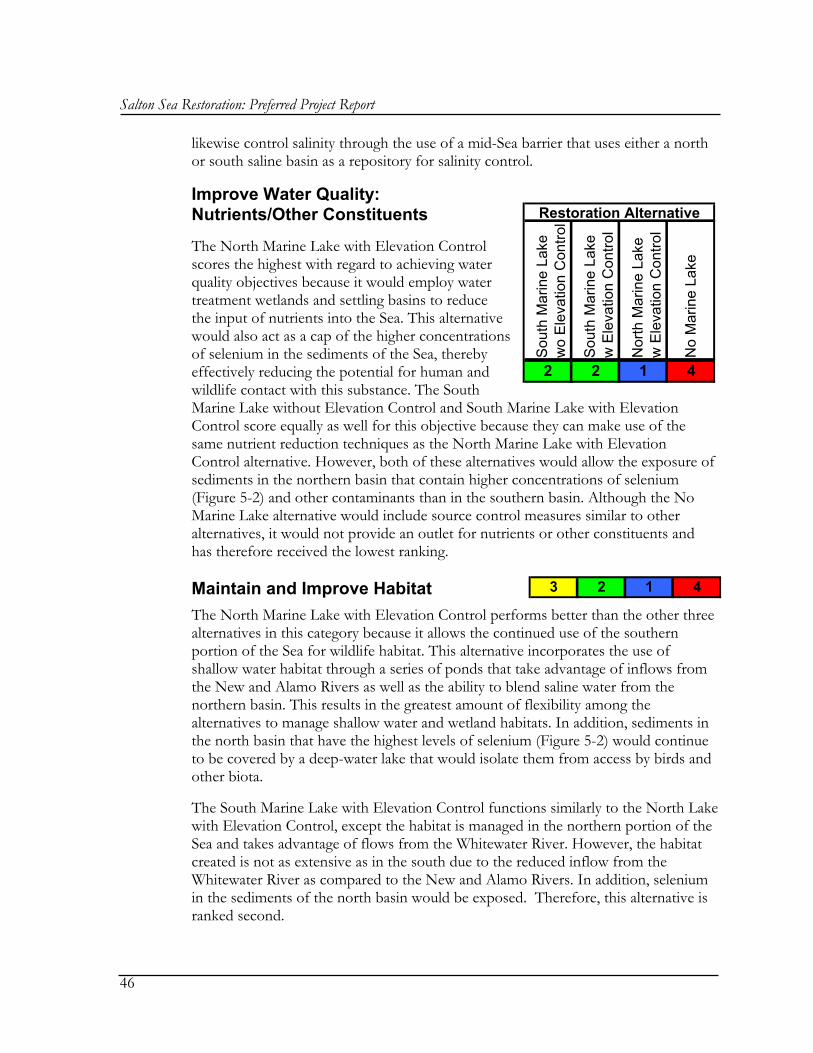
Improve Water Quality: Nutrients/Other Constituents
The North Marine Lake with Elevation Control scores the highest with regard to achieving water quality objectives because it would employ water treatment wetlands and settling basins to reduce the input of nutrients into the Sea. This alternative would also act as a cap of the higher concentrations of selenium in the sediments of the Sea, thereby effectively reducing the potential for human and wildlife contact with this substance. The South Marine Lake without Elevation Control and South Marine Lake with Elevation Control score equally as well for this objective because they can make use of the same nutrient reduction techniques as the North Marine Lake with Elevation Control alternative. However, both of these alternatives would allow the exposure of sediments in the northern basin that contain higher concentrations of selenium (Figure 5-2) and other contaminants than in the southern basin. Although the No Marine Lake alternative would include source control measures similar to other alternatives, it would not provide an outlet for nutrients or other constituents and has therefore received the lowest ranking.
Maintain and Improve Habitat The North Marine Lake with Elevation Control performs better than the other three alternatives in this category because it allows the continued use of the southern portion of the Sea for wildlife habitat. This alternative incorporates the use of shallow water habitat through a series of ponds that take advantage of inflows from the New and Alamo Rivers as well as the ability to blend saline water from the northern basin. This results in the greatest amount of flexibility among the alternatives to manage shallow water and wetland habitats. In addition, sediments in the north basin that have the highest levels of selenium (Figure 5-2) would continue to be covered by a deep-water lake that would isolate them from access by birds and other biota.
The South Marine Lake with Elevation Control functions similarly to the North Lake with Elevation Control, except the habitat is managed in the northern portion of the Sea and takes advantage of flows from the Whitewater River. However, the habitat created is not as extensive as in the south due to the reduced inflow from the Whitewater River as compared to the New and Alamo Rivers. In addition, selenium in the sediments of the north basin would be exposed. Therefore, this alternative is ranked second.
Restoration Alternative
Sou
th M
arin
e La
kew
o E
leva
tion
Con
trol
Sou
th M
arin
e La
kew
Ele
vatio
n C
ontro
l
Nor
th M
arin
e La
kew
Ele
vatio
n C
ontro
l
No
Mar
ine
Lake
2 2 1 4
3 2 1 4

Chapter 5: Evaluation of Reasonable Alternatives
47
The South Lake without Elevation Control is ranked third. Without a head differential between basins, it would not be possible to use gravity flow from the marine lake to fill shallow water saline habitat areas. In addition, with an elevation drop of about 20 feet, sediments with higher selenium levels would be exposed around the perimeter of the north basin.
The No Marine Lake alternative is the worst performing alternative for this objective because the salinity in the Sea would reach a level where the fishery would be unsustainable resulting in the loss of a food source for fish-eating birds and no shallow-water shoreline habitat with any functional value.
8.5
6.7
5.8
5.0
5.0
8.58.5
6.76.7
5.85.8
5.05.0
5.05.0
Figure 5-2. Selenium Levels in Salton Sea Sediments.

Salton Sea Restoration: Preferred Project Report
48
Time to Achieve Water Quality and Habitat Objectives The South Marine Lake with Elevation Control is ranked slightly higher than the North Lake with Elevation Control because with direct flows into the south lake, it is estimated that water quality objectives could be achieved earlier upon closure of the lake. This conclusion is based on the assumption that the same design elevation is included for either alternative. The South Marine Lake without Elevation Control is ranked third because it is assumed that the central barrier would not be completed until a nearly stable elevation is achieved, which could be twenty or more years in the future. The No Marine Lake scenario scores fourth because it would not achieve water quality and habitat objectives.
Respond to Inflow Changes The No Marine Lake alternative would perform the best for this objective because inflow would have relatively no affect on the hyper-saline lake, there would be little if any recreational uses, and no structures would be affected. The South Marine Lake without Elevation Control is the next best performing alternative because elevation would be the same in the two basins and could fluctuate depending on inflow scenarios with relatively little impact on the structures associated with this alternative. The North Lake with Elevation Control is ranked third because inflows would impact the water available for dust control and shallow water habitat development and management. The South Marine Lake with Elevation Control is ranked last because of the larger size of the marine lake in the south than for the North Lake alternative. Less inflow, therefore, would have a greater impact on the functioning of this alternative.
Increase Recreational and Economic Potential The North Marine Lake with Elevation Control scores highest for this objective due to the improvement to recreational opportunities that would be available to the communities surrounding the northern basin. Marinas and other boating facilities in and around Salton City, Bombay Beach, Desert Shores, and North Shore would experience a renaissance due to the improved water quality and shoreline stabilization of this alternative. Additionally, these communities could experience significant economic development potential due to the linkage to the rapidly expanding southern Coachella Valley communities. As an added benefit, additional geothermal resources could be exploited in the southern portion of the Sea due to the exposure of areas of known geothermal potential adjacent to existing developed geothermal areas. Farmland in the south could also be reclaimed under this alternative.
3 2 1 4
2 4 3 1
Restoration Alternative
Sou
th M
arin
e La
kew
o E
leva
tion
Con
trol
Sou
th M
arin
e La
kew
Ele
vatio
n C
ontro
l
Nor
th M
arin
e La
kew
Ele
vatio
n C
ontro
l
No
Mar
ine
Lake
3 1 2 4

Chapter 5: Evaluation of Reasonable Alternatives
49
The South Marine Lake with Elevation Control alternative, ranked second, would provide for increased recreational opportunities due to the improvement to the water quality and stabilization of the shoreline. Recreation associated with the Sonny Bono Wildlife Refuge and Imperial Wildlife Area would be improved as well as duck hunting that occurs in this area. However, existing marinas and other boating facilities are not as prevalent in the southern portion of the Sea as in the north and these recreational opportunities would not benefit as much as with the North Lake with Elevation Control.
The South Lake without Elevation Control, ranked third, would not perform as well as the two previously discussed alternatives because the northern basin would be saline and would not support a viable fishery or be attractive for recreational uses. However, the southern portion of the Sea could experience similar recreational benefits as the South Marine Lake with Elevation Control alternative.
The No Marine Lake alternative would not achieve these objectives because the Sea would eventually become hyper-saline and would not support a viable fishery or fish-eating bird populations. There would be little if any incentive to use the Sea for recreational purposes if this alternative is implemented.
Address Air Quality (PM10) Concerns The South Lake with Elevation Control and North Lake with Elevation Control alternatives both score the highest for this objective. This is due to the ability to distribute saline or brackish water over exposed areas in the north and south basins, respectively. Conveyance canals incorporated into these alternatives would allow for gravity flow of water from the higher elevation marine lake over large areas that would not be inundated by a marine lake. These alternatives also allow the creation of salt crust over the exposed sediments thereby reducing the likelihood of fine-grained sediments being exposed to wind dispersion. This would reduce or eliminate exposed sediments that could provide a source of fine particulate matter and become windborne during high wind conditions. The South Marine Lake without Elevation Control and No Marine Lake both perform poorly against this objective because of the lack of flexibility to disperse water over large areas of exposed Sea sediments. This is due in part to the higher elevation of the exposed sediments relative to the reduced elevation of the Sea for these alternatives making distribution of water over these areas more difficult. For these alternatives, salt water or brine would have to be pumped to higher elevation to provide a mechanism to create salt crusts over the exposed sediments.
Restoration Alternative
Sou
th M
arin
e La
kew
o E
leva
tion
Con
trol
Sou
th M
arin
e La
kew
Ele
vatio
n C
ontro
l
Nor
th M
arin
e La
kew
Ele
vatio
n C
ontro
l
No
Mar
ine
Lake
3 1 1 3

Salton Sea Restoration: Preferred Project Report
50
Provide High Safety Rating/Low Risk of Failure The No Marine Lake alternative performs best against this objective because there is no structure that has the potential to fail during a seismic event. The South Marine Lake without Elevation Control alternative is the next best performing alternative because water elevation in the two basins is maintained at the same level. Consequently, even under catastrophic failure conditions where the barrier is breached, no change to shoreline water elevations would occur. The South Marine Lake with Elevation Control and North Lake with Elevation Control both perform equally for this objective. In the event of catastrophic failure of the impoundment structure, the water behind the barrier would flow into the opposite basin until equilibrium is reached. If recreational users or others are in the vicinity of the basin being inundated they could become flooded by the flow of water emanating from the upstream basin. Thus, even though there is a low risk of failure of the impoundment structure for these alternatives, the potential outcome is such that these alternatives score last compared to the other two.
Overcome Institutional Barriers/Public Acceptance The North Lake with Elevation Control alternative is ranked first for this objective due to a number of factors that make it superior to the others under consideration. For example, this alternative has the support of many local influential community organizations as well as local government agencies. The local Congressional Representative also has endorsed this concept. Additionally, there are many features of this alternative such as the economic and recreational development potential that provide an added benefit to the local community, thereby increasing the acceptability and support from the community for the alternative. The South Lake with Elevation Control is the next best performing alternative because it includes many of the elements of the North Lake alternative. However, it does not afford the economic and recreational benefits in the northern portion of the Sea where these benefits would likely be more advantageous to economic growth. The South Marine Lake without Elevation Control is the next best performing alternative and has similar characteristics compared to the South Lake with Elevation Control except that the northern basin is a hyper-saline lake that would not afford much if any benefit for economic or recreational purposes. The No Marine Lake alternative is the worst performing alternative because it results in a large hyper-saline lake with little if any ecologic, economic, or recreational potential. It is highly unlikely that the local community, regional, state, or federal agencies would support this alternative.
Restoration Alternative
Sou
th M
arin
e La
kew
o E
leva
tion
Con
trol
Sou
th M
arin
e La
kew
Ele
vatio
n C
ontro
l
Nor
th M
arin
e La
kew
Ele
vatio
n C
ontro
l
No
Mar
ine
Lake
2 3 3 1
3 2 1 4

Chapter 5: Evaluation of Reasonable Alternatives
51
Reasonable Cost/High Probability of Financing The No Marine Lake has the lowest cost to construct and maintain of the four alternatives under consideration. Although the North Lake with Elevation Control alternative is the most costly to build and maintain, there is a higher likelihood of this alternative being financed due to the significantly greater benefits that would occur. Government and private financing would be more likely for this alternative because there is a higher degree of public support and the potential for economic development greater than for the other alternatives under consideration. In addition, the Authority is investigating creating an Infrastructure Finance District or similar means to generate tax revenue to assist with financing of the project. The South Marine Lake without Elevation Control is the next best ranked alternative because of the slightly lower cost involved in constructing and maintaining the Sea. However, the economic benefits are lower and consequently financing likelihood lower as well. The South Lake with Elevation Control alternative is the least likely to receive favorable financing because the cost to build and maintain it would be similar to the North Lake alternative but with significantly fewer economic benefits.
5.3 Evaluation Summary The ranking of restoration alternatives carried out in this study is summarized in Table 5-1. Table 5-1 also shows: (1) an average ranking score calculated by taking a simple average of the rank values for each of the objectives; (2) the number of top rankings; (3) the number of lowest rankings; and (4) the overall average ranking based on the three previous statistics. Figure 5-3 illustrates the number of highest rankings for each alternative. Figure 5-4 illustrates the number of lowest rankings for each alternative. Figure 5-5 illustrates the overall ranking of the three alternatives.
Based on the data presented here, the North Lake with Elevation Control alternative received the top ranking and is recommended for consideration as the preferred restoration strategy for the Salton Sea.
3 4 2 1
Restoration Alternative
Sou
th M
arin
e La
kew
o E
leva
tion
Con
trol
Sou
th M
arin
e La
kew
Ele
vatio
n C
ontro
l
Nor
th M
arin
e La
kew
Ele
vatio
n C
ontro
l
No
Mar
ine
Lake

Salton Sea Restoration: Preferred Project Report
52
Objectives
Project Objectives Used in this Report ⇓ Sou
th M
arin
e La
ke
wo
Ele
vatio
n C
ontro
l
Sou
th M
arin
e La
ke
w E
leva
tion
Con
trol
Nor
th M
arin
e La
ke w
E
leva
tion
Con
trol
No
Mar
ine
Lake
Preserve Sea as Repository for Agricultural Runoff 1 1 1 1Provide Large Marine Lake with Stable Elevation 3 1 2 4Improve Water Quality: Salinity 1 1 1 4Improve Water Quality: Nutrients/Other Constituents 2 2 1 4Maintain and Improve Habitat 3 2 1 4Time to Achieve Water Quality and Habitat Objectives 3 1 2 4Respond to Inflow Changes 2 4 3 1Increase Recreational and Economic Potential 3 2 1 4Address Air Quality (PM10) Concerns 3 1 1 3Provide High Safety Rating/Low Risk of Failure 2 3 3 1Overcome Institutional Barriers/Public Acceptance 3 2 1 4Reasonable Cost/High Probability of Financing 3 4 2 1Average Score 2.4 2.0 1.6 2.9Number of Top Rankings 2 5 7 4Number of Lowest Rankings 1 3 1 8Overall Ranking 3 2 1 4
Restoration Alternative
Number of Highest Rankings
2
5
7
4
South Marine Lake woElevation Control
South Marine Lake wElevation Control
North Marine Lake wElevation Control
No Marine Lake
Restoration Alternative
North Marine Lake with Elevation Control ranked first for 7 out of 12 objectives
Figure 5-3. Number of Highest Rankings for Each Alternative.
Table 5-1. Evaluation of Restoration Options

Chapter 5: Evaluation of Reasonable Alternatives
53
Number Lowest Rankings
1
3
1
8
South Marine Lake woElevation Control
South Marine Lake wElevation Control
North Marine Lake wElevation Control
No Marine Lake
Restoration Alternative
North Marine Lake with Elevation Control ranked last for only one objective
Overall Rankings
Fourth
Second
Third
First
South Marine Lake woElevation Control
South Marine Lake wElevation Control
North Marine Lake wElevation Control
No Marine Lake
Restoration Alternative
Figure 5-4. Number of Lowest Rankings for Each Alternative.
Figure 5-5. Overall Ranking of Alternatives.

Salton Sea Restoration: Preferred Project Report
54
This page intentionally left blank.

Chapter 6: The Preferred Project
55
Chapter 6: PREFERRED PROJECT: A VISION FOR THE FUTURE Starting with the north lake concept and adding other features, a preferred project emerges that has the potential to create outstanding opportunities for the Imperial and Coachella valleys. This vision of the future combines a healthier and more stable marine lake that has lower salinity with a variety of ecological and recreational features. It also includes measures to mitigate potential air quality degradation that may be associated with sediments exposed by declining lake levels that result from decreases in inflow.
The concept is illustrated in Figure 6-1. Features of the plan, preliminary cost estimates, lake elevations, performance, phasing of the project, and implementation of the plan are discussed in this chapter.
6.1 Features Features of the preferred project concept are discussed below.
The Main Lake The main lake (Figure 6-2) would be a marine lake with ocean-like salinity with an area of about 85,000 to 95,000 acres. It would be California’s second largest lake, behind Lake Tahoe. It would be capable of supporting a marine sport fishery that would also provide a food source for the millions of fish eating birds that use the Salton Sea as a stopover point along the Pacific Flyway. The main lake could be controlled at an elevation lower than the current elevation which would help reduce the cost of the mid-Sea causeway. Access to communities would be provided by dredging channels to local communities which would also create islands and peninsulas that would have new recreation and development opportunities.
Habitat and Recreational Features
Figure 6-1 illustrates the wide range of habitat and recreational features that could be included as part of the vision of the future for the Salton Sea ecosystem. The features of the preferred project are conceptual. Some features have been developed in more detail, such as the central causeway/retention structure.Conceptual designs for the causeway are provided in URS (2004). Many other features, such as fresh water recreational lakes and wetlands, were reviewed by anOutdoor Recreation Advisory Task Force.
The Recreational Task Force includedrepresentatives of recreational groups, cities and other organizations, primarily from the north end of the Imperial Valley. Task Force recommendations are provided in Appendix D to this report.

Salton Sea Restoration: Preferred Project Report
56
Access to Deep-Water Fishery In order to provide recreational opportunities with a smaller marine lake, access to the Sea would need to be maintained. If the elevation of the marine lake would be lower than the current Sea elevation, access could be provided by dredging to the existing seaside communities. Although not recommended, if the lake elevation is decreased significantly, dredging channels through the Sea-bottom areas exposed by lower lake levels could also create islands and peninsulas that would have additional recreational value. Access would also be enhanced by rehabilitation or expansion of existing marinas or creation of new marinas. Dredging could also create and enhance perimeter development and also could create development opportunities on Torres Martinez land (Figure 6-3).
Figure 6-2. Artistic Rendering of Lake Overlook Scenic Point.

Chapter 6: The Preferred Project
57
Figure 6-1. Preferred Alternative Concept Plan for the Salton Sea Area.

Salton Sea Restoration: Preferred Project Report
58
This page intentionally left blank.

Chapter 6: The Preferred Project
59
Water Quality A number of measures would be undertaken to address water quality concerns to ensure that water quality in the main lake is significantly improved over current conditions. These measures are as follows:
• Created wetlands and sedimentation basins—Created wetlands and sedimentation basins would be installed to help remove fine sediments and nutrients from the waters that flow into the main lake (Figure 6-4). Locations of wetland habitats and sedimentation basins include areas along the New and Alamo rivers, extensions of those rivers that may be associated with the creation of a smaller marine lake, and areas near the mouth of the Whitewater River. In addition to having benefits for water quality, created wetland areas would provide a variety of habitats for birds as well as recreational opportunities for hunting, bird watching, and possibly fishing. Wetlands could also be designed to preserve snag habitat used by wildlife in the northern and other portions of the Sea. Reducing eutrophic conditions of the Salton Sea by reducing nutrients flowing into the Sea is a central project objective. Wetlands have been built through the efforts of the Citizen Congressional Task Force on the New River in the New and Alamo river drainages to, in part, improve water quality. They improve the
Figure 6-3. Artistic Rendering Peninsula/Resort Concept.
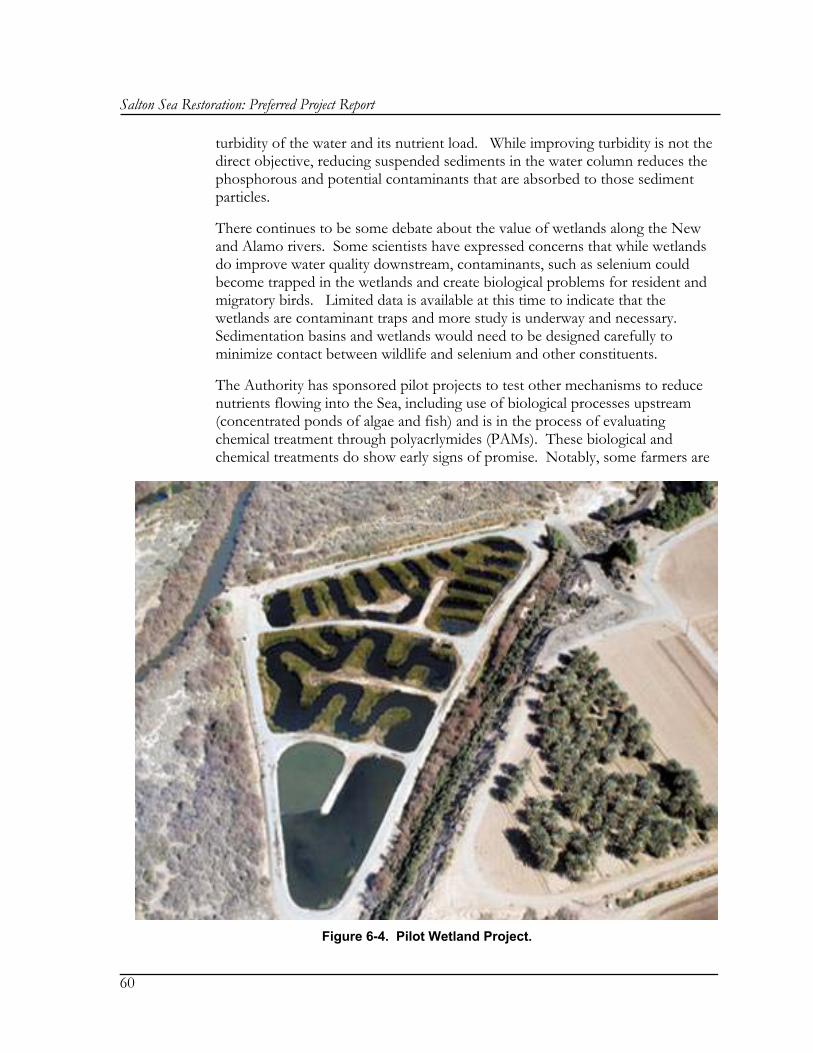
Salton Sea Restoration: Preferred Project Report
60
turbidity of the water and its nutrient load. While improving turbidity is not the direct objective, reducing suspended sediments in the water column reduces the phosphorous and potential contaminants that are absorbed to those sediment particles.
There continues to be some debate about the value of wetlands along the New and Alamo rivers. Some scientists have expressed concerns that while wetlands do improve water quality downstream, contaminants, such as selenium could become trapped in the wetlands and create biological problems for resident and migratory birds. Limited data is available at this time to indicate that the wetlands are contaminant traps and more study is underway and necessary. Sedimentation basins and wetlands would need to be designed carefully to minimize contact between wildlife and selenium and other constituents.
The Authority has sponsored pilot projects to test other mechanisms to reduce nutrients flowing into the Sea, including use of biological processes upstream (concentrated ponds of algae and fish) and is in the process of evaluating chemical treatment through polyacrlymides (PAMs). These biological and chemical treatments do show early signs of promise. Notably, some farmers are
Figure 6-4. Pilot Wetland Project.
Chapter 6: The Preferred Project
61
already utilizing PAMs to reduce sediments flowing in their tail water. As the Regional Water Quality Control Board recently noted (memo to Tom Kirk from Doug Wylie, March 23, 2004), total suspended solids (TSS) concentration in the Alamo River last year was 280 mg/L, significantly less than the 1980-2000 average concentration of 377 mg/L. As Mr. Wylie notes, this implies some success by farmers in the Imperial Valley in implementing agricultural management practices.
The Wylie memo indicates that the current wetlands along the New and Alamo rivers reduce total suspended solids by 93 percent from the waters flowing through the wetlands. Using the first two years of data for the New River Wetlands project referenced in the Wylie memo, the wetlands have a 40-50% total phosphorous efficiency. It is expected that this phosphorous efficiency will decrease as the wetlands are fully established due to the saturation of nutrient uptake by the vegetation. In addition, nutrient removal is less efficient as nutrient loads are decreased upstream.
A new wastewater treatment plant in Mexicali is expected to remove about 10% of total phosphorous from the loading to the Salton Sea when fully operational, according to the EPA (2003). Additionally, extending the rivers another approximately 21 miles each in the proposed plan will likely slow water velocities, dropping out additional solids along the way.
Total Maximum Daily Load Program (TMDL)—As mentioned briefly in Chapter 2, the TMDL program is being implemented by the Regional Water Quality Control Board to provide a long-term reduction in key constituents in waters that flow into the Sea. Congress, through the Clean Water Act (CWA), established the legal requirement that states list and rank impaired waterbodies, and that TMDLs be established for constituents that are causing impairment, in accordance with the priority ranking. The Salton Sea watershed has been identified as a priority watershed for the TMDL program. The Colorado River Basin Regional Water Quality Control Board (RWQCB) in California is currently in the process of establishing TMDLs for these waters. The long-term goal of the TMDL process is to improve the quality of water flowing into the Sea. The sediment/silt TMDLs are now in-place for the New and Alamo rivers and will soon be implemented for some of the agricultural drains. Implementation of the Alamo River and New River silt TMDLs is expected to reduce total suspended solids to 200 mg/L in both rivers by 2015. The process for implementing TMDLs for nutrients is nearly complete. While sedimentation basins and improvements in Mexico could reduce phosphorous loads to the Sea, opportunities for additional wetlands could reduce nutrient loading even more. Steps are underway to design a nutrient TMDL by the Regional Water Quality Control Board. Implementation of such a TMDL would

Salton Sea Restoration: Preferred Project Report
62
Figure 6-6. Artistic Rendering Shallow Habitat Area.
further reduce nutrient inputs to the system, but no estimates are available yet as to its likely effect on the Sea.
Smaller Recreational Lakes Smaller recreational lakes could include a fresh/brackish water lake near Red Hill Marina (Figure 6-5) that could provide recreational opportunities for boating and water skiing in Imperial County. In addition, other lakes could include one near Red Hill Marina. During the transition period prior to closure of the north marine lake, these smaller lakes could possibly be operated as salt water lakes with managed salinity to act as fish refugios to sustain the marine fish breeding stock until the north lake salinity targets are achieved.
The Causeway The causeway would be between 7 and 8.5 miles long depending on the elevation of the main lake. It would offer a convenient and time saving means to travel from one side of the Sea to the other, and could also offer shoreline access for people, fishing opportunities, and habitat for fish and birds.
Shallow Brackish and Salt Water Habitat Reclamation The creation of shallow salt-water habitat would need to be an integral component of a successful comprehensive restoration strategy due to the ability of the habitat to address multiple issues. Creation of shallow water habitat would allow for reclamation of flooded areas of the Sony Bono Wildlife Refuge, providing more than twice the area of shallow water habitat than is currently present at the Sea (Figure 6-6). As a result of reduced inflow to the Sea and the corresponding reduction in size of the Sea, less shallow water habitat would be available to many of the bird species that use the Sea either seasonally or as
Figure 6-5. Fresh Water Lake Concept—Lake Red Hill.

Chapter 6: The Preferred Project
63
permanent residents. Development of shallow water habitat would provide the important habitat necessary for these bird species.
In addition to habitat benefits, the development of shallow water areas has the potential to mitigate air quality impacts as discussed in the following paragraphs. It is proposed to begin by constructing about 2,000 acres of shallow habitat as an initial phase, and then add more as the lake level in the south basin recedes. The area between the existing shoreline and the one foot depth contour is currently just over 2,000 acres for the entire Sea.
Air Quality/Dust Control Mitigation
The legislation authorizing water transfers under the QSA requires mitigation for air quality impacts at the Sea that would be caused by reduced inflows that result from the transfer. Regardless of the funding source, it is important that air quality be addressed as part of an overall restoration strategy. Some measures that could be undertaken to address air quality concerns of the Salton Sea area as part of an integrated and comprehensive restoration strategy are as follows:
• Shallow water habitat areas—As mentioned above, creating shallow water habitat areas would have the added benefit of dust suppression. The development of shallow water habitat has the potential to mitigate some air quality impacts through the spreading and coverage of exposed sediments with shallow water habitat cells or ponds. This would reduce wind fetches and provide wetted areas to saltation of blowing dust particles.
• Salt crusts—In addition to dust suppression associated with the shallow water wetted areas, as salt water would be moved through a series of the shallow water ponds, salts would tend to concentrate in the water from solar evaporation. Ultimately, concentrated brine would be discharged from the shallow water habitat areas and the brine could then be used to create salt crusts in areas that would be particularly susceptible to wind erosion. Salt crusts would cover fine sediments that otherwise would be exposed to erosion.
• Salt tolerant vegetation—Another feature that could be associated with shallow water areas would be the presence of salt tolerant vegetation. Vegetation would probably need to be included with the overall dust suppression plan.
Geothermal Expansion It is widely recognized that areas of known geothermal resource potential are located at the southern end of the Salton Sea that are currently inundated. With a receding Sea exposing these areas in conjunction with a restoration plan that would allow further access to these areas, a significant potential to exploit these resources would occur (Figure 6-7). Exposing a large geothermal anomaly would allow for a 1,400

Salton Sea Restoration: Preferred Project Report
64
MW expansion opportunity, that could triple the existing and planned capacity of existing geothermal operations.
Other Economic and Recreational Opportunities
Other opportunities would include the possibility of reclaiming farmland that is now flooded; wide ranging hunting, bird watching, hiking, and water contact opportunities; marina and housing development; and off-road vehicle use areas. It could also facilitate additional water transfers through desalting of inflows or other reuse or conservation measures. As the Sea recedes, previously inundated farmland could be reclaimed and used for agricultural production. The most likely area for this to occur would be in the south adjacent to existing farmland due to economies of scale and because agricultural infrastructure is already in place on adjacent land.
Other Recreation and Public Information Opportunities
The recreational enhancements program should provide for improvements to recreational facilities around the Sea. Specific improvements would be designed to meet future needs, but may include a visitor center, improvements to access areas or creation of new access points associated with these facilities, upgrades to public use areas, and public outreach material. Other recreational facilities such as golf courses could be encouraged through land use planning and zoning designations for areas surrounding the Sea. Hunting and fishing opportunities could also be incorporated into a restoration plan that takes advantage of the new configuration of the Sea.
Wildlife Disease Control A comprehensive restoration strategy should include an integrated approach to wildlife disease control to reduce the incidences of wildlife disease at the Sea. Avian disease at the Salton Sea has been a chronic problem resulting in an annual loss of several thousand birds. Major epizootics (quickly spreading disease among animals) increased in frequency during the 1990s, which greatly increased the level of losses. During 1992, more than 150,000 eared grebes (Podiceps nigricollis) died during a single event of undetermined origin. The deaths of thousands of white pelicans (Pelecanus erythrorhynchos) and more than 1,000 endangered California brown pelicans (P. occidentalis) during 1996 from type C avian botulism focused national attention on the Salton Sea. That event served as a catalyst to begin the current Salton Sea Restoration Project.
Figure 6-7. Rendering of Geothermal Expansion Area.
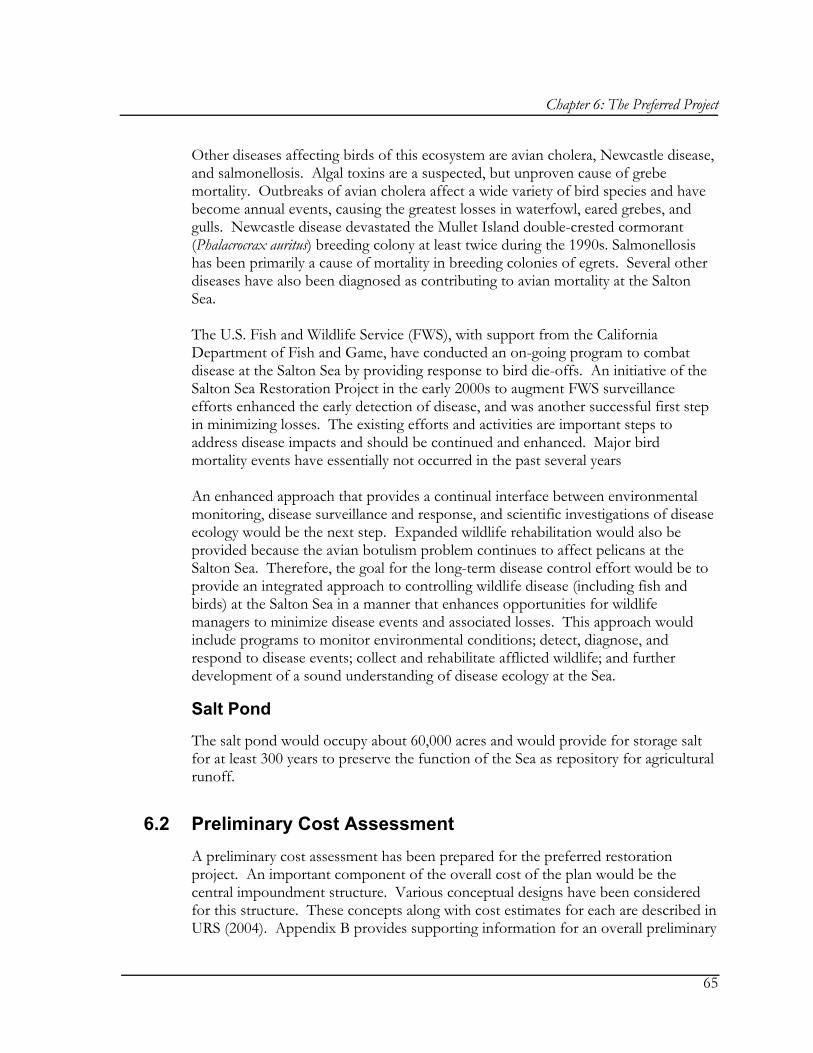
Chapter 6: The Preferred Project
65
Other diseases affecting birds of this ecosystem are avian cholera, Newcastle disease, and salmonellosis. Algal toxins are a suspected, but unproven cause of grebe mortality. Outbreaks of avian cholera affect a wide variety of bird species and have become annual events, causing the greatest losses in waterfowl, eared grebes, and gulls. Newcastle disease devastated the Mullet Island double-crested cormorant (Phalacrocrax auritus) breeding colony at least twice during the 1990s. Salmonellosis has been primarily a cause of mortality in breeding colonies of egrets. Several other diseases have also been diagnosed as contributing to avian mortality at the Salton Sea. The U.S. Fish and Wildlife Service (FWS), with support from the California Department of Fish and Game, have conducted an on-going program to combat disease at the Salton Sea by providing response to bird die-offs. An initiative of the Salton Sea Restoration Project in the early 2000s to augment FWS surveillance efforts enhanced the early detection of disease, and was another successful first step in minimizing losses. The existing efforts and activities are important steps to address disease impacts and should be continued and enhanced. Major bird mortality events have essentially not occurred in the past several years An enhanced approach that provides a continual interface between environmental monitoring, disease surveillance and response, and scientific investigations of disease ecology would be the next step. Expanded wildlife rehabilitation would also be provided because the avian botulism problem continues to affect pelicans at the Salton Sea. Therefore, the goal for the long-term disease control effort would be to provide an integrated approach to controlling wildlife disease (including fish and birds) at the Salton Sea in a manner that enhances opportunities for wildlife managers to minimize disease events and associated losses. This approach would include programs to monitor environmental conditions; detect, diagnose, and respond to disease events; collect and rehabilitate afflicted wildlife; and further development of a sound understanding of disease ecology at the Sea.
Salt Pond
The salt pond would occupy about 60,000 acres and would provide for storage salt for at least 300 years to preserve the function of the Sea as repository for agricultural runoff.
6.2 Preliminary Cost Assessment A preliminary cost assessment has been prepared for the preferred restoration project. An important component of the overall cost of the plan would be the central impoundment structure. Various conceptual designs have been considered for this structure. These concepts along with cost estimates for each are described in URS (2004). Appendix B provides supporting information for an overall preliminary

Salton Sea Restoration: Preferred Project Report
66
cost estimate for the preferred project including costs for the central retention structure obtained from URS (2004) and other features of the project. A cost summary for the total project is provided in Table 6-1. The table includes cost estimates for two possible designs for the impoundment structure and two possible design elevations for the water surface of the marine lake. Lowering the design elevation would lower the cost of the impoundment structure.
Each of the features included in the cost estimate are discussed briefly below:
Impoundment Structure/Causeway— A working group of 15 civil and geotechnical engineers was convened to review the feasibility of constructing a dike, or retention structure/causeway anywhere within the Salton Sea. The group reviewed data from the recent geotechnical investigation of the Sea and suggested alternative design concepts. Cost estimates were developed based on the concepts identified by this group. Cost estimates are very preliminary at this point, and, as of this writing, have not yet undergone review by the work group.
Of the concepts proposed by the work group, the most cost effective structure appears to be a blanketed rockfill design. This concept would consist of an embankment built in the water and entirely out of rock fills. To mitigate seepage through the dam, a blanket of fine material would need to be placed on the upstream slope. Conventionally, this is usually an asphalt or concrete pavement. However, the Sea level would preclude those for this concept. The upstream blanket for this concept would consist of depositing fine-grained soils on the upstream slope to “plug” the rockfill. Ten to 25 feet of the weak soils below the embankment would be excavated and replaced with rock fills. This material could be used to provide the blanket. Alternatively, a bentonite slurry wall could be constructed through the dam along its crest to provide a seepage barrier. The slurry wall would add $60 to $70 million to the project. The conceptual design includes inclinations of 4:1 on the upstream slope and 7:1 on the downstream slope. The crest of the dam would be 30 feet wide and provide for 5 feet of freeboard above the lake. This concept is shown in Figure 6-8. Lower marine lake levels would require less embankment volume for the impoundment structure, and would cost less. Table 6-1 presents the estimated costs for the Blanketed Rockfill structure for lake elevations of –235 and –240 feet msl. This evaluation indicates that the mid-Sea dam would cost about $100 million less with a 5 foot drop in lake level below -235 feet msl. Conversely, if the structure were designed to maintain the current water elevation, the cost estimates would go up by about $150 million.
Appurtenant Structures—The cost of appurtenances such as spillways and other outlet structures, and the channels leading to the shallow water habitat areas have been factored in as five percent of the impoundment structure.

Chapter 6: The Preferred Project
67
Table 6-1. Preliminary Cost Estimate for Preferred Alternative Concept
Item Cost ($M) at El=-235' msl Cost ($M) at El=-240' msl
Initial Construction Costs Blanketed Rockfill
Rockfill w Slurry Wall
Blanketed Rockfill
Rockfill w Slurry Wall
Mid-Sea Retention Structure/Causeway 418$ 489$ 354$ 418$
Appurtenant Structures (Spillways, etc.) 21 24 18 21
Dredging to Communities & Island Creation 6 6 20 20
Greenbelt Channels to North Lake(Incl. 20 sed. basins, 2,500 ac wetland, 20% planted) 76 76 66 66
Recreational Lake (approx. 1,000 ac) 45 45 45 45
Torres Martinez Wetlands/Habitat 20 20 20 20
Upstream Wetlands (Top 5 sites, 1376 ac) 58 58 58 58
Shallow Water Habitat Initial Phase (2,000 ac) 8 8 8 8
Total Construction Costs (rounded) 650$ 730$ 590$ 660$
Annual Costs Cost ($M/yr) Cost ($M/yr)
Causeway, Channel & Appurtenance O&M 5.1$ 5.9$ 4.4$ 5.0$
Add Shallow Habitat (500-1,000 ac/yr) 3.0 3.0 3.0 3.0
Habitat O&M 2.0 2.0 2.0 2.0
Total Annual O&M ($M/yr) 10.1$ 10.9$ 9.4$ 10.0$
Present Value of Annual Costs ($M) - based on 30 yrs 150$ 160$ 140$ 140$
Total Present Value Cost ($M) 800$ 890$ 730$ 800$
Note: Does not include costs for development of recreational facilities, new highways, or new lakeside development.
Figure 6-8. Typical Blanketed Rockfill Impoundment Structure Cross Section.

Salton Sea Restoration: Preferred Project Report
68
Dredging to Communities and Island Creation—With lowered lake levels, existing Sea-side communities would be at some distance from the Sea. Dredging is proposed to restore access to the Sea for these communities. Dredging could also create islands and peninsulas that would provide recreational and habitat value as well as create opportunities for development. Dredging cost estimates are based on preliminary estimates of the quantities that would need to be removed for different lake elevation targets. A raw unit cost of $2.90/cubic yard was then applied for dredging along with factors for mobilization, unlisted items, contingencies, and costs such as design and construction oversight.
Greenbelt Channels to the Lakes with Wetlands and Sedimentation Basins—The New and Alamo rivers would need to be extended to reach the north basin marine lake (Figure 6-9). The cost of constructing a wetland greenbelt area around these river extensions has been included along with the cost of constructing 20 sedimentation basins. The Nolte (2002) report commissioned by the Citizens Congressional Task Force to evaluate potential wetland sites that could be developed in the New and Alamo river channels was used as an important source of cost information.
Figure 6-9. Schematic of Greenbelt Channel Extension Concept.

Chapter 6: The Preferred Project
69
The wetland greenbelt for both channels was estimated at 2,500 acres and it was assumed that vegetation would be planted on 20 percent of this area. It was assumed that over time vegetation would grow to fill the area. The unit cost for vegetation was also taken from Nolte (2002). For purposes of providing costs of a preferred project, wetlands and sedimentation basins were assumed. However, if other biological or chemical treatments are found more effective some amount of wetlands or sedimentation basins could be replaced with such treatments.
Wetlands expansion could be justified on economic, habitat or other purposes. For this report, the projected amount of wetlands and sedimentation basins is a function of the water quality improvement that would accrue to the water bodies envisioned in the current Salton Sea boundaries. The Nolte (2002) report identifies 4,276 acres of potential wetlands for a cost of $182 million. To achieve water quality targets, this report assumes 1,376 acres in the five highest rated sites of those wetlands could be constructed in the first phase of the proposed project.
For sedimentation basins, estimates were derived from the evaluation of plans to desalt the Alamo and/or New Rivers. US Filter, Black & Veatch and others have, in the past, suggested desalting the rivers in the Imperial Valley to provide product water for sale to urban or other communities. To properly operate such desalting plants, river water must be very clear. To reduce turbidity, a rule of thumb is often used that sedimentation basins should have an area of about 10 square feet for every gallon per minute of flow. That translates to a requirement of 110 acres of sedimentation basins to treat a flow of 800,000 acre-feet/year. The base cost for these was taken from the Nolte (2002) report on constructing wetlands on the New and Alamo Rivers, for a typical 5.5 acre sedimentation basin. Constructing 20 5.5 acre sedimentation basins will provide the total 110 acres needed for sedimentation.
Other Features—Preliminary cost estimates have been included for three other features: a 1,000 acre shallow recreational lake, a Torres Martinez wetlands/habitat feature, and an initial phase of shallow water habitat construction.
Operation and Maintenance Costs and Other On-Going Costs—Preliminary estimates have been provided for operation and maintenance of the various features such as the mid-Sea retention structure, appurtenances, and channels. In addition, costs are included for maintenance and for future expansion of shallow water habitat areas. It is anticipated that 500 to 1,000 acres of new shallow salt water habitat could be added each year to full build-out of about 20,000 acres. These areas would provide habitat for birds as well as help with dust suppression.
6.3 Program Financing As noted in Section 6.2, the total project capital costs are projected to be between $590 and $730 million. Several potential funding sources are discussed in this section, some of which the Authority might wish to pursue. A more detailed cost

Salton Sea Restoration: Preferred Project Report
70
analysis and financing plan will be possible following final design decisions and completion of all environmental compliance requirements.
Proposition 50—Proposition 50 funds could be used to jump start restoration in the near term. California’s legislature, through SB 654 (Machado), provides $50 million to assist in implementation of the Salton Sea preferred project. $20 million of that funding has been separately allocated to the State’s new 3-year study of the Sea via a programmatic environmental impact report.
Should study funding instead be directed at a “project” level, construction could occur much sooner than the State’s current stated intentions. In addition, much of this funding could be allocated for actual improvements related to Phase 1 construction activities (see Section 6.5), such as expansion of freshwater wetlands and creation of sedimentation basins, and process costs be kept to a minimum (e.g. $2 million).
California’s Salton Sea Restoration Fund—The largest current committed funding source is related to the agreements to transfer water from the Imperial Valley to urban and other communities known as the QSA. The QSA and related legislation (SB 277, SB 317, SB 654) provide for $30 million to be contributed to a restoration fund by water transfer parties. The biggest QSA contribution to the restoration fund comes from the potential sale of mitigation water.
Under the terms of the QSA, potential impacts from water transfers to the Salton Sea are mitigated/addressed by sustaining inflows to the Sea for the first 15 years of the water transfer. However, if a restoration plan, such as the one proposed in this report, is found to not require the mitigation water, the water could be sold to urban water districts to generate approximately $200 million.
Additionally, $60 million could be generated for the restoration fund from the purchase and re-sale of additional water from the Imperial Irrigation District. Metropolitan Water District will also contribute to the restoration fund for all special surplus water received by MWD from the Colorado River. The total QSA-related contribution to restoration funding could reach $300 million.
Most of the $300 million QSA-related contribution to restoration funding involves, in many ways, accelerating the water transfers to the coast. The proposed project facilitates such an acceleration. In fact, the proposed project benefits from the acceleration due to the reduced time to achieve the target elevation as well as any money generated for the restoration fund from the acceleration.
Interestingly, water transfers could be accelerated beyond that contemplated in the QSA to provide more water supply to urban communities during the initial ten to fifteen year period and, if designed similar to the above arrangements, could provide additional funding for Salton Sea restoration. However, the Imperial Irrigation District would need to be consulted in depth to determine the capability to accelerate

Chapter 6: The Preferred Project
71
efficiency improvements or other water savings beyond that contemplated in the QSA.
Local Tax Increment—With restoration of the Sea, it is expected that property values will increase. As a result, property tax revenues will also increase. Redevelopment project areas and infrastructure finance districts allow government to capture the new or “incremental” increased revenues to support capital projects without increasing the tax rate. This makes particularly good sense at the Sea given the direct link between the project, restoration of the Sea, and property value/tax revenue increases.
About five years ago, the Authority’s Economic Development Task Force identified tax increment financing as a potential financial tool for the Authority. The Authority sponsored legislation that was authored by Senator Dave Kelley to allow the Authority to establish an Infrastructure Finance District around the Sea. The Authority commissioned a study by Rosenow Spevacek Group to conduct a tax increment financing feasibility study. The study indicated that several hundred million dollars could be generated through a tax increment district around the Sea. And that the revenue projects could significantly increase with an expansion of the Authority’s boundaries.
Early in 2004, the Authority significantly increased its boundaries to increase the revenue potential. For purposes of this conceptual financing plan, we have conservatively estimated that $200 million, present value, could be generated for the project.
Federal Funding/State Bond Financing—Of the projected $730 million capital cost of the preferred project, approximately $500 million, or over 70%, could be generated within the region. Any remaining necessary funding could be provided by Federal appropriations and/or State bond financing. Such funding could be equal to the local, tax increment funding, or about $200 million.
Federal and State of funding is certainly a political challenge, particularly in an era of federal and state budget deficits and financial challenges. However, increasing broad based support for restoration, evidenced by the formation of the Salton Sea Coalition and recent state legislation is an encouraging sign. The availability of regional matching funding, the $500 million, also improves prospects for federal or state matching funds. In the past year, while to-date unsuccessful, federal and state legislators have floated various bond and authorization packages for restoration ranging from $300 million to $1 billion.
Fed/State
SSA Tax Increment
Water Transfer
Prop. 50

Salton Sea Restoration: Preferred Project Report
72
Total operations and maintenance costs of the project are projected to be less than $9 million annually, but must be addressed. Changes in the State’s government code which allows the Authority to create a tax increment district could allow that funding source to pay for operations and maintenance requirements.
Given the amount of additional habitat created on the Sonny Bono National Wildlife Refuge, additional annual federal funding may be necessary to help manage what will likely be prolific bird habitat.
Access and Use Fees—Other aspects of the project could generate significant annual revenues. Access and use fees at the proposed freshwater lake in the Imperial Valley could defer maintenance costs on that facility (salt cedar control, etc.). If a roadway runs along the causeway, it could be tolled to help fund annual maintenance of the facility. Commercial leases of the facility and/or land sales of public land could also be used to support the capital or ongoing costs of the project.
6.4 Performance The performance of the north marine lake has been evaluated by Reclamation using the Salton Sea Accounting Model (Appendix C). The salinity projections for two inflow scenarios are shown in Figure 6-10 and 6-11. Figure 6-10 provide salinity projections for the north lake with QSA inflows with mitigation water ending in 2006 for three possible lake level design elevations: -230, -235, and -240 feet msl. Figure 6-11 provide salinity projections for the north lake for the 800,000 acre-feet/year inflow scenario, for the same three possible lake level design elevations.
The performance data in Figure 6-10 shows that the lake could reach a salinity target of 35,000 mg/L by 2013 for the -235 feet msl design elevation case, for QSA inflows with mitigation water ending in 2006. For the -240 feet msl design elevation case, it would take an extra 5 years for the salinity to get back under 40,000 mg/L for this inflow scenario, and it would reach the 35,000 mg/L target by about 2020. However, Figure 6-11 shows that for the 800,000 acre-feet/year inflow case, the salinity could reach 35,000 mg/L by about 2016. In either case, the -240 feet msl design elevation project would have higher peak salinity during the transition period than the higher elevation design.
6.5 Target Lake Elevation A design elevation of around -235 feet msl is recommended for consideration as the target elevation. It would have a number of benefits:
• High enough elevation to allow for gravity flow of salt water to shallow habitat areas and for dust control.
• Minimal dredging for access to communities.

Chapter 6: The Preferred Project
73
Salinity of North LakeQSA Level Inflows to the Salton SeaWith Mitigation Water Ending in 2006
0
10,000
20,000
30,000
40,000
50,000
60,000
70,000
2000 2010 2020 2030 2040 2050 2060 2070 2080
Year
Salin
ity (m
g/l)
Elevation = -230' mslElevation = -235' mslElevation = -240' msl
Salinity of North LakeInflows Reduced to 800k to the Salton Sea
0
10,000
20,000
30,000
40,000
50,000
60,000
70,000
2000 2010 2020 2030 2040 2050 2060 2070 2080
Year
Salin
ity (m
g/l)
Elevation = -230' mslElevation = -235' mslElevation = -240' msl
Figure 6-10. Projected Salinity in North Lake for QSA Inflows with Mitigation Water Ending in 2006.
Figure 6-11. Projected Salinity in North Lake for 800,000 Acre-Foot/Year Inflow Scenario.

Salton Sea Restoration: Preferred Project Report
74
• Low enough to provide fall for river extensions.
• Minimal salinity spike and short time to target salinity.
• Reasonable cost…at -235 feet msl the cost estimate for the retention structure is about $150 million less than it would be for the current lake elevation.
While elevation -235 feet msl provides a reasonable design target, there are some considerations where -240 feet msl should be considered. If it appears that the construction schedule would need to be extended and the 800,000 acre-feet/year inflow is realistic, then -240 feet msl should be reconsidered as there could be a savings of about $100 million, with other factors being equal.
6.6 Program Phasing Project phasing will depend on the design elevation of the north marine lake. Significant savings can be achieved in the embankment construction by lowering the lake elevation. In general, reducing the height of an embankment by a factor of two will decrease its cost by a factor of four. Because the lake will respond to inflow reductions gradually over a period of years, the lower the design elevation, the longer it will take to achieve closure of the lake. The north lake cannot be closed until the Sea elevation declines enough to match the desired design elevation. Figure 6-12 illustrates a preliminary phasing plan assuming a design elevation of -235 feet msl.
Phasing of restoration features could be accomplished in the following manner:
1. Installing upstream freshwater wetlands and sedimentation basins coupled with implementing TMDL measures to improve water quality of inflowing could be accomplished as the first step. This step would ensure that once the marine lake is created, the inflows would be of high quality. In addition, it would create recreational opportunities for hunting and bird watching.
2. Dredging of shoreline access areas would begin prior to substantial drops in lake elevation, to begin creating islands and peninsulas.
3. Constructing extensions of the New and Alamo river channels as the lake level begins to recede, in preparation for creating the main marine lake. Additional freshwater and brackish wetlands and sedimentation basins would be created along these channels. Smaller freshwater or brackish lakes and some shallow water habitat areas could also be created concurrently to create additional recreational opportunities and begin dust control measures.
4. Constructing the central causeway to create the main marine lake.
5. Completing the shallow water habitat areas and dust control measures.
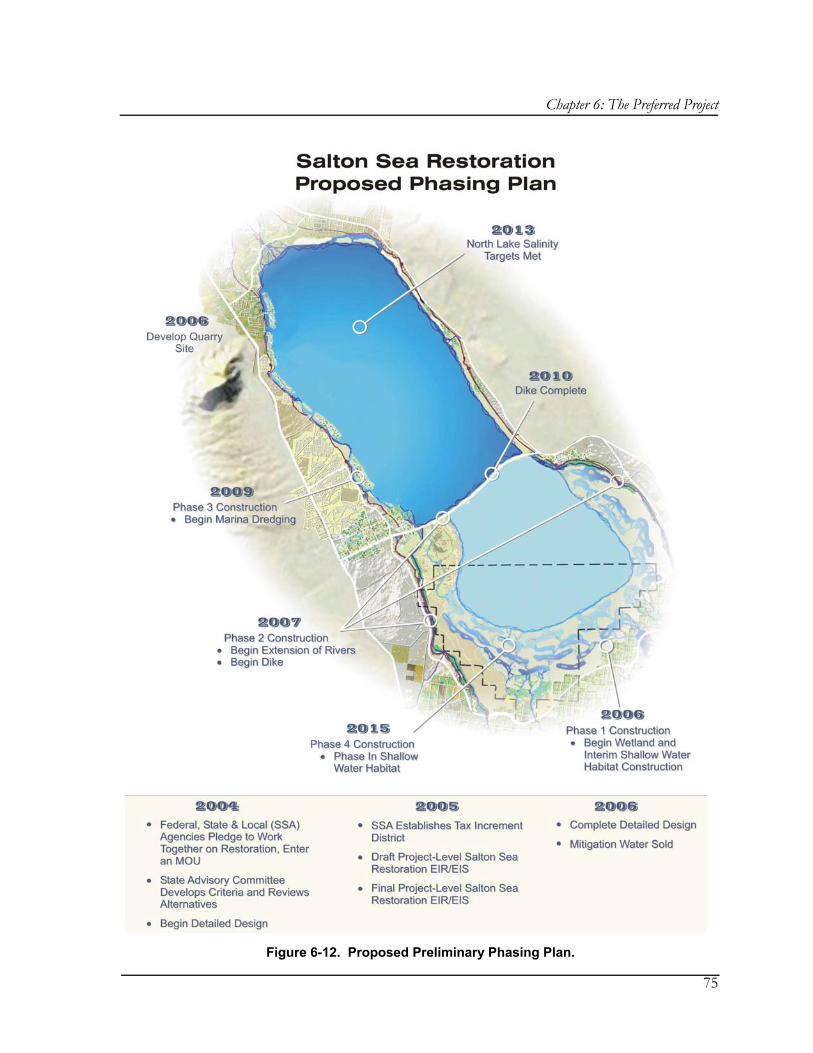
Chapter 6: The Preferred Project
75
Figure 6-12. Proposed Preliminary Phasing Plan.

Salton Sea Restoration: Preferred Project Report
76
6.7 Implementation A conceptual implementation schedule is provided in Table 6-2 including a preliminary estimate of phasing of expenditures. The funding profile is illustrated in Figure 6-13. Implementation of the project would begin with contracting for detailed design, environmental compliance, and permitting. The detailed design phase would include a second phase of geotechnical investigations, geophysical surveys, seismic stability analysis for the embankment structure, identification of a quarry site, site surveys, detailed construction and operation cost estimates, and preparation of permit applications. For environmental compliance, the Authority could then begin preparation of a site specific Environmental Impact Statement/Environmental Impact Report (EIS/EIR) to analyze the preferred alternative and the other alternatives discussed in Chapter 5. Alternatively, the State could incorporate the preferred project into its CEQA documentation process. The major construction phase is anticipated to be about a four year program.
Timeframe Construction Phase Expenditure2004 Begin Detailed Design 22005 Design Continues, Environmental Compliance and Permitting 102006 Complete Detailed Design 102006 Phase One Construction: Develop Quarry Site, Begin Wetlands and
Interim Shallow Water Habitat Construction 202007 Phase Two Construction: Begin Extension of Rivers and Causeway 1102008 Construction Continues 1602009 Phase Three Construction: Begin Marina Dredging 1902010 Complete Causeway 148
Initial Construction Program Complete: Total Expenditures 650
Begin Operation Phase
Annual Expenditures
($M/Year)2011-2014 Operation and Maintence (O&M) 5.1
2015- O&M Plus Phased In Shallow Water Habitat 10.1Based on Blanketed Rockfill Dike at Elevation -235 feet, msl.
Table 6-2. Conceptual Implementation Schedule
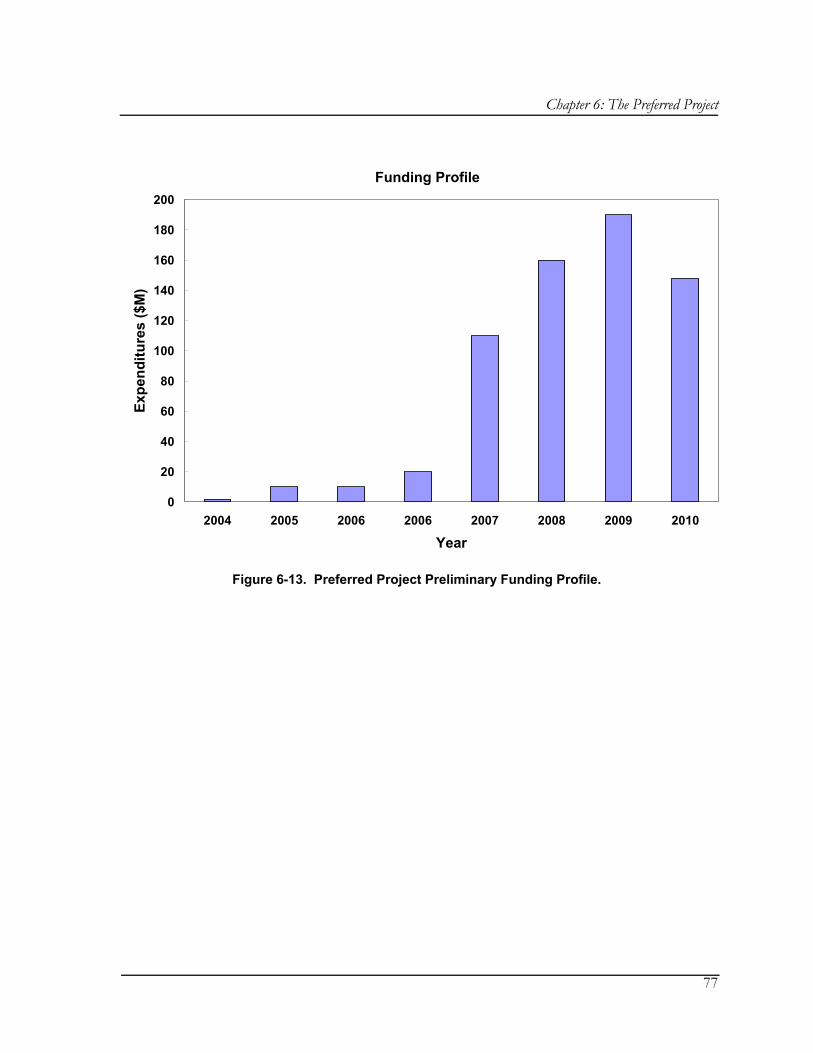
Chapter 6: The Preferred Project
77
Funding Profile
0
20
40
60
80
100
120
140
160
180
200
2004 2005 2006 2006 2007 2008 2009 2010
Year
Expe
nditu
res
($M
)
Figure 6-13. Preferred Project Preliminary Funding Profile.

Salton Sea Restoration: Preferred Project Report
78
This page intentionally left blank.

Chapter 7: References
A-79
Chapter 7: REFERENCES Brownlie and Kirk. 2003. Technical Memo From Tom Kirk, Salton Sea Authority and Bill Brownlie, Tetra Tech, Inc. Re: Black & Veatch Salton Sea Proposal. August.
CH2M Hill. 2002. IID Water Conservation and Transfer Project Draft Environmental Impact Report/Environmental Impact Statement.
Nolte Beyond Engineering. 2002. Reconnaissance Inventory of Wetland and Sedimentation Basin Sites: New and Alamo Rivers Prepared for The Citizen's Congressional Task Force on the New River. May.
Salton Sea Science Office. 2002. Evaluation of a Proposal for Conversion of the Salton Sea Ecosystem. Analysis of a project proposed by the Pacific Institute for Studies in Development, Environment and Security, Oakland, California, October 2001. By participants in workshops coordinated by the U.S.D.I. Salton Sea Science Office and held during December 2001 and January 2002, Riverside, San Diego and Indian Wells. February.
Tetra Tech. 2004. Habitat Quality in Saline and Hypersaline Shallow Ponds. Prepared for Salton Sea Authority, La Quinta, California.
Tetra Tech. 2003. Review of US Filter Corporation Salton River Proposal Final Report. Prepared for Salton Sea Authority, in cooperation with Salton Sea Science Office and Citizens Advisory Committee. March.
Tetra Tech. 2000. Draft Salton Sea Restoration Project Environmental Impact Statement/Environmental Impact Report. Prepared for Salton Sea Authority, La Quinta, California, and U.S. Bureau of Reclamation, Boulder City, Nevada. January.
Tetra Tech. 1999. Salton Sea Restoration Project Alternatives Screening Report. Salton Sea Restoration Project. Prepared for Salton Sea Authority, La Quinta, California.
U.S. Department of the Interior, Bureau of Reclamation. 2003. Salton Sea Study Status Report. Prepared by Tetra Tech. January.
URS and Tetra Tech. 2004. Preliminary In-Sea Geotechnical Investigation Salton Sea Restoration Project. Riverside and Imperial Counties, California. March.

Salton Sea Restoration: Preferred Project Report
80
This page intentionally left blank.

A-1
Appendix A SHALLOW WATER HABITAT AT THE SALTON SEA
A.1 Overview A workshop was convened in San Diego, California by the Salton Sea Science Office to address issues associated with the development of shallow habitat at the Salton Sea. As all of the proposed Salton Sea restoration or recovery scenarios include shallow habitat, the physical, chemical, biological, and engineering issues associated with such habitats are important to consider as the alternatives are being evaluated.
The workshop began with a tour of the shallow ponds at the Western Salt facility in Chula Vista, which has recently been acquired for management by the United States Fish and Wildlife Service. Berm structure and salinity profiles, in addition to use of the ponds by various bird species, were examined and discussed.
At the workshop, background information on shallow habitat evaluation associated with the US Filter proposal, data on eutrophication, the results of an environmental risk assessment of the shallow salt ponds of the Salton Sea solar pilot project, and a summary of the sediments of the Salton Sea were presented. Following these presentations, the group divided into three work groups to focus on biology (especially bird species), physical and chemical qualities of shallow habitat, and engineering considerations for construction of the habitat. The participants reported back on the major findings of each group.
The general conclusions can be summarized as follows:
• Shallow habitats should be developed using Salton Sea water rather than water from rivers or drains due to selenium concerns. Shallow water impoundments that begin with water containing more than 2 ppb selenium should be discouraged.
• Shallow habitats should be sited where they take optimum advantage of shallow slopes, of proximity to existing reserves or habitats, and of proximity to agricultural fields, as these siting considerations give the developed habitats their highest value.

Salton Sea Restoration: Preferred Project Report
A-2
• The salinity of the habitats is of minor concern, as any waters between about 30 and 150 parts per thousand total dissolved solids (PPT TDS) will provide foraging value to a variety of birds. If environments including brine at the saturation level for salts are present, however, proximity to lower salinity habitats is important. Salinity targets should be out of the range for avian botulism.
• Selenium is the most important water quality concern, although data on DDE should be carefully considered as well.
• Eutrophication level for shallow habitat areas is not a concern.
• Construction of the shallow habitats could utilize structures developed with low-cost agricultural specifications, subject to site-specific and risk assessment review.
There were no “data gaps” that were suggested as being critical to moving forward with developing a preferred alternative concept. It is now possible to develop conceptual level cost estimates for both the construction and the operation and maintenance (O&M) of shallow water habitat areas. More detailed cost estimates can be developed in concert with the preparation of site-specific habitat restoration plans.
As regards the applicability of shallow habitats to the alternatives under consideration, the results of the workshops suggest that overall, from the point of view of shallow habitat, a preferred alternative would have the following features:
• Construction opportunities at the south areas of the basin, on clay soils with shallow slopes adjacent to existing refuge and reserve lands. This requirement eliminates the South Marine Lake with Elevation Control alternative, but remains feasible with the other scenarios.
• Gravity delivery of water from a restored portion of the Sea, which would be low in selenium and of a salinity about that of ocean water. This requirement would be possible with the alternatives involving a south or north marine lake with elevation control.
• A pumped delivery of water from a restored portion of the Sea, which would be low in selenium and of a salinity about that of ocean water. This would be possible with all scenarios, but more pumping would be required with the barrier and the no barrier alternatives.
A.2 Background The Salton Sea Science Office (SSS0) conducted a workshop on January 28-29, 2004 in order to evaluate the major considerations associated with the development of

Appendix A: Shallow Water Habitat
A-3
shallow water habitat at the Salton Sea. Experts in water quality, biology, and engineering who possess special expertise in saline conditions were invited to participate in this workshop. The goal of the workshop was to engage in discussion about the issues surrounding the creation of shallow water habitat at the Salton Sea, and to develop some recommendations for the restoration planning team that are based in sound science and pertinent experience. This paper reports on the findings of that workshop.
With inflows to the Salton Sea expected to decrease substantially in the future, there would be a considerable expanse of shoreline exposed by the retreating Sea. These exposed sediments could create significant air quality problems if they prove to be emissive of PM10 (particles smaller than 10 microns) during wind events. Furthermore, the retreating Sea will provide for less shallow water habitat than is currently present in the basin. Shallow water habitat is important for many of the bird species that use the Salton Sea either seasonally or as permanent residents. Development of new shallow water habitat, then, is a proposal that accompanies all of the restoration scenarios currently under consideration, as it both protects exposed sediments from wind erosion, and also provides important habitat for birds.
A.3 Approach The planning committee for the workshop consisted of Dr. Douglas Barnum and Dr. Rey Stendall of the SSSO, Dr. William Brownlie of Tetra Tech, Mr. Robert Prohaska of Essex Environmental, and Ms.Carla Scheidlinger and Mr. Frank Stradling of Agrarian Research. This group developed the approach and the materials used for the workshop.
The overall approach was to provide appropriate and pertinent background material for all participants, to engage in a field trip to obtain some first-hand impressions of the kinds of habitats that would be under consideration, and to facilitate focused discussions on several aspects of shallow habitat development. The background material and field trip produced some common ground for discussion, which was augmented by a brief presentation of the six conceptual alternatives for Salton Sea restoration that are currently under consideration. In addition, the planning team developed a habitat grid that describes the kinds of habitats that would be associated with each alternative. From that grid, habitats that were characterized by shallow water were singled out for discussion at the workshop.
The major categories of issues associated with shallow water habitat were water quality, biological factors affecting bird use, and engineering concerns. Regarding water quality, the physical and chemical characteristics of the water that would supply the shallow habitats were judged to be highly variable, and a professional consensus regarding optimal as well as hazardous water quality conditions is desirable prior to the selection of a preferred alternative. The biological characteristics that each habitat develops are equally variable, and the quality of habitat that could be created for bird

Salton Sea Restoration: Preferred Project Report
A-4
use is of great interest. Once again, a consensus as to optimal and hazardous habitat conditions was sought. Finally, the development of shallow water habitat involves engineering considerations regarding the kinds of infrastructure elements required for such habitat, and the construction constraints and opportunities that the Salton Sea environments offer.
In order to sort out and effectively discuss these three categories of issues, the workshop plan included separate break-out sessions where each set of considerations could get appropriate attention from the participants.
In summary, then, the approach was to provide an on-the-ground view of the kinds of habitats and infrastructures under consideration, put the habitats in the context of the restoration alternatives, provide sufficient background data to encourage fully informed discussion, and to focus on the three areas of evaluation for habitat and restoration planning.
A.4 Workshop Summary Field Trip. The field trip took place on Wednesday January 28, 2004 at the Western Salt facility in Chula Vista, California. The tour was conducted by Brian Collins of the Tijuana Estuary Reserve in Imperial Beach, California, and by Gene Mullineaux of Western Salt Company.
Western Salt Company is located in the extreme south end of San Diego Bay, and has been in operation for decades. This 800 acre site was once a thriving estuarine system that was home to numerous fish and wildlife species. The United States Fish and Wildlife Service’s Coastal Program, working with the Refuges and Endangered Species programs, acquired the entire 800 acres into the Refuge system, and is now preparing habitat management and restoration plans.
The ponds viewed on the tour were generally of medium depth, between 1 and 6 feet deep. They varied in salinity from that of ocean water (about 35 PPT TDS) in the primary system, to about 60 PPT in the secondary pools, to 280 PPT in the pickling pools, to saturation for sodium chloride, which is at about 340 PPT, or 34 percent salt. Gypsum precipitation in the ponds was said to be at about 110 PPT. The primary systems contained fish, and were used by terns, pelicans, and osprey. In ponds between 80-120 PPT, Artemia were found, although fish were absent. No salt had precipitated at that point. In ponds with a TDS of greater than 120 PPT, brine flies were the only invertebrates noted.
The ponds operate principally by gravity flow, with head differential built with depth. Some amount of pumping is necessary to move the brine, but it is minimal. Some odor has been reported from the ponds, presumably from the sediments, which are probably anoxic. The ponds are considered to be eutrophic, which is not a problem for the salt industry, but is not ideal for deep marine habitat.

Appendix A: Shallow Water Habitat
A-5
The ponds were constructed with native material, which was a mixture of sand, silt, and clay, and which had been bailed up with an excavator during construction. Although the berms had to dry out and set up for almost a year before they could be formed into the roads the tour was driving on, they had been used for water ponding immediately after construction.
The general take-home messages from the field trip for the three areas of inquiry were as follows:
• Ponds can be built with fairly simple technology, including berm construction using dredging, or bailing up of sediments using an excavator. The sediments can take time (1-2 years) to fully dry, but the berms can be used to impound water immediately.
• The quality of the water as regards salinity produces a wide range of habitat conditions, from including fish, to providing only brine flies. At very high salinities where NaCl crystallizes, the habitat is essentially sterile, but can provide safe resting places for birds. Odors coming from eutrophic waters and anoxic sediments were noted.
• Bird habitat is variable, depending on salinity and depth. Nesting habitat can be improved by graveling levees, and making them wider. The deeper ponds support certain birds, including fish-eating birds. The shallower habitats (less than 8 inches) have more bird species diversity.
Orientation. An initial orientation presentation was provided to all participants. In addition, four presentations were made by workshop participants that introduced data that have bearing on the topic of shallow habitats. After the presentations, participants broke into focused workshops on either biology, water quality, or engineering. Although several participants “floated” between two workshop sessions, most individuals remained in a single workshop group. The discussions that took place in these three groups are summarized below.
A.4 Water Quality Panel Participants. The participants in the Water Quality Panel were Dale M. Robertson (U.S. Geological Survey), Geoff Schladow (University of California, Davis), Chris Holdren (Reclamation), Chris Amrhein (University of California, Riverside), Sujoy.Roy (Tetra Tech), Francisco Costa (California Regional Water Quality Control Board), Rick Gersberg (San Diego State University), Debi Livesay (Torres Martinez Desert Cahuilla Indians), John Chesnut (Agrarian), and Carla Scheidlinger (Agrarian, moderator).
Freshwater Wetlands. The discussion began with an assessment of the potential for using freshwater (as defined by input from the New and Alamo Rivers, as well as

Salton Sea Restoration: Preferred Project Report
A-6
from the drains of the Imperial Irrigation District farms) for supplying shallow habitats. Such habitats were discussed and compared to the wetlands that have been constructed for multiple purposes, including water treatment, along the New River, and which are proposed additionally for the Alamo River. Potential benefits included removal of sediment, nitrogen and phosphorus, as well as reduction of biological oxygen demand (BOD).
Data from the existing New River wetlands at Imperial and Brawley (unpublished data from Imperial Irrigation District, 2003) indicate that about 50 to 70 percent of the total nitrogen is removed from the water as well, although the form in which it is removed varies with the wetland area. Up to 45 percent of total phosphorus was removed in these wetlands, as well as a maximum of 28 percent of the incoming selenium. Almost none of the coliform bacteria remained in the water after passing through the wetlands. Such wetlands can, then, function reasonably effectively for water treatment, and industry standards suggest that treatment efficiencies can be improved in wetlands designed specifically for treatment, rather than for multiple uses including habitat.
Sedimentation basins, however, must be considered separately from wetlands or habitat areas. The sedimentation cells of the New River wetlands removed about 95 percent of the total suspended solids from the water entering the projects. It was agreed in the workshop that any areas that were expected to remove sediments would quickly fill up if they were shallow, and that wetlands should not be expected to double as sediment traps. If the removal of sediment is a goal, then deep sediment retention basins should be implemented upstream of shallow habitat areas. Such basins can be extremely effective at controlling sediment, and should be cost-effective to construct, operate and maintain.
The use of additional shallow freshwater wetlands outside of the river channels for treatment purposes was not generally encouraged. Phosphorus reduction would be more effectively achieved using best management practices (BMP’s) on farms rather than attempting to remove phosphorus in treatment wetlands. In any case, trapping sediment tends to remove about half of the phosphorus anyway, as the phosphorus is deposited with sediment. Although nitrogen removal can be accomplished by treatment wetlands, the Salton Sea is strongly phosphorus limited, so nitrogen removal is less of an issue.
Regarding habitat using freshwater, liabilities arising from the construction of extensive shallow freshwater wetlands included tamarisk infestations and mosquito problems. Overall, however, the show-stopper for freshwater wetlands using the available source water was selenium concentration. Data show that algae in the rivers contain up to 2 mg/kg of selenium, which is at the threshold of concern. Any water used for shallow habitat should contain no more than about 1.5 ppb selenium at the point where it is introduced into the shallow habitat system. This level is somewhat lower than the selenium concentration reported in the river systems. Shallow habitat using freshwater, then, has few benefits and serious liabilities. An exception would be

Appendix A: Shallow Water Habitat
A-7
large, deep ponds for sediment removal which would be managed to discourage use by birds that feed principally on insects.
There was some discussion about constructing shallow habitats with freshwater on exposed sediments of the Salton Sea instead of in the river channels, with the structure and function of rice paddies in the Central Valley proposed as a model. This concept was generally rejected, as the initial water quality that would be used here is characteristic of drainage water rather than of irrigation water, and is high in selenium and organics. Blue-green algae could pose serious odor problems in shallow habitats supplied with such water. If the ponds in this scenario were to be managed for seasonal use, the problems with selenium could become multiplied, as selenium could be mobilized from the sediments each time the areas are re-wetted, causing a spike in selenium concentration in the water, which could prove toxic to the wildlife attracted to the seasonal habitat.
Saline Habitats. The next kind of habitat considered was a saline shallow habitat that would be accomplished by blending Salton Sea water with the river or drain water. The participants were unanimous in their opinion that, in order for such water to comprise high quality habitat, river water would have to be blended with Salton Sea water to a final concentration of lower than 2 ppb selenium. The final salinity or eutrophication level of the water was of little concern; what matters is obtaining a low selenium concentration in the water supply to the shallow habitat. Such a blending scenario was deemed feasible, as the group concluded that it was reasonable to assume that the same selenium removal mechanisms that operate in the Salton Sea now would continue to function in a reduced Sea; that is, the Sea would continue to function as a selenium sink. The preferred scenario, however, was to use the remaining Sea as a selenium filter, and to construct shallow habitat using only water that had been obtained from the Sea itself. Blending, then, would not occur, and habitat would be constructed with salinity levels at or above the salinity of the Salton Sea. Furthermore, any reject water from a desalination plant should be discharged directly to the brine pool, without being passed through the Sea. This would remove some additional selenium from the water that would ultimately be available for habitat.
It was acknowledged that even if the water supplying the shallow habitats were to be introduced at a concentration of less than 2 ppb selenium, the selenium concentration could increase through evaporation. The habitat that would result would be of lower quality, but probably not enough to trigger unacceptable risks. The group offered the opinion that as the selenium concentration would increase, the risk of deformities in birds would also increase. However, the risk in this case is judged to be minimal because of the low selenium concentrations anticipated, and the idea that the risk to a few individuals would be offset by the expanded habitat that would beneficial to many more individuals. It could be envisioned, then, that the effect would be a net benefit
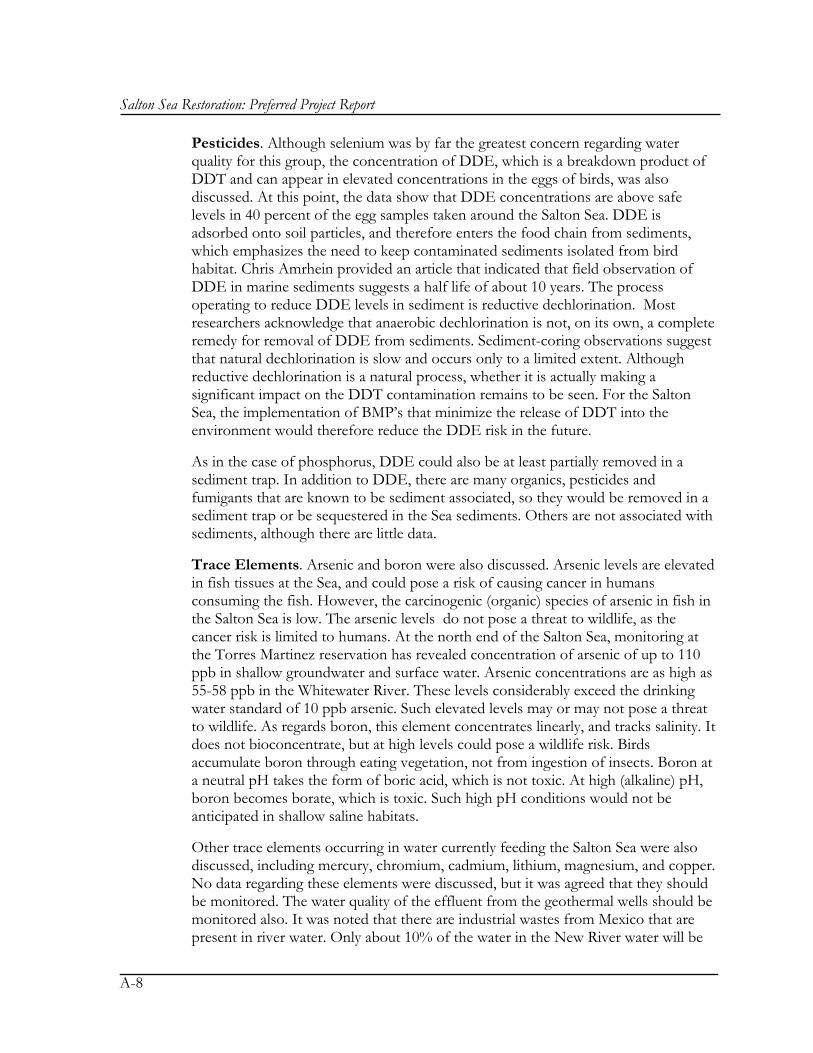
Salton Sea Restoration: Preferred Project Report
A-8
Pesticides. Although selenium was by far the greatest concern regarding water quality for this group, the concentration of DDE, which is a breakdown product of DDT and can appear in elevated concentrations in the eggs of birds, was also discussed. At this point, the data show that DDE concentrations are above safe levels in 40 percent of the egg samples taken around the Salton Sea. DDE is adsorbed onto soil particles, and therefore enters the food chain from sediments, which emphasizes the need to keep contaminated sediments isolated from bird habitat. Chris Amrhein provided an article that indicated that field observation of DDE in marine sediments suggests a half life of about 10 years. The process operating to reduce DDE levels in sediment is reductive dechlorination. Most researchers acknowledge that anaerobic dechlorination is not, on its own, a complete remedy for removal of DDE from sediments. Sediment-coring observations suggest that natural dechlorination is slow and occurs only to a limited extent. Although reductive dechlorination is a natural process, whether it is actually making a significant impact on the DDT contamination remains to be seen. For the Salton Sea, the implementation of BMP’s that minimize the release of DDT into the environment would therefore reduce the DDE risk in the future.
As in the case of phosphorus, DDE could also be at least partially removed in a sediment trap. In addition to DDE, there are many organics, pesticides and fumigants that are known to be sediment associated, so they would be removed in a sediment trap or be sequestered in the Sea sediments. Others are not associated with sediments, although there are little data.
Trace Elements. Arsenic and boron were also discussed. Arsenic levels are elevated in fish tissues at the Sea, and could pose a risk of causing cancer in humans consuming the fish. However, the carcinogenic (organic) species of arsenic in fish in the Salton Sea is low. The arsenic levels do not pose a threat to wildlife, as the cancer risk is limited to humans. At the north end of the Salton Sea, monitoring at the Torres Martinez reservation has revealed concentration of arsenic of up to 110 ppb in shallow groundwater and surface water. Arsenic concentrations are as high as 55-58 ppb in the Whitewater River. These levels considerably exceed the drinking water standard of 10 ppb arsenic. Such elevated levels may or may not pose a threat to wildlife. As regards boron, this element concentrates linearly, and tracks salinity. It does not bioconcentrate, but at high levels could pose a wildlife risk. Birds accumulate boron through eating vegetation, not from ingestion of insects. Boron at a neutral pH takes the form of boric acid, which is not toxic. At high (alkaline) pH, boron becomes borate, which is toxic. Such high pH conditions would not be anticipated in shallow saline habitats.
Other trace elements occurring in water currently feeding the Salton Sea were also discussed, including mercury, chromium, cadmium, lithium, magnesium, and copper. No data regarding these elements were discussed, but it was agreed that they should be monitored. The water quality of the effluent from the geothermal wells should be monitored also. It was noted that there are industrial wastes from Mexico that are present in river water. Only about 10% of the water in the New River water will be
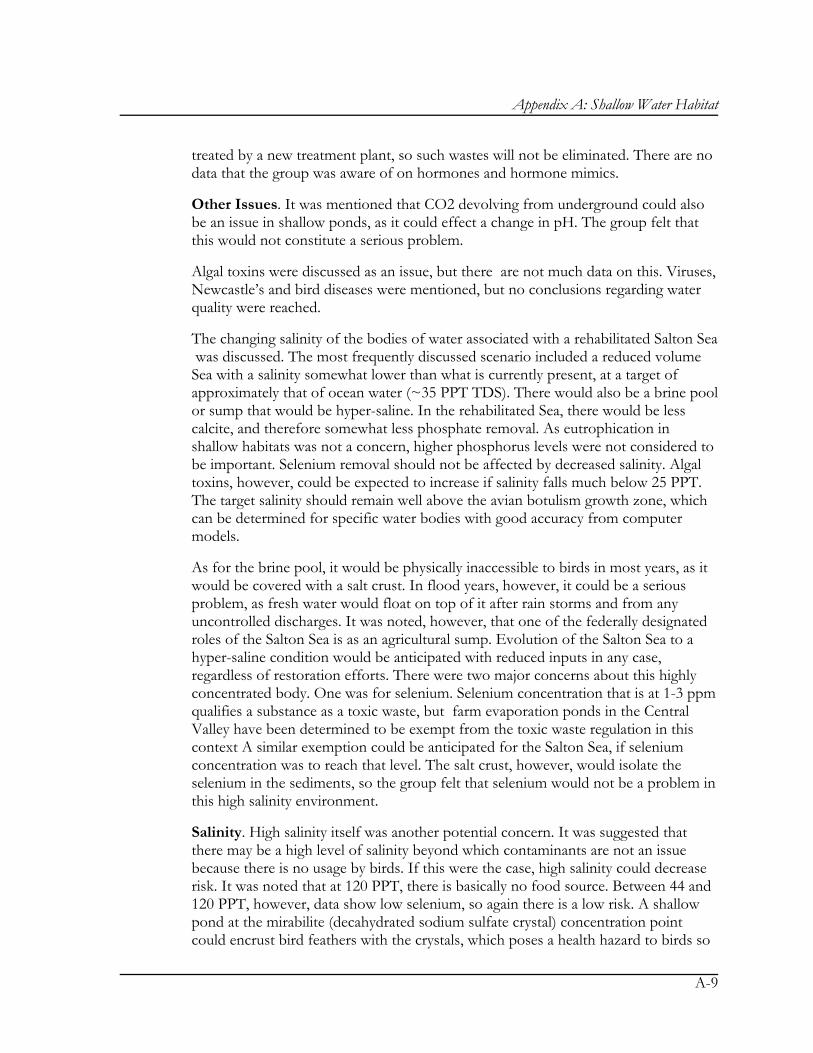
Appendix A: Shallow Water Habitat
A-9
treated by a new treatment plant, so such wastes will not be eliminated. There are no data that the group was aware of on hormones and hormone mimics.
Other Issues. It was mentioned that CO2 devolving from underground could also be an issue in shallow ponds, as it could effect a change in pH. The group felt that this would not constitute a serious problem.
Algal toxins were discussed as an issue, but there are not much data on this. Viruses, Newcastle’s and bird diseases were mentioned, but no conclusions regarding water quality were reached.
The changing salinity of the bodies of water associated with a rehabilitated Salton Sea was discussed. The most frequently discussed scenario included a reduced volume Sea with a salinity somewhat lower than what is currently present, at a target of approximately that of ocean water (~35 PPT TDS). There would also be a brine pool or sump that would be hyper-saline. In the rehabilitated Sea, there would be less calcite, and therefore somewhat less phosphate removal. As eutrophication in shallow habitats was not a concern, higher phosphorus levels were not considered to be important. Selenium removal should not be affected by decreased salinity. Algal toxins, however, could be expected to increase if salinity falls much below 25 PPT. The target salinity should remain well above the avian botulism growth zone, which can be determined for specific water bodies with good accuracy from computer models.
As for the brine pool, it would be physically inaccessible to birds in most years, as it would be covered with a salt crust. In flood years, however, it could be a serious problem, as fresh water would float on top of it after rain storms and from any uncontrolled discharges. It was noted, however, that one of the federally designated roles of the Salton Sea is as an agricultural sump. Evolution of the Salton Sea to a hyper-saline condition would be anticipated with reduced inputs in any case, regardless of restoration efforts. There were two major concerns about this highly concentrated body. One was for selenium. Selenium concentration that is at 1-3 ppm qualifies a substance as a toxic waste, but farm evaporation ponds in the Central Valley have been determined to be exempt from the toxic waste regulation in this context A similar exemption could be anticipated for the Salton Sea, if selenium concentration was to reach that level. The salt crust, however, would isolate the selenium in the sediments, so the group felt that selenium would not be a problem in this high salinity environment.
Salinity. High salinity itself was another potential concern. It was suggested that there may be a high level of salinity beyond which contaminants are not an issue because there is no usage by birds. If this were the case, high salinity could decrease risk. It was noted that at 120 PPT, there is basically no food source. Between 44 and 120 PPT, however, data show low selenium, so again there is a low risk. A shallow pond at the mirabilite (decahydrated sodium sulfate crystal) concentration point could encrust bird feathers with the crystals, which poses a health hazard to birds so

Salton Sea Restoration: Preferred Project Report
A-10
affected. Brine concentration data show that at 60 �F the mirabilite concentration point is at about 100 PPT, so brines of that concentration could be discharged to the brine pool and get absorbed into the brine. It was also noted that in the shallow habitat scenarios discussed, there would be ample high quality habitat for the birds to escape to, where they could both clean their feathers from salts, and obtain food uncontaminated with selenium.
Habitat Acreage Estimates. A preliminary water balance calculated for the reduced Sea scenario indicated that there would be a requirement of discharging about 40,000 Acre-feet/year from the reduced Sea in order to maintain stable salinity. With such a discharge, approximately 8,000 acres of saline shallow habitat could be created. As this water is flushed to higher salinity ponds downslope, additional shallow habitat at a higher concentration could be obtained.
A.5 Biology Panel Participants. The participants in the Biology Panel were John Y. Takekawa (US Geological Survey), Carol A. Roberts (U.S. Fish and Wildlife Service), Rick Soehren (California Department of Water Resources), Mark Rigby (Tetra Tech), Dan Cooper (Audubon California), Kathy Molina (Natural History Museum of Los Angeles County), Chuck Henny (USGS - Biological Resources Division), and Doug Barnum (Salton Sea Science Office and USGS, moderator).
Approach. The approach taken by the participants in the biology workshop was to consider various habitats and then discuss them according to usage by birds based on whether they were breeding or migratory, the guild or foraging type they represent, and whether or not they are state or federally listed species.
The group then discussed various habitats that are currently present at the Salton Sea, or which would be created under conditions of a declining Sea level or as part of the restoration scenarios.
Estuarine habitat, which is the fresh/salt mixing zone, is not expected to be a significant area under these scenarios.
Flooded agricultural fields (with fresh water) provide breeding habitat, but not nesting or foraging opportunities, for gull-billed terns. Non-breeding birds that would use this habitat include ibis, large waders, snow geese, curlew, gulls, shorebirds, waterfowl, and northern harrier hawks. Various roosting birds would also be expected to forage here.
Riparian zones of native vegetation (mesquite) were distinguished as a unique habitat, which also contain saltbush species and arrowweed. This habitat provides breeding grounds for resident desert bird species such as roadrunners, Gambel’s quail, and blacktailed gnatcatchers. Non –breeding migrants such as Wilson’s warbler would also utilize this habitat.

Appendix A: Shallow Water Habitat
A-11
Riparian zones of tamarisk provide breeding habitat for cattle egrets, and foraging habitat for non-breeding migrant passerines, especially in the river channels that support the growth of Phragmites.
Earthen channels are important breeding areas for burrowing owls and large wading birds.
Typha marshes, which include standing water that is reasonably fresh comprise habitat for the endangered Yuma clapper rail, as well as for the least bittern, ibis, breeding waders, and breeding waterfowl including the fulvous whistling duck and wintering dabblers.
Salt pans support breeding snowy plovers, stilts, avocets, and wintering savannah sparrows.
Drain influenced lagoons and lagoon overwash areas are habitat for cormorants and roosting birds.
Mudflats, regardless of whether they are within impoundments or not, and regardless of salinity structure, do not provide breeding habitat, but are foraging locations for non-breeding and migrant gulls, waterfowl, shorebirds, a variety of sensitive species, waders, and roosting birds.
Shallow Water Habitat. The discussion then turned to specifically shallow water habitats. “Shallow” was defined as having a maximum depth of three feet, with an average depth of less than one foot. Anything deeper was classed as “deep marine” if it is saline.
Shallow freshwater habitat at the mouths of rivers and drains may include islands that are surrounded on all sides by water, and often feature snags and levees that provide habitat diversity and structure. This habitat could be termed mixosaline brackish, with a salinity of 5-30 PPT.
Salinity Regimes. Additional salinity regimes are overlain on habitat types, and the major impact of salinity changes is on invertebrate populations. That is, salinity is the key habitat modifier, and varies from low salinity to hyper-saline. Assuming that the shallow habitats proposed for development have their lowest salinity at approximately ocean water levels (which is proposed in several of the restoration scenarios), there were three salinity classes identified. In waters of 35-70 PPT TDS, both fish and a variety of invertebrates would be present. For waters between 70-150 PPT TDS, there would be selected invertebrates only. At salinity greater than 150 PPT TDS, micro-invertebrates would be excluded.
Shallow Water Habitat Siting Considerations. Siting considerations for shallow habitats were then considered. It was noted that for breeding birds, the broods need to have access to sources of fresh water, so some habitat heterogeneity is required.

Salton Sea Restoration: Preferred Project Report
A-12
At the least, constructed saline habitats should be near existing fresh water sources such as rivers or drains. Other siting considerations were:
• Develop shallow habitats within areas of shallow slope, which are conducive to maximum water distribution. This is perhaps the most important consideration in order to maximize the amount of habitat that can be created
• Proximity to agricultural lands is important for ibis, curlew, egrets, and gull-billed terns
• Proximity to existing refuges and/or Department of Fish and Game lands is desirable to maximize contiguous habitat opportunity. This requirement suggests that the constructed habitats should be as close to the current shoreline as possible
• Proximity to existing and/or potential breeding areas is important to assure that there is habitat available for use by broods
Conclusions. A summary of the general conclusions of this workshop group is that no single habitat type will be optimal for all species. Taking species of special concern (i.e., listed species) into account first will guide decisions about what habitats can be developed or protected for the benefit of these species. It may be that protection of existing habitat best addresses many of these species, such as maintaining Typha wetlands for Yuma clapper rails, or agricultural drains for burrowing owls. Given that the habitats under discussion were shallow water, it was suggested that siting considerations are more important than determining salinity gradients, as such considerations will determine how to optimize both total area and take advantage of synergistic interactions with nearby or adjacent habitats. Finally, as salinity increases, biological diversity in the shallow habitats decreases, although total biomass of food items may remain high.
The group wanted to acquire photos of each species of concern, and suggested consulting Birds of the Salton Sea and the text Cowardin’s Wetland and Deepwater Habitats (Cowardin et al. 1979).
A.6 Engineering Panel Participants. The participants in the Engineering Panel were Leo Handfelt (URS), Ted Schade (Great Basin Unified Air Pollution Control District), Cheryl Rodriquez (Reclamation), John Vrymoed (California Department of Water Resources), Frank Stradling (Agrarian), and Bill Brownlie (Tetra Tech, moderator).
Approach. This group began by coming to agreement on which types of structures were to be considered, developing definitions for those structures, and identifying issues and areas of inquiry that would be required in order to develop specifications and costs for infrastructure and O&M elements.

Appendix A: Shallow Water Habitat
A-13
Infrastructure Elements. There were three infrastructure elements discussed: berms, dikes, and levees. Berms were defined as earthen structures less than three feet above the original ground level, with a top width of two to five feet, and with side slopes varying from 3:1 if they are vegetated, to 7:1 if they are not. No slope protection other than potentially vegetation would be associated with a berm. A berm would not support vehicular traffic, although it may or may not be compacted. The purpose of a berm is to control and advance sheet flows of water. Berms enjoy the lowest level of design standards, as they are not constructed to retain much standing water.
Dikes were defined as earthen structures less than 10 feet above the original ground level, with a top width of about 12 feet, with some turnouts included. Side slopes would typically be between 4:1 and 6:1, although further stability analysis was suggested to develop a firmer slope requirement. Slope protection could be vegetation, rock, or a flatter side slope to prevent accelerated erosion. A dike would support vehicular traffic, and would preferably be compacted, and generally capped. It may or may not be keyed into the parent material, depending on the site. The purpose of a dike is to impound and contain shallow water, of a depth of five feet or less. Dikes are not, however, jurisdictional dams.
Levees were defined as earthen structures more than 10 feet above the original ground surface, with a top width of 20 to 30 feet, and with side slopes of 6:1 or flatter. Slope protection would be with rock revetment. Levees are generally compacted, would be capped, and would support vehicular traffic. They may or may not be keyed into the parent material, depending on the site requirements. The purpose of a levee is the retention of water that is deeper than five feet. As such, it may or may not be a jurisdiction al dam.
Construction Issues. There are certain challenges associated with construction of such infrastructures in the sediments of the Salton Sea. Foundation support is of primary importance. Construction would need to be on fat clays, and could take place in shallow water or fully saturated soils. The structures would be constructed of native materials, which would be removed and placed using an excavator walking on mats. The material thus bailed up would need to be allowed to dry, after which it could be compacted. Grid-type geosynthetic mats could possibly be used to help stabilize embankments where soft sediments used in the construction.
Seismic issues are a concern as well. When the structures are designed, articulation of an acceptable level of damage that the structure could be allowed to sustain during a seismic event should be made, and an acceptable cost of repairs for that damage. The most common form of seismic damage is anticipated to be cracking, which can be largely avoided by compaction during construction.
There are certain limitations that will be faced in constructing these infrastructure elements. Cost is a primary consideration. Different foundation conditions may dictate construction methods and specifications that dramatically affect total cost.

Salton Sea Restoration: Preferred Project Report
A-14
Water is another consideration, as construction in shallow water may require alternative methods such as dredging. For the shallow habitats proposed in the restoration scenarios, a salinity break between the habitats and a salt crust developed for dust control must be anticipated, and the structural implications of that break taken into consideration. Finally, there may be a need to evaluate existing construction methods and develop modified or novel alternatives to assure that the methods produce competent structures.
The group discussed what available specification guidelines should be used for these infrastructures in this setting. It was decided to review the applicability of National Resource Conservation Service (NRCS) specifications for berms, dikes, and levees. These specifications were developed for use in agriculture, with assumptions of low cost and minor consequences resulting from damage or failure. Use of such specifications could substantially reduce the construction cost of developing shallow habitats.
The group raised the question of any critical data sets that are needed in order to proceed with detailed shallow habitat designs. The following issues were identified:
• Careful analysis of unit costs. Depending on the specifications adopted, costs could be quite variable for these infrastructure elements. Determination of the most appropriate specifications and thorough evaluation of costs is important.
• Native material vs. imports. Some materials may not be suitable for the sustainable development of infrastructures for shallow habitat. If site evaluations dictate that imported material is required, the costs associated with such materials should be evaluated.
• Seismic response analysis. The Salton Sea is in an active seismic zone. The infrastructure elements developed according to the selected specifications should be evaluated to determine the degree of vulnerability that they would have to seismic activity.
• Cost Factors/Considerations. Selecting the criteria against which costs will be evaluated remains to be done.
• Low risk of failure vs. higher O&M costs. Infrastructure elements constructed with low initial costs may prove to be more vulnerable to damage or failure. Maintenance costs associated with such structures, and the reliability of the structures must be evaluated in terms of costs and benefits associated with any construction specification. It may be most cost effective to build simple low cost berms and pay for O&M later if they get damageds.
Conclusions. In summary, this workshop group examined three infrastructure elements that would be associated with the development of shallow habitat, and

Appendix A: Shallow Water Habitat
A-15
proposed questions and concerns associated with their construction and maintenance. In general, it was agreed that low cost infrastructures designed according to specifications such as those developed by the NRCS deserved evaluation, as this could keep initial costs for a project low. Site specific considerations will have to be thoroughly evaluated to determine the benefits and costs of implementing such specifications, given variable parent material and seismic risk. Low initial costs may imply higher maintenance costs, but this balance may prove to provide a lower cost project overall.
A.7 Workshop Summary Each panel presented a summary of its discussion to the group at large at the conclusion of the workshop. The general conclusions can be summarized as follows:
• Shallow habitats should be developed using Salton Sea water rather than water from rivers or drains due to selenium concerns. Shallow water impoundments that begin with water containing more than 2 ppb selenium should be discouraged.
• Shallow habitats should be sited where they take optimum advantage of shallow slopes, of proximity to existing reserves or habitats, and of proximity to agricultural fields, as these siting considerations give the developed habitats their highest value.
• The salinity of the habitats is of minor concern, as any waters between about 30 and 150 PPT TDS will provide foraging value to a variety of birds. If environments including brine at the saturation level for salts are present, however, proximity to lower salinity habitats is important. Salinity targets should be out of the range for avian botulism.
• Selenium is the most important water quality concern, although data on DDE should be carefully considered as well.
• Eutrophication levels for the shallow habitats is not a concern.
• Construction of the shallow habitats could utilize structures developed with low-cost agricultural specifications, subject to site-specific and risk assessment review.
• There were no “data gaps” that were suggested as being critical to moving forward with designing a preferred alternative, except the cost development for infrastructure and construction.

Salton Sea Restoration: Preferred Project Report
A-16
A.8 Alternatives Considered Shallow habitat configurations that could be associated with five possible restoration alternatives for the Salton Sea are discussed in the following paragraphs. These alternatives are briefly described here, with note being made of the habitats that would be associated with each.
South Marine Lake without Elevation Control This alternative would involve construction of a low barrier across the middle of the Sea, thus creating two distinct bodies of water. The South portion of the Sea would be fresher, as it would be fed directly from the New and Alamo Rivers. The North portion of the Sea would become hyper-saline. There would be minimum elevation difference between the two bodies of water, but their habitat characteristics would be different. A conceptual plan for this alternative is provided in Figure A-1.
The conceptual plan for this alternative has conveyance channels that provide water for constructed habitats along the margins of the shrinking Sea. One conveyance channel would originate in a forebay at the Alamo River and would run from south to north along the east edge of the Sea. Sea water would be blended into this channel for the purpose of providing brackish water to constructed habitats. Another conveyance channel would run from south to the north originating with water pumped from the south portion of the Sea into the channel.
There would be several kinds of constructed habitats associated with this alternative. The channel on the east side of the Sea would deliver water to saltgrass and waterfowl habitats, and would also supply a recreational pool at Bombay Beach. The channel on the west side, which would consist of fresh water blended with Sea water pumped from the South portion of the Sea, would supply additional saltgrass and waterfowl habitat areas. It would also provide water for a recreational pool at Salton City. The west channel could double as pupfish connectivity habitat as well. Additional flooded saltgrass stands would be present at the north, provided with water blended from the west conveyance channel and water from the Whitewater River. Saline waterfowl habitat at the north end would be supplied from the same blended water, arriving in the channels from both the east and the west. The outflow from all habitat types would be used to create solar salt concentrators and crystallizers downslope of the saline habitats.
The conceptual plan for this alternative includes freshwater habitat in the forebays only, with short lengths of freshwater channels. There would be at least three pump stations required. One would be north of the Alamo River to supply the channels flowing north to Bombay Beach and south to the saltgrass and waterfowl habitats. A blending station would be required at both the New and Alamo Rivers to blend saline and river waters for the channels. Another pump would be at Niland, to augment flows to the north end of the Sea. The third would be near Salton City, to
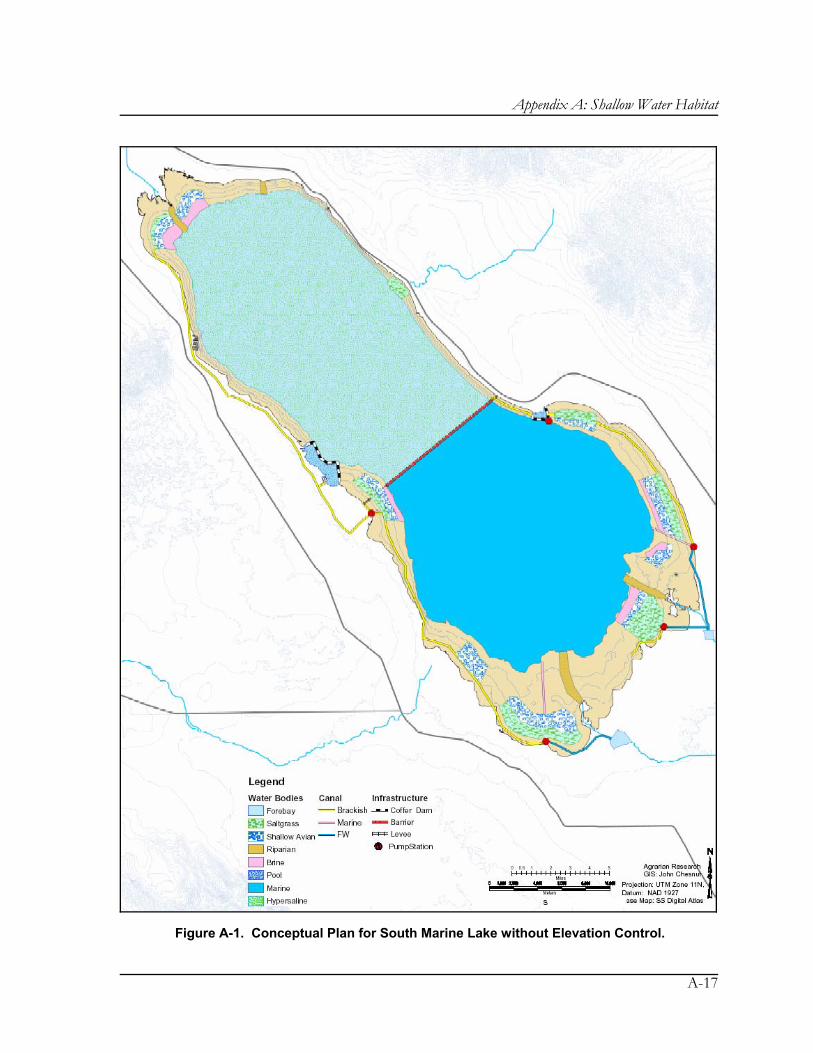
Appendix A: Shallow Water Habitat
A-17
Figure A-1. Conceptual Plan for South Marine Lake without Elevation Control.

Salton Sea Restoration: Preferred Project Report
A-18
provide additional water to the channel and recreational pool on the west shore. A low mid-Sea barrier would also be required.
South Marine Lake with Elevation Control This alternative would require a retention structure across the middle of the Sea, dividing it into two parts. There would be a large lake maintained at a stable elevation at about ocean water salinity (35 PPT) at the south end of the current Sea. This south lake would be discharged to conveyance channels for habitat development, thus maintaining a stable salinity. The North Basin would dry to a crystal body and salt flats. A conceptual plan for this alternative is provided in Figure A-2.
The Alternative requires conveyance channels that need to run in two directions. One conveyance channel runs along the west edge of the south lake from south to north, carrying water from forebays constructed on the New and Alamo Rivers to the north basin, to prevent increasing freshening of the South Sea. Thus, the New and Alamo Rivers both feed the South Sea directly, and supply water for habitat to be constructed at the west and north edges of the north basin. There are also conveyance channels on the west shore of the south basin that originate in the south lake and flow to the north, and have a salinity level the same as that of the lake. These channels serve as required discharge from the south lake, and also provide water for constructed habitat when blended with the freshwater river channels.
The exposed edges of the west and north end of the Sea would include constructed habitats using a blend of water from the New, Alamo, and Whitewater Rivers, and from the discharge from the south lake. The channels originating from both the southern rivers and from the south lake (after blending in both) would supply brackish water to flooded saltgrass stands that would be created on exposed areas of the north basin. Saline waterfowl habitats would be constructed as well at the northern margins of the Sea. Outflows from the waterfowl habitat and saltgrass habitats would be discharged to concentrator ponds downslope, where they can either form salt beds or be recycled for blending to assure adequate salt concentrations for the habitats.
The channel originating from the south lake could double as pupfish connectivity habitat, as it would allow the fish to migrate from one watercourse to another. A recreational pool would be formed offshore of Salton City, consisting of water blended from both the freshwater channel and the south lake, resulting in higher salinity water. A crystal body and salt flat would result from the shrinking Sea in the north basin.
The only freshwater habitat in this scenario is in the east channel and in the forebays of the rivers. Minimal pumping is required for blending of channel water to assure brackish concentrations for habitat. A mid-Sea dam is required.

Appendix A: Shallow Water Habitat
A-19
Figure A-2. Conceptual Plan for South Marine Lake with Elevation Control.

Salton Sea Restoration: Preferred Project Report
A-20
North Marine Lake with Elevation Control This alternative would require a retention structure across the middle of the Sea, dividing it into two parts. There would be a large lake maintained at a stable elevation at about ocean water salinity (35 PPT) at the north end of the current Sea. This Lake would be discharged to conveyance channels for habitat development, thus maintaining a stable salinity. The South Basin would dry to a crystal body and salt flats. A conceptual plan for this alternative is provided in Figure A-3.
This conceptual plan for this alternative includes conveyance channels that need to run in two directions: from the south to feed the north lake with water from the New and Alamo Rivers, and from the north to provide discharge from the north lake to maintain elevation and salinity. Channels from the south to the north along the east shore of the Sea would consist of fresh water originating in forebays constructed on the Alamo and New Rivers. These forebays would give sufficient head to flow the water as far north as the mid-Sea dam, where sufficient water would be discharged to the north lake to maintain salinity and elevation. The remainder of the water would contribute to habitat or to recreational pools. The conveyance channels on the west shore of the south basin originate in the north lake, and have a salinity level the same as that of the lake.
The exposed edges of the south end of the Sea would include constructed habitats using a blend of water from the New and Alamo Rivers, and from the discharge from the
The channels originating from both the southern rivers and from the north lake (after blending in both) would supply brackish water to flooded saltgrass stands that would be created adjacent to the delta areas of the New and Alamo Rivers. Saline waterfowl habitats would be constructed as well at the southwest margin of the Sea. Outflows from the waterfowl habitat and saltgrass habitats would be discharged to concentrator ponds downslope, where they can either form salt beds or be recycled for blending to assure adequate salt concentrations for the habitats. The west channel originating from the north lake could double as pupfish connectivity habitat, as it would allow the fish to migrate from one watercourse to another. A recreational pool would be formed offshore of Bombay Beach, consisting of water blended from both the freshwater channel and the north lake, resulting in higher salinity water. A crystal body and salt flat would result from the shrinking Sea in the south basin.
The only freshwater habitat for this scenario would be located in the east channel and in the forebays. No extensive pumping is required, except for blending for channel water to assure a brackish supply for the habitats.

Appendix A: Shallow Water Habitat
A-21
Figure A-3. Conceptual Plan for North Marine Lake with Elevation Control.

Salton Sea Restoration: Preferred Project Report
A-22
No Marine Lake (No Marine Fishery) Two options are considered for the alternative where a marine fishery is not maintained. For the first option, pumping features would be included to provide brine from the residual Sea and blend it with fresh water to create shallow salt water habitat. For the second option, pumping systems would not be included. Conceptual plans for the pumping and no-pumping options are provided in Figures A-4 and A-5, respectively.
With Brine Pumping. This option provides for a single body of the Sea, with elevation declining by about 30 feet. The main body of the Sea would be hyper-saline, with a potential salinity of about 160 PPT. Constructed habitats would be developed along the exposed margins of the Sea using water delivered from conveyance channels.
This option would include two forebays to capture and build head with New and Alamo River water. There would also be two afterbays which would function as blending stations, receiving water from the conveyance channels delivered from the rivers, and blending it with water from the Sea, which would be delivered via a dredged channel and lifted into the afterbay with a pump. The resulting water would be at about 35 PPT, but any salinity level could be targeted. The blended water would then go into two major conveyance channels, one flowing along the east border of the Sea and the other along the west. These channels would supply constructed habitats.
The west channel could double as pupfish connectivity habitat. Discharges from the channels south of Niland and south of Salton City would form flooded saltgrass habitat, and saline waterfowl habitat. Widening of the channels at coastal communities, including Bombay Beach and Salton City would create recreational pools to a depth of a maximum of 30 feet. The east channel would terminate in such a pool at Bombay Beach, and the west channel would continue to the north end of the Sea. At the north end of the Sea, there would be additional waterfowl habitat supplied with water from the Whitewater River and the channel. Discharge from the areas of waterfowl habitat would form solar concentrators and crystallizers terminating in salt bodies at the north end of the Sea. Discharge from the shallow habitats at the southeast and southwest end would form several deep marine habitats with a salinity that could be blended to attain about that of ocean water (35 PPT) as habitat for pelicans and other fish-eating birds.
This option has freshwater habitat only at the two forebays on the New and Alamo Rivers, and in short segments of conveyance channels between the forebays and the blending stations. It would require several pump stations for blending. The only barriers required would be coffer dams for the deep marine habitats at the south area of the Sea, and the recreational pools at the shoreline communities.
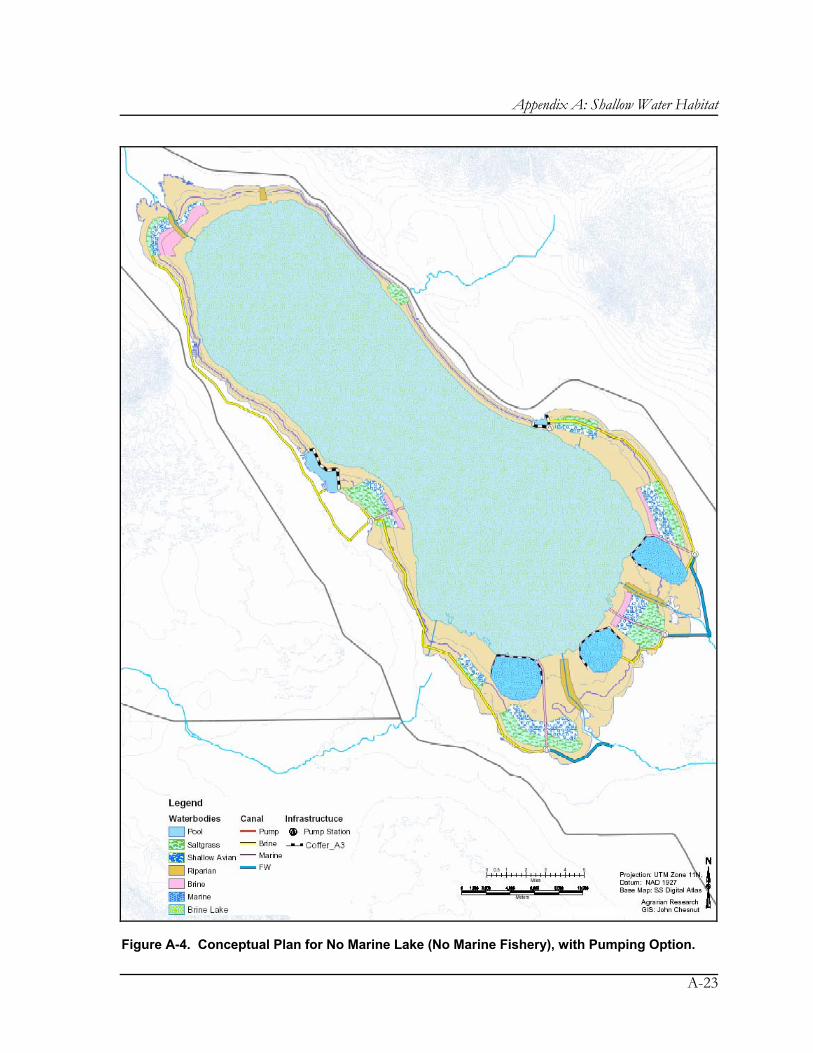
Appendix A: Shallow Water Habitat
A-23
Figure A-4. Conceptual Plan for No Marine Lake (No Marine Fishery), with Pumping Option.

Salton Sea Restoration: Preferred Project Report
A-24
Figure A-5. Conceptual Plan for No Marine Lake (No Marine Fishery), without Pumping Option.
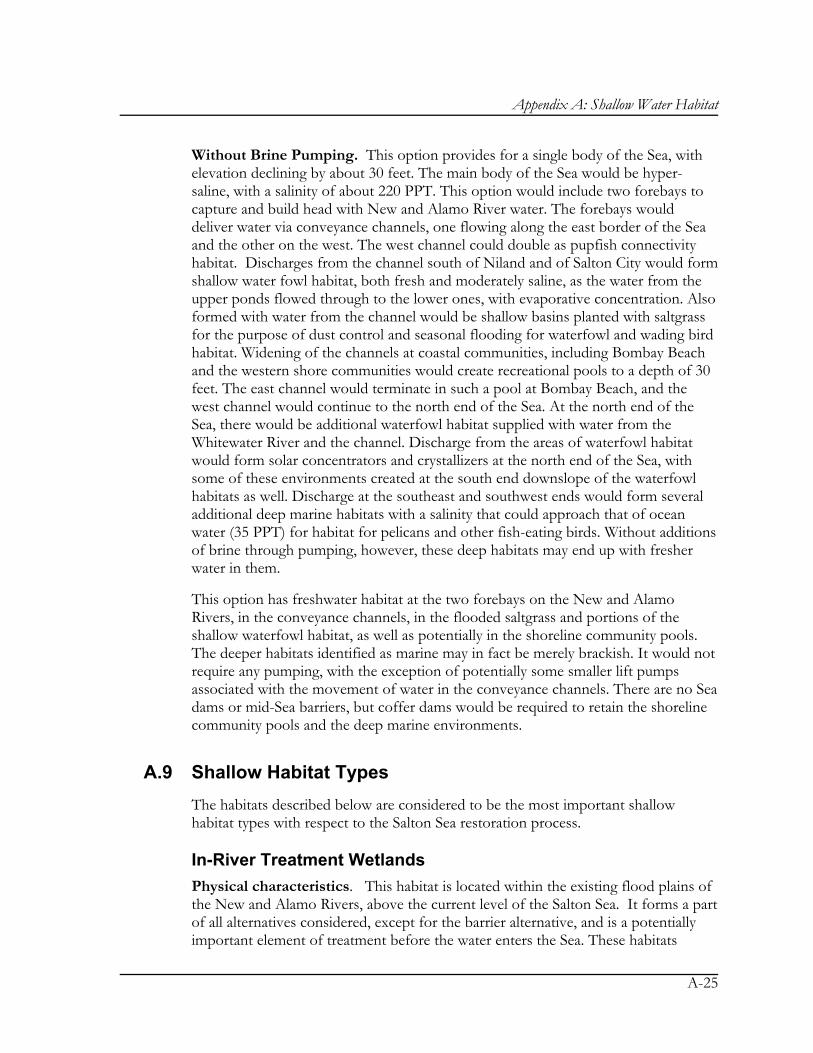
Appendix A: Shallow Water Habitat
A-25
Without Brine Pumping. This option provides for a single body of the Sea, with elevation declining by about 30 feet. The main body of the Sea would be hyper-saline, with a salinity of about 220 PPT. This option would include two forebays to capture and build head with New and Alamo River water. The forebays would deliver water via conveyance channels, one flowing along the east border of the Sea and the other on the west. The west channel could double as pupfish connectivity habitat. Discharges from the channel south of Niland and of Salton City would form shallow water fowl habitat, both fresh and moderately saline, as the water from the upper ponds flowed through to the lower ones, with evaporative concentration. Also formed with water from the channel would be shallow basins planted with saltgrass for the purpose of dust control and seasonal flooding for waterfowl and wading bird habitat. Widening of the channels at coastal communities, including Bombay Beach and the western shore communities would create recreational pools to a depth of 30 feet. The east channel would terminate in such a pool at Bombay Beach, and the west channel would continue to the north end of the Sea. At the north end of the Sea, there would be additional waterfowl habitat supplied with water from the Whitewater River and the channel. Discharge from the areas of waterfowl habitat would form solar concentrators and crystallizers at the north end of the Sea, with some of these environments created at the south end downslope of the waterfowl habitats as well. Discharge at the southeast and southwest ends would form several additional deep marine habitats with a salinity that could approach that of ocean water (35 PPT) for habitat for pelicans and other fish-eating birds. Without additions of brine through pumping, however, these deep habitats may end up with fresher water in them.
This option has freshwater habitat at the two forebays on the New and Alamo Rivers, in the conveyance channels, in the flooded saltgrass and portions of the shallow waterfowl habitat, as well as potentially in the shoreline community pools. The deeper habitats identified as marine may in fact be merely brackish. It would not require any pumping, with the exception of potentially some smaller lift pumps associated with the movement of water in the conveyance channels. There are no Sea dams or mid-Sea barriers, but coffer dams would be required to retain the shoreline community pools and the deep marine environments.
A.9 Shallow Habitat Types The habitats described below are considered to be the most important shallow habitat types with respect to the Salton Sea restoration process.
In-River Treatment Wetlands Physical characteristics. This habitat is located within the existing flood plains of the New and Alamo Rivers, above the current level of the Salton Sea. It forms a part of all alternatives considered, except for the barrier alternative, and is a potentially important element of treatment before the water enters the Sea. These habitats

Salton Sea Restoration: Preferred Project Report
A-26
would occur at an elevation of –200 to –205 feet, above the current shoreline of the Sea. They are supplied with water from either the New or the Alamo Rivers. The ponds are constructed on the floodplains, and vary in depth from 0.5 to 10 feet. The water is fresh, varying from about 2.5 to 5 PPT TDS. Suspended solids in the water are low, being removed by the sedimentation cells at the intake to the wetland systems. Nutrient content is medium, as the wetlands remove some amount of nutrients, especially nitrogen. The degree of eutrophication, then, is medium. . Selenium concentration is medium (6-15 ppb), as selenium is not removed efficiently by the wetlands and can concentrate evaporatively. The evaporation rate in these ponds would be the same as that of fresh water (5.6 feet per year), and the water would remain in any given pond for about 3-5 days, depending on season. Wind fetch across the ponds would be of very short length, and the ponds would in general border on streambank riparian habitat, either of native species such as mesquite, or of introduced species such as tamarisk.
Biological characteristics. This habitat would be rich in life forms, harboring bacteria, algae, and higher plants. The invertebrates present would be those characteristic of freshwater environments, as would the fish. Birds attracted to this area would be riparian birds and waterfowl, a well as wading birds which feed on the invertebrates and fish found in the freshwater environment.
Function of the habitat type. These ponds would provide foraging, resting, and nesting habitat for waterfowl and wading birds, and contribute to the richness of the riparian environment. Properly designed for the functions of water treatment, they may remove much of the suspended solids (up to 98 percent) and perhaps 50 to 70 percent of the nitrogen.
Environmental quality. The overall environmental quality of this habitat, if it is indeed constructed for the purpose of water treatment, is judged to be poor. Specifics of the environmental benefits and liabilities were discussed in the workshop. It is not recommended to construct large areas of this habitat type, due to selenium concerns.
Conveyance Channels Physical characteristics. This habitat is located as a narrow band above the current level of the Salton Sea, moving along the contours above the current shoreline of the Sea at about –205 to –225 feet. It forms a part of all scenarios considered, and is a critical component of all scenarios, as it delivers water to a variety of other habitats. The conveyance channels may be either freshwater or moderately saline, depending on the scenario considered. They are supplied with water from either the New and/or Alamo Rivers, or from a blending facility that would mix river waters with brine from the Sea itself.
For the South Marine Lake without Elevation Control there is a freshwater conveyance channel that would originate from the Alamo River and would run from south to north along the east edge of the Sea, delivering water to a recreational pool

Appendix A: Shallow Water Habitat
A-27
at Bombay Beach. Additional Sea water could also be blended into this channel for the remainder of the distance to the north end of the Sea, creating a moderately saline environment. Another conveyance channel would run from south to north originating with water pumped from the north portion of the Sea into the channel. This channel would provide recreational pools at Salton City, Desert Shores, and other locations, consisting of saline water.
In the South Lake with Elevation Control Alternative, there is one conveyance channel that runs along the east edge from south to north, carrying water from the rivers to the north basin, to prevent increasing freshening of the South Sea. In addition, there is another conveyance channel running along the west edge from south to north carrying South Sea water at 35 PPT. The west channel supplies recreational pools at Salton City and the Desert Shores area.
In the North Marine Lake with Elevation Control Alternative, the channels originating in the south from the rivers are freshwater, and flow to the east of the Sea. The conveyance channels originating from the north lake are the salinity of ocean water, and flow south on the west side of the Sea.
For the No Marine Lake Alternative with Pumping Option, water would be blended from the rivers with Sea water pumped into an afterbay. The resulting water would be at about 35 PPT, but any salinity level could be targeted. The blended water would then go into two conveyance channels, one flowing along the east border of the Sea and the other on the west. The west channel could double as pupfish connectivity habitat.
For the No Marine Lake with No Pumping Option, there would be two freshwater conveyance channels originating in the rivers, one flowing north along the east border of the Sea and the other flowing north on the west. The west channel could double as pupfish connectivity habitat. The east channel would terminate in a recreational pool at Bombay Beach, and the west channel would continue to the north end of the Sea.
The channels in all alternatives are constructed more or less on contour, and are located outside the current shoreline, with a depth of 3 to 10 feet. If fresh, the water varies from about 2.5 to 10 PPT TDS. If saline, the water may be between 20-40 PPT TDS. Freshwater channels could have high levels of suspended solids, but there would be very little TSS in the saline channels, as the sediment would have been deposited in the Sea. Nutrient content would be medium in the freshwater systems, as some nutrients would have been removed by treatment wetlands. Nutrient content would be low in saline channels. The degree of eutrophication, is medium. Selenium concentration is medium (6-15 ppb). If the water is blended, selenium concentration could be lower, as selenium is sequestered in Sea sediments. The evaporation rate in these channels would be the same as that of fresh water (5.6 feet per year), and the water would remain in any given portion of a channel for about 1-5 seconds, depending on flow rate. Wind fetch across the channels would be of very short

Salton Sea Restoration: Preferred Project Report
A-28
length, and the channels would in general border on streambank riparian habitat or on other upland habitat unassociated with the restoration scenarios..
Biological characteristics. This habitat would be rich in life forms, harboring bacteria, algae, and higher plants along the edges. The invertebrates present would be those characteristic of freshwater to saline environments, depending on the water source, as would the fish. Birds attracted to this area would be riparian birds and waterfowl, as well as wading birds and fisheating birds which feed on the invertebrates and fish found in the various waters.
Function of the habitat type. These channels function as conveyance of water to other habitat types, and are not designed to be habitat components in and of themselves. They will, however, have a generally riparian character, with water quality depending on source and development alternative.
Environmental quality. The overall environmental quality of this habitat ranges from good, if the water is saline, to poor if it is fresh. This habitat was not specifically discussed in the workshop, and may need some consideration. If wetlands associated with the channels are proposed, they should be minimal in size due to selenium concerns. Including sedimentation basins or traps before the water is discharged to the conveyance channels is highly recommended as a method of sequestering phosphorus and possibly DDE in addition to the sediment.
Flooded Saltgrass Physical characteristics. This habitat is located near the shoreline and farther down in the basin, and is included in all restoration alternatives. The habitat would occur at elevations of about –220 to –240 feet, inside the margins of the current Sea. It is supplied with water in a variety of ways, making the habitat consist either of freshwater, or of moderately saline waters (between 2.5 and 15 PPT TDS). The habitat consists of shallow ponds constructed more or less on contour on exposed sediments or near-shore upland areas. Pond depth varies from 0.5 to 3 feet.
In the South Marine Lake without Elevation Control Alternative, flooded saltgrass stands would be present at the north, provided with water blended from the west conveyance channel and water from the Whitewater River. Additional saltgrass stands would be at the southwest edge of the Sea, provided with water blended from water pumped from the south Seaand mixed with water from the New River. All of these stands would be of moderately saline water.
In the South Marine Lake with Elevation Control Alternative, flooded saltgrass habitat is provided at the north end of the Sea with blended water from the Whitewater River and the South Sea as delivered in the channels, so the water quality could be up to about 15 PPT.

Appendix A: Shallow Water Habitat
A-29
In the North Marine Lake with Elevation Control Alternative, flooded saltgrass plant substrate would be created at the delta areas of the New and Alamo Rivers, as freshwater habitats using river water.
In the No Marine Lake Alternative with Pumping Option, discharges from the channel south of Niland and of Salton City would form flooded saltgrass habitat, using blended water from the rivers and the Sea, for a moderately saline environment. In the No Marine Lake Alternative with No Pumping Option, flooded saltgrass would be provided with water from freshwater conveyance channels from the New and Alamo Rivers.
Suspended solids in the water are very low, as is the nutrient content, both being removed by physical and biological action in these ponds themselves. Eutrophication is therefore also low. Selenium concentration is medium (6-15 ppb), as it is not removed by the ponds themselves. If the water is blended with Sea water, selenium concentrations could be lower. The evaporation rate in these ponds would be about that of fresh water (5.6 feet per year), and the water would remain in any given pond for about 4-120 hours (5 days), depending on season and management practices. Wind fetch across the ponds would be of short length, and the ponds would in general border on similar habitat or other forms of waterfowl habitat, including wildlife sanctuaries.
Biological characteristics. This habitat would probably be rich in life, harboring bacteria, algae, and higher plants. The invertebrates present would be those characteristic of freshwater or moderately saline environments. Birds attracted to this area would be waterfowl and wading birds which feed on plants and invertebrates found in freshwater and moderately saline environments.
Function of the habitat type. These shallow ponds would provide important foraging, resting, and nesting habitat for waterfowl and wading birds. The ponds would evaporatively concentrate water for delivery to other habitat types downslope. The habitat would also be important for dust control, as it would occur on sediments exposed by the drying lake.
Environmental quality. The overall environmental quality of this habitat is judged to be fair. The habitat type was not specifically considered in the workshop, but if the habitat were seasonally flooded there would be concern with the re-mobilization of soluble forms of selenium from the sediments.
Fresh Water Waterfowl Fringe Habitat Physical characteristics. This habitat is located near the shoreline in only the No Marine Lake with No Pumping Alternative, as this alternative has no options for blending of water to create upslope saline habitats. It would occur at elevations of about –220 to –240 feet, inside the margins of the current Sea. It is supplied with water directly out of the two river systems, via forebays and channels that deliver the

Salton Sea Restoration: Preferred Project Report
A-30
water to ponds constructed more or less on contour on exposed sediments or near-shore upland areas. Pond depth varies from 0.5 to 3 feet. The water is quite fresh, varying from about 2.5 to a maximum of 15 PPT TDS. When it exceeds 15 PPT TDS, it would be considered to be saline waterfowl fringe habitat.(#10). Suspended solids in the water are low, as they should have been removed by sedimentation basins upstream. Nutrient content, however, is high, especially in phosphorus. Eutrophication is therefore also high. Selenium concentration is medium (6-25 ppb). The evaporation rate in these ponds would be about that of fresh water (6.5 feet per year), and the water would remain in any given pond for about 1-10 days, depending on season. Wind fetch across the ponds would be of medium length, and the ponds would in general border on similar habitat or other forms of waterfowl habitat.
Biological characteristics. This habitat would probably be rich in life, harboring bacteria, algae, and higher plants. The invertebrates present would be those characteristic of freshwater environments, as would the fish. Birds attracted to this area would be waterfowl, fisheating, and wading birds which feed on plants, invertebrates, and fish found in freshwater environments.
Function of the habitat type. These shallow ponds would provide foraging, resting, and nesting habitat for waterfowl, fisheating, and wading birds. There would be a high rate of return for reducing any remaining suspended solids, nutrients, and selenium, as the habitat would tend to be low in oxygen. It would promote the growth of a variety of higher plants in a wetland setting. The ponds would evaporatively concentrate water for delivery to other habitat types downslope. The habitat would also be important for dust control, as it would occur on sediments exposed by the drying lake.
Environmental quality. The overall environmental quality of this habitat is judged to be fair. The main problem is selenium, which would be in concentration too high for good quality habitat.
Saline Waterfowl Fringe Habitat Physical characteristics. This habitat is the one that was principally discussed during the workshop, and would be present in all alternatives. In would be located downslope of freshwater habitats if they exist, or at somewhat higher elevations if freshwater habitats are a lesser or absent part of a restoration scenario. It would occur at elevations of about –240 to –255 feet, well inside the margins of the current Sea. It is supplied with water either from conveyance channels following blending of river water with water pumped from the larger body of the Sea, or as the downslope recipient of water flowing through freshwater habitats upslope following evaporative concentration. It could also be developed with discharge water from the restored portion of a divided Sea, which is the biologically preferred scenario. Shallow ponds are constructed more or less on contour on the exposed sediments and vary in depth from 0.5 to 3 feet. The water is saline, varying from about 15-50 PPT TDS. Suspended solids in the water are low, as they would have been removed either by

Appendix A: Shallow Water Habitat
A-31
sedimentation basins or by deposition in the Sea. Nutrient content is probably low-medium, as phosphorus may have been sequestered in the Sea sediments. Eutrophication is therefore also low to medium. Selenium concentration could be low (1-2 ppb), resulting from implementation with Salton Sea water which has acted as a selenium filter. The evaporation rate in these ponds would be slightly lower than that of fresh water (6.0 feet per year), and the water would remain in any given pond for about 1-4 weeks, depending on season. Wind fetch across the ponds would be of medium length, and the ponds would in general border on similar habitat or other forms of waterfowl habitat.
Biological characteristics. This habitat would probably be somewhat restricted in life form, harboring bacteria and algae, but largely excluding higher plants. The invertebrates present would be those characteristic of saline environments, as would the fish. Birds attracted to this area would be saltwater fisheating birds and wading birds which feed on the invertebrates and fish found in moderately saline environments.
Function of the habitat type. These shallow ponds would provide foraging, resting, and nesting habitat for waterfowl, fisheating, and wading birds. The ponds will evaporatively concentrate water for delivery to other habitat types downslope. The habitat would be important for dust control, as it would occur on sediments exposed by the drying lake.
Environmental quality. The overall environmental quality of this habitat is judged to be very good. If the habitat is implemented using only Salton Sea water, the selenium concerns are considerably ameliorated.
Shallow Flood Hyperbrine Concentrator Habitat Physical characteristics. This habitat is located downslope of other saline habitats, or at somewhat higher elevations if water is pumped to them as part of a restoration scenario. It forms a part of all scenarios considered, and would occur at elevations of about –235 to –255 feet, well inside the margins of the current Sea. It is supplied with water either pumped directly from the larger body of the Sea, or as the downslope recipient of water flowing through saline habitats upslope following evaporative concentration. Shallow ponds are constructed more or less on contour on the exposed sediments and vary in depth from 0.5 to 4 feet. The water is hyper-saline, varying from about 50 to120 PPT TDS. Suspended solids in the water are low, as it will have been removed by either sedimentation basin or by deposition in the Salton Sea. Eutrophication is low to medium. Selenium concentration is low (1-2 ppb), having been removed by sequestration in the Salton Sea sediments. The evaporation rate in these ponds would be lower than that of fresh water (5.0 feet per year), and the water would remain in any given pond for only about 4-10 days, depending on season. Wind fetch across these small ponds would be of short length, and the ponds would in general border on similar habitat, salt flats, or other forms of waterfowl habitat.

Salton Sea Restoration: Preferred Project Report
A-32
Biological characteristics. This habitat would probably be somewhat restricted in life form, harboring bacteria and algae, but completely excluding higher plants. The invertebrates present are those characteristic of hyper-saline environments. There are no fish. Birds attracted to this area would be only wading birds which feed on the invertebrates found in these hyper-saline environments.
Function of the habitat type. These shallow ponds would provide foraging, resting, and possibly nesting habitat for certain wading birds. The ponds will evaporatively concentrate water for delivery to salt crystallizer and bittern ponds. The habitat would be important for the generation of brines for dust control, as it would occur on sediments exposed by the drying lake.
Environmental quality. The overall environmental quality of this habitat is judged to be fair. Specifics of the environmental benefits and liabilities [were?] discussed in the workshop.
A.10 Review of the Restoration Alternatives In light of the results of the workshop on shallow habitat, the restoration alternatives can be discussed relative to their ability to provide the habitat qualities called out by the workshop participants. Although the workshop did not specifically evaluate each alternative in light of opportunities for shallow habitat, the workshop coordinators have taken the information generated by the workshop participants and undertaken the following conceptual analysis. We recognize that the actual configuration of the alternatives could be modified, but this discussion is intended to call out the advantages and disadvantages of each alternative as currently presented, as it relates to the shallow habitats discussed at the workshop.
South Marine Lake without Elevation Control. This alternative would provide minimal opportunities for diverting saline water into shallow shoreline habitats without pumping. With the barrier, the salinity of the water on each side of the barrier would be different, but the elevation would be essentially the same. Therefore, in order to provide saline water to shoreline habitats, pumping would be required. With pumping, however, there is ample opportunity to construct habitat near the shore and in proximity to existing refuge habitat on clay soils with shallow slope, in the south portion of the basin as well as near the Whitewater River at the north. An additional feature of this alternative is that almost all of the conveyance channels would be brackish water instead of fresh, and selenium could be diluted.
South Marine Lake with Elevation Control Alternative. This alternative would have fewer opportunities to develop shallow habitat on clay soils with shallow slope in the vicinity of existing preserve lands, as compared to the North Marine Lake with Elevation Control Alternative. The shoreline areas exposed in the north half of the Sea are generally steep and sandy, with the exception of the Whitewater River delta. The maintenance of the south lake at the elevation of the current Sea facilitates using the Sea water for shallow habitat near the shoreline with minimal pumping. If habitat

Appendix A: Shallow Water Habitat
A-33
is to be developed associated with the Whitewater River, however, pumping would be required in order to deliver Sea brine to that wetland to dilute the selenium sufficiently.
North Marine Lake with Elevation Control Alternative. This alternative would have the ability to provide saline or at least brackish water habitat in areas that would be close to the shoreline and in the vicinity of existing refuge or preserve lands, and which could be constructed where clay soils and shallow slopes are present. With the North Lake held at the elevation of the current Sea, the delivery of saline water to the shallow habitats could be accomplished with a minimum of pumping. This alternative could be modified to minimize habitat utilizing the relatively selenium-rich river and drain water, all of which could be diverted to the North Lake via conveyance channels. From the point of view of shallow habitat, this alternative is quite viable.
No Marine Lake, with Pumping Option. This alternative has also provides no opportunities for developing shallow habitat with saline water without pumping, but pumping is specifically provided for in this alternative. Since the residual Sea would be hyper-saline in this alternative, however, blending with river or drain water would be required in order to target the desired salinity for the habitat. Blending was not a preferred method of supplying water, due to selenium concerns. If blending were not used, the shallow habitat would be hyper-saline, as is the Sea. This alternative does provide ample location for habitat construction on clay soils with shallow slopes near existing refuges both at the north and south portions of the basin.
No Marine Lake, No Pumping Option. This alternative provides no opportunity to create shallow habitat with saline water, as the brine in the residual Sea could not be diverted using gravity to shoreline areas for habitat development. Any shallow habitats, then, would have to begin with river or drain water, and could concentrate to more saline conditions. The selenium concentration in the river and drain water, however, makes this an unattractive option. Even though exposed shorelines with clay soils and shallow slopes are present, any habitat constructed in them would be of poor to unacceptable quality.
Overall, from the point of view of shallow habitat, a preferred alternative would have the following features:
• Construction opportunities at the south areas of the basin, on clay soils with shallow slopes adjacent to existing refuge and reserve lands. This requirement eliminates the South Marine Lake with Elevation Control alternative, but remains feasible with the other scenarios.
• Gravity delivery of water from a restored portion of the Sea, which would be low in selenium and of a salinity about that of ocean water. This requirement would be possible with a south or north marine lake.

Salton Sea Restoration: Preferred Project Report
A-34
• A pumped delivery of water from a restored portion of the Sea, which would be low in selenium and of a salinity about that of ocean water. This would be possible with all scenarios, but more pumping would be required with the barrier and the no barrier alternatives.
A.11 Next Steps The following actions were suggested specifically by workshop participants. The workshop coordinators have proposed some possibilities for accomplishing these actions, which should be part of the ongoing restoration efforts for the Salton Sea.
1. A responsible monitoring program for the entire Salton Sea, including the river and drain inputs, should be designed, funded, and implemented. The Salton Sea Science Office is the logical lead for this effort, which should include comprehensive data on physical and chemical characteristics of the Sea, taken from more than a single point, and repeated at least quarterly at standardized sampling locations over the course of at least a year. Participation for design of the studies and technical review of the data should be sought from the participants in the water quality workshop. This monitoring program should be implemented as soon as possible, but certainly before the end of 2004.
2. Review the applicability of National Resource Conservation Service (NRCS) specifications for berms, dikes, and levees. The planning team headed by Tetra Tech is a logical lead for this effort. The review should include an informed participant from the NCS who has had on-the-ground experience with the infrastructure elements under evaluation. The review should return a report that details the conditions of salinity, moisture, texture, and exposure to wind fetch that can be expected to result in effective implementation of each infrastructure element evaluated. This review should be accomplished as part of the current contract for developing a preferred alternative for Salton Sea restoration.
3. Develop a data base that would include photos of each bird species of concern and its habitat requirements. This could be accomplished by consulting Birds of the Salton Sea and the text Cowardin’s Wetland and Deepwater Habitats (Cowardin et al. 1979). The Salton Sea Science Office is a logical lead for this project, which could be usefully contracted to any qualified individual of team. The Science Office, in consultation with participants from the biology workshop, should determine the list of species to be included in the data base. As it includes a compilation of existing data, it is a task that should be accomplished before the end of 2004.

B-1
Appendix B COST ANALYSIS OF THE PREFERRED PROJECT
B.1 Introduction A preliminary cost assessment has been prepared for the preferred restoration project. This appendix provides an overview of the assumptions and factors used for developing the cost estimate of the preferred project. The overall cost summary is provided in Table B-1. An important component of the overall cost of the plan would be the central impoundment structure. Table B-1 includes cost estimates for two possible designs for the impoundment structure and two possible design elevations for the water surface of the marine lake. Lowering the design elevation would lower the cost of the impoundment structure and affect the cost of some other features.
B.2 Cost Elements Each of the features included in the cost estimate are discussed briefly below:
Impoundment Structure/Causeway—Various conceptual designs have been considered for the central impoundment structure. These concepts along with cost estimates for each are described in URS (2204). A working group of 15 civil and geotechnical engineers was convened to review the feasibility of constructing a dike, or retention structure/causeway anywhere within the Salton Sea. The group reviewed data from the recent geotechnical investigation of the Sea and suggested alternative design concepts. Cost estimates were developed based on the concepts identified by this group. Cost estimates are very preliminary at this point, and, as of this writing, have not yet undergone review by the work group.
Of the concepts proposed by the work group, the most cost effective structure appears to be a blanketed rockfill design. This concept would consist of an embankment built in the water and entirely out of rock fills. To mitigate seepage through the dam, a blanket of fine material would need to be placed on the upstream slope. Conventionally, this is usually an asphalt or concrete pavement. However, the Sea level would preclude those for this concept. The upstream blanket for this concept would consist of depositing fine-grained soils on the upstream slope to “plug” the rockfill. Ten to 25 feet of the weak soils below the embankment would

Salton Sea Restoration: Preferred Project Report
B-2
be excavated and replaced with rock fills. This material could be used to provide the blanket. Alternatively, a bentonite slurry wall could be constructed through the dam along its crest to provide a seepage barrier. The slurry wall would add $60 to $75 million to the project. The conceptual design includes inclinations of 4:1 on the upstream slope and 7:1 on the downstream slope. The crest of the dam would be 30 feet wide and provide for 5 feet of freeboard above the lake.
Lower marine lake levels would require less embankment volume for the impoundment structure, and would cost less. Table B-1 presents the estimated costs for the Blanketed Rockfill structure for lake elevations of –235 and –240 feet relative to mean sea level (msl). This evaluation indicates that the mid-Sea dam would cost about $100 million less with a 5 foot drop in lake level below -235 feet msl. Conversely, if the structure were designed to maintain the current water elevation, the cost estimates would go up by about $150 million.
Appurtenant Structures—The cost of appurtenances such a spillways and other outlet, and the channels leading to shallow water have been factored in as five percent of the impoundment structure.
Table B-1. Preliminary Cost Estimate for Preferred Alternative Concept
Item Cost ($M) at El=-235' msl Cost ($M) at El=-240' msl
Initial Construction Costs Blanketed Rockfill
Rockfill w Slurry Wall
Blanketed Rockfill
Rockfill w Slurry Wall
Mid-Sea Retention Structure/Causeway 418$ 489$ 354$ 418$
Appurtenant Structures (Spillways, etc.) 21 24 18 21
Dredging to Communities & Island Creation 6 6 20 20
Greenbelt Channels to North Lake(Incl. 20 sed. basins, 2,500 ac wetland, 20% planted) 76 76 66 66
Recreational Lake (approx. 1,000 ac) 45 45 45 45
Torres Martinez Wetlands/Habitat 20 20 20 20
Upstream Wetlands (Top 5 sites, 1376 ac) 58 58 58 58
Shallow Water Habitat Initial Phase (2,000 ac) 8 8 8 8
Total Construction Costs (rounded) 650$ 730$ 590$ 660$
Annual Costs Cost ($M/yr) Cost ($M/yr)
Causeway, Channel & Appurtenance O&M 5.1$ 5.9$ 4.4$ 5.0$
Add Shallow Habitat (500-1,000 ac/yr) 3.0 3.0 3.0 3.0
Habitat O&M 2.0 2.0 2.0 2.0
Total Annual O&M ($M/yr) 10.1$ 10.9$ 9.4$ 10.0$
Present Value of Annual Costs ($M) - based on 30 yrs 150$ 160$ 140$ 140$
Total Present Value Cost ($M) 800$ 890$ 730$ 800$
Note: Does not include costs for development of recreational facilities, new highways, or new lakeside development.
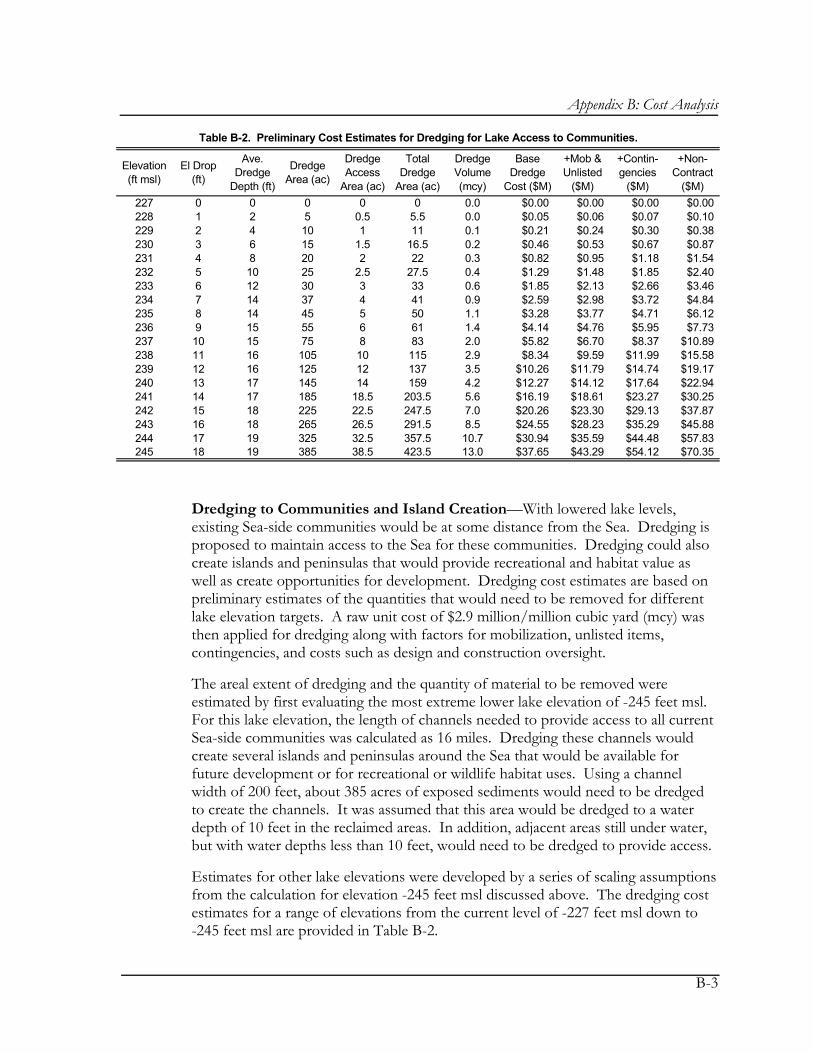
Appendix B: Cost Analysis
B-3
Dredging to Communities and Island Creation—With lowered lake levels, existing Sea-side communities would be at some distance from the Sea. Dredging is proposed to maintain access to the Sea for these communities. Dredging could also create islands and peninsulas that would provide recreational and habitat value as well as create opportunities for development. Dredging cost estimates are based on preliminary estimates of the quantities that would need to be removed for different lake elevation targets. A raw unit cost of $2.9 million/million cubic yard (mcy) was then applied for dredging along with factors for mobilization, unlisted items, contingencies, and costs such as design and construction oversight.
The areal extent of dredging and the quantity of material to be removed were estimated by first evaluating the most extreme lower lake elevation of -245 feet msl. For this lake elevation, the length of channels needed to provide access to all current Sea-side communities was calculated as 16 miles. Dredging these channels would create several islands and peninsulas around the Sea that would be available for future development or for recreational or wildlife habitat uses. Using a channel width of 200 feet, about 385 acres of exposed sediments would need to be dredged to create the channels. It was assumed that this area would be dredged to a water depth of 10 feet in the reclaimed areas. In addition, adjacent areas still under water, but with water depths less than 10 feet, would need to be dredged to provide access.
Estimates for other lake elevations were developed by a series of scaling assumptions from the calculation for elevation -245 feet msl discussed above. The dredging cost estimates for a range of elevations from the current level of -227 feet msl down to -245 feet msl are provided in Table B-2.
Table B-2. Preliminary Cost Estimates for Dredging for Lake Access to Communities.
Elevation (ft msl)
El Drop (ft)
Ave. Dredge
Depth (ft)
Dredge Area (ac)
Dredge Access
Area (ac)
Total Dredge
Area (ac)
Dredge Volume (mcy)
Base Dredge
Cost ($M)
+Mob & Unlisted
($M)
+Contin-gencies
($M)
+Non-Contract
($M)227 0 0 0 0 0 0.0 $0.00 $0.00 $0.00 $0.00228 1 2 5 0.5 5.5 0.0 $0.05 $0.06 $0.07 $0.10229 2 4 10 1 11 0.1 $0.21 $0.24 $0.30 $0.38230 3 6 15 1.5 16.5 0.2 $0.46 $0.53 $0.67 $0.87231 4 8 20 2 22 0.3 $0.82 $0.95 $1.18 $1.54232 5 10 25 2.5 27.5 0.4 $1.29 $1.48 $1.85 $2.40233 6 12 30 3 33 0.6 $1.85 $2.13 $2.66 $3.46234 7 14 37 4 41 0.9 $2.59 $2.98 $3.72 $4.84235 8 14 45 5 50 1.1 $3.28 $3.77 $4.71 $6.12236 9 15 55 6 61 1.4 $4.14 $4.76 $5.95 $7.73237 10 15 75 8 83 2.0 $5.82 $6.70 $8.37 $10.89238 11 16 105 10 115 2.9 $8.34 $9.59 $11.99 $15.58239 12 16 125 12 137 3.5 $10.26 $11.79 $14.74 $19.17240 13 17 145 14 159 4.2 $12.27 $14.12 $17.64 $22.94241 14 17 185 18.5 203.5 5.6 $16.19 $18.61 $23.27 $30.25242 15 18 225 22.5 247.5 7.0 $20.26 $23.30 $29.13 $37.87243 16 18 265 26.5 291.5 8.5 $24.55 $28.23 $35.29 $45.88244 17 19 325 32.5 357.5 10.7 $30.94 $35.59 $44.48 $57.83245 18 19 385 38.5 423.5 13.0 $37.65 $43.29 $54.12 $70.35

Salton Sea Restoration: Preferred Project Report
B-4
Greenbelt Channels to the Lakes with Wetlands and Sedimentation Basins—The New and Alamo rivers would need to be extended to reach the north basin marine lake (Figure B-1). The cost of constructing a wetland greenbelt area around these river extensions has been included along with the cost of constructing 20 sedimentation basins. The Nolte (2002) report commissioned by the Citizens Congressional Task Force to evaluate potential wetland sites that could be developed in the New and Alamo river channels was used as an important source of cost information.
The wetland greenbelt for both channels was estimated at 2,500 acres and it was assumed that vegetation would be planted on 20 percent of this area. It was assumed that over time vegetation would grow to fill the area. The unit cost for vegetation was also taken from Nolte (2002). For purposes of providing costs of a preferred project, wetlands and sedimentation basins were assumed. However, if other biological or chemical treatments are found more effective some amount of wetlands or sedimentation basins could be replaced with such treatments.
Figure B-1. Schematic of Greenbelt Channel Extension Concept.

Appendix B: Cost Analysis
B-5
The Nolte (2002) report identifies 4,276 acres of potential wetlands for a cost of $182 million. To achieve water quality targets, this report assumes 1,376 acres in the five highest rated sites of those wetlands could be constructed in the first phase of the proposed project (Table B-3).
For sedimentation basins, estimates were derived from the evaluation of plans to desalt the Alamo and/or New Rivers. US Filter, Black & Veatch and others have, in the past, suggested desalting the rivers in the Imperial Valley to provide product water for sale to urban or other communities. To properly operate such desalting plants, river water must be very clear. To reduce turbidity, a rule of thumb is often used that sedimentation basins should have an area of about 10 square feet for every gallon per minute of flow. That translates to a requirement of 110 acres of sedimentation basins to treat a flow of 800,000 acre-feet/year. The base cost for these was taken from the Nolte (2002) report on constructing wetlands on the New and Alamo Rivers, for a typical 5.5 acre sedimentation basin. Constructing 20 5.5 acre sedimentation basins will provide the total 110 acres needed for sedimentation.
Cost estimates for channel extensions including the greenbelt areas are provided in Tables B-4 and B-5, for marine lake elevations -235 feet msl and -240 feet msl, respectively. A lower marine lake elevation will allow for a greater channel slope, and thus a smaller cross section and lower construction costs. Channels were assumed to be excavated and unlined. Excavated material would be compacted and used to create embankments on either side of the channels.
Other Features—Preliminary cost estimates have been included for three other features: a 1,000 acre shallow recreational lake, a Torres Martinez wetlands/habitat feature, and an initial phase of shallow water habitat construction. Shallow habitat areas were assumed to be graded at a cost of about $2,000/acre as a base cost and $4,000/acre when all contingencies are included.
Operation and Maintenance Costs and Other On-Going Costs—Preliminary estimates have been provided for operation and maintenance of the various features. In addition, costs are included for future build-out of shallow water habitat which would be phased-in later. These areas would provide habitat for birds as well as help with dust suppression.
Table B-3. Cost Estimate for Top 5 Wetland Sites from Nolte (2002).Site Ranking Score Area (ac) Cost Est. Unit Cost ($/ac)
NR16 27 585 $24,640,000 $42,119.66NR17 27 320 $13,380,000 $41,812.50AR14 31 313 13,750,000 $43,929.71NR32 33 93 $3,900,000 $41,935.48NR26 34 65 $2,750,000 $42,307.69
Top 5 Sites 1376 $58,420,000 $42,456.40

Salton Sea Restoration: Preferred Project Report
B-6
Table B-4. Channel Cost Estimate for Both River Extensions to North LakeLake Elevation = -235
Variable New R Alamo R TotalsQ (AFY) 500,000 450,000 950,000Q (cfs) 691 622 1,312Ave. Side Slope (1:SS) 2 2Bottom Width (ft) 29 25Top Width (ft) 69 64Depth in Main Channel (ft) 10 10Ave. Depth (ft) 7 7Velocity (fps) 1.4 1.4Freeboard1 (ft) 2.0 2.0Length (mi) 21.8 19.4 41.2Length (ft) 115,104 102,432 217,536Channel Excavation (cu yd) 2,757,618 2,187,292 4,944,910
Wetland Side Channel Area (%) 20% 20%Sinuosity 3.0 3.0Wetland Excavation (cu yd) 1,654,571 1,312,375 2,966,946
Total Excavation (cu yd) 4,412,189 3,499,667 7,911,856
Excavation Unit Cost ($/cu yd) $2.35 $2.35Compact Embankment ($/cu yd) $1.50 $1.50
Channel Cost 16,986,928 13,473,719 30,460,646
Vegetation (ac/mi) 12 12Vegetation ($/ac) $16,335 $16,335
Vegetation Cost $4,273,236 $3,802,788 $8,076,024
No. of Sedimentation Basins 10 10Sedimentation Basin Unit Cost $114,422 $114,422
Sedimentation Basin Cost $1,144,220 $1,144,220 $2,288,440Channel + Wetlands Base $22,404,384 $18,420,727 $40,825,110
Mobilization (5%) $1,120,219 $921,036 $2,041,256Unlisted Items (+10%) $2,240,438 $1,842,073 $4,082,511Contingencies (25%) $6,441,260 $5,295,959 $11,737,219Noncontract Cost (30%) $9,661,890 $7,943,938 $17,605,829
Total Cost $41,868,192 $34,423,733 76,291,925
Evap. Losses in Channels (AFY) 1,101 907 2,0081 Additional freeboard would be provided by compacted embankments made from cut material.

Appendix B: Cost Analysis
B-7
Table B-5. Channel Cost Estimate for Both River Extensions to North LakeLake Elevation = -240
Variable New R Alamo R TotalsQ (AFY) 500,000 450,000 950,000Q (cfs) 691 622 1,312Ave. Side Slope (1:SS) 2 2Bottom Width (ft) 15 23Top Width (ft) 59 58Depth in Main Channel (ft) 11 9Ave. Depth (ft) 7 6Velocity (fps) 1.7 1.7Freeboard1 (ft) 2.0 2.0Length (mi) 21.8 19.4 41.2Length (ft) 115,104 102,432 217,536Channel Excavation (cu yd) 2,238,461 1,838,924 4,077,385
Wetland Side Channel Area (%) 20% 20%Sinuosity 3.0 3.0Wetland Excavation (cu yd) 1,343,076 1,103,354 2,446,431
Total Excavation (cu yd) 3,581,537 2,942,278 6,523,815
Excavation Unit Cost ($/cu yd) $2.35 $2.35Compact Embankment ($/cu yd) $1.50 $1.50
Channel Cost 13,788,919 11,327,770 25,116,689
Vegetation (ac/mi) 12 12Vegetation ($/ac) $16,335 $16,335
Vegetation Cost $4,273,236 $3,802,788 $8,076,024
No. of Sedimentation Basins 10 10Sedimentation Basin Unit Cost $114,422 $114,422
Sedimentation Basin Cost $1,144,220 $1,144,220 $2,288,440Channel + Wetlands Base $19,206,375 $16,274,778 $35,481,153
Mobilization (5%) $960,319 $813,739 $1,774,058Unlisted Items (+10%) $1,920,637 $1,627,478 $3,548,115Contingencies (25%) $5,521,833 $4,678,999 $10,200,831Noncontract Cost (30%) $8,282,749 $7,018,498 $15,301,247
Total Cost $35,891,913 $30,413,491 66,305,404
Evap. Losses in Channel (AFY) 928 823 1,7521 Additional freeboard would be provided by compacted embankments made from cut material.

Salton Sea Restoration: Preferred Project Report
B-8
B.3 References Nolte Beyond Engineering. 2002. Reconnaissance Inventory of Wetland and Sedimentation Basin Sites: New and Alamo Rivers Prepared for The Citizen's Congressional Task Force on the New River. May.
URS. 2004. Mid-Sea Dam and Barrier Concepts Salton Sea Study. Riverside and Imperial Counties, California. July.

C-1
Appendix C PERFORMANCE
Reclamation, IID, and CVWD have studied historic and potential future inflows to Salton Sea in detail (Weghorst, 2001). This hydrology work has served as the basis for the development of the Salton Sea Accounting Model (Model) which is used to forecast future salinity and elevation in the Sea. The Model has been used to assess the performance of restoration alternatives, as well as to evaluate the effects water transfer agreements. The Model is a computer application used to simulate the response to historic and expected future inflows to the Salton Sea.
This appendix focuses on the performance of the recommended preferred project, the alternative that includes a marine lake in the north with elevation control. Discussions of the performance of other alternatives considered in the main report are also provided along with comparisons to some other alternatives considered in the past.
C.1 Historic Inflow, Salinity and Elevation Inflows to the Salton Sea are not constant and have varied from a minimum of 1.19 million acre-feet per year in 1992 to a maximum of 1.50 million acre-feet/year in 1963. Figure C-1a depicts a history of inflows into the Salton Sea for the years 1950 to 1999 (Weghorst, 2001). The average annual inflow for this period was 1.34 million acre-feet/year. The historic salt load into the Salton Sea has also been variable. Figure C-1b presents a history of salt load to the Sea. A minimum load of 3.0 million tons occurred in 1950. A maximum salt load of 6.1 million tons occurred in 1977. The average annual salt load to the Salton Sea for the period 1950 to 1999 was 4.5 million tons per year (ton/yr). It appears that salt loading has leveled off at around 4 million ton/yr.
In 2000-2001, the Salton Sea had an average salinity level of about 44,000 milligrams per liter (mg/L) (Weghorst, 2001). Expectations are that salinity levels within the Sea will continue to increase as a result of evaporation and continuous inflows of salt-laden water from agricultural drainage water from irrigation districts around the Sea and from agricultural and municipal use in Mexico.

Salton Sea Restoration: Preferred Project Report
C-2
Figure C-1a. Total Historic Salton Sea Inflows (Source: Weghorst, 2001).
Figure C-1b. Total Historic Salton Sea Salt Load (Source: Weghorst, 2001).
1,000,000
1,100,000
1,200,000
1,300,000
1,400,000
1,500,000
1,600,000
1950 1955 1960 1965 1970 1975 1980 1985 1990 1995 2000
Year
Inflo
w (a
f/yr)
0
1000000
2000000
3000000
4000000
5000000
6000000
1950 1955 1960 1965 1970 1975 1980 1985 1990 1995 2000Year
Salt
Load
(ton
s/yr
)

Appendix C: Performance
C-3
IID estimates annual average salinity for the Sea from surface samples taken at Bertam Station, Desert Beach, Sandy Beach, and Salton Sea Beach. A historic record exists from 1950 through present, with data available up to 1999. Figure C-2a depicts historic Salton Sea salinity values through time. Beginning in 1992, the rate of salinity increase in the Sea began declining. A similar, but more pronounced, reduction in salinity occurred between 1972 and 1980. A much more dramatic reduction occurred from 1950 to 1955.
Inspection of the historic water surface elevations, presented in Figure C-2b, yields the conclusion that these early salinity changes occurred during periods of rising Sea elevations. Rising elevations were a result of increased inflows that provided significant dilution effects. When the elevation increases, salinity levels are observed to go down or level off. These trends were also observed during the post-1992 period where the trend indicated a leveling off of increases in salinity. However, the leveling of the increase in salinity from 1992 to 1999 was paired with only slight increases in elevation. This trend suggests that solids are precipitating or being biologically reduced from the Sea (Weghorst, 2001). This issue is discussed below.
The Sea’s inverse relationship between salinity and water surface elevation is due to simple conservation of mass principles. Salinity can increase rapidly over a short period of time when evaporation exceeds inflows. Conversely, when inflows exceed evaporation, then dilution will occur and salinity will decrease. Under conditions of equal inflow and evaporation, only slight increases in salinity will occur due to salt loading from inflows.
C.2 Precipitation of Dissolved Solids In December 2000, a Science Workshop was held in Riverside, California, to develop a joint opinion of scientists with knowledge in the field of salinity, salt precipitation, and biological reduction of sulfates within natural waters. It was concluded that dissolved solids are either being precipitated or biologically reduced within the Salton Sea as dissolved salts are added to Sea waters on an annual basis. It was concluded that, at a minimum, 0.7 million ton/yr of salts dissolved in inflow waters are being precipitated or reduced upon mixing in the Sea. It was also concluded that, at a maximum, 1.2 million ton/yr are either being precipitated and/or biologically reduced. If biologic reductions are occurring, then they could be reducing, for example, through actions of sulfate-reducing bacteria.
Given the wide range of possibilities that exist between 700,000 and 1.2 million ton/yr of salt loading, the Salton Sea Accounting Model was developed in a way so that this issue was handled as an uncertainty term. When the Model is operated in a stochastic mode, a different value for precipitation or reduction of dissolved solids is sampled from a uniform probability distribution defined by the above limits of 700,000 and 1.2 million ton/yr. The Model then reduces the salt load to the Sea on

Salton Sea Restoration: Preferred Project Report
C-4
Figure C-2a. Historic Salinity Trend in the Salton Sea.
Figure C-2b. Historic Elevation Trend in the Salton Sea.
y
28,000
30,000
32,000
34,000
36,000
38,000
40,000
42,000
44,000
46,000
1950 1955 1960 1965 1970 1975 1980 1985 1990 1995 2000
Year
Salin
ity (m
g/L)
-242
-240
-238
-236
-234
-232
-230
-228
-226
1950 1955 1960 1965 1970 1975 1980 1985 1990 1995 2000
Year
Elev
atio
n (ft
)

Appendix C: Performance
C-5
an annual basis by a corresponding amount to that which is sampled from the distribution. This results in Model simulations that account for the uncertainty of how dissolved solids are precipitating or reduced within the Salton Sea (Weghorst, 2001).
The Science Workshop participants were not able to come to any conclusions about whether or not the rate of precipitation and/or biological reduction would change at higher or lower salinities relative to current conditions. It was also not possible to ascertain whether or not salts that might have precipitated historically might be brought back into solution at lower salinities. There is good reason to believe that precipitation has not been occurring on a large scale and that biological processes are the dominate influence. Therefore if salts were to be re-dissolved at lower salinities then the amount available would be small. The Salton Sea Accounting Model therefore assumes that the uniform distribution used to stochastically simulate precipitation and/or reduction is applicable at both lower and higher salinities from current conditions.
C.3 Baseline Inflow Conditions There are actions in place that are likely to affect, or have already affected, inflows to the Salton Sea. Included in these are a 4.4 million acre-feet/year normal year limited entitlement to Colorado River water for the State of California, increased salinity in the Colorado River, pre-existing conservation, historic aquifer pumping effects in the Coachella Valley, and activities in Mexico. The effects of these actions combined with meteorological, economic, and demand factors will define the near-term inflows. The exact effects of these historic actions are difficult to assess. For purposes of analysis in this report, the maximum future inflow conditions analyzed are similar to the baseline conditions used in the recently published Draft Environmental Impact Report/Environmental Impact Statement (EIR/EIS) for the IID Water Transfer Program. The average future baseline inflow presented in this document is 1.23 million acre-feet/year.
The Model operates stochastically and, therefore, uses a different future sequence of inflows for each simulation. Figure C-3a presents a sample future inflow sequences with an average annual value of 1.23 million acre-feet/year.
The salt load to the Salton Sea is assumed to be equal to that forecasted by the water districts and presented by Weghorst (2001), which is consistent with an inflow of 1.23 million acre-feet/year. The average annual baseline salt load used in all simulations is 3.8 million ton/yr. Figure C-3b shows a sample stochastic sequence of inflowing salt load from the Model with an average annual value of 3.8 million tons/yr. The salt load is shown decreasing in the future because of Salton Sea water intrusion into the Coachella Aquifer.

Salton Sea Restoration: Preferred Project Report
C-6
Figure C-3a. Forecasted Baseline Inflow Assumptions.
Figure C-3b. Forecasted Baseline Salt Load.
Salton Sea Inflow
800,000
900,000
1,000,000
1,100,000
1,200,000
1,300,000
1,400,000
1,500,000
1,600,000
1990 2000 2010 2020 2030 2040 2050 2060 2070 2080Year
Inflo
w (a
f/yr)
Salton Sea Salt Load
3,200,000 3,300,000
3,400,000 3,500,000 3,600,000
3,700,000 3,800,000 3,900,000
4,000,000 4,100,000
4,200,000
2000 2010 2020 2030 2040 2050 2060 2070 2080
Year
Salt
Load
(ton
s)
Assumed to be same for each of the three baseline inflow conditions

Appendix C: Performance
C-7
C.4 Future Inflow Projections With implementation of the QSA, the average inflow to the Sea is expected to decrease over about 15 to 20 years from a baseline of 1.23 million acre-feet/year to an expected inflow of about 930,000 acre-feet/year. While the water transfer agreements contain predictable transfer schedules, there is an option for transferring up to 1.6 million acre feet of additional water if the water is not needed to mitigate effects to the Salton Sea. In addition, inflow to the New River from Mexico, where the flow originates, may also be subject to future reductions. For example, reductions in Colorado River flows to Mexico could, in turn, affect New River flows back across the border. It is also possible that the Coachella Valley groundwater management program would affect inflows. These variables translate to
an uncertainty with respect to actual Salton Sea inflows. Therefore, three inflow scenarios are considered in this report:
4. The anticipated QSA schedule that includes salinity management deliveries (mitigation water) to offset salinity effects to the Salton Sea over the next 15 years;
5. The QSA schedule with the salinity management water terminated in 2006 and sale of additional water to generate restoration funds; and
6. A schedule that would reduce average inflow to about 800,000 acre-feet/year.
The three inflow scenarios are illustrated in Figure C-4.
Under all three inflow scenarios, without restoration, salinity in the Sea would more than double over a period of 20 to 25 years, while the water surface elevation would decrease by about 20 feet over the same period.
C.5 Overview of Salton Sea Accounting Model Assessment of the future of the Salton Sea is dependent on the ability to predict the hydrologic response of the Sea to changing conditions. Foreseeable changes include a range of water conservation programs within the Salton Basin, as well as possible restoration activities. Conservation programs would likely change inflows of both water and dissolved solids into the Sea. Predicting hydrologic response due to these possible changes requires a predictive computer model of the Salton Sea.
The Salton Sea Accounting Model was developed to predict hydrologic response to possible changes in the Sea (Weghorst, 2001). It allows the effective evaluation of historic, present, and future conditions within the Sea. Specifically, the Model

Salton Sea Restoration: Preferred Project Report
C-8
predicts changes in inflow, elevation, surface area, and salinity. Special operating requirements included the need to simulate:
• Future reductions in inflow • Future changes in salt loads into the Sea • Salt precipitation and/or biological reduction • Imports of water • Exports of water • Dividing the Sea into two basins
The basics of the Model involve conservation of mass for both water and total dissolved solids (TDS). The Model maintains separate accounting of each and corresponding calculations of salinity. The Model follows the equations below for mass calculations (Weghorst, 2001):
• Water in Storage = Previous Water in Storage + Inflow – Evaporation + Rain
• Salt Content = Previous Salt Content + Salt Load – Precipitation (or reduction) of salts
600,000
700,000
800,000
900,000
1,000,000
1,100,000
1,200,000
1,300,000
2005 2010 2015 2020 2025 2030 2035 2040 2045
Year
Inflo
w (
acre
-feet
/ ye
ar )
QSA Inflows w/Mitigation Water
QSA Inflows w/Mitigation Water Terminated in 2006
Inflows Reduced to 800 kaf/yr
Figure C-4. Possible Future Salton Sea Inflow Scenarios Evaluated in this Report.

Appendix C: Performance
C-9
The Salton Sea Accounting Model incorporates the ability to perform stochastic and deterministic simulations of Salton Sea conditions. The Model operates on an annual time step. Deterministic simulations of the Model assume that the hydrologic and salt load variability of the Sea will repeat in the future exactly in the same pattern each time the Salton Sea is simulated. Stochastic simulations imply that different hydrologic conditions are sampled and used in each simulation. Model results presented in this report are the result of stochastic simulations and represent mean futures for the Salton Sea. The term mean-future is used to represent the averaging of results from one thousand Model simulations. Therefore, any point removed from one of the simulation charts presented represents an average of one thousand simulations.
For the current modeling assessment, the full Salton Basin was divided into two basins with separate area-capacity tables for each. Inflows to the north end were optimized to achieve target water surface elevations and salinity in the shortest amount of time. Thereafter, inflows in the model were reduced to provide sufficient inflow to maintain Sea salinity close to the target value of 35,000 milligrams/liter. Any remaining inflows were diverted to the south basin and shallow habitat pond areas. Inflows to the south basin were a combination of diverted river flows and discharges from the north basin. In all model assessments it was assumed that the inflows were reduced as a result of evaporation or other losses in wetlands planned for development along the New and Alamo Rivers.
C.6 Salton Sea Accounting Model Results Without Project Figures C-5a and C-5b illustrate the model results for the three inflow scenarios for salinity and elevation in the Salton Sea, respectively. Note that the QSA inflow case where mitigation water would be provided through 2018 is probably the most likely scenario for the no-project scenario. The model results for this case are also illustrated in Figure 2-3 in the main body of this report. The model results show that for this case, the salinity would double, reaching 90,000 mg/L in less than 25 years. For this inflow case, Figure C-5b shows that the elevation of the Sea is expected to drop about 20 feet.
C.7 Salton Sea Accounting Model Results for Preferred Project The model was run by Reclamation for nine sets of conditions for the case where a causeway would be constructed across the central area of the Sea to divide it into north and south basins. The sets of runs were based on the three inflow scenarios shown in Figure C-4 and three possible design water surface elevations for the north marine lake: -230 feet above mean sea level (msl); -235 feet msl; and -240 feet msl.

Salton Sea Restoration: Preferred Project Report
C-10
Figure C-5a. Projected Salinity in the Salton Sea for Three Inflow Scenarios, without the Restoration Project.
Figure C-5b. Projected Elevation in the Salton Sea for Three Inflow Scenarios, without the Restoration Project.
Projected Salton Sea Salinity Without Restoration Project
0
20,000
40,000
60,000
80,000
100,000
120,000
2005 2015 2025 2035 2045 2055
Year
Salin
ity (m
g/l)
QSA Inflows w/Mitigation WaterQSA Inflows w/Mitigation Water Terminated in 2006Inflows Reduced to 800 kaf/yr
Projected Salton Sea Water Surface Elevation Without Restoration Project
-260
-255
-250
-245
-240
-235
-230
-225
2005 2015 2025 2035 2045 2055Year
Elev
atio
n (ft
)
QSA Inflows w/Mitigation Water
QSA Inflows w/Mitigation Water Terminated in 2006
Inflow Reduced to 800 kAFY

Appendix C: Performance
C-11
The simulations assume dam crests elevations of -225, -230, and -235 feet msl respectively with each assuming 5 feet of free board on the dam. Simulations of the -230 and -235 feet msl dam crests provide for salinity reduction benefits that would occur as a result of the dam crest surfacing after construction with an assumed spillway notch of 5 foot height. During this time salinity would begin to decrease in the north end even though the structure would not be acting as a dam. During this period, water would flow between both sides of the structure through the spillway notch. With greater inflows on the north end the salinity would reduce on the north end as saltier water that is displaced by these greater inflows migrates south. This temporary situation would not occur with a dam crest of -225 feet msl and an operating water surface elevation of -230 feet msl because by the time the dam was constructed the water surface elevation would already be at assumed spillway crest elevation of -230 feet.
In order to achieve the performance for the higher design lake elevations of -230 or -235 feet msl, based on the model assumptions discussed above, the extensions of the New and Alamo rivers would need to be constructed near or above the current lake shoreline. The channels would need to be constructed at or above the current water line to have sufficient slope to deliver water to the north with the lake at elevation -230 feet msl. For lower design lake elevations, the channel extensions could be accomplished within the existing lake footprint as the lake level would recede. Specific channel configurations and timings of water deliveries are details that would need to be developed during the feasibility design phase.
Figures C-6a, b and c illustrate the projected salinity in the north basin for the three inflow scenarios. Each chart shows the projected salinity profiles for the three design elevations for a given inflow scenario. Figure C-6a shows the projected salinity in the north basin for the scenario where mitigation water would be sold to help finance the project. Figure C-6b illustrates the most extreme inflow reduction case where all current inflows sources would be reduced to 800,000 acre-feet/yr (including flows into the south and north basins. Figure C-6c illustrates the case where mitigation water would not be sold, and thus this scenario would involve the greatest amount of inflowing water. Figures C-6a, b and c suggest that a north basin design elevation of either -230 feet msl or -235 feet msl, coupled with any of the inflow scenarios would provide the most reasonable times to achieve target salinity in the north basin. However, the lower the inflow, the faster the target salinity could be achieved.
Figure C-7 illustrates the projected salinity trends in the south basin for the scenario where mitigation water would be sold to help finance the project. This chart suggests that salinity in the south basin would reach saturation within 25 to 30 years. At this point salts would begin to crystallize. Similar trends would be seen with the other two inflow scenarios. Salinity projections above 250,000 to 300,000 mg/L are not considered accurate because the Model does not take into consideration salt

Salton Sea Restoration: Preferred Project Report
C-12
precipitation above saturation. The Model does not simulate the phase chemistry of Salton Sea brines.
Figures C-8 and C-9 illustrate the projected elevation in the north and south basins, respectively, for the scenario where mitigation water would be sold to help finance the project. Figure C-9 suggests that the south basin would stabilize at around -260 feet msl. As an example, for the case where the design elevation in the north basin would be -235 feet msl, the water surface on the north side of the central causeway would be 25 feet higher than on the south side. Again, similar trends would be seen with the other two inflow scenarios.
Salinity of North BasinQSA Level Inflows to the Salton SeaWith Mitigation Water Ending in 2006
0
10,000
20,000
30,000
40,000
50,000
60,000
70,000
2005 2015 2025 2035 2045
Year
Salin
ity (m
g/l)
Elevation = -230' mslElevation = -235' mslElevation = -240' msl
Figure C-6a. Projected Salinity in the North Basin for Three Target Lake Elevations, with Mitigation Water Ending in 2006.

Appendix C: Performance
C-13
Salinity of North BasinInflows Reduced to 800k to the Salton Sea
0
10,000
20,000
30,000
40,000
50,000
60,000
70,000
2005 2015 2025 2035 2045
Year
Salin
ity (m
g/l)
Elevation = -230' mslElevation = -235' mslElevation = -240' msl
Figure C-6b. Projected Salinity in the North Basin for Three Target Lake Elevations, with Inflows Reduced to 800,000 Acre-Feet/Year.

Salton Sea Restoration: Preferred Project Report
C-14
Salinity of North BasinQSA Level Inflows to the Salton SeaWith Mitigation Water Ending in 2018
0
10,000
20,000
30,000
40,000
50,000
60,000
70,000
2005 2015 2025 2035 2045
Year
Salin
ity (m
g/l)
Elevation = -230' mslElevation = -235' mslElevation = -240' msl
Figure C-6c. Projected Salinity in the North Basin for Three Target Lake Elevations, with Mitigation Water Ending in 2018.

Appendix C: Performance
C-15
Salinity of South BasinQSA Level Inflows to the Salton SeaWith Mitigation Water Ending in 2006
0
100,000
200,000
300,000
400,000
500,000
2005 2015 2025 2035 2045
Year
Salin
ity (m
g/l)
Elevation = -230' mslElevation = -235' mslElevation = -240' msl
Figure C-7. Projected Salinity in the South Basin for Three Target Lake Elevations, with Mitigation Water Ending in 2006.
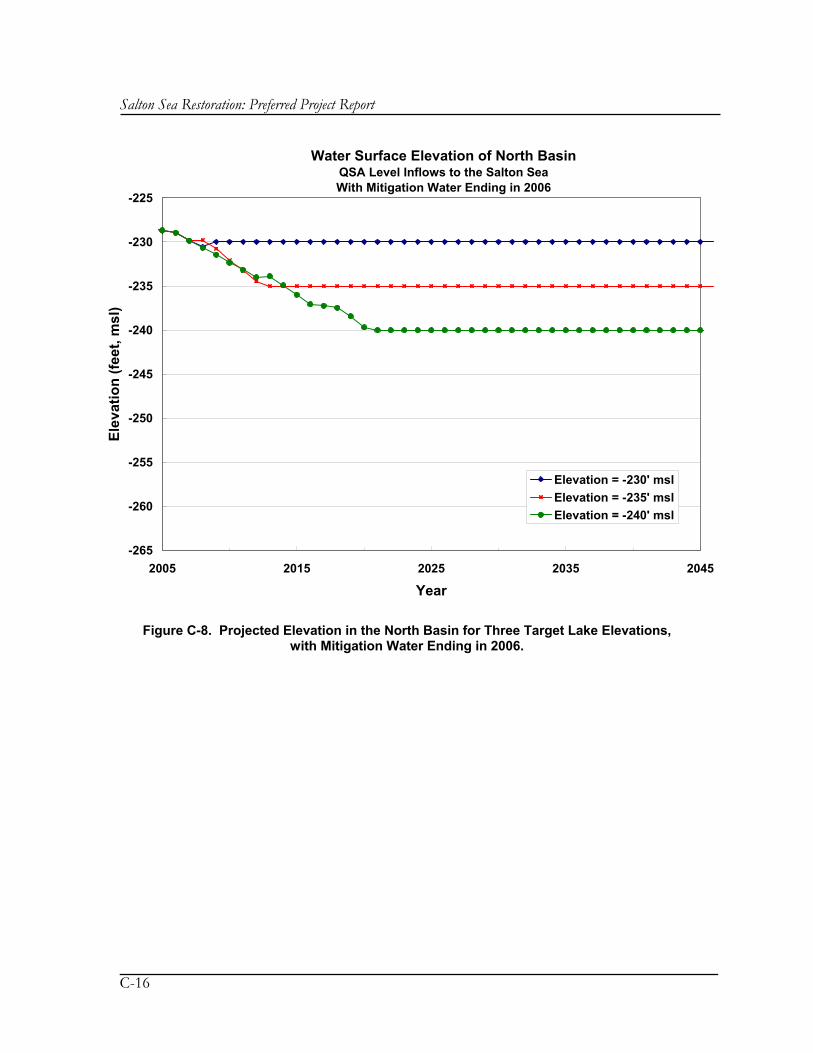
Salton Sea Restoration: Preferred Project Report
C-16
Water Surface Elevation of North BasinQSA Level Inflows to the Salton SeaWith Mitigation Water Ending in 2006
-265
-260
-255
-250
-245
-240
-235
-230
-225
2005 2015 2025 2035 2045
Year
Elev
atio
n (fe
et, m
sl)
Elevation = -230' mslElevation = -235' mslElevation = -240' msl
Figure C-8. Projected Elevation in the North Basin for Three Target Lake Elevations, with Mitigation Water Ending in 2006.
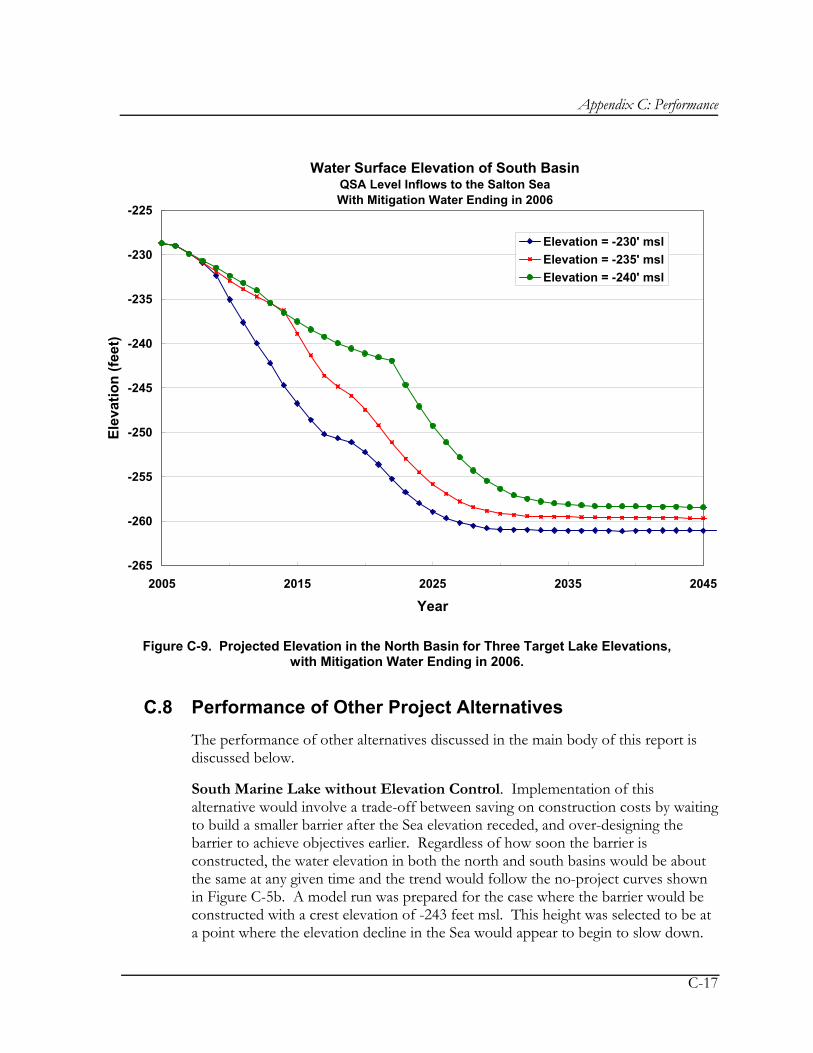
Appendix C: Performance
C-17
Water Surface Elevation of South BasinQSA Level Inflows to the Salton SeaWith Mitigation Water Ending in 2006
-265
-260
-255
-250
-245
-240
-235
-230
-225
2005 2015 2025 2035 2045
Year
Elev
atio
n (fe
et)
Elevation = -230' mslElevation = -235' mslElevation = -240' msl
Figure C-9. Projected Elevation in the North Basin for Three Target Lake Elevations, with Mitigation Water Ending in 2006.
C.8 Performance of Other Project Alternatives The performance of other alternatives discussed in the main body of this report is discussed below.
South Marine Lake without Elevation Control. Implementation of this alternative would involve a trade-off between saving on construction costs by waiting to build a smaller barrier after the Sea elevation receded, and over-designing the barrier to achieve objectives earlier. Regardless of how soon the barrier is constructed, the water elevation in both the north and south basins would be about the same at any given time and the trend would follow the no-project curves shown in Figure C-5b. A model run was prepared for the case where the barrier would be constructed with a crest elevation of -243 feet msl. This height was selected to be at a point where the elevation decline in the Sea would appear to begin to slow down.
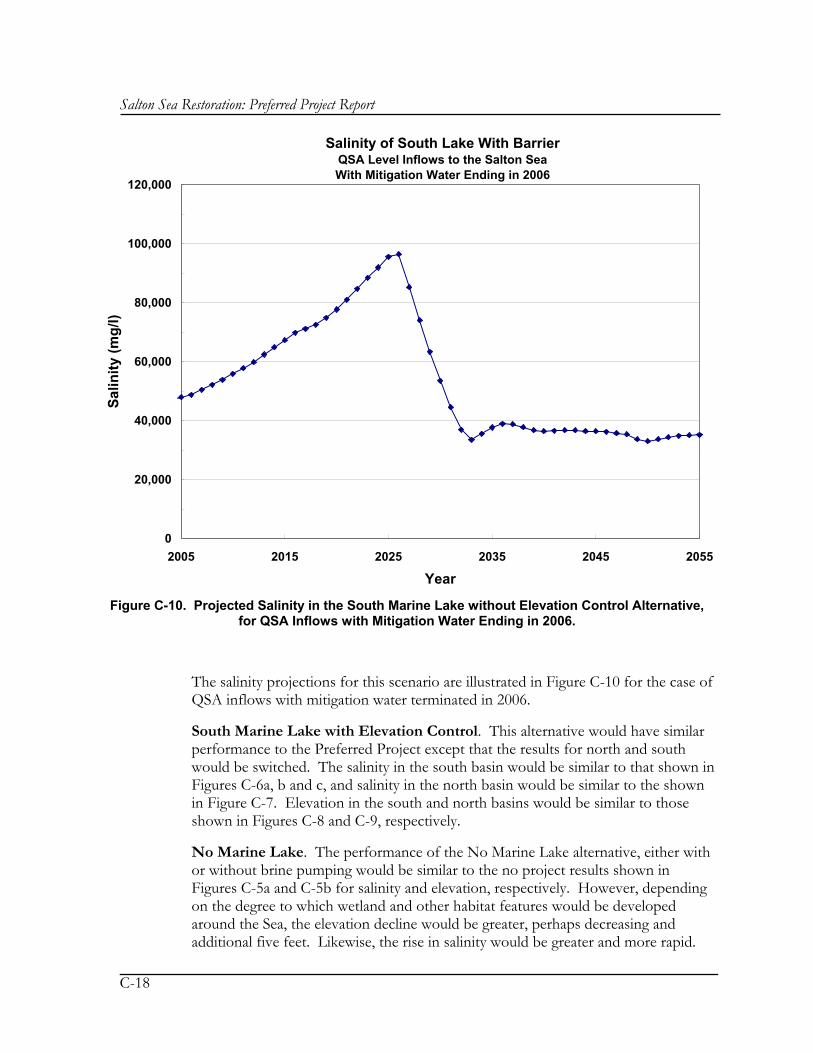
Salton Sea Restoration: Preferred Project Report
C-18
Figure C-10. Projected Salinity in the South Marine Lake without Elevation Control Alternative, for QSA Inflows with Mitigation Water Ending in 2006.
The salinity projections for this scenario are illustrated in Figure C-10 for the case of QSA inflows with mitigation water terminated in 2006.
South Marine Lake with Elevation Control. This alternative would have similar performance to the Preferred Project except that the results for north and south would be switched. The salinity in the south basin would be similar to that shown in Figures C-6a, b and c, and salinity in the north basin would be similar to the shown in Figure C-7. Elevation in the south and north basins would be similar to those shown in Figures C-8 and C-9, respectively.
No Marine Lake. The performance of the No Marine Lake alternative, either with or without brine pumping would be similar to the no project results shown in Figures C-5a and C-5b for salinity and elevation, respectively. However, depending on the degree to which wetland and other habitat features would be developed around the Sea, the elevation decline would be greater, perhaps decreasing and additional five feet. Likewise, the rise in salinity would be greater and more rapid.
Salinity of South Lake With BarrierQSA Level Inflows to the Salton SeaWith Mitigation Water Ending in 2006
0
20,000
40,000
60,000
80,000
100,000
120,000
2005 2015 2025 2035 2045 2055
Year
Salin
ity (m
g/l)

Appendix C: Performance
C-19
C.9 Performance of Alternatives Considered in the Past The only other known alternative considered in the past that would perform comparable the preferred project, but for a full Sea, would be a massive water exchange with the Gulf of California through the construction of pipelines and/or channels. Interior (2003) estimated that such an alternative could cost between $13 and $38 billion in total present value cost. In addition, while such a water exchange alternative could be used to control the elevation of the Sea, salinity could not be reduced below about 40,000 mg/L. This conclusion is based on the source if replenishing water being ocean water with a salinity of 35,000 mg/L. Even with very large exchange systems, evaporation in the Sea would cause the salinity to be greater than that value.
Interior also investigated the performance of alternatives that would export salt water without any replacement for water transferred out of the area. These would include on-land and in-Sea pond systems, enhanced evaporation systems, and desalination plants. For all of these alternatives, the elevation decline in the Sea would be similar to or more extreme than the no action case shown in Figure C-5b. In-Sea pond systems and desalination plants (with return of product water to the Sea) would have elevation trends similar to Figure C-5b. Whereas, on-land solar ponds and enhanced evaporation systems would tend to reduce elevation by an additional five to seven feet for any of the three inflow scenarios, for a total drop in the Sea’s water surface of 25 to 30 feet. While all of these alternatives would ultimately control salinity, modeling by Interior showed salinity would peak around 60 mg/L and that it would take about 30 years for salinity in the Sea to be reduced to 40,000 mg/L.
C.10 References Weghorst, Paul. A. 2001. Salton Sea Accounting Model, draft. Bureau of Reclamation, Lower Colorado Region, Boulder City, Nevada. November.
Department of Interior. 2003. Salton Sea Restoration Project Status Report, January.

Salton Sea Restoration: Preferred Project Report
C-20
This page intentionally left blank

D-1
Appendix D OUTDOOR RECREATION
In February 2004, the Authority appointed an Outdoor Recreation Advisory Task Force to evaluate recreational potential of a restored Salton Sea and present recommendations to the Authority Board. The Outdoor Recreation Advisory Committee presented their report to the Board on June 24, 2004. This Appendix provides the committee’s report in its entirety.
With water transfers and the QSA resulting in a smaller sea, the Task Force was asked to address how to turn potential problems into potential opportunities. It was asked to create a new vision for the Sea that responds to the new water realities.
Its members included: John Benson, Victor Torres, Lea Anne O'Malley, Shirley Palmer, Christine Harris, Sue Giller, Bill Gates, Tim Kelley, Cliff Lawrence, Leon Lesicka, Roland Gaebert, Chris Schoneman, Jack Crayon, Vince Signorotti, Wayne Olesh, Jacob Ward, Fred Singh, Al Kalin, Jack Hart and Tom Raftican. Lea Anne O'Malley was appointed chairwoman.
The Task Force held its first meeting in March 29. Six subsequent meetings were held in West Shores (Salton City), Niland, Westmorland, Brawley and Calipatria.
D.1 A Vision for the Sea The Task Force has found that the future for the Salton Sea can indeed be a bright one, even with diminished inflows. The Salton Sea will no longer be California’s largest Lake, but, what is lost in quantity will be replaced by quality. For years, dreamers have envisioned economic development and a recreational Mecca around its shores. With proper funding and with the necessary political will at the Federal, State and local government levels, this lake will realize its potential.
Just visualize what can occur if this effort is successful.
In the next several decades, as inflows diminish and the shoreline recedes, new wetlands areas, shallow water ponds and Imperial County’s largest fresh water lake will appear along the southern shores. Hunting and fishing, bird watching, hiking, equestrian trails and off-roading will attract thousands of visitors and local residents
Salton Sea Restoration: Preferred Project Report
D-2
annually. The old Salton Sea Navy Base will possibly become another Glamis—a Glamis with a lake view.
In the northern marine lake, a stabilized body of water will attract sports fishermen and recreational boating. The Imperial County communities of West Shores, Bombay Beach, Calipatria and Niland will receive major economic benefits and development from this renewed ecotourism. The community of North Shore will again become a place to visit.
D.2 Issues Evaluated In analyzing the issues, the Task Force identified several broad categories, with specific questions to evaluate in each category. The questions are cited below.
Extension of New/Alamo Rivers and Wetland Creation
A. Should 2,000 to 4,000 acres of wetlands be created in the New and Alamo Rivers and their extensions under the Restoration Plan?
B. Should small, sedimentation basins be designed throughout the River systems or medium sized to large ones be placed in a few locations?
C. Should the design of wetlands in the extensions be much different than the design of wetlands in existing river courses?
Freshwater Lakes
A. Should the Restoration Plan include a large freshwater lake fed by Alamo River water at Red Hill Marina?
B. Should the Restoration Plan include a small ski lake fed by Alamo River water around Mullet Island?
C. Should a lake be designated as being specifically for bird watching (with no power boats allowed?
D. Should there be a channel/lake in Bombay Beach area?
Marine Lake North Basin
A. Are there features of the marine lake in the North part of the Sea that should be added or changed to encourage different forms of recreation?

Appendix D: Outdoor Recreation
D-3
Shallow Water Ponds
A. Should trails or other public access be provided to the network of shallow water wetlands?
B. What sort of public uses should be allowed in the shallow water ponds?
Agriculture
A. Should land previously flooded by the Sea be reclaimed for farming?
Geothermal
A. What are the most compatible uses of land near potential geothermal expansion areas?
Off Road Vehicle Use
A. Can some lands be utilized for off road vehicle use?
B. Should a large (10,000 acre) off road racing course be developed?
Ownership
A. Are there special considerations for lands under the jurisdiction of FWS?
B. Are there special considerations for lands under the jurisdiction of State Parks?
C. Are there special considerations for lands under the jurisdiction of IID?
D. Are there special considerations for lands under the jurisdiction of Reclamation?
E. Are there special considerations for lands under the jurisdiction of the Torres Martinez Tribe?
F. Are there special considerations for lands under the jurisdiction of other agencies?
Hunting and Fishing
A. Are there special design considerations to maximize hunting opportunities?
B. Are there special design considerations to maximize fishing opportunities?

Salton Sea Restoration: Preferred Project Report
D-4
Other Issues
A. Are there other recreational and economic development issues that ought to be included in the plan?
B. Where will communities along the Salton Sea shores get their water to accommodate the expected growth?
C. Should there be a road on the dike?
D.3 Findings
Extension of New/Alamo Rivers and Wetland Creation
The Task Force was in agreement that wetlands should be extended in both rivers—at least 4,000 acres. The Salton Sea Science Office and other experts should determine the questions regarding the size of sedimentation basins. The Task Force also agreed that the current design should be continued.
The Wetlands projects are very important to the restoration of the Sea because of their ecological value to the region. They are a key political selling point in the total restoration effort.
Freshwater Lakes
The Task Force extensively evaluated the potential of freshwater lakes fed by the Alamo and New rivers and is in agreement that such lakes are crucial to expanded recreation use for the Sea.
Members also expressed concern that allowances be made on the lakes for recreational boating as well as restricted areas for wildlife preservation and bird nesting. It was felt that it will be difficult in advance to determine the location of the best wildlife areas: that will be determined by the wildlife. However, it was also felt this could be a seasonal situation and could be controlled by posting—similar to procedures used at Lake Perris.
The committee felt a small recreational freshwater lake near Bombay Beach could not be economically justified. However, the Task Force also said a channel linking Bombay Beach to the northern lake would be important to serve residents there to prevent that community from becoming totally isolated from access to the new Salton Sea
Two different concepts for a single freshwater lake of up to 2,000 acres were discussed for the region around the current Red Hill Marina. It would be the largest

Appendix D: Outdoor Recreation
D-5
freshwater lake in Imperial County. Both concepts would have an extended channel running north to the main body of the northern lake—a drop of about eight feet over 15 miles. Additionally, dredging would probably be necessary to create the freshwater lake.
The first concept is a kidney-shaped body of water centered around Red Hill with an extended narrow channel running north to Bombay Beach. With this concept, there would be an option to continue Mullet Island as an island, but would leave much of the current wildlife refuge in a “dry” area.
The second concept is a longer and narrower lake that stretches from Obsidian Butte to Red Hill. It incorporates much of the current refuge. Additionally, Obsidian Butte and Red Hill are the only natural structures (“mountain peaks”) for miles—incorporating them in the lake would add some beauty to the area. It also has a narrow channel extending to Bombay Beach. Mullet Island would become part of the dry area in this concept.
More evaluation is necessary on either concept, but the majority of the committee favored the “longer-narrow” option because it incorporates the current refuge area as well as the two “mountain peaks.” However, the Fish and Wild Service expressed reservations regarding use of the refuge area and those must be considered.
Marine Lake: North Basin
The committee felt there would be many recreational opportunities in the northern marine lake, which will become very important as the region develops. It was also felt that a public access road across the dike dividing the North Sea and the salt settling pond would be a very valuable asset. The road could have turn-outs for parking and some extensions or piers to enhance fishing in the area.
Shallow Water Ponds
The Task Force felt a series of shallow water ponds around the southern portion of the current sea would be an excellent mitigation for the smaller sea. They not only would become excellent habitat for birds and other wildlife but also would offer extensive recreational opportunities.
Hiking and equestrian trails should be incorporated in the restoration plans as well as bike trails and a cultural component that will provide public education opportunities.

Salton Sea Restoration: Preferred Project Report
D-6
Agriculture
The Task Force thoroughly discussed whether land previously flooded by the Sea on its south end should be reclaimed for farming. The committee decided this is not a good option: shallow ponds are the best alternative.
Questions were raised over water availability to reclaim the land as well as whether the reclamation would be economically feasible.
Geothermal
Portions of the Salton Sea Geothermal Anomaly that are currently inundated by the Sea have high commercial potential for future development.
The potential expansion of the geothermal development near Obsidian Butte and Red Hill needs to be coordinated with the ultimate design of freshwater lakes.
Although market conditions and economics will play a large role in any future expansion of the development by CalEnergy, experts believe that areas with a high probability of having commercial quantities of geothermal resources are located under water in that area of the Sea.
Because of the prime Geothermal “hotspots” in the areas of the proposed freshwater lakes, it may be necessary to move the lakes somewhat to the east and north. If that means loss of one of the scenic “mountain peaks” in the lake (Red Hill and Obsidian Butte) another could possibly be constructed. While geothermal development is compatible with recreational uses, agriculture and the environment, it is less compatible with residential areas--such as mobile home parks or camp grounds that could develop near a lake.
Close coordination will be imperative between CalEnergy and the Authority regarding appropriate placement of the freshwater lakes to maximize the recreation/wildlife potential and not adversely impact potential geothermal development.
Off Road Vehicle Use
There are areas along the West Shore near the former Navy Test Base that could become excellent off road recreational areas. However, the Task Force had some concerns regarding development of an off road race track.
A Task Force member discussed this with some off road vehicle retailers in Imperial County to get opinions. The consensus was an off road area would serve people very well, but having an actual race track there would be difficult. Such tracks get very heavy use and require extreme amounts of maintenance, including mixing soils. The

Appendix D: Outdoor Recreation
D-7
only way a track could possibly succeed would be one constructed and operated by private enterprise.
An alternative to a race track would be development of a recreational vehicle “parking area”, similar to Glamis. With the Sea as a back drop, it would become a popular recreational site. Families could use the dike for fishing, etc. and have off road access all the way to popular areas near the Ocotillo Wells Recreation area and Plaster City. Fees could be assessed for use of this area.
Land Ownership Issues
United States Fish and Wildlife Service: There would be a need for land swaps in the hyper saline areas to resolve management conflicts.
State Parks: There were no issues identified. The new features of the Salton Sea that are being discussed are compatible with the State Parks goals.
Imperial Irrigation District: Cal Energy’s use of land under the Sea is also an IID issue. IID will be sensitive to land use and liability issues that effect the land it owns in and around the current Sea.
Bureau of Reclamation: There were no special ownership issues identified regarding Reclamation Land.
Torres Martinez: There are some restrictions regarding use of Indian Lands. These would have to be identified by the Torres Martinez Tribe and incorporated into the planning.
County of Imperial: Red Hill Marina is currently a county park. The county will need to be involved in any planning regarding a freshwater lake in that area.
Hunting and Fishing
This committee feels strongly that hunting and fishing needs should be factored in to any restoration plan and should be maximized. Wetlands, shallow water ponds and lakes under discussion are designed to enhance recreational opportunities. It is agreed that certain areas may be designed for specific uses in an effort to balance recreational uses with environmental concerns. As budgets are put together, sufficient funds should be requested to cover operations and maintenance to maximize the hunting and fishing potential.
In addition to hunting and fishing, other areas should be set aside for bird watching, hiking, bicycling, equestrian and other compatible uses.

Salton Sea Restoration: Preferred Project Report
D-8
Other Issues
Regional Cooperation between Economic Development agencies and organizations in Coachella and Imperial Valleys: It is imperative that economic development interests in the Coachella and Imperial valleys work together to realize the vision and potential of a restored Salton Sea. It is also imperative that this region work cooperatively with representatives and agencies at the federal and state level and that they, in turn, give substantial value to local input.
Agricultural Issues: The Salton Sea serves as a model of how the interrelationship between agricultural needs and environmental, recreational and economic benefits create a valuable ecosystem. The committee wants to recognize the significance agriculture plays in creating this valuable resource and does not want agriculture’s contributions to be diminished.
Budget Issues: State and local budget reductions will have an impact on development and management of recreational areas at a restored Salton Sea. However, this is considered to be a short term problem. While there are few agency resources at present, thought should be given to develop strong volunteer programs to assist in development and management of hunting and fishing areas.
Water to Salton Communities: While there were no specific recommendations, the committee discussed the need to develop a reliable water supply to the West Shores communities that will be needed if they are to develop.
Road on Mid-Sea Retention Structure: The committee felt a public access road across the dike would be an excellent idea. It could be a source of possible income and a major economic benefit to the region. It also would enhance recreational access to the Sea. Costs permitting, pullouts for parking and fishing off the dike could be designed into the roadway. Access roads should also be designed to the shallow water lakes without adversely affecting sensitive areas.
Enterprise Zone: The committee recognized the need for an expanded Enterprise Zone in the southern portion of the Sea that is currently being sought by the cities of Calipatria, Brawley and Westmorland. Any Enterprise Zone endeavors must be compatible with environmental and recreational development in the area.

This Page
Intentionally
Left Blank

Green Job Hazards
http://www.osha.gov/dep/greenjobs/index.html[8/6/2012 10:56:24 AM]
Newsletter RSS Feeds Print This Page Text Size
What's New | Offices
<< Back to the OSHA Home Page
Green Job Hazards
Green jobs are being defined broadly as jobs that help to improve the environment. These jobs also create opportunities to help revitalize the economy and getpeople back to work. Green jobs do not necessarily mean that they are safe jobs. Workers in the green industries may face hazards that are commonly known inworkplaces -- such as falls, confined spaces, electrical, fire, and other similar hazards. These hazards may be new to many workers who are moving into fast-growing green industries. Additionally, workers may be exposed to new hazards which may not have been previously identified. For example, workers in the solarenergy industry may be exposed to Cadmium Telluride, a known carcinogen, if adequate controls are not implemented.
The Occupational Safety and Health Act (OSH Act) requires employers to comply with safety and health standards and regulations promulgated by OSHA or by astate with an OSHA-approved state plan. In addition, the Act's General Duty Clause, Section 5(a)(1), requires employers to provide their employees with aworkplace free from recognized hazards likely to cause death or serious physical harm. In the absence of an OSHA standard, OSHA can enforce the General DutyClause. OSHA standards cover many of the hazards in green industries and employers must use the necessary controls to protect workers. Click on the industryicon on this page to get more information about some of the hazards in the industry and the OSHA standards that may apply.
A key concept for all industries, but especially those that are just beginning to grow, is "Prevention through Design (PtD)" – designing the process/equipment in away that eliminates hazards to the workers who use them. Employers should have a system in place where safety and health professionals work with designengineers in "designing out" hazards throughout the design phase of their products. See NIOSH's efforts on PtD and its blog on green jobs.
OSHA is committed to helping workers and employers ensure that green jobs are safe jobs. See Assistant Secretary Michael's remarks from National Institute forOccupational Safety and Health's Going Green Workshop. Read about Dr. Michaels' participation in the U.S.-Canada-European Commission Trilateral Roundtable onthe Employment Dimension of the Transition to a Green Economy.
Resources
U.S. Department of Energy
Blue Green Alliance
A to Z Index | En Español | Contact Us | FAQs | About OSHA
OSHA
Home Workers Regulations Enforcement Data & Statistics Training Publications Newsroom Small Business
Green Job Hazards
http://www.osha.gov/dep/greenjobs/index.html[8/6/2012 10:56:24 AM]
Freedom of Information Act | Privacy & Security Statement | Disclaimers | Customer Survey | Important Web Site Notices | International | Contact Us
U.S. Department of Labor | Occupational Safety & Health Administration | 200 Constitution Ave., NW, Washington, DC 20210Telephone: 800-321-OSHA (6742) | TTY: 877-889-5627
www.OSHA.gov
Disclaimer
This guidance is not a standard or regulation, and it creates no new legal obligations. It contains recommendations aswell as descriptions of mandatory safety and health standards. The recommendations are advisory in nature,informational in content, and are intended to assist employers in providing a safe and healthful workplace. TheOccupational Safety and Health Act requires employers to comply with safety and health standards and regulationspromulgated by OSHA or by a state with an OSHA-approved state plan. In addition, the Act's General Duty Clause,Section 5(a)(1), requires employers to provide their employees with a workplace free from recognized hazards likely tocause death or serious physical harm.
*Hydrogen fuel cell photo courtesy of National Renewable Energy Laboratory (NREL). Jack Dempsey, photographer.
Wind Energy | Solar | Geo-Thermal Energy | Biofuels | Recycling | Green Roofs | Hydrogen Fuel Cells | Weather Insulating/Sealing

This Page
Intentionally
Left Blank

Toward a Just and Sustainable Solar Energy Industry
1 - Silicon Valley Toxics Coalition
_
Toward a Just and Sustainable Solar Energy Industry
A Silicon Valley Toxics Coalition White Paper
January 14, 2009

Toward a Just and Sustainable Solar Energy Industry
2 - Silicon Valley Toxics Coalition
About Silicon Valley Toxics Coalition:
• Silicon Valley Toxics Coalition (SVTC) is a diverse organization that promotes human health and environmental justice in the high-tech industry through research, advocacy, and grassroots organizing.
• Our goal is environmental sustainability and clean production for industry and improved health and democratic decision making for the communities and workers most affected by the high-tech revolution.
• We envision a toxic-free future in which each new generation of technical advances includes parallel and proportionate advances in social and environmental justice.
Credits:
• Contributors: Dustin Mulvaney, Ph.D.—Switzer Fellow Vicki Bolam—Technical Writer Monica Cendejas—Project Manager, SVTC Sheila Davis—Executive Director, SVTC Lauren Ornelas—Campaign Director, SVTC
Simon Kim—SVTC Intern, Stanford University Serena Mau—SVTC Intern, University of California, Berkeley William Rowan—SVTC Intern, Stanford University Esperanza Sanz—SVTC Intern, De Anza College Peter Satre—SVTC Intern, Stanford University Ananth Sridhar—SVTC Intern, Stanford University Dean Young—SVTC Intern, Stanford University
• Design and layout:
Kiel MacDonald—Web Associate, SVTC
The content of this document does not reflect the positions or opinions of its reviewers. • External Reviewers:
Louise Auerhahn—Working Partnerships USA José Bravo—Just Transition Alliance Rob D’Arcy—County of Santa Clara, Department of Environmental Health Ken Geiser—University of Massachusetts Lowell Ian Kim—Ella Baker Center David Levine—Green Harvest Technologies Bettye L.S. Maddux—University of Oregon
Cover image courtesy of Schwarzerkater at www.flickr.com/photos/asterix/151969001/ Victorian rooftop installation image courtesy of Brian Kusler at http://www.flickr.com/photos/briankusler/23331054/ African installation image courtesy of Jim Wiggins of Inveneo.org

Toward a Just and Sustainable Solar Energy Industry
Silicon Valley Toxics Coalition
EXECUTIVE SUMMARY 1
I. Introduction 2 II. Overview of Solar Photovoltaic (PV) Technology 5
A. Solar PV Basics B. Crystalline Silicon (c-Si) Solar Cells C. Thin-Film Solar Technologies D. Gallium Arsenide (GaAs) and Multijunction Cells
III. Hazardous Materials Used in Solar PV Cell Production 9 A. Crystalline Silicon (c-Si) B. Amorphous Silicon (a-Si) Thin Film C. Cadmium Telluride (CdTe) Thin Film D. Copper Indium Selenide (CIS) and Copper Indium Gallium Selenide (CIGS) E. Gallium Arsenide (GaAs) and Multijunction Cells F. Emerging Solar PV Technologies
IV. Potential End-of-Life Hazards for Solar PV Products 19 A. Solar PV Toxic Waste is Also E-Waste B. Crystalline Silicon (c-Si) C. Amorphous Silicon (a-Si) D. Cadmium Telluride (CdTe) E. Copper Indium Selenide (CIS) and Copper Indium Gallium Selenide (CIGS) F. Gallium Arsenide (GaAs) and Multijunction Panels G. Emerging Solar PV Technologies
V. Current Regulatory Framework for Solar PV Products 24 A. Overview of U.S. Regulations Relating to Solar PV B. Regulation in the European Union and Other Countries C. The Toxic Waste Burden on U.S. State and Local Governments
VI. Recommendations for a Clean and Just Solar Industry 27 A. Reduce and Eventually Eliminate the Use of Toxic Materials B. Hold the Solar PV Industry Accountable for the Lifecycle Impacts of Its Products C. Ensure Proper Testing of New and Emerging Materials and Processes D. Expand Recycling Technology and Design Products for Easy Recycling E. Promote High-Quality “Green Jobs” That Protect Worker Health and Safety and Provide a Living Wage F. Protect Community Health and Safety throughout the Global PV Industry and Supply Chains
VII. Taking Action: What You Can Do 32 APPENDIX A: Overview of Chemicals Associated with Solar Photovoltaic (PV)
Manufacturing and Disposal 34 APPENDIX B: Annotated Solar Manufacturing Process Diagrams 39 REFERENCES 42
Table of Contents

Toward a Just and Sustainable Solar Energy Industry
1 - Silicon Valley Toxics Coalition
Executive Summary
Every hour, enough solar energy reaches the Earth to meet human energy needs for an entire year. Solar photovoltaic
(PV) technology is widely seen as a “win-win” solution that can harness this “free energy” to address global warming,
reduce U.S. dependence on energy imports, create “green jobs,” and help revitalize the U.S. economy.
Solar energy will play an essential role in meeting these challenges, but as the solar PV sector expands, little attention is
being paid to the potential environmental and health costs of that rapid expansion. The most widely used solar PV panels
are based on materials and processes from the microelectronics industry and have the potential to create a huge new wave
of electronic waste (e-waste) at the end of their useful lives, which is estimated to be 20 to 25 years. New solar PV
technologies are increasing cell efficiency and lowering costs, but many of these use extremely toxic materials or materials
with unknown health and environmental risks (including new nanomaterials and processes).
With the solar PV sector still emerging, we have a limited window of opportunity to ensure that this extremely important
industry is truly “clean and green,” from its supply chains through product manufacturing, use, and end-of-life disposal. The
solar industry has taken a leadership role in addressing the world’s pressing energy and environmental challenges and will
serve as a model for how other innovative “green” industries address the lifecycle impacts of their products.
In this white paper, the Silicon Valley Toxics Coalition (SVTC) provides an overview of the health and safety issues faced
by the solar PV industry, including the toxic materials used in manufacturing and the potential end-of-life disposal hazards
of solar PV products. The report also lays out recommendations to immediately address these problems to build a safe,
sustainable, and just solar energy industry. These recommendations include:
• Reduce and eventually eliminate the use of toxic materials and develop environmentally sustainable practices.
• Ensure that solar PV manufacturers are responsible for the lifecycle impacts of their products through Extended
Producer Responsibility (EPR).
• Ensure proper testing of new and emerging materials and processes based on a precautionary approach.
• Expand recycling technology and design products for easy recycling.
• Promote high-quality “green jobs” that protect worker health and safety and provide a living wage throughout the
global PV industry, including supply chains and end-of-life recycling.
• Protect community health and safety throughout the global PV industry, including supply chains and recycling.

Toward a Just and Sustainable Solar Energy Industry
2 - Silicon Valley Toxics Coalition
Figure 1: Annual Global Production of Photovoltaic Cells: 1980–2007
Figure 2: Cumulative Global Sales of Photovoltaic Modules: 1996–2007
I. Introduction
The solar photovoltaic (PV) industry is at the forefront of a multibillion dollar “clean and green” technology sector that is
seeking solutions to the critical environmental issues that threaten the planet. The solar PV industry has seen tremendous
growth in the past decade and continues to expand even as credit markets contract. In 2007, the industry grew by 62
percent and earned $17.2 billion in global revenues.1 The number of solar cells produced globally has increased sevenfold
in the past five years, and cumulative installations have increased fivefold over that time.2
Although solar power now provides just 1/10th of 1 percent of U.S. energy consumption, that share is rapidly expanding as
costs become more competitive with conventional energy sources. By some estimates, each time the volume of solar PV cell
shipments doubles, the price falls by about 20 percent.3 The sector forecasts sustained growth, as calls for carbon-free
energy and green jobs translate into increased investment in renewable energy, tax incentives for solar PV systems, and
subsidies for solar PV research.†
Solar energy is an essential part of the global move toward
clean, renewable energy, and it is critical that the growing
solar PV industry is itself truly safe and sustainable. Little
attention is currently being paid to the potential risks and
consequences of scaling up solar PV cell production. The
solar PV industry must address these issues immediately, or
risk repeating the mistakes made by the microelectronics
industry.4 The electronics industry’s lack of environmental
planning and oversight resulted in widespread toxic chemical
pollution that caused death and injury to workers and people
living in nearby communities. The high-tech industry’s legacy
now includes the growing global tide of toxic electronic
waste, or e-waste.5
† The federal budget for solar PV research was $106 million in 2007. Department of Energy, “Budget.” http://www1.eere.energy.gov/solar/budget.html (accessed July 13, 2008).
Figure 1 and 2 used courtesy of Worldwatch Institute, Vital Signs Online, www.worldwatch.org

Toward a Just and Sustainable Solar Energy Industry
3 - Silicon Valley Toxics Coalition
Although the solar PV boom is still in its early stages,
disturbing global trends are beginning to emerge. For
example, much of the polysilicon feedstock material (the
highly refined silicon used as the basic material for
crystalline silicon PV cells) is produced in countries like
China, where manufacturing costs and environmental
regulatory enforcement are low.6 In March 2008, the
Washington Post reported that at least one plant in China’s
Henan province is regularly dumping extremely toxic silicon
tetrachloride (a corrosive and toxic waste product of
polysilicon manufacturing) on nearby farmland. According to
Li Xiaoping, deputy director of the Shanghai Academy of
Environmental Sciences, “Crops cannot grow on this, and it
is not suitable for people to live nearby.”7 Silicon
tetrachloride makes the soil too acidic for plants, causes
severe irritation to living tissues, and is highly toxic when
ingested or inhaled.8
For more than 25 years, the Silicon Valley Toxics Coalition
(SVTC) has been a leading advocate for safety and manufacturer responsibility in the electronics industry. SVTC is now
applying that long experience to the solar PV industry with its Clean and Just Solar Industry initiative. The initiative’s goal
is to ensure that this promising new technology is as safe and sustainable as possible by promoting “cradle to cradle”
product stewardship and “lifecycle thinking” throughout the solar PV supply chain.
SVTC is urging the adoption of policies that:
• Reduce and eventually eliminate the use of toxic materials and develop environmentally sustainable practices.
This includes proper testing of new and emerging materials based on a precautionary approach. This approach requires
that materials be proven safe before use, rather than waiting until they cause harm.
• Ensure that solar PV manufacturers are responsible for the lifecycle impacts of their products through Extended
Producer Responsibility (EPR) (see sidebar, page 3). Solar PV companies should take back decommissioned solar
panels and recycle them responsibly. Responsible recycling does not export waste overseas or use U.S. prison labor.
Extended Producer Responsibility
Extended Producer Responsibility (EPR) requires companies to take responsibility for the impacts of their products: from the materials used in manufacturing to product recycling. One well-known form of EPR is producer take back, which requires companies to take back their products when users are done with them and ensure that they are recycled safely and responsibly.
EPR policies provide incentives for companies to design and produce cleaner and more easily recyclable products, and discourage the practice of “planned obsolescence” (intentionally making products that quickly become out of date or useless).
Although all electronics companies take back their products in the European Union, some companies (including Dell, HP, and Sony) have already adopted voluntary take-back policies in the U.S., setting the pace for the rest of the industry. In the U.S., 15 states have passed legislation mandating some type of EPR.†
†Electronics TakeBack Coalition, http://www.computertakeback.com

Toward a Just and Sustainable Solar Energy Industry
4 - Silicon Valley Toxics Coalition
• Ensure proper testing of new and emerging materials and processes based on a precautionary approach.
Those advocating the use of new chemicals or processes must prove their safety (rather than requiring communities
or workers to prove their dangers).
• Expand recycling technology and design
products for easy recycling: Current solar PV
products contain many toxic materials that should
not enter the waste stream when products are
decommissioned. Requiring manufacturer
responsibility will provide an incentive to design
less-toxic solar PV products that are easier to
recycle. It will also spur development of safe
recycling technologies.
• Promote high-quality “green jobs” that protect
worker health and safety and provide a living
wage throughout the global PV industry,
including supply chains, production, and recycling.
Manufacturers must monitor supply chains to
ensure safe and just conditions for workers. (See
Green Jobs sidebar).
• Protect community health and safety
throughout the global PV industry, including
supply chains and end-of-life recycling. People
have the right to know what toxic materials are
being used in their communities.
Green Jobs The emerging environmental sector has the potential to create millions of “green jobs” at all levels and help revitalize the U.S. industrial economy. A broad spectrum of U.S. labor unions, environmentalists, community groups, and businesses is calling for major nationwide investments in a new clean energy economy that addresses climate stability, energy security, and economic prosperity.
The accepted definition of "green-collar jobs" closely follows that developed by Raquel Pinderhughes, professor of urban studies at San Francisco State University.† Green-collar jobs improve environmental quality while offering a living wage, health and other benefits, job satisfaction, access for entry-level workers, and opportunities for career advancement.
Major national organizations, including the Apollo Alliance and Green for All, are proposing concrete programs for the large-scale creation of green-collar jobs. The Apollo Alliance’s New Apollo Program, for example, proposes a comprehensive investment strategy of $500 billion over the next ten years that would create five million high-quality green-collar jobs and transform the U.S. energy infrastructure.
The solar sector has the potential to open up hundreds of thousands of jobs in fields including manufacturing, construction, installation, and maintenance. However, without careful attention to job quality, this industry that seeks to be environmentally sustainable could end up producing unsustainable jobs—jobs that keep workers and their families in poverty, add to the nation's health insurance crisis, or put workers' health and safety at risk through toxic exposure. As Green for All puts it, “We must say ‘No’ to solar sweatshops and Wal-Mart wind farms.” As the solar PV industry grows, we must ensure that the resources invested in the industry are used to create high-quality jobs that are accessible to all workers and communities.
† Raquel Pinderhughes, Green Collar Jobs, Berkeley Office of Energy and Sustainable Development, 2007.

Toward a Just and Sustainable Solar Energy Industry
5 - Silicon Valley Toxics Coalition
II. Overview of Solar Photovoltaic (PV) Technology
A. Solar PV Basics
Solar energy technology uses the “photovoltaic (PV) effect” to capture sunlight and convert it into electricity. Typically,
solar PV cells are made by sandwiching together two thin layers of semiconductor material. The two layers have slightly
different chemical compositions that facilitate electron transfer between them. When sunlight energy is absorbed by a solar
cell,† it causes electrons to “escape” from molecules in one layer of material and move to those in the other. This creates
an electrical field that can be converted into electricity (see Figure 3).
Today’s most common solar PV technology is based
on silicon semiconductors and uses manufacturing
processes and materials similar to those of the
microelectronics industry. In addition, the solar PV
industry is rapidly developing novel materials and
processes to increase cell efficiency (the amount of
solar energy converted into electricity per area of
semiconductor). New technologies are also lowering
costs by using less semiconductor material and
streamlining production. At the leading edge of
today’s PV industry are “thin-film” cells. These use
very small amounts of semiconductor materials,
which are applied in thin layers to inexpensive glass,
metal, and plastic surfaces. Potential thin-film
applications also include construction materials,
such as roof tiles and siding, and even clothing, for
“wearable” PV.
Unfortunately, many of these new technologies use
toxic, explosive, corrosive, or potentially
carcinogenic materials, such as cadmium and
selenium. Other processes rely on newly developed
materials that have not been sufficiently tested for
† The terms solar photovoltaic (PV) “cells,” “modules,” and “panels” will be used interchangeably throughout this report. The solar cell is the manufactured unit of PV technology, typically ranging from less than one inch to several inches across, and it includes semiconductor material, a substrate, a protective layer, and wiring to conduct electricity. Cells are assembled into modules, and modules are assembled into larger collections of panels and arrays.
Figure 3: Close-up of a PV Cell
Figure 3 used courtesy of Online Solar Inc., https://www.mrsolar.com

Toward a Just and Sustainable Solar Energy Industry
6 - Silicon Valley Toxics Coalition
Figure 5: Polycrystalline Panel
toxicity. Increasingly, these materials are the products of
nanotechnology (nanotech), which relies on the distinctive
chemical, physical, and electrical properties of materials at
the molecular scale. Nanotech could potentially provide
new and useful materials for a wide range of industries, but
the novel properties of these materials present significant
challenges to safeguarding workers, consumers, and the
environment.9,10
B. Crystalline Silicon (c-Si) Solar Cells
Silicon-based solar cells were first used in the 1950s, and
they remain the backbone of the solar industry. Crystalline
silicon (c-Si) cells—those typically used in rooftop panels
and large utility company arrays—dominate the solar PV
industry and will continue to do so in the near future.11
However, the dominance of c-Si is waning somewhat. In
2004, approximately 88 percent of the solar PV panels
produced in the U.S. were c-Si, but by 2006 that
percentage had fallen to 69 percent.12
Individual c-Si cells are assembled from thin wafers of silicon that are cut from monocrystalline silicon cylinders (called
“rods” or “ingots”) or from blocks of cast multicrystalline silicon. Two wafers are slightly altered (or “doped”) with small
amounts of different impurities to facilitate electron transfer, for example
phosphorous in one wafer and boron in another. The wafers are sandwiched
together between glass or layers of ethyl vinyl acetate and a polymer laminate
to protect the cells. Metal grids and contacts conduct the electrical energy
produced, and inverters change the direct current (DC) produced by solar cells
to the alternating current (AC) used in power lines (see Figure 3, page 5).
Solar PV cells are combined into modules (typically several square feet), then
into panels or arrays. One significant problem for c-Si production is the loss of
material in sawing—as much as 50 percent of the highly refined and
increasingly expensive silicon is lost in the process.13
† Source: Daniel Ruoss, Market Overview of Silicon and Non-Silicon Technologies and a Perspective of the PV Market and Technologies Development, Envision,
Figure 4: Global Market Share of Solar PV Semiconductors in 2007†
*Other includes gallium arsenide, zinc manganese tellurium, indium gallium phosphide/germanium, and indium gallium nitride a Legend: c-Si - Crystalline silicon a-Si - Amorphous silicon CIS - Copper indium selenide CIGS - Copper indium gallium selenide CdTe - Cadmium telluride
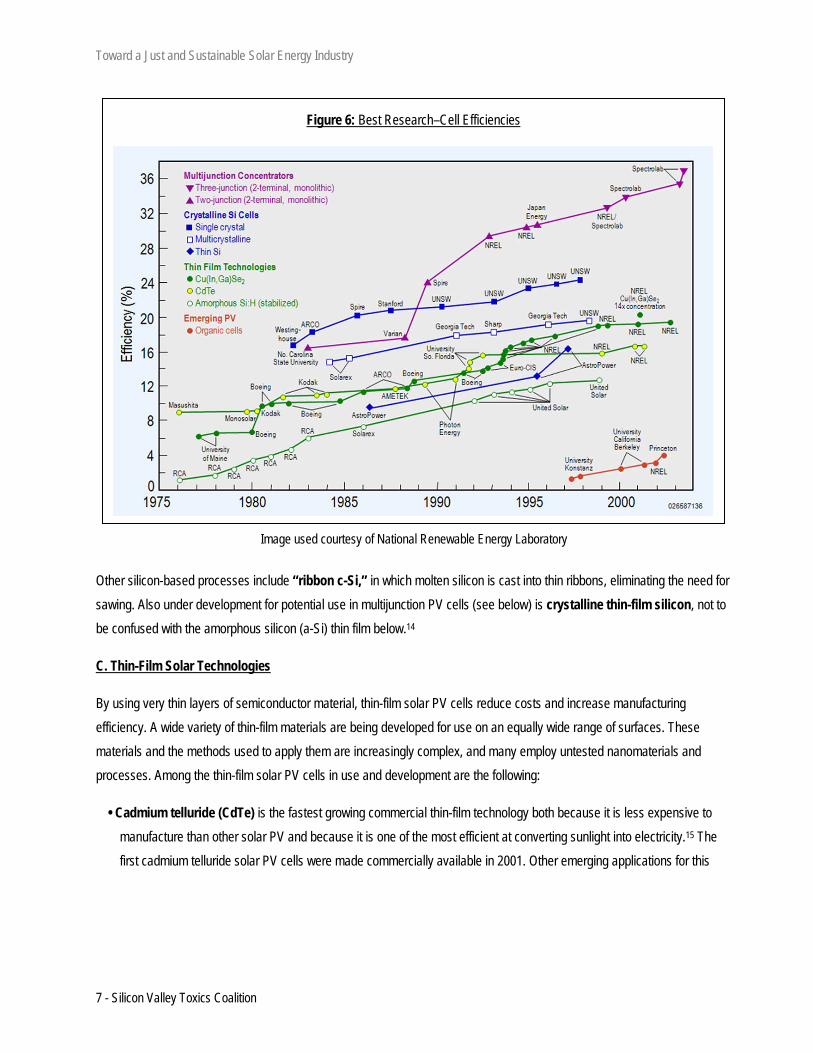
Toward a Just and Sustainable Solar Energy Industry
7 - Silicon Valley Toxics Coalition
Other silicon-based processes include “ribbon c-Si,” in which molten silicon is cast into thin ribbons, eliminating the need for
sawing. Also under development for potential use in multijunction PV cells (see below) is crystalline thin-film silicon, not to
be confused with the amorphous silicon (a-Si) thin film below.14
C. Thin-Film Solar Technologies
By using very thin layers of semiconductor material, thin-film solar PV cells reduce costs and increase manufacturing
efficiency. A wide variety of thin-film materials are being developed for use on an equally wide range of surfaces. These
materials and the methods used to apply them are increasingly complex, and many employ untested nanomaterials and
processes. Among the thin-film solar PV cells in use and development are the following:
• Cadmium telluride (CdTe) is the fastest growing commercial thin-film technology both because it is less expensive to
manufacture than other solar PV and because it is one of the most efficient at converting sunlight into electricity.15 The
first cadmium telluride solar PV cells were made commercially available in 2001. Other emerging applications for this
Image used courtesy of National Renewable Energy Laboratory
Figure 6: Best Research–Cell Efficiencies

Toward a Just and Sustainable Solar Energy Industry
8 - Silicon Valley Toxics Coalition
material include the use of quantum dots,† which are also being investigated for use in applications such as LEDs and
medical imaging.16
• Copper Indium Selenide (CIS) and Copper Indium Gallium Selenide (CIGS)
Although CIS and CIGS thin-film technologies have only been recently commercialized, they are producing impressive
efficiency rates (approaching 20 percent) in laboratory tests (see Figure 6, page 7). These new technologies have the
potential to revolutionize the solar industry with cheap, efficient PV cells. They use a process very similar to ink
printing or lithography to apply semiconductor material to a wide range of lightweight backings. Some companies are
using nanotechnology to increase CIGS efficiencies.17
• Amorphous silicon (a-Si) solar PV cells are widely used to power small, low-power consumer devices like watches,
calculators, and outdoor lighting. This non-crystalline form of silicon is applied as a thin film to various surfaces.
Amorphous silicon cells have been commercially available since the 1970s, and they are relatively inefficient at
converting sunlight to electricity (reaching a maximum of about 12 percent).18 However, because they are a thousand
times thinner than c-Si cells, they use less silicon and are much cheaper to produce. They can also be made more
efficient by stacking with other thin-film semiconductors.19
D. Gallium Arsenide (GaAs) and Multijunction Cells
Multijunction solar PV panels use two or more types of semiconductor cells that absorb different parts of the solar
spectrum. The ability to capture light from this broader spectrum makes multijunction cells more efficient. The maximum
efficiency of a single solar cell based on one material is about 30 percent, but multijunction cells are already approaching
40 percent in laboratory tests.20 Because of their complexity, multijunction PV cells are expensive to manufacture, limiting
current commercial availability to military and communications satellites.
Current multijunction PV cells use gallium arsenide (GaAs) combined with thin-film materials such as cadmium telluride
(CdTe) and amorphous silicon (a-Si). Additional materials under development for multijunction cells include zinc
manganese tellurium, indium gallium phosphide/germanium, and indium gallium nitride.
† Quantum dots are semiconductor crystals fabricated from the bottom up. Rather than being cut from larger crystals, quantum dots are precipitated onto a surface, creating less waste in the process. These are nanometer-scale particles, so they exhibit quantum properties that come with advantages (such as potential to produce dots of different sizes to absorb different parts of the solar spectrum); but they also present potential risks and uncertain hazards. Quantum dots are made from materials such as carbon, silicon, gallium arsenide, cadmium telluride, and cadmium selenide.

Toward a Just and Sustainable Solar Energy Industry
9 - Silicon Valley Toxics Coalition
III. Hazardous Materials Used in Solar PV Cell Production
Silicon-based solar PV production involves many of the same materials as the microelectronics industry and therefore
presents many of the same hazards. At the same time, emerging thin-film and nanotech-based cells pose unknown health
and environmental dangers. This section provides an overview of the hazards posed by current and emerging solar PV
production technologies.
A. Crystalline Silicon (c-Si)
As with the production of silicon chips, production of c-Si wafers begins with the mining of silica (SiO2), found in the
environment as sand or quartz.† Silica is refined at high temperatures to remove the O2 and produce metallurgical
grade silicon, which is approximately 99.6 percent pure. However, silicon for semiconductor use must be much purer.
Higher purities are achieved through a chemical process that exposes metallurgical grade silicon to hydrochloric acid
and copper to produce a gas called trichlorosilane (HSiCl3). The trichlorosilane is then distilled to remove remaining
impurities, which typically include chlorinated metals of aluminum, iron, and carbon. It is finally heated or “reduced”
with hydrogen to produce silane (SiH4) gas. The silane gas is either heated again to make molten silicon, used to
grow monocrystalline silicon crystals, or used as an input for amorphous silicon (see next section).
The next step is to produce crystals of either monocrystalline or multicrystalline silicon. Monocrystalline silicon rods
are pulled from molten silicon, cooled, and suspended in a reactor at high temperature and high pressure. Silane gas
is then introduced into the reactor to deposit additional silicon onto the rods until they “grow” to a specified diameter.
To produce multicrystalline silicon, molten silicon is poured into crucibles and cooled into blocks or ingots. Both
processes produce silicon crystals that are extremely pure (from 99.99999 to 99.9999999 percent), which is ideal for
microchips, but far more than required by the PV industry. The high temperatures required for c-Si production make it
an extremely energy intensive and expensive process, and also produces large amounts of waste. As much as 80
percent of the initial metallurgical grade silicon is lost in the process.21
Sawing c-Si wafers creates a significant amount of waste silicon dust called kerf, and up to 50 percent of the
material is lost in air and water used to rinse wafers.22 This process may generate silicon particulate matter that will
pose inhalation problems for production workers and those who clean and maintain equipment. The U.S.
Occupational Safety and Health Administration (OSHA) has set exposure limits to keep ambient dust levels low and
recommends the use of respiratory masks, but it has been suggested that, despite the use of respiratory masks,
workers remain overexposed to silicon dust.23
† The mining of metallurgical grade silica can produce silica dust that has been associated with silicosis, a severe lung disease. Only a fraction of silica goes to the semiconductor industries, with most being mined for the steel industry.
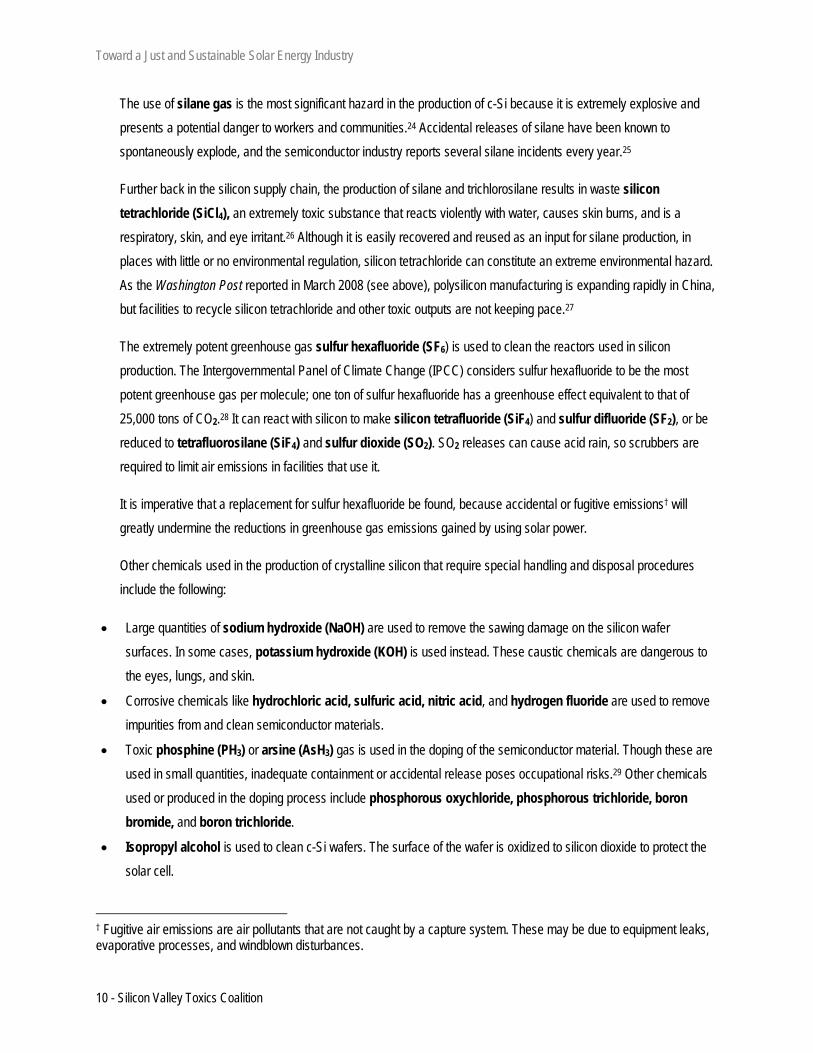
Toward a Just and Sustainable Solar Energy Industry
10 - Silicon Valley Toxics Coalition
The use of silane gas is the most significant hazard in the production of c-Si because it is extremely explosive and
presents a potential danger to workers and communities.24 Accidental releases of silane have been known to
spontaneously explode, and the semiconductor industry reports several silane incidents every year.25
Further back in the silicon supply chain, the production of silane and trichlorosilane results in waste silicon
tetrachloride (SiCl4), an extremely toxic substance that reacts violently with water, causes skin burns, and is a
respiratory, skin, and eye irritant.26 Although it is easily recovered and reused as an input for silane production, in
places with little or no environmental regulation, silicon tetrachloride can constitute an extreme environmental hazard.
As the Washington Post reported in March 2008 (see above), polysilicon manufacturing is expanding rapidly in China,
but facilities to recycle silicon tetrachloride and other toxic outputs are not keeping pace.27
The extremely potent greenhouse gas sulfur hexafluoride (SF6) is used to clean the reactors used in silicon
production. The Intergovernmental Panel of Climate Change (IPCC) considers sulfur hexafluoride to be the most
potent greenhouse gas per molecule; one ton of sulfur hexafluoride has a greenhouse effect equivalent to that of
25,000 tons of CO2.28 It can react with silicon to make silicon tetrafluoride (SiF4) and sulfur difluoride (SF2), or be
reduced to tetrafluorosilane (SiF4) and sulfur dioxide (SO2). SO2 releases can cause acid rain, so scrubbers are
required to limit air emissions in facilities that use it.
It is imperative that a replacement for sulfur hexafluoride be found, because accidental or fugitive emissions† will
greatly undermine the reductions in greenhouse gas emissions gained by using solar power.
Other chemicals used in the production of crystalline silicon that require special handling and disposal procedures
include the following:
• Large quantities of sodium hydroxide (NaOH) are used to remove the sawing damage on the silicon wafer
surfaces. In some cases, potassium hydroxide (KOH) is used instead. These caustic chemicals are dangerous to
the eyes, lungs, and skin.
• Corrosive chemicals like hydrochloric acid, sulfuric acid, nitric acid, and hydrogen fluoride are used to remove
impurities from and clean semiconductor materials.
• Toxic phosphine (PH3) or arsine (AsH3) gas is used in the doping of the semiconductor material. Though these are
used in small quantities, inadequate containment or accidental release poses occupational risks.29 Other chemicals
used or produced in the doping process include phosphorous oxychloride, phosphorous trichloride, boron
bromide, and boron trichloride.
• Isopropyl alcohol is used to clean c-Si wafers. The surface of the wafer is oxidized to silicon dioxide to protect the
solar cell.
† Fugitive air emissions are air pollutants that are not caught by a capture system. These may be due to equipment leaks, evaporative processes, and windblown disturbances.

Toward a Just and Sustainable Solar Energy Industry
11 - Silicon Valley Toxics Coalition
• Lead is often used in solar PV electronic circuits for wiring, solder-coated copper strips, and some lead-based
printing pastes.
• Small quantities of silver and aluminum are used to make the electrical contacts on the cell.
Chemicals released in fugitive air emissions by known manufacturing facilities include trichloroethane, acetone,
ammonia, and isopropyl alcohol.30
A1. Monocrystalline Silicon Production Hazards
Monocrystalline silicon (mono c-Si) is formed when the one single crystal cools into a cylinder (called a rod or ingot).
Thin wafers are then cut from the cylinder.
Mono c-Si is produced in large quantities for the computer industry. Because the purity of silicon needed for solar PV
is less than that required for silicon chips, the PV industry has historically relied on purchasing (at reduced cost)
silicon wafers and polysilicon feedstock rejected by the chip makers.31 The production of solar grade silicon is growing
as demand in the PV industry is outstripping the available computer industry castoffs.
In addition to the chemicals used by all crystalline silicon cell production (see above), additional chemicals used to
manufacture mono c-Si solar cells include ammonium fluoride, nitrogen, oxygen, phosphorous, phosphorous
oxychloride, and tin.32 Like most industrial chemicals, these materials require special handling and operating
standards to prevent workplace hazards or exposure to toxics.
For further explanation of the above process diagram refer to Figure 7 in Appendix B, page 39.
Figure 7: Crystalline Silicon Generic Process Diagram

Toward a Just and Sustainable Solar Energy Industry
12 - Silicon Valley Toxics Coalition
A2. Multicrystalline Silicon Production Hazards
To make multicrystalline silicon (multi c-Si) wafers, molten silicon is poured into crucibles under an inert atmosphere
of argon gas and slowly cooled to form thin squares. These cells are typically less pure than mono c-Si, particularly
around the edges due to contact with the crucible during crystallization. They are less efficient but are also less
expensive and less energy-intensive to make. Multi c-Si has a significant share of the c-Si market at about 67 percent
in 2004.33 Overall, the lifecycle impacts of mono c-Si and multi c-Si have a similar profile, although the energy used in
production is higher for mono c-Si.34
Other materials used or produced in the manufacturing of multi c-Si that require special handling and operating
procedures include ammonia, copper catalyst, diborane, ethyl acetate, ethyl vinyl acetate, hydrogen, hydrogen
peroxide, ion amine catalyst, nitrogen, silicon trioxide, stannic chloride, tantalum pentoxide, titanium, and
titanium dioxide.35
New production practices are on the c-Si manufacturing horizon, and new technologies are being developed to
significantly reduce energy consumption.36 Efforts are being made to make thinner wafers—microcrystalline Si and
nanocrystalline Si—that use less silicon, but these require manufacturing techniques from nanotechnology that may
pose new kinds of occupational risks.
B. Amorphous Silicon (a-Si) Thin Film
The chemical composition of amorphous silicon (a-Si) allows it to be deposited in a thin layer on materials such as
plastics, glass, and metal. To make a-Si cells, silane or chlorosilane gas is heated and mixed with hydrogen, then
deposited as a thin film of a-Si (an alloy of silicon and hydrogen) on these materials. As mentioned previously, silane
(SiH4) gas is extremely explosive and poses a potential hazard to production workers and nearby communities.37 The
semiconductor industry has a history of silane gas explosions and occupational injuries.38 Chlorosilane gases are also
very toxic and highly flammable.39 However, because the amount of silicon used is much smaller than in crystalline
silicon production, less silane is needed to produce a-Si.
Hydrogen is also an explosive gas, and therefore poses an occupational hazard for workers.40 In addition, methane
gas is often mixed with the waste streams from the deposition process to literally burn off additional hydrogen.
Methane is another highly flammable gas that poses a greenhouse gas threat if released into the atmosphere.
Germane gas, often used to dope a-Si, is also explosive and considered toxic to the blood and kidneys.41
Chemicals used to etch and clean wafers—such as hydrochloric acid, hydrofluoric acid, phosphoric acid, and
sodium hydroxide—require special handling to avoid occupational injury. Other dangerous chemicals used in the
manufacture of a-Si include acetone, aluminum, chlorosilanes, diborane, phosphine, isopropanol, nitrogen,
silicon tetrafluoride, tin, and, where germane is used, germanium and germanium tetrafluoride.42 The
tetrafluoride compounds above can emit toxic fumes if heated.

Toward a Just and Sustainable Solar Energy Industry
13 - Silicon Valley Toxics Coalition
Figure 8: Amorphous Silicon (a-Si) Generic Process Diagram
C. Cadmium Telluride (CdTe) Thin Film
Cadmium telluride (CdTe) thin-film solar PV panels use layers of CdTe and cadmium sulfide (CdS). Cadmium (Cd) is
a by-product of zinc mining, and batteries and solar cells are major end uses. The rare metal tellurium (Te) is a by-
product of copper, lead, and gold mining, and its scarcity may eventually prove to be a bottleneck for CdTe cell
production. This will make the recovery of Te through recycling essential for the success of this rapidly growing
technology.
Cadmium telluride PV cells are produced by a process called electrodeposition, which efficiently applies a thin film of
semiconductor material to glass or plastic, with less raw material waste than amorphous silicon thin-film production.
CdTe thin films are deposited via electrical charge onto a surface using a solution of cadmium sulfate (CdSO4) or
cadmium chloride (CdCl2), mixed with tellurium dioxide (TeO2). Cadmium in wastewater used to rinse CdTe films
presents potential water pollution issues, but it can be reclaimed and reused in the deposition of the cadmium sulfide
(CdS) layer.43
There are several ways of producing the CdS layer. One method deposits the layer by heating the surface and directly
applying a mixture of cadmium sulfate (CdSO4), thiourea (also called thiocarbamide, CS(NH2)2), and ammonia (NH3);
only 1 percent of the cadmium used as an input is disposed of as solid waste.44
Another method uses the same chemicals and dips the surface into a chemical bath, but this method is less efficient
in terms of raw material use. A third method deposits a solid CdS powder directly onto the surface after vaporizing the
chemicals. In each of these methods the cadmium compounds are recycled, albeit not at 100 percent, as some
For further explanation of the above process diagram refer to Figure 8 in Appendix B, page 39.

Toward a Just and Sustainable Solar Energy Industry
14 - Silicon Valley Toxics Coalition
material is released in air exhaust and water effluent. For the latter two methods mentioned above, 10 to 30 percent of
cadmium input is disposed of as solid waste.45
The major health and safety hazards associated with the manufacture of CdTe cells relate to the use of cadmium,
cadmium sulfide, cadmium chloride, and thiourea. Cadmium is a known carcinogen46 and is considered
“extremely toxic” by the U.S. Environmental Protection Agency (EPA)47 and Occupational Safety and Health
Administration (OSHA).48 It has the potential to cause kidney, liver, bone, and blood damage from ingestion and lung
cancer from inhalation, and workers may be exposed to cadmium compounds during the manufacturing process. The
European Economic Community (EEC) has prohibited the sale of most products containing cadmium for health and
safety reasons. While the toxicity of cadmium is well known, there is limited information on cadmium telluride (CdTe)
toxicology.49 It is not clear whether or not the EEC will grant CdTe manufacturers the exemptions necessary to allow
sales of these modules in the European Union (E.U.). It is believed to be less toxic than cadmium compounds found in
nickel cadmium (NiCd) batteries.50 The Pesticide Action Network recognizes thiourea as a “Bad Actor Chemical”
because it is a known carcinogen and can be toxic.51
For further explanation of the above process diagram refer to Figure 9 in Appendix B, page 40.
Figure 9: Cadmium Telluride (CdTe) Generic Process Diagram

Toward a Just and Sustainable Solar Energy Industry
15 - Silicon Valley Toxics Coalition
The potential for dust and fumes creates potential hazards for workers during the preparation of materials, from
scraping and cleaning CdTe products, and from fugitive emissions. Other hazardous inputs in the production of CdTe
panels include molybdenum, nickel, sulfur, tellurium, and tin.52
As noted previously, the emerging use of nanoscale CdTe, also known as CdTe quantum dots, raises unknown safety
issues that must be identified and addressed.53 Properties of materials at the nanoscale may differ significantly from
those of larger particles of the same material, including increased toxicity, potential for bioaccumulation, and
nanoparticle mobility in the body.
Another safety concern regarding materials used in CdTe (and also in CIS/CIGS cells, discussed below), is the risk of
toxic releases during fires in residential and commercial structures where these cells are installed. The compounds
that would be released during fires pose a potential risk of toxic exposure, although the short-term nature of fires and
the fact that cadmium vaporizes at temperatures higher than typical household fires, suggest that the risk is minimal.54
However, the release of toxics from commercial buildings and industrial facilities during fires remains a concern, as
fire temperatures can be higher in these kinds of structures.
D. Copper Indium Selenide (CIS) and Copper Indium Gallium Selenide (CIGS)
This rapidly emerging solar PV semiconductor technology has the potential to revolutionize the industry with its ability
to print thin layers of semiconductor material on a wide range of materials. CIS and CIGS are also some of the best-
absorbing semiconductor materials.
Depositing the CIS/CIGS layers onto a surface requires the mixing of copper and indium (and gallium in CIGS) with
hydrogen selenide and the use of various industrial techniques.55 One new process using nano-sized particles in an
ink suspension is able to utilize 100 percent of gallium and indium inputs, which is important because these are
globally rare metals.56
There is little information available about the toxicity of CIS or CIGS crystals, but numerous chemicals are used in the
production of CIS and CIGS panels, many of them very toxic. These include hydrogen selenide (or selenium
hydride, H2Se), which is considered highly toxic and dangerous at concentrations as low as 1 part per million in the
air. It is used as the primary source of selenium and is consumed in the step called selenization, in which hydrogen
selenide is introduced into the atmosphere of a reactor to provide excess selenium to react with the other metals.
Hydrogen selenide will present potential occupational health and safety issues. New processes that avoid using
hydrogen selenide have been developed, but these are more expensive and are not currently used to manufacture
CIS/CIGS.57
Another concern with the use of selenium is the potential formation of selenium dioxide (SeO2) at high temperatures.
Selenium dioxide is a tissue poison like arsenic, and great care must be taken to ensure that workers are not exposed
to this occupational air pollutant.58 Reactions at high temperatures facilitate the uniformity of CIGS and CIS crystals,

Toward a Just and Sustainable Solar Energy Industry
16 - Silicon Valley Toxics Coalition
which is important for scaling up solar cell production. Selenium dioxide is vented into a water solution, where it forms
elemental selenium. The recovery of selenium in this step is very high, but not 100 percent, and fugitive emissions do
occur.59
CIS/CIGS panels often use a layer of cadmium sulfide (CdS). Salts of cadmium are released into the water as CIS
cells are rinsed, which means that the concerns above about cadmium apply. The CdS layer can be replaced with an
alternative material, such as zinc sulfide (ZnS) or indium sulfate (In2SO4), but CdS is more efficient.60
Copper, indium, and selenium are considered to have a mild toxicity, while gallium (only used in CIGS) has a low
toxicity. Dust from copper, indium, gallium, and selenium accumulate in the equipment used for production, presenting
potential inhalation risks to workers.61 Other materials used in CIS and CIGS production include hydrogen sulfide (a
gas used in CIS cell production), molybdenum, and zinc oxide. Molybdenum and zinc oxide are used as the back
and front contacts that carry the electricity and are considered non-toxic.62
For further explanation of the above process diagram refer to Figure 10 in Appendix B, page 40Figure 10: Copper Indium (Gallium) Selenide (CIS/CIGS) Process Diagram
For further explanation of the above process diagram refer to Figure 10 in Appendix B, page 40.

Toward a Just and Sustainable Solar Energy Industry
17 - Silicon Valley Toxics Coalition
E. Gallium Arsenide (GaAs) and Multijunction Cells
Gallium arsenide (GaAs) is currently used in multijunction solar PV cells, combined with thin-film materials such as
cadmium telluride (CdTe), amorphous silicon (a-Si), aluminum indium phosphide (AlInP), aluminum gallium
indium phosphide (AlGaInP), or gallium indium phosphide (GaInP). GaAs technology is also used in concentrator
cells, which focus incoming sunlight to increase its intensity. Because of the high cost of inputs and the manufacturing
process, GaAs cell adoption has been limited to communication and military satellite applications.
The production of GaAs crystals starts with gallium and arsenic in pure form. The materials are combined and GaAs
crystals grow on a surface made of germanium or silicon. Newer methods use trimethyl gallium ((CH3)3Ga) and
trimethyl arsenic ((CH3)3As) gases. There is a debate in the scientific community about whether trimethyl arsenic
detoxifies arsenic or transforms it into a carcinogen.63 These gases are exposed to a heated surface where the GaAs
crystals are grown. Different layers of these crystals are doped with different gases to make each layer sensitive to
different parts of the solar spectrum.
The limited toxicological data on gallium arsenide suggest that it could have profound effects on lung, liver, immune,
and blood systems if workers are exposed for extensive periods during manufacturing or if chemicals are accidentally
released.64 There is little toxicological data on gallium, but it is widely used as a marker/tag in MRI tests, and believed
to be safe in small doses.
For further explanation of the above process diagram refer to Figure 11 in Appendix B, page 41.
Figure 11: Gallium Arsenide (GaAs) Generic Process Diagram

Toward a Just and Sustainable Solar Energy Industry
18 - Silicon Valley Toxics Coalition
Additional toxic materials used to produce GaAs PV cells include the following:
• Arsenic is a metalloid used to produce gallium arsenide crystals. Arsenic is highly toxic and carcinogenic,65 and
extreme caution will be required to avoid occupational hazards as the use of this technology expands.
• Phosphine and arsine are highly toxic gases used to dope GaAs crystals, but they are not found in the final PV
cells. Less toxic alternatives are being developed (including tertiary butyl arsine and tertiary butyl phosphine),66
and researchers are looking into substituting hydrogen with non-explosive (inert) nitrogen.
• Trichloroethylene, a known carcinogen, is a solvent used for cleaning. Other chemicals used or produced in the
manufacturing process include hydrochloric acid, methane, triethyl gallium, and trimethyl gallium, 67
F. Emerging Solar PV Technologies
It is difficult to speculate about the production hazards presented by the next generation of solar PV technology as
most are still in the theoretical or laboratory stages of development. Future applications for solar PV include new
configurations of multijunction cells, as well as the following:
• Dye-sensitized solar cells release electrons from (in one particular case) titanium dioxide covered in a pigment
that effectively absorbs sunlight.
• Organic (living or dead carbon-based) solar cells are made of biodegradable materials. At this point, many of
these organic technologies degrade during operation, making them very unstable and far from commercial
viability.
• Hybrid cells that combine various technologies and therefore present all the production hazards associated with
their constituent semiconductors.
Emerging solar cell technologies are also rapidly incorporating advanced techniques in nanotechnology, such as the
deposition of nanocrystals. Nanotechnology applications to solar cell manufacturing include nanoparticles suspended
in ink, quantum dots, nanowires, and silver cells. Nanotech is also being used to produce very stable laminate layers
to protect solar cells. These emerging uses merit considerable attention and the development of proactive labor
standards to safeguard against unknown hazards.

Toward a Just and Sustainable Solar Energy Industry
19 - Silicon Valley Toxics Coalition
IV. Potential End-of-Life Hazards for Solar PV Products
What will happen to today’s solar panels at the end of their usefulness, which is estimated at 25 years or more? Not only
do solar PV products contain many of the same materials as electronic waste (e-waste), but they also contain a growing
number of new and emerging materials that present complex recycling challenges. These challenges include finding ways
to recycle the small amounts of valuable materials on which many of the new solar PV technologies are based.
Much like e-waste, solar panels will leave a toxic legacy if they end up in landfills (where the materials they contain can
leach into groundwater) or incinerators (where burning can release toxic materials into the air).68 To avoid a repeat of the
e-waste crisis, we need to ensure that decommissioned solar PV products are recycled responsibly and do not enter the
waste stream at all. Responsible recycling means that waste is not shipped to developing countries for dismantling or
recycled using U.S. prison labor.
One option could be to recycle solar PV panels that contain toxic metals at existing responsible e-waste recycling facilities†
or at facilities that recycle batteries containing lead and cadmium, thereby keeping toxics out of the municipal incinerators
and landfills.69 However, the latter hazardous waste recovery facilities are often low-tech and in need of substantial
research and development to improve their environmental footprint. For example, most recycling facilities reclaim metals
using smelters, which are known to increase the risk of lung cancer from cadmium exposure in recycling workers and
residents in nearby communities.70
Extended Producer Responsibility (EPR), such as manufacturer take-back requirements (see sidebar, page 3), will be the
key to ensuring that these complex and diverse solar PV products can be safely recycled. Making manufacturers
responsible for the lifecycle impacts of their products will provide incentives for the development of safe and effective
recycling technologies and for the design of products that are easier to recycle. Plans for recovering and recycling
materials at the end of product life should be standard practice for any product identified as a “renewable” energy source.
A. Solar PV Toxic Waste is Also E-Waste
Because solar PV semiconductor manufacturing processes have roots in the microelectronics industry, many of the
chemicals found in e-waste are also found in solar PV, including lead, brominated flame retardants, cadmium, and
chromium. Each of these is described in more detail below. Many of the toxic materials currently used in the PV sector
are being phased out of electronic products in the E.U., but are still currently used in most of the U.S.
† Recyclers that have signed the landmark “Electronic Recyclers Pledge of True Stewardship.” For additional information, see: http://www.computertakeback.com/the_solutions/recycler_s_pledge.cfm

Toward a Just and Sustainable Solar Energy Industry
20 - Silicon Valley Toxics Coalition
Lead is often used in electronic circuits,
including solar PV circuits, for wiring, solder-
coated copper strips, and some lead-based
printing pastes.71 Lead is highly toxic to the
central nervous system, endocrine system,
cardiovascular system, and kidneys.72
Because lead accumulates in landfills,
discarded solar PV panels have the potential
to leach into drinking water. In one study, solar
PV modules using lead solder exceeded by 30
percent the maximum allowable
concentrations for lead in the Toxicity
Characteristic Leaching Procedure (TCLP)
standards set by the U.S. EPA.73 This can be
easily resolved by using lead-free solders
(such as those containing tin, silver, or
copper), but current U.S. regulations do not
require lead-free solder in the manufacture of
solar panels or any electronic devices.74 The
E.U. has been more proactive, restricting the
sale of electronics with lead-based solders.
Brominated flame retardants (BFRs),
polybrominated biphenyls (PBBs), and
polybrominated diphenylethers (PBDEs)
are added to plastics to make them less
flammable. They are used in circuit boards
and solar panel invertors (which convert DC to usable AC power). BFRs contain bromine atoms, which are released as the
plastic heats. Combustion is slowed as the additional bromine in the air interferes with the supply of oxygen needed to
sustain fire.
Brominated flame retardants have become ubiquitous in the environment; they are found at high levels in a wide range of
living organisms, from harbor seals in San Francisco Bay, to Arctic polar bears, to the breast milk of humans in the United
States.75 PBDEs bioaccumulate in fatty tissues; they are recognized as toxic and carcinogenic and are described as
endocrine disrupters.76 The E.U. and the states of Washington and California have banned the manufacture, distribution, or
processing of goods with PBDEs.
The Global E-Waste Crisis
The global tide of toxic electronic waste (e-waste) is an escalating environmental and health disaster, especially for countries in Asia, West Africa, and Latin America where e-waste is often shipped for cheap recycling.
According to EPA estimates, in 2005 more than 2.6 million tons of e-waste were generated in the U.S., and that flood of waste is expected to increase dramatically with the nationwide switch from analog to digital TV in February 2009.
In 2005, only 12.5 percent of that 2.6 million tons was collected for recycling. The remainder—more than 87 percent—was disposed of, largely in U.S. landfills or incinerators. The hazardous materials in e-waste, which include lead and other toxic heavy metals like mercury, chromium, and cadmium, can leach out of the landfills into groundwater and streams, and the burning of plastics can emit dioxins into the air. As of March 2008, at least ten states had passed laws banning disposal of some electronics in landfills.†
Some of that 12.5 percent of e-waste collected for recycling is recycled responsibly, but an estimated 50 to 80 percent of it is exported to developing countries where it is dismantled or disposed of using very rudimentary and toxic technologies.†† The imprecision of that estimate reflects the fact that it is almost impossible to track the amount of U.S. e-waste that is shipped overseas. The U.S. is one of only three nations (the others are Afghanistan and Haiti) that have not ratified the Basel Convention, an international treaty designed to stop free trade in hazardous wastes. In addition, a significant amount of U.S. e-waste is recycled using prison labor in this country.†††
† Electronics TakeBack Coalition, “E-Waste: The Exploding Global Electronic Waste Crisis,” October 10, 2008 (Issue briefing book), p. 8, available at http://www.computertakeback.com
†† Ibid., p. 4. ††† Ibid., p. 6.

Toward a Just and Sustainable Solar Energy Industry
21 - Silicon Valley Toxics Coalition
Hexavalent chromium (Cr(VI)) is used in many solar panels as a coating to absorb solar radiation, and it is also
found in screws and circuit board chassis. It is considered carcinogenic.77 Several companies have phased out the
use of hexavalent chromium in solar modules.
Solar PV, like most electronics equipment, contains recoverable metals. Copper wiring, nickel, silver, and aluminum
contacts, and aluminum frames can be recycled like other scrap metals.
The sections below outline the end-of-life recycling challenges for specific solar PV technologies.
B. Crystalline Silicon (c-Si)
End-of-life hazardous waste issues: As outlined above, c-Si circuitry and inverters contain hazardous materials such
as lead, brominated flame retardants, and hexavalent chromium. Toxic materials contained in the actual c-Si
semiconductor materials are below levels regulated by the EPA.
Recycling options: Used silicon wafers can be melted into new silicon ingots and cut into new wafers. It takes far less
energy (estimates range from 30 to 90 percent less) to process c-Si feedstock from recycled silicon than it does to
process raw silica.78 Furthermore, in recent years a silicon shortage has made recycling silicon PV an even more
attractive option. A company located in Freiburg, Germany, is one of the few in the world that operates a c-Si recycling
plant to reuse defective and used c-Si for new panels.79
C. Amorphous Silicon (a-Si)
End-of-life hazardous waste issues: Amorphous silicon PV panels contain no EPA-regulated toxic materials, aside
from those contained in the circuit boards (as noted above).
Recycling options: Since most a-Si PV panels are currently found in consumer products, they are typically disposed of
in household waste streams. As with other small electronic devices, these products contribute to the overall e-waste
load on local landfills. Amorphous silicon cells are also being used in combination with other materials to make
multijunction panels (see below). The a-Si panels on these consumer products can be recycled through standard
glass recovery/recycling processes, but they rarely are because they are attached to consumer products that are
typically just thrown in the trash.
D. Cadmium Telluride (CdTe)
End-of-life hazardous waste issues: While the hazards of cadmium are well known, the toxicity of cadmium telluride
(CdTe) is not as clear. It is believed to be less toxic than cadmium compounds (cadmium hydroxide) found in nickel
cadmium (NiCd) batteries because it does not dissolve in water as readily.80 However, tests to date are inconclusive.

Toward a Just and Sustainable Solar Energy Industry
22 - Silicon Valley Toxics Coalition
Early studies of how metals may leach into groundwater show that CdTe modules failed both the TCLP and DEV†
tests.81,82,83,84 More recent studies indicate that CdTe panels marginally pass TCLP standards,85,86 and one
manufacturer reports that its panels currently pass TCLP and DEV tests.87,88 Potential future applications include
CdTe quantum dots, shown to cause damage to cell biology and cell death.89
Recycling options: Even though recycling technologies and processes are being developed, no company is yet
reusing discarded CdTe panels as a manufacturing input for new ones. CdTe panels will go to the smelters that treat
television cathode ray tubes (CRTs), fluorescent lights, and Ni-Cad and lead-acid batteries. There are several
recycling methods in development by private industry and government labs to recover the metals in CdTe panels
instead of burning them, but these are limited to pilot projects.90, 91 These methods include the use of strong acids
(such as sulfuric acid) to strip off metals from crushed PV modules, providing a solution rich in metals that is further
processed with sodium hydroxide, sodium carbonate, sodium metabisulfite, zinc, or iron to recover cadmium and
tellurium.92
Some of the intermediate compounds that could enter the waste stream from the recycling process above include
sodium sulfide and tellurium sulfide. Potential waste products include tellurium dioxide, sulfur dioxide, and
potential emissions from the polymer laminate and casing. Since these recycling efforts are still at the pilot scale, it is
unclear what kinds of tasks will be automated and which will put workers at risk. It is also unclear if recovered
cadmium will be economically competitive for reuse, or simply treated as hazardous waste. Recovery of tellurium,
however, is very important because of low global availability.
E. Copper Indium Selenide (CIS) and Copper Indium Gallium Selenide (CIGS)
End-of-life hazardous waste issues: Selenium is a regulated substance that bioaccumulates in food webs and forms
compounds such as hydrogen selenide, which is considered highly toxic and carcinogenic by the EPA.93 CIGS has
toxicity levels similar to CIS with the addition of gallium, which is associated with low toxicity. CIS and CIGS
semiconductors also use cadmium sulfide (CdS) as a buffer layer, so cadmium is also a potential hazard. In
addition, cadmium telluride (CdTe) is often used as a buffer material in these modules, which introduces the CdTe
toxicity issues discussed above. In an acute toxicity comparison of CdTe, CIS, and CIGS, researchers found CIGS to
have the lowest toxicity, and CdTe to have the highest.94
Recycling options: No recycling processes to recover elements for reuse have been explored beyond the pilot scale.95
Indium, a by-product of zinc mining, is extremely rare, and it has competing uses in the flat screen television industry.
The high value of this metal will make recycling important for the success of CIS/CIGS PV technologies.
† The German “DEV S4” (Deutsches Einheitsverfahren) test, similar to the U.S. TCLP, is used by the E.U. to ensure that potentially toxic materials do not leach into the groundwater near waste disposal sites.

Toward a Just and Sustainable Solar Energy Industry
23 - Silicon Valley Toxics Coalition
F. Gallium Arsenide (GaAs) and Multijunction Panels
End-of-life hazardous waste issues: The limited toxicological data on gallium arsenide (GaAs) suggest that it could
have profound effects on lung, liver, immune, and blood systems.96 It is also considered likely that these crystals
would release arsine or arsenic if deposited in landfills; arsenic is highly toxic and carcinogenic.97 As noted above,
there is little toxicological data on gallium, but it is believed to be safe in small doses.
Recycling options: There are no pilot-scale recycling facilities for GaAs and multijunction PV (which also incorporates
materials such as cadmium telluride and amorphous silicon). Other potentially toxic materials under development for
use in multijunction PV include zinc manganese tellurium, indium gallium phosphide/germanium, and indium
gallium nitride. As noted previously, the global rarity of metals such as indium and tellurium will make recycling
essential to the success of solar PV based on these materials.
G. Emerging Solar PV Technologies
End-of-life hazardous waste issues: Most of the end-of-life hazards for emerging solar PV technologies have not been
analyzed. In some cases, emerging products simply combine existing semiconductors (or advanced forms of existing
semiconductors), and they will therefore carry the hazardous waste issues of all the technologies employed. For
example, a multijunction cell of amorphous silicon and gallium arsenide will entail hazards posed by all of the
materials and processes used.
Even less is known about the hazards of newer PV technologies. Dye-sensitized solar cells are based on a
combination of a dye and titanium dioxide (which is not considered toxic), so the hazards of these technologies will be
based on the toxicities of the dyes used, which at this point are not clear. Silver cells will pose hazards related to the
mild toxicity of silver, as well as any new hazards presented by the use of silver nanocrystals.
Recycling options: Because of the diversity of materials used, recovery of semiconductor materials in multijunction
cells will be complicated unless the different crystals are mechanically or manually disassembled, at which point their
recovery processes will be similar to those described above. It is too early to say how dye-sensitive cells are going to
be recycled. Organic, carbon-based, solar PV will pose little if any risk since it would be biodegradable. Understanding
the end-of-life impacts of hybrid cells will depend on knowing which technology is being utilized.
Of particular concern for emerging solar cell technologies’ end-of-life are the uncertain hazards associated with the
use of nanomaterials and technologies. As previously noted, the fate of nano-sized particles can be much different
than that of larger sized particles of the same materials. Materials not considered hazardous may, in fact, become
hazardous if their bioaccumulative or toxicity characteristics change at the nanoscale. It is also unclear how
nanoparticles found in ink suspensions or nanoparticles (such as quantum dots) sprayed onto surfaces will degrade
when exposed to cracks in the solar cells’ protective layers.
Toward a Just and Sustainable Solar Energy Industry
24 - Silicon Valley Toxics Coalition
V. Current Regulatory Framework for Solar PV Products
As with any rapidly developing industry, regulatory agencies around the world are struggling to keep current with new
technologies and materials. This section provides an overview of the status of environmental and health regulation for solar
PV products.
A. Overview of U.S. Regulations Relating to Solar PV
A1. Manufacturing Chemicals and Materials
In 1986, SVTC campaigned with other environmentalists nationwide to persuade Congress to pass the national
Emergency Planning and Community Right-to-Know Act, which established toxic chemical reporting requirements for
states, local governments, and industry.
The requirements of the act include the Toxics Release Inventory (TRI)—an inventory of routine toxic chemicals
emissions required of facilities with 10 or more employees that use 10,000 pounds or more of EPA-listed hazardous
chemicals. In addition, companies are required to prepare Materials Safety Data Sheets (MSDSs) that list each
chemical’s common name and health impacts. These are used to inform workers and emergency response teams of
potential risks.
Solar PV manufacturing is subject to the requirements above if the materials used are EPA-listed. However, there is
concern that new nanomaterials used in solar panels will not be adequately covered by these regulations because
existing reporting requirements and regulations are based on the volume of materials in use. Although nanomaterials
often exhibit very different properties than larger sized particles of the materials, they are considered the same for
regulatory purposes. For example, some nanomaterials have the potential to be extremely toxic in very small
amounts, but current regulations do not reflect this danger. Therefore, current MSDSs for bulk materials may not
adequately address the potential hazards of nanomaterials.
A2. PV Product Disposal and End-of-Life Regulation
U.S. regulation of solar PV products’ end-of-life disposal is based on the federal Resource Conservation and
Recovery Act (RCRA) and on state policies like California's Hazardous Waste Control Law (HWCL). If solar panels
are determined to be hazardous waste, RCRA (and HWCL in California) could be used to regulate their handling,
recycling, reuse, storage, treatment, and disposal.
Decommissioned or defective solar panels are currently considered hazardous waste by regulators if they do not meet
the U.S. Environmental Protection Agency (EPA) Toxicity Characteristic Leaching Procedure (TCLP) standards (and
this determination varies depending on the technology used). TCLP is intended to ensure that potentially toxic

Toward a Just and Sustainable Solar Energy Industry
25 - Silicon Valley Toxics Coalition
materials do not leach into the groundwater near waste disposal sites. The E.U. relies on the similar German “DEV
S4” (Deutsches Einheitsverfahren) test. The TCLP test is required for all new solar panels that enter the U.S. market.
California’s Hazardous Waste Control Law (HWCL) has even stricter hazardous waste designations than the federal
government, requiring that materials pass an additional toxicity test. California is the only U.S. state with a toxics
policy similar to the E.U. (see below). For example, California prohibits the manufacture, distribution, and processing
of brominated diphenylethers (PBDEs) and also requires that substitutes for brominated flame retardants (BFRs)
not be persistent, bioaccumulative, or toxic.
B. Regulation in the European Union and Other Countries
In February 2003, the E.U. established the WEEE (Waste Electrical and Electronic Equipment) and RoHS (Restriction
of Hazardous Substances) directives. Both policies seek to minimize the amount of electronic waste headed for
landfills and incineration. WEEE sets minimum recycling targets with which member states must comply. No explicit
ruling has been made on whether WEEE applies to PV systems, but Article 13 of WEEE mentions the possible
incorporation of solar PV products.98 In anticipation of the inclusion of PV systems in WEEE, the European
Photovoltaic Industry Association and German Business Association have launched the “PV Cycle” program to
develop “a European-wide collection, recycling, and recovery system.”99 This effort by industry (although only
voluntary) is an excellent first step in minimizing the end-of-life impacts of PV systems, but should not preclude the
specific inclusion of solar PV systems in the WEEE.
Beginning in July 2006, the RoHS required that electronics sold on the E.U. market contain only minimal amounts of
lead, mercury, cadmium, chromium, polybrominated biphenyls (PBBs), or brominated diphenylethers (PBDEs). The
maximum threshold is 1,000 parts per million (0.1 percent) of each of the above, with the exception of cadmium which
is more restrictive, at 10 parts per million (0.01 percent). U.S. policies are less restrictive, although PBBs have now
been banned in the U.S. Manufacturers in the U.S. must comply with RoHS for products sold in the E.U., but not for
products sold domestically.
In Japan, the leading PV manufacturing country for most of the past decade, laws require the collection of electrical
appliances (such as refrigerators and washing machines) for recycling, but computers and other electronics products
are not specifically included.100 A fee is assessed on electrical appliance retailers, with retailers required to take back
products and transport them to collection sites.
C. The Toxic Waste Burden on U.S. State and Local Governments
The solar PV industry has the potential to provide enormous environmental benefits, but the toxic materials contained
in solar panels will present a serious danger to public health and the environment if they are not disposed of properly
when they reach the end of their useful lives.

Toward a Just and Sustainable Solar Energy Industry
26 - Silicon Valley Toxics Coalition
Of the 73 bills related to the solar PV industry that were introduced in the California Legislature during 2007 and 2008,
none addressed the manufacturing or end-of-life hazards discussed in this report. Most of the bills focused on installation
targets and tax incentives/rebates for photovoltaic adoption. Lawmakers must expand their support for solar energy to
encompass a comprehensive lifecycle approach and build a solar sector that is truly sustainable and just.
The problem of solar PV waste is part of the larger issue of how to deal with dangerous or toxic consumer waste in
general, a responsibility that currently falls mostly on the local and regional governments that operate public landfills. This
waste includes a wide range of toxic consumer products, such as arsenic-treated lumber, hypodermic needles, electronic
waste, batteries, and fluorescent light bulbs.
While state policies around the nation are being enacted to address these problems, much of this legislation consists
simply of bans on the disposal of hazardous waste in landfills. Such bans do nothing to reduce product toxicity or the total
volume of consumer waste—they simply shift the burden of toxic waste collection and management to already under-
funded local and regional governments. In California, for example, local governments spend a total of more than $100
million a year collecting and properly managing household hazardous products alone.
To address this growing problem, local governments throughout the country are beginning to take collective action to
demand policies that put the responsibility for consumer waste back on product manufacturers. In California, local
governments are working with the California Product Stewardship Council (http://www.calpsc.org/) to help move the state
from a government- and rate-payer-funded toxic waste disposal model to one that puts responsibility for product disposal
on manufacturers (Extended Producer Responsibility or EPR). This model not only reduces public costs, but also drives
improvements in product design that promote environmental sustainability.
Solar energy can play an important role in addressing climate change and also in stimulating the “green” economic sector.
As the solar industry takes off, an EPR approach will be critical to ensuring the safe disposal of decommissioned products
and also to ensuring that the costs of managing this new flood of e-waste do not fall on local governments and
communities.
To date, more than 15 U.S. states have passed EPR legislation based on a variety of different policy models. California
has also begun implementing its E-Waste Recycling Act (SB 20, passed in 2003), which adds a $6 to $10 advance
disposal fee to the purchase price of computer monitors and televisions to help fund e-waste collection and management
efforts. Solar panels have not yet been covered, but electronics with similar toxic materials are currently regulated through
this legislation. It is important to note that while the SB 20 fee supports the collection of televisions and computer monitors
for recycling, it is not able to stop the export of California e-waste to developing countries that do not have the
infrastructure to handle it.
Another producer-responsibility approach requires brand owners to create a plan for collection and responsible recycling of
their spent items (at no cost to local governments) before products can be sold within the regulating jurisdiction, such as a
U.S. state or Canadian province. This approach is being taken in Washington State, New York City, and British Columbia.

Toward a Just and Sustainable Solar Energy Industry
27 - Silicon Valley Toxics Coalition
VI. Recommendations for a Clean and Just Solar Industry
The rapid growth of solar PV technologies provides an opportunity to continuously improve the safety and environmental
performance of products. We also have an opportunity to ensure that the industry incorporates principles of social justice
into its global supply, production, and recycling
operations.
SVTC has launched the Campaign for a Just and
Sustainable Future in Solar Energy to promote a
lifecycle approach to the long-term safety of solar
energy. The initiative calls for the following
measures to help ensure a sustainable future for the
solar PV industry; each of these measures is
discussed in more detail later in this section.
• Reduce and eventually eliminate the use of
toxic materials and develop environmentally
sustainable practices. This includes design
for the environment and implementation of
green chemistry principles (see Green
Chemistry sidebar).
• Ensure that solar PV manufacturers are
responsible for the lifecycle impacts of their
products through Extended Producer
Responsibility (EPR).
• Ensure proper testing of new and emerging materials and processes based on a precautionary approach.
• Expand recycling technology and design products for easy recycling.
• Promote high-quality “green jobs” that protect worker health and safety and provide a living wage throughout the
global PV industry, including industry supply chains and end-of-life recycling.
• Protect community health and safety throughout the global PV industry, supply chains, and recycling operations.
A. Reduce and Eventually Eliminate the Use of Toxic Materials
Based on the information presented in this report, SVTC recommends that the following actions be taken by U.S. solar
PV manufacturers to reduce the environmental and health risks presented by the PV industry:
Green Chemistry
Green chemistry takes a lifecycle approach, in which every step from raw material extraction through product use and end-of-life are considered in the design of products. The 12 principles of green chemistry† include precautionary and pollution prevention measures to ensure that products are designed to incorporate safer chemicals, renewable raw materials, and minimal energy use and waste.
As detailed in this report, many of the chemicals used in the PV industry are far from green. Application of green chemistry principles will benefit everyone. Solar PV companies can save on the costs of energy and regulatory compliance, and workers and communities will risk less exposure to potential toxins. This approach is already viewed as a competitive advantage for companies seeking to market products to the E.U. and to U.S. states with proactive chemicals policies, such as California.††
† P. Anastas and J. Warner, Green Chemistry: Theory and Practice, Oxford University Press, New York, 1998.
†† Michael Wilson, “Green Chemistry in California: A Framework for Leadership in Chemicals Policy and Innovation,” Report to the California Senate Environmental Quality Committee, California Policy Research Center, Berkeley, 2006.

Toward a Just and Sustainable Solar Energy Industry
28 - Silicon Valley Toxics Coalition
• Phase out use of chemicals already restricted by the E.U.’s Restriction of Hazardous Substances (RoHS).
These chemicals—including cadmium, lead, mercury, brominated flame retardants, and chromium—are
considered highly dangerous and should be phased out in the U.S. as well.
• Develop chlorine-free methods for making polysilicon feedstock that eliminate the use of trichlorosilane
(which results in waste silicon tetrachloride, an extremely toxic substance). This is the most toxic and energy-
intensive phase of silicon production, and several methods are being developed to potentially replace it.101
• Phase out use of sulfur hexafluoride (SF6). One ton of sulfur hexafluoride has the greenhouse effect equivalent
of 25,000 tons of CO2.102 It is imperative that a replacement for sulfur hexafluoride be found, because accidental or
fugitive emissions will greatly undermine the greenhouse gas reductions gained by the use of solar power.
• Phase out use of hydrogen selenide. This highly toxic material is used in the production of CIS/CIGS PV. New
processes to make CIS/CIGS have been developed that avoid using hydrogen selenide.103
• Phase out use of arsenic. Arsenic, used in production of gallium arsenide PV, is highly toxic and carcinogenic.
• Phase out phosphine and arsine. Phosphine and arsine are highly toxic gases used in the production of GaAs
crystals (although they are not found in the final PV cells).
• Reduce fugitive air emissions from facilities. Reduce fugitive air emissions by PV manufacturing facilities,
which include such chemicals as trichloroethane, acetone, ammonia, and isopropyl alcohol and greenhouse gases
such as sulfur hexafluoride and nitrogen trifluoride 104
B. Hold the Solar PV Industry Accountable for the Lifecycle Impacts of Its Products
The best opportunity to minimize the end-of-life hazards of solar PV lies in Extended Producer Responsibility (EPR),
which makes manufacturers responsible for their products’ end-of-life disposal. PV companies should take back their
solar panels and recycle them responsibly without exporting waste overseas or using U.S. prison labor.
Manufacturer take-back provides an important incentive for the reduction of toxics in manufacturing and encourages
the design of products that are easier and safer to recycle. It also gives companies an incentive to recycle
decommissioned and defective solar PV panels into new solar panels.
The European Photovoltaic Industry Association (through its PV Cycle initiative) and the German Solar Business
Association have endorsed full lifecycle accountability and product take-back for the solar PV sector. Germany
accounts for both the largest solar PV market and the largest share of production.105
A few companies are already establishing take-back and recycling programs. An Arizona-based firm has adopted the
world’s first pre-funded take-back policy for its cadmium telluride (CdTe) solar panels. A German company has
established a pilot-scale recycling facility that uses defective and used crystalline silicon (c-Si) solar panels to make
Toward a Just and Sustainable Solar Energy Industry
29 - Silicon Valley Toxics Coalition
new panels. Further research on recycling is being conducted on solar PV panels made from other materials and
using other recovery processes.
C. Ensure Proper Testing of New and Emerging Materials and Processes
All new chemicals and materials developed for use in the solar PV industry should be properly tested. The following
general guidelines should be applied:
• Policies should incorporate a precautionary approach, requiring that those who advocate the use of new
chemicals or processes prove their safety (rather than requiring communities or workers to prove their dangers).
• Apply green chemistry principles as a screen for PV cell technology based on organic materials and inorganic
crystals and for other emerging solar cell technologies before a prototype is available for market.
In addition, more extensive testing should be conducted on new chemicals or new materials being introduced and on
the chemicals already in use. The latter category includes cadmium telluride (CdTe); cadmium telluride quantum dots;
copper indium selenide (CIS) crystals; gallium arsenide (GaAs); and gallium.
D. Expand Recycling Technology and Design Products for Easy Recycling
To meet the challenges of solar PV recycling, manufacturers should be encouraged to:
• Invest in recycling infrastructure. Communicate with existing glass, electronics, and battery recycling companies
to build the infrastructure and capacity to recycle solar PV.
• Design for recycling. Design all solar products for ease of recycling by reducing the use of toxic materials and
designing products to be easily disassembled.
• Use silicon recovered from consumer electronics products. Because solar grade silicon does not have to be
as pure as the c-Si used in computer microchips, the reuse of silicon recovered from consumer electronics (like
televisions, computers, and cell phones) should be explored.
• Develop recycling processes for all rare metals. Develop plans to recover all rare metals such as tellurium
(CdTe panels) and indium (CIS panels).
E. Promote High-Quality “Green Jobs” That Protect Worker Health and Safety and Provide a Living Wage
The first line of defense against dangerous toxic exposures or releases at manufacturing plants is an engaged and
empowered workforce throughout the global PV industry and its supply chains. Whether solar PV manufacturing
facilities are located in California or in China, it is critical that the industry establish and enforce strong labor standards
for its own practices and those of its suppliers. These include standards for occupational health and safety, respect for
all international labor standards including prohibitions on the use of child labor or forced labor, and the free right of all
Toward a Just and Sustainable Solar Energy Industry
30 - Silicon Valley Toxics Coalition
workers to organize and have a voice at work. Workers who are deprived of these basic rights often cannot speak up
against dangerous working conditions or misuse of toxic chemicals for fear of losing their jobs.
Over the past decade, dangerous working conditions and abuse of workers involved in retailers' supply chains have
become a national issue. In the garment and footwear industries, for example, major brands such as Nike and Gap
have been forced to defend their images against accusations of sweatshop sourcing, with at least four states and 26
cities passing legislation barring the use of public dollars to purchase clothing that does not adhere to a strict "no-
sweat" code.106 In microelectronics manufacturing—solar PV's close cousin—the specter of "high-tech sweatshops"
tainted the industry in the late 1990s. Even IBM faced a number of lawsuits (largely settled out of court) from cancer-
stricken workers who accused the computer giant of criminal negligence in exposing its employees to carcinogens.107
As the solar industry rapidly grows to scale, solar PV manufacturers have an opportunity to learn from the problems
faced by the electronics and apparel industries. The solar industry can be a proactive model in implementing systems
to monitor worker health and safety, chemical use and exposure, and enforcement of labor and environmental laws
throughout the global supply chain.
The known hazards involved in solar PV production already raise a number of red flags for worker health and safety,
some of which are outlined below. In addition to these known hazards, emerging PV processes pose risks that are as
yet unidentified, and further investigation is required, including input from workers and factory owners. Workers have
the right to know what chemicals are being used and what potential hazards those chemicals might present.
The chemicals listed below are only a brief survey of production activity and may not reflect the most hazardous or the
most prevalent chemicals in the workplace.
• Eliminate exposure to silicon dust. Sawing c-Si wafers creates a significant amount of silicon dust called kerf,
and up to 50 percent of the material is lost in air and the water used to clean the wafers.108 This process may
generate silicon particulate matter that poses inhalation hazards for workers.
• Reduce and eliminate exposure to cadmium. The major health and safety hazards associated with CdTe cells
during manufacture involve the use of cadmium. Cadmium is considered “extremely toxic” by the Environmental
Protection Agency109 and Occupational Safety and Health Administration (OSHA), potentially causing kidney, liver,
bone, and blood damage. The potential for dust and fumes will also pose occupational hazards.
• Eliminate potential exposure to dust from CIS/CIGS production. Dust from copper, indium, gallium, and
selenium accumulates in production equipment, presenting potential inhalation risks to workers.
• Eliminate potential for selenium dioxide exposure. Selenium dioxide is a tissue poison like arsenic, and great
care should be used to ensure that workers are not exposed.

Toward a Just and Sustainable Solar Energy Industry
31 - Silicon Valley Toxics Coalition
Finally, as part of the industry-wide effort to create green jobs, solar companies should engage with green job
advocates and support federal and state green-collar jobs legislation that promotes the creation of high-quality green
jobs. These jobs should include safety standards as well as provisions for education, training, and support services to
ensure that all community members have the opportunity for careers in the solar industry.
F. Protect Community Health and Safety throughout the Global PV Industry and Supply Chains
We need to ensure that the communities where solar PV products are made, used, and recycled (including
communities that contribute to the global supply chain) are informed about the hazards of chemicals being used
nearby. Companies manufacturing and selling solar PV products must take responsibility for monitoring their supply
chains and ensuring the health and safety of workers and nearby communities. This includes ensuring that workers
throughout the industry earn a living wage.
As noted above, the solar PV industry received negative publicity from a recent Washington Post story of silicon
tetrachloride waste dumping in China.110 That plant is owned by Luoyang Zhonggui High-Technology Co. and is a key
supplier to one of the world’s largest solar cell manufacturers. Supply chain audits by solar PV manufacturers are
critical to avoid potential environmental damage and social injustices, especially as production shifts to countries with
minimal environmental regulations.
In the U.S., toxic chemicals used in solar production, including nanomaterials, should be listed on Materials Safety
Data Sheets (MSDSs), and Toxic Release Inventory (TRI) reports. Manufacturers should take steps to continuously
reduce and eliminate volatile chemicals and those that have a high potential to contaminate air, water, and soil.
Manufacturers also need to be responsible for potential hazards posed by solar panels during use. It is critical that
residents and fire safety personnel have information about the potential exposure to solar PV toxic materials in
residential or commercial building fires.

Toward a Just and Sustainable Solar Energy Industry
32 - Silicon Valley Toxics Coalition
VII. Taking Action: What You Can Do
Working together, we need to take steps to ensure that today’s solar PV products are safe and sustainable throughout
their lifecycles and supply chains. SVTC makes the following recommendations:
State and Federal Policymakers
• Author and support legislation that requires take-back policies for electronic waste, including solar panels.
• Enact policies regarding the import and sale of products containing toxic materials; these policies should, at a
minimum, meet the standards set by recent E.U. legislation.
• Support legislation to prevent the export of hazardous waste to developing countries.
• Support legislation that promotes the creation of high-quality “green jobs.” Green jobs protect worker health and
safety, while providing a living wage, health and other benefits, job satisfaction, access for entry-level workers, and
opportunities for career advancement.
Solar Panel Designers and Manufacturers
• Through continuous improvement in product and manufacturing design, reduce and eventually eliminate the use of
toxic materials in the production of solar panels.
• Design and manufacture solar panels that can be easily and safely recycled.
• Know and disclose the chemicals used in products throughout their lifecycles.
• Assess the potential hazards of chemicals in use and avoid toxic exposure to workers, the environment, and the
public.
• Establish effective take-back policies for solar panels, including strategies to collect and recycle panels when they
are decommissioned.
• Monitor supply chains for the chemical inputs used in solar cell manufacturing and ensure that environmental and
labor practices are safe and just.

Toward a Just and Sustainable Solar Energy Industry
33 - Silicon Valley Toxics Coalition
Consumers
• Contact legislators with your concerns. Tell them you strongly support the use of solar energy and want to make
sure it is advanced in a safe and just manner.
• Before purchasing solar panels, find out if the company will take back the solar panels after use and ensure
responsible recycling. Also inquire whether the company actively supports legislation to require take-back
programs and the use of responsible recyclers for the solar industry.
• Although manufacturers should ultimately take responsibility for ensuring product safety, consumers need
information about the toxic materials used in solar panels and about any potential hazards those materials pose to
users (for example, in the case of residential fires).
• When disposing of solar panels and other electronic products, be sure they are recycled in a responsible manner,
without shipping waste overseas or using prison labor. For information about responsible e-waste recycling, visit
the Electronics TakeBack Coalition website at: http://www.computertakeback.com/responsible_recycling/index.cfm

Toward a Just and Sustainable Solar Energy Industry
34 - Silicon Valley Toxics Coalition
Appendix A1
Overview of Chemicals Associated with Solar Photovoltaic (PV) Manufacturing and Disposal • Ammonia (NH3) is used to produce anti-reflective coatings for solar PV modules. High-level exposures may irritate the
skin, eyes, throat, and lungs and cause burns. Lung damage and death may result from exposure to very high concentrations. Ingesting ammonia can burn the mouth, throat, and stomach, and ammonia in the eyes can cause burns and blindness.
• Argon (Ar) gas is used in thin-film solar cell manufacturing to apply a semiconductor onto a surface or as an inert cooling gas. Although considered non-toxic, it is known to result in death due to asphyxiation in confined spaces. In such cases, mental alertness is diminished, muscular coordination is impaired, judgment becomes faulty, and all sensations are depressed. Emotional instability often results and fatigue occurs rapidly. As the asphyxia progresses, there may be nausea and vomiting, prostration and loss of consciousness, and finally convulsions, deep coma, and death.
• Arsenic (As) can be released from the decomposition of discarded GaAs solar PV cells. Inhalation of high levels of arsenic causes throat soreness, lung irritation, increased lung cancer risk, nausea and vomiting, decreased production of red and white blood cells, abnormal heart rhythm, damage to blood vessels, and “pins and needles” sensations in hands and feet. Ingesting or breathing low levels of inorganic arsenic for an extended period causes skin darkening, and small “corns” or “warts” appear on the palms, soles, and torso. Skin contact may cause redness and swelling. Ingestion can increase skin, liver, bladder, and lung cancer risks. Ingesting very high levels can result in death.
• Arsine (AsH3) is a doping gas used to add impurities to PV semiconductors. When inhaled, it attacks red blood cells, causing headaches, vertigo, and nausea. It can cause critically affect the kidneys and blood. Arsine is a recognized carcinogen and is similar in toxicity to the methyl isocyanate released in Bhopal. Arsine can be phased out and replaced with the less toxic tertiary butyl arsine (TBA).
• Boron trifluoride (BF3) gas is used to dope silicon semiconductors. Exposure to large amounts over short periods of time can affect the stomach, intestines, liver, kidney, and brain and can eventually lead to death.
• Brominated Flame Retardants (BFRs) are chemicals that inhibit the ignition of combustible organic materials. BFRs are commonly used in computers, electronic products, televisions, insulating foams, and other building materials to reduce product flammability. BFRs bioaccumulate and are found at high concentrations in human breast milk. BFRs known as polybrominated diphenyl ethers (PBDEs) are used in polymers such as polystyrene foams, high-impact polystyrene, and epoxy resins (see PBDE item below).
• Cadmium (Cd) is a by-product of zinc, lead, or copper mining. Workers can be exposed through cadmium smelting and refining or through the air in workplaces that make Cd-based semiconductors. Acute symptoms vary depending on the specific cadmium compound, but can include pulmonary edema, cough, chest tightening, headache, chills, muscle aches, nausea, vomiting, and diarrhea. Cd is chronically toxic to the respiratory system, kidneys, prostate, and blood and can cause prostate and lung cancer. NIOSH considers cadmium dust and vapors as carcinogens. California has also determined (under AB 1807 and Proposition 65) that cadmium and cadmium compounds are carcinogens.
• Cadmium chloride (CdCl2) is a soluble form of Cd that vaporizes more readily than other cadmium compounds. It is
extremely toxic to workers exposed during feedstock preparation or through maintenance and fugitive emissions.
Information for this appendix was compiled from the International Labor Organization (ILO), NOAA’s Office of Response and Restoration, the Intergovernmental Panel on Climate Change (IPCC), U.S. EPA, California EPA, U.S. OSHA, and California OSHA.

Toward a Just and Sustainable Solar Energy Industry
35 - Silicon Valley Toxics Coalition
• Cadmium sulfate (CdSO4) is used to apply CdS in CdTe and CIS/CIGS production. Cadmium compounds are toxic by inhalation and skin contact, and exposure may cause cumulative and irreversible effects. Cadmium sulfate causes nose, throat, and lung irritation, and lung edema may also occur. Symptoms are usually delayed for several hours and aggravated by physical effort. Repeated, prolonged exposure to dust may cause discoloration of teeth, loss of smell, shortness of breath, damage to liver and kidneys, and mild anemia.
• Cadmium sulfide (CdS) is used in CdTe and CIS/CIGS thin-film solar PV production. It is a suspected human carcinogen and is toxic to kidney, lungs, and liver. Some bacteria found in nature produce CdS, and research is underway to investigate possible use of these bacteria in solar PV manufacturing.
• Cadmium telluride (CdTe) is a thin-film semiconductor. Inhalation, ingestion, and dermal contact with CdTe are considered toxic, though very little CdTe toxicological data exists. The highly reactive surface of cadmium telluride quantum dots could trigger extensive reactive oxygen damage to the cell membrane, mitochondria, and cell nucleus.
• Carbon nanotubes (CNTs) are carbon allotropes (like diamonds and graphite) measured at the nanometer scale. Exposures are linked to mesothelioma in animals, and nanotubes are believed to present inhalation hazards similar to those of asbestos.
• Carbon tetrachloride (CCl4) is used to manufacture c-Si PV cells. Exposure to very high amounts of carbon tetrachloride can damage the liver, kidneys, and nervous system (including the brain). CCl4 can cause cancer in animals, and the Department of Health and Human Services (DHHS) has determined that it may be considered a human carcinogen.
• Chromium VI (Cr VI) is used in PV modules for chrome-plated hardware such as screws and frames. High levels of chromium have provoked asthma attacks, and long-term exposure is associated with lung cancer. Handling liquids or solids containing Cr VI can cause skin ulcers. Swallowing large amounts will cause upset stomach, ulcers, convulsions, kidney and liver damage, and even death. The EPA classifies Cr VI as a known human carcinogen.
• Copper (Cu) can be poisonous or fatal at high exposures. Inhalation exposures may occur through the vaporization of copper in CIS/CIGS production. Breathing high levels of copper can cause nasal and throat irritation. Ingestion of high levels of copper can cause nausea, vomiting, and diarrhea. Very high doses of copper can cause damage to the liver and kidneys and can ultimately cause death.
• Copper indium diselenide (CIS) is used in thin-film PV cells. There is limited toxicity information on CIS. Measurements of airborne concentrations of copper, indium, and cadmium from mechanical scribing and deposition operations on CIS/CdS modules were well below threshold levels. The main health issue related to CIS is the highly toxic hydrogen selenide feedstock gas (also called selenium hydride, see below).
• Copper indium gallium diselenide (CIGS) is similar to CIS but also contains gallium (Ga) (see below).
• Diborane (B2H6) is a doping gas used to manufacture a-Si cells. It is highly flammable and is considered highly irritating to skin tissues. In rare cases, it may cause liver and kidney damage.
• Ethyl vinyl acetate (EVA) is used to encapsulate solar PV cells. It is a non-toxic alternative to soft plastics like polyvinyl chloride (PVC) and bisphenyl A, but may release volatile organic compounds during manufacture.
• Gallium (Ga) is a rare soft metal used in GaAs PV and recovered from zinc and aluminum mining. It is not considered toxic, but may cause skin irritation after prolonged exposure. Scaling up of GaAs production is limited by the global scarcity of gallium. For use in manufacturing, Ga is converted into trimethylgallium (Ga(CH3)3).

Toward a Just and Sustainable Solar Energy Industry
36 - Silicon Valley Toxics Coalition
• Germane (GeHH4) is often deposited with silane to dope a-Si layers with germanium. It is extremely toxic and can kill red blood cells and cause anemia and kidney failure.
• Helium (He) is a colorless, odorless, non-toxic gas used in solar PV to propel thin films onto a surface. Helium is absorbed by inhalation or skin contact. Inhalation causes a high voice, dizziness, dullness, headache, and possible suffocation. Containment failure can cause suffocation by displacing oxygen in confined areas. Skin frostbite is possible through contact with liquid He.
• Hexafluoroethane (C2F6) is used to etch semiconductors. It is an asphyxiant and in high concentrations may cause dizziness, nausea, vomiting, disorientation, confusion, loss of coordination, and narcosis. Very high concentrations may cause suffocation. Liquid hexafluoroethane may cause frostbite. Harmful amounts may be absorbed if skin contact is prolonged or widespread. It is listed as a potent greenhouse gas by the IPCC.
• Hydrochloric acid (HCl) is used to clean and etch semiconductors and to produce electrical grade silicon. Concentrated HCl is corrosive to the skin, eyes, nose, mucous membranes, and respiratory and gastrointestinal tracts. Inhalation can lead to pulmonary edema. Ingestion can cause severe injury to the mouth, throat, esophagus, and stomach. Other possible effects include shock, circulatory collapse, metabolic acidosis, and respiratory depression.
• Hydrofluoric acid (HF) is used to etch and remove oxidation from semiconductors. Low levels of HF gas can irritate the eyes, nose, and respiratory tract. Inhalation at high levels or in combination with skin contact can cause death from irregular heartbeat or lung fluid buildup. Splashes of HF on the skin can be fatal, but may cause no immediate signs of exposure. Swallowing even a small amount of highly concentrated HF affects internal organs and may be fatal.
• Hydrogen (H2) is used to manufacture a-Si solar cells. It is considered non-toxic but is extremely flammable and explosive.
• Hydrogen sulfide (H2S) is used in the manufacture of CIS/CIGS. It is considered an irritant and is extremely flammable.
• Indium (In) is a rare metal used as the semiconductor for CIS/CIGS, indium gallium phosphide, or indium gallium nitride solar PV. It is also used in lead-free solders. It is made from the highly reactive trimethylindium, which can spontaneously combust.
• Indium gallium nitride (InGaN) is a PV semiconductor. The toxicology of InGaN is not well documented, but the dust is a known skin, eye, and lung irritant. It is produced from trimethylindium, trimethylgallium, and ammonia.
• Indium phosphide (InP) is used in multijunction solar PV. It is listed under California Proposition 65 as a chemical known to cause cancer.
• Lead (Pb) is used to solder photovoltaic electrical components. Lead exposures occur in smelting and refining industries, soldering, and battery manufacturing. Workers can inadvertently bring home lead via clothing and possibly expose those most vulnerable: pregnant women and children. People who reclaim heavy metals from "recycled" electronics are also exposed. Lead is most toxic to the nervous system. Lead exposure may cause weakness in fingers, wrists, or ankles, and can also cause anemia. At high exposure levels, lead severely damages the brain and kidneys and may ultimately cause death. In pregnant women, high levels of exposure to lead may cause miscarriage. Lead is also considered a probable human carcinogen.
• Nitric acid (HNO3) is used in solar PV manufacture to clean wafers, remove dopants, and clean reactors. Major occupational concerns relate to the potential for chemical burns.

Toward a Just and Sustainable Solar Energy Industry
37 - Silicon Valley Toxics Coalition
• Nitrogen (N2) is used to dope semiconductors. Rapid release of nitrogen gas in an enclosed space can displace oxygen, and it therefore represents an asphyxiation hazard.
• Nitrogen trifluoride (NF3) is used to clean reactors and etch polysilicon semiconductors. It emits toxic fumes when burned or reacted and can cause asphyxiation. The IPCC considers NF3 a significant greenhouse gas, making fugitive emission control very important.
• Phosphine (PH3) is a doping gas used to add impurities to photovoltaic semiconductors. It is extremely flammable and explosive and is considered a severe respiratory irritant. Phosphine can be replaced by less toxic tertiary butyl phosphine.
• Polybrominated diphenyl ethers (PBDEs) are flame-retardant chemicals added to plastics and foam products. Because they are mixed into plastics and foams rather than bound to them, PBDEs can leave the products and enter the environment. PBDEs undergo long-range transport and deposition, appearing in ringed seals found in the Canadian Arctic. Very little is known about the human health effects of PBDEs, but toxicity to the liver, thyroid, and neurodevelopment is reported in animals, and concerns are raised because of persistence and bioaccumulation in humans. The EPA requires special procedures for the transport, storage, or disposal of PBDE. California outlawed the sale of PBDEs and products containing them effective January 1, 2008.
• Polysilicon is the feedstock material used to produce silicon PV cells. It is obtained by heating silane or trichlorosilane gas.
• Polyvinyl fluoride (Tedlar®) is used in solar PV module backing sheets to extend product life and increase efficiency. These are preferred backing sheets due to strength and weather, moisture, and UV light resistance. Tedlar® dust may cause eye irritation, and skin contact may also produce irritation. Some formulations contain small amounts of one or more of the following compounds: lead, chromium, cadmium, selenium, arsenic, and antimony.
• Selenium (Se) is found in CIS/CIGS as an alloy of diselenide. Short-term exposure to high concentrations of selenium may cause nausea, vomiting, and diarrhea. Chronic exposure to high concentrations of selenium compounds can produce a disease called selenosis. Major signs of selenosis are hair loss, nail brittleness, and neurological abnormalities (such as numbness and other odd sensations in the extremities). Brief exposures to high levels of Se can result in respiratory tract irritation, bronchitis, difficulty breathing, and stomach pains.
• Selenium dioxide (SeO2) is a by-product of CIS/CIGS manufacturing and an intermediary in the recovery of selenium from waste CIS/CIGS modules. It is highly toxic when inhaled and may cause skin burns and eye irritation. Chronic exposure may cause selenium-related diseases. Brief exposure to high levels of SeO2 can result in respiratory tract irritation, bronchitis, difficulty breathing, and stomach pains.
• Selenium hydride (H2Se) is used to apply the diselenide layer in CIS/CIGS. It is highly toxic and can cause respiratory irritation and selenium-related diseases. Inhalation causes a burning sensation, nausea, and sore throat. Skin contact can cause frostbite. It is extremely flammable. Methods are being developed to produce CIS/CIGS without H2Se. Also called hydrogen selenide.
• Silane (SiH4) gas is used to apply silicon thin films and make silicon crystal semiconductors. Major health hazards include respiratory tract, skin, and eye irritation. Silane gas is extremely explosive. At room temperature, silane is pyrophoric—it spontaneously combusts in air without external ignition.
• Silicon (Si) is the most widely used solar PV semiconductor. Crystalline silica (silicon dioxide, SiO2) is a potent respiratory hazard, irritating skin and eyes on contact. Inhalation causes lung and mucus membrane irritation. Eye irritation results in watering and redness. Lung cancer is associated with occupational exposures to crystalline silica among miners, diatomaceous earth workers, granite workers, pottery workers, brick workers, and others.

Toward a Just and Sustainable Solar Energy Industry
38 - Silicon Valley Toxics Coalition
• Silicon tetrachloride (SiCl4) is a corrosive and toxic by-product and intermediary in silicon-based PV cell production. It reacts with water to form hydrochloric acid and can cause tissue damage. It causes severe respiratory problems when inhaled. Skin contact causes severe pain, and eye contact can cause permanent damage. It is one of a group of chemicals known as chlorosilanes.
• Silver (Ag) is used in solar PV electrical contacts or as the semiconductor in silver cells. Exposure to high levels of silver over long time periods may cause a condition called argyria, a blue-gray discoloration of the skin and other body tissues. Argyria is permanent, but it appears to be only a cosmetic problem. Exposure to high levels of silver can result in breathing problems, lung and throat irritation, and stomach pains. Skin contact with silver can cause mild allergic reactions such as rash, swelling, and inflammation.
• Sodium hydroxide (NaOH) is used to clean and etch semiconductors. Even very low levels can produce skin and eye irritation. High-level exposure can cause severe burns to the eyes, skin, and gastrointestinal tract, which may cause death.
• Sulfur hexafluoride (SF6) is used to etch semiconductors and clean reactors in PV manufacturing. It is relatively inert and is considered an asphyxiant. The IPCC considers SF6 the most potent greenhouse gas known.
• Tetrobromo bisphenol A (TBBPA) is a reactive brominated flame retardant used in the printed wiring boards of more than 90 percent of electrical and electronic products. The main use of TBBPA in solar PV is in inverters. Occupational exposure may occur from contact during production or through dust inhalation. Recent concerns focus on TBBPA as an endocrine disruptor; it is similar to bisphenol A, a known estrogen mimic. TBBPA also bioaccumulates in organisms.
• Thiourea (CH4N2S) is used to manufacture CdTe and CdS PV semiconductors. It is toxic to blood and causes thyroid and liver tumors. California recognizes thiourea as a carcinogen.
• Trichlorosilane (HSiCl3) is the main source of electrical grade silicon. It is formed in the presence of silicon and hydrochloric acid and is toxic and flammable. Inhalation causes acute effects such as burns, difficulty breathing, headache, dizziness, bluish skin color, and lung congestion. Blurred vision results from eye contact, and ingestion can cause burns, vomiting, and diarrhea.

Toward a Just and Sustainable Solar Energy Industry
39 - Silicon Valley Toxics Coalition
Appendix B Annotated Solar Manufacturing Process Diagrams Crystalline Silicon Generic Process Diagram Explanation (from page 11):
Silica is mined and refined into metallurgical grade silicon (Mg-Si). This is reacted with hydrochloric acid (HCl) where silane/polysilicon feedstock and silicon tetrachloride waste is produced. The resulting silane/polysilicon is heated to produce a crystalline silicon (c-Si) ingot that is doped to make c-Si into a semiconductor. The potent greenhouse gases sulfur hexaflouride (SF6) and nitrogen fluoride (NF3) are used in this step to clean the reactors. The c-Si ingot is cut into wafers, which are etched with reactive solvents to remove surface imperfections. Finally, the wafers are encapsulated with ethyl vinyl acetate (EVA) or Tedlar® to protect the surface, mounted onto a frame and wired into the PV cell. Without extended producer responsibility, these cells will end up in smelters and dumps where any hazardous materials will cause air and water pollution.
Amorphous Silicon (a-Si) Generic Process Diagram Explanation (from page 13):
The first step in amorphous silicon (a-Si) PV cell production is similar to c-Si. Silane feedstock is mixed with hydrogen and doped with impurities before it is deposited onto a surface, etched, and then cleaned. The a-Si cell is mounted in a frame, encapsulated with EVA or Tedlar®, and wired to electrical components. Since many a- Si cells are put into consumer devices, their lifespan is shorter, and they often end up in smelters and dumps where hazardous materials will cause air and water pollution.
Figure 7: Crystalline Silicon Generic Process Diagram
Figure 8: Amorphous Silicon (a-Si) Generic Process Diagram

Toward a Just and Sustainable Solar Energy Industry
40 - Silicon Valley Toxics Coalition
Cadmium Telluride (CdTe) Generic Process Diagram Explanation (from page 14):
Cadmium Telluride (CdTe) PV cells are produced by mixing cadmium compounds, with thiocarbamide or ammonia, and tellurium dioxide, a step where cadmium and thiourea wastes are generated. The CdTe is then deposited onto a surface and the cell is mounted onto a frame, encapsulated, and wired to electrical components. Since Cd is a known carcinogen, and Te is a rare element, extended producer responsibility is important to prevent Cd from entering the water and air, and to recover Te.
Copper Indium (Gallium) Selenide (CIS/CIGS) Process Diagram Explanation (from page 16):
Copper indium (gallium) selenide (CIS/CIGS) cells are produced by mixing copper, indium, (and gallium in CIGS), and hydrogen selenide. In this step, hydrogen selenide and selenium dioxide wastes are generated. The semiconductor is then deposited on a surface, where is it etched and cleaned before being mounted in a frame, encapsulated, and wired. Since selenium is a known carcinogen, and indium is a rare element, extended producer responsibility is important to CIS/ CIGS production to prevent selenium from entering the water and air, and to recover indium.
Figure 9: Cadmium Telluride (CdTe) Generic Process Diagram
Figure 10: Copper Indium (Gallium) Selenide (CIS/CIGS) Process Diagram

Toward a Just and Sustainable Solar Energy Industry
41 - Silicon Valley Toxics Coalition
Gallium Arsenide (GaAs) Generic Process Diagram Explanation (from page 17):
Gallium arsenide (GaAs) crystals are produced by mixing trimethyl gallium and trimethyl arsenic in the presence of doping gases, often producing arsenic waste as a byproduct. The crystal is sliced into wafers, etched, and cleaned before being mounted to a frame, encapsulated, and wired. Since arsenic is a known carcinogen, it is important to ensure it does not end up in the water or air.
Figure 11: Gallium Arsenide (GaAs) Generic Process Diagram

Toward a Just and Sustainable Solar Energy Industry
42 - Silicon Valley Toxics Coalition
REFERENCES
1 Solarbuzz, “2007 World PV Industry Report Highlights,” http://www.solarbuzz.com/Marketbuzz2008-intro.htm (accessed June
18, 2008). 2 Janet Sawin, “Another Sunny Year for Solar Power,” Vital Signs Report, World Watch Institute, May 2008. 3 Tom Markvart, Luis Castaner, Peter Ahm, and Frederik Krebs, “Photovoltaics,” Riso Energy Report 5, Riso National Laboratory,
Denmark, November 2006. 4 Ted Smith, David A. Sonnenfeld, and David Naguib Pellow, Challenging the Chip: Labor Rights and Environmental Justice in
the Global Electronics Industry, Temple University Press, Philadelphia, 2006. 5 Eric D. Williams, Robert U. Ayres, and Miriam Heller, “The 1.7 Kilogram Microchip: Energy and Material Use in the Production
of Semiconductor Devices,” Environmental Science and Technology 36(24):5504–5510, 2002. 6 Emil ter Horst and Zhang Cheng, “PV Market and Industry Development in China: Impact of PV Programs and Technology
Improvement,” Report, Department of Science, Technology, and Society, Utrecht University, The Netherlands, 2006. 7 Ariana Eunjung Cha, “Solar Energy Firms Leave Waste Behind in China,” Washington Post, March 9, 2008
http://www.washingtonpost.com/wp-dyn/content/article/2008/03/08/AR2008030802595.html (accessed July 1, 2008). 8 Richard Bolmen, Semiconductor Safety Handbook, Noyes Publications, Westwood, NJ, 1998. 9 Silicon Valley Toxics Coalition, “Regulating Emerging Technologies in Silicon Valley and Beyond,”
http://www.etoxics.org/site/PageServer?pagename=svtc_nanotech (accessed July 11, 2008). 10 Linda K. Breggin and John Pendergrass, Where Does the Nano Go? End of Life Regulation of Nanotechnologies, Project on
Emerging Nanotechnologies (PEN), Woodrow Wilson International Center for Scholars, Washington, DC, July 2007. 11 Adolf Goetzberger, C. Hebling, and H. Schock, “Photovoltaic Materials, History, Status, and Outlook,” Materials Science and
Engineering 40:1–46, 2003. 12 Energy Information Administration, “Solar Photovoltaic,”
http://www.eia.doe.gov/cneaf/solar.renewables/page/solarphotv/solarpv.html (accessed July 13, 2008). 13 Nigel Mason, “Industry Developments that Sustain the Growth of Crystalline Silicon PV Output,” Report, Proceedings of the
Photovoltaic Science, Applications, and Technology Conference, Durham, UK, March 28–30, 2007. 14 B. von Roedern, “Status of Amorphous and Crystalline Thin Film Silicon Solar Cell Activities,” Report, National Renewable
Energy Laboratory, Golden, CO, March 2003. 15 A. Goetzberger and C. Hebling, “Photovoltaic Materials, Past, Present, Future,” Solar Energy Materials and Solar Cells 62:1–
19, 2000. 16 Tracie Bukowski and Joseph Simmons, “Quantum Dot Research: Current State and Future Prospects,” Critical Reviews in
Solid State and Materials Sciences 27(3):119–142, 2002. 17 Rommel Noufi and Ken Zweibel, “High-Efficiency CdTe and CIGS Thin Film Solar Cells: Highlights and Challenges,” National
Renewable Energy Laboratory, Golden, CO, May 2006. 18 K. Zweibel, “Thin Film Photovoltaics,” Solar Energy Research Institute, 1989. 19 M. Ghosh, F. Kampas, and J. Xi, “Research on Stable, High-Efficiency Amorphous Silicon Multijunction Modules,” Report,
National Renewable Energy Laboratory, Golden, CO, September 1993. 20 Frank Dimroth and Sarah Kurtz, “High-Efficiency Multijunction Solar Cells,” MRS Bulletin–Materials Research Society
32(3):230–235, 2007. 21 Y.S. Tsuo, et al., “Environmentally Benign Silicon Solar Cell Manufacturing,” Report, 2nd World Conference and Exhibition on
Photovoltaic Solar Energy Conversion, National Renewable Energy Laboratory, Golden, CO, July 1998. 22 Adolf Goetzberger and Volker Hoffman, Photovoltaic Solar Energy Generation, Springer, New York, 2005. 23 Abdiaziz Yassin, Francis Yebesi, and Rex Tingle, “Occupational Exposure to Crystalline Silica Dust in the United States:
1988–2003,” Environmental Health Perspectives 113(3):255-260, 2005. 24 Vasilis Fthenakis and Paul Moskowitz, “An Assessment of Silane Explosion Hazards,” Solid State Technology 33(1):81–85,
1990. 25 Vasilis Fthenakis, “National PV Environmental Research Center: Summary Review of Silane Ignition Studies,”
http://www.bnl.gov/pv/abs/abs_149.asp (accessed May 20, 2008). 26 See reference 24 above. 27 See reference 7 above. 28 Erik Alsema, A. Baumann, R. Hill, and M. Patterson, “Health, Safety and Environmental Issues in Thin Film Manufacturing,”
Report, Department of Science, Technology, and Society, Utrecht University, The Netherlands, 1996. 29 Vasilis Fthenakis and Paul Moskowitz, “A Checklist of Safe Practices for the Storage, Distribution, Use and Disposal of Toxic
and Hazardous Gases in Photovoltaic Cell Manufacturing,” Solar Cells 31:513–525, 1991.

Toward a Just and Sustainable Solar Energy Industry
43 - Silicon Valley Toxics Coalition
30 Electric Power Research Institute, “Potential Health and Environmental Impacts Associated with the Manufacture and Use of
Photovoltaic Cells,” Report to the California Energy Commission, Palo Alto, CA, 2003. 31 Y.S. Tsuo, T.H. Wang, and T.F. Ciszek, “Crystalline-Silicon Solar Cells for the 21st Century,” National Renewable Energy
Laboratory Report, Electrochemical Society Annual Meeting, Seattle, May 1999. 32 See reference 30 above. 33 See reference 3 above. 34 Erik Alsema and Mariska de Wild-Scholten, “Environmental Impacts of Crystalline Silicon Photovoltaic Module Production,”
Conference Proceedings, 13th Annual Conference of Life Cycle Engineering, Leuven, The Netherlands, May 31–June 2, 2006.
35 See reference 30 above. 36 See reference 34 above. 37 See reference 24 above. 38 Vasilis Fthenakis, “Prevention and Control of Accidental Releases of Hazardous Materials in PV Facilities,” Progress in
Photovoltaics 6(2):91–8, 1998. 39 Ibid. 40 Paul Moskowitz, “An Overview of Environmental, Health, and Safety Issues in the Photovoltaic Industry,” in Solar Cells and
Their Applications, Wiley, New York, 1995. 41 Vasilis Fthenakis, "Overview of Potential Hazards," in Practical Handbook of Photovoltaics: Fundamentals and Applications, T.
Markvart and L. Castaner (eds.), Elsevier, New York, 2003. 42 See reference 30 above. 43 See reference 28 above. 44 Vasilis Fthenakis, “Life Cycle Impact of Cadmium in CdTe PV Production,” Renewable and Sustainable Energy Reviews
8:303–334, 2004. 45 Ibid. 46 U.S. Department of Health and Human Services, “Toxicological Profile for Cadmium,” Report, Agency for Toxic Substances
and Disease Registry, Atlanta, 1997. 47 Environmental Protection Agency, “Technical Factsheet on Cadmium,” http://www.epa.gov/safewater/dwh/t-ioc/cadmium.html
(accessed June 10, 2008). 48 Occupational Safety and Health Administration, “Safety and Health Topics: Cadmium,” http://www.osha.gov/SLTC/cadmium
(accessed June 10, 2008). 49 Vasilis Fthenakis, et al., “Toxicity of Cadmium Telluride, Copper Indium Diselenide, and Copper Gallium Diselenide,” Progress
in Photovoltaics 7:489–497, 1999. 50 See reference 44 above. 51 Pesticide Action Network, “Pesticides Database,” http://www.pesticideinfo.org/Detail_Chemical.jsp?Rec_Id=PC34589
(accessed August 20, 2008). 52 See reference 30 above. 53 See reference 18 above. 54 Vasilis Fthenakis and Paul Moskowitz, “Toxic Materials Released from Photovoltaic Modules During Fires: Health Risks,” Solar
Cells 29:63–71, 1990. 55 A. Romeo, et al., “Development of Thin-Film Cu(InGa)Se2 and CdTe Solar Cells,” Progress in Photovoltaics 12:93–111, 2004. 56 C. Eberspacher, et al., “Thin-Film CIS Alloy PV Materials Fabricated Using Non-Vacuum, Particle-Based Techniques,” Thin
Solid Films 387:18–22, 2001. 57 S.F. Chichibu, et al., “Use of Diethylselenide as a Less-Hazardous Source for Preparation of CuInSe2 Photoabsorbers by
Selenization of Metal Precursors,” Journal of Crystal Growth 243:404–409, 2002. 58 Agency for Toxic Substances and Disease Registry, “Toxicological Profile for Selenium,” http://www.atsdr.cdc.gov/
toxprofiles/tp92.html (accessed July 1, 2008). 59 Vasilis Fthenakis, Hyung Chul Kim, and Wenming Wang, “Life Cycle Inventory Analysis in the Production of Metals Used in
Photovoltaics,” Report, Brookhaven National Laboratory, Upton, NY, March 30, 2007. 60 A. Shah, et al., “Photovoltaic Technology: The Case for Thin-Film Solar Cells,” Science 285:692–698, 1999. 61 See reference 28 above. 62 D.G. Barceloux, “Molybdenum,” Journal of Toxicology–Clinical Toxicology 37:231–237, 1999. 63 Miroslav Styblo, et al., “The Role of Biomethylation in Toxicity and Carcinogenicity of Arsenic: A Research Update,”
Environmental Health Perspectives 110(Supplement 5):7667–7671, 2002. 64 Swaran Flora and S. Gupta, “Toxicology of Gallium Arsenide: An Appraisal,” Defense Science Journal 44(1):5–10, 1994. 65 Agency for Toxic Substances and Disease Registry, “ToxFAQs for Arsenic,” http://www.atsdr.cdc.gov/tfacts2.html (accessed
June 20, 2008).

Toward a Just and Sustainable Solar Energy Industry
44 - Silicon Valley Toxics Coalition
66 J. Komeno, “Metalorganic Vapor Phase Epitaxy Using Organic Group V Precursors,” Journal of Crystal Growth 145(1–4):468–
472, 1994. 67 See reference 30 above. 68 Paul Williams, “Dioxins and Furans from the Incineration of Municipal Solid Waste,” Journal of the Energy Institute 78(1):38–
48, 2005. 69 Erik Alsema, “Environmental Aspects of Solar Cell Modules,” Report, Netherlands Agency for Energy and the Environment,
Utrecht, August 1996. 70 A. Ades and G. Kazantzis, “Lung Cancer in a Non-Ferrous Smelter: The Role of Cadmium,” British Journal of Industrial
Medicine 45(7):435–442, 1988. 71 Vasilis Fthenakis and Ron Gonsiorawski, “Lead-Free Solder Technology from ASE Americas,” Workshop Report, BNL-67536,
Brookhaven National Laboratory, Upton, NY, October 19, 1999. 72 Environmental Protection Agency, “Lead in Paint, Dust, and Soil,” http://www.epa.gov/lead (accessed June 21, 2008). 73 Hartmut Steinberger, “HSE for CdTe and CIS Thin Film Module Operation,” IEA Expert Workshop, Environmental Aspects of
PV Power Systems, Report No. 97072, Utrecht University, The Netherlands, May 23, 1997. 74 Stephanie Zangl, “Regulation Scenarios for Waste PV Modules,” Report, Workshop on Life Cycle Analysis and Recycling of
Solar Modules, Brussels, March 18–19, 2004. 75 Elizabeth Grossman, High Tech Trash: Digital Devices, Hidden Toxics, and Human Health, Island Press, Washington, DC,
2007. 76 Agency for Toxic Substances and Disease Registry, “Toxicological Profile for Polybrominated Diphenyl Ethers and
Polybrominated Biphenyls,” http://www.atsdr.cdc.gov/toxprofiles/tp68.html (accessed July 1, 2008). 77 Centers for Disease Control and Prevention, “Chromium,” http://www.cdc.gov/niosh/topics/chromium (accessed June 28,
2008). 78 IBM, “IBM Pioneers Process to Turn Waste into Solar Energy,” http://www-03.ibm.com/press/us/en/pressrelease/22504.wss (accessed July 10, 2008). 79 Karsten Wambach, “Recycling of Photovoltaic Modules,” Report, Workshop on Life Cycle Analysis and Recycling of Solar
Modules, Brussels, March 18–19, 2004. 80 See reference 44 above. 81 Vasilis Fthenakis, Chris Eberspacher, and Paul Moskowitz, “Recycling Strategies to Enhance the Commercial Viability of CIS
Photovoltaics,” Progress in Photovoltaics 4:447–456, 1996. 82 Paul Moskowitz, Hartmut Steinberger, and Werner Thumm, “Health and Environmental Hazards of CdTe PV Production, Use,
and Decommissioning,” Report, World Conference on Photovoltaic Conversion, Waikoloa, HI, December 1994. 83 Vasilis Fthenakis and Paul Moskowitz, “Thin-Film Photovoltaic Cells: Health and Environmental Issues in Their Manufacture,
Use, and Disposal,” Progress in Photovoltaics 3:295–306, 1995. 84 Vasilis Fthenakis, “Regulations on PV Module Disposal and Recycling,” Informal Report, Brookhaven National Laboratory,
Upton, NY, January 29, 2001. 85 Robert Goozner, et al., “A Process to Recycle Thin Film PV Materials,” 26th Annual Meeting of the Photovoltaic Specialists
Society, Anaheim, CA, 1997. 86 Vasilis Fthenakis, “Could CdTe PV Modules Pollute the Environment?” Working Paper, National Photovoltaic Environmental
Health and Safety Assistance Center, Brookhaven National Laboratory, Upton, NY, 2002. 87 See reference 41 above. 88 See reference 28 above. 89 Jasmina Lovric, Sung Jo Cho, Francoise Winnik, and Dusica Maysinger, “Unmodified Cadmium Telluride Quantum Dots
Induce Reactive Oxygen Species Formation Leading to Multiple Organelle Damage and Cell Death,” Chemical Biology 12(11):1227–1234, 2005.
90 See reference 84 above. 91 Shalini Menezes, “Electrochemical Approach for Removal, Separation, and Retrieval of CdTe and CdS Film from PV Module
Waste,” Thin Solid Films 387(1–2):175–178, 2001. 92 Vasilis Fthenakis, “End-of-Life Management and Recycling of PV Modules,” Energy Policy 28:1051–1058, 2000. 93 See reference 59 above. 94 Vasilis Fthenakis, et al. “Toxicity of Cadmium Telluride, Copper Indium Diselenide, and Copper Gallium Diselenide,” Progress
in Photovoltaics 7:489–497, 1999. 95 See reference 92 above. 96 See reference 64 above. 97 See reference 65 above. 98 Mariska de Wild-Scholten, et al., “Implications of European Environmental Legislation for Photovoltaic Systems,” Report, 20th
European Photovoltaic Energy Conference, Barcelona, June 6–10, 2004.

Toward a Just and Sustainable Solar Energy Industry
45 - Silicon Valley Toxics Coalition
99 PV Cycle, http://www.pvcycle.org/ (accessed May 30, 2008). 100 See reference 84 above. 101 D.S. Strebkov, et al., “Chlorine Free Technology for Solar-Grade Silicon Manufacturing,” Report, Workshop on Crystalline
Silicon Solar Cells and Modules, Winter Park, CO, August 8–11, 2004. 102 See reference 28 above. 103 A.E. Delahoy, et al., “Thin Film CIGS Photovoltaic Technology: Annual Technical Report,” National Renewable Energy
Laboratory, Golden, CO, August 2000. 104 See reference 30 above. 105 Janet Wood, “Solar Energy in Germany: A Market Review,” Refocus 7(3):24–30, 2006. 106 Global Exchange, “Sweat Free: A Movement Towards Ending Sweatshops,”
http://www.globalexchange.org/campaigns/sweatshops/background.html (accessed September 30, 2008). 107 Benjamin Pimentel, "Cancer Claims Ex-IBM Plaintiff." San Francisco Chronicle, October 12, 2004, http://sfgate.com/cgi-
bin/article.cgi?f=/c/a/2004/10/12/BUGEF97HJN1.DTL 108 See reference 22 above. 109 See reference 47 above. 110 See reference 7 above.

This Page
Intentionally
Left Blank
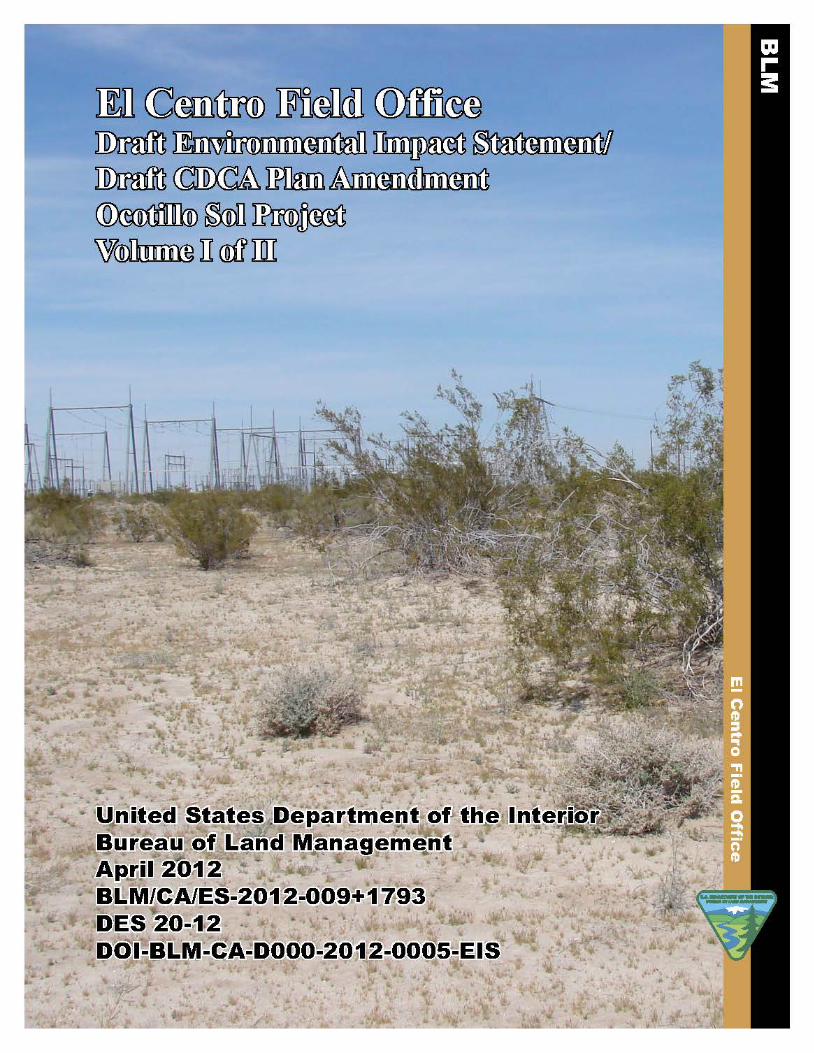

United States Department of the Interior
BUREAU OF LAND MANAGEMENT El Centro Field Office
1661 S. 4th Street El Centro, CA 92243
(760) 337-4436
In reply refer to: CACA 51625
April 2012
Dear Reader:
Attached for your review and comment is the Draft Environmental Impact Statement/ Draft California Desert Conservation Area Plan Amendment (Draft EIS/Draft CDCA Plan Amendment) for the Ocotillo Sol Project prepared by the Bureau of Land Management (BLM) El Centro Field Office. The BLM prepared this document in accordance with the National Environmental Policy Act of 1969 (NEPA), as amended, the Federal Land Policy and Management Act of 1976 (FLPMA), as amended, the applicable implementing regulations, the BLM’s Land Use Planning Handbook (H-16011), and other applicable law and policy.
The Applicant’s proposed Ocotillo Sol Project, a 100-acre, up to 20-megawatt solar photovoltaic facility and 15-acre temporary construction laydown area, would be sited on BLM-managed lands adjacent to the existing Imperial Valley Substation in Imperial County, California. The Draft EIS/Draft CDCA Plan Amendment and supporting information are available on the project web site at: www.blm.gov/en/fo/elcentro.
The BLM encourages the public to provide information and comments pertaining to the analysis presented in the Draft EIS/Draft CDCA Plan Amendment. We are particularly interested in feedback concerning the adequacy and accuracy of the proposed alternatives, the analysis of the alternatives, and any new information that would help the BLM as it develops the document. As a member of the public, your timely comments on the Draft EIS/ Draft CDCA Plan Amendment will help formulate the Final EIS.
Comments will be accepted for ninety (90) calendar days following the Environmental Protection Agency’s publication of its Notice of Availability in the Federal Register. The BLM can best use your comments and resource information submissions if received within the review period.
Comments may be submitted electronically at the following e-mail address: [email protected]. Comments may also be submitted by mail to: Noel Ludwig, California Desert District Office, 22835 Calle San Juan de Los Lagos, Moreno Valley, CA 92553. To facilitate analysis of comments and information submitted, we strongly encourage you to submit comments in an electronic format.
Your review of and comments on the content of this document are critical to the success of this planning effort. If you wish to submit comments on the Draft EIS/Draft CDCA

Plan Amendment, we request that you make your comments as specific as possible. Comments containing only opinions or preferences will be considered and included as part of the decision-making process, but they will not receive a formal response from the BLM.
Before including your address, phone number, e-mail address, or other personal identifying information in your comment, you should be aware that your entire comment, including your personal identifying information, may be made publicly available at any time. While you can ask us in your comment to withhold your personal identifying information from public review, we cannot guarantee that we will be able to do so.
Public meetings to provide an overview of the document, respond to questions, and take public comments will be announced by local media, website, and/or public mailings at least 15 days in advance.
Copies of the Draft EIS/Draft CDCA Plan Amendment have been sent to affected federal, state and local government agencies, as well as affected Tribal governments. Copies of the Draft EIS/Draft CDCA Plan Amendment are available for public inspection at the BLM California Desert District Office (see address above); the BLM El Centro Field Office, 1661 S. 4th Street, El Centro, California 922443; and the BLM California State Office, 2800 Cottage Way, Sacramento, California 95825.
Thank you for your continued interest in the Draft EIS/Draft CDCA Plan Amendment. We appreciate the information and suggestions you contribute to the planning process. For additional information or clarification regarding this document or the planning process, please contact Noel Ludwig, BLM Project Manager, California Desert District Office at (951) 697-5368 or [email protected].
Sincerely,
Margaret L. Goodro Field Manager, El Centro Field Office Bureau of Land Management

Ocotillo Sol Project Draft Environmental Impact Statement
Prepared by U.S. Department of the Interior Bureau of Land Management
El Centro Field Office California
April 2012
Margaret L. Goodro
Field Manager, El Centro
Teri Raml
District Manager, California Desert
James G. Kenna
State Director

Publication Index #BLM/CA/ES-2012-009+1793DOI Control #DES 12-20
BLM California Desert District Office Publication #DOI-BLM-CA-D0002012-0005-EIS

Executive Summary
EXECUTIVE SUMMARY
San Diego Gas & Electric (the Applicant) has filed a right-of-way application with the Bureau of Land Management (BLM) for a right-of-way grant to construct, operate, maintain, and decommission a 100-acre solar photovoltaic facility on BLM-managed lands. The Ocotillo Sol Project would interconnect with the existing Imperial Valley Substation and generate up to 20 megawatts of electricity. In connection with its consideration of the Applicant’s right-of-way application, the BLM will also be considering whether or not to amend the California Desert Conservation Area (CDCA) Plan of 1980, as amended.
The decision regarding the issuance of the right-of-way grant and potential amendment to the CDCA Plan will be based in part on an evaluation of the potential environmental effects through the environmental review process under the National Environmental Policy Act of 1969 (NEPA) and the requirements of the Federal Land Policy and Management Act of 1976 (FLPMA). This environmental impact statement (EIS) follows regulations promulgated by the Council on Environmental Quality for Implementing the Procedural Provisions of NEPA (40 Code of Federal Regulations [CFR] 1500–1508); the Department of the Interior’s NEPA regulations, 43 CFR Part 46; the BLM NEPA Handbook, H-1790-1; Sections 201, 202, and 206 of FLPMA (43 CFR 1600); and the BLM Land Use Planning Handbook, H1601-1. This EIS describes the components of and reasonable alternatives to the proposed action and environmental consequences of the proposed action and the alternatives. It also presents recommended mitigation measures that would avoid, minimize, or mitigate the significant environmental impacts identified. In accordance with NEPA, this EIS also identifies alternatives that respond to the BLM’s purpose and need, including alternatives to amend the CDCA Plan.
ES.1 PROJECT OVERVIEW
The Applicant’s proposed 100-acre solar photovoltaic generation facility and 15-acre temporary laydown area would be sited entirely on BLM-managed lands adjacent to the existing Imperial Valley Substation in Imperial County, California. The Ocotillo Sol Project would be sited approximately 82 miles east of San Diego, approximately 9 miles southwest of El Centro, 5 miles south of Seeley, and approximately 5 miles north of the United States–Mexico border.
The project site would lie within the Imperial South California Renewable Energy Zone and within the BLM’s Yuha Basin Area of Critical Environmental Concern, which contains the Yuha Desert Management Area. The Yuha Desert Management Area was created for the conservation and management of the flat-tailed horned lizard as identified in the Flat-tailed Horned Lizard Rangewide Management Strategy, 2003 Revision, An Arizona-California Conservation Strategy and incorporated through an amendment to the CDCA Plan.
The Ocotillo Sol Project components would include the photovoltaic modules and mounting structures, a maintenance building with an associated parking area, internal roads, inverters, transformers, and the combining switchgear.
Ocotillo Sol Project Page ES-1 Draft EIS/Draft CDCA Plan Amendment April 2012
Executive Summary
ES.2 PURPOSE AND NEED
In accordance with FLPMA (Section 103(c)), public lands are to be managed for multiple use that takes into account the long-term needs of future generations for renewable and nonrenewable resources. The Secretary of the Interior is authorized to grant rights-of-way on public lands for systems of generation, transmission, and distribution of electric energy (Section 501[a][4]). Taking into account the BLM’s multiple use mandate, the purpose and need for the proposed action is to respond to a FLPMA Title V right-of-way application submitted by the Applicant to construct, operate, maintain, and decommission a solar photovoltaic facility and associated infrastructure on public lands administered by the BLM in compliance with FLPMA, BLM right-of-way regulations, and other applicable federal laws and policies.
In conjunction with FLPMA, the BLM’s applicable authorities include the following:
§ Executive Order 13212, dated May 18, 2001, which mandates that agencies act expediently and in a manner consistent with applicable laws to increase the production and transmission of energy in a safe and environmentally sound manner
§ Section 211 of the Energy Policy Act of 2005, sets forth the “sense of Congress” that the Secretary of the Interior should seek to have approved 10,000 megawatts of non-hydropower renewable energy on public lands by 2015
§ Secretarial Order 3285A1, dated February 22, 2010, which establishes the development of renewable energy as a priority for the Department of the Interior
The BLM will decide whether to deny the proposed right-of-way, grant the right-of-way, or grant the right-of-way with modifications. The BLM may include any terms, conditions, and stipulations it determines to be in the public interest and may include modifying the proposed use or changing the route or location of the proposed facilities (43 CFR 2805.10[a][1]).
In connection with its decision on the Ocotillo Sol Project right-of-way grant application, the BLM’s action will also include consideration of potential amendments to the CDCA land use plan, as analyzed in the Draft EIS alternatives. The CDCA Plan, while recognizing the potential compatibility of solar energy facilities on public lands, requires that all sites associated with power generation or transmission not identified in that plan be considered through the land use plan amendment process to determine the suitability of the sites for energy development. The Ocotillo Sol Project site was not previously identified as suitable for solar energy development, so any authorization of the project would require an amendment to the CDCA Plan.
Additionally, the CDCA Plan requires that transmission lines about 161 kilovolts are either within a designated corridor or allowed outside of a designated corridor. The Ocotillo Sol Project would use an existing transmission line that is entirely within a designated corridor, so a Plan Amendment would not be required. The transmission line associated with this project is compliant with the CDCA Plan.
Page ES-2 Ocotillo Sol Project Draft EIS/Draft CDCA Plan Amendment
April 2012

Executive Summary
ES.3 ALTERNATIVES
Alternatives considered in this environmental impact statement are based on issues identified by the BLM, comments received during the public scoping process, and the Applicant’s process for evaluating and selecting potential project locations. The BLM is required to “study, develop, and describe appropriate alternatives to recommended course of action in any proposal that involves unresolved conflicts concerning alternative uses of available resources” (42 USC § 4332). In determining the alternatives to be considered, the emphasis is on what is reasonable: “Reasonable alternatives include those that are practical or feasible from the technical and economic standpoint and using common sense, rather than simply desirable from the standpoint of applicant” (46 Federal Register 18026). Alternatives must also meet the purpose and need to be considered reasonable.
Alternatives considered by the BLM, along with those suggested by the public during the scoping process, were evaluated using the following criteria:
§ Does the alternative fulfill the purposes, needs, and objectives identified in Chapter 1 for both the BLM and the applicant?
§ Does the alternative minimize effects on human and environmental resources and therefore resolve identified resource conflicts?
§ Is the alternative technically and economically feasible to construct, operate, maintain, and decommission?
Alternatives that met all the criteria above were analyzed and are presented in detail in this environmental impact statement.
ES.3.1 ALTERNATIVE 1: NO ACTION / NO CDCA PLAN AMENDMENT
Under NEPA, the No Action Alternative serves as a benchmark of existing conditions by which the public and decision makers can compare the environmental effects of the proposed action and the alternatives. With this No Action Alternative, the Ocotillo Sol Project would not be approved (all components of the project would be denied), no right-of-way grant would be issued, and there would be no CDCA Plan Amendment regarding the suitability of the site for solar development. If Alternative 1 were selected, the construction, operation, maintenance, and decommission of the Ocotillo Sol Project would not occur. This No Action Alternative does not preclude future solar development in the Ocotillo Sol Project area, subject to compliance with the applicable statutory and regulatory requirements at the time such a project were proposed.
ES.3.2 ALTERNATIVE 2: APPLICANT’S PROPOSED PROJECT
Under Alternative 2, the Applicant’s proposed project, the Applicant would construct, operate, maintain, and decommission a 100-acre, up to 20-megawatt solar photovoltaic facility on BLM-managed lands pursuant to an approved right-of-way grant. In addition, this alternative includes
Ocotillo Sol Project Page ES-3 Draft EIS/Draft CDCA Plan Amendment April 2012

Executive Summary
a 15-acre temporary right-of-way for use as a laydown area during construction of the solar facility. This alternative would also include a 12.47-kilovolt, 2,000-foot underground generation tie line from the generation facility to the adjacent Imperial Valley Substation. It would also include interconnection facilities within the Imperial Valley Substation consisting of breakers, switches, racking systems, and cabling. The Applicant would develop, execute, own, and operate the Ocotillo Sol Project.
PROPOSED CDCA PLAN AMENDMENT
Under Alternative 2, the BLM would amend the CDCA Plan to identify all 115 acres as suitable for solar energy development and allow solar development on this land. A Plan Amendment would not be required for the proposed generation tie line and interconnection facilities as they lie fully within a previously designated corridor (Utility Corridor N) for such facilities within the the existing CDCA Plan.
ES.3.3 ALTERNATIVE 3: REDUCED CONSTRUCTION FOOTPRINT ALTERNATIVE (PREFERREDALTERNATIVE)
Alternative 3, the reduced construction footprint alternative, is the BLM’s Preferred Alternative. Alternative 3 would be the same as Alternative 2 except it would be modified to reduce the total area of disturbance in the Yuha Desert associated with the Ocotillo Sol Project. By reducing the laydown area, Alternative 3 would necessitate the Applicant’s management of laydown and staging within the 100-acre Ocotillo Sol Project site as construction activities progress. The 2acre temporary laydown area would be used for construction workforce parking.
ES.3.4 ALTERNATIVE 4: NO PROJECT / AMEND CDCAPLAN TO IDENTIFY AREA AS SUITABLE FOR SOLAR DEVELOPMENT
Under Alternative 4, the Ocotillo Sol Project would not be approved and no right-of-way grant would be issued to the Applicant. Construction, operation, maintenance, and decommission of the Ocotillo Sol Project would not occur. The CDCA Plan, however, would be amended to identify the Ocotillo Sol Project area as suitable for solar energy development.
ES.3.5 ALTERNATIVE 5: NO PROJECT / AMEND CDCAPLAN TO IDENTIFY AREA AS UNSUITABLE FOR SOLAR DEVELOPMENT
Under Alternative 5, the Ocotillo Sol Project would not be approved and no right-of-way grant would be issued to the Applicant. Construction, operation, maintenance, and decommission of the Ocotillo Sol Project would not occur. Additionally, the CDCA Plan would be amended to identify the site as unsuitable for solar energy development, and the site would not be available for such development in the future. The site, however, would continue to be available for other types of uses allowable on BLM-administered lands, and the site would remain within a designated utility corridor.
Page ES-4 Ocotillo Sol Project Draft EIS/Draft CDCA Plan Amendment
April 2012

Executive Summary
ES.4 ENVIRONMENTAL CONSEQUENCES
Under Alternatives 1, 4, and 5, there would be no construction, operation and maintenance, or decommissioning of the Applicant’s proposed Ocotillo Sol Project. Therefore, no direct or indirect impacts associated with the Ocotillo Sol Project would occur under any of these alternatives. Alternatives 1, 4, and 5 would not contribute cumulative impacts when added to other reasonably foreseeable future projects in the area.
Of the 5 alternatives considered, Alternative 2 would have the highest level of ground disturbance (115 acres) and thus the highest level of impacts. Alternative 3, the preferred alternative, would have a lower level of ground disturbance (102 acres) than Alternative 2. Impacts under Alternatives 2 and 3 would be minimal overall. Mitigation measures and best management practices would be incorporated into the project that would further reduce the level of impacts.
No adverse direct or indirect impacts are expected to occur under Alternatives 2 and 3 related to geologic features; water resources; special status plant species; jurisdictional waters; cultural resources or historic properties; lands and realty; special designation areas; transportation and access; noise sensitive receptors; public health and safety; local socioeconomic impact area; or minority populations, low-income communities, and Tribes. Alternatives 2 and 3 would not contribute cumulative impacts when added to other reasonably foreseeable future projects in the area.
Negligible impacts (direct, indirect, or cumulative) would occur related to air quality, greenhouse gases, soil resources, paleontological resources, wildland fire, recreation, and visual resources under Alternatives 2 and 3.
Although Alternatives 2 and 3 would generate a marginal economic benefit for the local economy, the impact would be relatively small and would not represent a substantial impact to the regional economy.
Alternatives 2 and 3 would result in direct and indirect adverse impacts to vegetation resources and the creosote bush–white burr sage scrub sensitive natural community. Mitigation measures would be implemented to minimize or compensate for these impacts. With implementation of mitigation measures, Alternatives 2 and 3 would not contribute to cumulatively adverse impacts to sensitive natural communities.
Alternatives 2 and 3 would result in adverse impacts to flat-tailed horned lizard. Conservation and mitigation measures would be implemented to avoid, minimize, or compensate for impacts under these alternatives. Impacts under Alternatives 2 and 3 would be mitigated in accordance with the Flat-tailed Horned Lizard Rangewide Management Strategy and thus would not contribute to cumulatively adverse impacts to flat-tailed horned lizard.
Alternatives 2 and 3 would result in adverse impacts also to burrowing owl, raptor species, migratory birds, and special status small mammals and reptiles. Conservation and mitigation measures would be implemented to avoid, minimize, or compensate for impacts under these alternatives. With implementation of mitigation measures, Alternatives 2 and 3 would not
Ocotillo Sol Project Page ES-5 Draft EIS/Draft CDCA Plan Amendment April 2012

Executive Summary
contribute to a cumulatively adverse impact to burrowing owl, raptor species, migratory birds, and special status small mammals and reptiles.
Under Alternatives 2 and 3, ground-disturbing activities may result in the spread of noxious, invasive, or non-native weed species. Soil disturbed due to grading during construction and continued use of the Ocotillo Sol Project area could result in the introduction or increased density of non-native invasive plant species. To reduce the potential for the introduction and spread of non-native invasive plant species under Alternatives 2 and 3, a Weed Management Plan has been prepared and would be implemented.
Table ES-1 provides a comparison of impacts by alternative at the end of this Executive Summary.
ES.5 LEAD AGENCY ROLES AND RESPONSIBILITIES
As the federal lead agency on the proposed Ocotillo Sol Project, the BLM is responsible for soliciting comments from relevant agencies and the public, organizing and analyzing the comments received, and identifying the issues that will be addressed during the environmental analysis.
ES.6 NATIVE AMERICAN GOVERNMENT-TOGOVERNMENT CONSULTATION
The BLM is responsible for consultation with Indian tribes to identify sacred sites, historic properties, other places of traditional religious and cultural significance, and other resources within the project area. The BLM is also responsible for consultation with Indian tribes to incorporate appropriate mitigation measures in the event such sites are adversely affected by the Ocotillo Sol Project.
The BLM invited Indian tribes to consult on the Ocotillo Sol Project on a government-togovernment basis at the earliest stages of project planning. Initial Tribal consultation letters were sent in February 2010. Additional correspondence and communication has occurred since the initial letters were sent. Tribes were also invited to the August 2011 affected agency pre-application meeting. Consultation with Tribes will continue throughout the NEPA and Section 106 compliance processes.
ES.7 PUBLIC PARTICIPATION
An initial 30-day scoping period for the Ocotillo Sol Project was announced by the publication of the Notice of Intent in the Federal Register on July 15, 2011. The Notice of Intent announced the period for public scoping of alternatives, issues, impacts, and planning criteria. The Notice of Intent also requested the views of other agencies regarding the scope and content of the environmental information relevant to their statutory responsibilities or areas of expertise.
Page ES-6 Ocotillo Sol Project Draft EIS/Draft CDCA Plan Amendment
April 2012

Executive Summary
Federal, state, and local agencies, as well as individuals or organizations that were interested or may be affected by the BLM’s decision on the Ocotillo Sol Project, were invited to participate in the scoping process. Eligible agencies could request to participate as a cooperating agency. The BLM hosted two public scoping meetings in El Centro, California, on August 10, 2011. Both the afternoon (2:00–4:00 P.M.) and evening (6:00–8:00 P.M.) meetings were held at the Imperial County Executive Office. Both meetings were conducted as an open house, allowing participants to review maps, display boards, and ask specific questions of the BLM staff available at the display stations. A letter from the BLM to the public provided information about the scoping meetings and process, and was made available as a handout for the public. Fact sheets about the project and NEPA process were also made available, along with comment forms. The BLM invited participants to submit comments in formats other than comment forms, including letters and e-mail.
ES.8 SCOPING COMMENTS
Two federal agencies, eight special interest (environmental) organizations (many of which combined their comments), and three individuals provided comments by e-mail. No scoping comments, written or verbal, were received at either of the two scoping meetings.
Five comments were received regarding assessing impacts on resources. Two comments addressed the purpose and need for the project, and one comment addressed BLM’s purpose and need. Several comments were received regarding alternatives. These comments included requests to provide reasons for eliminating alternatives, suggestions to include alternative sites and generation technologies, a request to identify and analyze an environmentally preferred alternative, requests for a comparison of all alternatives, and a suggestion to include an approach to identifying and designating environmentally sensitive areas. Four comments were received concerning air quality. These comments concerned the existing air quality conditions in Imperial County. Several comments received were specific to biological resources near the Ocotillo Sol Project. Three comments received regarded climate change and greenhouse gas emissions. Two comments were specific to cultural resources. Both comments requested that cultural resources at the Ocotillo Sol Project be protected or avoided pursuant to existing legislation. In addition, one comment requested that Tribal and State Historic Preservation Officer coordination be discussed. Four comments regarded public health and safety. Two comments related to socioeconomics. One comment received was about environmental justice requesting an evaluation of the project’s impact on minority populations and low-income communities and analysis of disproportionate impacts to these populations. Several comments were received specific to special designations, particularly the Yuha Desert Area of Critical Environmental Concern. Commenters expressed concern regarding the management of the Area of Critical Environmental Concern and potential impacts of this project or other renewable energy projects within this or other Areas of Critical Environmental Concern. Two comments were about visual resources—one asking that light and glare be discussed and another that impacts to visual resources be analyzed. Numerous comments were received concerning water resources for the Ocotillo Sol Project.
Ocotillo Sol Project Page ES-7 Draft EIS/Draft CDCA Plan Amendment April 2012

Executive Summary
This page is intentionally blank.
Page ES-8 Ocotillo Sol Project Draft EIS/Draft CDCA Plan Amendment
April 2012

Executive Summary
Ocotillo Sol Project Page ES-9 Draft EIS/Draft CDCA Plan Amendment April 2012
TABLE ES-1 SUMMARY COMPARISON OF IMPACTS BY ALTERNATIVE
Alternative 1: No Action / No CDCA Plan Amendment
Alternative 2: Applicant’s Proposed Project (115 acres)
Alternative 3: Reduced Construction Footprint Alternative
(102 acres; Preferred Alternative)
Alternative 4: No Project/Amend CDCA Plan To Identify Area As Suitable For Solar Development
Alternative 5: No Project/Amend CDCA Plan To Identify Area As Unsuitable For Solar Development
Air Quality
No direct or indirect impacts. Construction and operational emissions are projected to be below the de minimis thresholds and would not be regionally significant. The Ocotillo Sol Project is presumed to conform to the applicable state implementation plan, and adverse direct and indirect impacts to air quality would be negligible. A Dust Control Plan would be implemented to further avoid and reduce dust emissions. Potential adverse impacts associated with carbon monoxide hot spot formation and air toxics would likewise be negligible.
Emissions associated with Alternative 3 would be equal to or less than those associated with Alternative 2. A Dust Control Plan would be implemented to further avoid and reduce dust emissions. Potential adverse impacts associated with carbon monoxide hot spot formation and air toxics would likewise be negligible.
No direct or indirect impacts. No direct or indirect impacts.
Cumulative Impacts:
Under Alternative 1, there would be no direct or indirect impacts to air quality. This alternative would not contribute to cumulative air quality impacts within the 6-mile radius of the project area or within the larger region.
The majority of past, present, and reasonably foreseeable activities, with the exception of activities at the Imperial Valley Substation, would occur 2 miles or more away from the proposed Ocotillo Sol Project area. The renewable energy projects, along with other activities within the 6-mile geographic scope for air quality, combined with construction activities under Alternative 2, would result in short-term cumulative impacts to air quality. These impacts are not expected to have a significant cumulative effect on local or regional air quality. All renewable energy projects within a 6-mile radius of the proposed Ocotillo Sol Project area have or will be required to implement air quality dust control plans or mitigation measures to reduce impacts. During operation and maintenance activities under Alternative 2, emissions for all criteria pollutants would be near zero. No direct cumulative impacts to air quality are anticipated during operations and maintenance activities under Alternative 2.
The majority of past, present, and reasonably foreseeable activities, with the exception of activities at the Imperial Valley Substation, would occur 2 miles or more away from the proposed Ocotillo Sol Project area. The renewable energy projects, along with other activities within the 6-mile geographic scope for air quality, combined with construction activities under Alternative 3, would result in short-term cumulative impacts to air quality. These impacts are not expected to have a significant cumulative effect on local or regional air quality. All renewable energy projects within a 6-mile radius of the proposed Ocotillo Sol Project area have or will be required to implement air quality dust control plans or mitigation measures to reduce impacts. During operation and maintenance activities under Alternative 3, emissions for all criteria pollutants would be near zero. No direct cumulative impacts to air quality are anticipated during operations and maintenance activities under Alternative 3.
Under Alternative 4, there would be no direct or indirect impacts to air quality. This alternative would not contribute to cumulative air quality impacts within the 6-mile radius of the project area or within the larger region.
Under Alternative 5, there would be no direct or indirect impacts to air quality. This alternative would not contribute to cumulative air quality impacts within the 6-mile radius of the project area or within the larger region.

Executive Summary
Page ES-10 Ocotillo Sol Project Draft EIS/Draft CDCA Plan Amendment April 2012
TABLE ES-1 SUMMARY COMPARISON OF IMPACTS BY ALTERNATIVE
Alternative 1: No Action / No CDCA Plan Amendment
Alternative 2: Applicant’s Proposed Project (115 acres)
Alternative 3: Reduced Construction Footprint Alternative
(102 acres; Preferred Alternative)
Alternative 4: No Project/Amend CDCA Plan To Identify Area As Suitable For Solar Development
Alternative 5: No Project/Amend CDCA Plan To Identify Area As Unsuitable For Solar Development
Air Quality (cont.)
Irreversible or Irretrievable Commitment of Resources:
Alternative 1 would not cause irreversible or irretrievable commitment of air resources. No unavoidable adverse impacts to air quality are anticipated under Alternative 1.
Construction and decommissioning activities under Alternative 2 would result in unavoidable adverse impacts to air quality from particulate matter and vehicle emissions. These impacts would be temporary negligible residual effects. Best management practices and implementation of a dust control plan would minimize impacts. Alternative 2 would not trigger federal or state conformity levels, and would not cause irreversible or irretrievable commitment of air resources.
Construction and decommissioning activities under Alternative 3 would result in unavoidable adverse impacts to air quality from particulate matter and vehicle emissions. These impacts would be temporary negligible residual effects. Best management practices and implementation of a dust control plan would minimize impacts. Alternative 3 would not trigger federal or state conformity levels, and would not cause irreversible or irretrievable commitment of air resources.
Alternative 5 would not cause irreversible or irretrievable commitment of air resources. No unavoidable adverse impacts to air quality are anticipated under Alternative 4.
Alternative 5 would not cause irreversible or irretrievable commitment of air resources. No unavoidable adverse impacts to air quality are anticipated under Alternative 5.
Greenhouse Gases and Climate Change
No direct or indirect impacts. Greenhouse gas emissions associated with Alternative 2 would be negligible. There would be no adverse impacts from greenhouse gas emissions.
Greenhouse gas emissions associated with Alternative 3 would be negligible. There would be no adverse impacts from greenhouse gas emissions.
No direct or indirect impacts. No direct or indirect impacts.

Executive Summary
Ocotillo Sol Project Page ES-11 Draft EIS/Draft CDCA Plan Amendment April 2012
TABLE ES-1 SUMMARY COMPARISON OF IMPACTS BY ALTERNATIVE
Alternative 1: No Action / No CDCA Plan Amendment
Alternative 2: Applicant’s Proposed Project (115 acres)
Alternative 3: Reduced Construction Footprint Alternative
(102 acres; Preferred Alternative)
Alternative 4: No Project/Amend CDCA Plan To Identify Area As Suitable For Solar Development
Alternative 5: No Project/Amend CDCA Plan To Identify Area As Unsuitable For Solar Development
Greenhouse Gases and Climate Change (cont.)
Cumulative Impacts:
Alternative 1 would not contribute to cumulative greenhouse gas impacts.
This entire greenhouse gas impact assessment is a cumulative impact assessment; there are no direct localized impacts from project-level greenhouse gas emissions. The information needed to link any particular instance of GHG emissions or sequestration to any specific climate-related environmental effects does not currently exist, and the effect of GHG emissions must be understood in the aggregate. The Ocotillo Sol Project under Alternative 2 would not be sufficient to effect global climate change, but it would emit greenhouse gases and, therefore, has been analyzed as a source of potential cumulative impacts in the context of long-term global impacts and existing greenhouse gas regulatory requirements and greenhouse gas energy policies. The broad integration of renewable energy, however, would allow for a sizable reduction in current greenhouse gas emission rates and could have long-term beneficial impacts in relation to climate change. Specifically, the Ocotillo Sol Project under Alternative 2 would enable greenhouse gas emission reductions, and so has been found to provide beneficial cumulative greenhouse gas impacts.
This entire greenhouse gas impact assessment is a cumulative impact assessment; there are no direct localized impacts from project-level greenhouse gas emissions. The information needed to link any particular instance of GHG emissions or sequestration to any specific climate-related environmental effects does not currently exist, and the effect of GHG emissions must be understood in the aggregate. The Ocotillo Sol Project under Alternative 3 would not be sufficient to effect global climate change, but it would emit greenhouse gases and, therefore, has been analyzed as a source of potential cumulative impacts in the context of long-term global impacts and existing greenhouse gas regulatory requirements and greenhouse gas energy policies. The broad integration of renewable energy, however, would allow for a sizable reduction in current greenhouse gas emission rates and could have long-term beneficial impacts in relation to climate change. Specifically, the Ocotillo Sol Project under Alternative 3 would enable greenhouse gas emission reductions, and so has been found to provide beneficial cumulative greenhouse gas impacts.
Alternative 4 would not contribute to cumulative greenhouse gas impacts.
Alternative 5 would not contribute to cumulative greenhouse gas impacts.
Irreversible and Irretrievable Commitment of Resources:
Alternative 1 would not result in an irreversible or irretrievable commitment of resources. No unavoidable adverse impacts from greenhouse gas emissions are anticipated under Alternative 1.
Construction and decommissioning activities under Alternative 2 would result in negligible GHG emissions. Alternative 2 would not result in a significant increase of GHG emissions within the region nor would it hinder attainment of the state’s goals of reducing GHG emissions to 1990 levels by 2020. As a result, it would not result in an irreversible or irretrievable commitment of air resources causing a significant increase in GHG emissions.
Construction and decommissioning activities under Alternative 3 would result in negligible GHG emissions. Alternative 3 would not result in a significant increase of GHG emissions within the region nor would it hinder attainment of the state’s goals of reducing GHG emissions to 1990 levels by 2020. As a result, it would not result in an irreversible or irretrievable commitment of air resources causing a significant increase in GHG emissions.
Alternative 4 would not result in an irreversible or irretrievable commitment of resources. No unavoidable adverse impacts from greenhouse gas emissions are anticipated under Alternative 4.
Alternative 5 would not result in an irreversible or irretrievable commitment of resources. No unavoidable adverse impacts from greenhouse gas emissions are anticipated under Alternative 5.

Executive Summary
Page ES-12 Ocotillo Sol Project Draft EIS/Draft CDCA Plan Amendment April 2012
TABLE ES-1 SUMMARY COMPARISON OF IMPACTS BY ALTERNATIVE
Alternative 1: No Action / No CDCA Plan Amendment
Alternative 2: Applicant’s Proposed Project (115 acres)
Alternative 3: Reduced Construction Footprint Alternative
(102 acres; Preferred Alternative)
Alternative 4: No Project/Amend CDCA Plan To Identify Area As Suitable For Solar Development
Alternative 5: No Project/Amend CDCA Plan To Identify Area As Unsuitable For Solar Development
Geology and Soils
No direct or indirect impacts. No impacts to geology are anticipated under Alternative 2. Impacts from expansive soils would not be significant. Erosion could occur within graded areas due to removal of vegetation and soil exposure. Soil erosion and compaction could occur due to maintenance and decommissioning activities. Erosion control measures would be implemented to minimize the amount of soil erosion during construction. In addition, a stormwater pollution prevention plan would be implemented, which would also minimize erosion potential.
Impacts related to seismic activity would be the same for Alternative 3 as outlined under Alternative 2. The incorporation of standard building practices and design recommendations from the geotechnical report would minimize these potential impacts. Erosion could occur within graded areas due to removal of vegetation and soil exposure. Direct and indirect adverse impacts to soil resources would be negligible under Alternative 3.
No direct or indirect impacts. No direct or indirect impacts.
Cumulative Impacts:
Alternative 1 would not result in impacts to geology or soil resources. This alternative would not contribute to geology and soil resource cumulative impacts.
Alternative 2 would result in negligible impacts to soil resources. Activities occurring on lands within a 1-mile radius of the Ocotillo Sol Project area (e.g., recreation, transmission line development and maintenance, and agricultural activities) have had minimal impacts to geology and soils within the Ocotillo Sol Project area, and these ongoing activities would likely continue to have minimal impacts to geology and soil resources, even when combined with potential impacts under Alternative 2.
Erosion control measures, along with measures incorporated into present and reasonably foreseeable future actions, will minimize cumulative impacts to soil resources under Alternative 2.
Alternative 2 would not result in impacts to geologic resources. Therefore, Alternative 2, when added to other reasonably foreseeable future projects, is not expected to result in cumulative impacts to geologic resources.
Alternative 3 would result in negligible impacts to soil resources. Activities occurring on lands within a 1-mile radius of the Ocotillo Sol Project area (e.g., recreation, transmission line development and maintenance, and agricultural activities) have had minimal impacts to geology and soils within the Ocotillo Sol Project area, and these ongoing activities would likely continue to have minimal impacts to geology and soil resources, even when combined with potential impacts under Alternative 3.
Erosion control measures, along with measures incorporated into present and reasonably foreseeable future actions, will minimize cumulative impacts to soil resources under Alternative 3.
Alternative 3 would not result in impacts to geologic resources. Therefore, Alternative 3, when added to other reasonably foreseeable future projects, is not expected to result in cumulative impacts to geologic resources.
Alternative 4 would not result in impacts to geology or soil resources. This alternative would not contribute to geology and soil resource cumulative impacts.
Alternative 5 would not result in impacts to geology or soil resources. This alternative would not contribute to geology and soil resource cumulative impacts.

Executive Summary
Ocotillo Sol Project Page ES-13 Draft EIS/Draft CDCA Plan Amendment April 2012
TABLE ES-1 SUMMARY COMPARISON OF IMPACTS BY ALTERNATIVE
Alternative 1: No Action / No CDCA Plan Amendment
Alternative 2: Applicant’s Proposed Project (115 acres)
Alternative 3: Reduced Construction Footprint Alternative
(102 acres; Preferred Alternative)
Alternative 4: No Project/Amend CDCA Plan To Identify Area As Suitable For Solar Development
Alternative 5: No Project/Amend CDCA Plan To Identify Area As Unsuitable For Solar Development
Geology and Soils (continued)
Irreversible and Irretrievable Commitment of Resources:
No irreversible or irretrievable commitment of geological or soil resources would occur under Alternative 1. Alternative 1 is not expected to result in unavoidable adverse impacts to geological or soil resources.
No direct or indirect impacts to geology would occur under Alternative 2 and no irreversible or irretrievable commitment of geological resources would occur. Alternative 2 would result in negligible adverse impacts to soil erosion and compaction during construction, operation and maintenance, and decommissioning activities. Erosion control measures would be implemented to minimize soil erosion during construction. In addition, a stormwater pollution prevention plan would be implemented, which would also minimize erosion potential. There would be an irreversible and irretrievable commitment of soil resources on areas where revegetation fails and subsequent erosion occurs. It is expected that these areas would be small overall and minimal, if any, erosion would occur.
Effects to soils could also occur from petroleum or other hazardous material spills. Best management practices related to hazardous materials spills would be implemented and the affected area would be cleaned. If a spill occurred, affected soils would be irretrievably and irreversibly lost.
Unavoidable adverse impacts to soil resources would occur, primarily during the construction period under Alternative 2. These impacts would be negligible and would be minimized with implementation of the stormwater pollution prevention plan and related erosion control measures. No unavoidable impacts to geology would occur as a result of selecting Alternative 2.
No direct or indirect impacts to geology would occur under Alternative 3 and no irreversible or irretrievable commitment of geological resources would occur. Alternative 3 would result in negligible adverse impacts to soil erosion and compaction during construction, operation and maintenance, and decommissioning activities. Erosion control measures would be implemented to minimize soil erosion during construction. In addition, a stormwater pollution prevention plan would be implemented, which would also minimize erosion potential. There would be an irreversible and irretrievable commitment of soil resources on areas where revegetation fails and subsequent erosion occurs. It is expected that these areas would be small overall and minimal, if any, erosion would occur.
Effects to soils could also occur from petroleum or other hazardous material spills. Best management practices related to hazardous materials spills would be implemented and the affected area would be cleaned. If a spill occurred, affected soils would be irretrievably and irreversibly lost.
Unavoidable adverse impacts to soil resources would occur, primarily during the construction period under Alternative 3. These impacts would be negligible and would be minimized with implementation of the stormwater pollution prevention plan and related erosion control measures. No unavoidable impacts to geology would occur as a result of selecting Alternative 3.
No irreversible or irretrievable commitment of geological or soil resources would occur under Alternative 4. Alternative 4 is not expected to result in unavoidable adverse impacts to geological or soil resources.
No irreversible or irretrievable commitment of geological or soil resources would occur under Alternative 5. Alternative 5 is not expected to result in unavoidable adverse impacts to geological or soil resources.

Executive Summary
Page ES-14 Ocotillo Sol Project Draft EIS/Draft CDCA Plan Amendment April 2012
TABLE ES-1 SUMMARY COMPARISON OF IMPACTS BY ALTERNATIVE
Alternative 1: No Action / No CDCA Plan Amendment
Alternative 2: Applicant’s Proposed Project (115 acres)
Alternative 3: Reduced Construction Footprint Alternative
(102 acres; Preferred Alternative)
Alternative 4: No Project/Amend CDCA Plan To Identify Area As Suitable For Solar Development
Alternative 5: No Project/Amend CDCA Plan To Identify Area As Unsuitable For Solar Development
Water Resources
No direct or indirect impacts. No direct or indirect impacts. No direct or indirect impacts. No direct or indirect impacts. No direct or indirect impacts.
Cumulative Impacts:
Alternative 1 would not result in impacts to water resources. This alternative would not contribute to cumulative impacts to water resources in the groundwater basin.
Alternative 2 would not result in direct or indirect impacts to water resources. Existing and reasonably foreseeable activities occurring on lands within the groundwater basin (e.g., renewable energy projects, recreation, transmission line development and maintenance, and agricultural activities) have had minimal impacts to groundwater resources. Therefore, these ongoing activities would likely continue to have minimal impacts on water resources. Mitigation measures in the form of a stormwater pollution prevention plan and erosion control measures would be implemented during construction, operation and maintenance, and decommissioning to minimize impacts to water resources. Alternative 2, when added to other reasonably foreseeable future projects, are not expected to result in cumulative impacts to water resources.
Alternative 3 would not result in direct or indirect impacts to water resources. Existing and reasonably foreseeable activities occurring on lands within the groundwater basin (e.g., renewable energy projects, recreation, transmission line development and maintenance, and agricultural activities) have had minimal impacts to groundwater resources. Therefore, these ongoing activities would likely continue to have minimal impacts on water resources. Mitigation measures in the form of a stormwater pollution prevention plan and erosion control measures would be implemented during construction, operation and maintenance, and decommissioning to minimize impacts to water resources. Alternative 3, when added to other reasonably foreseeable future projects, are not expected to result in cumulative impacts to water resources.
Alternative 4 would not result in impacts to water resources. This alternative would not contribute to cumulative impacts to water resources in the groundwater basin.
Alternative 5 would not result in impacts to water resources. This alternative would not contribute to cumulative impacts to water resources in the groundwater basin.
Irreversible and Irretrievable Commitment of Resources:
No direct or indirect impacts to water resources would occur under Alternative 1 and no irreversible or irretrievable commitment of water resources would occur. No unavoidable adverse impacts to water resources are expected to occur under Alternative 1.
No direct or indirect impacts to water resources would occur under Alternative 2 and no irreversible or irretrievable commitment of water resources would occur. By implementing the mitigation measures identified above, and by avoiding groundwater extraction from beneath the project site, no unavoidable adverse impacts to water resources are expected to occur under Alternative 2.
No direct or indirect impacts to water resources would occur under Alternative 3 and no irreversible or irretrievable commitment of water resources would occur. By implementing the mitigation measures identified above, and by avoiding groundwater extraction from beneath the project site, no unavoidable adverse impacts to water resources are expected to occur under Alternative 3.
No direct or indirect impacts to water resources would occur under Alternative 4 and no irreversible or irretrievable commitment of water resources would occur. No unavoidable adverse impacts to water resources are expected to occur under Alternative 4.
No direct or indirect impacts to water resources would occur under Alternative 5 and no irreversible or irretrievable commitment of water resources would occur. No unavoidable adverse impacts to water resources are expected to occur under Alternative 5.

Executive Summary
Ocotillo Sol Project Page ES-15 Draft EIS/Draft CDCA Plan Amendment April 2012
TABLE ES-1 SUMMARY COMPARISON OF IMPACTS BY ALTERNATIVE
Alternative 1: No Action / No CDCA Plan Amendment
Alternative 2: Applicant’s Proposed Project (115 acres)
Alternative 3: Reduced Construction Footprint Alternative
(102 acres; Preferred Alternative)
Alternative 4: No Project/Amend CDCA Plan To Identify Area As Suitable For Solar Development
Alternative 5: No Project/Amend CDCA Plan To Identify Area As Unsuitable For Solar Development
Biological Resources
(Vegetation and Noxious Weeds) Under Alternative 1, no direct or indirect adverse impacts to vegetation, riparian habitat, special status plants, or sensitive natural communities would occur.
Under Alternative 1, no direct or indirect adverse impacts from noxious, invasive, or non-native weed species would be expected to occur.
Under Alternative 2, permanent impacts to 100 acres of creosote bush–white burr sage scrub vegetation would occur. The area would remain un-vegetated after the facility is constructed and during its entire operation period. No other vegetation community would be disturbed or removed within the 100-acre construction area. The 100-acre solar field would be reclaimed after operations are terminated. The 15-acre temporary laydown area would be considered a temporary impact to creosote bush–white burr sage scrub vegetation, and the laydown area would be revegetated to repair impacts to the habitat after construction is complete. Removal of creosote bush–white burr sage scrub vegetation may affect flat-tailed horned lizard, burrowing owl, and other wildlife species that rely on the creosote bush–white burr sage scrub vegetation.
In addition, soil disturbed due to grading during construction and continued use of the access road may result in the introduction or increased density of non-native invasive plant species. These species can undermine the habitat quality and integrity of the native plant communities. Alternative 2 would result in direct and indirect adverse impacts to vegetation resources and the creosote bush–white burr sage scrub sensitive natural community. Mitigation measures would be implemented to minimize or compensate for these impacts.
No impacts to special status plant species are anticipated under Alternative 2.
Under Alternative 3, impacts to vegetation resources would be similar to, but slightly less than, those discussed under Alternative 2. As with Alternative 2, mitigation measures would be implemented to minimize or compensate for impacts under Alternative 3.
Under Alternative 3, 100 acres of permanent and 2 acres of temporary impacts would occur that may result in the spread of noxious, invasive, or non-native weed species. Soil disturbed due to grading during construction and continued use of the Ocotillo Sol Project area could result in the introduction or increased density of non-native invasive plant species. To reduce the potential for the introduction and spread of non-native invasive plant species, a Weed Management Plan has been prepared and would be implemented during both the construction and general operation and maintenance phases of the project, within and adjacent to the solar field as a mitigation measure.
Under Alternative 4, no direct or indirect adverse impacts to vegetation, riparian habitat, special status plants, or sensitive natural communities would occur.
Under Alternative 4, no direct or indirect adverse impacts from noxious, invasive, or non-native weed species would be expected to occur.
Under Alternative 5, no direct or indirect adverse impacts to vegetation, riparian habitat, special status plants, or sensitive natural communities would occur.
Under Alternative 5, no direct or indirect adverse impacts from noxious, invasive, or non-native weed species would be expected to occur.

Executive Summary
Page ES-16 Ocotillo Sol Project Draft EIS/Draft CDCA Plan Amendment April 2012
TABLE ES-1 SUMMARY COMPARISON OF IMPACTS BY ALTERNATIVE
Alternative 1: No Action / No CDCA Plan Amendment
Alternative 2: Applicant’s Proposed Project (115 acres)
Alternative 3: Reduced Construction Footprint Alternative
(102 acres; Preferred Alternative)
Alternative 4: No Project/Amend CDCA Plan To Identify Area As Suitable For Solar Development
Alternative 5: No Project/Amend CDCA Plan To Identify Area As Unsuitable For Solar Development
Biological Resources (continued)
(Wildlife) Under Alternative 1, no direct or indirect adverse impacts to wildlife or special status species would occur.
Alternative 2 would result in adverse impacts to flat-tailed horned lizard. Conservation and mitigation measures would be implemented to avoid, minimize, and/or compensate for impacts under this alternative. In accordance with the Flat-tailed Horned Lizard Rangewide Management Strategy, compensation for permanent impacts to flat-tailed horned lizard habitat within the Yuha Desert Wildlife Management Area will be at a 6:1 ratio.
Alternative 2 would result in adverse impacts to burrowing owl. Conservation and mitigation measures would be implemented to avoid, minimize, and/or compensate for impacts under this alternative.
Alternative 2 could result in adverse impacts to migratory bird species. Conservation and mitigation measures would be implemented to avoid, minimize, and/or compensate for impacts under this alternative.
Alternative 2 could result in adverse impacts to special status small mammals and reptiles. Conservation and mitigation measures would be implemented to avoid, minimize, and/or compensate for impacts under this alternative.
Impacts to wildlife movement are not anticipated to occur under Alternative 2.
Impacts to wildlife and habitat for special status wildlife would occur under Alternative 3. These impacts would be similar to, but slightly less than, those discussed under Alternative 2.
Under Alternative 4, no direct or indirect adverse impacts to wildlife or special status species would occur.
Under Alternative 5, no direct or indirect adverse impacts to wildlife or special status species would occur.
(Jurisdictional Waters) Under Alternative 1, no direct or indirect adverse impacts to jurisdictional waters would occur.
No impacts to U.S. Army Corps of Engineers, Regional Water Quality Control Board, or California Department of Fish and Game jurisdictional waters would occur under Alternative 2.
No impacts to U.S. Army Corps of Engineers, Regional Water Quality Control Board, or California Department of Fish and Game jurisdictional waters would occur under Alternative 3.
Under Alternative 4, no direct or indirect adverse impacts to jurisdictional waters would occur.
Under Alternative 5, no direct or indirect adverse impacts to jurisdictional waters would occur.

Executive Summary
Ocotillo Sol Project Page ES-17 Draft EIS/Draft CDCA Plan Amendment April 2012
TABLE ES-1 SUMMARY COMPARISON OF IMPACTS BY ALTERNATIVE
Alternative 1: No Action / No CDCA Plan Amendment
Alternative 2: Applicant’s Proposed Project (115 acres)
Alternative 3: Reduced Construction Footprint Alternative
(102 acres; Preferred Alternative)
Alternative 4: No Project/Amend CDCA Plan To Identify Area As Suitable For Solar Development
Alternative 5: No Project/Amend CDCA Plan To Identify Area As Unsuitable For Solar Development
Biological Resources (continued)
Cumulative Impacts:
Alternative 1 would not result in impacts to vegetation resources. This alternative would not contribute to cumulative impacts to vegetation in the 2-mile geographic scope area.
Alternative 1 would not result in impacts to wildlife resources. This alternative would not contribute to cumulative impacts to wildlife in the 2-mile geographic scope area.
The cumulative impact to the 57,304-acre Yuha Desert Wildlife Management Area would be 374.6 acres of flat-tailed horned lizard habitat disturbance from impacts 1) that have occurred since the 1997 adoption of the Flat-tailed Horned Lizard Rangewide Management Strategy, 2) that could result from reasonably foreseeable projects, and 3) that would occur under Alternative 2. These habitat disturbances would comprise about two-thirds of the 1 percent (1 percent of the 57,304-acre area is 573.04 acres) of habitat disturbance allowance within the Yuha Desert Wildlife Management Area.
Based on the U.S. Fish and Wildlife Service determination not to list the flat-tailed horned lizard, the success of BLM’s Flat-tailed Horned Lizard Rangewide Management Strategy, and implementation of mitigation and mitigation measures, Alternative 2, when combined with the other reasonably foreseeable future projects, would not result in a cumulatively adverse impact to flat-tailed horned lizard.
With implementation of mitigation measures, Alternative 2, when combined with other past, present and reasonably foreseeable projects in the area, would not result in a cumulatively adverse impact to burrowing owl.
With implementation of mitigation measures, Alternative 2 would not result in a cumulatively adverse impact to nesting raptors or migratory birds when combined with other past, present, and reasonably foreseeable projects in the area.
The cumulative impact to the 57,304-acre Yuha Desert Wildlife Management Area would be 361.6 acres of flat-tailed horned lizard habitat disturbance from impacts 1) that have occurred since the 1997 adoption of the Flat-tailed Horned Lizard Rangewide Management Strategy, 2) that could result from reasonably foreseeable projects, and 3) that would occur under Alternative 3. These habitat disturbances would comprise about two-thirds of the 1 percent (1 percent of the 57,304-acre area is 573.04 acres) of habitat disturbance allowance within the Yuha Desert Wildlife Management Area.
Based on the U.S. Fish and Wildlife Service determination not to list the flat-tailed horned lizard, the success of BLM’s Flat-tailed Horned Lizard Rangewide Management Strategy, and implementation of mitigation and mitigation measures, Alternative 3, when combined with the other reasonably foreseeable future projects, would not result in a cumulatively adverse impact to flat-tailed horned lizard.
With implementation of mitigation measures, Alternative 3, when combined with other past, present and reasonably foreseeable projects in the area, would not result in a cumulatively adverse impact to burrowing owl.
With implementation of mitigation measures, Alternative 3 would not result in a cumulatively adverse impact to nesting raptors or migratory birds when combined with other past, present, and reasonably foreseeable projects in the area.
Alternative 4 would not result in impacts to vegetation resources. This alternative would not contribute to cumulative impacts to vegetation in the 2-mile geographic scope area.
Alternative 4 would not result in impacts to wildlife resources. This alternative would not contribute to cumulative impacts to wildlife in the 2-mile geographic scope area.
Alternative 5 would not result in impacts to vegetation resources. This alternative would not contribute to cumulative impacts to vegetation in the 2-mile geographic scope area.
Alternative 5 would not result in impacts to wildlife resources. This alternative would not contribute to cumulative impacts to wildlife in the 2-mile geographic scope area.

Executive Summary
Page ES-18 Ocotillo Sol Project Draft EIS/Draft CDCA Plan Amendment April 2012
TABLE ES-1 SUMMARY COMPARISON OF IMPACTS BY ALTERNATIVE
Alternative 1: No Action / No CDCA Plan Amendment
Alternative 2: Applicant’s Proposed Project (115 acres)
Alternative 3: Reduced Construction Footprint Alternative
(102 acres; Preferred Alternative)
Alternative 4: No Project/Amend CDCA Plan To Identify Area As Suitable For Solar Development
Alternative 5: No Project/Amend CDCA Plan To Identify Area As Unsuitable For Solar Development
Biological Resources (continued)
Irreversible and Irretrievable Commitment of Resources:
No irreversible and irretrievable commitment of biological resources would occur, and no unavoidable adverse impacts would occur under Alternative 1.
Construction, operation and maintenance, and decommissioning activities under Alternative 2 would result in direct and indirect impacts to biological resources. Alternative 2 would result in the loss of 100 acres of native vegetation and habitat, as well as 15 acres of disturbed vegetation and habitat. These permanent and temporary losses of native vegetation would result in unavoidable adverse impacts to native vegetation and wildlife. Implementation of avoidance and mitigation measures would minimize adverse impacts. Compensation for permanent impacts to flat-tailed horned lizard habitat within the Yuha Desert Wildlife Management Area will be at a 6:1 ratio. Acquisition of compensation lands would occur within undisturbed habitat suitable for flat-tailed horned lizards. This mitigation would result in beneficial impacts to flat-tailed horned lizards, as well as other species occurring within this habitat, due to an increase in undisturbed area and likely limitations on future disturbance within acquired lands.
With these measures, Alternative 2 would not substantially alter or interfere with wildlife or plant populations in the project area. Adverse impacts would be negligible overall and would affect a small, localized area. The impacts to native vegetation and wildlife would not cause an irreversible and irretrievable commitment of the resources.
Construction, operation and maintenance, and decommissioning activities under Alternative 3 would result in direct and indirect impacts to biological resources. Alternative 3 would result in the loss of 100 acres of native vegetation and habitat, as well as 2 acres of disturbed vegetation and habitat. These permanent and temporary losses of native vegetation would result in unavoidable adverse impacts to native vegetation and wildlife. Implementation of avoidance and mitigation measures would minimize adverse impacts. Compensation for permanent impacts to flat-tailed horned lizard habitat within the Yuha Desert Wildlife Management Area will be at a 6:1 ratio. Acquisition of compensation lands would occur within undisturbed habitat suitable for flat-tailed horned lizards. This mitigation would result in beneficial impacts to flat-tailed horned lizards, as well as other species occurring within this habitat, due to an increase in undisturbed area and likely limitations on future disturbance within acquired lands.
With these measures, Alternative 3 would not substantially alter or interfere with wildlife or plant populations in the project area. Adverse impacts would be negligible overall and would affect a small, localized area. The impacts to native vegetation and wildlife would not cause an irreversible and irretrievable commitment of the resources.
No irreversible and irretrievable commitment of biological resources would occur, and no unavoidable adverse impacts would occur under Alternative 4.
No irreversible and irretrievable commitment of biological resources would occur, and no unavoidable adverse impacts would occur under Alternative 5.

Executive Summary
Ocotillo Sol Project Page ES-19 Draft EIS/Draft CDCA Plan Amendment April 2012
TABLE ES-1 SUMMARY COMPARISON OF IMPACTS BY ALTERNATIVE
Alternative 1: No Action / No CDCA Plan Amendment
Alternative 2: Applicant’s Proposed Project (115 acres)
Alternative 3: Reduced Construction Footprint Alternative
(102 acres; Preferred Alternative)
Alternative 4: No Project/Amend CDCA Plan To Identify Area As Suitable For Solar Development
Alternative 5: No Project/Amend CDCA Plan To Identify Area As Unsuitable For Solar Development
Cultural Resources
No direct or indirect impacts. There are 12 isolates and one recorded archaeological site within the Ocotillo Sol Project area. The 12 isolates and one recorded site would be destroyed during construction. The isolates that are within the Area of Potential Effect have been determined to be ineligible for the National Register of Historic Places and thus are not historic properties. The one archaeological site has been recommended ineligible for the National Register of Historic Places. The site would be destroyed during construction; however, effects to this resource would not be considered adverse. No historic properties would be impacted under Alternative 2.
There is a potential for indirect effects due to increased traffic during construction. It is also possible that grading within the construction area could increase the amount of sheet flow and water runoff during heavy rainfall events that could cause damage to cultural resources outside the construction area. There are four numbered sites within 100 feet of the direct effects; these sites may be indirectly affected by under Alternative 2. Cultural Resources Mitigation Measure 2 has been incorporated as a project design feature in order to ensure that project impacts for the above mentioned four sites do not result in an adverse effect.
There are 12 isolates and one recorded archaeological site within the Ocotillo Sol Project area. The 12 isolates and one recorded site would be destroyed during construction. The isolates that are within the Area of Potential Effect have been determined to be ineligible for the National Register of Historic Places and thus are not historic properties. The one archaeological site has been recommended ineligible for the National Register of Historic Places. The site would be destroyed during construction; however, effects to this resource would not be considered adverse. No historic properties would be impacted under Alternative 3.
There is a potential for indirect effects due to increased traffic during construction. It is also possible that grading within the construction area could increase the amount of sheet flow and water runoff during heavy rainfall events that could cause damage to cultural resources outside the construction area. There are four numbered sites within 100 feet of the direct effects; these sites may be indirectly affected by under Alternative 3. Cultural Resources Mitigation Measure 2 has been incorporated as a project design feature in order to ensure that project impacts for the above mentioned four sites do not result in an adverse effect.
No direct or indirect impacts. No direct or indirect impacts.
Cumulative Impacts:
Alternative 1 would not result in impacts to historic properties. This alternative would not contribute to cumulative impacts to historic properties or landscapes in the area.
No cumulative adverse impacts to cultural resources or historic properties are expected under Alternative 2 when combined with other reasonably foreseeable future projects.
No cumulative adverse impacts to cultural resources or historic properties are expected under Alternative 3 when combined with other reasonably foreseeable future projects.
Alternative 4 would not result in impacts to historic properties. This alternative would not contribute to cumulative impacts to historic properties or landscapes in the area.
Alternative 5 would not result in impacts to historic properties. This alternative would not contribute to cumulative impacts to historic properties or landscapes in the area.
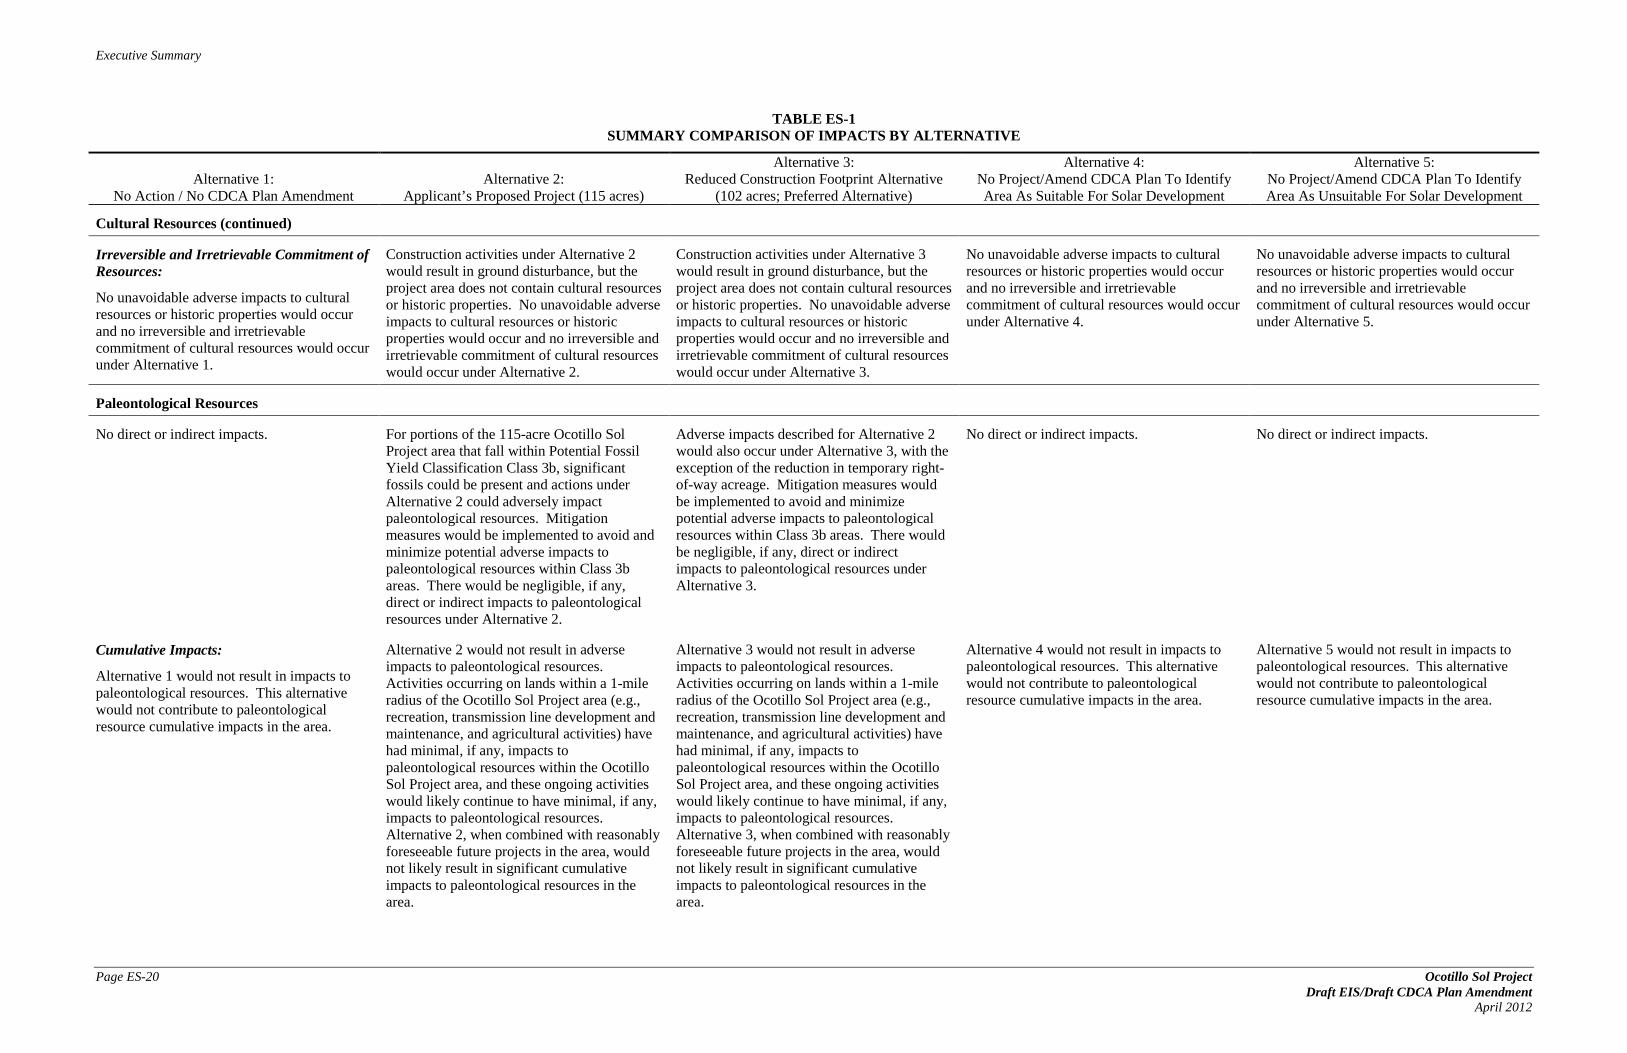
Executive Summary
Page ES-20 Ocotillo Sol Project Draft EIS/Draft CDCA Plan Amendment April 2012
TABLE ES-1 SUMMARY COMPARISON OF IMPACTS BY ALTERNATIVE
Alternative 1: No Action / No CDCA Plan Amendment
Alternative 2: Applicant’s Proposed Project (115 acres)
Alternative 3: Reduced Construction Footprint Alternative
(102 acres; Preferred Alternative)
Alternative 4: No Project/Amend CDCA Plan To Identify Area As Suitable For Solar Development
Alternative 5: No Project/Amend CDCA Plan To Identify Area As Unsuitable For Solar Development
Cultural Resources (continued)
Irreversible and Irretrievable Commitment of Resources:
No unavoidable adverse impacts to cultural resources or historic properties would occur and no irreversible and irretrievable commitment of cultural resources would occur under Alternative 1.
Construction activities under Alternative 2 would result in ground disturbance, but the project area does not contain cultural resources or historic properties. No unavoidable adverse impacts to cultural resources or historic properties would occur and no irreversible and irretrievable commitment of cultural resources would occur under Alternative 2.
Construction activities under Alternative 3 would result in ground disturbance, but the project area does not contain cultural resources or historic properties. No unavoidable adverse impacts to cultural resources or historic properties would occur and no irreversible and irretrievable commitment of cultural resources would occur under Alternative 3.
No unavoidable adverse impacts to cultural resources or historic properties would occur and no irreversible and irretrievable commitment of cultural resources would occur under Alternative 4.
No unavoidable adverse impacts to cultural resources or historic properties would occur and no irreversible and irretrievable commitment of cultural resources would occur under Alternative 5.
Paleontological Resources
No direct or indirect impacts. For portions of the 115-acre Ocotillo Sol Project area that fall within Potential Fossil Yield Classification Class 3b, significant fossils could be present and actions under Alternative 2 could adversely impact paleontological resources. Mitigation measures would be implemented to avoid and minimize potential adverse impacts to paleontological resources within Class 3b areas. There would be negligible, if any, direct or indirect impacts to paleontological resources under Alternative 2.
Adverse impacts described for Alternative 2 would also occur under Alternative 3, with the exception of the reduction in temporary right-of-way acreage. Mitigation measures would be implemented to avoid and minimize potential adverse impacts to paleontological resources within Class 3b areas. There would be negligible, if any, direct or indirect impacts to paleontological resources under Alternative 3.
No direct or indirect impacts. No direct or indirect impacts.
Cumulative Impacts:
Alternative 1 would not result in impacts to paleontological resources. This alternative would not contribute to paleontological resource cumulative impacts in the area.
Alternative 2 would not result in adverse impacts to paleontological resources. Activities occurring on lands within a 1-mile radius of the Ocotillo Sol Project area (e.g., recreation, transmission line development and maintenance, and agricultural activities) have had minimal, if any, impacts to paleontological resources within the Ocotillo Sol Project area, and these ongoing activities would likely continue to have minimal, if any, impacts to paleontological resources. Alternative 2, when combined with reasonably foreseeable future projects in the area, would not likely result in significant cumulative impacts to paleontological resources in the area.
Alternative 3 would not result in adverse impacts to paleontological resources. Activities occurring on lands within a 1-mile radius of the Ocotillo Sol Project area (e.g., recreation, transmission line development and maintenance, and agricultural activities) have had minimal, if any, impacts to paleontological resources within the Ocotillo Sol Project area, and these ongoing activities would likely continue to have minimal, if any, impacts to paleontological resources. Alternative 3, when combined with reasonably foreseeable future projects in the area, would not likely result in significant cumulative impacts to paleontological resources in the area.
Alternative 4 would not result in impacts to paleontological resources. This alternative would not contribute to paleontological resource cumulative impacts in the area.
Alternative 5 would not result in impacts to paleontological resources. This alternative would not contribute to paleontological resource cumulative impacts in the area.

Executive Summary
Ocotillo Sol Project Page ES-21 Draft EIS/Draft CDCA Plan Amendment April 2012
TABLE ES-1 SUMMARY COMPARISON OF IMPACTS BY ALTERNATIVE
Alternative 1: No Action / No CDCA Plan Amendment
Alternative 2: Applicant’s Proposed Project (115 acres)
Alternative 3: Reduced Construction Footprint Alternative
(102 acres; Preferred Alternative)
Alternative 4: No Project/Amend CDCA Plan To Identify Area As Suitable For Solar Development
Alternative 5: No Project/Amend CDCA Plan To Identify Area As Unsuitable For Solar Development
Paleontological Resources (continued)
Irreversible and Irretrievable Commitment of Resources:
No unavoidable adverse impacts to paleontological resources are expected to occur and no irreversible or irretrievable commitment of paleontological resources would occur under Alternative 1.
Construction and decommissioning activities under Alternative 2 could result in negligible, if any, adverse impacts to paleontological resources. Mitigation measures would be implemented to avoid and minimize potential adverse impacts to paleontological resources within Class 3b areas. No unavoidable adverse impacts to paleontological resources would occur and no irreversible or irretrievable commitment of paleontological resources would occur under Alternative 2.
Construction and decommissioning activities under Alternative 3 could result in negligible, if any, adverse impacts to paleontological resources. Mitigation measures would be implemented to avoid and minimize potential adverse impacts to paleontological resources within Class 3b areas. No unavoidable adverse impacts to paleontological resources would occur and no irreversible or irretrievable commitment of paleontological resources would occur under Alternative 3.
No unavoidable adverse impacts to paleontological resources are expected to occur and no irreversible or irretrievable commitment of paleontological resources would occur under Alternative 4.
No unavoidable adverse impacts to paleontological resources are expected to occur and no irreversible or irretrievable commitment of paleontological resources would occur under Alternative 5.
Fire/Fuels
No direct or indirect impacts. Under Alternative 2, potential wildland fire related negligible adverse impacts may occur. These impacts would be avoided by implementing a Weed Management Plan and best management practices.
Under Alternative 3, potential wildland fire related negligible adverse impacts may occur. These impacts would be avoided by implementing a Weed Management Plan and best management practices.
No direct or indirect impacts. No direct or indirect impacts.
Cumulative Impacts:
Alternative 1 would not result in fire-related impacts. This alternative would not contribute to wildland fire cumulative impacts in the area.
With implementation of mitigation measures as well as best management practices, Alternative 2 would not likely result in a cumulatively adverse impacts related to wildland fire when combined with other past, present, and reasonably foreseeable projects in the area.
With implementation of mitigation measures as well as best management practices, Alternative 3 would not likely result in a cumulatively adverse impacts related to wildland fire when combined with other past, present, and reasonably foreseeable projects in the area.
Alternative 4 would not result in fire-related impacts. This alternative would not contribute to wildland fire cumulative impacts in the area.
Alternative 5 would not result in fire-related impacts. This alternative would not contribute to wildland fire cumulative impacts in the area.
Irreversible and Irretrievable Commitment of Resources:
No unavoidable adverse wildland fire impacts are expected to occur and no irreversible or irretrievable commitment of resources would occur under Alternative 1.
Construction, operation and maintenance, and decommissioning activities under Alternative 2 could result in negligible adverse impacts related to fire and fuels hazards. Mitigation measures would be implemented avoid impacts related to fire and fuels hazards. No unavoidable adverse impacts related to fire and fuels hazards would occur and no irreversible and irretrievable commitment of resources would occur under Alternative 2.
Construction, operation and maintenance, and decommissioning activities under Alternative 3 could result in negligible adverse impacts related to fire and fuels hazards. Mitigation measures would be implemented avoid impacts related to fire and fuels hazards. No unavoidable adverse impacts related to fire and fuels hazards would occur and no irreversible and irretrievable commitment of resources would occur under Alternative 3.
No unavoidable adverse wildland fire impacts are expected to occur and no irreversible or irretrievable commitment of resources would occur under Alternative 4.
No unavoidable adverse wildland fire impacts are expected to occur and no irreversible or irretrievable commitment of resources would occur under Alternative 5.

Executive Summary
Page ES-22 Ocotillo Sol Project Draft EIS/Draft CDCA Plan Amendment April 2012
TABLE ES-1 SUMMARY COMPARISON OF IMPACTS BY ALTERNATIVE
Alternative 1: No Action / No CDCA Plan Amendment
Alternative 2: Applicant’s Proposed Project (115 acres)
Alternative 3: Reduced Construction Footprint Alternative
(102 acres; Preferred Alternative)
Alternative 4: No Project/Amend CDCA Plan To Identify Area As Suitable For Solar Development
Alternative 5: No Project/Amend CDCA Plan To Identify Area As Unsuitable For Solar Development
Lands and Realty
No direct or indirect impacts. Alternative 2 would not result in direct or indirect adverse impacts to lands and realty.
Alternative 3 would not result in direct or indirect adverse impacts to lands and realty.
No direct or indirect impacts. No direct or indirect impacts.
Cumulative Impacts:
Alternative 1 would not result in impacts to lands and realty. This alternative would be consistent with applicable plans, policies, and regulations and would not interfere with existing land uses. Alternative 1 would not contribute to cumulative impacts to lands and realty.
Alternative 2 would not result in adverse impacts to lands and realty. Renewable energy projects and other activities within approximately 20 miles of the Ocotillo Sol Project area have been consistent with applicable plans, policies, and regulations in the region. Alternative 2 would also be consistent with applicable plans, policies, and regulations and would not interfere with existing land uses. Alternative 2, in combination with other reasonably foreseeable future projects, would not contribute to cumulative impacts to lands and realty.
Alternative 3 would not result in adverse impacts to lands and realty. Renewable energy projects and other activities within approximately 20 miles of the Ocotillo Sol Project area have been consistent with applicable plans, policies, and regulations in the region. Alternative 3 would also be consistent with applicable plans, policies, and regulations and would not interfere with existing land uses. Alternative 3, in combination with other reasonably foreseeable future projects, would not contribute to cumulative impacts to lands and realty.
Alternative 4 would not result in impacts to lands and realty. This alternative would be consistent with applicable plans, policies, and regulations and would not interfere with existing land uses. Alternative 4 would not contribute to cumulative impacts to lands and realty.
Alternative 5 would not result in impacts to lands and realty. This alternative would be consistent with applicable plans, policies, and regulations and would not interfere with existing land uses. Alternative 5 would not contribute to cumulative impacts to lands and realty.
Irreversible and Irretrievable Commitment of Resources:
No unavoidable adverse impacts to lands and realty and no irreversible and irretrievable commitment of the resource are expected to occur under Alternative 1.
No direct or indirect impacts to lands and realty would occur under Alternative 2. The footprint of the Ocotillo Sol Project under Alternative 2 would limit future use of 100 acres of BLM-administered land for other uses for the life of the project and would result in irreversible and irretrievable commitment of the resource. No unavoidable adverse impacts to lands and realty are expected to occur under Alternative 2.
No direct or indirect impacts to lands and realty would occur under Alternative 3. The footprint of the Ocotillo Sol Project under Alternative 3 would limit future use of 100 acres of BLM-administered land for other uses for the life of the project and would result in irreversible and irretrievable commitment of the resource. No unavoidable adverse impacts to lands and realty are expected to occur under Alternative 3.
No unavoidable adverse impacts to lands and realty and no irreversible and irretrievable commitment of the resource are expected to occur under Alternative 4.
No unavoidable adverse impacts to lands and realty and no irreversible and irretrievable commitment of the resource are expected to occur under Alternative 5.

Executive Summary
Ocotillo Sol Project Page ES-23 Draft EIS/Draft CDCA Plan Amendment April 2012
TABLE ES-1 SUMMARY COMPARISON OF IMPACTS BY ALTERNATIVE
Alternative 1: No Action / No CDCA Plan Amendment
Alternative 2: Applicant’s Proposed Project (115 acres)
Alternative 3: Reduced Construction Footprint Alternative
(102 acres; Preferred Alternative)
Alternative 4: No Project/Amend CDCA Plan To Identify Area As Suitable For Solar Development
Alternative 5: No Project/Amend CDCA Plan To Identify Area As Unsuitable For Solar Development
Special Designations
No direct or indirect impacts. Under Alternative 2, no direct or indirect impacts would occur to special designation areas.
Under Alternative 3, no direct or indirect impacts would occur to special designation areas.
No direct or indirect impacts. No direct or indirect impacts.
Cumulative Impacts:
Alternative 1 would not result in impacts to special designations. This alternative would be consistent with applicable plans, policies, and regulations for these areas and would not interfere with management. Alternative 1 would not contribute to cumulative impacts to special designations.
Alternative 2 would not result in adverse impacts to special designation areas. Renewable energy projects and other activities within approximately 20 miles of the Ocotillo Sol Project area have been consistent with applicable plans, policies, and regulations for these special designation areas. Alternative 2 would also be consistent with applicable plans, policies, and regulations for special designation areas and would not interfere with management. Alternative 2, when combined with other reasonably foreseeable future projects, would not contribute to cumulative impacts to special designations.
Alternative 3 would not result in adverse impacts to special designation areas. Renewable energy projects and other activities within approximately 20 miles of the Ocotillo Sol Project area have been consistent with applicable plans, policies, and regulations for these special designation areas. Alternative 3 would also be consistent with applicable plans, policies, and regulations for special designation areas and would not interfere with management. Alternative 3, when combined with other reasonably foreseeable future projects, would not contribute to cumulative impacts to special designations.
Alternative 4 would not result in impacts to special designations. This alternative would be consistent with applicable plans, policies, and regulations for these areas and would not interfere with management. Alternative 4 would not contribute to cumulative impacts to special designations.
Alternative 5 would not result in impacts to special designations. This alternative would be consistent with applicable plans, policies, and regulations for these areas and would not interfere with management. Alternative 5 would not contribute to cumulative impacts to special designations.
Irreversible and Irretrievable Commitment of Resources:
No direct or indirect impacts to special designations would occur and no irreversible or irretrievable commitment of these resources would occur. No unavoidable adverse impacts to special designations are expected to occur under Alternative 1.
No direct or indirect impacts to special designations would occur and no irreversible or irretrievable commitment of these resources would occur. No unavoidable adverse impacts to special designations are expected to occur under Alternative 2.
No direct or indirect impacts to special designations would occur and no irreversible or irretrievable commitment of these resources would occur. No unavoidable adverse impacts to special designations are expected to occur under Alternative 3.
No direct or indirect impacts to special designations would occur and no irreversible or irretrievable commitment of these resources would occur. No unavoidable adverse impacts to special designations are expected to occur under Alternative 4.
No direct or indirect impacts to special designations would occur and no irreversible or irretrievable commitment of these resources would occur. No unavoidable adverse impacts to special designations are expected to occur under Alternative 5.

Executive Summary
Page ES-24 Ocotillo Sol Project Draft EIS/Draft CDCA Plan Amendment April 2012
TABLE ES-1 SUMMARY COMPARISON OF IMPACTS BY ALTERNATIVE
Alternative 1: No Action / No CDCA Plan Amendment
Alternative 2: Applicant’s Proposed Project (115 acres)
Alternative 3: Reduced Construction Footprint Alternative
(102 acres; Preferred Alternative)
Alternative 4: No Project/Amend CDCA Plan To Identify Area As Suitable For Solar Development
Alternative 5: No Project/Amend CDCA Plan To Identify Area As Unsuitable For Solar Development
Recreation
No direct or indirect impacts. Overall, due to minimal recreational use of the area, existing aesthetics, and existing land uses, Alternative 2 would have negligible adverse impacts on recreation.
Overall, due to minimal recreational use of the area, existing aesthetics, and existing land uses, Alternative 3 would have negligible adverse impacts on recreation.
No direct or indirect impacts. No direct or indirect impacts.
Cumulative Impacts:
Alternative 1 would not result in impacts to recreation. This alternative would be consistent with recreational use of the area. Alternative 1 would not contribute to cumulative impacts to recreation.
Alternative 2, in combination with other reasonably foreseeable future projects, would result in negligible adverse impacts to recreational users of the area. Impacts would be negligible overall due to minimal recreational use of the area. Renewable energy projects and other activities within approximately 2 miles of the Ocotillo Sol Project area have been consistent with recreational use of the area near the Ocotillo Sol Project. Alternative 2, when combined with other past, present, and reasonably foreseeable future projects in the area, would not result in a cumulatively adverse impact to recreation.
Alternative 3, in combination with other reasonably foreseeable future projects, would result in negligible adverse impacts to recreational users of the area. Impacts would be negligible overall due to minimal recreational use of the area. Alternative 3, when combined with other past, present, and reasonably foreseeable future projects in the area, would not result in a cumulatively adverse impact to recreation.
Alternative 4 would not result in impacts to recreation. This alternative would be consistent with recreational use of the area. Alternative 4 would not contribute to cumulative impacts to recreation.
Alternative 5 would not result in impacts to recreation. This alternative would be consistent with recreational use of the area. Alternative 5 would not contribute to cumulative impacts to recreation.
Irreversible and Irretrievable Commitment of Resources:
No unavoidable adverse impacts to recreation are expected to occur and no irreversible or irretrievable commitment of resources related to recreation would occur under Alternative 1.
Construction, operation and maintenance, and decommissioning activities under Alternative 2 would have negligible adverse impacts on recreation. Overall, due to minimal recreational use of the area, existing aesthetics, and existing land uses, Alternative 2 would have no unavoidable adverse impacts to recreation and no irreversible or irretrievable commitment of resources related to recreation would occur.
Construction, operation and maintenance, and decommissioning activities under Alternative 3 would have negligible adverse impacts on recreation. Overall, due to minimal recreational use of the area, existing aesthetics, and existing land uses, Alternative 3 would have no unavoidable adverse impacts to recreation and no irreversible or irretrievable commitment of resources related to recreation would occur.
No unavoidable adverse impacts to recreation are expected to occur and no irreversible or irretrievable commitment of resources related to recreation would occur under Alternative 4.
No unavoidable adverse impacts to recreation are expected to occur and no irreversible or irretrievable commitment of resources related to recreation would occur under Alternative 5.

Executive Summary
Ocotillo Sol Project Page ES-25 Draft EIS/Draft CDCA Plan Amendment April 2012
TABLE ES-1 SUMMARY COMPARISON OF IMPACTS BY ALTERNATIVE
Alternative 1: No Action / No CDCA Plan Amendment
Alternative 2: Applicant’s Proposed Project (115 acres)
Alternative 3: Reduced Construction Footprint Alternative
(102 acres; Preferred Alternative)
Alternative 4: No Project/Amend CDCA Plan To Identify Area As Suitable For Solar Development
Alternative 5: No Project/Amend CDCA Plan To Identify Area As Unsuitable For Solar Development
Visual Resources
No direct or indirect impacts. For all key observation points, the expected degree of visual contrast of the Ocotillo Sol Project would meet and be compatible with the Visual Resource Management Objective of Class III.
The proposed Interim Visual Resource Management Class III assignment for the Ocotillo Sol Project area is consistent with the California Desert Conservation Area prescriptions and the inventory class (Visual Resource Inventory Class III). The project would be constructed and maintained in conformance with the Visual Resource Management Class III objective and would not result in adverse visual impacts under Alternative 2.
Impacts to visual resources under Alternative 3 would be similar to those described for Alternative 2, except the project footprint would be 102 acres under Alternative 3. The expected level of visual contrast is compatible with the Visual Resource Management objectives for Class III, and would not be considered an adverse visual impact under Alternative 3. Alternative 3 would not result in direct or indirect adverse impacts to visual resources.
No direct or indirect impacts. No direct or indirect impacts.
Cumulative Impacts:
Alternative 1 would not result in impacts to visual resources. Alternative 1 would not contribute to cumulative impacts to visual resources.
No cumulative impacts to visual resources are anticipated under Alternative 2 in combination with other reasonably foreseeable future projects in the area.
No cumulative impacts to visual resources are anticipated under Alternative 3 in combination with other reasonably foreseeable future projects in the area.
Alternative 4 would not result in impacts to visual resources. Alternative 4 would not contribute to cumulative impacts to visual resources.
Alternative 5 would not result in impacts to visual resources. Alternative 5 would not contribute to cumulative impacts to visual resources.
Irreversible and Irretrievable Commitment of Resources:
No direct or indirect impacts to visual resources would occur and no irreversible or irretrievable commitment of visual resources would occur. No unavoidable adverse impacts to visual resources are expected to occur under Alternative 1.
Impacts to visual resources from dust emissions would be temporary and minimized by implementing dust control measures. This impact would not be avoidable; however, mitigation measures and the short duration of the impact would result in minimal, if any, changes in viewshed. No direct or indirect impacts to visual resources would occur and no irreversible or irretrievable commitment of visual resources would occur under Alternative 2.
Impacts to visual resources from dust emissions would be temporary and minimized by implementing dust control measures. This impact would not be avoidable; however, mitigation measures and the short duration of the impact would result in minimal, if any, changes in viewshed. No direct or indirect impacts to visual resources would occur and no irreversible or irretrievable commitment of visual resources would occur under Alternative 3.
No direct or indirect impacts to visual resources would occur and no irreversible or irretrievable commitment of visual resources would occur. No unavoidable adverse impacts to visual resources are expected to occur under Alternative 4.
No direct or indirect impacts to visual resources would occur and no irreversible or irretrievable commitment of visual resources would occur. No unavoidable adverse impacts to visual resources are expected to occur under Alternative 5.

Executive Summary
Page ES-26 Ocotillo Sol Project Draft EIS/Draft CDCA Plan Amendment April 2012
TABLE ES-1 SUMMARY COMPARISON OF IMPACTS BY ALTERNATIVE
Alternative 1: No Action / No CDCA Plan Amendment
Alternative 2: Applicant’s Proposed Project (115 acres)
Alternative 3: Reduced Construction Footprint Alternative
(102 acres; Preferred Alternative)
Alternative 4: No Project/Amend CDCA Plan To Identify Area As Suitable For Solar Development
Alternative 5: No Project/Amend CDCA Plan To Identify Area As Unsuitable For Solar Development
Transportation and Access
No direct or indirect impacts. Under Alternative 2, construction, operation and maintenance, and decommissioning activities would not result in direct or indirect impacts to traffic conditions in the project area.
Under Alternative 3, construction, operation and maintenance, and decommissioning activities would not result in direct or indirect impacts to traffic conditions in the project area.
No direct or indirect impacts. No direct or indirect impacts.
Cumulative Impacts:
Alternative 1 would not result in impacts to transportation and access. This alternative would not increase traffic volumes or disrupt access. Alternative 1 would not contribute to cumulative impacts to transportation and access.
Alternative 2, in combination with other reasonably foreseeable future projects would not result in an increase of traffic volumes or disrupt access. Renewable energy projects in the vicinity would not likely have the same construction schedule and would not result in a significant increase in traffic volumes. Alternative 2, when combined with other reasonably foreseeable future projects, is not expected to result in cumulative impacts to transportation and access.
Alternative 3, in combination with other reasonably foreseeable future projects would not result in an increase of traffic volumes or disrupt access. Renewable energy projects in the vicinity would not likely have the same construction schedule and would not result in a significant increase in traffic volumes. Alternative 3, when combined with other reasonably foreseeable future projects, is not expected to result in cumulative impacts to transportation and access.
Alternative 4 would not result in impacts to transportation and access. This alternative would not increase traffic volumes or disrupt access. Alternative 4 would not contribute to cumulative impacts to transportation and access.
Alternative 5 would not result in impacts to transportation and access. This alternative would not increase traffic volumes or disrupt access. Alternative 5 would not contribute to cumulative impacts to transportation and access.
Irreversible and Irretrievable Commitment of Resources:
No direct or indirect impacts to transportation and access would occur and no irreversible or irretrievable commitment of these resources would occur. No unavoidable adverse impacts to transportation and access are expected to occur under Alternative 1.
No direct or indirect impacts to transportation and access would occur under Alternative 2 and no irreversible or irretrievable commitment of these resources would occur. No unavoidable adverse impacts to transportation and access are expected to occur under Alternative 2.
No direct or indirect impacts to transportation and access would occur under Alternative 3 and no irreversible or irretrievable commitment of these resources would occur. No unavoidable adverse impacts to transportation and access are expected to occur under Alternative 3.
No direct or indirect impacts to transportation and access would occur and no irreversible or irretrievable commitment of these resources would occur. No unavoidable adverse impacts to transportation and access are expected to occur under Alternative 4.
No direct or indirect impacts to transportation and access would occur and no irreversible or irretrievable commitment of these resources would occur. No unavoidable adverse impacts to transportation and access are expected to occur under Alternative 5.
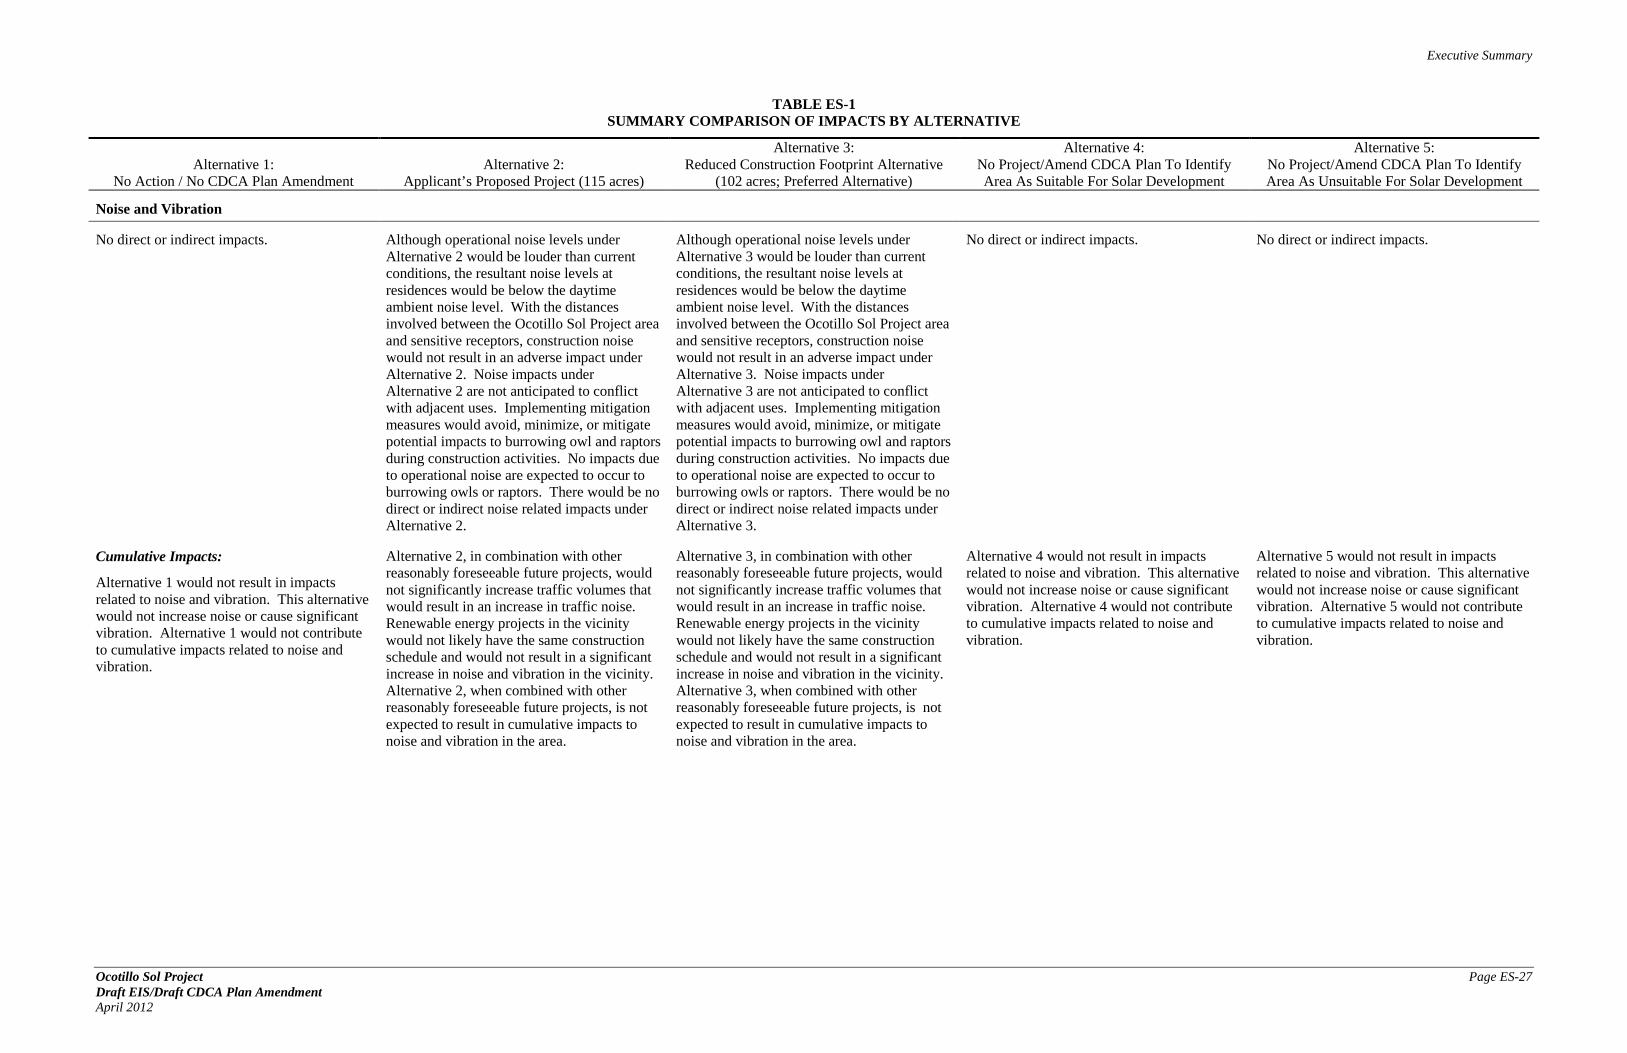
Executive Summary
Ocotillo Sol Project Page ES-27 Draft EIS/Draft CDCA Plan Amendment April 2012
TABLE ES-1 SUMMARY COMPARISON OF IMPACTS BY ALTERNATIVE
Alternative 1: No Action / No CDCA Plan Amendment
Alternative 2: Applicant’s Proposed Project (115 acres)
Alternative 3: Reduced Construction Footprint Alternative
(102 acres; Preferred Alternative)
Alternative 4: No Project/Amend CDCA Plan To Identify Area As Suitable For Solar Development
Alternative 5: No Project/Amend CDCA Plan To Identify Area As Unsuitable For Solar Development
Noise and Vibration
No direct or indirect impacts. Although operational noise levels under Alternative 2 would be louder than current conditions, the resultant noise levels at residences would be below the daytime ambient noise level. With the distances involved between the Ocotillo Sol Project area and sensitive receptors, construction noise would not result in an adverse impact under Alternative 2. Noise impacts under Alternative 2 are not anticipated to conflict with adjacent uses. Implementing mitigation measures would avoid, minimize, or mitigate potential impacts to burrowing owl and raptors during construction activities. No impacts due to operational noise are expected to occur to burrowing owls or raptors. There would be no direct or indirect noise related impacts under Alternative 2.
Although operational noise levels under Alternative 3 would be louder than current conditions, the resultant noise levels at residences would be below the daytime ambient noise level. With the distances involved between the Ocotillo Sol Project area and sensitive receptors, construction noise would not result in an adverse impact under Alternative 3. Noise impacts under Alternative 3 are not anticipated to conflict with adjacent uses. Implementing mitigation measures would avoid, minimize, or mitigate potential impacts to burrowing owl and raptors during construction activities. No impacts due to operational noise are expected to occur to burrowing owls or raptors. There would be no direct or indirect noise related impacts under Alternative 3.
No direct or indirect impacts. No direct or indirect impacts.
Cumulative Impacts:
Alternative 1 would not result in impacts related to noise and vibration. This alternative would not increase noise or cause significant vibration. Alternative 1 would not contribute to cumulative impacts related to noise and vibration.
Alternative 2, in combination with other reasonably foreseeable future projects, would not significantly increase traffic volumes that would result in an increase in traffic noise. Renewable energy projects in the vicinity would not likely have the same construction schedule and would not result in a significant increase in noise and vibration in the vicinity. Alternative 2, when combined with other reasonably foreseeable future projects, is not expected to result in cumulative impacts to noise and vibration in the area.
Alternative 3, in combination with other reasonably foreseeable future projects, would not significantly increase traffic volumes that would result in an increase in traffic noise. Renewable energy projects in the vicinity would not likely have the same construction schedule and would not result in a significant increase in noise and vibration in the vicinity. Alternative 3, when combined with other reasonably foreseeable future projects, is not expected to result in cumulative impacts to noise and vibration in the area.
Alternative 4 would not result in impacts related to noise and vibration. This alternative would not increase noise or cause significant vibration. Alternative 4 would not contribute to cumulative impacts related to noise and vibration.
Alternative 5 would not result in impacts related to noise and vibration. This alternative would not increase noise or cause significant vibration. Alternative 5 would not contribute to cumulative impacts related to noise and vibration.

Executive Summary
Page ES-28 Ocotillo Sol Project Draft EIS/Draft CDCA Plan Amendment April 2012
TABLE ES-1 SUMMARY COMPARISON OF IMPACTS BY ALTERNATIVE
Alternative 1: No Action / No CDCA Plan Amendment
Alternative 2: Applicant’s Proposed Project (115 acres)
Alternative 3: Reduced Construction Footprint Alternative
(102 acres; Preferred Alternative)
Alternative 4: No Project/Amend CDCA Plan To Identify Area As Suitable For Solar Development
Alternative 5: No Project/Amend CDCA Plan To Identify Area As Unsuitable For Solar Development
Noise and Vibration (continued)
Irreversible and Irretrievable Commitment of Resources:
No direct or indirect impacts from noise would occur and no irreversible or irretrievable commitment of resources from noise impacts would occur. No unavoidable adverse impacts from noise are expected to occur under Alternative 1.
No direct impacts from noise and vibration would occur under Alternative 2. Indirect unavoidable impacts could occur, however, to burrowing owl individuals and/or active burrowing owl burrows during grading, vegetation clearing, and other construction activities if those activities take place within 250 feet of an active burrow during the breeding season. In addition, if construction occurs between February 1 and July 15, impacts to an active raptor nest could occur. These impacts would be mitigated or avoided by mitigation measures. No irreversible and irretrievable commitment of resources from noise or vibration impacts would occur under Alternative 2.
No direct impacts from noise and vibration would occur under Alternative 3. Indirect unavoidable impacts could occur, however, to burrowing owl individuals and/or active burrowing owl burrows during grading, vegetation clearing, and other construction activities if those activities take place within 250 feet of an active burrow during the breeding season. In addition, if construction occurs between February 1 and July 15, impacts to an active raptor nest could occur. These impacts would be mitigated or avoided by mitigation measures. No irreversible and irretrievable commitment of resources from noise or vibration impacts would occur under Alternative 3.
No direct or indirect impacts from noise would occur and no irreversible or irretrievable commitment of resources from noise impacts would occur. No unavoidable adverse impacts from noise are expected to occur under Alternative 4.
No direct or indirect impacts from noise would occur and no irreversible or irretrievable commitment of resources from noise impacts would occur. No unavoidable adverse impacts from noise are expected to occur under Alternative 5.
Public Health and Safety
No direct or indirect impacts. No direct or indirect adverse impacts to public health and safety would occur under Alternative 2. Implementation of best management practices would avoid and reduce the potential for release of hazardous materials.
No direct or indirect adverse impacts to public health and safety would occur under Alternative 3. Implementation of best management practices would avoid and reduce the potential for release of hazardous materials.
No direct or indirect impacts. No direct or indirect impacts.
Cumulative Impacts:
Alternative 1 would not result in impacts to public health and safety. This alternative would be consistent with applicable laws, policies, and regulations related to public health and safety. Alternative 1 would not contribute to cumulative impacts to public health.
Alternative 2 would not result in adverse impacts to public health and safety. Renewable energy projects and other activities within approximately 20 miles of the Ocotillo Sol Project area have been consistent with applicable laws, policies, and regulations related to public health and safety. Alternative 2 would also be consistent with applicable laws, policies, and regulations. Alternative 2, when combined with other reasonably foreseeable future projects, is not expected to result in cumulative impacts to public health and safety.
Alternative 3 would not result in adverse impacts to public health and safety. Renewable energy projects and other activities within approximately 20 miles of the Ocotillo Sol Project area have been consistent with applicable laws, policies, and regulations related to public health and safety. Alternative 3 would also be consistent with applicable laws, policies, and regulations. Alternative 3, when combined with other reasonably foreseeable future projects, is not expected to result in cumulative impacts to public health and safety.
Alternative 4 would not result in impacts to public health and safety. This alternative would be consistent with applicable laws, policies, and regulations related to public health and safety. Alternative 4 would not contribute to cumulative impacts to public health.
Alternative 5 would not result in impacts to public health and safety. This alternative would be consistent with applicable laws, policies, and regulations related to public health and safety. Alternative 5 would not contribute to cumulative impacts to public health.

Executive Summary
Ocotillo Sol Project Page ES-29 Draft EIS/Draft CDCA Plan Amendment April 2012
TABLE ES-1 SUMMARY COMPARISON OF IMPACTS BY ALTERNATIVE
Alternative 1: No Action / No CDCA Plan Amendment
Alternative 2: Applicant’s Proposed Project (115 acres)
Alternative 3: Reduced Construction Footprint Alternative
(102 acres; Preferred Alternative)
Alternative 4: No Project/Amend CDCA Plan To Identify Area As Suitable For Solar Development
Alternative 5: No Project/Amend CDCA Plan To Identify Area As Unsuitable For Solar Development
Public Health and Safety (continued)
Irreversible and Irretrievable Commitment of Resources:
No unavoidable adverse impacts related to public health and safety would occur and no irreversible or irretrievable commitment of resources would occur under Alternative 1.
Construction, operation and maintenance, and decommissioning activities under Alternative 2 could result in release of hazardous materials. Implementation of best management practices would avoid and reduce the potential for release of hazardous materials. No unavoidable adverse impacts related to public health and safety would occur and no irreversible or irretrievable commitment of resources would occur under Alternative 2.
Construction, operation and maintenance, and decommissioning activities under Alternative 3 could result in release of hazardous materials. Implementation of best management practices would avoid and reduce the potential for release of hazardous materials. No unavoidable adverse impacts related to public health and safety would occur and no irreversible or irretrievable commitment of resources would occur under Alternative 3.
No unavoidable adverse impacts related to public health and safety would occur and no irreversible or irretrievable commitment of resources would occur under Alternative 4.
No unavoidable adverse impacts related to public health and safety would occur and no irreversible or irretrievable commitment of resources would occur under Alternative 5.
Socioeconomics
No direct or indirect impacts. Under Alternative 2, the Ocotillo Sol Project would generate a marginal economic benefit for the local economy, the impact would be relatively small and would not represent a substantial impact to the regional economy.
Under Alternative 2, no impacts to property values, adverse or beneficial, were identified. No impacts to population and housing, adverse or beneficial, were identified under Alternative 2.
No social impacts, adverse or beneficial, were identified for the relatively passive and infrequent operation and maintenance activities.
Under Alternative 3, the Ocotillo Sol Project would generate a marginal economic benefit for the local economy, the impact would be relatively small and would not represent a substantial impact to the regional economy.
Under Alternative 3, no impacts to property values, adverse or beneficial, were identified. No impacts to population and housing, adverse or beneficial, were identified under Alternative 3.
No social impacts, adverse or beneficial, were identified for the relatively passive and infrequent operation and maintenance activities.
No direct or indirect impacts. No direct or indirect impacts.
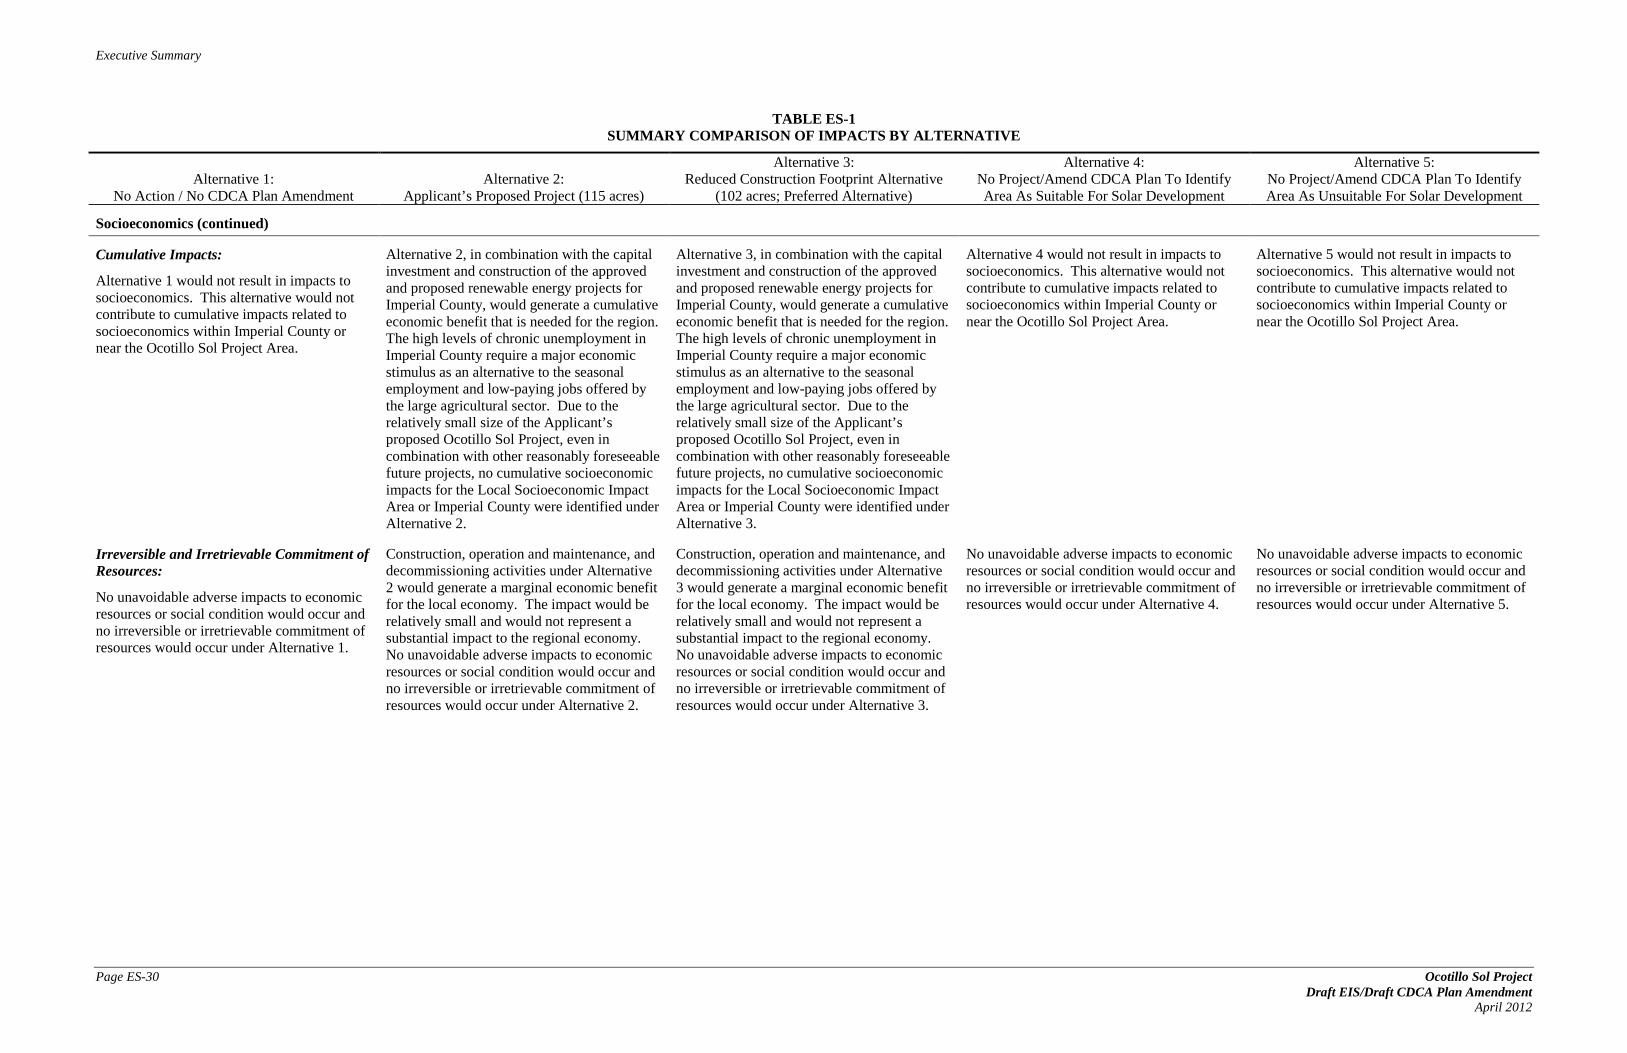
Executive Summary
Page ES-30 Ocotillo Sol Project Draft EIS/Draft CDCA Plan Amendment April 2012
TABLE ES-1 SUMMARY COMPARISON OF IMPACTS BY ALTERNATIVE
Alternative 1: No Action / No CDCA Plan Amendment
Alternative 2: Applicant’s Proposed Project (115 acres)
Alternative 3: Reduced Construction Footprint Alternative
(102 acres; Preferred Alternative)
Alternative 4: No Project/Amend CDCA Plan To Identify Area As Suitable For Solar Development
Alternative 5: No Project/Amend CDCA Plan To Identify Area As Unsuitable For Solar Development
Socioeconomics (continued)
Cumulative Impacts:
Alternative 1 would not result in impacts to socioeconomics. This alternative would not contribute to cumulative impacts related to socioeconomics within Imperial County or near the Ocotillo Sol Project Area.
Alternative 2, in combination with the capital investment and construction of the approved and proposed renewable energy projects for Imperial County, would generate a cumulative economic benefit that is needed for the region. The high levels of chronic unemployment in Imperial County require a major economic stimulus as an alternative to the seasonal employment and low-paying jobs offered by the large agricultural sector. Due to the relatively small size of the Applicant’s proposed Ocotillo Sol Project, even in combination with other reasonably foreseeable future projects, no cumulative socioeconomic impacts for the Local Socioeconomic Impact Area or Imperial County were identified under Alternative 2.
Alternative 3, in combination with the capital investment and construction of the approved and proposed renewable energy projects for Imperial County, would generate a cumulative economic benefit that is needed for the region. The high levels of chronic unemployment in Imperial County require a major economic stimulus as an alternative to the seasonal employment and low-paying jobs offered by the large agricultural sector. Due to the relatively small size of the Applicant’s proposed Ocotillo Sol Project, even in combination with other reasonably foreseeable future projects, no cumulative socioeconomic impacts for the Local Socioeconomic Impact Area or Imperial County were identified under Alternative 3.
Alternative 4 would not result in impacts to socioeconomics. This alternative would not contribute to cumulative impacts related to socioeconomics within Imperial County or near the Ocotillo Sol Project Area.
Alternative 5 would not result in impacts to socioeconomics. This alternative would not contribute to cumulative impacts related to socioeconomics within Imperial County or near the Ocotillo Sol Project Area.
Irreversible and Irretrievable Commitment of Resources:
No unavoidable adverse impacts to economic resources or social condition would occur and no irreversible or irretrievable commitment of resources would occur under Alternative 1.
Construction, operation and maintenance, and decommissioning activities under Alternative 2 would generate a marginal economic benefit for the local economy. The impact would be relatively small and would not represent a substantial impact to the regional economy. No unavoidable adverse impacts to economic resources or social condition would occur and no irreversible or irretrievable commitment of resources would occur under Alternative 2.
Construction, operation and maintenance, and decommissioning activities under Alternative 3 would generate a marginal economic benefit for the local economy. The impact would be relatively small and would not represent a substantial impact to the regional economy. No unavoidable adverse impacts to economic resources or social condition would occur and no irreversible or irretrievable commitment of resources would occur under Alternative 3.
No unavoidable adverse impacts to economic resources or social condition would occur and no irreversible or irretrievable commitment of resources would occur under Alternative 4.
No unavoidable adverse impacts to economic resources or social condition would occur and no irreversible or irretrievable commitment of resources would occur under Alternative 5.

Executive Summary
Ocotillo Sol Project Page ES-31 Draft EIS/Draft CDCA Plan Amendment April 2012
TABLE ES-1 SUMMARY COMPARISON OF IMPACTS BY ALTERNATIVE
Alternative 1: No Action / No CDCA Plan Amendment
Alternative 2: Applicant’s Proposed Project (115 acres)
Alternative 3: Reduced Construction Footprint Alternative
(102 acres; Preferred Alternative)
Alternative 4: No Project/Amend CDCA Plan To Identify Area As Suitable For Solar Development
Alternative 5: No Project/Amend CDCA Plan To Identify Area As Unsuitable For Solar Development
Environmental Justice
No direct or indirect impacts. No adverse socioeconomic impacts were identified for Alternative 2 and Alternative 2 would not generate disproportionate adverse Environmental Justice impacts. Alternative 2 would not result in direct or indirect impacts to Environmental Justice.
No adverse socioeconomic impacts were identified for Alternative 3 and Alternative 3 would not generate disproportionate adverse Environmental Justice impacts. Alternative 3 would not result in direct or indirect impacts to Environmental Justice.
No direct or indirect impacts. No direct or indirect impacts.
Cumulative Impacts:
Alternative 1 would not result in impacts to Environmental Justice. This alternative would not contribute to cumulative impacts related to Environmental Justice within Imperial County or near of the Ocotillo Sol Project Area.
No cumulative adverse Environmental Justice impacts were identified under Alternative 2. This alternative, in combination with other reasonably foreseeable future projects, would not generate a cumulative impact that would yield disproportionate adverse Environmental Justice impacts.
No cumulative adverse Environmental Justice impacts were identified under Alternative 3. This alternative, in combination with other reasonably foreseeable future projects, would not generate a cumulative impact that would yield disproportionate adverse Environmental Justice impacts.
Alternative 4 would not result in impacts to Environmental Justice. This alternative would not contribute to cumulative impacts related to Environmental Justice within Imperial County or near of the Ocotillo Sol Project Area.
Alternative 5 would not result in impacts to Environmental Justice. This alternative would not contribute to cumulative impacts related to Environmental Justice within Imperial County or near of the Ocotillo Sol Project Area.
Irreversible and Irretrievable Commitment of Resources:
No direct or indirect impacts to Environmental Justice would occur and no irreversible or irretrievable commitment of resources would occur. No unavoidable adverse impacts to Environmental Justice are expected to occur under Alternative 1.
The Ocotillo Sol Project area is located within a rural area and within a designated utility corridor. The project area is not located in or near an urban area and would not disproportionately have an effect on low income or minority populations. No direct or indirect impacts to Environmental Justice would occur under Alternative 2 and no irreversible or irretrievable commitment of resources would occur. No unavoidable adverse impacts to Environmental Justice are expected to occur under Alternative 2.
The Ocotillo Sol Project area is located within a rural area and within a designated utility corridor. The project area is not located in or near an urban area and would not disproportionately have an effect on low income or minority populations. No direct or indirect impacts to Environmental Justice would occur under Alternative 3 and no irreversible or irretrievable commitment of resources would occur. No unavoidable adverse impacts to Environmental Justice are expected to occur under Alternative 3.
No direct or indirect impacts to Environmental Justice would occur and no irreversible or irretrievable commitment of resources would occur. No unavoidable adverse impacts to Environmental Justice are expected to occur under Alternative 4.
No direct or indirect impacts to Environmental Justice would occur and no irreversible or irretrievable commitment of resources would occur under Alternative 5. No unavoidable adverse impacts to Environmental Justice are expected to occur.

Executive Summary
Page ES-32 Ocotillo Sol Project Draft EIS/Draft CDCA Plan Amendment April 2012
This page is intentionally blank.

TABLE OF CONTENTS
EXECUTIVE SUMMARY ES-1 ES.1 Project Overview ES-1 ES.2 Purpose and Need ES-2 ES.3 Alternatives ES-3
ES.3.1 Alternative 1: No Action/No CDCA Plan Amendment ES-3 ES.3.2 Alternative 2: Applicant’s Proposed Project ES-3 ES.3.3 Alternative 3: Reduced Construction Footprint Alternative (Preferred
Alternative) ES-4 ES.3.4 Alternative 4: No Project/Amend CDCA Plan to Identify Area as
Suitable for Solar Development ES-4 ES.3.5 Alternative 5: No Project/Amend CDCA Plan to Identify Area as
Unsuitable for Solar Development ES-4 ES.4 Environmental Consequences ES-5 ES.5 Lead Agency Roles and Responsibilities ES-6 ES.6 Native American Government–to-Government Consultation ES-6 ES.7 Public Participation ES-6 ES.8 Scoping Comments ES-7
CHAPTER 1, INTRODUCTION AND PURPOSE AND NEED 1-1 1.1 Project Overview 1-1 1.2 General Location and Map 1-2 1.3 BLM Purpose and Need 1-3 1.4 Applicant’s Objectives 1-4 1.5 Issues 1-4 1.6 Agency Roles and Authorizations 1-5 1.7 Policy Consistency and Plan Conformance 1-5
1.7.1 Federal Land Policy and Management Act 1-5 1.7.2 National Environmental Policy Act 1-7 1.7.3 Clean Air Act 1-7 1.7.4 Energy Policy Act 1-7 1.7.5 National Historic Preservation Act 1-7 1.7.6 Renewable Energy Development by the Department of the Interior 1-8 1.7.7 California Desert Conservation Area Plan 1-8 1.7.8 Flat-tailed Horned Lizard Management Area 1-11
1.8 Other Applicable Plans and Programs 1-11 1.8.1 State of California Renewables Portfolio Standard Program 1-11 1.8.2 State Implementation Plan for Particulate Matter
Less Than 10 Microns in Diameter 1-11 1.8.3 Imperial County General Plan (1993) 1-12
Ocotillo Sol Project Page i Draft EIS/Draft CDCA Plan Amendment April 2012
Table of Contents

Table of Contents
TABLE OF CONTENTS (CONT.)
CHAPTER 2, DESCRIPTION OF ALTERNATIVES 2-1 2.1 Overview of Alternatives Development 2-1 2.2 Alternatives Considered and Carried Forward for Detailed Analysis 2-3
2.2.1 Alternative 1: No Action/No CDCA Plan Amendment 2-3 2.2.2 Alternative 2: Applicant’s Proposed Project 2-4 2.2.3 Alternative 3: Reduced Construction Footprint Alternative
(Preferred Alternative) 2-19 2.2.4 Alternative 4: No Project/Amend CDCA Plan to Identify Area
as Suitable For Solar Development 2-20 2.2.5 Alternative 5: No Project/Amend CDCA Plan to Identify Area
as Unsuitable for Solar Development 2-20 2.3 Alternatives Considered but Eliminated From Detailed Analysis 2-20
2.3.1 Alternative Sites 2-21 2.3.2 Alternative Energy Generation Technologies 2-22 2.3.3 Conservation and Demand-side Management and
Distributed Generation 2-22 2.4 Comparison of Alternatives 2-23
2.4.1 Preferred Alternative 2-25 CHAPTER 3, AFFECTED ENVIRONMENT 3-1
3.1 Introduction and Overview 3-1 3.2 Air Quality 3-1
3.2.1 Applicable Regulations, Plans, and Policies/Management Goals 3-2 3.2.2 Compliance with Air Quality Standards 3-10 3.2.3 Climate and Meteorology 3-11 3.2.4 Air Quality in the Ocotillo Sol Project Area 3-12
3.3 Greenhouse Gases and Climate Change 3-22 3.3.1 Applicable Regulations, Plans, and Policies/Management Goals 3-23 3.3.2 Greenhouse Gases of Primary Concern 3-29 3.3.3 Greenhouse Gases Existing Conditions 3-30
3.4 Geology and Soils 3-32 3.4.1 Applicable Regulations, Plans, and Policies/Management Goals 3-32 3.4.2 Existing Conditions 3-33
3.5 Water Resources 3-38 3.5.1 Applicable Regulations, Plans, and Policies/Management Goals 3-38 3.5.2 Existing Conditions 3-40
3.6 Biological Resources 3-43 3.6.1 Applicable Regulations, Plans, and Policies/Management Goals 3-43 3.6.2 Methodology 3-48 3.6.3 Vegetation Resources 3-49
Page ii Ocotillo Sol Project Draft EIS/Draft CDCA Plan Amendment
April 2012

Table of Contents
3.6.4 Wildlife 3-51 3.6.5 Jurisdictional Resources 3-56
3.7 Cultural Resources 3-57 3.7.1 Applicable Regulations, Plans, and Policies/Management Goals 3-57 3.7.2 Existing Conditions 3-59
3.8 Paleontological Resources 3-64 3.8.1 Applicable Regulations, Plans, and Policies/Management Goals 3-64 3.8.2 Existing Conditions 3-65
3.9 Fire/Fuels 3-68 3.9.1 Applicable Regulations, Plans, and Policies/Management Goals 3-68 3.9.2 Existing Conditions 3-68
3.10 Lands and Realty 3-71 3.10.1 Applicable Regulations, Plans, and Policies/Management Goals 3-71 3.10.2 Existing Conditions 3-72
3.11 Special Designations 3-73 3.11.1 Applicable Regulations, Plans, and Policies/Management Goals 3-73 3.11.2 Existing Conditions 3-75
3.12 Lands with Wilderness Characteristics 3-77 3.12.1 Management of Lands with Wilderness Characteristics 3-77 3.12.2 Background of Wilderness Designation in the CDCA 3-77 3.12.3 Inventory of Lands with Wilderness Characteristics 3-77
3.13 Recreation 3-79 3.13.1 Applicable Regulations, Plans, and Policies/Management Goals 3-79 3.13.2 Existing Conditions 3-80
3.14 Visual Resources 3-81 3.14.1 Applicable Regulations, Plans, and Policies/Management Goals 3-81 3.14.2 Regional Context 3-84 3.14.3 Distance Zones and Key Observation Points 3-85 3.14.4 Visual Sensitivity 3-86 3.14.5 Scenic Quality 3-87 3.14.6 Interim Visual Resource Management Class 3-88 3.14.7 Light and Glare 3-89
3.15 Transportation and Public Access 3-90 3.15.1 Applicable Regulations, Plans, and Policies/Management Goals 3-90 3.15.2 Existing Conditions 3-91
3.16 Noise and Vibration 3-93 3.16.1 Applicable Regulations, Plans, and Policies/Management Goals 3-93 3.16.2 Noise and Vibration in the Ocotillo Sol Project Area 3-95
3.17 Public Health and Safety 3-97 3.17.1 Applicable Regulations, Plans, and Policies/Management Goals 3-97 3.17.2 Existing Conditions 3-100
3.18 Socioeconomics 3-102 3.18.1 Applicable Regulations, Plans, and Policies/Management Goals 3-102
Ocotillo Sol Project Page iii Draft EIS/Draft CDCA Plan Amendment April 2012

Table of Contents
3.18.2 Demographic and Socioeconomic Characteristics 3-102 3.18.3 Regional Economic Conditions 3-106 3.18.4 Taxable Retail Sales 3-110 3.18.5 Overnight Transient Accommodations 3-110
3.19 Environmental Justice 3-112 3.19.1 Applicable Regulations, Plans, and Policies/Management Goals 3-112 3.19.2 Environmental Setting for Environmental Justice 3-113
CHAPTER 4, ENVIRONMENTAL CONSEQUENCES 4.1 Introduction and Overview 4-1
4.1.1 Methodology 4-1 4.1.2 Analytical Assumptions 4-1 4.1.3 Types of Effects 4-1 4.1.4 Cumulative Impacts 4-2 4.1.5 Mitigation 4-17 4.1.6 Irreversible or Irretrievable Commitment of Resources 4-17
4.2 Air Quality 4-18 4.2.1 Management Goals 4-18 4.2.2 Emissions Calculations 4-18 4.2.3 Impacts by Alternative 4-19 4.2.4 Cumulative Impacts 4-35 4.2.5 Mitigation 4-37 4.2.6 Irreversible or Irretrievable Commitment of Resources 4-37
4.3 Greenhouse Gases and Climate Change 4-38 4.3.1 Management Goals 4-38 4.3.2 Emissions Calculations 4-38 4.3.3 Impacts by Alternative 4-38 4.3.4 Cumulative Impacts 4-42 4.3.5 Mitigation 4-42 4.3.6 Irreversible or Irretrievable Commitment of Resources 4-42
4.4 Geology and Soils 4-43 4.4.1 Management Goals 4-43 4.4.2 Typical Impacts from Solar Energy Development 4-43 4.4.3 Impacts by Alternative 4-43 4.4.4 Cumulative Impacts 4-45 4.4.5 Mitigation 4-46 4.4.6 Irreversible or Irretrievable Commitment of Resources 4-46
4.5 Water Resources 4-47 4.5.1 Management Goals 4-47 4.5.2 Typical Impacts from Solar Energy Development 4-47 4.5.3 Impacts by Alternative 4-48 4.5.4 Cumulative Impacts 4-49 4.5.5 Mitigation 4-50 4.5.6 Irreversible or Irretrievable Commitment of Resources 4-51
Page iv Ocotillo Sol Project Draft EIS/Draft CDCA Plan Amendment
April 2012

Table of Contents
4.6 Biological Resources 4-52 4.6.1 Vegetation Resources 4-52 4.6.2 Wildlife Resources 4-57 4.6.3 Cumulative Impacts 4-65 4.6.4 Mitigation Measures 4-70 4.6.5 Irreversible or Irretrievable Commitment of Resources 4-78
4.7 Cultural Resources 4-80 4.7.1 NEPA Indicators / Methodology 4-80 4.7.2 Typical Impacts from Solar Energy Development 4-81 4.7.3 Impacts by Alternative 4-81 4.7.4 Cumulative Impacts 4-84 4.7.5 Mitigation 4-86 4.7.6 Irreversible or Irretrievable Commitment of Resources 4-87
4.8 Paleontological Resources 4-88 4.8.1 Management Goals 4-88 4.8.2 Typical Impacts from Solar Energy Development 4-88 4.8.3 Impacts by Alternative 4-89 4.8.4 Cumulative Impacts 4-91 4.8.5 Mitigation 4-92 4.8.6 Irreversible or Irretrievable Commitment of Resources 4-93
4.9 Fire and Fuels 4-94 4.9.1 Management Goals 4-94 4.9.2 Typical Impacts from Solar Energy Development 4-94 4.9.3 Impacts by Alternative 4-94 4.9.4 Cumulative Impacts 4-96 4.9.5 Mitigation 4-97 4.9.6 Irreversible or Irretrievable Commitment of Resources 4-97
4.10 Lands and Realty 4-98 4.10.1 Management Goals 4-98 4.10.2 Typical Impacts from Solar Energy Development 4-98 4.10.3 Impacts by Alternative 4-98 4.10.4 Cumulative Impacts 4-100 4.10.5 Mitigation 4-101 4.10.6 Irreversible or Irretrievable Commitment of Resources 4-101
4.11 Special Designations 4-102 4.11.1 Management Goals 4-102 4.11.2 Typical Impacts from Solar Energy Development 4-102 4.11.3 Impacts by Alternative 4-102 4.11.4 Cumulative Impacts 4-104 4.11.5 Mitigation 4-105 4.11.6 Irreversible or Irretrievable Commitment of Resources 4-106
4.12 Recreation 4-107 4.12.1 Management Goals 4-107
Ocotillo Sol Project Page v Draft EIS/Draft CDCA Plan Amendment April 2012

Table of Contents
4.12.2 Typical Impacts from Solar Energy Development 4-107 4.12.3 Impacts by Alternative 4-107 4.12.4 Cumulative Impacts 4-109 4.12.5 Mitigation 4-110 4.12.6 Irreversible or Irretrievable Commitment of Resources 4-110
4.13 Visual Resources 4-111 4.13.1 Management Goals 4-111 4.13.2 Typical Impacts from Solar Energy Development 4-112 4.13.3 Impacts by Alternative 4-112 4.13.4 Cumulative Impacts 4-118 4.13.5 Mitigation 4-119 4.13.6 Irreversible or Irretrievable Commitment of Resources 4-120
4.14 Transportation and Access 4-121 4.14.1 Management Goals 4-121 4.14.2 Typical Impacts from Solar Energy Development 4-121 4.14.3 Impacts by Alternative 4-121 4.14.4 Cumulative Impacts 4-123 4.14.5 Mitigation 4-124 4.14.6 Irreversible or Irretrievable Commitment of Resources 4-124
4.15 Noise and Vibration 4-125 4.15.1 Management Goals 4-125 4.15.2 Typical Impacts from Solar Energy Development 4-125 4.15.3 Impacts by Alternative 4-125 4.15.4 Cumulative Impacts 4-148 4.15.5 Mitigation 4-149 4.15.6 Irreversible or Irretrievable Commitment of Resources 4-150
4.16 Public Health and Safety 4-151 4.16.1 Management Goals 4-151 4.16.2 Typical Impacts from Solar Energy Development 4-151 4.16.3 Impacts by Alternative 4-151 4.16.4 Cumulative Impacts 4-153 4.16.5 Mitigation 4-154 4.16.6 Irreversible or Irretrievable Commitment of Resources 4-154
4.17 Socioeconomics 4-155 4.17.1 Management Goals 4-155 4.17.2 Typical Impacts from Solar Energy Development 4-155 4.17.3 Impacts by Alternative 4-155 4.17.4 Cumulative Impacts 4-162 4.17.5 Mitigation 4-162 4.17.6 Irreversible or Irretrievable Commitment of Resources 4-162
4.18 Environmental Justice 4-164 4.18.1 Management Goals 4-164 4.18.2 Typical Impacts from Solar Energy Development 4-164
Page vi Ocotillo Sol Project Draft EIS/Draft CDCA Plan Amendment
April 2012

Table of Contents
4.18.3 Impacts by Alternative 4-165 4.18.4 Cumulative Impacts 4-166 4.18.5 Mitigation 4-167 4.18.6 Irreversible or Irretrievable Commitment of Resources 4-167
4.19 Short-term versus Long-term Productivity of the Environment 4-168 CHAPTER 5, CONSULTATION, COORDINATION, AND PUBLIC PARTICIPATION5-1
5.1 Public Scoping 5-1 5.1.1 Public Scoping Period 5-1 5.1.2 Scoping Meeting 5-1 5.1.3 Scoping Response 5-2 5.1.4 Issues Identified during Scoping 5-2
5.2 Organizations and Persons Consulted 5-5 5.2.1 Native American Government-to-Government Consultation 5-6 5.2.2 Section 106 Compliance 5-7
CHAPTER 6, LIST OF PREPARERS 6-1 6.1 BLM 6-1
6.1.1 Washington Office 6-1 6.1.2 California State Office 6-1 6.1.3 California Desert District Office 6-1 6.1.4 El Centro Field Office 6-1
6.2 Consultants 6-2 6.2.1 RECON Environmental, Inc. 6-2 6.2.2 CIC Research, Inc. 6-2 6.2.3 The Sandberg Group 6-2 6.2.4 KTU + A 6-2
CHAPTER 7, REFERENCES 7-1 CHAPTER 8, INDEX 8-1 CHAPTER 9, GLOSSARY OF TERMS AND LIST OF ACRONYMS 9-1
9.1 Glossary of Terms Used 9-1 9.2 List of Acronyms Used 9-2
FIGURES (inserted in chapters) 2-1: Example PV Module 2-5 2-2: Example PV Module and Rack System 2-6 3.2-2 Imperial County PM10 Emissions for 1990 to 2010 3-13 3.18-1: Imperial County Employment by Industry Sector 3-109
TABLES ES-1: Summary Comparison of Impacts by Alternative ES-9 2-1: Alternative 2: Construction Workspace Acreages 2-15 2-2: Alternative 2: Construction Labor Force by Month 2-16 2-3: Alternative 2: Construction Equipment List and Hours of Use 2-16
Ocotillo Sol Project Page vii Draft EIS/Draft CDCA Plan Amendment April 2012

Table of Contents
2-4: Alternative 2: Operations and Maintenance Equipment List and Hours of Use 2-18 2-5: Comparison of Project Components and Features 2-24 3.2-1: Ambient Air Quality Standards 3-3 3.2-2: Federal De Minimis Thresholds—Imperial Valley Nonattainment Areas 3-8 3.2-3: Ambient Air Quality Summary—Salton Sea Air Basin 3-15 3.2-4: Number of Days above National Standards in Imperial Valley, California 3-17 3.2-5: Attainment Periods 3-18 3.2-6: Number of Days above State Standards or Annual Average
in Imperial Valley, California 3-19 3.2-7: Imperial County 2008 Estimated Annual Emissions (Tons/Day) 3-21 3.3-1: CARB Scoping Plan—Recommended GHG Reduction Measures 3-27 3.3-2: Global Warming Potentials and Atmospheric Lifetimes (Years) 3-29 3.3-3: California GHG Emissions by Sector in 1990, 2000, 2004, and 2008 3-31 3.4-1: Known Earthquake Faults Near the Ocotillo Sol Project Area 3-35 3.6-1: Non-Native Plant Species Observed Within the Ocotillo Sol Project Area 3-51 3.7-1: Newly Recorded Isolated Artifacts within the Ocotillo Sol Project 115-acre APE 3-62 3.9-1: Condition Classes Based On Departures from Historical Fire Regimes 3-69 3.14-1: Visual Resource Inventory Class Diagram—Basis for Determining Visual
Resource Inventory Classes 3-83 3.14-2: Scenic Quality Rating Units of the Ocotillo Sol Project Area 3-87 3.16-1: 30-Minute Traffic Counts on Main Access Road Adjacent to the Ocotillo Sol
Project Area 3-96 3.18-1: Demographic Profiles for the Local Socioeconomic Impact Area and
Imperial County, California 3-103 3.18-2: Imperial County Total Economic Value Added By Major Sector during 2011 3-108 3.18-3: Taxable Retail Sales 3-110 4.1-1: Cumulative Projects List 4-4 4.1-2: Cumulative Scenario by Resource or BLM Program 4-7 4.2-1: ICAPCD Thresholds of Significance 4-19 4.2-2: Federal de minimis Thresholds—Imperial Valley Nonattainment Areas 4-19 4.2-3 Construction Timeline 4-21 4.2-4: Construction Equipment Parameters 4-22 4.2-5 Equipment Emission Factors 4-30 4.2-6: Estimated Annual Construction Air Quality Emissions Due to the
Ocotillo Sol Project (Tons/Year) 4-32 4.2-7: Operational Activities 4-33 4.2-8: Estimated Annual Operational Air Quality Emissions Due to the
Ocotillo Sol Project (Tons/Year) 4-33 4.2-9: Emissions from Electrical Energy Generation 4-34 4.3-1: Alternative 2 Estimated Annual Construction GHG Emissions (Metric Tons/Year) 4-40 4.3-2: Alternative 2 Estimated Annual Operational GHG Emissions (Metric Tons/Year) 4-40 4.3-3: GHG Emissions from Electrical Energy Generation by Conventional Power Plant 4-41 4.6-1 Past, Approved, and Proposed Projects within the Yuha Desert Wildlife
Management Area 4-67 4.15-1: Construction Phases by Month 4-127 4.15-2: Construction Noise Level by Phase (dBA) 4-129 4.15-3: Construction Noise Level by Month (dBA) 4-135 4.15-4: Modeled Operational Source Noise Level (dBA) 4-145 4.15-5: Construction Noise By Month at Nearest Residential Receptor (dBA) 4-146 4.15-6: Operational Noise Level at Nearest Residential Receptor (dBA) 4-147 4.17-1: Regional Economic Impacts of Project Build Alternatives (Alternatives 2 and 3) 4-157
Page viii Ocotillo Sol Project Draft EIS/Draft CDCA Plan Amendment
April 2012

Table of Contents
APPENDIXES A: Figures
1-1: Project Location 2-3: Alternative 2 Ocotillo Sol Project Facility Layout 2-4: Alternative 3 Ocotillo Sol Project Facility Layout 3.2-1: Salton Sea Air Basin 3.2-3: Imperial Valley Planning Area—Serious PM10 Nonattainment Area 3.2-4: Imperial County—PM2.5 24-hour Nonattainment Area 3.2-5: Imperial County—Moderate 8-hour Ozone Nonattainment Areas 3.6-1: Biological Resources in the Ocotillo Sol Project Survey Area 3.6-2: Jurisdictional Resources in Relation to the Ocotillo Sol
Project Survey Area 3.10-1: Ocotillo Sol Project Area in Relation to Multiple Use Class,
Utility Corridor, and ACEC 3.14-1: Regional Landscape Character 3.14-2: Visual Project Vicinity 3.14-3 Visual Resources in the Ocotillo Sol Project Area 3.15-1: Roadways in the Vicinity of the Ocotillo Sol Project Area 3.16-1: Noise Measurement Locations 4.1-1: Cumulative Projects 4.6-1: Impacts to Biological Resources on the Ocotillo Sol Project
B: Draft Ocotillo Sol Decommissioning Plan C: Biological Resources Technical Report D: Draft Weed Management Plan E: SDG&E Project Alternatives Analysis F: Results of Focused Plant Survey G: Winter Avian Point-count Survey Results H: Spring Avian Point-count Survey Results I: Flat-tailed Horned Lizard Survey J: Summary of the Breeding Season Burrowing Owl Surveys K: Paleontological Resources Assessment: Preliminary Report L: Visual Contrast Rating Worksheets M: Final Scoping Report—Results of Scoping
Ocotillo Sol Project Page ix Draft EIS/Draft CDCA Plan Amendment April 2012

Table of Contents
This page is intentionally blank.
Page x Ocotillo Sol Project Draft EIS/Draft CDCA Plan Amendment
April 2012

Introduction and Purpose and Need
CHAPTER 1.0 INTRODUCTION AND PURPOSE AND NEED
San Diego Gas & Electric (Applicant) has filed a right-of-way (ROW) application (CACA51625) with the Bureau of Land Management (BLM) for a ROW grant to construct, operate, maintain, and decommission a 100-acre solar photovoltaic (PV) facility on BLM-managed lands. The Applicant’s Ocotillo Sol Project would interconnect with the existing Imperial Valley Substation and generate up to 20 megawatts (MW) of electricity. In connection with its consideration of the Applicant’s ROW application, the BLM will also be considering whether or not to amend the California Desert Conservation Area (CDCA) Plan of 1980, as amended.
The decision regarding the issuance of the ROW grant and potential amendment to the CDCA Plan will be based in part on an evaluation of the potential environmental effects through the environmental review process under the National Environmental Policy Act of 1969 (NEPA) and the requirements of the Federal Land Policy and Management Act of 1976 (FLPMA). As part of the ROW grant application process, the Applicant submitted a Plan of Development (POD) for the Ocotillo Sol Project to the BLM in August 2010. A revised POD was submitted to the BLM in December 2010.
This Environmental Impact Statement (EIS) follows regulations promulgated by the Council on Environmental Quality (CEQ) for Implementing the Procedural Provisions of NEPA (40 Code of Federal Regulations [CFR] 1500-1508); the Department of the Interior’s NEPA regulations, 43 CFR Part 46; the BLM NEPA Handbook, H-1790-1; Sections 201, 202, and 206 of FLPMA (43 CFR 1600); and the BLM Land Use Planning Handbook, H1601-1. This EIS describes the components of and reasonable alternatives to the proposed action and environmental consequences of the proposed action and the alternatives. It also presents recommended mitigation measures that would avoid, minimize, or mitigate the significant environmental impacts identified.
A Notice of Availability of this draft EIS and proposed CDCA Plan Amendment published by the Environmental Protection Agency (EPA) in the Federal Register initiates a 90-day public comment period.
1.1 PROJECT OVERVIEW
The Applicant’s proposed 100-acre solar PV generation facility and 15-acre temporary laydown area would be sited entirely on BLM-managed lands adjacent to the existing Imperial Valley Substation in Imperial County, California (Figure 1-1 in Appendix A). The project site would lie within the BLM’s Yuha Basin Area of Critical Environmental Concern (ACEC), which contains the Yuha Desert Management Area. The Yuha Desert Management Area was created for the
Ocotillo Sol Project Page 1-1 Draft EIS/Draft CDCA Plan Amendment April 2012

Introduction and Purpose and Need
conservation and management of the flat-tailed horned lizard as identified in the Flat-tailed Horned Lizard Rangewide Management Strategy, 2003 Revision, An Arizona-California Conservation Strategy (Flat-tailed Horned Lizard Interagency Coordinating Committee) and incorporated through an amendment to the CDCA Plan.
The Ocotillo Sol Project components would include the PV modules and mounting structures, a maintenance building with an associated parking area, internal roads, inverters, transformers, and the combining switchgear.
The Imperial Valley Substation lies directly north of the project site. Transmission lines connect to the substation from the east and west. The substation is visible from Highway 98. There are several communication towers near the project site, and construction for an unrelated project (Sunrise Powerlink) is under way to the west of the project site, connecting to the Imperial Valley Substation.
1.2 GENERAL LOCATION AND MAP
The Ocotillo Sol Project location is in Imperial County, California, approximately 82 miles east of San Diego, approximately 9 miles southwest of El Centro, 5 miles south of Seeley, and approximately 5 miles north of the U.S.–Mexico border. A portion of the Juan Bautista de Anza National Historic Trail lies approximately 5 miles to the west of the project site and runs approximately north–south. The Jacumba Mountains Wilderness lies 11.6 miles to the west of the project site (see Figure 1-1 in Appendix A).
The Ocotillo Sol Project area is in the Yuha Desert and within the boundaries of BLM’s Yuha Basin ACEC. The northern boundary of the 115-acre site abuts the existing Imperial Valley Substation. High-voltage power lines and supporting structures are aligned just east of the Ocotillo Sol Project area, extending south.
Pinto Wash lies immediately south of the project site. The Westside Main Irrigation Canal is located approximately 2 miles east of the Ocotillo Sol Project area. This north–south canal serves as the eastern boundary of the Yuha Basin ACEC. A dense band of tamarisk and other vegetation parallel the west side of this canal, east of which are cultivated, private agricultural lands.
The regional location is the western portion of the Salton Trough, in the Basin and Range Province, and east of the rugged mountainous terrain of the Peninsular Ranges in the Lower California Province (California Geologic Survey 2002). This transitional zone between physiographic provinces is characterized by badlands landscape features, very rugged and sparsely vegetated low mountains, and relatively level alluvial plains with a sparse to moderate vegetated cover of creosote, saltbush, prickly pear, and other small subshrubs and grasses (creosote flats). The landscape type is panoramic, with a broad horizontal composition and little sense of boundary restriction other than distant views of rugged mountainous terrain.
Page 1-2 Ocotillo Sol Project Draft EIS/Draft CDCA Plan Amendment
April 2012

Introduction and Purpose and Need
1.3 BLM PURPOSE AND NEED
In accordance with FLPMA (Section 103[c]), public lands are to be managed for multiple use that takes into account the long-term needs of future generations for renewable and nonrenewable resources. The Secretary of the Interior is authorized to grant ROWs on public lands for systems of generation, transmission, and distribution of electric energy (Section 501[a][4]). Taking into account the BLM’s multiple use mandate, the purpose and need for the proposed action is to respond to a FLPMA Title V ROW application submitted by the Applicant to construct, operate, maintain, and decommission a solar PV facility and associated infrastructure on public lands administered by the BLM in compliance with FLPMA, BLM ROW regulations, and other applicable federal laws and policies. The BLM will decide whether to deny the proposed ROW, grant the ROW, or grant the ROW with modifications. The BLM may include any terms, conditions, and stipulations it determines to be in the public interest, and may include modifying the proposed use or changing the route or location of the proposed facilities (43 CFR 2805.10[a][1]).
The Ocotillo Sol Project would, if approved, assist the BLM in addressing the following management objectives, and would help further the development of environmentally responsible renewable energy:
§ Executive Order (EO) 13212, dated May 18, 2001, which mandates that agencies act expediently and in a manner consistent with applicable laws to increase the production and transmission of energy in a safe and environmentally sound manner.
§ Section 211 of the Energy Policy Act of 2005, which sets forth the “sense of Congress” that the Secretary of the Interior should seek to have approved 10,000 MW of non-hydropower renewable energy on public lands by 2015.
§ Secretarial Order (SO) 3285A1, dated February 22, 2010, which establishes the development of renewable energy as a priority for the Department of the Interior (DOI).
In connection with its decision on the Ocotillo Sol Project ROW grant application, the BLM’s action will also include consideration of potential amendments to the CDCA land use plan, as analyzed in the Draft EIS alternatives. The CDCA Plan, while recognizing the potential compatibility of solar energy facilities on public lands, requires that all sites associated with power generation or transmission not identified in that plan be considered through the land use plan amendment process. BLM policy encourages the avoidance of development on lands with high conflict or sensitive resource values (IM 2011-061). While the BLM is not required formally to determine whether certain high conflict lands are or are not available for solar energy development, BLM must amend the CDCA Plan if it decides to make that decision. The BLM is deciding whether to amend the CDCA Plan to identify the Ocotillo Sol Project site as available and whether to amend the CDCA Plan to make high conflict or sensitive resource value areas within the Ocotillo Sol Project application unavailable for solar energy development.
Additionally, the CDCA Plan requires that transmission lines above 161 kilovolts (kV) either be within a designated corridor or allowed outside of a designated corridor. The Ocotillo Sol Project would use an existing transmission line that is entirely within a designated corridor, so a
Ocotillo Sol Project Page 1-3 Draft EIS/Draft CDCA Plan Amendment April 2012

Introduction and Purpose and Need
Plan Amendment would not be required. Therefore, the proposed transmission line associated with this project would comply with the applicable CDCA Plan requirements.
1.4 APPLICANT’S OBJECTIVES
The applicant’s interests and objectives, including any constraints or flexibility with respect to their proposal, help to inform the BLM’s decision and cannot be ignored in the NEPA process. (BLM Instruction Memorandum [IM] 2011-059).
The Applicant’s fundamental objective for the Ocotillo Sol Project is to develop, own, and operate a renewable energy generation facility in the Imperial Valley region of southern California, and to deliver the renewable energy generated by the project to the Applicant’s customers consistent with California laws, policies, and mandates. Additional objectives for the Ocotillo Sol Project include the following:
1. Increase the use of renewable energy and reduce greenhouse gas emissions in California consistent with existing California laws, orders, and policies.
2. Develop and refine the project concept and details with input and guidance from the BLM and Imperial County.
In developing their proposed action, the Applicant, in consultation with the BLM, used the following siting criteria to evaluate potential project sites:
§ A contiguous site, with flat topography (grade of less than 3 percent) large enough for siting a 20-MW solar PV facility with minimal land disturbance
§ Avoidance or mitigation for disturbance of areas that are pristine and biologically sensitive
§ Avoidance of high-quality habitat for federally listed species
§ Avoidance of known cultural or historic sites and recreational resource areas
§ Proximity to transmission facilities with sufficient capacity for the Ocotillo Sol Project output and suitable locations for interconnection
§ Proximity to highway and road access
§ Availability of contiguous land for sale or lease at a feasible cost
These criteria led the Applicant to further evaluate seven private parcels and one additional BLM parcel. These alternative sites and the reasons for their dismissal from detailed analysis under NEPA are discussed in Section 2.3. In addition, the Applicant conducted preliminary biological, cultural, hydrological, and geological reviews to evaluate site conditions. Based on these reviews, portions of the initial 350-acre Ocotillo Sol Project survey area were considered unsuitable for development and were eliminated from consideration.
Alternative site configurations were developed to avoid or minimize impacts to sensitive environmental resources, such as biological, cultural, and visual resources, to the extent possible. Specific consideration was given to avoiding active flat-tailed horned lizard areas, sensitive plant species concentrations, burrowing owl signs, Pinto Wash, and cultural resources. When
Page 1-4 Ocotillo Sol Project Draft EIS/Draft CDCA Plan Amendment
April 2012

Introduction and Purpose and Need
determining the optimum configuration for the Ocotillo Sol Project, the BLM also considered stakeholders’ comments made during scoping.
Additional factors considered by the Applicant include engineering constraints, such as those for existing easements, grading, hydrological, electrical, and security; construction constraints, such as those for safety, cost, and constructability; and interconnection constraints.
1.5 ISSUES
For the purpose of the BLM’s NEPA analysis, an issue is a point of disagreement, debate, or dispute with a proposed action based on some anticipated environmental effect (BLM National Environmental Policy Act Handbook, H-1790-1). Issues are identified through scoping, which is the process by which the BLM solicits internal and external input on the project.
The BLM hosted two public scoping meetings in El Centro, California, on August 10, 2011. During these meetings, participants reviewed maps and display boards, and asked specific questions of BLM staff. The BLM invited participants to submit comments via comment forms, letters, and e-mail. External Scoping is discussed further in Chapter 5 of this EIS.
The issues evaluated in this EIS include the physical, biological, cultural, socioeconomic, and other resources that have the potential to be affected by activities related to the Applicant’s proposed Ocotillo Sol Project and alternatives. The issues are:
§ Air Quality
§ Greenhouse Gases and Climate Change
§ Geology and Soils
§ Water Resources
§ Biological Resources
§ Cultural Resources
§ Paleontological Resources
§ Fire/Fuels
§ Lands and Realty
§ Special Designations
§ Lands with Wilderness Characteristics
§ Recreation
§ Visual Resources
§ Transportation and Public Access
§ Noise and Vibration
§ Public Health and Safety
§ Socioeconomics
§ Environmental Justice
Ocotillo Sol Project Page 1-5 Draft EIS/Draft CDCA Plan Amendment April 2012

Introduction and Purpose and Need
Resources that do not exist in the project vicinity and, therefore, do not warrant analysis in the EIS include Grazing, Wild Horses and Burros, and Mineral Resources.
1.6 AGENCY ROLES AND AUTHORIZATIONS
The BLM is preparing this EIS, in compliance with NEPA, FLPMA, and applicable regulations to inform the public about the Ocotillo Sol Project. As noted above, a BLM authorization of a ROW grant for the Ocotillo Sol Project would require an amendment to the CDCA Plan (BLM 1980), as amended. Other state and local agencies may issue additional potential project permits and approvals, which may have associated NEPA compliance requirements. It is the Applicant’s responsibility to obtain these permits; however, other federal, state, and local permitting authorities may rely upon the analysis presented in this EIS for fulfillment of their respective regulatory obligations.
1.7 POLICY CONSISTENCY AND PLAN CONFORMANCE
This section provides an overview of the major federal (BLM and non-BLM) policies, plans, programs, and laws that would apply to the Ocotillo Sol Project. State and local policies, plans, and programs are discussed in Section 1.8 below. Additional requirements are discussed for each environmental resource in Chapter 3.
1.7.1 FEDERAL LAND POLICY AND MANAGEMENT ACT OF 1976
Pursuant to FLPMA of 1976, 43 United States Code (USC) 1701 et seq., the BLM is directed to manage the public lands and their resources based on multiple use and sustained yield principles. As required by FLPMA, public lands must be managed in a manner that: protects the quality of scientific, scenic, historical, ecological, environmental, air and atmospheric, water resource, and archaeological values; preserves and protect, where appropriate, certain public land in their natural condition; provides food and habitat for fish, wildlife, and domestic animals; and provides for outdoor recreation and human occupancy and use by encouraging collaboration and public participation throughout the planning process. In addition, public land must be managed in a manner that recognizes the nation’s need for domestic sources of minerals, food, timber, and fiber from public land. Land use plans are the primary mechanism for guiding BLM activities to achieve the BLM’s mission and goals. In processing a land use plan amendment, BLM must also comply with the BLM Planning Regulations (43 CFR Part 1600) and the BLM Land Use Planning Handbook (H-1601-1). FLPMA also authorizes BLM to issue ROW grants for systems intended for generation, transmission, and distribution of electric energy.
In addition, FLPMA provides guidance for ACEC management (43 USC 1702). ACECs must meet the relevance and importance criteria in 43 CFR 1610.7-2(b) and must require special management (43 CFR 1601.0-5[a]) to protect the area and prevent irreparable damage to resource or natural systems, or to protect life and promote safety in areas where natural hazards
Page 1-6 Ocotillo Sol Project Draft EIS/Draft CDCA Plan Amendment
April 2012

Introduction and Purpose and Need
exist. The values for which ACECs are designated are considered the highest and best use for those lands, and protection of those values would take precedence over multiple uses.
1.7.2 NATIONAL ENVIRONMENTAL POLICY ACT
NEPA (42 USC 4321 et seq.) declares a continuing federal policy that directs “a systematic, interdisciplinary approach” to planning and decision-making and requires the preparation of environmental statements for “major federal actions significantly affecting the quality of the human environment.” The NEPA process is an overall framework for the environmental evaluation of federal actions. The CEQ has issued regulations for implementing NEPA, which establish procedures to ensure proper consideration of environmental concerns (40 CFR 15001508). In processing ROW applications, BLM must also comply with the Department of the Interior’s regulations applicable to implementing the procedural requirements of NEPA (43 CFR Part 46), as well as BLM’s NEPA Handbook (H-1790-1).
1.7.3 CLEAN AIR ACT
The Clean Air Act (42 USC 7401 et seq.), as amended, regulates air pollution to improve air quality. This act regulates air emissions from area, stationary, and mobile sources. The Clean Air Act also authorizes the EPA to establish National Ambient Air Quality Standards (NAAQS) to protect public health and the environment. General Conformity (40 CFR Part 93) requires a determination of conformity with the State Implementation Plan for a project that requires federal approval if the project’s annual emissions are above specified levels. The Applicant’s proposed Ocotillo Sol Project would fall under the general conformity requirements.
1.7.4 ENERGY POLICY ACT
The Energy Policy Act of 2005 (Public Law [PL] 109-58) established a comprehensive, long-range, national energy policy that included a goal for the Secretary of the Interior to approve 10,000 MW of renewable energy on public lands by 2015. It provides incentives for traditional energy production as well as newer, more efficient energy technologies and conservation. It contains several provisions related to geothermal energy to make it more competitive with traditional methods of energy production. The approval of the Ocotillo Sol Project, which would be on public lands, would contribute to the 10,000 MW goal.
1.7.5 NATIONAL HISTORIC PRESERVATION ACT
The National Historic Preservation Act (NHPA) of 1966 (PL 89-665, as amended by PL 96-515 [16 USC 470 et seq.]) provides for the establishment of the National Register of Historic Places (NRHP) to include historic properties such as districts, sites, buildings, structures, and objects that are significant in American history, architecture, archaeology, and culture. Section 106 of the act requires federal agencies with jurisdiction over a proposed federal undertaking to take into account the effect of the undertaking on historic properties listed or eligible for listing on the NRHP, and to afford the Advisory Council on Historic Preservation an opportunity to comment on the undertaking. The NRHP eligibility criteria are defined at 36 CFR 60.
Ocotillo Sol Project Page 1-7 Draft EIS/Draft CDCA Plan Amendment April 2012

Introduction and Purpose and Need
1.7.6 RENEWABLE ENERGY DEVELOPMENT BY THE DEPARTMENT OF THE INTERIOR
As noted above, SO 3285A1 made production and transmission of renewable energy on public lands a priority for the DOI. It established a DOI-wide approach for applying scientific tools to increase understanding of climate change and to coordinate an effective response to impacts on tribes and on the land, water, ocean, fish and wildlife, and cultural heritage resources that are managed within the DOI. SO 3285A1 also established an energy and climate change task force that identifies specific zones on U.S. public lands where the DOI can facilitate a rapid and responsible move to large-scale production of solar, wind, geothermal, and biomass energy. The approval of the Ocotillo Sol Project would contribute to the priority goals of the DOI.
1.7.7 CALIFORNIA DESERT CONSERVATION AREA PLAN
The CDCA encompasses 25 million acres in southern California designated by Congress in 1976 through FLPMA. The BLM manages about 10 million of those acres. Congress directed the BLM to prepare and implement a comprehensive long-range plan for the management, use, development, and protection of public lands within the CDCA. The 1980 CDCA Plan, as amended, is based on the concepts of multiple use, sustained yield, and maintenance of environmental quality. The CDCA Plan provides overall regional guidance for BLM-administered lands in the CDCA and establishes long-term goals for protection and use of the California desert.
The CDCA Plan establishes four multiple use classes, multiple use class guidelines, and plan elements for specific resources or activities, such as motorized vehicle access, recreation, and vegetation. The Ocotillo Sol Project site is currently classified as Multiple Use Class L (Limited Use). Approximately 4 million acres of public lands are classified as Class L. These lands are managed to protect sensitive, natural, scenic, ecological, and cultural resource values. They provide for generally lower-intensity, carefully controlled multiple uses that do not significantly diminish resource values (BLM 1999).
The CDCA Plan also includes ACEC designations to protect sensitive cultural and natural resources. The project site is located within the Yuha Basin ACEC, which was designated to protect cultural and natural resources within the area. Since 1980, the CDCA Plan has been amended periodically to reflect changing conditions, including the acquisition of new knowledge relating to natural resources and updates of management strategies. BLM authorization of a ROW grant for the Ocotillo Sol Project would require a resource management plan amendment to the CDCA Plan in accordance with BLM planning regulations, Part 43, CFR, Subpart 1610.32. The Yuha Basin ACEC Management Plan allows for the “traversing of the ACEC by proposed transmission lines and associated facilities if environmental analysis demonstrates that it is environmentally sound to do so.” The Ocotillo Sol Project would, if approved, be consistent with the management plan for the Yuha Basin ACEC and the values for which it was designated.
The CDCA Plan was amended in 2004, for the adoption of the Flat-tailed Horned Lizard Rangewide Management Strategy, 2003 Revision, An Arizona-California Conservation Strategy. The purpose of this strategy is to provide a framework for conserving sufficient habitat to
Page 1-8 Ocotillo Sol Project Draft EIS/Draft CDCA Plan Amendment
April 2012

Introduction and Purpose and Need
maintain four viable populations of the flat-tailed horned lizard throughout the species’ range. Planning actions and prescriptions that guide the management of lands within the designated management areas are designed primarily to reduce new surface disturbance and to promote reclamation of disturbed sites. The strategy provides standards for mitigation measures (Appendix 3 of the strategy) and a compensation formula (Appendix 4 of the strategy) to be incorporated into all authorized surface-disturbing projects where applicable. BLM authorization of a ROW grant for the Ocotillo Sol Project would require appropriate mitigation measures and habitat compensation to offset unavoidable residual effects of the project to achieve no net adverse impact on the species. BLM would coordinate with the Applicant to determine mitigation measures.
1.7.7.1 PLANNING CRITERIA (BLM)
The CDCA planning criteria are the constraints and ground rules that guide and direct the development of the Plan Amendment. They ensure that the Plan Amendment is tailored to the identified issues and ensure that unnecessary data collection and analyses are avoided. They focus on the decisions to be made in the Plan Amendment, and will achieve the following: “Sites associated with power generation or transmission not identified in the Plan will be considered through the Plan Amendment process.”
Because the Applicant’s proposed facility is not currently identified within the CDCA Plan, an amendment to identify the proposed facility within the CDCA Plan is hereby proposed. As specified in the CDCA Plan Chapter 7, Plan Amendment Process, there are three categories of Plan Amendments as follows:
§ Category 1, for proposed changes that will not result in significant environmental impact or analysis through an EIS;
§ Category 2, for proposed changes that would require a significant change in the location or extent of a multiple-use class designation; and
§ Category 3, to accommodate a request for a specific use or activity that will require analysis beyond the Plan Amendment Decision.
Based on these criteria, approval of the Applicant’s proposed Ocotillo Sol Project would require a Category 3 amendment. The section below (Statement of Plan Amendment) summarizes the procedures necessary to evaluate the proposed Plan Amendment, as well as the procedures required to perform the environmental review of the ROW application.
1.7.7.2 STATEMENT OF PLAN AMENDMENT
The Implementation section of the Energy Production and Utility Corridors Element of the CDCA Plan lists a number of Category 3 amendments that have been approved since adoption of the CDCA Plan in 1980. An additional amendment is proposed to be added to this section of the CDCA Plan and would read, “Permission granted to construct solar energy facility (proposed Ocotillo Sol Project).”
Ocotillo Sol Project Page 1-9 Draft EIS/Draft CDCA Plan Amendment April 2012

Introduction and Purpose and Need
1.7.7.2.1 Plan Amendment Process The Plan Amendment process is outlined in Chapter 7 of the CDCA Plan. In analyzing the Applicant’s request for amending or changing the Plan, the BLM District Manager will:
§ Determine if the request has been properly submitted and if any law or regulation prohibits granting the requested amendment.
§ Determine if alternative locations within the CDCA Plan are available which would meet the Applicant’s needs without requiring a change in the Plan’s classification, or an amendment to any Plan element.
§ Determine the environmental effects of granting and/or implementing the Applicant’s request.
§ Consider the economic and social impacts of granting and/or implementing the Applicant’s request.
§ Provide opportunities for and consideration of public comment on the proposed amendment, including input from the public and from federal, state, and local government agencies.
§ Evaluate the effect of the proposed amendment on BLM management’s desert-wide obligation to achieve and maintain a balance between resource use and resource protection.
1.7.7.2.2 Decision Criteria for Evaluation of Proposed Plan Amendment The Decision Criteria to be used for approval or disapproval of the proposed plan amendment require that the following determinations be made by the BLM Desert District Manager:
§ The proposed plan amendment is in accordance with applicable laws and regulations; and
§ The proposed plan amendment will provide for the immediate and future management, use, development, and protection of the public lands within the CDCA.
The BLM Desert District Manager will base the rationale for these determinations on the principles of multiple use, sustained yield, and maintenance of environmental quality as required in FLPMA.
1.7.7.2.3 Decision Criteria for Evaluation of Application In addition to defining the required analyses and Decision Criteria for Plan Amendments, the CDCA Plan Energy Production and Utility Corridors Element (Energy Element) provides additional guidance for the location of energy facilities and utility corridors. The Energy Element identifies nine decision criteria to be evaluated when considering locating a new energy facility within the CDCA Plan area. These criteria are as follows:
§ Minimize the number of separate ROWs by using existing ROWs as a basis for planning corridors.
§ Encourage joint use of corridors for transmission lines, canals, pipelines, and cables.
§ Provide alternative corridors to be considered during the processing of applications.
§ Avoid sensitive resources wherever possible.
§ Conform to local plans whenever possible.
§ Consider wilderness values and be consistent with final wilderness recommendations.
Page 1-10 Ocotillo Sol Project Draft EIS/Draft CDCA Plan Amendment
April 2012

Introduction and Purpose and Need
§ Complete the delivery system network.
§ Consider ongoing projects for which decisions have been made.
§ Consider corridor networks that take into account power needs and alternative fuel resources.
These criteria were considered by BLM when establishing the range of alternatives and when determining whether to proceed with preparation of the EIS. These criteria were also used by the Applicant when establishing the 115-acre project site within the 350-acre survey area. Where relevant (e.g., to avoid sensitive resources, consider wilderness [visual] values), these criteria are discussed in the EIS.
1.7.8 FLAT-TAILED HORNED LIZARD MANAGEMENT AREA
The Flat-tailed Horned Lizard Rangewide Management Strategy, 2003 Revision, An Arizona-California Conservation Strategy encourages surface-disturbing projects to be located outside of Management Areas whenever possible. It does not preclude such projects from being located in a Management Area, however. If a project must be located within a Management Area, effort should be made to locate the project in a previously disturbed area or in an area where habitat quality is poor and construction should be timed to minimize mortality. New ROWs may be permitted along the boundaries of Management Areas, but only if impacts can be mitigated to avoid long-term effects on flat-tailed horned lizards in the Management Area. For ROWs within the boundaries of Management Area, mitigation would need to be incorporated. Additionally, the cumulative disturbance area per Management Area from all projects may not exceed 1 percent. To discourage development in the Management Areas the mitigation ratio can be as high as 6:1. The Ocotillo Sol Project would be located within the Yuha Desert Management Area of this Strategy, and would be subject to these disturbance limits and mitigation requirements.
1.8 OTHER APPLICABLE PLANS AND PROGRAMS
This section summarizes some of the other major plans, policies, programs, and laws that apply to the BLM’s proposed action. Resource-specific plans (e.g., specific to natural or cultural resources) are discussed in their respective sections in Chapter 3.
1.8.1 STATE OF CALIFORNIA RENEWABLES PORTFOLIO STANDARD PROGRAM
California’s Renewables Portfolio Standard (RPS) requires each of the state’s investor-owned utilities to supply 20 percent of its total electricity through renewable energy generation by the year 2010, as set forth in Senate Bill (SB) 1078 (establishing the California RPS Program) and SB 107 (accelerating the 20 percent requirement to the year 2010). Additionally, SB X1 2, signed into law on April 12, 2011, set an RPS mandate of 33 percent by 2020. The approval of the Ocotillo Sol Project would contribute to the state RPS goals.
Ocotillo Sol Project Page 1-11 Draft EIS/Draft CDCA Plan Amendment April 2012

Introduction and Purpose and Need
1.8.2 STATE IMPLEMENTATION PLAN FOR PARTICULATE MATTER LESS THAN 10 MICRONS IN DIAMETER
Imperial County is currently federally designated as a "serious" non-attainment area for Particulate Matter Less Than 10 Microns in Diameter (PM10) NAAQS, which requires that the Imperial County Air Pollution Control District (ICAPCD) develop an implementation plan describing the mechanisms that will be used to bring particulate matter emission levels back into attainment as expeditiously as practicable. ICAPCD adopted the Final Imperial County 2009 PM10 State Implementation Plan in August 2009. The 2009 State Implementation Plan (SIP) for PM10 meets the elements required under the Clean Air Act, as amended, for areas classified as “serious” non-attainment of the NAAQS. The elements of the plan are as follows:
§ Air quality data analysis for the years 2006 through 2008 including exceptional events
§ An updated emissions inventory
§ A determination of significant sources of PM10 and classification of these sources
§ Best available control strategies along with an impact analysis
Although the 2009 SIP has not been approved by the EPA, BLM will adhere to it in the expectation that it will be approved. As noted above, the Applicant’s proposed Ocotillo Sol Project would need to conform to the SIP pursuant to general conformity requirements of the Clean Air Act.
1.8.3 IMPERIAL COUNTY GENERAL PLAN (1993)
The full extent of the lands requested for ROW authorization lies within the planning area for the Imperial County General Plan. The Imperial County General Plan Update aims to create a comprehensive guide for development within Imperial County and to provide mechanisms to achieve desired community goals and objectives through a coordinated implementation program. The objectives of the Imperial County General Plan include the following:
§ To more effectively and comprehensively plan for the long-term physical development of Imperial County
§ To maintain agricultural production as a major economic activity
§ To provide short-term and long-term employment opportunities in Imperial County
§ To generate tax revenue and foster economic growth
§ To provide adequate housing, public services, and public safety for increasing numbers of people residing in Imperial County
§ To preserve the unique visual and recreational amenities available in Imperial County
§ To protect Imperial County’s biological and cultural resources
Although the Ocotillo Sol Project would be located entirely on federal lands and not subject to the Imperial County General Plan, it would be consistent with this plan.
Page 1-12 Ocotillo Sol Project Draft EIS/Draft CDCA Plan Amendment
April 2012

Alternatives
CHAPTER 2.0 DESCRIPTION OF ALTERNATIVES
This chapter of the Draft EIS describes the following five alternatives: 1) No Action/No CDCA Plan Amendment; 2) Applicant’s proposed Ocotillo Sol Project and associated CDCA Plan Amendment; 3) Reduced Construction Footprint Alternative and associated CDCA Plan Amendment; 4) No Project but CDCA Plan amendment to identify the area as suitable for solar development; and 5) No Project but CDCA Plan amendment to identify the area as unsuitable for solar development. This chapter also discusses the alternatives development process more generally and additional alternatives considered but eliminated from detailed analysis.
This document provides information to the authorized officer to make the following decisions:
Should the BLM deny the proposed ROW, grant the ROW, or grant the ROW with modifications?
If the BLM grants the ROW, what terms, conditions, and stipulations are determined to be in the public interest, and what modifications to the proposed use are appropriate?
If the BLM does not grant the ROW, should the CDCA Plan be amended to identify the project site as suitable or unsuitable for solar energy development?
The Applicant provided technical information about the proposed Ocotillo Sol Project reflected in this chapter. All numbers referring to land disturbance, equipment, schedule, mileage, and workforce are based on the most up-to-date engineering available from the Applicant and generally represent conservative estimates for purposes of analyzing impacts. The numbers may change based on final engineering and permit requirements for particular project components. The Applicant’s information was provided in the Draft POD submitted to the BLM in December 2010, with updates and additional details provided directly by the Applicant.
2.1 OVERVIEW OF ALTERNATIVES DEVELOPMENT
The Applicant’s interests and objectives, including any constraints or flexibility with respect to their proposal, help to inform the BLM’s decision and cannot be ignored in the NEPA process (BLM IM 2011-059). Therefore, the BLM will consider the Applicant’s action as proposed. In developing the proposed Ocotillo Sol Project, the Applicant, in consultation with the BLM, used the following siting criteria to evaluate potential project sites:
A contiguous site, with flat topography (grade of less than 3 percent) large enough for siting a 20 MW solar PV facility with minimal land disturbance
Ocotillo Sol Project Page 2-1 Draft EIS/Draft CDCA Plan Amendment April 2012

Alternatives
Proximity (within 1.5 miles) to the Imperial Valley Substation (based on the project’s connection to a 12.47-kV site within the Imperial Valley Substation that limits the feasible length of an interconnection)
Avoidance or mitigation for disturbance of areas that are largely pristine and biologically sensitive
Avoidance of high-quality habitat for federally listed species
Avoidance of known cultural or historic sites and recreational resource areas
Proximity to transmission facilities with sufficient capacity for the proposed Ocotillo Sol Project output and suitable locations for interconnection
Proximity to highway and road access
Availability of contiguous land for sale or lease at a feasible cost
These criteria led the Applicant to further evaluate seven private parcels and one additional BLM-administered parcel. These alternative sites and the reasons for their dismissal from detailed analysis under NEPA are discussed below in Section 2.3. As part of the alternatives development process, the Applicant conducted preliminary biological, cultural, hydrological, and geological reviews to evaluate site conditions within a larger (350-acre) area surrounding the proposed Ocotillo Sol Project site. Based on these reviews, portions of the initial proposed 350acre Ocotillo Sol Project application area (referred to as the original study area, spring survey area, and area of potential effect in Chapter 3) were determined to be unsuitable for development and were eliminated from further consideration.
Additional factors considered by the Applicant included engineering constraints, such as those for existing easements, grading, hydrological, electrical, and security; construction constraints, such as those for safety, cost, and constructability; and interconnection constraints. These considerations led to the development of alternative site configurations to avoid or minimize impacts to sensitive environmental resources, such as biological, cultural, and visual resources, to the extent possible. Specific consideration was given to avoiding designated flat-tailed horned lizard habitat found to be occupied during surveys, sensitive plant species, occupied burrowing owl foraging or sheltering areas, a potential riparian alluvial wash habitat and buffer area, and cultural resources. When determining the optimum configuration for the proposed Ocotillo Sol Project, BLM also considered stakeholder comments made during scoping.
In addition to considering the Applicant’s proposed Ocotillo Sol Project, alternatives considered in the EIS are based on issues identified by the BLM, comments received during the public scoping process, and the Applicant’s process for evaluating and selecting potential project locations. The BLM is required to “study, develop, and describe appropriate alternatives to recommended course of action in any proposal that involves unresolved conflicts concerning alternative uses of available resources” (42 USC § 4332). In determining the alternatives to be considered, the emphasis is on what is reasonable: “Reasonable alternatives include those that are practical or feasible from the technical and economic standpoint and using common sense, rather than simply desirable from the standpoint of applicant” (46 Federal Register 18026). Alternatives must also meet the purpose and need to be considered reasonable.
Alternatives considered by the BLM, along with those suggested by the public during the scoping process, were evaluated using the following criteria:
Page 2-2 Ocotillo Sol Project Draft EIS/Draft CDCA Plan Amendment
April 2012

Alternatives
Does the alternative fulfill the purposes, needs, and objectives identified in Chapter 1 for both the BLM and the Applicant?
Does the alternative minimize effects on human and environmental resources and therefore resolve identified resource conflicts?
Is the alternative technically and economically feasible to construct, operate, maintain, and decommission?
Alternatives that met all the criteria above were analyzed and are presented in detail in Section 2.2 below. Section 2.2 also analyzes the No Action alternatives, as required by CEQ regulations. Although these alternatives do not meet the BLM’s purpose and need, they provide a useful baseline for comparison of environment effects and demonstrate the consequences of not meeting the purpose and need.
Various renewable and nonrenewable generation technologies and alternative locations were considered but eliminated from detailed analysis under NEPA. These alternatives are described in Section 2.3, along with the reasons for elimination.
2.2 ALTERNATIVES CONSIDERED AND CARRIED FORWARD FOR DETAILED ANALYSIS
This section describes the alternatives carried forward for detail analysis, consisting of the no action alternative, the Applicant’s proposed project, a reduced construction footprint alternative, and two no project alternatives. Features common to the two action alternatives (e.g., project components and construction methods) are detailed in Section 2.2.2. Project features and construction methods listed in this section will serve as the basis of the impacts analysis in Chapter 4.
2.2.1 ALTERNATIVE 1: NO ACTION / NO CDCA PLAN AMENDMENT
Under NEPA, the No Action Alternative (Alternative 1) serves as a benchmark of existing conditions (as described in Chapter 3) by which the public and decision makers can compare the environmental effects of the Applicant’s proposed project and the alternatives. Under the No Action Alternative, the Ocotillo Sol Project would not be approved (all components of the project would be denied), no ROW grant would be issued, and no CDCA Plan Amendment would be approved.
If this No Action Alternative (Alternative 1) were selected, the construction, operation, maintenance, and decommission of the Ocotillo Sol Project would not occur, and there would be no CDCA Plan Amendment regarding the suitability of the site for solar development. This No Action Alternative does not preclude future solar development in the Ocotillo Sol Project area, subject to compliance with the applicable statutory and regulatory requirements at the time such a project were proposed.
Ocotillo Sol Project Page 2-3 Draft EIS/Draft CDCA Plan Amendment April 2012

Alternatives
2.2.2 ALTERNATIVE 2: APPLICANT’S PROPOSED PROJECT
Under Alternative 2, the Applicant’s proposed project, the Applicant would construct, operate, maintain, and decommission a 100-acre, up to 20 MW, solar PV generation facility on BLM-managed lands pursuant to a ROW authorization (see Figure 1-1 in Appendix A). In addition, this alternative includes a 15-acre temporary ROW for use as a laydown area during construction of the solar facility. This alternative would also include a 12.47 kV, 2,000-foot underground generation tie line from the generation facility to the adjacent Imperial Valley Substation. It would also include interconnection facilities within the Imperial Valley Substation consisting of breakers, switches, racking systems, and cabling. The Applicant would develop, execute, own, and operate the Ocotillo Sol Project. The Applicant has requested a 30-year ROW1, with renewal terms, for the 100 acres that would encompass the solar PV facility. The term of the temporary ROW for the 15-acre laydown area would be long enough to cover the construction period for the project and the time required to reclaim the laydown area.
2.2.2.1 CDCA PLAN AMENDMENT
Under Alternative 2, BLM would amend the CDCA Plan to identify all 115 acres as suitable for solar energy development and allow solar development on this land. A Plan Amendment would not be required for the proposed generation tie line and interconnection facilities as they lie fully within a previously designated corridor (Utility Corridor N) for such facilities within the existing CDCA Plan.
2.2.2.2 PROJECT COMPONENTS
Under Alternative 2, the Ocotillo Sol Project components, including the temporary 15-acre construction laydown area, would be on BLM-administered lands subject to a ROW grant.
Within the proposed ROW, the solar field, operations and maintenance building, laydown area, and the switchyard would occupy the majority of the site. About 75 percent (86 acres) of the 115-acre ROW would be used for the solar panels. The remaining acreage would be used for internal access roads, power lines, switchgear, a step-up transformer, an operations and maintenance building (together approximately 14 acres), and the temporary laydown area (15 acres).
The Ocotillo Sol Project would be a solar PV facility generating approximately 15 to 20 MW2 of renewable energy from sunlight. The project components would include the PV modules and mounting structures, a maintenance building, an associated parking area, access roads, internal roads, perimeter fencing, inverters, transformers, and the combining switchgear. An
1 The 30-year ROW term covers 25 years of commercial operation and 5 years for facility decommissioning and site remediation. If the facilities are determined by the Applicant to have considerable life remaining, the Applicant could seek renewal of the ROW after the 25-year period.
2 Unless specified differently, all capacity values are stated in MW alternating current.
Page 2-4 Ocotillo Sol Project Draft EIS/Draft CDCA Plan Amendment
April 2012

Figure 2-1. Example PV Module
Alternatives
underground 12.47 kV interconnection line would lie in an approximately 2,000-foot trench. This trench would run from the combining switchgear located in the northern Ocotillo Sol Project area boundary to a 12.47 kV bus and circuit breaker that would be installed in the Imperial Valley Substation. All interconnection equipment and construction activities would be within the boundary of the Imperial Valley Substation. No transmission system upgrades or modifications outside the Imperial Valley Substation would be required. The 15-acre construction laydown area would be restored upon completion of project construction and relinquished to the BLM, once BLM agrees that the initial site restoration has been completed to agreed-upon conditions. Restoration, including weed management, would continue until the final restoration condition is acceptable to the BLM. The Applicant has prepared a draft Decommissioning and Restoration Plan to address temporary and long-term restoration efforts to return the site to as near as pre-construction state as possible (Appendix B).
2.2.2.2.1 Solar PV Facility The solar PV facility would produce electrical energy in the form of direct current (DC). The facility would convert the DC energy into a useable alternating current (AC) and place the power on the transmission grid. Power would also be used for the Imperial Valley Substation. PV modules, mounted on racks, would generate electrical energy by converting sunlight (photo) directly into electricity (voltaic). Figures 2-1 and 2-2 provide example PV modules that could be used for the Ocotillo Sol Project.
Ocotillo Sol Project Page 2-5 Draft EIS/Draft CDCA Plan Amendment April 2012

Alternatives
Figure 2-2. Example PV Module and Rack System
The Ocotillo Sol Project would use conventional crystalline (silicon) or thin-film PV module technology. The means of energy production, disturbed acreage, equipment configuration, construction activities, and the operation and maintenance requirements are very similar for these two PV module technologies. Module efficiency is the major difference between the two. Under the crystalline PV technology option, the Ocotillo Sol Project would generate approximately 20 MW of energy. Under the thin-film PV technology option, the Ocotillo Sol Project would generate approximately 15 MW of energy.
The modules would be placed in a series called a module string, consisting of 8 to 33 modules. The number of modules in a string would depend on the PV module technology and the operating voltage of the system. The module strings would be wired and routed underground to a collection point and combiner box. The combiner box would collect the DC circuits from multiple module strings and combine them into one circuit for routing to the inverter.
The modules would be physically laid out in rows and mounted on the racking systems. If mounted for fixed tilt, these PV modules (arrays) would be 3 to 5 feet above the ground at the highest point. These rows of rack-mounted PV modules would be oriented upward toward the sun in a south or southwest orientation to maximize energy production. If mounted for single axis tracking, the PV arrays would be 6 to 8 feet above the ground at the highest point. These PV arrays would be oriented upward toward the sun in a north–south orientation designed to follow the sun throughout the day. Rows of arrays would be spaced to avoid shading each other as well as to provide maintenance access.
The DC power generated by the rows of PV arrays would be wired to collection boxes and then to DC fuse boxes and inverters. Inverters would convert the DC energy generated by the PV arrays to useable AC power at a low voltage (300 to 400 volts). AC output would be required to deliver power to the transmission grid and to provide power to the Imperial Valley Substation.
Page 2-6 Ocotillo Sol Project Draft EIS/Draft CDCA Plan Amendment
April 2012

Alternatives
The low-voltage AC output from the inverters would be stepped up to the required 12.47 kV by transformers located next to the inverters. This 12.47 kV output from the transformers would be collected and sent to the substation interconnection point through a combining switchgear. The output of the combining switchgear would continue on to the Imperial Valley Substation.
The preliminary site layout for the solar facility includes 1 MW blocks to match typical inverter sizing available on the market today, as shown in Figure 2-3 (see Appendix A). The site layout shown in Figure 2-3 (see Appendix A) contains 20 1 MW blocks. As described above, the current generated by module strings in each 1 MW block would be collected in several combiner boxes throughout the project site and would then be routed to the DC fuse box, inverters, and transformers. The inverters and transformers would be sized to handle 1 MW of capacity. Typical arrays would measure approximately 40 inches by 60 inches. The project would need about 64,000 to 200,000 arrays, depending on the PV technology selected. The project would need about 20 to 80 inverters depending on current technology type used, and would also use about 20 small transformers. Figure 2-3 (see Appendix A) also indicates the Applicant’s proposed route for the interconnection between the Ocotillo Sol Project and the existing Imperial Valley Substation.
2.2.2.2.2 Access Roads, Internal Roads, and Parking An existing access road for the Imperial Valley Substation within an existing BLM ROW provides access to the Ocotillo Sol Project site (see Figure 1-1 in Appendix A). New, minor access roads would be constructed between the module rows within the Ocotillo Sol Project area fence line. Existing access roads would be used where possible. A gravel parking area would provide parking for up to 15 vehicles and would be located adjacent to the maintenance building.
The majority of the construction workforce would access the site each day from Highway 98, also called the Yuha Cutoff, from the east. Equipment such as grading equipment, water trucks, and common carrier trucks would use this access route.
2.2.2.2.3 Electric Transmission and Interconnect The Ocotillo Sol Project’s transmission line would interconnect to the Imperial Valley Substation at 12.47 kV. The interconnection facilities would consist of the following existing equipment within the Imperial Valley Substation: three 12.47 kV breakers, six 12.47 kV disconnects, a 12.47 kV switch rack, 2,000 feet of underground 12.47 kV cable, associated protection relaying, and a fiber communication cable buried in the 12.47 kV cable trench. No new transmission facilities or transmission upgrades would be necessary for the Ocotillo Sol Project.
The Imperial Valley Substation is an existing major substation that serves San Diego Gas & Electric Company, the Imperial Irrigation District, and merchant generators, and provides an intertie to Comisión Federal de Electricidad in México. The Applicant (the interconnecting utility) and California Independent System Operator (CAISO, the grid operator) would be responsible for ensuring grid reliability. These two entities determine the transmission system impacts of the Ocotillo Sol Project and any measures needed to ensure system conformance with utility reliability criteria. All interconnect design and details would follow the Applicant’s and CAISO standards and regulations. No new additions to the existing electrical grid would be necessary for the Ocotillo Sol Project.
Ocotillo Sol Project Page 2-7 Draft EIS/Draft CDCA Plan Amendment April 2012

Alternatives
2.2.2.2.4 Operation and Maintenance Building A maintenance building would be constructed on the north end of the Ocotillo Sol Project area adjacent to the existing access road. The building would have a gravel parking area and would house maintenance equipment, spare parts, and the electronic plant monitoring system. This pre-engineered, metal building would be approximately 60 feet by 30 feet, and would not exceed 25 feet in height. This maintenance building would house electronics to monitor the energy generated at the site. It would also store materials required to maintain the solar PV facility. Limited quantities of hazardous materials, such as petroleum products, gasoline, diesel fuel, lubricants, hydraulic fluid, and transmission fluid would be stored and used on-site for operation and maintenance. All hazardous materials would be required to be stored and managed per the requirements of the local Certified Unified Program Agencies. Access roads within the project site boundary would allow equipment and maintenance access around the project site and within the individual solar module blocks. Security system components may be installed inside the building and around the area as deemed necessary.
2.2.2.2.5 Site Communication A fiber communication cable would be buried in the 12.47 kV cable trench and used for site communication. Site communication would be conducted via remote access.
2.2.2.2.6 Site Security and Fencing The perimeter of the proposed Ocotillo Sol Project area would be secured with chain link fencing, which would consist of 8 foot tall fencing and one-foot barbed wire or razor wire on top. This type of fencing would be consistent with security requirements for similar Applicant facilities, such as the adjacent Imperial Valley Substation. Fencing design would minimize potential impacts to wildlife. A 2-inch bottom gap on the fencing would allow small wildlife (e.g., lizards) movement through the area and minimize the potential of trapping wildlife within the fenced enclosure or beneath the fence.
During operations, the solar field enclosure would be equipped with a security system, including cameras, to monitor the facility. The Ocotillo Sol Project would have no full-time staff and staff would be on-site only to perform maintenance activities. Day-to-day monitoring of electrical output at the site would be done remotely via the Internet by the Applicant. Only authorized personnel would be allowed to enter the facility. The Applicant will comply with all applicable Imperial County building safety requirements, including those for fire safety.
The Applicant would also provide access to the secured area to the U.S. Border Patrol, allowing them to perform their duties.
2.2.2.2.7 Erosion Control and Stormwater Drainage The Ocotillo Sol Project’s design would include erosion control and stormwater drainage with the following objectives:
Protection of the facilities from erosion and stormwater damage
Minimization of off-site downstream effects of erosion and stormwater flow
Minimization of impacts that would reduce the ability to rehabilitate the land following the end of the Ocotillo Sol Project lease
Page 2-8 Ocotillo Sol Project Draft EIS/Draft CDCA Plan Amendment
April 2012

Alternatives
Continuation of existing sheet flow drainage patterns
The Applicant’s proposed Ocotillo Sol Project site was selected to minimize grading and to allow site hydrology to remain in a quasi-natural state. Minimal release of water and sediment outside the project boundary would be in equilibrium with water and sediment entering the project boundary. Any topsoil removed from the laydown area would be stored in windrows and replaced during post-construction restoration.
Site grading would match existing slopes and grades, minimize disturbance, and preserve existing drainage patterns. Soil would not be imported to or exported from the site. All electrical equipment and foundations would be elevated above the 100-year flow depth. Gravel would be placed on all site roadways to permit travel during storm events.
The Ocotillo Sol Project would comply with all water quality standards or waste discharge requirements. Discharge would be limited to stormwater runoff occurring during construction and operation, which would conform to California’s National Pollutant Discharge Elimination System (NPDES) Construction Permit, and the Applicant’s standard operating procedures and protocols. Construction associated with the project would require grading of one or more acres of land and require preparation of a Storm Water Pollution Prevention Plan (SWPPP), which would be implemented during construction activities in compliance with the NPDES Construction Permit requirements. The SWPPP would identify project-specific construction Best Management Practices (BMPs) from the Applicant’s Water Quality Construction BMP Manual (Sempra Energy Utilities 2002) as well as the Renewable Energy Action Team BMPs and Guidance Manual (2010), augmented as necessary according to standards set by the BLM authorized officer. These BMPs would minimize potential impacts to water quality during construction activities. The SWPPP would also include vehicle and equipment fueling, and spill control BMPs for the on-site refueling component of the Ocotillo Sol Project (Renewable Energy Action Team 2010; Sempra Energy Utilities 2002). As noted above, limited quantities of hazardous materials would be stored and used on-site for operation and maintenance. All hazardous materials are required to be stored and managed per the requirements of the local Certified Unified Program Agencies.
In addition, the Applicant would provide monitoring of the water quality BMPs. Monitoring would be conducted according to guidance provided in the Renewable Energy Action Team BMPs and Guidance Manual (2010). Applicant project monitors would provide oversight to crews who implement the BMPs and conduct routine inspections of disturbed areas to ensure that the BMPs remain effective. Monitors would be Qualified SWPPP Practitioners or Qualified SWPPP Practitioner supervised inspectors. Qualifications for these monitors will be outlined in the Ocotillo Sol Project Construction General Permit from the State Water Resources Control Board. To ensure compliance with SWPPP requirements and the State’s General Construction Storm Water Permit, monitors would provide training to construction workers, document inspections, and maintenance of the project’s SWPPP.
2.2.2.2.8 Vegetation Treatment and Weed Management The Ocotillo Sol Project area would be located in sparse Sonoran creosote bush scrub habitat. Native shrub cover on-site is approximately 10 percent and the average shrub height is 45 centimeters (1.5 feet; Appendix C).
Ocotillo Sol Project Page 2-9 Draft EIS/Draft CDCA Plan Amendment April 2012

Alternatives
Initial construction activities would include complete vegetation grubbing of the area after site boundary land survey staking and prior to full site land survey. Grubbing would incorporate the clearing of vegetation, use of herbicides, and a water truck for fugitive dust control. Herbicides may be applied during construction as specified in the approved Ocotillo Sol Project Weed Management Plan (Appendix D).
Vegetation treatment and weed management would be ongoing throughout the life of the project. The site would be maintained free of vegetation with BLM-approved herbicides. The Ocotillo Sol Weed Management Plan, developed in consultation with the BLM, would outline the vegetation treatment and weed management program for the site (see Appendix D).
2.2.2.2.9 Fire Protection Although the Ocotillo Sol Project would be unmanned during operation, the Applicant would incorporate a fire detection system into the maintenance building as part of the Fire Protection Plan. To minimize fuels and ignition potential in the Ocotillo Sol Project area, the site would be cleared of vegetation and maintained as a vegetation free environment. The fire protection system would consist of personal fire extinguishers throughout the site.
The existing Imperial Valley Substation adjacent to the Ocotillo Sol Project area has a water tank, which the Ocotillo Sol Project would be able to use in the event of fire. The water tank in the Imperial Valley Substation is 22 feet in diameter and 30 feet high, with an approximate 45,000-gallon capacity. It is located approximately 400 feet north of the Imperial Valley Substation access road near the main gate. The water connection is on the east side of the tank.
2.2.2.2.10Hazardous Materials and Waste Construction, operation, and maintenance activities would comply with applicable federal, state, and local regulations regarding the use of hazardous substances. Imperial County Public Health, Environmental Health and Consumer Protection Services, provides health and safety expertise in the containment and cleanup of accidental spills. The California Department of Toxic Substances Control is the appointed Certified Unified Program Agency in Imperial County and manages the regulation and permitting of businesses that handle hazardous materials and/or waste.
Construction, operation, and maintenance activities would involve hazardous chemicals such as petroleum products, gasoline, diesel fuel, lubricants, hydraulic fluid, and transmission fluid. These products would be used to fuel and lubricate vehicles and equipment, but would be contained within fuel trucks or in approved containers. When not in use, such materials would be periodically transported, stored properly off-site, and legally disposed of to prevent contamination and accidents. These materials would not be drained onto the ground, or into streams or drainage areas.
All trash would be totally enclosed. All construction, operation, and maintenance waste, including trash and litter, other solid waste, and other potentially hazardous materials, would be removed and transported to the nearest Type I or II landfill or to a nearby transfer station authorized to accept such materials. The only landfill of these types in Imperial County is Safety-Kleen (Laidlaw; Type I facility) located in Westmorland. No Type II facilities are present in Imperial County (California Environmental Protection Agency 2012). During
Page 2-10 Ocotillo Sol Project Draft EIS/Draft CDCA Plan Amendment
April 2012

Alternatives
construction, trash and other materials for disposal would be removed on a routine basis. Operations and maintenance activities are expected to produce only small quantities of trash and other materials for disposal; removal would be on an as-needed basis.
If spills occur, the Applicant would implement standard spill cleanup procedures, including recycling and disposal at an approved facility. Oil spills would be reported to the California Department of Fish and Game, Office of Spill Prevention and Response, at (800) 852-7550.
To avoid inadvertent release of materials and ensure proper response actions, the Applicant and its contractors would implement the Applicant’s standard operational procedures and protocols, including BMPs, to reduce potential impacts relative to hazardous material transport, use, storage, or disposal. Accidental leakage of fuel or lubricants from construction, operation, and maintenance equipment would be remediated in accordance with the environmental controls plan for the site. Maintenance activities such as painting, module cleaning, and equipment lubrication would be conducted in accordance with approved practices for minimizing environmental contamination. Any electrical equipment containing oil or liquids determined to be a contamination hazard would be mounted on sump foundations designed to contain any leakage that may occur. The containment system would conform to the National Fire Protection Association, state of California, and Imperial County fire protection codes and regulations. Other mitigation measures would be developed where necessary to minimize potential environmental impacts.
A thin-film PV module technology that may be used for the Ocotillo Sol Project contains cadmium telluride (CdTe). Human exposure of CdTe would only occur if the module, which is sealed in glass, generated flake or dust particles. The potential for CdTe release could only occur if severe pitting of the panel surface occurred. If thin film technology is used, routine monitoring and inspection activities by the Applicant would occur to identify any potentially damaged panels. If a damaged panel is discovered, the panel would be replaced prior to any degeneration that may result in the release of CdTe. The Applicant is only considering CdTe thin film technology as an option to crystalline silicon. The requisite Title V compliance during commercial operation and decommissioning plan after commercial operation should eliminate the need for further risk assessment.
Dust particles would not be generated unless the modules disintegrated during final disposal or vaporized in a fire. Final disposal of modules would occur off-site and would be covered under the decommissioning plan. The Applicant would also prepare a fire safety plan to address potential exposure to hazardous materials.
The Applicant would use contractors and workers who are skilled in the installation of the solar modules, further reducing the likelihood of modules being disintegrated or vaporized in a fire. In addition, contractors must operate in strict compliance with California Occupational Safety and Health Administration requirements and the hazardous materials release response plan to be produced in connection with the Applicant’s proposed Ocotillo Sol Project. Accordingly, any potential impact from the accidental exposure of CdTe, should such modules be used at the site, would be minimal.
Ocotillo Sol Project Page 2-11 Draft EIS/Draft CDCA Plan Amendment April 2012

Alternatives
2.2.2.2.11Dust Control Dust control measures, as detailed in the Water Quality Construction BMP Manual (Sempra Energy Utilities 2002) and Renewable Energy Action Team BMPs and Guidance Manual (2010), would be implemented to help reduce potential air quality concerns associated with the construction and operational phases of the Ocotillo Sol Project.
The Applicant would accomplish construction dust control of the Ocotillo Sol Project area, the construction laydown areas, and the access road during construction by using water applied by trucks or other palliative means deemed acceptable by BLM. Wind erosion control techniques (such as windbreaks, water, chemical dust suppressants, and/or vegetation) would be used where soils are disturbed (Renewable Energy Action Team 2010).
2.2.2.3 CONSTRUCTION
The Ocotillo Sol Project construction would move continuously across the project area. PV module mounting and electrical system installation would follow as the racking systems are erected. Construction would continue through completion to commissioning, without phasing of the Ocotillo Sol Project.
The Ocotillo Sol Project area would encompass 100 acres for the solar arrays, associated equipment, and internal access roads. Ocotillo Sol Project site construction would include the following major activities:
Preparation of site, including grubbing of site vegetation
Installation of minor site access roads, including within the temporary laydown area
Installation of perimeter fencing
Installation of module rack support posts
Installation of module racking systems on the support posts
Attachment of the PV modules to the racking systems
Wiring and cabling aboveground (from modules to underground wiring system)
Wiring and cabling underground (from panel rows to inverters)
Construction of the inverters and transformer stations
Construction of the maintenance building
Installation of the combining switchgear
Construction of the interconnection facilities
Commissioning and testing of the facility
The Applicant selected the Ocotillo Sol Project area location to minimize the grading requirements and to allow the site hydrology to remain in a quasi-natural state. Cut and fill activities would occur in the areas of access road construction, trenching for underground cables, and foundation preparation. On-site storage of soil materials would be minimal and of short duration. Cut and fill quantities would be balanced to ensure no net import or export of materials to the site. No soil would be removed from or brought onto the project site. The construction laydown area and the site access roads would be compacted and covered with gravel to minimize
Page 2-12 Ocotillo Sol Project Draft EIS/Draft CDCA Plan Amendment
April 2012

Alternatives
settlement and dust during construction. The general slope across the site would remain unchanged. BMPs would include periodic filling of rills from adjacent on-site deposited materials. Filled material would be compacted to a condition similar to its off-site condition.
Construction workflow would proceed as follows:
Hold on-site pre-construction meetings that include safety and environmental training for pertinent project staff, all construction personnel, and environmental monitors. Safety and environmental training for new personnel as well as refresher trainings would be part of pre-construction meetings.
Survey and mark the site for construction.
Install temporary construction fencing at the direction of biological and cultural monitors to keep construction crews out of sensitive environmental or cultural areas.
Install stormflow BMPs (e.g., silt fences) as needed.
Grade and compact site laydown, construction parking, construction office area, and permanent and construction site (temporary) access roads with heavy earthmoving equipment.
Drive steel posts into the ground to support the PV racking system. Posts will be capped to decrease the likelihood that birds or bats become trapped. Posts for racking are anticipated to be 5 to 8 feet deep. Actual depth would be determined upon completion of geotechnical studies.
Erect PV racking system and place per manufacturer recommendations and engineering documents.
Begin trenching for the underground collection system.
Form and pour foundations.
Set inverters and transformers.
Pull cables through the conduit or tray system, wiring rows of PV modules to intermediate collection points with termination in combiner boxes.
Connect cables from the combiner boxes to DC fuse boxes and inverters.
Connect cables or bus ducts to the AC side of the inverters to low side of the step-up transformers.
Route the 12.47 kV system wiring from the step-up transformers to a combining switchgear. The switchgear would combine all of the incoming circuits from the transformers into one circuit that would connect to the transmission system via an underground interconnection line brought to the fence of the existing Imperial Valley Substation. The combining switchgear would also provide an on-site means of disconnect.
Commission the 12.47 kV collector system loops on an ongoing basis as they are completed during the installation of the solar collection field. Inverters would be commissioned when interconnection is made and the 12.47 kV collection system is commissioned.
Construct the generation tie-in line and interconnection facilities within the Imperial Valley Substation in parallel with construction of the generation facility.
Commission and test the generation facility system.
Begin commercial operation after all steps above have been completed.
Ocotillo Sol Project Page 2-13 Draft EIS/Draft CDCA Plan Amendment April 2012

Alternatives
Construction and commissioning activities would occur over 8 to 11 months. Construction would occur five days per week for eight hours a day. Construction days and times may vary due to weather (such as extreme heat, storms, and high winds), seasons in regards to wildlife and plant sensitivity or avoidance periods, and construction timelines. Vehicle use during construction would occur during daytime hours in compliance with Imperial County regulations. Routine operation and maintenance activities, with the exception of an emergency, are expected to occur during daytime hours.
All construction roadways would consist of construction road base, an aggregate of gravel and sandy gravel soils. Permanent roads and parking would consist of compacted gravel as required for maintenance and access throughout the life of the Ocotillo Sol Project, and would be maintained regularly for dust control. All other areas would remain with the natural soil as the final surface.
A local plant would provide concrete, which would be trucked in for the required foundations. Off-site, existing commercial operations in the Imperial County area would provide gravel or aggregate, which would be trucked to the Ocotillo Sol Project area. Approximately 3,400 cubic yards of aggregate would be required for construction of the Ocotillo Sol Project. Gravel would be used as needed for road maintenance during operation of the solar PV facility.
Water needs for construction activities would be limited. During construction, water would be used primarily for fugitive dust control and for foundation work. Water use would be approximately 150 acre-feet total during the 8- to 11-month construction period, with most water being used for dust control purposes. The amount of water required for foundation work and dust control on the access road would be minimal.
Construction water quality would need to be reasonably clear without oil, salt, acid, alkali, organic, and other injurious substances. Non-potable construction water shall conform to state and local regulations. Potable water would be allowed without testing.
Potable water would need to be trucked in to the site each day during the construction period for drinking water, hand washing, and other personal uses. Approximately 1,350 gallons per day (gal/day) would be needed for about 270 workers during the peak construction period. Approximately 4 gallons of drinking water per person per day (1,080 gal/day) would be needed during the construction period. Approximately 1 gallon per person per day (270 gal/day) of water for hand washing and other personal uses would be needed during the construction period. Potable water should be provided for personnel use only; non-potable water would be sufficient for washing construction equipment and dust control.
Possible water sources for construction include surface water trucked to the Ocotillo Sol Project area from the Imperial Irrigation District and from municipal water systems near the Ocotillo Sol Project.
2.2.2.3.1 Temporary Workspace, Yards, and Staging Areas A 15-acre temporary construction workspace adjacent to the Ocotillo Sol Project area would house construction offices, parking for the construction workforce, and a temporary staging area for construction materials (Table 2-1; see also Figure 2-3 in Appendix A).
Page 2-14 Ocotillo Sol Project Draft EIS/Draft CDCA Plan Amendment
April 2012
Alternatives
TABLE 2-1 ALTERNATIVE 2: CONSTRUCTION WORKSPACE ACREAGES
Construction Workspace Area Acreage Construction Workforce Parking 2 Construction Offices 1 Construction Vehicle Parking 1 Construction Laydown/Staging 11 Total 15
The temporary laydown area would be directly east of and adjacent to the existing access road with temporary construction power provided from the Imperial Valley Substation. The laydown area would be fenced and secured during the construction period. Fencing of the laydown area would consist of an 8-foot chain link fence around the perimeter. The fence may include a one-foot barbed wire or razor wire top. This fence is not anticipated to restrict the movement of wildlife. The temporary laydown area would be left in its native state to the fullest extent possible. The temporary construction workspace would only be graded and compacted with a gravel overlay to mitigate unsuitable conditions only as a last resort. Those portions of the temporary laydown area where perennial shrubby vegetation is present would be pruned by hand, mowed, chained, and/or mulched prior to the commencement of other construction activities.
Temporary restroom facilities would be provided during construction. Water would be trucked in from either Imperial Irrigation District or municipal sources. Waste would be trucked out by a waste contractor to a waste treatment facility. The temporary laydown area would be returned to its pre-construction condition upon commissioning of the Ocotillo Sol Project. Imported gravel would be removed for off-site disposal.
2.2.2.3.2 Schedule The sequence of construction would be defined by the general contractor and based on BMPs. The schedule would generally follow the sequence of staking and flagging the perimeter of the Ocotillo Sol Project area, construction of internal access roads, site grading, installation of the grounded fence, installation of foundations, assembly and installation of all project facilities, cleanup, and site reclamation of the temporary work area. As noted above, construction and commissioning activities would occur over 8 to 11 months, five days per week for eight hours a day.
2.2.2.3.3 Workers, Vehicles, and Equipment Timeframes Prior to mobilization for construction, a detailed construction plan would be developed to define the construction supervisory and technical field organizations and required staffing levels. On average, 80 to 120 construction and supervisory personnel would be on-site for the duration of construction, with up to 270 workers at peak construction. Some workers would be local, but it is expected that some would be migrating to the work site from outside of the area. Table 2-2 shows the number of personnel per month required for construction of the Ocotillo Sol Project.
Ocotillo Sol Project Page 2-15 Draft EIS/Draft CDCA Plan Amendment April 2012

Alternatives
TABLE 2-2 ALTERNATIVE 2: CONSTRUCTION LABOR FORCE BY MONTH
Month Personnel 1 10 2 10 3 32 4 44 5 50 6 115 7 250 8 270 9 192 10 60 11 10
The construction workforce would consist of, but not be limited to, surveyors, inspectors, linemen, laborers, operators, supervisors, health and safety personnel, and environmental monitors.
Several types of vehicles, including personnel transport, water wagons, bulldozers, motor graders, paddle-wheel loaders, pan scrapers, backhoes, front-end loaders, dump trucks, trenchers, construction equipment, material delivery, and line trucks would be on-site at various stages during construction. Table 2-3 shows the amount of equipment required and the amount of time they would run for the duration of construction.
TABLE 2-3 ALTERNATIVE 2: CONSTRUCTION EQUIPMENT LIST AND HOURS OF USE
Equipment Type Engine HP Estimated Hours of Use Grader 350 440 Scraper/Dozer 400 336 Front End Loader 350 168 Roller/Compactor 350 512 Dump Truck 350 160 Vibratory Post Driver 100 240 Backhoe/Trencher 350 232 Generator/Compressor 100 320 Forklift 100 1,384 Flat-bed Truck 200 552 Water Truck 350 1,760 Hand Held Vibrator 50 320 Crane/Lift 150 560 ATV 50 2,880 Concrete Truck 350 400 Crew Delivery Bus 250 540 Semi (equipment and supply delivery) Truck 350 1,260 Personal Car 150 380
ATV = all-terrain vehicle
Page 2-16 Ocotillo Sol Project Draft EIS/Draft CDCA Plan Amendment
April 2012

Alternatives
2.2.2.4 OPERATIONS AND MAINTENANCE
Solar PV facilities generate electric energy whenever sunlight hits the PV modules. Energy generation from a solar PV facility occurs without on- or off-switching, requiring no direct intervention or control by on-site operations personnel.
Performance monitoring would evaluate system reliability, compare actual versus predicted generation values, identify malfunctioning equipment/systems, and provide operational indications that are outside expected ranges. Solar PV facilities are capable of providing performance monitoring from remote locations via electronic communications devices. The Applicant’s personnel currently operate other electricity-generating facilities, and it is anticipated that these same personnel would monitor the Ocotillo Sol Project via remote communication systems, including cameras. If the site endures vandalism or is determined to be highly susceptible to vandalism, the Applicant may have the site guarded by security personnel. Remote sensing via security cameras would allow the Applicant to notify the appropriate emergency first responders in the case of trespass/vandalism that would not otherwise trigger attention due to a change in energy output.
Operation and maintenance needs for the PV facility would be determined through a combination of continuous performance monitoring and an Operation and Maintenance Plan. The Operations and Maintenance Plan, which would be completed approximately one to two months prior to commercial operation, would include equipment protection, equipment supplier recommendations, environmental compliance, safety, and industry best practices and procedures.
Scheduled maintenance activities would include electrical system maintenance, transformer/breaker maintenance, road maintenance, lubrication, system integrity checks, vegetation management, cleaning of module surfaces, and repair or replacement of defective components. Routine maintenance activities would occur. Routine maintenance is predicated based on the monitoring of energy production. When abnormalities or declining trends in energy output are detected, the appropriate maintenance activity would be initiated. The most common maintenance activities would be panel washing (once or twice per year) and scanning of wire connections. Operations and maintenance of the solar PV systems would include a combination of performance based monitoring, manufacturer recommendations and visual inspections. Annual maintenance would consist of a visual and infrared scanning of connections, and checking of inverter(s), including maintaining inverter filters. Systems would be monitored with alarms for operational issues. Predicted performance would be compared with actual performance to detect issues. If system performance drops notably below expectations, a check of output at key points would be undertaken to isolate and resolve the issue.
Weed management during the operations and maintenance period would be conducted as described above in Section 2.2.2.2.8—Vegetation Treatment and Weed Management. In the event of any ground-disturbing activities during operations and maintenance, dust control measures would be conducted as described above in Section 2.2.2.2.11—Dust Control.
During operation of the solar PV facility, the arrays would be periodically washed, likely once or twice per year, using approximately 1 acre-foot of water per wash. This assumption is based on the conditions and dust levels in the Imperial Valley. All panel washing maintenance activities
Ocotillo Sol Project Page 2-17 Draft EIS/Draft CDCA Plan Amendment April 2012

Alternatives
would occur during daytime hours and would be contracted. No evaporation ponds or other water holding facilities would be required. Potable water would be used for array washing, unless de-mineralized water could be obtained at a reasonable cost. As described above, potential water sources include Imperial Irrigation District and municipal sources. Array washing would occur when plant performance feedback indicates a drop in generation, thus warranting cleaning. A solar PV facility has no processed water discharge. Water from panel washing would not likely pond due to the low levels of water needed and likelihood of rapid infiltration and evaporation.
Table 2-4 below shows the anticipated equipment and estimated hours of use during operation and maintenance of the Ocotillo Sol Project.
TABLE 2-4 ALTERNATIVE 2: OPERATIONS AND MAINTENANCE EQUIPMENT LIST AND
HOURS OF USE
Equipment Type Engine HP Estimated Hours of Use Forklift 100 360 Flat-bed Truck 200 120 Water Truck 350 20 Crane/Lift 150 40 ATV 50 720 Semi (equipment and supply delivery) Truck 350 20 Personal Car 150 720
ATV = all-terrain vehicle
2.2.2.4.1 Unscheduled Maintenance The Ocotillo Sol Project would not have an on-site workforce performing operation and maintenance activities on a continuous, shift-type basis. Security cameras would be installed to monitor the site. PV systems are capable of remote operation and maintenance monitoring. The Applicant or contract personnel would perform maintenance activities consistent with the Operations and Maintenance Plan or when the facility’s communication devices provide operation and maintenance feedback.
2.2.2.4.2 Operations Workforce and Equipment Routine maintenance activities would require two to three people onsite weekly. PV panel washing would require four to six people on-site one to two times per year.
Normal maintenance equipment would consist of trucks (primarily pickup or module trucks) or small, 4-wheeled carts pulling small trailers. Large equipment for maintenance would be used if large equipment or components require removal and replacement.
2.2.2.5 DECOMMISSIONING
The expected life of the project is 30 years. Once the site is retired from power generation service, the site would be reclaimed with all equipment, buildings, foundations, and driven piles being removed from the site. The site would be restored to pre-project conditions as much as feasible. To minimize erosion after decommissioning, the Applicant would document the
Page 2-18 Ocotillo Sol Project Draft EIS/Draft CDCA Plan Amendment
April 2012
Alternatives
topographical and erosional condition of the site before and after decommissioning. The Applicant would develop and implement a post-project erosion control plan and inspect the site quarterly for five years following decommissioning to determine the status of erosion. The Applicant would submit an annual report to the BLM documenting the status, and the BLM would determine if corrective actions were necessary to reduce the amount of erosion taking place.
Consistent with BLM requirements, the Applicant would prepare a detailed decommissioning plan that includes specific decommissioning procedures that both protect public health and safety and is environmentally acceptable. The BLM would have to approve the decommissioning plan before permanent decommissioning. When the BLM begins to consider decommissioning, it would contact applicable agencies to determine whether additional consultation would be appropriate. Materials used on-site would be reused at other locations, sold as scrap, or recycled wherever possible.
A separate NEPA document would be completed to develop alternatives to consider and to analyze the potential effects of the alternatives for decommissioning and reclamation. A bond would be required from the Applicant to ensure that decommissioning and reclamation is completed.
2.2.3 ALTERNATIVE 3: REDUCED CONSTRUCTION FOOTPRINT ALTERNATIVE (PREFERREDALTERNATIVE)
Alternative 3, the reduced footprint alternative, is the BLM’s Preferred Alternative. Alternative 3 would be the same as Alternative 2 except that it would be modified to reduce the total area of disturbance in the Yuha Desert associated with the Ocotillo Sol Project. The temporary construction laydown area described under Alternative 2 would be reduced to 2 acres under Alternative 3 (Figure 2-4 in Appendix A) as compared to 15 acres under Alternative 2. The construction office, restrooms, and other facilities would be placed within the 100-acre or 2-acre laydown area, as needed. By reducing the laydown area, Alternative 3 would necessitate the Applicant’s management of laydown and staging within the 100-acre Ocotillo Sol Project site as construction activities progress. Under Alternative 3, the 2-acre temporary laydown area would be used for construction workforce parking. Alternative 3 would also allow off-site parking and busing the work force to the construction site.
Under Alternative 3, BLM would amend the CDCA Plan to identify all 102 acres as suitable for solar development and allow solar development on this land. The 13 acres excluded from the ROW grant would be amended to be unsuitable for solar development. A Plan Amendment would not be required for the generation tie line as the generation tie line and interconnection facilities under this alternative lie fully within a BLM-designated corridor and would be compliant with the CDCA Plan.
Ocotillo Sol Project Page 2-19 Draft EIS/Draft CDCA Plan Amendment April 2012

Alternatives
2.2.4 ALTERNATIVE 4: NO PROJECT /AMEND CDCAPLAN TO IDENTIFY AREA AS SUITABLE FOR SOLAR DEVELOPMENT
Under this No Project Alternative (Alternative 4), the Ocotillo Sol Project would not be approved (all components of the project denied), and no ROW grant would be issued to the Applicant. The CDCA Plan, however, would be amended to identify the Ocotillo Sol Project area as suitable for solar energy development.
If Alternative 4 were selected, no impacts associated with the construction, operation, maintenance, and decommission of the Ocotillo Sol Project would occur.
Because the CDCA Plan would be amended to allow for solar energy development at this site, solar electricity could be produced at the site by some future project. Impacts associated with such a future project would likely be similar to the proposed Ocotillo Sol Project; however, such future projects and associated impacts are too speculative to be determined at this time. Additionally, any new project proponent would have to apply for a new interconnection queue position for such a project, and would be unlikely to obtain an interconnection agreement within the next several years.
2.2.5 ALTERNATIVE 5: NO PROJECT /AMEND CDCAPLAN TO IDENTIFY AREA AS UNSUITABLE FOR SOLAR DEVELOPMENT
Under this No Project Alternative (Alternative 5), the Ocotillo Sol Project would not be approved (all components of the project denied), and no ROW grant would be issued to the Applicant. The CDCA Plan would be amended to identify the Ocotillo Sol Project area as unsuitable for solar energy development.
If Alternative 5 were selected, no impacts associated with the construction, operation, maintenance, and decommission of the Ocotillo Sol Project would occur. Additionally, the CDCA Plan would be amended to identify the site as unsuitable for solar energy development, and the site would not be available for such development in the future. The site, however, would continue to be available for other types of uses allowable on BLM-administered land, and the site would remain within a designated utility corridor (Utility Corridor N).
2.3 ALTERNATIVES CONSIDERED BUT ELIMINATED FROM DETAILED ANALYSIS
In accordance with 43 CFR 2804.10, the BLM worked closely with the Applicant during the pre-application phase to identify other potential areas for their proposed project before the Applicant filed their ROW application. For example, the BLM discouraged the Applicant from including in their application alternate BLM locations with significant environmental concerns, such as critical habitat, ACECs, Desert Wildlife Management Areas, designated off-highway vehicle areas, wilderness study areas, and designated wilderness areas, or other sensitive resources. The
Page 2-20 Ocotillo Sol Project Draft EIS/Draft CDCA Plan Amendment
April 2012

Alternatives
BLM encouraged the Applicant to locate its project on public land with the fewest potential conflicts. Other alternative sites and various renewable and nonrenewable generation technologies were considered but eliminated from detailed analysis under NEPA. These alternatives were eliminated from detailed analysis because one or more of the following criteria from the BLM NEPA Handbook H-1790-1 (2008) apply:
It would not respond to the BLM purpose and need.
It is technologically or economically infeasible.
It is inconsistent with the basic policy objectives for the management of the area (not conforming to the CDCA Plan).
Its implementation is remote or speculative.
It is substantially similar in design to an alternative that is analyzed.
It would have substantially similar effects to an alternative that is analyzed.
Not all of these criteria from the BLM Handbook were used in eliminating alternatives from consideration. The process for eliminating these alternatives from detailed analysis complies with 40 CFR 1502.14(a) and is described below.
2.3.1 ALTERNATIVE SITES
2.3.1.1 FEDERAL LAND
The Applicant considered federal land outside the Yuha Desert Management Area that might be available for renewable energy development. A significant portion of the federal land outside the Yuha Desert Management Area, within 20 miles of the Imperial Valley Substation, is under development for other renewable projects. Additionally, because the Ocotillo Sol Project criteria include an interconnection to the Imperial Valley Substation at 12.47 kV technical constraints limit potential feasible project site location to those areas within approximately 1.5 miles of the substation. This constraint exists because the line loss and fault current conditions that are associated with the transmission of power at 12.47 kV would cause power losses that would make the project technically and economically infeasible at transmission distance greater than approximately 1.5 miles. A higher voltage line would also be economically infeasible. Since the closest available federal land outside the Yuha Desert Management Area lies approximately 5.5 miles from the Imperial Valley Substation, these alternative sites were considered technically infeasible. The Applicant did not include consideration of an above ground generation tie. Only an underground generation tie was considered in design to avoid and minimize the potential effects to visual and biological resources, and as discussed above, a longer overhead line is not feasible.
2.3.1.2 NON-FEDERAL LAND
Based on the transmission limitation discussed above, the Applicant considered seven alternative sites on private lands within a 2-mile radius of the Imperial Valley Substation (Appendix E). The Applicant’s research and contacts with landowners indicated that private parcels within a 2mile radius of the Imperial Valley Substation were unavailable. The reasons for the unavailability of suitable private lands include the following: 1) the lands were owned in fee or
Ocotillo Sol Project Page 2-21 Draft EIS/Draft CDCA Plan Amendment April 2012

Alternatives
under option by other renewable energy developers; 2) the lands were owned in fee by landowners who were not interested in renewable energy development or were unwilling to sell; and 3) landowners’ option and land price expectations (based on those contacted) greatly exceeded feasible renewable energy development economics as calculated by the Applicant and permitted by Sempra Utilities, of which the Applicant is a subsidiary.
The Applicant is regulated by the California Public Utilities Commission, which reviews all utility-owned generation projects for cost reasonableness. Because of the effort to identify suitable private lands, the Applicant determined that siting the Ocotillo Sol Project on non-federal lands would be technologically and economically infeasible.
2.3.2 ALTERNATIVE ENERGY GENERATION TECHNOLOGIES
Alternative technologies, including both renewable and non-renewable technologies, were considered as potential alternatives to the Applicant’s proposed Ocotillo Sol Project. This includes other types of solar power generation such as parabolic trough technology, solar power tower technology, linear frensel technology, and distributed solar generation. Non-solar generation, such as wind energy, geothermal energy, biomass energy, tidal energy, natural gas, coal, and nuclear energy, were also considered.
These technologies were eliminated from detailed consideration because they would not respond to the BLM’s purpose and need for the Ocotillo Sol Project, which is to respond to the Applicant’s ROW grant application to construct, operate, and decommission a solar PV facility on public lands. Additionally, non-renewable energy technologies do not respond to the purpose and need to meet the goal for the Secretary of the Interior of approving 10,000 MW of non-hydropower renewable energy on public lands by 2015, as established by the Energy Policy Act of 2005. Finally, no alternative technologies were identified that would address the unresolved resource conflicts raised by the Ocotillo Sol Project. Therefore, alternative technologies are not a reasonable alternative to the Applicant’s proposed Ocotillo Sol Project.
2.3.3 CONSERVATION AND DEMAND-SIDE MANAGEMENT AND DISTRIBUTED GENERATION
A distributed solar alternative would consist of PV panels that would absorb solar radiation and convert it directly to electricity. The PV panels could be installed on private or publicly owned residential, commercial, or industrial building rooftops or in other disturbed areas such as parking lots or disturbed areas adjacent to existing structures, such as substations.
Distributed generation does not respond to the purpose and need to consider an application for a ROW grant to construct, operate, and decommission a solar PV facility on public lands. Additionally, the Energy Policy Act of 2005 established a goal for the Secretary of the Interior to approve 10,000 MW of electricity from non-hydropower renewable energy projects located on public lands by 2015. Given the current state of the technology, only utility-scale renewable energy generation projects are reasonable alternatives to achieve this level of renewable energy generation on public lands. Furthermore, the BLM has no authority or influence over the installation of distributed generation systems, other than on its own lands. The BLM is
Page 2-22 Ocotillo Sol Project Draft EIS/Draft CDCA Plan Amendment
April 2012

Alternatives
evaluating the use of distributed generation at individual sites through other initiatives (EO 13514 and DOI implementing actions).
Conservation and demand-side management alone are not sufficient to address all of California’s energy needs, and would not provide the renewable energy required to meet the California RPS requirements. Additionally, it does not respond to the BLM’s purpose and need or the goals established by the Energy Policy Act.
2.4 COMPARISON OF ALTERNATIVES
Table 2-5 shows a comparison of the features of each alternative.
Ocotillo Sol Project Page 2-23 Draft EIS/Draft CDCA Plan Amendment April 2012

TABLE 2-5 COMPARISON OF PROJECT COMPONENTS AND FEATURES
Project Component Alternative 1 Alternative 2 Alternative 3 Alternative 4 Alternative 5 Renewable Energy Generation n/a 15–20 MW 15–20 MW n/a n/a
Previously Undisturbed Areas to be Grubbed / Graded / Developed (acres)
Project site (permanent disturbance) Construction laydown area (temporary disturbance)
Subtotal Total Area Developed (acres)
Total Right-of-way Construction Length (approximate number of days)
Maximum Number of Workers (c)
n/a n/a n/a n/a n/a n/a n/a
100 15 115 115 115
240–340 270
100 2
102 102 102
240–340 270
n/a n/a n/a n/a n/a n/a n/a
n/a n/a n/a n/a n/a n/a n/a
Estimated Water Use Construction (acre-feet)
Potable Water (gallons per day) Panel Washing (acre-feet per year)
n/a n/a n/a
150 1,350
1–2
150 1,350
1–2
n/a n/a n/a
n/a n/a n/a
Project Features CDCA Plan Amendment
Solar Panels Access Roads
Transmission and Interconnect Operations and Maintenance Building
Site Communications Site Security and Fencing
Erosion Control and Stormwater Drainage Vegetation Treatment and Weed Management
Fire Protection Hazardous Materials
Waste Disposal Dust Control
No
No No No No No No No No No No
No
Yes
Yes Yes Yes Yes Yes Yes Yes Yes Yes Yes
Yes
Yes
Yes Yes Yes Yes Yes Yes Yes Yes Yes Yes
Yes
Yes – Suitable for solar
development
No No No No No No No No No No
No
Yes – Unsuitable for
solar development
No No No No No No No No No No
No
Alternatives
Page 2-24 Ocotillo Sol Project Draft EIS/Draft CDCA Plan Amendment
April 2012

Alternatives
2.4.1 PREFERRED ALTERNATIVE
The BLM has identified Alternative 3 as the Preferred Alternative. As described above, Alternative 3 would require the Applicant to manage laydown and staging primarily within the 100-acre Ocotillo Sol Project area. Two acres would temporarily be made available for construction workforce parking. The footprint of the Applicant’s proposed project would be reduced by 13 acres under the BLM’s Preferred Alternative. The Preferred Alternative would include all of the BMPs listed under Alternative 2. Because of the reduced footprint, the impacts to resources under Alternative 3 would be less than under Alternative 2. The Preferred Alternative is therefore also the environmentally preferred alternative.
As part of the Preferred Alternative, the CDCA Plan would be amended to identify all 102 acres of the ROW as suitable for solar development. The remaining 13 acres excluded from the ROW grant would be amended to be unsuitable for solar development.
Ocotillo Sol Project Page 2-25 Draft EIS/Draft CDCA Plan Amendment April 2012

Alternatives
This page is intentionally blank.
Page 2-26 Ocotillo Sol Project Draft EIS/Draft CDCA Plan Amendment
April 2012

Affected Environment
Ocotillo Sol Project Page 3-1 Draft EIS/Draft CDCA Plan Amendment April 2012
CHAPTER 3.0 AFFECTED ENVIRONMENT
3.1 INTRODUCTION AND OVERVIEW
This chapter provides a baseline description of the affected environment for purposes of the general impact assessment found in Chapter 4, Environmental Consequences. The baseline affected environment is defined as those conditions that exist at the time the BLM decides to approve, reject, or modify the Applicant’s proposed Ocotillo Sol Project. The description of key resources found within the existing environment of the project area will be used to evaluate and assess the impact of the alternatives presented in Chapter 2. Chapter 1 includes a description of the major federal (BLM and non-BLM) policies, plans, programs, and laws that would apply to the resources and resource uses described in Chapter 3. These policies and laws include FLPMA, NEPA, and the CDCA Plan (Chapter 1, Section 1.6).
Some resource values not impacted by the proposed action area are not discussed in this chapter unless the resource value would address the context for the effects analysis in Chapter 4. The following resource topics have been omitted from analysis based on the assessment of the presence of the resource in the proposed action area:
• Minerals—No mineral resources near the Ocotillo Sol Project area would be affected by the proposed project or alternatives.
• Livestock Grazing—Livestock grazing is not an allowed use within the Ocotillo Sol Project area.
• Wild Horse and Burro—No wild horse or burro herds are found within or near the Ocotillo Sol Project area.
3.2 AIR QUALITY
This section describes the existing condition of air quality related to criteria pollutants and air toxics in the Ocotillo Sol Project area. Motor vehicles are one of the leading sources of air pollution. In addition to these sources, other mobile sources include construction equipment, trains, and airplanes. Emission standards for mobile sources are established by federal and state agencies such as the EPA and the California Air Resources Board (CARB). In addition to mobile sources, stationary sources also contribute to air pollution. Stationary sources include gasoline stations, conventional power plants, dry cleaners, and other commercial and industrial sites. Local air pollution control or air quality management districts regulate stationary sources of air pollution.

Affected Environment
Page 3-2 Ocotillo Sol Project Draft EIS/Draft CDCA Plan Amendment
April 2012
The state of California is divided geographically into 15 air basins for regional management of air resources. Areas within each air basin are considered to share the same air masses and, therefore, are expected to have similar ambient air quality. The Ocotillo Sol Project area is within the Salton Sea Air Basin (SSAB; Figure 3.2-1 in Appendix A).
The following sections provide key details of the regulatory framework of the federal, state, and local agencies in charge of monitoring and controlling air pollutants. In addition, the discussion includes the measures being taken to achieve and maintain healthful air quality in the Ocotillo Sol Project area.
3.2.1 APPLICABLE REGULATIONS, PLANS, AND POLICIES/ MANAGEMENT GOALS
3.2.1.1 FEDERAL REGULATIONS
Ambient Air Quality Standards represent the maximum levels of background pollution considered safe, with an adequate margin of safety, to protect the public health and welfare. The federal Clean Air Act was enacted in 1970 and amended in 1977 and 1990 (42 USC 7401) to protect and enhance the quality of the nation’s air resources to benefit public health, welfare, and productivity. In 1971, the EPA developed primary and secondary NAAQS to achieve the purposes of Section 109 of the Clean Air Act (42 USC 7409).
Seven pollutants of primary concern (criteria pollutants) have been designated: ozone (O3), carbon monoxide (CO), sulfur dioxide (SO2), nitrogen dioxide (NO2), lead, and respirable particulate matter with aerodynamic diameters of less than 10 and 2.5 microns (PM10 and PM2.5, respectively). The primary NAAQS “in the judgment of the Administrator, based on such criteria and allowing an adequate margin of safety, are requisite to protect the public health,” and the secondary standards “protect the public welfare from any known or anticipated adverse effects associated with the presence of such air pollutant in the ambient air” (42 USC 7409[b][2]). The primary standards were established considering long-term exposure for the most sensitive groups in the general population (i.e., children, senior citizens, and people with breathing difficulties). The current NAAQS are presented in Table 3.2-1 below.

Affected Environment
Ocotillo Sol Project Page 3-3 Draft EIS/Draft CDCA Plan Amendment April 2012
TABLE 3.2-1 AMBIENT AIR QUALITY STANDARDS
Pollutant Averaging
Time
California Standards1
Concentration3 California Standards1
Method4
Federal Standards2
Primary3,5
Federal Standards2
Secondary3,6 Federal Standards2
Method7
Ozone (O3) 1 Hour 0.09 ppm (180 µg/m3)
Ultraviolet Photometry – Same as Primary Standard
Ultraviolet Photometry
Ozone (O3) 8 Hour 0.07 ppm (137 µg/m3)
Ultraviolet Photometry 0.075 ppm (147 µg/m3)
Same as Primary Standard
Ultraviolet Photometry
Respirable Particulate
Matter (PM10)
24 Hour 50 µg/m3 Gravimetric or Beta Attenuation
150 µg/m3 Same as Primary Standard
Inertial Separation and Gravimetric Analysis
Respirable Particulate
Matter (PM10)
Annual Arithmetic
Mean
20 µg/m3 Gravimetric or Beta Attenuation
– Same as Primary Standard
Inertial Separation and Gravimetric Analysis
Fine Particulate Matter (PM2.5)
24 Hour No Separate State Standard
No Separate State Standard
35 µg/m3 Same as Primary Standard
Inertial Separation and Gravimetric Analysis
Fine Particulate Matter (PM2.5)
Annual Arithmetic
Mean
12 µg/m3 Gravimetric or Beta Attenuation
15 µg/m3 Same as Primary Standard
Inertial Separation and Gravimetric Analysis
Carbon Monoxide
(CO)
1 Hour 20 ppm (23 mg/m3)
Non-dispersive Infrared Photometry
35 ppm (40 mg/m3)
– Non-dispersive Infrared Photometry
Carbon Monoxide
(CO)
8 Hour 9.0 ppm (10 mg/m3)
Non-dispersive Infrared Photometry
9 ppm (10 mg/m3)
– Non-dispersive Infrared Photometry

Affected Environment
Page 3-4 Ocotillo Sol Project Draft EIS/Draft CDCA Plan Amendment April 2012
TABLE 3.2-1 AMBIENT AIR QUALITY STANDARDS
Pollutant Averaging
Time
California Standards1
Concentration3 California Standards1
Method4
Federal Standards2
Primary3,5
Federal Standards2
Secondary3,6 Federal Standards2
Method7
Carbon Monoxide
(CO)
8 Hour (Lake Tahoe)
6 ppm (7 mg/m3)
Non-dispersive Infrared Photometry
– – Non-dispersive Infrared Photometry
Nitrogen Dioxide (NO2)
8 1 Hour 0.18 ppm
(339 µg/m3) Gas Phase Chemi-
luminescence 100 ppb
(188 µg/m3) – Gas Phase
Chemiluminescence
Nitrogen Dioxide (NO2)
8 Annual
Arithmetic Mean
0.030 ppm (57 µg/m3)
Gas Phase Chemi-luminescence
53 ppb (100 µg/m3)
Same as Primary Standard
Gas Phase Chemiluminescence
Sulfur Dioxide (SO2)
9 1 Hour 0.25 ppm
(655 µg/m3) Ultraviolet Fluorescence 75 ppb
(196 µg/m3) – Ultraviolet Fluorescence;
Spectrophotometry (Pararosaniline Method)
Sulfur Dioxide (SO2)
9 3 Hour – Ultraviolet Fluorescence – 0.5 ppm
(1300 µg/m3) Ultraviolet Fluorescence;
Spectrophotometry (Pararosaniline Method)
Sulfur Dioxide (SO2)
9 24 Hour 0.04 ppm
(105 µg/m3) Ultraviolet Fluorescence 0.14 ppm
(for certain areas)9
– Ultraviolet Fluorescence; Spectrophotometry
(Pararosaniline Method)
Sulfur Dioxide (SO2)
9 Annual
Arithmetic Mean
– Ultraviolet Fluorescence 0.030 ppm (for certain
areas)9
– Ultraviolet Fluorescence; Spectrophotometry
(Pararosaniline Method)
Lead10,11 30 Day Average
1.5 µg/m3 Atomic Absorption – – High Volume Sampler and Atomic Absorption
Lead10,11 Calendar Quarter
– Atomic Absorption 1.5 µg/m3 (for certain areas)11
Same as Primary Standard
High Volume Sampler and Atomic Absorption

Affected Environment
Page 3-5 Ocotillo Sol Project Draft EIS/Draft CDCA Plan Amendment April 2012
TABLE 3.2-1 AMBIENT AIR QUALITY STANDARDS
Pollutant Averaging
Time
California Standards1
Concentration3 California Standards1
Method4
Federal Standards2
Primary3,5
Federal Standards2
Secondary3,6 Federal Standards2
Method7
Lead10,11 Rolling 3-Month Average
– Atomic Absorption 0.15 µg/m3 Same as Primary Standard
High Volume Sampler and Atomic Absorption
Visibility Reducing Particles12
8 Hour See footnote 12 Beta Attenuation and Transmittance through
Filter Tape
No Federal Standards
No Federal Standards
No Federal Standards
Sulfates 24 Hour 25 µg/m3 Ion Chromatography No Federal Standards
No Federal Standards
No Federal Standards
Hydrogen Sulfide
1 Hour 0.03 ppm (42 µg/m3)
Ultraviolet Fluorescence No Federal Standards
No Federal Standards
No Federal Standards
Vinyl Chloride10
24 Hour 0.01 ppm (26 µg/m3)
Gas Chromatography No Federal Standards
No Federal Standards
No Federal Standards
SOURCE: CARB 2012a. ppm = parts per million; ppb = parts per billion; µg/m3 = micrograms per cubic meter; – = not applicable. 1California standards for ozone, carbon monoxide (except 8-hour Lake Tahoe), sulfur dioxide (1 and 24 hour), nitrogen dioxide, particulate matter (PM10, PM2.5, and visibility reducing particles), are values that are not to be exceeded. All others are not to be equaled or exceeded. California ambient air quality standards are listed in the Table of Standards in Section 70200 of Title 17 of the California Code of Regulations.
2National standards (other than ozone, particulate matter, and those based on annual arithmetic mean) are not to be exceeded more than once a year. The ozone standard is attained when the fourth highest 8-hour concentration measured at each site in a year, averaged over three years, is equal to or less than the standard. For PM10, the 24-hour standard is attained when the expected number of days per calendar year with a 24-hour average concentration above 150 µg/m3 is equal to or less than one. For PM2.5, the 24-hour standard is attained when 98 percent of the daily concentrations, averaged over three years, are equal to or less than the standard. Contact the U.S. EPA for further clarification and current national policies.
3Concentration expressed first in units in which it was promulgated. Equivalent units given in parentheses are based upon a reference temperature of 25°C and a reference pressure of 760 torr. Most measurements of air quality are to be corrected to a reference temperature of 25°C and a reference pressure of 760 torr; ppm in this table refers to ppm by volume, or micromoles of pollutant per mole of gas.
4Any equivalent measurement method which can be shown to the satisfaction of the Air Resources Board to give equivalent results at or near the level of the air quality standard may be used.
5National Primary Standards: The levels of air quality necessary, with an adequate margin of safety to protect the public health. 6National Secondary Standards: The levels of air quality necessary to protect the public welfare from any known or anticipated adverse effects of a pollutant.

Affected Environment
Page 3-6 Ocotillo Sol Project Draft EIS/Draft CDCA Plan Amendment April 2012
7Reference method as described by the EPA. An “equivalent method” of measurement may be used but must have a “consistent relationship to the reference method” and must be approved by the EPA.
8To attain the 1-hour national standard, the 3-year average of the annual 98th percentile of the 1-hour daily maximum concentrations at each site must not exceed 100 ppb. Note that the national standards are in units of parts per billion (ppb). California standards are in units of parts per million (ppm). To directly compare the national standards to the California standards the units can be converted from ppb to ppm. In this case, the national standards of 53 ppb and 100 ppb are identical to 0.053 ppm and 0.100 ppm, respectively.
9On June 2, 2010, a new 1-hour SO2 standard was established and the existing 24-hour and annual primary standards were revoked. To attain the 1-hour national standard, the 3-year average of the annual 99th percentile of the 1-hour daily maximum concentrations at each site must not exceed 75 ppb. The 1971 SO2 national standards (24-hour and annual) remain in effect until one year after an area is designated for the 2010 standard, except that in areas designated nonattainment for the 1971 standards, the 1971 standards remain in effect until implementation plans to attain or maintain the 2010 standards are approved.
Note that the 1-hour national standard is in units of parts per billion (ppb). California standards are in units of parts per million (ppm). To directly compare the 1-hour national standard to the California standard the units can be converted to ppm. In this case, the national standard of 75 ppb is identical to 0.075 ppm.
10The ARB has identified lead and vinyl chloride as ‘toxic air contaminants’ with no threshold level of exposure for adverse health effects determined. These actions allow for the implementation of control measures at levels below the ambient concentrations specified for these pollutants.
11The national standard for lead was revised on October 15, 2008 to a rolling 3-month average. The 1978 lead standard (1.5 μg/m3 as a quarterly average) remains in effect until one year after an area is designated for the 2008 standard, except that in areas designated nonattainment for the 1978 standard, the 1978 standard remains in effect until implementation plans to attain or maintain the 2008 standard are approved.
12In 1989, the ARB converted both the general statewide 10-mile visibility standard and the Lake Tahoe 30-mile visibility standard to instrumental equivalents, which are “extinction of 0.23 per kilometer” and “extinction of 0.07 per kilometer” for the statewide and Lake Tahoe Air Basin standards, respectively.

Affected Environment
Ocotillo Sol Project Page 3-7 Draft EIS/Draft CDCA Plan Amendment April 2012
3.2.1.2 FEDERAL CLEAN AIR ACT CONFORMITY
The Clean Air Act Amendments of 1977 (42 USC 7401, et seq.) state that the federal government is prohibited from engaging in, supporting, providing financial assistance for, licensing, permitting, or approving any activity that does not conform to an applicable SIP. General conformity applies to all federal actions that do not include Federal Highway Administration or Federal Transit Administration projects as defined in 40 CFR 93.101. Separate regulations for transportation conformity cover federal actions related to transportation plans, programs, and projects developed, funded, or approved under Title 23 of the USC or the Federal Transit Act (49 USC 1601, et seq.). The Applicant’s proposed Ocotillo Sol Project would fall under the general conformity requirements.
The 1990 federal Clean Air Act Amendments contain provisions requiring federal agencies to ensure that actions undertaken in nonattainment or attainment-maintenance areas are consistent with applicable SIPs. Locally, the ICAPCD has adopted Rule 925, General Conformity. Rule 925 establishes the conformity criteria and procedures necessary to ensure that federal actions conform to the SIP and meet the provisions of the Clean Air Act. In general, this rule ensures that all criteria air pollutant and reactive organic gas emissions are specifically identified and accounted for in the SIP’s attainment or maintenance demonstration, conform to a SIP’s purpose of eliminating or reducing the severity and number of violations of the NAAQS, and achieving expeditious attainment of such standards.
The process of determining whether or not a federal action is consistent with the applicable SIP is called a conformity determination. On November 30, 1993, the EPA promulgated its rules for determining general conformity of federal actions as required by Clean Air Act Section 176(c). To demonstrate conformity with a local SIP, a project must clearly demonstrate that it does not:
• cause or contribute to any new violation of any standard in force for the area;
• interfere with provisions in the applicable SIP for maintenance or attainment of air quality standards;
• increase the frequency or severity of any existing violation of any federal standard; or
• delay timely attainment of any standard, any interim emission reduction, or other milestones included in the SIP for air quality.
The EPA has developed specific procedures for conformity determinations for federal actions, which include preparing an assessment of emissions associated with the project based on the latest and most accurate emissions estimating techniques. A determination of conformity with the applicable SIP is required for each criteria pollutant and is based on the total direct and indirect emissions in a nonattainment or attainment-maintenance area caused by the action exceeding specified de minimis levels. The de minimis threshold levels for requiring a full conformity analysis and the amount of emissions that could result in significant impacts are based on the attainment status of each criteria pollutant in the applicable nonattainment areas. These threshold levels are used to determine the potential significance of activities on BLM-administered lands. The general conformity de minimis thresholds are defined in 40 CFR 93.153(b) and ICAPCD Rule 925, and are shown in Table 3.2-2.
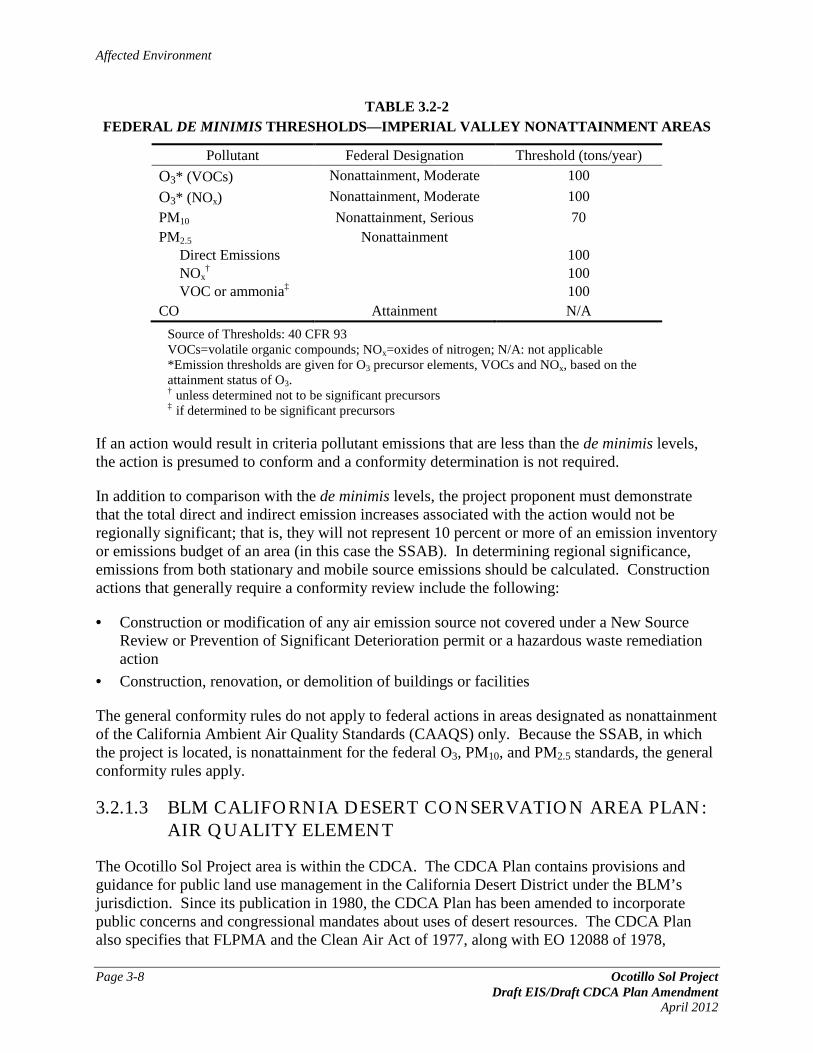
Affected Environment
Page 3-8 Ocotillo Sol Project Draft EIS/Draft CDCA Plan Amendment
April 2012
TABLE 3.2-2 FEDERAL DE MINIMIS THRESHOLDS—IMPERIAL VALLEY NONATTAINMENT AREAS
Pollutant Federal Designation Threshold (tons/year)
O3* (VOCs) Nonattainment, Moderate 100
O3* (NOx) Nonattainment, Moderate 100
PM10 Nonattainment, Serious 70 PM2.5 Direct Emissions NOx
†
VOC or ammonia‡
Nonattainment 100 100 100
CO Attainment N/A
Source of Thresholds: 40 CFR 93 VOCs=volatile organic compounds; NOx=oxides of nitrogen; N/A: not applicable *Emission thresholds are given for O3 precursor elements, VOCs and NOx, based on the attainment status of O3. † unless determined not to be significant precursors ‡ if determined to be significant precursors
If an action would result in criteria pollutant emissions that are less than the de minimis levels, the action is presumed to conform and a conformity determination is not required.
In addition to comparison with the de minimis levels, the project proponent must demonstrate that the total direct and indirect emission increases associated with the action would not be regionally significant; that is, they will not represent 10 percent or more of an emission inventory or emissions budget of an area (in this case the SSAB). In determining regional significance, emissions from both stationary and mobile source emissions should be calculated. Construction actions that generally require a conformity review include the following:
• Construction or modification of any air emission source not covered under a New Source Review or Prevention of Significant Deterioration permit or a hazardous waste remediation action
• Construction, renovation, or demolition of buildings or facilities
The general conformity rules do not apply to federal actions in areas designated as nonattainment of the California Ambient Air Quality Standards (CAAQS) only. Because the SSAB, in which the project is located, is nonattainment for the federal O3, PM10, and PM2.5 standards, the general conformity rules apply.
3.2.1.3 BLM CALIFORNIA DESERT CONSERVATION AREA PLAN: AIR QUALITY ELEMENT
The Ocotillo Sol Project area is within the CDCA. The CDCA Plan contains provisions and guidance for public land use management in the California Desert District under the BLM’s jurisdiction. Since its publication in 1980, the CDCA Plan has been amended to incorporate public concerns and congressional mandates about uses of desert resources. The CDCA Plan also specifies that FLPMA and the Clean Air Act of 1977, along with EO 12088 of 1978,

Affected Environment
Ocotillo Sol Project Page 3-9 Draft EIS/Draft CDCA Plan Amendment April 2012
“Federal Compliance with Pollution Control Standards,” require the BLM and other federal land-management agencies to preserve and protect air quality values on federal lands.
The CDCA Multiple Use Class Guidelines require that all land uses within the CDCA be managed to protect air quality and visibility in accordance with the Class II objectives of Subchapter I, Part C of the Clean Air Act Amendments, unless the state of California designates land uses in another class as a result of BLM air quality management plan. Additionally, the CDCA Plan considers air quality monitoring in the CDCA Plan elements related to wildlife and energy production and utility corridors as one of the requirements for implementation.
3.2.1.4 STATE REGULATIONS
The EPA allows states the option to develop stricter air quality standards. California generally has set more stringent limits on the seven criteria pollutants (see Table 3.2-1). In addition to the federal criteria pollutants, the CAAQS also specify standards for visibility reducing particles, sulfates, hydrogen sulfide, and vinyl chloride (see Table 3.2-1).
The California Clean Air Act, also known as the Sher Bill, or Assembly Bill (AB) 2595, became effective on January 1, 1989. The California Clean Air Act requires that air districts implement regulations to reduce emissions from mobile sources through the adoption and enforcement of transportation control measures. The California Clean Air Act requires that a district must (South Coast Air Quality Management District [SCAQMD] 2007):
• demonstrate the overall effectiveness of the air quality program;
• reduce nonattainment pollutants at a rate of 5 percent per year, or include all feasible measures and an expeditious adoption schedule;
• reduce population exposure to severe nonattainment pollutants according to a prescribed schedule; and
• rank control measures by cost-effectiveness.
3.2.1.5 STATE IMPLEMENTATION PLAN
The 1997 Amendments to the Clean Air Act require states with air quality that did not meet the NAAQS to develop and maintain an SIP. The SIP is a collection of documents that set forth the state’s strategies for achieving the federal air quality standards. In California, the individual air districts are responsible for preparing and implementing the portion of the SIP applicable to their area of jurisdiction. Air district plans constitute a federally enforceable definition of the approach (or plan) of the state and schedule for the attainment of the NAAQS. Air quality management areas are designated as attainment, nonattainment, or unclassified depending on whether or not they achieve the NAAQS and CAAQS. In addition, California can also designate areas as transitional, which is an area that is close to attaining the standard for a pollutant. Because the NAAQS and CAAQS are different in many cases, it is possible for an area to be designated as attainment by EPA (meets the NAAQS) and nonattainment by the CARB (does not meet the CAAQS) for the same pollutant. An area can also be designated as attainment for one pollutant (e.g., NO2) and nonattainment for others (e.g., O3 and PM10).

Affected Environment
Page 3-10 Ocotillo Sol Project Draft EIS/Draft CDCA Plan Amendment
April 2012
There are numerous classifications of the nonattainment designation, depending on the severity of nonattainment. For example, the O3 nonattainment designation has seven subclasses: transitional, marginal, moderate, serious, severe-15, severe-17, and extreme. Areas that were designated as nonattainment in the past, but have since achieved the NAAQS, are classified as attainment-maintenance. The maintenance classification remains in effect for 20 years from the date that the area is determined by EPA to meet the NAAQS. Areas that lack monitoring data are designated as unclassified areas and treated as attainment areas for regulatory purposes.
In Imperial County, the ICAPCD is the agency responsible for protecting public health and welfare through the administration of federal and state air quality laws, regulations, and policies. The ICAPCD adopts rules, regulations, and programs to attain federal and state air quality standards. The ICAPCD also appropriates funds (including permit fees) to achieve these objectives. Included in the tasks for ICAPCD are the monitoring of air pollution, preparation of the SIP for Imperial County, and promulgation of Rules and Regulations. The Imperial County SIP includes strategies and tactics to be used to attain the federal O3 and particulate standards in the county. The Rules and Regulations include procedures and requirements to control the emission of pollutants and to prevent adverse impacts (ICAPCD 2012a).
3.2.1.6 TOXIC AIR CONTAMINANTS
The federal and state laws and regulations also define a group of pollutants called “hazardous air pollutants,” “toxic air contaminants,” or “air toxics.” These pollutants are regulated by the National Emissions Standards for Hazardous Air Pollutants section of the Clean Air Act, various state laws and regulations, state air toxics acts (e.g., the AB 1807, AB 2588, and SB 1731 programs), and ICAPCD Regulation X. In urban areas, toxic air contaminants are a concern because of the high concentration of people living close to large sources of emissions. The combination of toxic emissions from vehicles, industry, and multiple area sources could create an unhealthy mix of pollutants that varies based on factors such as geography, industry, and population. Exposure to toxic air pollutants may cause or contribute to cancer, birth defects, genetic damage, and other adverse health effects.
3.2.2 COMPLIANCE WITH AIR QUALITY STANDARDS
The CARB monitors ambient air quality at approximately 250 air quality monitoring stations across the state. Air quality monitoring stations usually measure pollutant concentrations 10 feet above ground level; therefore, air quality is often referred to in terms of ground-level concentrations. Factors affecting ground-level pollutant concentrations include the rate at which pollutants are emitted to the atmosphere, height from which they are released, physical combination of emissions from various sources, formation of secondary pollutants, interaction of pollutants with topographic features, and meteorological conditions. Meteorological parameters that affect pollutant dispersion the most are wind speed and direction, atmospheric stability, mixing height, and temperature.
Ambient criteria air pollutant concentrations in the SSAB are measured at nine air quality monitoring stations operated by the CARB, the ICAPCD, the National Park Service, or the SCAQMD (see Figure 3.2-1 in Appendix A for approximate locations). Not all pollutants are monitored at all stations. The ICAPCD currently maintains five air quality monitoring stations.

Affected Environment
Ocotillo Sol Project Page 3-11 Draft EIS/Draft CDCA Plan Amendment April 2012
These stations are in El Centro, Brawley, Calexico–Ethel Street, Westmorland, and Niland. The ICAPCD conducts yearly and quarterly inspections of the monitoring stations (ICAPCD 2008b). The air quality monitoring stations operating near the Ocotillo Sol Project area are the El Centro–9th Street station, approximately 10 miles to the northeast, and the Calexico–Ethel Street station approximately 14 miles to the southeast. These two stations monitor O3, CO, NO2, PM10, and PM2.5. The Calexico–Ethel Street station also monitors SO2 and lead.
3.2.3 CLIMATE AND METEOROLOGY
The Ocotillo Sol Project area is in the Imperial County portion of the SSAB within the Lower Colorado River Valley subdivision of the Sonoran Desert. The climate is sub-tropical and characterized by low annual precipitation, very hot summers, mild winters, high evaporation rates, low humidity, and strong temperature inversions. One of the main determinants of the regional climatology is a semi-permanent high-pressure area (the Pacific High) in the eastern Pacific Ocean. In the summer, this pressure center is well to the north, causing storm tracks to be directed generally north of California. This high-pressure cell maintains clear skies for much of the year. When the Pacific High moves southward during the winter, weakened low-pressure storms and the orographic barrier bring little rainfall. The combination of subsiding air, protective mountains, and distance from the ocean markedly limits precipitation (ICAPCD 2008a).
Rainfall occasionally occurs in the summer in the form of thunderstorms resulting from monsoonal air flows bringing together upper level moisture from the Gulf of Mexico and lower level moisture from the Gulf of California. In Imperial County, annual precipitation fluctuates widely from about 1 to 6 inches, averaging 2.97 inches annually (Imperial County 2012). Temperature ranges from lows around 30 degrees Fahrenheit (°F) in January to highs around 110°F in July and August. Mean low temperature is 55°F, and mean high temperature is 90°F (Imperial County 2012). Winter daytime highs are in the 60°F–70°F range from December through March.
The flat terrain of Imperial Valley and the strong temperature differentials created by intense solar heating produce moderate winds and deep thermal convection. The Imperial Valley region occasionally experiences periods of high winds. Winter winds approach from the northwest. Summer winds are more variable, but often blow from the southeast. Wind events can cause the suspension of large amounts of dust and other particulate matter in the air.
A common atmospheric condition known as a temperature inversion affects air quality in the Ocotillo Sol Project area. An inversion acts like a lid, keeping normal atmospheric convection from penetrating through the inversion. Several weather-related effects result, including the trapping and buildup of pollutants below the inversion. Highest or worst-case O3 levels are often associated with the presence of this type of inversion. Although Imperial County experiences temperature inversions almost daily, these inversions are usually broken during the day, allowing pollutants to more easily disperse. Subsidence inversions are common from November through June, but appear to be relatively rare from July through October (ICAPCD 2008a).
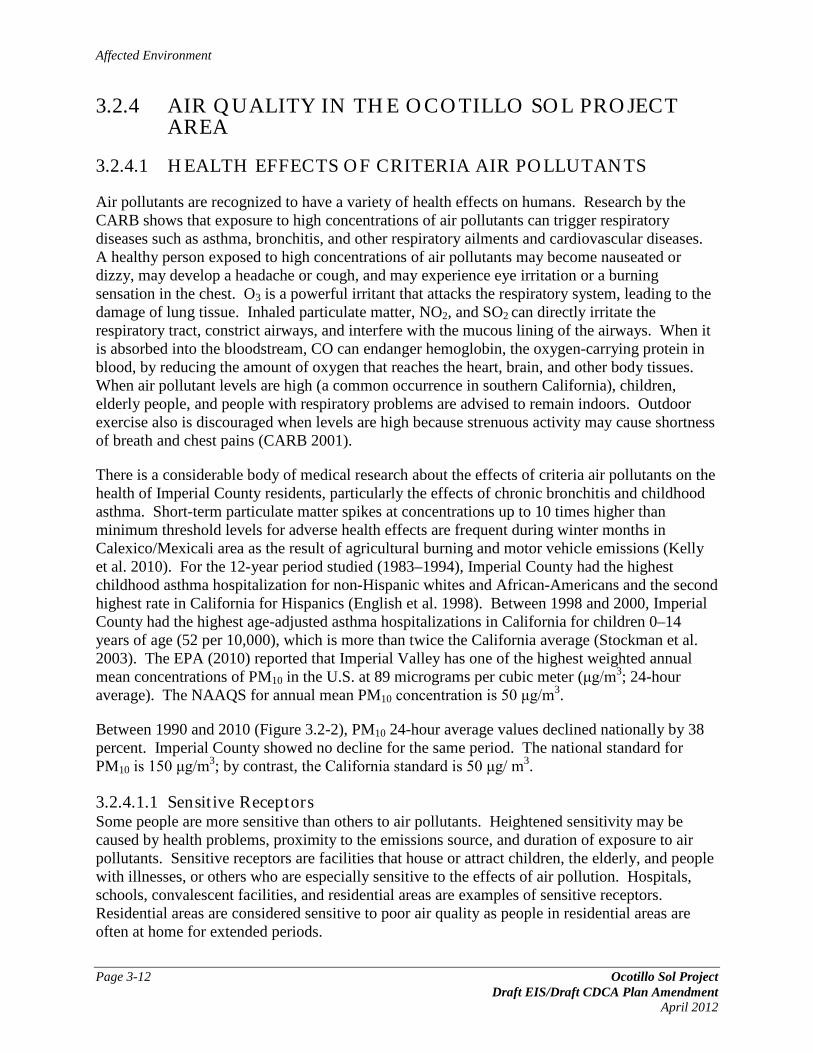
Affected Environment
Page 3-12 Ocotillo Sol Project Draft EIS/Draft CDCA Plan Amendment
April 2012
3.2.4 AIR QUALITY IN THE OCOTILLO SOL PROJECT AREA
3.2.4.1 HEALTH EFFECTS OF CRITERIA AIR POLLUTANTS
Air pollutants are recognized to have a variety of health effects on humans. Research by the CARB shows that exposure to high concentrations of air pollutants can trigger respiratory diseases such as asthma, bronchitis, and other respiratory ailments and cardiovascular diseases. A healthy person exposed to high concentrations of air pollutants may become nauseated or dizzy, may develop a headache or cough, and may experience eye irritation or a burning sensation in the chest. O3 is a powerful irritant that attacks the respiratory system, leading to the damage of lung tissue. Inhaled particulate matter, NO2, and SO2 can directly irritate the respiratory tract, constrict airways, and interfere with the mucous lining of the airways. When it is absorbed into the bloodstream, CO can endanger hemoglobin, the oxygen-carrying protein in blood, by reducing the amount of oxygen that reaches the heart, brain, and other body tissues. When air pollutant levels are high (a common occurrence in southern California), children, elderly people, and people with respiratory problems are advised to remain indoors. Outdoor exercise also is discouraged when levels are high because strenuous activity may cause shortness of breath and chest pains (CARB 2001).
There is a considerable body of medical research about the effects of criteria air pollutants on the health of Imperial County residents, particularly the effects of chronic bronchitis and childhood asthma. Short-term particulate matter spikes at concentrations up to 10 times higher than minimum threshold levels for adverse health effects are frequent during winter months in Calexico/Mexicali area as the result of agricultural burning and motor vehicle emissions (Kelly et al. 2010). For the 12-year period studied (1983–1994), Imperial County had the highest childhood asthma hospitalization for non-Hispanic whites and African-Americans and the second highest rate in California for Hispanics (English et al. 1998). Between 1998 and 2000, Imperial County had the highest age-adjusted asthma hospitalizations in California for children 0–14 years of age (52 per 10,000), which is more than twice the California average (Stockman et al. 2003). The EPA (2010) reported that Imperial Valley has one of the highest weighted annual mean concentrations of PM10 in the U.S. at 89 micrograms per cubic meter (μg/m3; 24-hour average). The NAAQS for annual mean PM10 concentration is 50 μg/m3.
Between 1990 and 2010 (Figure 3.2-2), PM10 24-hour average values declined nationally by 38 percent. Imperial County showed no decline for the same period. The national standard for PM10 is 150 μg/m3; by contrast, the California standard is 50 μg/ m3.
3.2.4.1.1 Sensitive Receptors Some people are more sensitive than others to air pollutants. Heightened sensitivity may be caused by health problems, proximity to the emissions source, and duration of exposure to air pollutants. Sensitive receptors are facilities that house or attract children, the elderly, and people with illnesses, or others who are especially sensitive to the effects of air pollution. Hospitals, schools, convalescent facilities, and residential areas are examples of sensitive receptors. Residential areas are considered sensitive to poor air quality as people in residential areas are often at home for extended periods.

Affected Environment
Ocotillo Sol Project Page 3-13 Draft EIS/Draft CDCA Plan Amendment April 2012
Figure 3.2-2. Imperial County PM10 Emissions for 1990 to 2010
No sensitive receptors are in the immediate vicinity of the Ocotillo Sol Project area. The nearest residences to the project site occur approximately 1 mile to the north, 1.75 miles to the east, and over 2 miles to the southeast.
3.2.4.2 EXISTING AIR QUALITY
Air quality is defined by ambient air concentrations of the criteria pollutants specified by the NAAQS and CAAQS. Pollutant emissions typically refer to the amount of pollutants or pollutant precursors introduced into the atmosphere by a source or group of sources. Pollutant emissions contribute to the ambient air concentrations of criteria pollutants, either by directly affecting the pollutant concentrations measured in the ambient air or by interacting in the atmosphere to form criteria pollutants. Primary pollutants, such as CO, SO2, lead, and some particulates, are emitted directly into the atmosphere from emission sources. Secondary pollutants, such as O3, NO2, and some particulates, are formed through atmospheric chemical reactions that are influenced by meteorology, ultraviolet light, and other atmospheric processes. In general, emissions such as reactive organic gases and oxides of nitrogen (NOx) are “precursors” to secondary pollutants in the atmosphere such as O3. These precursor gases are evaluated to control the level of criteria pollutant in the ambient air.
Table 3.2-3 summarizes the air quality data in the SSAB overall during the years 2006 to 2010.
Air pollutants of primary concern in the Imperial Valley are O3, PM10, and PM2.5.

Affected Environment
Page 3-14 Ocotillo Sol Project Draft EIS/Draft CDCA Plan Amendment
April 2012
This page is intentionally blank.
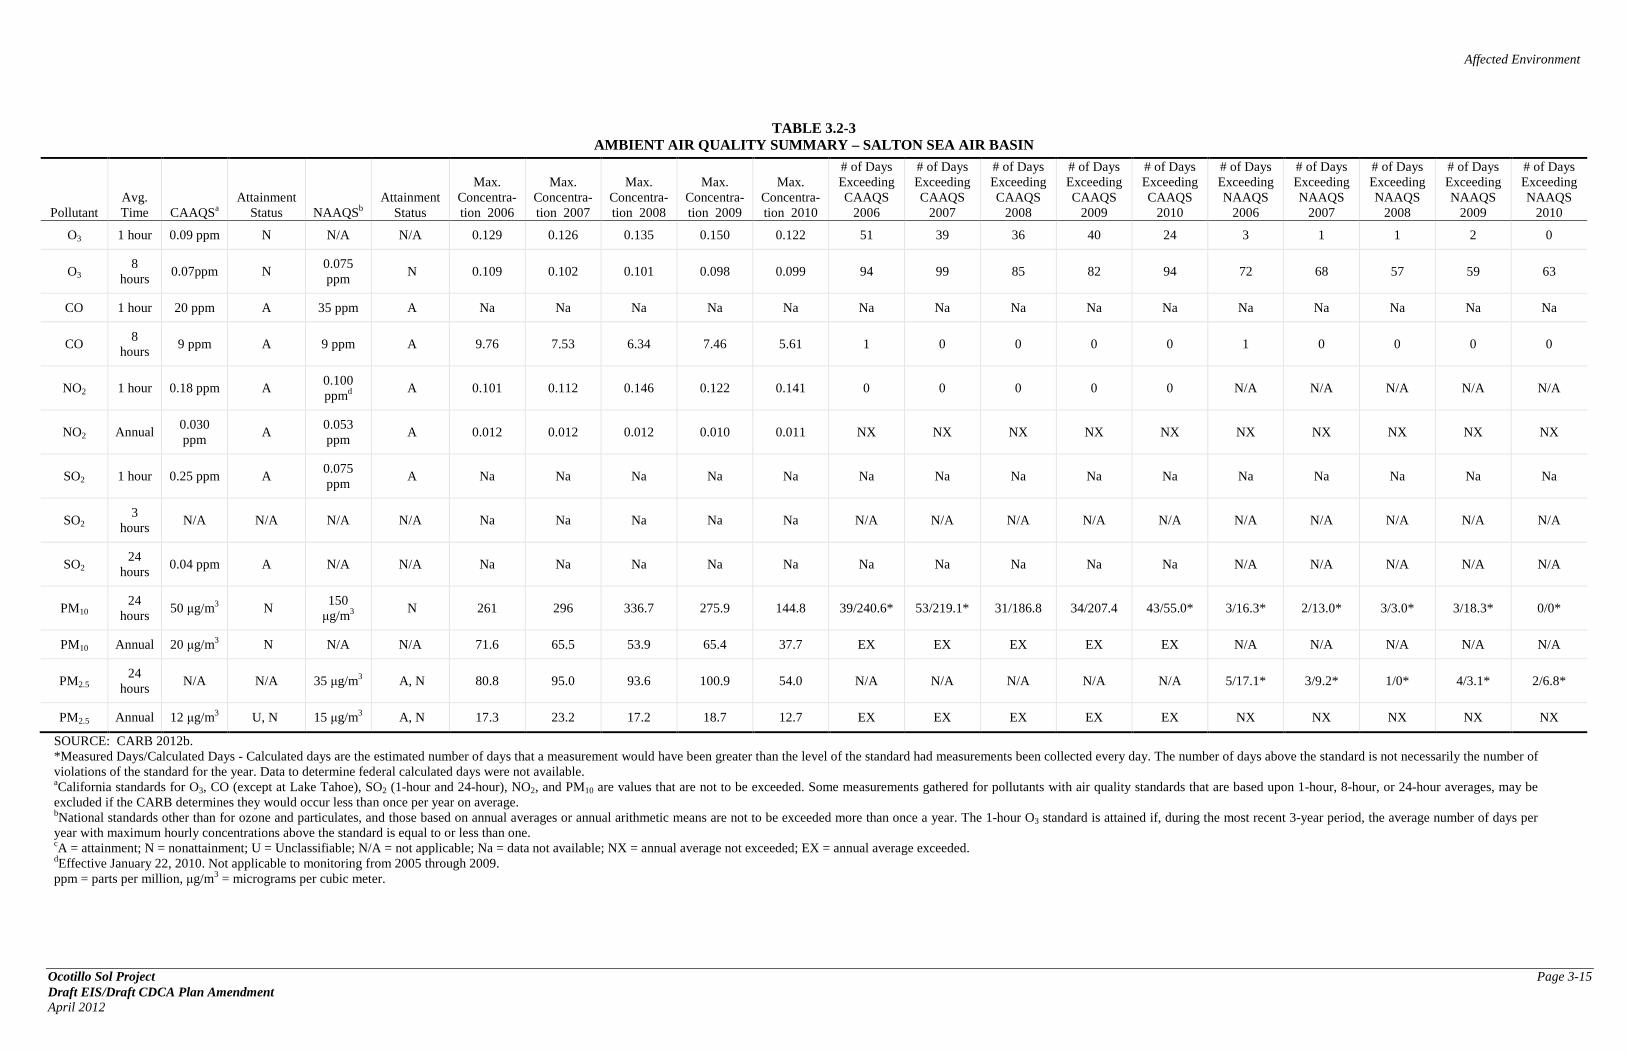
Affected Environment
Ocotillo Sol Project Page 3-15 Draft EIS/Draft CDCA Plan Amendment April 2012
TABLE 3.2-3 AMBIENT AIR QUALITY SUMMARY – SALTON SEA AIR BASIN
Pollutant Avg. Time CAAQSa
Attainment Status NAAQSb
Attainment Status
Max. Concentra-tion 2006
Max. Concentra-tion 2007
Max. Concentra-tion 2008
Max. Concentra-tion 2009
Max. Concentra-tion 2010
# of Days Exceeding CAAQS
2006
# of Days Exceeding CAAQS
2007
# of Days Exceeding CAAQS
2008
# of Days Exceeding CAAQS
2009
# of Days Exceeding CAAQS
2010
# of Days Exceeding NAAQS
2006
# of Days Exceeding NAAQS
2007
# of Days Exceeding NAAQS
2008
# of Days Exceeding NAAQS
2009
# of Days Exceeding NAAQS
2010
O3 1 hour 0.09 ppm N N/A N/A 0.129 0.126 0.135 0.150 0.122 51 39 36 40 24 3 1 1 2 0
O3 8
hours 0.07ppm N
0.075 ppm
N 0.109 0.102 0.101 0.098 0.099 94 99 85 82 94 72 68 57 59 63
CO 1 hour 20 ppm A 35 ppm A Na Na Na Na Na Na Na Na Na Na Na Na Na Na Na
CO 8
hours 9 ppm A 9 ppm A 9.76 7.53 6.34 7.46 5.61 1 0 0 0 0 1 0 0 0 0
NO2 1 hour 0.18 ppm A 0.100 ppmd
A 0.101 0.112 0.146 0.122 0.141 0 0 0 0 0 N/A N/A N/A N/A N/A
NO2 Annual 0.030 ppm
A 0.053 ppm
A 0.012 0.012 0.012 0.010 0.011 NX NX NX NX NX NX NX NX NX NX
SO2 1 hour 0.25 ppm A 0.075 ppm
A Na Na Na Na Na Na Na Na Na Na Na Na Na Na Na
SO2 3
hours N/A N/A N/A N/A Na Na Na Na Na N/A N/A N/A N/A N/A N/A N/A N/A N/A N/A
SO2 24
hours 0.04 ppm A N/A N/A Na Na Na Na Na Na Na Na Na Na N/A N/A N/A N/A N/A
PM10 24
hours 50 μg/m3 N
150 μg/m3
N 261 296 336.7 275.9 144.8 39/240.6* 53/219.1* 31/186.8 34/207.4 43/55.0* 3/16.3* 2/13.0* 3/3.0* 3/18.3* 0/0*
PM10 Annual 20 μg/m3 N N/A N/A 71.6 65.5 53.9 65.4 37.7 EX EX EX EX EX N/A N/A N/A N/A N/A
PM2.5 24
hours N/A N/A 35 μg/m3 A, N 80.8 95.0 93.6 100.9 54.0 N/A N/A N/A N/A N/A 5/17.1* 3/9.2* 1/0* 4/3.1* 2/6.8*
PM2.5 Annual 12 μg/m3 U, N 15 μg/m3 A, N 17.3 23.2 17.2 18.7 12.7 EX EX EX EX EX NX NX NX NX NX
SOURCE: CARB 2012b. *Measured Days/Calculated Days - Calculated days are the estimated number of days that a measurement would have been greater than the level of the standard had measurements been collected every day. The number of days above the standard is not necessarily the number of violations of the standard for the year. Data to determine federal calculated days were not available. aCalifornia standards for O3, CO (except at Lake Tahoe), SO2 (1-hour and 24-hour), NO2, and PM10 are values that are not to be exceeded. Some measurements gathered for pollutants with air quality standards that are based upon 1-hour, 8-hour, or 24-hour averages, may be excluded if the CARB determines they would occur less than once per year on average. bNational standards other than for ozone and particulates, and those based on annual averages or annual arithmetic means are not to be exceeded more than once a year. The 1-hour O3 standard is attained if, during the most recent 3-year period, the average number of days per year with maximum hourly concentrations above the standard is equal to or less than one. cA = attainment; N = nonattainment; U = Unclassifiable; N/A = not applicable; Na = data not available; NX = annual average not exceeded; EX = annual average exceeded. dEffective January 22, 2010. Not applicable to monitoring from 2005 through 2009. ppm = parts per million, μg/m3 = micrograms per cubic meter.

Affected Environment
Page 3-16 Ocotillo Sol Project Draft EIS/Draft CDCA Plan Amendment
April 2012
This page is intentionally blank.

Affected Environment
Ocotillo Sol Project Page 3-17 Draft EIS/Draft CDCA Plan Amendment April 2012
3.2.4.2.1 Federal Standards Table 3.2-4 shows the number of days above the national standards at the Imperial Valley monitoring stations for the period 2006 through 2010 for the three criteria pollutants of concern. The 2009 Imperial County PM10 SIP notes that the particulate exceedances for the period 2006 through 2008 were due either to high wind events or cross-border pollutant transport from Mexico (ENVIRON 2009).
TABLE 3.2-4 NUMBER OF DAYS ABOVE NATIONAL STANDARDS IN IMPERIAL VALLEY,
CALIFORNIA
Monitoring Station 2006 2007 2008 2009 2010 O3 (2008 8-hour standard)
Brawley–220 Main Street 0 0 0 * * Calexico–Ethel Street 2 9 7 4 2 El Centro–9th Street 26 8 2 11 10 Niland–English Road 3 7 3 5 0 Westmorland–West 1st Street 21 17 6 7 2
PM10 (24-hour standard)** Brawley–220 Main Street 0 13.0 0 18.8 0 Calexico–Ethel Street 6.6 6.1 0 18.3 0 El Centro–9th Street 0 7 0 13.1 0 Niland–English Road 0 3.5 0 6.1 0 Westmorland–West 1st Street 7.1 14 0 6.1 0
PM2.5 (24-hour standard)** Brawley–220 Main Street * * 0 * * Calexico–Ethel Street 17.1 9.2 * * 6.8 El Centro–9th Street 0 0 * 3.1 0
* There were insufficient (or no) data available to determine the value. **Measurements are usually collected every six days. Estimated days mathematically estimate how many days concentrations would have been greater than the level of the standard had each day been monitored. Source: CARB 2012b.
The SSAB is in attainment of all federal pollutant standards except for O3, PM10, and PM2.5. The Imperial Valley Planning Area in Imperial County, which includes the Ocotillo Sol Project area, is a Serious PM10 Nonattainment area (Figure 3.2-3 in Appendix A).
A portion of south-central Imperial County, including the Ocotillo Sol Project area, is Nonattainment for the PM2.5 24-hour standard (Figure 3.2-4 in Appendix A).
The Imperial County portion of the SSAB, including the Ocotillo Sol Project area, is a Moderate 8-hour O3 Nonattainment area under Subpart 2 (Figure 3.2-5 in Appendix A).
Under Subpart 2, consistent with Section 182 of the Clean Air Act, the maximum period of attainment from the effective date of designation for areas designated as nonattainment is as shown in Table 3.2-5 (69 Federal Register [FR] 23951).
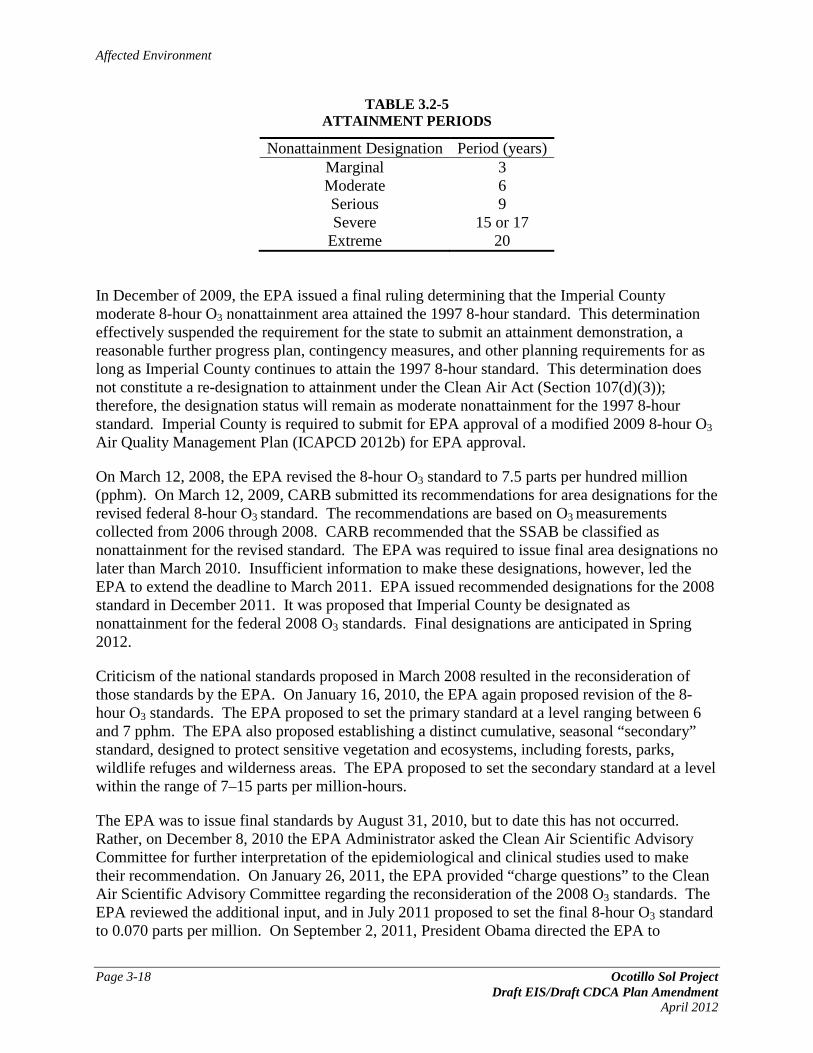
Affected Environment
Page 3-18 Ocotillo Sol Project Draft EIS/Draft CDCA Plan Amendment
April 2012
TABLE 3.2-5 ATTAINMENT PERIODS
Nonattainment Designation Period (years) Marginal 3 Moderate 6 Serious 9 Severe 15 or 17
Extreme 20
In December of 2009, the EPA issued a final ruling determining that the Imperial County moderate 8-hour O3 nonattainment area attained the 1997 8-hour standard. This determination effectively suspended the requirement for the state to submit an attainment demonstration, a reasonable further progress plan, contingency measures, and other planning requirements for as long as Imperial County continues to attain the 1997 8-hour standard. This determination does not constitute a re-designation to attainment under the Clean Air Act (Section 107(d)(3)); therefore, the designation status will remain as moderate nonattainment for the 1997 8-hour standard. Imperial County is required to submit for EPA approval of a modified 2009 8-hour O3 Air Quality Management Plan (ICAPCD 2012b) for EPA approval.
On March 12, 2008, the EPA revised the 8-hour O3 standard to 7.5 parts per hundred million (pphm). On March 12, 2009, CARB submitted its recommendations for area designations for the revised federal 8-hour O3 standard. The recommendations are based on O3 measurements collected from 2006 through 2008. CARB recommended that the SSAB be classified as nonattainment for the revised standard. The EPA was required to issue final area designations no later than March 2010. Insufficient information to make these designations, however, led the EPA to extend the deadline to March 2011. EPA issued recommended designations for the 2008 standard in December 2011. It was proposed that Imperial County be designated as nonattainment for the federal 2008 O3 standards. Final designations are anticipated in Spring 2012.
Criticism of the national standards proposed in March 2008 resulted in the reconsideration of those standards by the EPA. On January 16, 2010, the EPA again proposed revision of the 8-hour O3 standards. The EPA proposed to set the primary standard at a level ranging between 6 and 7 pphm. The EPA also proposed establishing a distinct cumulative, seasonal “secondary” standard, designed to protect sensitive vegetation and ecosystems, including forests, parks, wildlife refuges and wilderness areas. The EPA proposed to set the secondary standard at a level within the range of 7–15 parts per million-hours.
The EPA was to issue final standards by August 31, 2010, but to date this has not occurred. Rather, on December 8, 2010 the EPA Administrator asked the Clean Air Scientific Advisory Committee for further interpretation of the epidemiological and clinical studies used to make their recommendation. On January 26, 2011, the EPA provided “charge questions” to the Clean Air Scientific Advisory Committee regarding the reconsideration of the 2008 O3 standards. The EPA reviewed the additional input, and in July 2011 proposed to set the final 8-hour O3 standard to 0.070 parts per million. On September 2, 2011, President Obama directed the EPA to

Affected Environment
Ocotillo Sol Project Page 3-19 Draft EIS/Draft CDCA Plan Amendment April 2012
withdraw this draft O3 NAAQS. Therefore, the EPA continues to implement the 2008 standards set during the previous administration while the ongoing five-year review of the updated science continues, which is scheduled for completion in 2013.
3.2.4.2.2 State Standards Table 3.2-6 shows the number of days above the state standards, or the annual average in the case of PM2.5, at the Imperial Valley monitoring stations for the period 2006 through 2010 for the three criteria pollutants of greatest concern.
TABLE 3.2-6 NUMBER OF DAYS ABOVE STATE STANDARDS OR ANNUAL AVERAGE IN
IMPERIAL VALLEY, CALIFORNIA
Monitoring Station 2006 2007 2008 2009 2010 O3 (2008 8-hour standard)
Brawley–220 Main Street 0 0 0 * * Calexico–Ethel Street 3 20 17 9 6 El Centro–9th Street 39 23 9 30 29 Niland–English Road 6 15 11 16 5 Westmorland–West 1st Street 46 36 17 23 5
PM10 (24-hour standard)** Brawley–220 Main Street 100.1 158.6 61.1 90.0 47.9 Calexico–Ethel Street * 219.1 186.8 207.4 55.0 El Centro–9th Street 120.1 * 25.5 104.6 * Niland–English Road 30.5 82.8 61.5 74.2 43.8 Westmorland–West 1st Street * 126.6 60.7 90.5 40.8
PM2.5 (annual average [µg/m3]) Brawley–220 Main Street * * 8.2 * * Calexico–Ethel Street 17.3 23.2 * 18.7 12.7 El Centro–9th Street * * * 8.0 6.6
* There were insufficient (or no) data available to determine the value. **Measurements are usually collected every six days. Estimated days mathematically estimate how many days concentrations would have been greater than the level of the standard had each day been monitored. Source: CARB 2012b.
The SSAB is a state Nonattainment area for O3 and PM10. The SSAB is Unclassified/ Attainment for all other state standards.
3.2.4.3 SOURCES OF REGIONAL AND LOCAL POLLUTION
The area surrounding the Ocotillo Sol Project area consists largely of agricultural fields or undeveloped desert. Stationary sources of air pollutants are not currently on-site. The primary air pollution concerns in the Ocotillo Sol Project area are O3 and particulate emissions. The atmosphere is often stable enough to allow PM10 pollution to accumulate and frequently reach elevated concentrations across the southern portion of Imperial County. Under stagnant and light wind conditions, elevated dust concentrations in Mexicali, Mexico, can cause PM10 to drift across the border into the U.S. city of Calexico, east of the Ocotillo Sol Project area (ICAPCD 2008c). Metropolitan Mexicali comprises approximately 937,000 people and has PM10

Affected Environment
Page 3-20 Ocotillo Sol Project Draft EIS/Draft CDCA Plan Amendment
April 2012
emissions estimated at 257 tons/day, compared with emissions of about 13 tons/day for the considerably smaller town of Calexico (population approximately 32,000).
High concentrations of PM10 in many areas of Imperial County result from wind action. The wind picks up particles from disturbed and undisturbed surfaces, recreational travel on paved and unpaved roadways, construction and demolition activities, and farming operations. In addition to wind events, the primary contributors of PM10 within lands administered by the BLM in Imperial County are off-highway vehicle (OHV) recreation, mining operations, agricultural operations, and short-term construction projects such as installation of utility lines. The principal human health effect of airborne particulate matter is on the respiratory system (ICAPCD 2008 as cited in BLM 2010).
Because the Imperial Valley area is designated as nonattainment for PM10, the Imperial County government agencies and industry groups, private and public stakeholders, and ICAPCD have worked to reduce PM10 emissions and bring the area into compliance with the NAAQS. These efforts culminated in the 2005 amendments of the ICAPCD Regulation VIII Best Available Control Methods, adopted in advance of the 2009 Imperial County SIP for the purposes of accelerating Best Available Control Method implementation and meeting the requirements and schedule of Imperial County’s Natural Event Action Plan (ENVIRON 2009). The BLM has developed a Dust Control Plan to identify sources of PM10 within lands administered by BLM and provide implementation measures to help minimize or eliminate emissions (BLM 2011).
PM2.5 emissions can originate from surface disturbance, such as off-road activity and agricultural operations. PM2.5 emissions, however, are principally the result of fuel combustion. Typical sources include vehicles, construction equipment, agricultural equipment, and industrial sources including conventional electricity production. Combustion is also the primary source of these precursor emissions. The primary sources of these emissions in the immediate vicinity of the Ocotillo Sol Project area are vehicles and agricultural operations.
3.2.4.3.1 Salton Sea Air Basin and Imperial County Emissions Inventories Table 3.2-7 summarizes the estimated 2008 emissions inventory (the most recent data provided to CARB) for Imperial County. Detailed breakdowns of the emissions sources and categories are available at CARB’s Web site (CARB 2012c).

Affected Environment
Ocotillo Sol Project Page 3-21 Draft EIS/Draft CDCA Plan Amendment April 2012
TABLE 3.2-7 IMPERIAL COUNTY 2008 ESTIMATED ANNUAL EMISSIONS (TONS/DAY)
Emission Category Reactive Organic
Gas CO NOX SOX PM10 PM2.5 Stationary Sources
Fuel Combustion 0.17 1.02 7.19 0.13 0.47 0.41 Waste Disposal 0.02 - - - - - Cleaning and Surface Coatings 0.41 - - - - - Petroleum Production and Marketing
0.69 - 0.00 - - -
Industrial Processes 0.08 0.06 0.03 0.03 2.95 0.95 Area-wide Sources
Solvent Evaporation 6.89 - - - - - Miscellaneous Processes 9.95 15.61 0.69 0.08 226.97 36.38
Mobile Sources On-Road Motor Vehicles 5.71 49.23 20.46 0.04 0.88 0.72 Other Mobile Sources 6.52 25.32 9.70 0.14 0.95 0.90
Natural Sources Biogenic Sources 3.05 - - - - -
Total 33.49 91.24 38.06 0.41 232.21 39.35 Grand Total (tons/year) 12,224 33,303 13,892 150 84,757 14,363
Note: The sum of values may not equal total shown due to rounding. Source: CARB 2012c.

Affected Environment
Page 3-22 Ocotillo Sol Project Draft EIS/Draft CDCA Plan Amendment
April 2012
3.3 GREENHOUSE GASES AND CLIMATE CHANGE
Global climate change is a change in the average weather of the earth, as measured by wind patterns, storms, precipitation, and temperature. The earth’s climate is in a state of constant flux with periodic warming and cooling cycles. Extreme periods of cooling are termed “ice ages,” which may then be followed by extended periods of warmth. For most of the earth’s geologic history, periods of warming and cooling have resulted from many complicated interacting natural factors. Those factor include the following: volcanic eruptions that spew gases and particles (dust) into the atmosphere; the amount of water, vegetation, and ice covering the earth’s surface; subtle changes in the earth’s orbit; and the amount of energy released by the sun (sun cycles). Since the beginning of the Industrial Revolution around 1750, the average temperature of the earth’s atmosphere has been increasing at a rate faster than can be explained by natural climate cycles alone.
The Industrial Revolution initiated an increase in the combustion of carbon-based fuels such as wood, coal, oil, natural gas, and biomass. Industrial processes have also created emissions of substances not found in nature. This in turn has led to a marked increase in the emissions of gases, which has influenced the world’s climate. These gases, termed greenhouse gases (GHGs), affect the amount of heat trapped in the earth’s atmosphere.
Ongoing scientific research has identified the potential impacts of anthropogenic (human-made) GHG emissions and changes in biological carbon sequestration stemming from land management activities on global climate. On a regional and global scale, GHG emissions to the atmosphere and net losses of stored biological carbon sinks through deforestation and agriculture cause a net warming of the atmosphere, primarily by decreasing the amount of heat energy radiated by the earth back into space. Although GHG levels have varied for millennia, recent industrialization and attendant burning of fossil fuels have caused concentrations of GHGs such as carbon dioxide (CO2) and methane (CH4) to increase dramatically. Concentrations are likely to contribute to overall global climatic changes. The Intergovernmental Panel on Climate Change concluded that “warming of the climate system is unequivocal” and “[m]ost of the observed increase in global average temperatures since the mid-20th century is very likely due to the observed increase in anthropogenic [GHG] concentrations” (IPCC 2007). Because the collective of human actions taking place throughout the world contribute to climate change, climate change is quintessentially a global or cumulative issue. It is important to note that GHGs will have a sustained climactic impact over different temporal scales.
Rainfall patterns are also affected by global climate change. Total annual precipitation and statewide rainfall patterns are anticipated to change little over the next century. The intensity and frequency of extreme storm events could increase (State of California 2006). Demand for water resources due to a growing economy and population is likely to continue to increase, potentially overstretching water supply. Agricultural areas such as the Imperial Valley would likely be the hardest hit, potentially losing 25 percent or more of needed water supply (State of California 2006). Land use changes may occur as agricultural productivity declines due to climate change and potential loss of water rights occur for Colorado River water (pers. comm., J.

Affected Environment
Ocotillo Sol Project Page 3-23 Draft EIS/Draft CDCA Plan Amendment April 2012
Weigand 2012). Statewide average temperatures are anticipated to increase between 3°F and 10.5°F by 2100. There is a potential for a greater number of days with temperatures in the 90°F to 100°F range, if temperatures rise to the modeled higher warming ranges. Higher temperatures increase the risks to people of dehydration, heat stroke/exhaustion, heart attack, stroke, and respiratory distress caused by extreme heat. Higher temperature would also drive increased energy consumption needed for cooling.
Water would be needed for future maintenance of the solar facility. Use of water in this project may have to compete with use in other alternative energy projects nearby, other human needs for potable water, and use in food production, wildlife habitat and sustenance, and other basic ecosystem services.
3.3.1 APPLICABLE REGULATIONS, PLANS, AND POLICIES/MANAGEMENT GOALS
3.3.1.1 EPA REGULATORY INITIATIVES
The U.S. Supreme Court found on April 2, 2007, based on a petition for rulemaking under Section 202(a) filed by more than a dozen environmental and renewable energy organizations and other entities, that GHGs are air pollutants under the Clean Air Act. The Supreme Court held that the EPA must determine whether emissions of GHGs from new motor vehicles cause or contribute to air pollution that may reasonably be anticipated to endanger public health or welfare, or whether the science is too uncertain to make a reasoned decision. The EPA was required to follow the language of Section 202(a) of the Clean Air Act.
The EPA’s thorough examination of the scientific evidence concluded that the science compellingly supports a positive endangerment finding for both public health and welfare. The EPA relied heavily upon the major findings and conclusions from recent assessments of the U.S. Climate Change Science Program and the Intergovernmental Panel on Climate Change. The EPA made this endangerment finding after considering both observed and projected future effects of climate change, key uncertainties, and the full range of risks and effects to public health and welfare occurring within the United States. The EPA issued a final rule on May 13, 2010 to apply Prevention of Significant Deterioration requirements to new facilities whose carbon dioxide-equivalent emissions exceed 100,000 tons per year (EPA 2012a).
3.3.1.2 OTHER FEDERAL GUIDANCE ON GREENHOUSE GASES AND CLIMATE CHANGE
Presidential EO 13514 expands energy reduction and environmental performance requirements for federal agencies identified in EO 13423. The goal of the EO is to establish an integrated strategy towards sustainability in the federal government and to make reduction of GHG emissions a priority for federal agencies. SOs 3226 and 3285 direct bureaus and offices within the DOI to provide leadership by responding in a timely manner to climate change issues and make development of renewable energy a priority. On September 14, 2009, Secretary of the Interior Ken Salazar issued SO 3289, addressing the impacts of climate change on domestic water, land, and other natural and cultural resources. The SO establishes an approach for

Affected Environment
Page 3-24 Ocotillo Sol Project Draft EIS/Draft CDCA Plan Amendment
April 2012
increasing understanding of climate change and responding to potential climate change-related impacts as relevant to the resources that the DOI manages. The document specifically identifies areas such as potential changes in flood risk and water supply, sea level rise, changes in wildlife and habitat populations and their migration patterns, new invasions of exotic species, and increased threat of wildland fire. The SO includes Climate Change Response Planning Requirements, which require each bureau and office within the DOI (including BLM) to consider and analyze potential climate change impacts when undertaking long-range planning exercises, setting priorities for scientific research and investigations, developing multi-year management plans, and making major decisions regarding potential use of resources under the DOI’s purview.
3.3.1.3 SULFUR HEXAFLUORIDE EMISSION REDUCTION PARTNERSHIP FOR ELECTRIC POWER SYSTEMS
The Sulfur Hexafluoride (SF6) Emission Reduction Partnership is an EPA voluntary industry program aimed at reducing greenhouse gas emissions associated with electric generation and transmission. The Partnership’s primary objective is to reduce SF6 emissions via cost-effective technologies and practices. Through improvements in the leak rate of new equipment, refurbishing of older equipment, and the use of more efficient operation and maintenance techniques, utilities often find economical solutions to reduce SF6 emissions.
Industry partners agree to (EPA 2012b):
• estimate current annual SF6 emissions;
• annually inventory emissions of SF6 using an emissions inventory protocol;
• establish a strategy for replacing older, leakier pieces of equipment;
• implement SF6 recycling;
• ensure that only knowledgeable personnel handle SF6; and
• submit annual progress reports.
The EPA assists partners by:
• acting as a clearinghouse for technical information on successful strategies to reduce SF6 emissions;
• providing partners with recognition for their achievements in reducing SF6 emissions;
• serving as a credible repository for data on the emissions reduction achievements of the partners; and
• working to obtain commitments from all electric power system operators to join the partnership.
The partnership also produces annual reports. The Applicant is a member partner.

Affected Environment
Ocotillo Sol Project Page 3-25 Draft EIS/Draft CDCA Plan Amendment April 2012
3.3.1.4 EO S-3-05—STATEWIDE GHG EMISSION TARGETS
EO S-3-05 signed by Governor Schwarzenegger on June 1, 2005, established the following GHG emission reduction targets for the state of California:
1. by 2010, reduce GHG emissions to 2000 levels 2. by 2020, reduce GHG emissions to 1990 levels 3. by 2050, reduce GHG emissions to 80 percent below 1990 levels
This EO also directs the secretary of the California EPA to oversee the efforts made to reach these targets and to prepare biannual reports on the progress made toward meeting the targets and on the impacts to California related to global warming, including impacts to water supply and public health. With regard to impacts, the report shall also prepare and report on mitigation and adaptation plans to combat the impacts. The first Climate Action Team Assessment Report was produced in March 2006 and has been updated every two years, most recently in December 2010.
3.3.1.5 CALIFORNIA GLOBAL WARMING SOLUTIONS ACT: ASSEMBLY BILL 32
California AB 32 mandates that the state report and verify its GHG emissions in order to reduce GHG emissions statewide to 1990 levels by the year 2020. To facilitate this, CARB is required to adopt a statewide emissions limit, adopt regulations to reduce the amount of GHG emissions, and monitor compliance. CARB is the lead agency for implementing AB 32, which set the major milestones for establishing the program.
Although CO2 is the largest contributor to climate change, AB 32 references five additional GHGs: CH4, nitrous oxide (N2O), SF6, hydrofluorocarbons (HFCs), and perfluorocarbons (PFCs). Key elements of California’s recommendations for reducing its GHG emissions to 1990 levels by 2020 include the following:
• Setting targets for transportation-related GHG emissions for regions throughout California and pursuing policies and incentives to achieve those targets
• Adopting and implementing measures pursuant to existing state laws and policies, including California’s clean car standards, goods movement measures, and the Low Carbon Fuel Standard
• Imposing targeted fees on high global warming potential (GWP) gases
• Implementing additional measures to address emissions from industrial sources. These proposed measures would regulate fugitive emissions from oil and gas recovery and transmission activities
• Imposing a high GWP mitigation fee, which is anticipated to promote the development of alternatives to GWP chemicals and improve recycling and removal of these substances when older units containing them are dismantled

Affected Environment
Page 3-26 Ocotillo Sol Project Draft EIS/Draft CDCA Plan Amendment
April 2012
CARB recommended a GHG reduction goal for local governments of 15 percent below current levels by 2020 to ensure that their municipal and community-wide emissions match the state’s reduction target. AB 32 makes CARB responsible for monitoring and reducing GHG emissions and continues the existing Climate Action Team to coordinate statewide efforts. Additional requirements for CARB include the following:
• Establishing a statewide GHG emissions cap for 2020 based on 1990 emissions
o In December 2007, CARB approved a 2020 emission limit of 427 million metric tons of CO2 equivalent (MMTCO2E).
• Adopting mandatory reporting rules for significant sources of GHGs
o In December 2007, CARB adopted regulations requiring the largest industrial sources to report and verify their GHG emissions. Facilities began tracking emissions in 2008 with reporting based on best available data. Beginning in 2010, emissions reports became more rigorous and subject to third-party verification. This action builds on the earlier SB 177 (Sher) enacted in 2000, which established a nonprofit California Climate Action Registry for the purpose of administering a voluntary GHG emissions registry.
• Adopting a plan that indicates how emission reductions would be achieved from significant GHG sources via regulations, market mechanisms, and other actions
o A Climate Change Scoping Plan was approved on December 12, 2008. The Scoping Plan contains the main strategies California will implement to achieve a reduction of 174 MMTCO2E GHG emissions, or approximately 29 percent from the state’s projected 2020 emission level of 596 MMTCO2E under a “Business as Usual” scenario.
• Adopting regulations to achieve the maximum technologically feasible and cost-effective reductions in GHGs, including provisions for using both market mechanisms and alternative compliance mechanisms
• Convening an Environmental Justice Advisory Committee and an Economic and Technology Advancement Advisory Committee to advise CARB
o In January 2007, the CARB appointed a 10-member Environmental Justice Advisory Committee and appointed members to the Economic and Technology Advancement Advisory Committee.
• Evaluating several factors prior to imposing any mandates or authorizing market mechanisms, including, but not limited to, impacts on California’s economy, the environment, and public health; equity between regulated entities; electricity reliability and conformance with other environmental laws, as well as ensuring that the rules do not disproportionately impact low-income communities
• Adopting a list of discrete, early action measures to be implemented before January 1, 2010
• Ensuring public notice and opportunity for comment on all CARB actions
o A number of CARB documents— including the 2020 Emissions Forecast, the Scoping Plan, and the Draft Recommended Approaches for Setting Interim Significance Thresholds—have been circulated for public review and comment.

Affected Environment
Ocotillo Sol Project Page 3-27 Draft EIS/Draft CDCA Plan Amendment April 2012
3.3.1.5.1 Climate Change Scoping Plan As directed by AB 32, the Climate Change Scoping Plan prepared by CARB in December 2008 and adopted by the Board’s Executive Officer on May 11, 2009 includes measures to reduce statewide GHG emissions to 1990 levels by 2020. These reductions are what CARB identified as necessary to reduce forecasted Business as Usual 2020 emissions. CARB will update the Scoping Plan at least once every five years to allow evaluation of progress made and to correct the Scoping Plan’s course where necessary.
As indicated in Table 3.3-1, the majority of reductions are directed at the sectors with the largest GHG emissions contributions—transportation and electricity generation—and involve statutory mandates affecting vehicle or fuel manufacture, public transit, and public utilities. As discussed later in Section 3.3.1.6, the measure most applicable to energy generation is the implementation of an RPS. Implementing this measure accounts for a reduction of 21.3 MMTCO2E emissions, or 14 percent, of the total 146.7 MMTCO2E in reductions needed for capped sectors.
TABLE 3.3-1 CARB SCOPING PLAN—RECOMMENDED GHG REDUCTION MEASURES
Recommended Reduction Measures
Reductions Counted Towards 2020 Target
In MMTCO2E (% total2)
Estimated Reductions Resulting from the Combination of Capped Sectors and Complementary Measures
146.7
California Light-duty Vehicle Greenhouse Gas Standards • Implement Pavley Standards • Develop Pavley II light-duty vehicle standards
31.7 (22%)
Energy Efficiency • Building/appliance efficiency, new programs, etc. • Increase CHP generation by 30,000 gigawatts • Solar Water Heating (AB 1470 goal)
26.3 (18%)
RPS (33% by 2020) 21.3 (14%) Low Carbon Fuel Standard 15.0 (10%) Regional Transportation-related GHG Targets1 5.0 (4%) Vehicle Efficiency Measures 4.5 (3%) Goods Movement • Ship Electrification at Ports • System-wide Efficiency Improvements
3.7 (3%)
Million Solar Roofs 2.1 (2%) Medium/Heavy Duty Trucks • Heavy-duty Vehicle Greenhouse Gas Emissions Reduction
(Aerodynamic Efficiency) • Medium- and Heavy-duty Vehicle Hybridization
1.4 (<1%)
High Speed Rail 1.0 (<1%) Industrial Measures (for sources covered under cap & trade program) • Refinery Measures • Energy Efficiency and Co-benefits Audits
0.3 (<.5%)
Additional Reductions Necessary to Achieve the Cap 34.4 (23%)

Affected Environment
Page 3-28 Ocotillo Sol Project Draft EIS/Draft CDCA Plan Amendment
April 2012
TABLE 3.3-1 CARB SCOPING PLAN—RECOMMENDED GHG REDUCTION MEASURES
Recommended Reduction Measures
Reductions Counted Towards 2020 Target
In MMTCO2E (% total2)
Estimated Reductions Resulting from Uncapped Sectors 27.3 Industrial Measures (for sources not covered under cap & trade program) • Oil and Gas Extraction and Transmission
1.1
High GWP Gas Measures 20.2 Sustainable Forests 5.0 Recycling and Waste (landfill methane capture) 1.0
Total Reductions Counted Toward 2020 Target3 174.0 Source: Table 2 of CARB 2008. 1This number represents an estimate of what may be achieved from local land use changes. It is not the SB 375 regional target. CARB will establish regional targets for each Metropolitan Planning Organization following input of the Regional Targets Advisory Committee and a public stakeholders’ consultation process per SB 375.
2Percentages are relative to the capped sector subtotal of 146.7 MMTCO2E, and may not total 100 due to rounding. 3The total reduction for the recommended measures slightly exceeds the 169 MMTCO2E of reductions estimated in the Business as Usual 2020 Emissions Forecast. This is the net effect of adding several measures and adjusting the emissions reduction estimates for some other measures.
CARB also lists several other recommended measures which will contribute toward achieving the 2020 statewide reduction goal, but whose reductions are not (for various reasons, including the potential for double counting) additive with the measures listed in Table 3.3-1 above. These include state and local government operations measures, green building, mandatory commercial recycling and other additional waste and recycling measures, water sector measures, and methane capture at large dairies.
In addition, the Climate Change Scoping Plan considers the following key strategies, among others:
Cap-and-Trade Program: Broad-based to provide a firm limit on emissions; covers 85 percent of California’s emissions: electricity generation, large industrial sources, transportation fuels, and residential and commercial use of natural gas, and provides regional linkage with the Western Climate Initiative, allowing greater environmental and economic benefits
Transportation: GHG emission standards for cars, low-carbon fuel standard (10 percent by 2020), better land-use planning (SB 375), and more efficient delivery trucks, heavy duty trucks, and goods movement
Electricity and Energy (imported included): Improved appliance efficiency standards and other aggressive energy efficiency measures, 33 percent renewables by 2020, increased use of efficient “combined heat and power,” million solar roofs, solar hot water heating, green buildings, and water efficiency

Affected Environment
Ocotillo Sol Project Page 3-29 Draft EIS/Draft CDCA Plan Amendment April 2012
Industry (including cement): Audit of the 800 largest emission sources in California to identify GHG reduction opportunities; regulations on refinery flaring and fugitive emissions; considerations for cement to address “leakage”
High GWP Gases: Capture refrigerants and other high GWP gases already in use; reduce future impact through leak-resistant equipment, restrictions on use, and fees
Waste and Recycling: Reduce CH4 emissions from landfills and move toward high recycling and zero waste
3.3.1.6 RENEWABLES PORTFOLIO STANDARD
The RPS promotes diversification of the state’s electricity supply. Originally adopted in 2002 with a goal to achieve a 20-percent renewable energy mix by 2020, the goal has been accelerated and increased, most recently so by EOs S-14-08 and S-21-09 to a goal of 33 percent by 2020. Its purpose is to achieve a 33-percent renewable energy mix statewide; providing 33 percent of the state’s electricity needs met by renewable resources by 2020 (CARB 2008). As mentioned, the RPS is included in CARB’s Scoping Plan list of reduction measures (see Table 3.3-1). Increasing the RPS to 33 percent is designed to accelerate the transformation of the electricity sector, including investment in the transmission infrastructure and systems changes to allow integration of large quantities of intermittent wind and solar generation. Renewable energy includes (but is not limited to) wind, solar, geothermal, small hydroelectric, biomass, anaerobic digestion, and landfill gas. Increased use of renewables would decrease California’s reliance on fossil fuels, thus reducing emissions of GHGs from the electricity sector. CARB estimates that full achievement of the RPS would decrease statewide GHG emissions by 21.3 MMTCO2E (CARB 2008).
3.3.2 GREENHOUSE GASES OF PRIMARY CONCERN
There are numerous GHGs, both naturally occurring and human-made. Table 3.3-2 summarizes some of the most common GHGs. Each GHG has variable atmospheric lifetime and GWP.
TABLE 3.3-2 GLOBAL WARMING POTENTIALS AND ATMOSPHERIC LIFETIMES (YEARS)
Gas
Atmospheric Lifetime 100-year GWP
20-year GWP
500-year GWP
CO2 50–200 1 1 1 CH4
* 12±3 21 56 6.5 N2O 120 310 280 170 SF6 3,200 23,900 16,300 34,900 Source: EPA 2011, Annex 6.
*The methane GWP includes the direct effects and those indirect effects due to the production of tropospheric O3 and stratospheric water vapor. The indirect effect due to the production of CO2 is not included.
The atmospheric lifetime of a GHG is the average time that a molecule of gas stays stable in the atmosphere. Most GHGs have long atmospheric lifetimes, staying in the atmosphere hundreds or thousands of years. The potential of a gas to trap heat and warm the atmosphere is measured by its GWP. Specifically, GWP is defined as “the cumulative radiative forcing—both direct and
Affected Environment
Page 3-30 Ocotillo Sol Project Draft EIS/Draft CDCA Plan Amendment
April 2012
indirect effects—integrated over a period of time from the emission of a unit mass of gas relative to some reference gas” (EPA 2011). In other words, the GWP indicates the relative amount of heat that a particular gas can trap and store.
The reference gas for establishing GWP is CO2, which—as shown in Table 3.3-2—consequently has a GWP of 1. As an example, CH4, while having a shorter atmospheric lifetime than carbon dioxide, has a 100-year GWP of 21, which means that it has a greater global warming effect than CO2 on a molecule-by-molecule basis.
Of the gases listed in Table 3.3-2, CO2, CH4, and N2O are produced by both biogenic (natural) and anthropogenic (human) sources. The remaining gases occur solely as the result of human processes. HFCs are synthetic, human-made chemicals used as substitutes for O3-depleting chlorofluorocarbons used in air conditioners and as refrigerants. PFCs such as CF4 are used primarily in aluminum production and semiconductor manufacture. SF6 is used for insulation in electric power transmission and distribution equipment. HFCs and PFCs are not of primary concern to the proposed project.
CO2, CH4, N2O, and SF6 are the GHGs of primary concern in this analysis. Carbon dioxide would be emitted by the proposed project due to the combustion of fossil fuels in vehicles during project construction and maintenance, from electricity generation and natural gas consumption, water use, and from solid waste disposal. Smaller amounts of methane and nitrous oxide would be emitted from these same project operations. SF6 is not intentionally emitted to the atmosphere, but emissions could occur primarily as the result of equipment leaks or mishandling.
3.3.3 GREENHOUSE GASES EXISTING CONDITIONS
3.3.3.1 STATE GHG INVENTORIES
The CARB performs statewide GHG inventories. The inventory is divided into nine broad sectors of economic activity: agriculture, commercial, electricity generation, forestry, high GWP emitters, industrial, recycling and waste, residential, and transportation. Emissions are quantified in MMTCO2E. Table 3.3-3 shows the estimated statewide GHG emissions for the years 1990, 2000, 2004, and 2008.
As shown in Table 3.3-3, statewide GHG emissions totaled 433 MMTCO2E in 1990, 458 MMTCO2E in 2000, 484 MMTCO2E in 2004, and 478 MMTCO2E in 2008. According to data from the CARB, it appears that statewide GHG emissions peaked in 2004 and are now beginning to decrease (CARB 2010). Transportation-related emissions consistently contribute the most GHG emissions, followed by electricity generation and industrial emissions.

Affected Environment
Ocotillo Sol Project Page 3-31 Draft EIS/Draft CDCA Plan Amendment April 2012
TABLE 3.3-3 CALIFORNIA GHG EMISSIONS BY SECTOR IN 1990, 2000, 2004, AND 2008
Sector
1990 Emissions in MMTCO2E (% total)1
2000 Emissions in MMTCO2E (% total)1
2004 Emissions in MMTCO2E (% total)1
2008 Emissions in MMTCO2E (% total)1
Sources Agriculture 23.4 (5%) 25.44 (6%) 28.82 (6%) 28.06 (6%) Commercial 14.4 (3%) 12.80 (3%) 13.20 (3%) 14.68 (3%) Electricity Generation 110.6 (26%) 103.92 (23%) 119.96 (25%) 116.35 (24%) Forestry (excluding
sinks) 0.2 (<1%) 0.19 (<1%) 0.19 (<1%) 0.19 (<1%)
High GWP -- 10.95 (2%) 13.57 (3%) 15.65 (3%) Industrial 103.0 (24%) 97.27 (21%) 90.87 (19%) 92.66 (19%) Recycling and Waste -- 6.20 (1%) 6.23 (1%) 6.71 (1%) Residential 29.7 (7%) 30.13 (7%) 29.34 (6%) 28.45 (6%) Transportation 150.7 (35%) 171.13 (37%) 181.71 (38%) 174.99 (37%) Unspecified Remaining2 1.3 (<1%) -- -- --
Subtotal 433.3 458.03 483.89 477.74 Sinks Forestry Sinks -6.7 (--) -4.72 (--) -4.32 (--) -3.98 (--)
Total 426.6 453.31 479.57 473.76 Source: CARB 2007, 2010 1 Percentages may not total 100 due to rounding. 2 Unspecified fuel combustion and O3-depleting substance substitute use, which could not be attributed to an individual sector.
Affected Environment
Page 3-32 Ocotillo Sol Project Draft EIS/Draft CDCA Plan Amendment
April 2012
3.4 GEOLOGY AND SOILS
This section describes the existing conditions associated with the soil composition, geology, and seismicity of the Ocotillo Sol Project area. Documents reviewed include maps from the United States Geological Survey (USGS), California Geological Survey (CGS), and the Southern California Earthquake Center. The soils within the Ocotillo Sol Project area are generally reflective of the underlying geologic unit(s). The geologic formation depends on the extent of weathering of the unit(s), which is governed by the ground surface slope, the long-term climate, vegetation cover, the degree of human modification, and time.
3.4.1 APPLICABLE REGULATIONS, PLANS, AND POLICIES/ MANAGEMENT GOALS
3.4.1.1 FEDERAL LAND POLICY AND MANAGEMENT ACT OF 1976 AS AMENDED
FLPMA establishes policy and goals for BLM’s administration of public lands. The intent of FLPMA is to protect and administer public lands within the framework of a program of multiple use and sustained yield, and the maintenance of environmental quality. Particular emphasis is placed on the protection of the quality of scientific, scenic, historical, ecological, environmental, air and atmospheric, water resources and archaeological values. Under FLPMA, BLM is also charged with the protection of life and safety from natural hazards.
3.4.1.2 CALIFORNIA DESERT CONSERVATION AREA PLAN
The CDCA Plan defines Multiple Use Classes for BLM-managed lands in the CDCA, which includes the land area encompassing the Applicant’s proposed Ocotillo Sol Project and alternatives. With respect to geological resources, the CDCA Plan aims to maintain the availability of mineral resources on public lands for exploration and development.
3.4.1.3 THE CALIFORNIA LAND CONSERVATION ACT OF 1965
The California Land Conservation Act of 1965, commonly referred to as the Williamson Act, was enacted to preserve California’s prime agricultural lands from urbanization. The act has been amended several times to allow its use for purposes other than protection of prime agricultural lands, including enabling local governments to enter into contracts with private landowners for the purpose of restricting specific parcels of land to open space use.
3.4.1.4 ALQUIST–PRIOLO EARTHQUAKE FAULT ZONING ACT, PUBLIC RESOURCES CODE SECTION 2621–2630
The Alquist–Priolo Earthquake Fault Zoning Act of 1972 (formerly the Special Studies Zoning Act) regulates development and construction of buildings intended for human occupancy to avoid the hazard of surface fault rupture. This act mitigates the hazard of surface fault rupture of known active faults beneath occupied structures and requires disclosure to potential buyers of
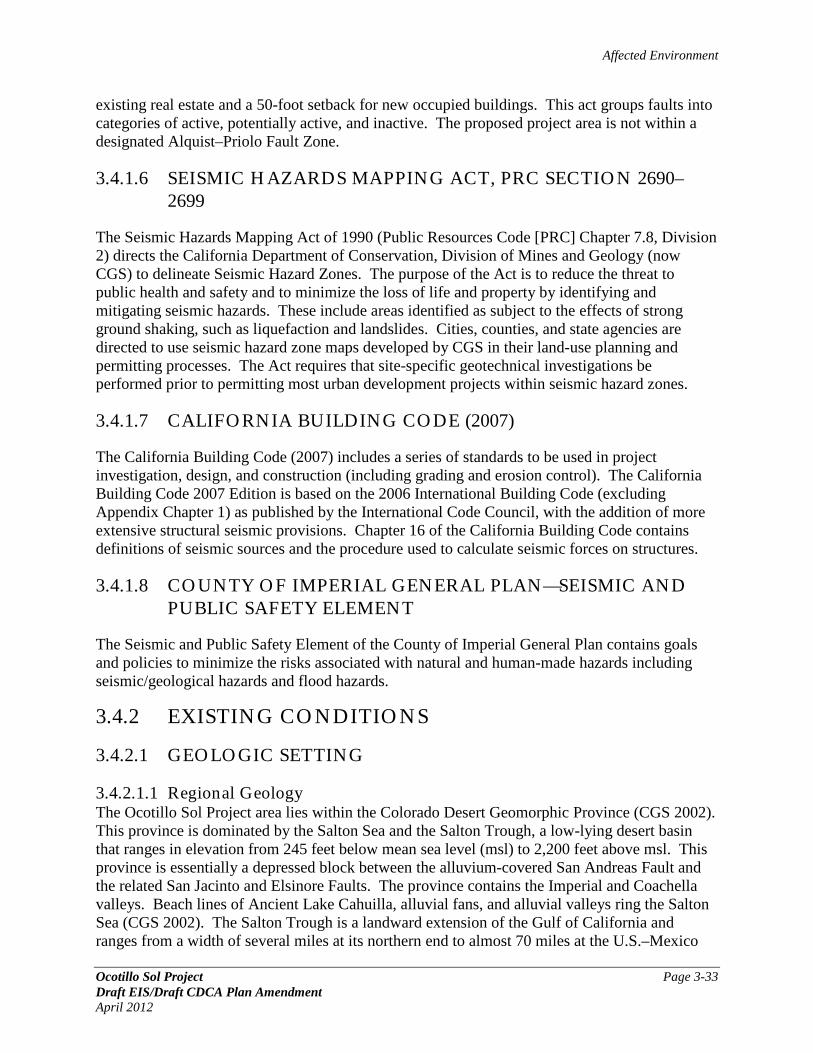
Affected Environment
Ocotillo Sol Project Page 3-33 Draft EIS/Draft CDCA Plan Amendment April 2012
existing real estate and a 50-foot setback for new occupied buildings. This act groups faults into categories of active, potentially active, and inactive. The proposed project area is not within a designated Alquist–Priolo Fault Zone.
3.4.1.6 SEISMIC HAZARDS MAPPING ACT, PRC SECTION 2690–2699
The Seismic Hazards Mapping Act of 1990 (Public Resources Code [PRC] Chapter 7.8, Division 2) directs the California Department of Conservation, Division of Mines and Geology (now CGS) to delineate Seismic Hazard Zones. The purpose of the Act is to reduce the threat to public health and safety and to minimize the loss of life and property by identifying and mitigating seismic hazards. These include areas identified as subject to the effects of strong ground shaking, such as liquefaction and landslides. Cities, counties, and state agencies are directed to use seismic hazard zone maps developed by CGS in their land-use planning and permitting processes. The Act requires that site-specific geotechnical investigations be performed prior to permitting most urban development projects within seismic hazard zones.
3.4.1.7 CALIFORNIA BUILDING CODE (2007)
The California Building Code (2007) includes a series of standards to be used in project investigation, design, and construction (including grading and erosion control). The California Building Code 2007 Edition is based on the 2006 International Building Code (excluding Appendix Chapter 1) as published by the International Code Council, with the addition of more extensive structural seismic provisions. Chapter 16 of the California Building Code contains definitions of seismic sources and the procedure used to calculate seismic forces on structures.
3.4.1.8 COUNTY OF IMPERIAL GENERAL PLAN—SEISMIC AND PUBLIC SAFETY ELEMENT
The Seismic and Public Safety Element of the County of Imperial General Plan contains goals and policies to minimize the risks associated with natural and human-made hazards including seismic/geological hazards and flood hazards.
3.4.2 EXISTING CONDITIONS
3.4.2.1 GEOLOGIC SETTING
3.4.2.1.1 Regional Geology The Ocotillo Sol Project area lies within the Colorado Desert Geomorphic Province (CGS 2002). This province is dominated by the Salton Sea and the Salton Trough, a low-lying desert basin that ranges in elevation from 245 feet below mean sea level (msl) to 2,200 feet above msl. This province is essentially a depressed block between the alluvium-covered San Andreas Fault and the related San Jacinto and Elsinore Faults. The province contains the Imperial and Coachella valleys. Beach lines of Ancient Lake Cahuilla, alluvial fans, and alluvial valleys ring the Salton Sea (CGS 2002). The Salton Trough is a landward extension of the Gulf of California and ranges from a width of several miles at its northern end to almost 70 miles at the U.S.–Mexico

Affected Environment
Page 3-34 Ocotillo Sol Project Draft EIS/Draft CDCA Plan Amendment
April 2012
Border. The Salton Trough is bordered by mountains to the west, north, and east and by the Colorado River Delta in the south. The Colorado River Delta separates the Salton Trough from the Gulf of California. In the past, the Colorado River frequently changed its course. Rather than flowing southward and into the Gulf of California, it would flow northward and fill the Salton Trough up to 40 to 48 feet above msl before the water would breach the delta on the southern end and again flow into the Gulf of California (URS 2011).
3.4.2.1.2 Project Site Geology The Ocotillo Sol Project area lies within the Yuha Desert of the lower Imperial Valley. The Westside Main Canal runs generally north–south and is east of the Ocotillo Sol Project area. Drainage within the general area typically flows in a northeasterly to easterly direction. The elevation of the Ocotillo Sol Project area varies from 6 feet to 24 feet above msl. This area is close to the maximum extent of the shoreline of Ancient Lake Cahuilla. Ancient Lake Cahuilla was an inland freshwater lake that underwent several drying and filling sequences as far back as 10,000 years before the present. The present-day Salton Sea was filled accidentally after a levee breach between 1905 and 1907. Based on mapping by Strand in 1962 (San Diego Gas & Electric 2010), the Ocotillo Sol Project area lies within Quaternary lake deposits (Ql) from Ancient Lake Cahuilla (URS 2008). These lake deposits are a variable mix of clay, sand, and beach gravel, depending on location, and contain locally abundant non-marine fossils. The Quaternary lake deposits have very low permeability (Ninyo and Moore 2010). Pinto Wash, located near the southeastern corner of the Ocotillo Sol Project area, contains alluvial deposits (URS 2011).
3.4.2.1.3 Faulting and Seismicity The Imperial Valley has experienced historically high seismic activity along several known faults. No known faults exist on or in the immediate vicinity of the Ocotillo Sol Project area (URS 2011).
Imperial County can expect injuries, casualties, and property damage from earthquakes at some time in the future because of the past frequency of moderately high magnitude and intensity earthquakes, the distribution of active faults and epicenters, and the projected increase in human population. Imperial County's two largest recent quakes occurred in 1979 and 2010. The magnitude of the 1979 earthquake was 6.6 on the Richter Scale (Imperial County 1997). The magnitude of the 2010 earthquake was 7.2. Both quakes caused widespread damage in all municipalities of Imperial County.
Table 3.4-1 lists known earthquake faults within the vicinity of the Ocotillo Sol Project area according to the Southern California Earthquake Center and the Imperial Valley Substation Geotechnical Report (California Division of Mines and Geology 1990).

Affected Environment
Ocotillo Sol Project Page 3-35 Draft EIS/Draft CDCA Plan Amendment April 2012
TABLE 3.4-1 KNOWN EARTHQUAKE FAULTS NEAR THE OCOTILLO SOL PROJECT AREA
Fault Name
Approximate Distance from the Ocotillo Sol Project Area and
Direction Moment
Magnitude Scale Laguna Salada–Elsinore 14 kilometers to the west 6.5 to 7.5 Yuha Wells 14 kilometers to the west - San Jacinto Fault Zone–Coyote Wells 20 kilometers to the north 6.5 to 7.5 Imperial 25 kilometers to the east 6.0 to 6.7
Data from Southern California Earthquake Center
Based on the Uniform Building Code Seismic Zone Maps of the U.S. and because of the number of active faults in the southern California area, the Ocotillo Sol Project area is in the highest seismic risk zone defined by the Uniform Building Code standard as Zone 4.
The Cerro Prieto geothermal field is at the head of the Gulf of California, 35 km south of the city of Mexicali. Cerro Prieto lies in an active continental rift that is transitional between the transform San Andreas fault system to the north and a spreading ridge of the East Pacific Rise in the Gulf of California to the south. The only surficial volcanic feature at Cerro Prieto (near sea level on the Colorado River delta) is a small, 223-meter-high compound dacitic lava dome. A 200-meter-wide crater is at the summit of the northeastern-most dome (Smithsonian Natural Museum of Natural History n.d.). Apparent ancient volcanism resulted in Mount Signal—an impressive landmark in the region.
3.4.2.1.4 Soils Exposed soils associated with the Ocotillo Sol Project area were identified using the Natural Resources Conservation Service database available through the web soil survey (2011). The majority of the Ocotillo Sol Project area is occupied by Rositas fine sand. Rositas fine sand is found on basin floors and forms from alluvium or eolian deposits derived from mixed sources. Rositas sand and Rositas–Superstition loamy fine sands are the other two deposits occupying the proposed project site. Rositas sand is found on basin floors from alluvium derived from mixed sources. Soils exposed at the existing Imperial Valley Substation include Rositas sand and to a much lesser extent the Glenbar complex and the Indio–Vint complex. The Glenbar complex is exposed in the middle of the Ocotillo Sol Project area and a small part of the area not surveyed. This complex is formed of intricately mixed, very deep and well drained soils that formed in alluvial sediment of a mixed origin. They occur on tilted, folded, faulted unconsolidated stratified sediment along the edges of Imperial Valley. The Indio–Vint complex comprises nearly level soils found on flood plains and alluvial basin floors. This unit is actually composed of several soil groups that are so intricately mixed that they cannot be separated into their respective soil units.
Geotechnical borings near the Ocotillo Sol Project area encountered alluvial and lacustrine deposits. These deposits are layered and interlaced, consisting of alternating layers of clean sand, silty and clayey sand, silt, lean clay, and fat clay. The blow counts in these materials indicate medium dense sands in the alluvial layer and stiff silts and clays in the lacustrine deposits. Cross sections of the Ocotillo Sol Project area suggest significant inter-layering of soils and that subsurface conditions will vary significantly. It is recommended that additional

Affected Environment
Page 3-36 Ocotillo Sol Project Draft EIS/Draft CDCA Plan Amendment
April 2012
borings be taken throughout the Ocotillo Sol Project area to accurately evaluate soil characteristics necessary for engineering design (URS 2008).
3.4.2.2 GEOLOGIC HAZARDS
3.4.2.2.1 Fault Rupture A factor considered in the seismic (earthquake) design of the proposed Ocotillo Sol Project is the location of active faults that may cross project structures. No active faults have been identified near the Applicant’s proposed Ocotillo Sol Project area.
3.4.2.2.2 Ground Shaking Earthquakes are the principal geologic activity affecting public safety in Imperial County. The ground shaking involved with earthquakes creates various secondary hazards. Secondary hazards include differential ground settlement; soil liquefaction, rock and mudslides, ground lurching, and avalanches; ground displacement along the fault; floods from dam and levee failure; fires; and disruption of water, sewer, gas, electricity, transportation, and communication systems. The irrigation and drainage system of Imperial Valley is particularly susceptible to earthquake damage (Imperial County 1997).
The intensity of the seismic shaking, or strong ground motion, during an earthquake is dependent on the distance between a project area and the epicenter (point at the earth’s surface directly above the initial movement of the fault at depth) of the earthquake, the magnitude (seismic energy released) of the earthquake, and the geologic conditions underlying and surrounding the area. Earthquakes occurring on faults closest to the Ocotillo Sol Project area would most likely generate the largest ground motion.
The estimate of the intensity (local shaking strength; not to be confused with magnitude) of earthquake-induced ground motion based on an up-to-date assessment of potential earthquake faults or other sources is available. A commonly used benchmark is peak horizontal ground acceleration that is provided for probability of occurrence and represented as a fraction of the acceleration of gravity (g). The approximate estimated range of peak ground acceleration for a 10 percent probability of being exceeded in 50 years in the Applicant’s proposed Ocotillo Sol Project area is between 0.50 and 0.60 g (CGS 2007). Seismic ground shaking can also induce settlement without liquefaction, such as within dry sands above the water table.
3.4.2.2.3 Liquefaction Liquefaction occurs primarily in saturated, loose, fine to medium grained soils in areas where the groundwater table is within approximately 50 feet of the ground surface. Depth to groundwater beneath the vicinity of the proposed Ocotillo Sol Project area is reported to be at depths of approximately 45 to 50 feet (URS 2008). Shaking causes the soils to lose strength (that is, lose their ability to stick together) and behave as a liquid. Liquefaction, which can include loss of bearing strength (the ability to support a load such as a building foundation), lateral spreading, subsidence, and buoyancy effects, occurs when these sediments temporarily lose their shear strength during strong ground shaking. Susceptibility to liquefaction is a function of the sediment density, water content, depth, and the peak ground acceleration.

Affected Environment
Ocotillo Sol Project Page 3-37 Draft EIS/Draft CDCA Plan Amendment April 2012
Imperial County is an area that is generally susceptible to liquefaction. The 1940 and 1979 earthquakes on the Imperial fault caused widespread liquefaction in areas underlain by alluvium, areas adjacent to canals and drains, and in areas underlain by lake deposits. These liquefiable sites contained predominantly loose sandy soils, or sequences of thick sandy layers within finer-grained soils (URS 2008). In addition, the geotechnical report identified a compactable layer, two to four feet thick at a depth of approximately 36 feet. During a seismic event, this layer may compact approximately one inch.
3.4.2.2.4 Land Subsidence Land subsidence is normally the result of fluid withdrawal (such as groundwater or oil extraction or other mining activities), which creates subsurface voids, resulting in the sinking of the ground surface and loss of permeability in the soil. The Ocotillo Sol Project area is within a region of active subsidence because of regional faulting that could produce roughly 1.6 inches of settlement per year across the entire Salton Trough (URS 2008). Subsidence resulting from tectonic processes generally occurs over large areas and any localized differential settlement resulting from regional subsidence is considered low.
In addition, the Imperial Valley is also subject to subsidence from fluid withdrawal (generally associated with geothermal wells). Subsidence associated with the extraction of fluids generally occurs near geothermal areas. The Ocotillo Sol Project area is not near any active geothermal areas and the potential for subsidence is considered low.
3.4.2.2.5 Expansive Soils Expansive soils are primarily comprised of clays, which increase in volume when water is absorbed and shrink when dry. Expansive soils are of concern because building foundations, concrete flatwork, and asphalt/concrete pavements may be prone to the potential swelling forces and reduction in soil strength. Towards the southern section of the Ocotillo Sol Project area, the soils are predominantly large deposits of granular material. An assumption of the soil cannot be made at this time as soil deposits vary from even adjacent sites. Expansive soils are not anticipated at this time for the Ocotillo Sol Project area (URS 2008).
3.4.2.2.6 Oil, Gas, and Geothermal Fields The online California Department of Conservation, Department of Oil, Gas and Geothermal Resources database for the Ocotillo Sol Project area and vicinity was reviewed. The California Department of Conservation “Reference Map K” dated 1986 was also reviewed. No oil or gas wells or geothermal fields were depicted on the site or adjacent properties on the Regional Wildcat Map for the site vicinity (California Department of Conservation 2010).

Affected Environment
Page 3-38 Ocotillo Sol Project Draft EIS/Draft CDCA Plan Amendment
April 2012
3.5 WATER RESOURCES
3.5.1 APPLICABLE REGULATIONS, PLANS, AND POLICIES/MANAGEMENT GOALS
3.5.1.1 CLEAN WATER ACT
The Federal Water Pollution Control Act was passed in 1972 and was amended in 1977 as the Clean Water Act (CWA; 33 USC 1251-1376). The CWA was reauthorized in 1981, 1987, and 2000. The CWA provides guidance for the restoration and maintenance of the chemical, physical, and biological integrity of the nation's waters. Many pollutants are regulated under the CWA, including various toxic pollutants, total suspended solids, biological oxygen demand and pH (acidity/alkalinity measure scale).
3.5.1.1.1 Sections 301 and 402 Sections 301 and 402 of the CWA prohibit the discharge of pollutants (except for fill and dredged material, which are regulated under Section 401 and 404 of the CWA) from point sources to Waters of the U.S., unless authorized under a NPDES permit, issued by the EPA or by agencies in delegated states. The NPDES permit program has been delegated in California to the State Water Resources Control Board (WRCB). These sections of the CWA require that an applicant for a federal license or permit that allows activities resulting in a discharge to Waters of the U.S. must obtain a state certification that the discharge complies with other provisions of the CWA. The California Regional Water Quality Control Board (RWQCB)–Colorado River Region administers the NPDES permits under the CWA in the proposed Ocotillo Sol Project area.
3.5.1.1.2 Section 303 (d) Section 303(d) of the CWA requires states, territories, and authorized tribes to develop a list of surface water bodies that are impaired for water quality. The waters on the list are designated as not meeting water quality standards, even after point sources of pollution have installed the minimum required levels of pollution-control technology. The law requires that priority rankings be established for waters on the list for the development of action plans, called Total Maximum Daily Loads, to improve water quality. Total Maximum Daily Loads are a calculation of the maximum amount of pollutant that a surface water body can receive and still safely meet water quality standards.
3.5.1.2 NATIONAL FLOOD INSURANCE PROGRAM
The Federal Emergency Management Agency (FEMA) administers the National Flood Insurance Program, a federal program enabling property owners in participating communities to purchase insurance protection against losses from flooding. In support of this program, FEMA identifies flood hazard areas throughout the U.S. and its territories by producing flood hazard boundary maps, flood insurance rate maps, and flood boundary and floodway maps. Participation in the National Flood Insurance Program is based on an agreement between communities and the federal government. The agreement states that if a community adopts and enforces a floodplain
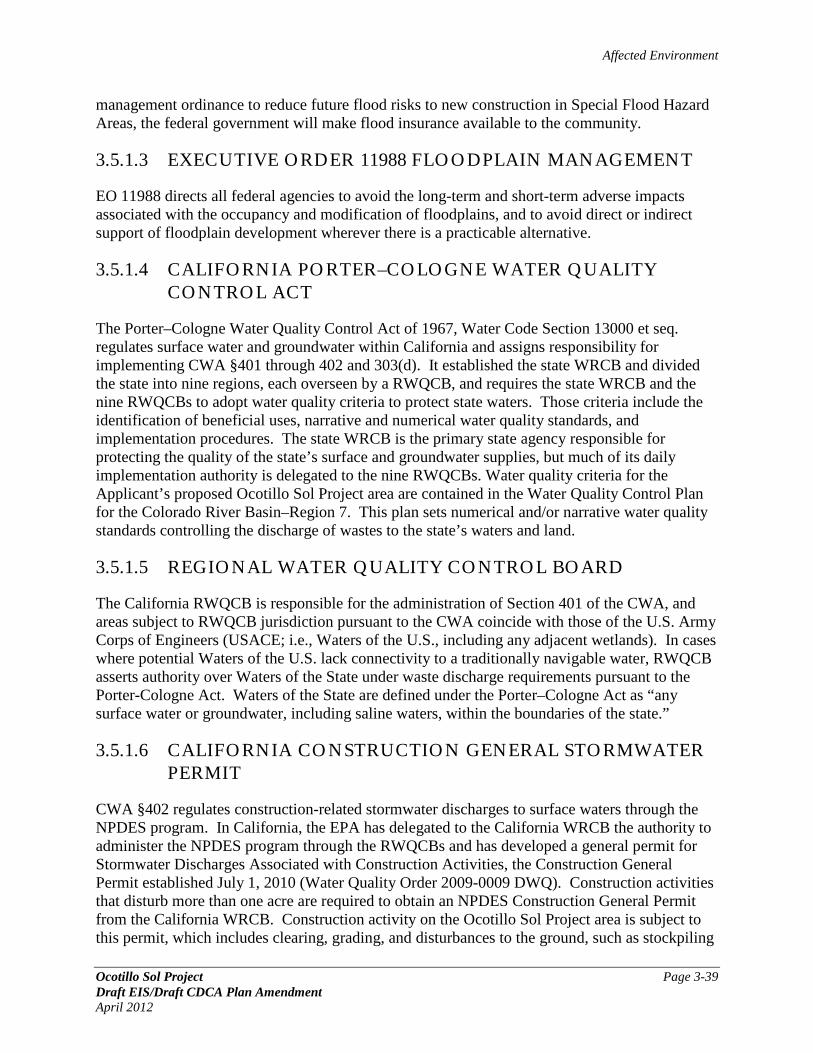
Affected Environment
Ocotillo Sol Project Page 3-39 Draft EIS/Draft CDCA Plan Amendment April 2012
management ordinance to reduce future flood risks to new construction in Special Flood Hazard Areas, the federal government will make flood insurance available to the community.
3.5.1.3 EXECUTIVE ORDER 11988 FLOODPLAIN MANAGEMENT
EO 11988 directs all federal agencies to avoid the long-term and short-term adverse impacts associated with the occupancy and modification of floodplains, and to avoid direct or indirect support of floodplain development wherever there is a practicable alternative.
3.5.1.4 CALIFORNIA PORTER–COLOGNE WATER QUALITY CONTROL ACT
The Porter–Cologne Water Quality Control Act of 1967, Water Code Section 13000 et seq. regulates surface water and groundwater within California and assigns responsibility for implementing CWA §401 through 402 and 303(d). It established the state WRCB and divided the state into nine regions, each overseen by a RWQCB, and requires the state WRCB and the nine RWQCBs to adopt water quality criteria to protect state waters. Those criteria include the identification of beneficial uses, narrative and numerical water quality standards, and implementation procedures. The state WRCB is the primary state agency responsible for protecting the quality of the state’s surface and groundwater supplies, but much of its daily implementation authority is delegated to the nine RWQCBs. Water quality criteria for the Applicant’s proposed Ocotillo Sol Project area are contained in the Water Quality Control Plan for the Colorado River Basin–Region 7. This plan sets numerical and/or narrative water quality standards controlling the discharge of wastes to the state’s waters and land.
3.5.1.5 REGIONAL WATER QUALITY CONTROL BOARD
The California RWQCB is responsible for the administration of Section 401 of the CWA, and areas subject to RWQCB jurisdiction pursuant to the CWA coincide with those of the U.S. Army Corps of Engineers (USACE; i.e., Waters of the U.S., including any adjacent wetlands). In cases where potential Waters of the U.S. lack connectivity to a traditionally navigable water, RWQCB asserts authority over Waters of the State under waste discharge requirements pursuant to the Porter-Cologne Act. Waters of the State are defined under the Porter–Cologne Act as “any surface water or groundwater, including saline waters, within the boundaries of the state.”
3.5.1.6 CALIFORNIA CONSTRUCTION GENERAL STORMWATER PERMIT
CWA §402 regulates construction-related stormwater discharges to surface waters through the NPDES program. In California, the EPA has delegated to the California WRCB the authority to administer the NPDES program through the RWQCBs and has developed a general permit for Stormwater Discharges Associated with Construction Activities, the Construction General Permit established July 1, 2010 (Water Quality Order 2009-0009 DWQ). Construction activities that disturb more than one acre are required to obtain an NPDES Construction General Permit from the California WRCB. Construction activity on the Ocotillo Sol Project area is subject to this permit, which includes clearing, grading, and disturbances to the ground, such as stockpiling

Affected Environment
Page 3-40 Ocotillo Sol Project Draft EIS/Draft CDCA Plan Amendment
April 2012
or excavation, but does not include regular maintenance activities performed to restore the original line, grade, or capacity of the facility. The General Permit requires the preparation and implementation of a SWPPP.
3.5.1.7 CALIFORNIA INDUSTRIAL STORMWATER PROGRAM
Industrial activities, including electrical power generating facilities, in California with the potential to impact stormwater discharges are required to obtain an Industrial Stormwater General Permit, Order 97-03-DWQ (General Industrial Permit CAS 000001). The Industrial Stormwater General Permit requires the implementation of management measures that will protect water quality. In addition, the discharger must develop and implement a SWPPP and a monitoring plan. The monitoring plan requires sampling of stormwater discharges during the wet season and visual inspections during the dry season. A report must be submitted to the RWQCB each year by July 1 documenting the status of the program and monitoring results.
3.5.1.8 IMPERIAL COUNTY GENERAL PLAN
The County of Imperial General Plan Water Element contains policies for the protection of county groundwater and surface water from toxic or hazardous materials and wastes. The Water Element also has policies for the effective and efficient management of water resources through interagency and inter-jurisdictional coordination and cooperation. The Conservation and Open Space Element of the General Plan has water-related policies that prohibit structural development within designated floodways.
3.5.2 EXISTING CONDITIONS
The Ocotillo Sol Project area is in a relatively flat desert area within the larger Yuha Desert region, and is surrounded by large agricultural fields (north and east) and desert habitat (west and south). The area is very sparsely populated. The Westside Main Canal runs generally north–south and lies east of the Ocotillo Sol Project area. Drainage within the general area typically flows in a northeasterly to easterly direction.
3.5.2.1 SURFACE WATER RESOURCES
The Ocotillo Sol Project area lies within the western portion of the Imperial Valley. Surface waters within the Imperial Valley mostly drain toward the Salton Sea. The New and Alamo rivers convey agricultural irrigation drainage water from farmlands in the Imperial Valley, surface runoff, and lesser amounts of treated municipal and industrial wastewaters from the Imperial Valley. Average annual precipitation is approximately less than three inches in the project vicinity (Imperial County 2006). Colorado River water via the All American Canal is the predominant water supply for the Imperial Valley and is used for irrigation, industrial, and domestic purposes. The nearest permanent surface water body is the Westside Main Canal, which is approximately 0.5 mile northeast of the Ocotillo Sol Project area.
Water enters the Ocotillo Sol Project area in the form of direct precipitation (rainfall). Although no surface water was present on the Ocotillo Sol Project area during the site surveys, evidence of surface water flows from previous rainfall events was observed in the southeast corner. Pinto

Affected Environment
Ocotillo Sol Project Page 3-41 Draft EIS/Draft CDCA Plan Amendment April 2012
Wash, located off-site and south of the Ocotillo Sol Project area, is a well-defined ephemeral desert wash conveying seasonal runoff. A survey conducted by LSA Associates, Inc. determined that no Waters of the U.S. are present within the Ocotillo Sol Project area (2010).
Limited water use would be required for the proposed Ocotillo Sol Project during construction and operation (San Diego Gas & Electric 2010). Possible water sources for construction include the following:
Surface water sourced from the Imperial Irrigation District and trucked to the Ocotillo Sol Project area
Surface water from municipal water systems in the Ocotillo Sol Project area and trucked to the site
A determination and assessment of the expected water source will be included in the Final EIS.
3.5.2.2 GROUNDWATER RESOURCES
The Ocotillo Sol Project area is within the Imperial Valley Groundwater Basin, which comprises approximately 1,870 square miles within Imperial County. The Ocotillo Sol Project area is within the Imperial Hydrologic Unit. Within this unit, groundwater is stored in the Pleistocene sediments of the valley floor, the mesas on the west (West Mesa groundwater recharge area), and the East Mesa and Imperial Sand Dunes on the east. The fine-grained lake sediments in the central portion of Imperial Valley inhibit groundwater movement, and tile-drain systems are used to dewater sediments to a depth below the root zone of crops and to prevent the accumulation of saline water on the surface (Imperial County 2006).
Few wells have been drilled in these lake sediments because the yield is poor and the water is generally saline. These wells in the Imperial Valley are for domestic use only. Factors that diminish groundwater reserves are consumptive use, evapotranspiration, evaporation from soils where groundwater is near the surface, and losses through outflow and export.
The Imperial Valley Groundwater Basin has two major aquifers, separated at depth by a semi-permeable aquitard that averages 60 feet thick and reaches a maximum thickness of 280 feet (California Department of Water Resources 2004). The aquifers consist mostly of alluvial deposits of late Tertiary and Quaternary age. Average thickness of the upper aquifer is 200 feet with a maximum thickness of 450 feet. The lower aquifer averages 380 feet thick with a maximum thickness of 1,500 feet. As much as 80 feet of fine-grained, low-permeability prehistoric lake deposits have accumulated on the nearly flat valley floor and cause locally confined aquifer conditions (California Department of Water Resources 2004).
3.5.2.3 FLOOD CONTROL
Flood zone information for the Ocotillo Sol Project area is delineated on the FEMA Flood Insurance Rate Maps. The FEMA community-level floodplain maps were created during the late 1970s through the early 1980s to identify 100-year floodplains, 500-year floodplains, and estimated flood depths. Flood zones are geographic areas that FEMA has defined according to varying levels of flood risk. There are two flood zones in the vicinity, Flood Zone X and Flood

Affected Environment
Page 3-42 Ocotillo Sol Project Draft EIS/Draft CDCA Plan Amendment
April 2012
Zone A. Areas designated as Flood Zone X are those with minimal flood hazard. These areas have a 0.2 percent annual chance of flooding (also known as the 500-year flood event). Areas designated as Flood Zone A are those with a high risk of flooding. These areas have a 1 percent annual chance of flooding (also known as the 100-year flood event).
The Ocotillo Sol Project area is within Flood Zone X and outside of the 100-year floodplain (Flood Zone A; FEMA 2011). The southern limits of the Ocotillo Sol Project area are approximately 2,000 feet from the nearest Flood Zone A designation. Portions of the area south of the Ocotillo Sol Project area would be subject to Flood A conditions (i.e., within the 100-year flood event). These portions include existing agricultural fields to the southeast. Based on historical aerial photos of the area, these agricultural fields have been present since at least 2005. Recent aerial photographs of the area seem to indicate that flows from Pinto Wash do not flow across the existing agricultural fields, but rather flow through the area in a northeastern and southeastern path around the agricultural fields. FEMA has updated the floodplain data for this area, which became effective August 2008. Because the floodplain data has been updated to incorporate previously approved map amendments and data from flooding that has occurred, it is anticipated that this area southeast of the Ocotillo Sol Project site would still be subject to 100-year flood despite the presence of the agricultural fields and berms.
3.5.2.4 WATER QUALITY
The Ocotillo Sol Project area is within the unincorporated area of Imperial County and under the jurisdiction of the RWQCB–Colorado River Region (Region 7; RWQCB 2005). In general, groundwater within the Imperial Valley groundwater basin is unusable for domestic and irrigation uses without treatment.
Groundwater in the area is not used for municipal or domestic supply and there are no nearby wells. In the western section of the valley, water quality varies widely. Almost all of the wells in Coyote Valley have total dissolved solids concentrations below 500 milligrams per liter. West Mesa wells have levels between 1,800 and 5,200 milligrams per liter (Imperial County 2006; California Department of Water Resources 2004).
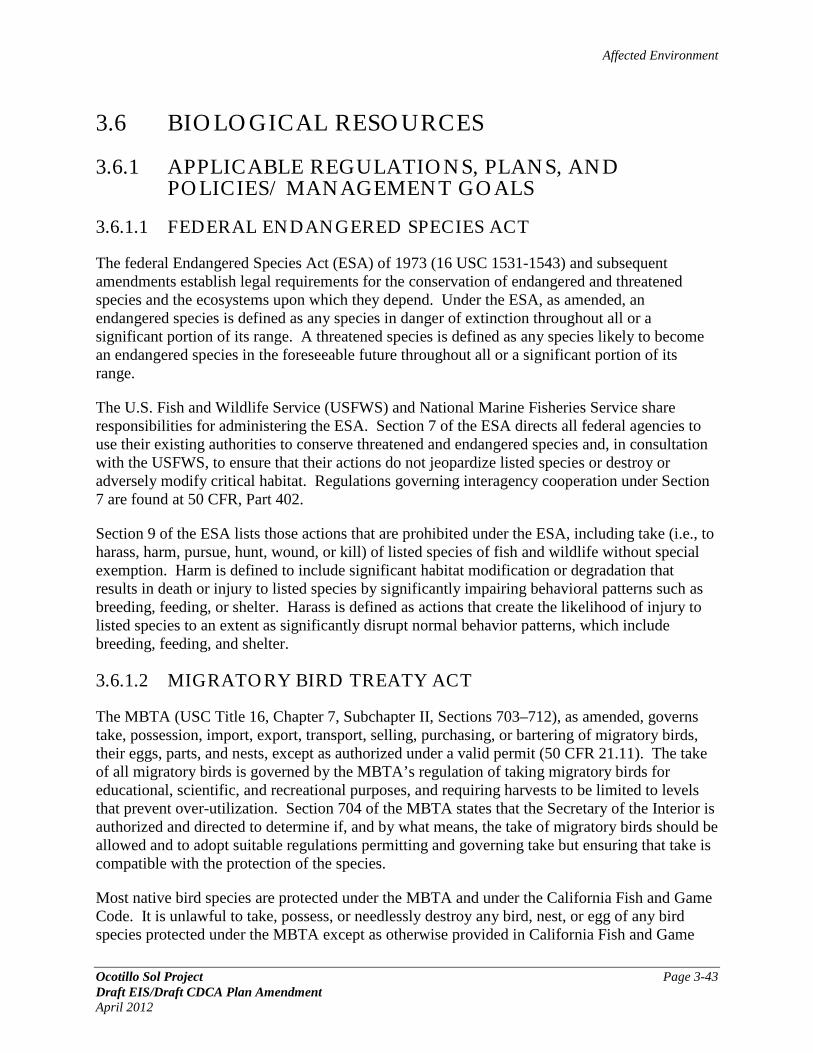
Affected Environment
Ocotillo Sol Project Page 3-43 Draft EIS/Draft CDCA Plan Amendment April 2012
3.6 BIOLOGICAL RESOURCES
3.6.1 APPLICABLE REGULATIONS, PLANS, AND POLICIES/ MANAGEMENT GOALS
3.6.1.1 FEDERAL ENDANGERED SPECIES ACT
The federal Endangered Species Act (ESA) of 1973 (16 USC 1531-1543) and subsequent amendments establish legal requirements for the conservation of endangered and threatened species and the ecosystems upon which they depend. Under the ESA, as amended, an endangered species is defined as any species in danger of extinction throughout all or a significant portion of its range. A threatened species is defined as any species likely to become an endangered species in the foreseeable future throughout all or a significant portion of its range.
The U.S. Fish and Wildlife Service (USFWS) and National Marine Fisheries Service share responsibilities for administering the ESA. Section 7 of the ESA directs all federal agencies to use their existing authorities to conserve threatened and endangered species and, in consultation with the USFWS, to ensure that their actions do not jeopardize listed species or destroy or adversely modify critical habitat. Regulations governing interagency cooperation under Section 7 are found at 50 CFR, Part 402.
Section 9 of the ESA lists those actions that are prohibited under the ESA, including take (i.e., to harass, harm, pursue, hunt, wound, or kill) of listed species of fish and wildlife without special exemption. Harm is defined to include significant habitat modification or degradation that results in death or injury to listed species by significantly impairing behavioral patterns such as breeding, feeding, or shelter. Harass is defined as actions that create the likelihood of injury to listed species to an extent as significantly disrupt normal behavior patterns, which include breeding, feeding, and shelter.
3.6.1.2 MIGRATORY BIRD TREATY ACT
The MBTA (USC Title 16, Chapter 7, Subchapter II, Sections 703–712), as amended, governs take, possession, import, export, transport, selling, purchasing, or bartering of migratory birds, their eggs, parts, and nests, except as authorized under a valid permit (50 CFR 21.11). The take of all migratory birds is governed by the MBTA’s regulation of taking migratory birds for educational, scientific, and recreational purposes, and requiring harvests to be limited to levels that prevent over-utilization. Section 704 of the MBTA states that the Secretary of the Interior is authorized and directed to determine if, and by what means, the take of migratory birds should be allowed and to adopt suitable regulations permitting and governing take but ensuring that take is compatible with the protection of the species.
Most native bird species are protected under the MBTA and under the California Fish and Game Code. It is unlawful to take, possess, or needlessly destroy any bird, nest, or egg of any bird species protected under the MBTA except as otherwise provided in California Fish and Game

Affected Environment
Page 3-44 Ocotillo Sol Project Draft EIS/Draft CDCA Plan Amendment
April 2012
Codes and regulations. Disturbances at the active nesting territories should be avoided during the nesting season, typically February through August.
BLM’s responsibility under the MBTA was clarified in a Memorandum of Understanding with the USFWS pursuant to EO 13186 (BLM 2010).
3.6.1.3 BALD AND GOLDEN EAGLE PROTECTION ACT
Under the authority of the Bald and Golden Eagle Protection Act (16 USC 668-668d), bald eagles and golden eagles are afforded additional legal protection. Take under this statute is defined as “pursue, shoot, shoot at, poison, wound, kill, capture, trap, collect, or molest or disturb.” Disturb is defined as “to agitate or bother a bald or golden eagle to a degree that causes, or is likely to cause, based on the best scientific information available, 1) injury to an eagle, 2) a decrease in its productivity, by substantially interfering with normal breeding, feeding, or sheltering behavior” (50 CFR § 22.3). If a proposed project or action would occur in areas where nesting, feeding, or roosting eagles occur, then project proponents may need to incorporate additional conservation measures into projects to achieve compliance with the Bald and Golden Eagle Protection Act and applicable regulations, guidance, and policies.
3.6.1.4 PLANT PROTECTION ACT
The Plant Protection Act (Public Law 106-224 [June 20, 2000]) replaced the Federal Noxious Weed Act and many other U.S. Department of Agriculture Animal and Plant Health Inspection Service Plant Protection Authorities. This Act consolidates and modernizes all major statutes pertaining to plant protection and quarantine (Federal Noxious Weed Act, Plant Quarantine Act). The noxious weed list for California is available from the Natural Resource Conservation Service.
3.6.1.5 EXECUTIVE ORDER 13112 INVASIVE SPECIES
EO 13112 defines invasive species and provides the authority for federal agencies to prevent the introduction of invasive species and provide for their control and to minimize the economic, ecological, and human health impacts that invasive species cause.
3.6.1.6 CLEAN WATER ACT
The CWA (33 USC 1251-1376) establishes legal requirements for the restoration and maintenance of the chemical, physical, and biological integrity of the nation’s waters. Section 401 of the CWA requires that an applicant for a federal license or permit that allows activities resulting in a discharge to waters of the U.S. must obtain a state certification that the discharge complies with other provisions of the CWA. The RWQCBs administer the certification program in California.
Section 404 of the CWA establishes a permit program administered by USACE regulating the discharge of dredged or fill material into waters of the U.S., including wetlands. Implementing regulations by USACE are found at 33 CFR Parts 320-330. Guidelines for implementation are referred to as the Section 404(b)(1) Guidelines and were developed by the EPA in conjunction

Affected Environment
Ocotillo Sol Project Page 3-45 Draft EIS/Draft CDCA Plan Amendment April 2012
with USACE (40 CFR Parts 230). The guidelines allow the discharge of dredged or fill material into the aquatic system only if there is no practicable alternative that would have less adverse impacts.
3.6.1.7 EXECUTIVE ORDER 11988 FLOODPLAIN MANAGEMENT
EO 11988 directs all federal agencies to avoid the long-term and short-term adverse impacts associated with the occupancy and modification of floodplains, and to avoid direct or indirect support of floodplain development wherever there is a practicable alternative.
3.6.1.8 EXECUTIVE ORDER 11990 PROTECTION OF WETLANDS
EO 11990 directs all federal agencies to avoid to the extent possible the long- and short-term adverse impacts associated with the destruction or modification of wetlands and to avoid direct or indirect support of new construction in wetlands wherever there is a practicable alternative.
3.6.1.9 CALIFORNIA DESERT CONSERVATION AREA PLAN
The Wildlife Element of the CDCA Plan contains objectives and goals designed to:
Manage federally and state-listed species and their habitats
Comply with existing legislation and BLM policies
Provide certain species designated as sensitive by the BLM special consideration and attention in the planning process
Consider the habitat of all fish and wildlife in implementing the CDCA Plan
Manage representative habitats using a holistic approach
Give habitats unique to the CDCA special management consideration and manage them so as to maintain their unique biological characteristics
Manage sensitive habitat using a holistic, systems-type approach
Some examples of sensitive habitats include riparian areas, wetlands, sand dunes, relict and island habitats, washes, and important ecological zones between different major ecosystems and deserts. The primary active wildlife management tools used in the CDCA Plan are ACECs and Habitat Management Plans. The CDCA Plan also affords protection to fish and wildlife resources through the designation of Multiple Use Class L, which limits the number and location of routes that are approved. The proposed Ocotillo Sol Project area falls within the Yuha Basin ACEC of the CDCA, and is within the Utility Corridor N, as designated by the CDCA.
3.6.1.10 FLAT-TAILED HORNED LIZARD RANGEWIDE MANAGEMENT STRATEGY
The Flat-tailed Horned Lizard Interagency Coordinating Committee’s 2003 Flat-tailed Horned Lizard Rangewide Management Strategy designated five Management Areas to help focus conservation and management of flat-tailed horned lizard key populations. For disturbances over

Affected Environment
Page 3-46 Ocotillo Sol Project Draft EIS/Draft CDCA Plan Amendment
April 2012
10 acres, the Interagency Coordinating Committee and Management Oversight Group must be contacted for concurrence.
The CDCA Plan was amended in 2004 for the adoption of the Flat-tailed Horned Lizard Rangewide Management Strategy, 2003 Revision, An Arizona-California Conservation Strategy. The purpose of this strategy is to provide a framework for conserving sufficient habitat to maintain four viable populations of the flat-tailed horned lizard throughout the species’ range. Planning actions and prescriptions that guide the management of lands within the designated management areas are designed primarily to reduce new surface disturbance and to promote reclamation of disturbed sites. The strategy provides mitigation measures (Appendix 3 of the strategy) and a compensation formula (Appendix 4 of the strategy), to be incorporated into all authorized surface-disturbing projects where applicable.
3.6.1.11 CALIFORNIA ENDANGERED SPECIES ACT
The California ESA (California Fish and Game Code, Division 3, Chapter 1.5, Sections 2050–2115) is administered by the California Department of Fish and Game (CDFG) and prohibits the take of plant and animal species identified as either threatened or endangered in California by the Fish and Game Commission. Take is defined as hunt, pursue, catch, capture, or kill. Sections 2091 and 2081 of the California ESA allow CDFG to authorize exceptions to the prohibition of take of the state-listed threatened or endangered plant or animal species for purposes such as public and private development. The CDFG requires formal consultation to ensure that a proposed project’s actions would not jeopardize the continued existence of any listed species or destroy or adversely affect listed species’ habitats.
3.6.1.12 NATIVE PLANT PROTECTION ACT
California’s Native Plant Protection Act (Fish and Game Code 1900-1913) requires all state agencies to use their authority to carry out programs to conserve endangered and rare native plants. Provisions of the Native Plant Protection Act prohibit the taking of listed plants from the wild and require notification of the CDFG at least 10 days in advance of any change in land use. This allows CDFG to salvage listed plant species that would otherwise be destroyed.
3.6.1.13 CALIFORNIA FISH AND GAME CODE, SECTIONS 1600–1616
Under these sections of the Fish and Game Code, CDFG jurisdiction is determined to occur within the water body of any natural river, stream, or lake. The term stream, which includes creeks and rivers, is defined in Title 14, California Code of Regulations, Section 1.72. An applicant is required to notify CDFG prior to constructing any project that would divert, obstruct, or change the natural flow, bed, channel, or bank of any river, stream, or lake. Preliminary notification and project review generally occur during the environmental process. When an existing fish or wildlife resource may be substantially adversely affected, CDFG is required to propose reasonable project changes to protect the resource. These modifications are formalized in a Streambed Alteration Agreement that becomes part of the plans, specifications, and bid documents for a project.

Affected Environment
Ocotillo Sol Project Page 3-47 Draft EIS/Draft CDCA Plan Amendment April 2012
3.6.1.14 PORTER-COLOGNE WATER QUALITY CONTROL ACT
The Porter–Cologne Water Quality Control Act (California Water Code, Division 7, Sections 13000–14958) provides for statewide coordination of water quality regulations. The Act established the California State Water Resources Control Board as the statewide authority and nine separate RWQCBs to oversee water quality on a day-to-day basis at the regional/local level.
3.6.1.15 CALIFORNIA FISH AND GAME CODE 3503.5
Raptors (birds of prey) and active raptor nests are protected by the California Fish and Game Code 3503.5, which states that it is “unlawful to take, possess, or destroy any birds of prey or to take, possess, or destroy the nest or eggs of any such bird” unless authorized.
3.6.1.16 CALIFORNIA FISH AND GAME CODE 3503
Bird nests and eggs are protected by the California Fish and Game Code 3503, which states “it is unlawful to take, possess, or needlessly destroy the nest or eggs of any bird, except as otherwise provided by this code or any regulation made pursuant thereto.”
3.6.1.17 CALIFORNIA FISH AND GAME CODE 3513
Protects California’s migratory birds by making it unlawful to take or possess any migratory nongame bird as designated in the MBTA or any part of such migratory nongame birds.
3.6.1.18 STATE OF CALIFORNIA FULLY PROTECTED SPECIES
The classification of Fully Protected was the state's initial effort in the 1960s to identify and provide additional protection to those animals that were rare or faced possible extinction. Lists were created for fish, mammals, amphibians and reptiles, birds and mammals. Most fully protected species have also been listed as threatened or endangered species under ESA and/or California ESA. Fully protected species may not be taken or possessed at any time, and no licenses or permits may be issued for their take except for collecting these species for necessary scientific research and relocation of the bird species for the protection of livestock.
3.6.1.19 IMPERIAL COUNTY GENERAL PLAN
The Imperial County General Plan Conservation and Open Space Element provides detailed plans and measures for the preservation and management of biological and cultural resources, soils, minerals, energy, regional aesthetics, air quality, and open space. The purpose of the Conservation and Open Space Element is to promote the protection, maintenance, and use of natural resources within the county with particular emphasis on scarce resources and to prevent wasteful exploitation, destruction, and neglect of the state’s natural resources. The primary purpose of Conservation and Open Space Element is to recognize that natural resources must be maintained for their ecological value for the direct benefit to the public, protect open space for the preservation of natural resources, the managed production of resources, outdoor recreation, and for public health and safety (Imperial County 2011).

Affected Environment
Page 3-48 Ocotillo Sol Project Draft EIS/Draft CDCA Plan Amendment
April 2012
3.6.2 METHODOLOGY
LSA biologists conducted on-site assessments to identify and document botanical and wildlife species, map jurisdictional areas and natural communities, and evaluate suitability of habitat for various special status species (see Appendix C; Appendixes F–H). From October 2009 through the spring of 2010, the study area consisted of approximately 350 acres (hereafter referred to as the spring survey area or original study area) east, south, and west of the existing substation. After the project was refined to avoid and minimize impacts to biological and cultural resources, the survey area was reduced to approximately 142 acres (herein referred to as the fall survey area) primarily located south of the substation. The fall survey area included the Ocotillo Sol Project area (115 acres) surrounded by a 150-foot buffer in undeveloped areas (Figure 3.6-1 in Appendix A). Surveys conducted by LSA are described below.
General Biological Survey and Vegetation Mapping. Reconnaissance-level field surveys of the spring survey area were conducted on October 26 and 27, and November 30, 2009, to evaluate habitat for special status species and to map natural communities. Natural communities were classified according to the CDFG Biogeographic Data Branch Vegetation Classification and Mapping Program, List of California Vegetation Alliances (see Appendix C), and mapped using global positioning system (GPS) units and geographic information systems (GIS) software.
Protocol Rare Plant Surveys. The rare plant surveys were conducted in accordance with BLM guidance by biologists qualified to conduct botanical surveys. All plant taxa observed were documented and identified at least to the taxonomic level required to determine rarity status. The survey consisted of three survey periods in 2010 (see Appendix F).
Protocol Flat-tailed Horned Lizard Survey. Protocol surveys for flat-tailed horned lizard were conducted on September 23, 2009, by Natural Resources Assessment, Inc. (NRA) and LSA.
Protocol Burrowing Owl Survey. In October 2009 and May 2010, LSA conducted six field visits to the 350-acre spring survey area. Protocol-level burrowing owl surveys were conducted in accordance with the California Burrowing Owl Consortium’s 1993 Burrowing Owl Survey Protocol and Mitigation Guidelines, which included a preliminary burrow survey in 2009 followed by subsequent focused breeding season surveys in 2010 (see Appendix C).
Avian Point-count Survey. LSA conducted focused avian point-count surveys in accordance with the BLM Solar Facility Point Count Protocol (2009). Winter surveys were conducted on November 11, 18, and 30 and December 7, 2010. Spring surveys were conducted on March 2, 11, 18, and 25, 2011. The area under consideration is the Ocotillo Sol Project area (115 acres) plus a 150-foot buffer (27 acres), which totals approximately 142 acres (see Appendixes G and H). Data from avian surveys conducted in nearby areas were also considered (BLM and County of Imperial 2011).
Jurisdictional Delineation and Mapping. On October 26, 2009, LSA conducted a field survey of areas considered potentially jurisdictional by USACE pursuant to Section 404 of the CWA, the RWQCB pursuant to Section 401 of the CWA, or the Porter–Cologne Act and the CDFG pursuant to Section 1600 et seq. of the California Fish and Game Code within the approximately 350-acre original study area. Areas of potential jurisdiction were evaluated according to current

Affected Environment
Ocotillo Sol Project Page 3-49 Draft EIS/Draft CDCA Plan Amendment April 2012
USACE and CDFG criteria. USACE wetland delineation procedures, including excavation of sample pits and wetland data sheets, were not completed because no federally regulated Waters of the U.S. were identified within the 142-acre fall survey area (see Appendix C).
3.6.3 VEGETATION RESOURCES
3.6.3.1 NATURAL COMMUNITIES AND FLORA
The only natural community on the 115-acre Ocotillo Sol Project area is the Larrea tridentata–Ambrosia dumosa Alliance (see Figure 3.6-1 in Appendix A; see also Appendix C). This community is dominated by creosote bush (Larrea tridentata), burrobush (Ambrosia dumosa), Panamint cryptantha (Cryptantha angustifolia), desert Indianwheat (Plantago ovata), and common Mediterranean grass (Schismus barbatus). Creosote bush, as well as a few other native perennial shrubs such as burrobush, is common throughout most of the Ocotillo Sol Project area, but sparse in areas of greater disturbance. The shrub layer, which contains most of the plant biomass and vegetative cover suitable for wildlife use, is dominated by native shrubs, principally creosote bush. The herbaceous layer is generally sparse and dominated by annual species; primarily desert Indianwheat, Panamint cryptantha, and common Mediterranean grass.
Pinto Wash is south of the Ocotillo Sol Project area, but within the 142-acre survey area. The predominant natural community in Pinto Wash is the Larrea tridentata Alliance, which is dominated by creosote bush, Panamint cryptantha, and common Mediterranean grass. The Psorothamnus spinosus Alliance occupies a smaller portion of Pinto Wash, and is dominated by smoketree (Psorothamnus spinosus), cryptantha (Cryptantha sp.), common Mediterranean grass, and desert sand verbena (Abronia villosa var. villosa). The Psorothamnus spinosus Alliance in Pinto Wash (see Figure 3.6-1 in Appendix A) is a “rare or unusual plant community” as defined in the BLM plant survey protocol. This natural community is within the LSA spring survey area, but is not within the fall survey area or within the 115-acre Ocotillo Sol Project area.
A Tamarix aphylla semi-natural non-native stand occurs in the northern portion of the 350-acre spring survey area just east of the existing substation. This vegetation type is dominated by athel (Tamarix aphylla), cryptantha, creosote bush, and common Mediterranean grass.
A list of all plant species identified within the survey area is found in the Biological Resources Technical Report (see Appendix C).
3.6.3.2 SPECIAL STATUS PLANTS
Based on analysis of species ranges and habitat requirements, it was determined that the Ocotillo Sol Project area may provide potentially suitable habitat for the following species, which became the target species of the focused plant survey:
Chaparral sand-verbena (Abronia villosa var. aurita)
Harwood’s milk-vetch (Astragalus insularis var. harwoodii) Emory’s crucifixion-thorn (Castela emoryi) Abrams’ spurge (Chamaesyce abramsiana)

Affected Environment
Page 3-50 Ocotillo Sol Project Draft EIS/Draft CDCA Plan Amendment
April 2012
Baja California ipomopsis (Ipomopsis effusa)
Brown turbans (Malperia tenuis)
Hairy stickleaf (Mentzelia hirsutissima)
Slender woolly-heads (Nemacaulis denudata var. gracilis)
Thurber’s pilostyles (Pilostyles thurberi)
3.6.3.2.1 Thurber’s pilostyles One target species, Thurber’s pilostyles (Pilostyles thurberi), was found within the 350-acre spring survey area, but outside of the 142-acre fall survey area (see Figure 3.6-1 in Appendix A) and Ocotillo Sol Project area. Thurber’s pilostyles is not a special status species (as defined in the BLM plant survey protocol) and is not considered sensitive, but is monitored by the California Native Plant Society as a List 4.3 species. The other target species were not detected, and are determined to be absent at this time as summarized in Appendix A of the Biological Resources Technical Report (see Appendix C). The plant survey report is attached as Appendix F.
No special status plant species were observed within the spring survey area. Based on the level of disturbance within the survey area and the results of the focused rare plant surveys, no special status plant species are expected to occur within the survey area, and none are expected to occur within the Ocotillo Sol Project impact area.
3.6.3.3 RIPARIAN HABITAT OR SENSITIVE NATURAL COMMUNITIES
Sensitive vegetation communities are those that are considered rare or sensitive based on the level of disturbance or habitat conversion within their range. Vegetation communities associated with wetland or riparian habitats such as the smoketree vegetation in Pinto Wash are considered sensitive by CDFG (see Appendix C), but fall outside of the 115-acre Ocotillo Sol Project area.
BLM policy under Manual 6840 (Section .22C) states that conservation of plants and animals and their habitats will be conducted to reduce, mitigate, and possibly eliminate the need for their identification as a special status species. The Larrea tridentata–Ambrosia dumosa vegetation within the Ocotillo Sol Project area is considered occupied by the flat-tailed horned lizard and conservation measures under BLM guidelines would apply (BLM 2001).
3.6.3.4 NOXIOUS, INVASIVE, AND NON-NATIVE WEEDS
Invasive weeds are generally considered plants that are capable of rapid, unchecked growth and spread into areas where the plants are not desirable and are capable of causing harm to the environment. For the purpose of this document, weeds are defined as any plant included on the federal noxious weed list (U.S. Department of Agriculture 2010), the California Department of Feed and Agriculture (CDFA) Noxious weed list (CDFA 2010) and/or is included in the California Invasive Plant Council’s Invasive Plant Inventory (Cal-IPC 2012). The spread of weeds results in impacts to agricultural resources and wildland natural resources by displacing crops and native species, increasing the risk and intensity of wildfires, and altering habitat structure and functions.

Affected Environment
Ocotillo Sol Project Page 3-51 Draft EIS/Draft CDCA Plan Amendment April 2012
No federally listed noxious weeds were observed during the botanical surveys. Four non-native plants were identified that are included on the CDFA noxious weed list and/or the Cal-IPC Invasive Plant Inventory (Table 3.6-1).
TABLE 3.6-1 NON-NATIVE PLANT SPECIES OBSERVED WITHIN THE 115-ACRE OCOTILLO SOL
PROJECT AREA
Scientific Name Common Name Cal-IPC Ranking CDFA Ranking
Asteraceae Sunflower family
Lactuca serriola Prickly lettuce No ranking No ranking
Sonchus oleraceus Common sow thistle No ranking No ranking
Brassicaceae Mustard family
Brassica tournefortii Sahara mustard High No ranking
Chenopodiaceae Saltbush family
Chenopodium murale Nettleleaf goosefoot No ranking No ranking
Tamaricaceae Tamarisk family
Tamarix aphylla Athel Limited No ranking
Tamarix ramosissima Mediterranean tamarisk High B; state-listed noxious
Poaceae Grass family
Schismus barbatus Common Mediterranean grass Limited No ranking
3.6.4 WILDLIFE
3.6.4.1 GENERAL WILDLIFE
The primary natural community within the Ocotillo Sol Project area is the Larrea tridentata–Ambrosia dumosa Alliance, which provides suitable habitat for a variety of native wildlife species. In the vicinity of the Ocotillo Sol Project area, a variety of disturbances to this community have occurred, including grading and vegetation removal for roadways, transmission lines, and the Imperial Valley Substation. Eleven reptile species, 66 bird species (including three non-native species), and five mammal species were observed or otherwise detected during LSA’s field surveys. A complete list of all animal species identified within the survey area is included in Appendix C.
Reptile species observed are typical of open desert habitat and include side-blotched lizard (Uta stansburiana), sidewinder (Crotalus cerastes), desert iguana (Dipsosaurus dorsalis), western whiptail (Cnemidophorus tigris), and zebra-tailed lizard (Callisaurus draconoides).
Bird species frequently observed include turkey vulture (Cathartes aura), mourning dove (Zenaida macroura), rock pigeon (Columba livia), greater roadrunner (Geococcyx californianus), black-tailed gnatcatcher (Polioptila melanura), and European starling (Sturnus vulgaris).

Affected Environment
Page 3-52 Ocotillo Sol Project Draft EIS/Draft CDCA Plan Amendment
April 2012
The Ocotillo Sol Project area also provides habitat for several common mammals, including black-tailed jackrabbit (Lepus californicus), kangaroo rat (Dipodomys sp.), desert kit fox (Vulpes macrotis), coyote (Canis latrans), and round-tailed ground squirrel (Spermophilus tereticaudus). Other small and medium-sized mammals may also occur within the Ocotillo Sol Project area.
3.6.4.2 SPECIAL STATUS ANIMALS
Seven special status animal species have a moderate or greater probability of occurring within the 350-acre original study area, and are discussed below, including:
Flat-tailed horned lizard
Burrowing owl
Colorado Desert fringe-toed lizard (Uma notata)
Loggerhead shrike (Lanius ludovicianus)
Palm Springs pocket mouse (Perognathus longimembris bangsi) Pallid San Diego pocket mouse (Chaetodipus fallax pallidus)
Western mastiff bat (Eumops perotis californicus)
Other sensitive wildlife species that may occur near the Ocotillo Sol Project area, based on range or habitat preferences, are evaluated in the Biological Resources Technical Report (see Appendix C). The golden eagle is also discussed below due to its sensitivity and survey requirements.
3.6.4.2.1 Flat-Tailed Horned Lizard Flat-tailed horned lizard is a California Species of Special Concern and a BLM Sensitive species. It has been recorded in high numbers in Sonoran desert scrub habitat. It also inhabits mixed desert scrub and saltbush scrub communities. Once thought to be restricted to windblown sand, it has been found in soil covers ranging from sandy flats or areas with a veneer of fine, windblown sand, to areas with little or no windblown sand. California populations occupy sandy flats and hills, badlands, salt flats and gravelly soils (Grant 2005).
The Ocotillo Sol Project area lies within the range of flat-tailed horned lizard. The Ocotillo Sol Project area is also in the Yuha Desert flat-tailed horned lizard management area, where the BLM has conducted annual monitoring and assisted with studies of this species since 2002. Flat-tailed horned lizard demographic plot density estimates from mark-recapture studies for the Yuha Desert Management Area for 2007 through 2010, as well as population estimates, were comparable with the other management areas in Imperial Valley.
Loose sands suitable to support this species are present within the 350-acre original study area. During protocol flat-tailed horned lizard surveys conducted in September of 2009, scat and tracks were recorded, but no flat-tailed horned lizards were observed within the survey area. Low detectability would be expected for adults this late in the season (Grant 2005). Incidentally, during the rare plant surveys in late March 2010, a juvenile flat-tailed horned lizard was observed in Pinto Wash (see Figure 3.6-1 in Appendix A) and remnants of a flat-tailed horned lizard carcass were observed near the center of the spring survey area at the mouth of a burrow with burrowing owl sign.

Affected Environment
Ocotillo Sol Project Page 3-53 Draft EIS/Draft CDCA Plan Amendment April 2012
The entire survey area, including the 115-acre Ocotillo Sol Project area, is considered to be occupied with flat-tailed horned lizard in accordance the protocol provided in the Flat-tailed Horned Lizard Rangewide Management Strategy (Flat-tailed Horned Lizard Interagency Coordinating Committee 2003) for determination of flat-tailed horned lizard presence. A review of available data shows that the criteria have been met to assume the presence of the species. Specifically, the Ocotillo Sol Project area is within the historical range of the flat-tailed horned lizard, is within two miles of a recorded flat-tailed horned lizard population, habitat on site is contiguous throughout the Ocotillo Sol Project area and the surrounding area extending into areas known to support flat-tailed horned lizard, no major habitat alteration or conversion has taken place in the project area since the species was detected, and there are no barriers between the Ocotillo Sol Project area and areas of known occupation by the flat-tailed horned lizard. The flat-tailed horned lizard survey report is attached as Appendix I.
3.6.4.2.2 Burrowing Owl The burrowing owl is a California Species of Special Concern and a BLM Sensitive species. It frequents a wide range of open habitats, especially those with healthy populations of ground squirrels.
During the burrow survey in October 2009, many potentially suitable burrows were mapped and at least three adult burrowing owls were found occupying four burrows within the 350-acre LSA spring survey area. Two of the occupied burrows were within the 115-acre Ocotillo Sol Project area (see Figure 3.6-1 in Appendix A). In addition, during the rare plant survey in March 2010, a burrowing owl was incidentally observed in flight in the southeast portion of the spring survey area (see Figure 3.6-1 in Appendix A).
Burrowing owls were not found during the four protocol breeding season field visits in May 2010. The four burrows that were occupied at the time of the burrow survey were found to be inactive, and, although over 20 suitable burrows were investigated for sign, no additional active burrows were found. Most suitably sized burrows in the spring survey area were found to be clear of debris and cobwebs and were in marginally suitable foraging habitat. Most burrows were being used by reptiles (i.e., lizards and snakes), rodents, or kit fox.
The results of the burrow survey and protocol breeding season survey indicated that breeding owls were not present on site at the time of the survey, but that the site was used by wintering individuals. During the rare plant survey in late March 2010, a burrowing owl individual was observed near a burrow with owl sign near the center of the spring survey area. The protocol burrowing owl survey report is attached as Appendix J.
3.6.4.2.3 Colorado Desert Fringe-toed Lizard Colorado Desert fringe-toed lizard is a California Species of Special Concern and a BLM Sensitive species. It is found in sandy dunes, flats, and washes in some of the most arid parts of the desert; the same areas favored by flat-tailed horned lizard. The fringe-toed lizard’s habitat requirements appear to be more restrictive than those of the flat-tailed horned lizard. This species was not observed in the Ocotillo Sol Project area during any of the surveys, although habitat appears to be suitable.

Affected Environment
Page 3-54 Ocotillo Sol Project Draft EIS/Draft CDCA Plan Amendment
April 2012
3.6.4.2.4 Loggerhead Shrike Loggerhead shrike is a California Species of Special Concern. It occupies many open habitats, but has undergone population declines across much of its range. California desert populations appear to have been among the least affected to date. Loggerhead shrikes were observed within the 115-acre Ocotillo Sol Project area during site visits, including the winter avian point-count survey (see Appendix G). The species was most numerous during winter surveys, but might also nest in the Ocotillo Sol Project area.
3.6.4.2.5 Palm Springs Pocket Mouse Palm Springs pocket mouse is a California Species of Special Concern and a BLM Sensitive species. It is found in desert scrub on fine sandy soils. Habitat in the Ocotillo Sol Project area appears to be suitable for the species, there is a moderate potential for it to occur. No small mammal trapping was conducted.
3.6.4.2.6 Pallid San Diego Pocket Mouse Pallid San Diego pocket mouse is a California Species of Special Concern. It is found in a variety of arid scrub habitats. Habitat in the Ocotillo Sol Project area appears to be suitable for the species, there is a moderate potential for it to occur. No small mammal trapping was conducted.
3.6.4.2.7 Bats Western mastiff bat is a California Species of Special Concern and a BLM Sensitive species. It occurs in many open, semi-arid to arid habitats, but roosts in crevices in vertical cliff faces, high buildings, trees, and tunnels. Western mastiff bats range widely while foraging, and are likely to forage high over the Ocotillo Sol Project area. No trees or other potential roosting habitat were observed on or adjacent to the Ocotillo Sol Project area.
Pallid bat is a California Species of Concern and a BLM Sensitive species. These bats are found in a wide variety of habitats in all but the highest elevations. They are most common in open, dry habitats with rocky areas for roosting. This species has not been detected in the vicinity and no potential roosting habitat is found within the Ocotillo Sol Project area.
California leaf-nosed bat is a California Species of Concern and a BLM Sensitive species. These bats are found in all but subalpine habitats and roost in caves or abandoned mines, occasionally in buildings. This species has not been detected in the vicinity and no potential roosting habitat is found within the Ocotillo Sol Project area.
3.6.4.2.8 Golden Eagle Nest Survey The golden eagle (Aquila chrysaetos) is a California Fully Protected Species, and is protected under the federal Bald and Gold Eagle Protection Act. It is on the list of BLM Sensitive species for California (BLM 2010). Golden eagles usually require cliffs or large trees for nesting, but forage over a wide range of open habitats. Golden eagles generally forage within 3.7 miles of their nests (see Appendix C), but in desert areas with poor habitat, their foraging territories typically encompass 100 to 120 square miles (see Appendix C), which corresponds to a foraging range of 5.6 to 6.2 miles from the nest.
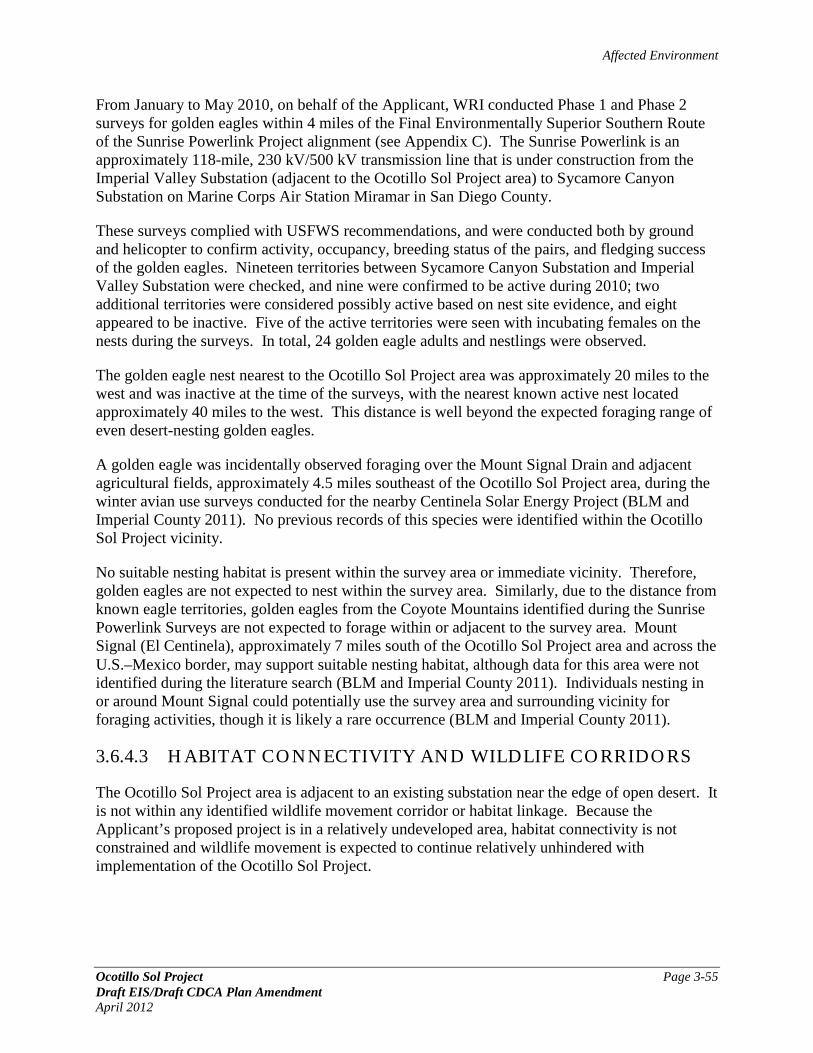
Affected Environment
Ocotillo Sol Project Page 3-55 Draft EIS/Draft CDCA Plan Amendment April 2012
From January to May 2010, on behalf of the Applicant, WRI conducted Phase 1 and Phase 2 surveys for golden eagles within 4 miles of the Final Environmentally Superior Southern Route of the Sunrise Powerlink Project alignment (see Appendix C). The Sunrise Powerlink is an approximately 118-mile, 230 kV/500 kV transmission line that is under construction from the Imperial Valley Substation (adjacent to the Ocotillo Sol Project area) to Sycamore Canyon Substation on Marine Corps Air Station Miramar in San Diego County.
These surveys complied with USFWS recommendations, and were conducted both by ground and helicopter to confirm activity, occupancy, breeding status of the pairs, and fledging success of the golden eagles. Nineteen territories between Sycamore Canyon Substation and Imperial Valley Substation were checked, and nine were confirmed to be active during 2010; two additional territories were considered possibly active based on nest site evidence, and eight appeared to be inactive. Five of the active territories were seen with incubating females on the nests during the surveys. In total, 24 golden eagle adults and nestlings were observed.
The golden eagle nest nearest to the Ocotillo Sol Project area was approximately 20 miles to the west and was inactive at the time of the surveys, with the nearest known active nest located approximately 40 miles to the west. This distance is well beyond the expected foraging range of even desert-nesting golden eagles.
A golden eagle was incidentally observed foraging over the Mount Signal Drain and adjacent agricultural fields, approximately 4.5 miles southeast of the Ocotillo Sol Project area, during the winter avian use surveys conducted for the nearby Centinela Solar Energy Project (BLM and Imperial County 2011). No previous records of this species were identified within the Ocotillo Sol Project vicinity.
No suitable nesting habitat is present within the survey area or immediate vicinity. Therefore, golden eagles are not expected to nest within the survey area. Similarly, due to the distance from known eagle territories, golden eagles from the Coyote Mountains identified during the Sunrise Powerlink Surveys are not expected to forage within or adjacent to the survey area. Mount Signal (El Centinela), approximately 7 miles south of the Ocotillo Sol Project area and across the U.S.–Mexico border, may support suitable nesting habitat, although data for this area were not identified during the literature search (BLM and Imperial County 2011). Individuals nesting in or around Mount Signal could potentially use the survey area and surrounding vicinity for foraging activities, though it is likely a rare occurrence (BLM and Imperial County 2011).
3.6.4.3 HABITAT CONNECTIVITY AND WILDLIFE CORRIDORS
The Ocotillo Sol Project area is adjacent to an existing substation near the edge of open desert. It is not within any identified wildlife movement corridor or habitat linkage. Because the Applicant’s proposed project is in a relatively undeveloped area, habitat connectivity is not constrained and wildlife movement is expected to continue relatively unhindered with implementation of the Ocotillo Sol Project.

Affected Environment
Page 3-56 Ocotillo Sol Project Draft EIS/Draft CDCA Plan Amendment
April 2012
3.6.5 JURISDICTIONAL RESOURCES
The Ocotillo Sol Project area is relatively flat with a 20-foot difference in elevation from the southwest corner of the LSA spring survey area to the northeast corner, located nearly 3,500 feet away (Figure 3.6-2 in Appendix A), producing an average slope of less than 1 percent. Pinto Wash, which is subject to CDFG jurisdiction, is to the southeast approximately 540 feet outside of the proposed 115-acre Ocotillo Sol Project area limits but within the spring survey area.
No drainages, wetlands, or any other topographical or hydrological features with potential to be subject to USACE, RWQCB, or CDFG jurisdiction were observed within the 115-acre Ocotillo Sol Project area. No evidence of streambed and banks as defined by CDFG were observed within the Ocotillo Sol Project area, nor were any defined channels that would be subject to agency jurisdiction. Evidence of hydrology on site is limited to some bare spots and soil sorting due to sheet flow, which was observed throughout the Ocotillo Sol Project area, generally following the gentle slope of the terrain.

Affected Environment
Ocotillo Sol Project Page 3-57 Draft EIS/Draft CDCA Plan Amendment April 2012
3.7 CULTURAL RESOURCES
Cultural resources, for the purposes of complying with NEPA and NHPA Section 106 requirements, are locations of human activity, occupation, or use identifiable through field inventory, historical documentation, or oral evidence. Cultural resources include both archaeological, historic, or architectural sites, structures, or places with important public and scientific uses, and may include definite locations (sites or places) of traditional cultural or religious importance to specified social and/or cultural groups (e.g., traditional cultural property). Three kinds of cultural resources are considered in this assessment: prehistoric, ethnographic, and historic-period archaeological and built environment resources. Prehistoric archaeological resources are associated with human occupation prior to European contact. These resources may include isolated features, artifact scatters, ceramics, lithics, fish traps, rock art, trails, and other traces of Native American human behavior. In California, the prehistoric period began over 12,000 years ago and extended until 1769, when the Europeans permanently settled in San Diego. Ethnographic resources represent the heritage of a particular ethnic or cultural group, such as Native Americans or African, European, Latino, or Asian immigrants. They may include traditional resource collecting areas, ceremonial sites, value-imbued landscape features, cemeteries, shrines, or ethnic neighborhoods and structures. Historic-period resources, both archaeological and architectural, are associated with Euro–American exploration and settlement of an area and the beginning of a written historical record. They may include archaeological deposits, sites, structures, traveled ways, artifacts, or other evidence of human activity. Groupings of historic-period resources are also recognized as historic districts and as historic vernacular landscapes. Cultural resources are categorized as buildings, sites, structures, objects, and districts for the purposes of complying with these requirements.
As explained below, cultural resources may be, but are not necessarily, eligible for the NRHP. Because the 1-mile radius around the Ocotillo Sol Project contains evidence of human activity since prehistoric times and because cultural resources could be affected by the proposed Ocotillo Sol Project, the project is subject to federal environmental regulations and laws. This section describes the laws, regulations, and plans relevant to the regulatory setting for the project. This is followed by past cultural resources investigations and existing cultural resources within the project area.
3.7.1 APPLICABLE REGULATIONS, PLANS, AND POLICIES/MANAGEMENT GOALS
There are numerous federal regulations, executive orders, and policies that direct management of cultural resources on federal lands and by federal agencies. These include the NHPA, the Native American Graves Protection and Repatriation Act, the American Indian Religious Freedom Act, EO 13007, and the Antiquities Act. The following is a discussion of the most pertinent laws affecting the proposed Ocotillo Sol Project.
Affected Environment
Page 3-58 Ocotillo Sol Project Draft EIS/Draft CDCA Plan Amendment
April 2012
3.7.1.1 NATIONAL HISTORIC PRESERVATION ACT
The principal federal law addressing historic properties is Section 106 of the NHPA (16 USC § 470f) and its implementing regulations at 36 CFR 800. Section 106 requires a federal agency with jurisdiction over a project (referred to as an “undertaking” under NHPA) to take into account the effect of the project on historic properties and to seek to resolve any adverse effects. A federal agency must also afford the Advisory Council on Historic Preservation a reasonable opportunity to comment. Federal regulations (36 CFR Part 800.16) define historic properties as "any prehistoric or historic district, site, building, structure, or object included in, or eligible for inclusion” in the NRHP. The Ocotillo Sol Project is an undertaking with the potential to affect historic properties, 36 CFR § 800.3(a), and therefore is subject to the requirements of Section 106.
The term “historic properties” refers to “any prehistoric or historic district, site, building, structure, or object included in, or eligible for inclusion in the NRHP” (36 CFR § 800.16(l)(1). Criteria for eligibility are discussed in Section 4.7.1. Historic properties are not required to be formally listed on the NRHP—i.e., they can be determined to be eligible by the agency as part of the Section 106 process. Under Section 106 of the NHPA and its implementing regulations at 36 CFR 800, federal agencies are obliged to identify and evaluate historic properties located within a proposed project’s Area of Potential Effect (APE) to assess effects to resources associated with the proposed project, and to develop and evaluate alternatives or modifications to the proposed project that could avoid, minimize, or to mitigate adverse effects to historic properties. The Section 106 process does not require the preservation of historic properties, but instead, it is a procedural requirement mandating that federal agencies take into account effects to historic properties from an undertaking prior to the approval of that undertaking.
The steps of the Section 106 process must be accomplished through consultation with the State Historic Preservation Officer (SHPO), Native American tribes, local governments, and other consulting parties. The agency also must provide an opportunity for public involvement. Consultation with Native American tribes regarding issues related to Section 106 of the NHPA, as well as other authorities like NEPA, must recognize the government-to-government relationship between the federal government and Native American tribes.
3.7.1.2 NATIVE AMERICAN GRAVES PROTECTION AND REPATRIATION ACT (1990); TITLE 25, USC SECTION 3001, ET SEQ.
Requirements for responding to discoveries of Native American human remains and associated funerary objects on federal land are addressed under the Native American Graves Protection and Repatriation Act (PL 101-601) and its implementing regulations found at 43 CFR Part 10. If human remains or associated funerary objects are discovered on public lands within the Ocotillo Sol Project area, the BLM will comply with the law and regulations by determining lineal descendants and culturally affiliated Indian tribes and by carrying out appropriate treatment and disposition of the discovered remains, including transfer of custody.

Affected Environment
Ocotillo Sol Project Page 3-59 Draft EIS/Draft CDCA Plan Amendment April 2012
3.7.1.3 CDCA PLAN–YUHA BASIN ACEC MANAGEMENT PLAN
The Yuha Basin ACEC Management Plan was prepared in order to give additional protection to unique cultural resource and wildlife values within portions of the Yuha Basin. This ACEC contains a high density and diversity of cultural resource values, including intaglios (e.g., geoglyphs, or ground figures made from moved rocks), temporary camps, lithic scatters, cremation loci, pottery loci, trails, and shrines.
3.7.1.4 CALIFORNIA STATE PROTOCOL AGREEMENT BETWEEN BLM AND SHPO
The State Protocol Agreement between the California State Director of the Bureau of Land Management and the California State Historic Preservation Officer (2007) streamlines the Section 106 process by not requiring case-by-case consultation with the SHPO on many routine undertakings. Under the Section 106 process, the BLM is obliged to identify cultural resources within the proposed project’s APE, to assess effects to properties found eligible for listing on the NRHP, and to mitigate adverse effects to historic properties. In the case of complex undertakings or undertakings for which adverse effects are anticipated, the BLM consults directly with SHPO and the Protocol does not apply (BLM 2007). The Ocotillo Sol Project is not a complex project; SHPO consultation is ongoing.
3.7.2 EXISTING CONDITIONS
Information for this section is summarized from the Class III Inventory Ocotillo Sol Project, Imperial County, California, prepared by LSA (2011).
The proposed project would construct a 100-acre solar PV facility and use 15 acres as a laydown area during construction. The APE consists of 115 acres. The Class III inventory for cultural resources encompassed an area larger than the APE. The survey area was 351.25 acres and included the APE.
3.7.2.1 CULTURAL SETTING
During prehistoric times, the Ancient Lake Cahuilla basin was the focal point of the landscape. Lake Cahuilla was formed by floodwaters from the Colorado River that flowed through the desert toward the Gulf of California on an occasional basis. Evidence from archaeological investigations at prehistoric sites along the Lake Cahuilla shoreline suggests at least three episodes of flooding and evaporation. The project area is near the western shoreline of the former Lake Cahuilla within the Yuha Desert basin (LSA 2011). A generally accepted cultural history outline has been developed for the Colorado Desert. This cultural history is based on the work of Malcolm Rogers (1939, 1945, 1966). The framework is divided into six cultural patterns that extend to at least 12,000 years ago. The cultural patterns are Malpai (Early Man), San Dieguito, Pinto and Amargosa, Patayan (Prehistoric Yuman), Historic Yuman, and Historic Euro-American (LSA 2011).

Affected Environment
Page 3-60 Ocotillo Sol Project Draft EIS/Draft CDCA Plan Amendment
April 2012
3.7.2.1.1 Ethnohistory/Historic Yuman The Kamia and Kumeyaay exploited the project area. Ethnographically, the Quechan and the Cocopah lived along the Colorado River. The Quechan lived in settlements called Rancherias. These Rancherias were moved seasonally as the Colorado River flooded during the spring and receded in the winter. The Quechan grew maize, squash, and beans and added melons, wheat, and black-eyed peas after the arrival of the Europeans. They also gathered wild plants and fished with nets, traps, cactus spine hooks, and bows and arrows in the Colorado and Gila rivers. The Quechan were organized militarily and the Cocopah and Maricopa were their enemies.
The Cocopah lived along the Colorado River and its delta south of the Quechan into northwestern Mexico. They were semi-nomadic, hunter-gatherers who used the delta to plant beans, squash, and beans. They collected wild plants and hunted deer, wild boar, rabbits, wood rats, and beavers.
3.7.2.1.2 Historic Euro–American Pattern The Spanish Period (1540 to 1821) began with Juan Rodriguez Cabrillo’s expedition in 1542 and ended with the Treaty of Cordoba, which established Mexican independence. This period is dominated by the Spanish attempts to link their territories in Mexico with their outposts in California and prevent Russia or Britain encroachment. In an attempt to make that link, Captain Juan Bautista de Anza crossed the project area in 1774–1775 looking for an overland route to the mission in San Diego and then to Monterey. His party encountered Yuma Indians at the confluence of the Gila and Colorado rivers and camped at several locations across the Colorado Desert.
During the Mexican Period (1821 to 1848), the Colorado Desert was nearly forgotten. Romualdo Pacheco, who would become the first California-born governor of California, made several exploratory expeditions in 1826 and 1827 into the area. He and his men built Fort Romualdo Pacheho approximately 6 miles west of present-day Imperial (California State Historical Landmark 944). The post was abandoned after the Kumeyaay attacked it. The Army of the West led by Stephen Kearney also crossed the desert in 1846–1847. Border tension escalated and the U.S. invaded Mexico in 1846.
The American Period (1848 to present) began with signing of the Treaty of Guadalupe Hidalgo in which the U.S. acquired Texas, New Mexico, and Alta California. That same year gold was discovered in the mountains of California. The gold rush brought a large influx of Anglo-Americans. California became a state in 1850.
The settlement of the Imperial Valley can be attributed to Dr. Oliver M. Wozencraft. Wozencraft identified the valley’s potential for agriculture because of fertile soil and the feasibility to irrigate using a gravity canal and the higher elevation of the Colorado River. The building of the canals and irrigation system was one of the most important 19th century developments for the Imperial Valley.
In 1905, water levels were lower than usual and silt deposits had impeded the flow of water through the gravity-fed system. A temporary wooden gate was built in the river upstream from the silted portions to allow a fuller flow with the idea that the gate would be removed before the spring runoff. Before this occurred, however, several floods destroyed gates and dams along the

Affected Environment
Ocotillo Sol Project Page 3-61 Draft EIS/Draft CDCA Plan Amendment April 2012
canal network and changed the course of the water, flooding the Alamo River to the Salton Trough and eventually forming the Salton Sea. The breach in the river was closed in 1907 due to the efforts of the Southern Pacific Railroad.
The Westside Main Canal was built between 1906 and 1907 to provide irrigation to crops on the west side of the valley and was later incorporated into the All-American Canal system during its construction between 1934 and 1940 (Hupp 1999). The Westside Main Canal extends from the All-American Canal at the U.S.–Mexico border to the south end of the Salton Sea.
The Imperial Irrigation District was organized in 1911 and was delivering water to over 500,000 acres of arable land. The Boulder (Hoover) Dam was completed in 1935 and provided hydroelectric power to the valley.
The Imperial Valley could be crossed by railroad lines and a network of roads. The plank road completed in 1915 connected Yuma and Holtville. Construction for State Highway 80 started in 1915. This was renamed U.S. 80 in 1926 and linked the desert floor with San Diego.
3.7.2.2 INVENTORY METHODS
LSA was contracted by the Applicant to conduct a BLM Class III intensive archaeological inventory for the project, which consisted of archival research and a field survey. A cultural resources work plan was prepared for the project, which outlined field methods including transect spacing and recordation devices. The survey area consisted of 351.25 acres and included the 115-acre Ocotillo Sol Project APE. The purpose of the survey was to establish the horizontal extent of archaeological resources, establish the types of archaeological resources in the APE, and develop preliminary recommendations for each site regarding eligibility for listing in the NRHP. Prior to the survey, a record search of an area bounded by a 1-mile radius around the survey area was obtained from the South Coastal Information Center. Previously recorded historic and prehistoric archaeological site records and documentations were reviewed as well as information about past archaeological resources investigations in the project area. Historic aerial photographs and maps were also examined to determine presence of historic buildings or structures.
The archaeological field survey was conducted on April 5–9, 2010. The field crew consisted of four archaeologists and three Native American monitors. All cultural resources were recorded and documented on appropriate Department of Parks and Recreation archaeological site forms (LSA 2011).
LSA conducted a historic built environment survey of the project area on July 7, 2011. The survey for historic built environment resources covered 1,284 acres, which included a one-quarter mile radius around the 351.25-acre survey area. The purpose of this survey was to document all resources over 50 years in age and identify any potential impacts to the historic built environment to comply with Section 106 of the NHPA and BLM requirements.

Affected Environment
Page 3-62 Ocotillo Sol Project Draft EIS/Draft CDCA Plan Amendment
April 2012
3.7.2.3 INVENTORY RESULTS
The South Coastal Information Center records search identified 15 previous archaeological resources surveys and 43 previously recorded archaeological resources within the 1-mile study radius.
The 43 previously recorded archaeological sites consist of seven small temporary camps, one identified as being on desert pavement, two historic artifact scatters, and 33 isolated ceramic or lithic artifacts. Three of the previously recorded archaeological sites are located within the 115-acre APE. The three sites (CA-IMP-6680, -6681, and -6682) were recorded as isolated artifacts. No historic built environment resources were identified during the records search. The archaeological field survey for the project APE resulted in one newly identified and recorded archaeological site (CA-IMP-11741) and 12 isolated artifacts (Table 3.7-1). LSA did not relocate any of the previously recorded archaeological sites within the APE. CA-IMP-11741 is a low-density surface scatter consisting of four flakes and with little potential for subsurface deposits.
TABLE 3.7-1 NEWLY RECORDED ISOLATED ARTIFACTS WITHIN THE OCOTILLO SOL PROJECT
115-ACRE APE
Resource Name Description P-13-013724 1 flake P-13-013725 1 point fragment P-13-013726 1 flake P-13-013727 2 flakes P-13-013731 1 flake P-13-013732 1 flake P-13-013733 9 ceramic sherds in a 33 × 17 cm area; all from same
ceramic vessel (these assemblages are often referred to as a “pot drop” although only a small percentage of the vessel is actually present)
P-13-013734 1 ceramic sherd, 1 flake P-13-013735 1 flake P-13-013741 2 ceramic sherds P-13-013742 1 flake P-13-013743 1 ceramic sherd
No historic built environment properties were identified within the 1,284 acres of the historic built environment resources survey area. The Westside Main Canal (CA-IMP-7834H) is the nearest documented built environment resource. It is located just over one mile northeast of the historic built environment survey area. The canal was built between 1906 and 1907 to provide irrigation to crops on the west side of the valley and later incorporated into the All-American Canal system during its construction between 1934 and 1940 (Hupp 1999). The Westside Main Canal extends from the All-American Canal at the U.S.–Mexico border to the south end of the Salton Sea. Because the All-American Canal was found eligible for the NRHP in 2001, the update form recommended the Westside Main Canal as an extension of the All-American Canal as eligible for the NRHP and California Register of Historical Resources under criterion A/1 for

Affected Environment
Ocotillo Sol Project Page 3-63 Draft EIS/Draft CDCA Plan Amendment April 2012
its association with the significant initial development of the Imperial Valley, and under criterion C/3 as one of the unique engineering projects associated with the All-American Canal in the 1930s and 1940s (Schaefer and O’Neill 2001).
3.7.2.4 SITE SIGNIFICANCE WITHIN THE OCOTILLO SOL PROJECT AREA
One site (CA-IMP-11741) was found within the 115-acre APE. This site was recommended not eligible for the NRHP. The site is a low density surface scatter consisting of four flakes and with little potential for subsurface deposits. Isolates typically have limited potential for important information and lack qualities that would qualify them for listing on the NRHP. Therefore, the 16 isolates within the 115-acre APE are not eligible for the NRHP.

Affected Environment
Page 3-64 Ocotillo Sol Project Draft EIS/Draft CDCA Plan Amendment
April 2012
3.8 PALEONTOLOGICAL RESOURCES
LSA Associates, Inc. conducted a paleontological resources assessment of the Ocotillo Sol Project area in July 2011. The results of the assessment are summarized here and the preliminary report is included as Appendix K.
3.8.1 APPLICABLE REGULATIONS, PLANS, AND POLICIES/MANAGEMENT GOALS
This section summarizes federal regulations pertaining to paleontological resources. The management and preservation of paleontological resources on public lands are governed under various laws, regulations, and standards. For the past several decades, the BLM has used FLPMA as the legislative foundation for its paleontological resource management policies. The BLM has also developed general procedural guidelines (Manual H-8720-1; Instructional IM 2008-009; IM 2009-011) for the management of paleontological resources. Paleontological resource management objectives include the evaluation, management, protection, and location of fossils on BLM managed lands. Management policy also includes measures to ensure that proposed land use projects do not inadvertently damage or destroy scientifically significant paleontological resources.
3.8.1.1 PALEONTOLOGICAL RESOURCES PRESERVATION, OMNIBUS PUBLIC LANDS ACT, PUBLIC LAW 111-011, TITLE VI, SUBTITLE D
The Omnibus Public Lands Act–Paleontological Resource Preservation (OPLA–PRP) legislation directs the Secretaries (Interior and Agriculture) to manage and protect paleontological resources on federal land using scientific principles and expertise. OPLA–PRP incorporates most of the recommendations of the report of the Secretary of the Interior entitled Assessment of Fossil Management on Federal and Indian Lands to formulate a consistent paleontological resources management framework. In passing the OPLA–PRP, Congress officially recognized the scientific importance of paleontological resources on some federal lands by declaring that fossils from these lands are federal property that must be preserved and protected. The OPLA–PRP codifies existing policies of the BLM, National Park Service, U.S. Forest Service, Bureau of Reclamation, and USFWS, and provides the following:
Uniform criminal and civil penalties for illegal sale and transport, and theft and vandalism of fossils from federal lands
Uniform minimum requirements for paleontological resource-use permit issuance (terms, conditions, and qualifications of applicants)
Uniform definitions for “paleontological resources” and “casual collecting”
Uniform requirements for curation of federal fossils in approved repositories
Federal legislative protections for scientifically significant fossils applies to projects that take place on federal lands (with certain exceptions, such as the Department of Defense), involve
Affected Environment
Ocotillo Sol Project Page 3-65 Draft EIS/Draft CDCA Plan Amendment April 2012
federal funding, require a federal permit, or involve crossing state lines. Because the vast majority of the proposed project area occurs on BLM-managed lands, federal protections for paleontological resources apply under NEPA, FLPMA, and OPLA–PRP.
3.8.2 EXISTING CONDITIONS
Paleontological resources are the fossilized evidence of past life found in the geologic record. Despite the tremendous volume of sedimentary rock deposits preserved worldwide and the enormous number of organisms that have lived through time, preservation of plant and animal remains as fossils is an extremely rare occurrence. Because of the infrequency of fossil preservation, fossils—particularly vertebrate fossils—are considered to be nonrenewable resources. Because of their rarity and the scientific information they can provide, fossils are highly significant records of ancient life. They can provide information about the interrelationships of living organisms, their ancestry, development, and change through time, and their former distribution. Progressive morphologic changes observed in fossil lineages may provide critical information on the evolutionary process itself—that is, the ways in which new species arise and adapt to changing environmental circumstances. Fossils can also serve as important guides to the ages of the rocks and sediments in which they are contained and may prove useful in determining the temporal relationships of rock deposits from one area to another and the timing of geologic events. Time scales established by fossils provide chronologic frameworks for geologic studies of all kinds.
Significant fossils include all vertebrate fossil remains (body and trace fossils) and plant and invertebrate fossils determined to be scientifically unique. Paleontological resources (fossils) include the bones, teeth, body remains, traces, or imprints of plants and animals preserved in the earth since a past geologic time. All fossils offer scientific information, but not all fossils offer significant scientific information. Among paleontologists, fossils generally are considered scientifically significant if they are unique, unusual, rare, diagnostically or stratigraphically important, or add to the existing body of knowledge in a specific area of science. Most fossils occur in sedimentary rock formations. Although experienced paleontologists generally can predict which formations will contain fossils and what types of fossils will be found based on the age of the formation and its depositional environment, predicting the exact location where fossils will be found without field surveys is usually not possible.
The Ocotillo Sol Project area lies within the Colorado Desert Geomorphic Province, which is characterized by a low-lying desert basin ranging in elevation from 245 feet below msl to 2,200 feet above msl. It is dominated by the Salton Sea, which fills the Salton Trough to an average elevation of 231 feet below msl (see Appendix K).
The elevation of the Ocotillo Sol Project vicinity varies from 40 feet above msl to 15 feet below msl. The parcel proposed for solar development ranges in elevation from 6 to 24 feet above msl, with the drainage being to the northeast, roughly parallel to that of Pinto Wash, the major drainage through the area. This parcel is very close to the maximum extent of the high shoreline of Lake Cahuilla. Geologic mapping shows that surface sediments in the Ocotillo Sol Project area are Quaternary lake deposits from Lake Cahuilla. These lake deposits are a mix of clay, sand, and beach gravel, and contain locally abundant non-marine invertebrate fossils (see Appendix K).

Affected Environment
Page 3-66 Ocotillo Sol Project Draft EIS/Draft CDCA Plan Amendment
April 2012
Within the Ocotillo Sol Project area, recent sediments from Lake Cahuilla contain non-mineralized mollusks that are 200 to 300 years old and contemporaneous with extant modern species. Plio–Pleistocene (more recent than circa 5 million years ago) sediments that crop out on the surface two miles to the southwest of the Ocotillo Sol Project area have potential to contain significant nonrenewable paleontological resources. It is unknown at what depth they may occur under the Ocotillo Sol Project area (see Appendix K).
3.8.2.1 POTENTIAL FOSSIL YIELD CLASSIFICATION
The BLM uses the Potential Fossil Yield Classification (PFYC) System to classify geologic units based on their relative abundance of vertebrate fossils or scientifically significant invertebrate or plant fossils and their sensitivity to adverse impacts, with a higher class number indicating potential. These classes are as follows:
Class 1 (very low). Geologic units likely to contain recognizable fossil remains. Management concern is negligible, and assessment or mitigation requirements are usually not necessary, with the exception of isolated circumstances.
Class 2 (low). Sedimentary geologic units not likely to contain vertebrate fossils or significant non-vertebrate fossils. Management concern is generally low, and assessment of mitigation is usually not necessary, with the exception of isolated circumstances.
Class 3 (moderate or unknown). Fossiliferous sedimentary geologic units where fossil content varies in significance, abundance and predictable occurrence, or units of unknown fossil potential. Management concern is moderate or cannot be determined from existing data. Ground-disturbing activities may require field assessment to determine the appropriate course of action.
Class 3a – Moderate Potential. Units are known to contain vertebrate fossils or scientifically significant non-vertebrate fossils, but these occurrences are widely scattered. Common invertebrate or plant fossils may be found in the area, and opportunities may exist for hobby collecting. The potential for a project to be sited on or impact a significant fossil locality is low, but is somewhat higher for common fossils.
Class 3b – Unknown Potential. Units exhibit geologic features and preservational conditions that suggest significant fossils could be present, but little information about the paleontological resources of the unit or the area is known. This may indicate the unit or area is poorly studied, and field surveys may uncover significant finds. The units in this Class may eventually be placed in another Class when sufficient survey and research is performed. The unknown potential of the units in this Class should be carefully considered when developing any mitigation or management actions.
Class 4 (high). Geologic units containing a high occurrence of significant fossils. The probability for impacting significant paleontological resources is moderate to high, and is dependent on the proposed action. Anticipated impacts to significant fossils would usually require a field survey, followed by on-site paleontological monitoring or spot-checking.

Affected Environment
Ocotillo Sol Project Page 3-67 Draft EIS/Draft CDCA Plan Amendment April 2012
Class 5 (very high). Fossil-rich geologic units that regularly produce vertebrate fossils or significant non-vertebrate fossils that are at risk of natural degradation or human-caused adverse impacts. The probability of impacting significant fossils is high and fossils are known or can reasonably be expected to occur in the impacted area. Anticipated impacts to significant fossils would usually require a field survey, followed by on-site paleontological monitoring or spot-checking.
The Lake Cahuilla sediments within the Ocotillo Sol Project area are classified under PFYC Class 2. The Plio–Pleistocene sediments within the Ocotillo Sol Project area are classified under PFYC Class 3b.
LSA Associates conducted a paleontological locality search through the San Diego Natural History Museum, and geological and paleontological records maintained at LSA Associates. A field survey of the project area was completed in July 2011. The paleontological locality search, conducted between November 2010 and July 2011, included a review of the area geology and any known paleontological resources recovered from the surrounding area, as well as the geologic units that would likely be encountered during excavation activities associated with the project. The paleontological records search did not identify any fossil localities within the Ocotillo Sol Project area. The field survey of the project area located one vertebrate fossil, which appeared to be introduced onto the project by stream action. The field survey also found recent molluscan specimens and mineralized wood and bone. These items are not considered “scientifically significant” fossils (see Appendix K). No scientifically significant fossil localities were located in surficial late Holocene (circa 12,000 years ago to the present) sediments in the Ocotillo Sol Project area.
While the PFYC is based on probabilities, not certainties or known locations, there will be exceptions to each classification based on the criterion used as the basis. Where the presence or absence of vertebrate and significant invertebrate fossils is not known in a geologic unit, existing protocols allow for inventory, assessments, and mitigation of potential paleontological resource impacts on a case-by-case basis.

Affected Environment
Page 3-68 Ocotillo Sol Project Draft EIS/Draft CDCA Plan Amendment
April 2012
3.9 FIRE AND FUELS
3.9.1 APPLICABLE REGULATIONS, PLANS, AND POLICIES/MANAGEMENT GOALS
3.9.1.1 2001 FEDERAL FIRE POLICY
The 2001 Federal Fire Policy comprises guiding principles and discreet policies. As a whole the guiding principles and policy statements guide the philosophy, direction, and implementation of fire management planning, activities, and projects on federal lands. Many federal agencies conduct programs or activities that support or otherwise affect federal wildland fire management activities. The guiding principles and policy statements guide the direction and implementation of those programs as well, to ensure consistency, coordination, and integration of wildland fire management programs and related activities throughout the federal government.
3.9.1.2 GUIDANCE FOR IMPLEMENTATION OF FEDERAL WILDLAND FIRE MANAGEMENT POLICY
The Federal Executive Council approved the Guidance for the Implementation of Federal Wildland Fire Management Policy on February 13, 2009. This guidance provides for consistent implementation of the 1995/2001 Federal Fire Policy, as directed by the Wildland Fire Leadership Council.
3.9.2 EXISTING CONDITIONS
Wildland fires result from either natural or human-made causes which occur in brush, grasslands, or fallow agricultural areas are capable of causing widespread damage to neighboring lands, in addition to threatening the lives and personal property of persons residing in wildfire-prone areas.
3.9.2.1 FIRE REGIMES AND RISK CONDITIONS
Fire regime refers to the nature of fires occurring over long periods of time and the prominent immediate effects of fire that generally characterize an ecosystem (Brown 2000 as cited in BLM 2010). Fire regimes can be defined through the attributes of frequency, seasonality, size/spatial extent, rotation (or fire cycle), predictability (or variation in fire frequency), and magnitude (both intensity and severity; Agee 1993; Morgan et al. 2001 as cited in BLM 2010). Fire regimes can be subdivided into components that vary in time, space, and magnitude. Fire regime descriptions are often limited to the frequency and severity of wildfires.
Fire regimes vary considerably by both vegetation types and landscape characteristics. The vegetated lands in the Ocotillo Sol Project area are classified as Fire Regime IV (fire frequency of 35–100+ years with high severity; N. Ludwig, pers. comm. 2012).

Affected Environment
Ocotillo Sol Project Page 3-69 Draft EIS/Draft CDCA Plan Amendment April 2012
Current condition classes are a function of the degree of departure from historical fire regimes resulting in alterations of key ecosystem components such as species composition, structural stage, stand age, and canopy closure. One or more of the following activities may have caused this departure: fire exclusion or suppression, vegetation management, introduction and establishment of exotic plant species, insects or disease (introduced or native), or other past management activities (Hann and Bunnell 2001 as cited in BLM 2010).
Table 3.9-1 displays the current fire regime condition classes, based on degree of departures from historical/natural fire regimes, for the vegetated lands in the Ocotillo Sol Project area.
TABLE 3.9-1 CONDITION CLASSES BASED ON DEPARTURES FROM HISTORICAL FIRE REGIMES
Condition Class (CC) Description CC1 Fire regimes are within an historical range, and the risk of
losing key ecosystem components is low. Vegetation attributes (species composition and structure) are intact and functioning within an historical range.
CC2 Fire regimes have been moderately altered from their historical range. The risk of losing key ecosystem components is moderate. Fire frequencies have departed from historical frequencies by one or more return intervals (either increased or decreased). This results in moderate changes to one or more of the following: fire size, intensity and severity, and landscape patterns. Vegetation attributes have been moderately altered from their historical range.
CC3 Fire regimes have been significantly altered from their historical range. The risk of losing key ecosystem components is high. Fire frequencies have departed from historical frequencies by multiple return intervals. This results in dramatic changes to one or more of the following: fire size, intensity and severity, and landscape patterns. Vegetation attributes have been significantly altered from their historical range.
Source: Hann and Bunnell 2001 as cited in BLM 2010.
The fire condition class for all BLM lands within 12 miles of the Ocotillo Sol Project area is Class 1 (N. Ludwig, pers. comm. 2012).
3.9.2.2 FIRE MANAGEMENT UNITS AND WILDFIRE HISTORY
The Ocotillo Sol Project area falls within the San Diego Fire Management Unit. Wildfire history is closely related to vegetation and climatic patterns in terrestrial ecosystems. Patterns of fire frequency, season, size, severity, and uniformity are functions of existing vegetation conditions, weather, elevation, physiographic features, ignition sources, and fire suppression activities.

Affected Environment
Page 3-70 Ocotillo Sol Project Draft EIS/Draft CDCA Plan Amendment
April 2012
There have been no recorded fires in the Yuha Basin ACEC. The closest recorded fires on BLM lands were the June 2007 Inkopah Fire and the June 2008 Mountain Fire, both of which were in the Jacumba Mountains Wilderness over 20 miles away (N. Ludwig, pers. comm. 2012).
California Department of Forestry and Fire Protection (CAL FIRE) and BLM operate under a Cooperative Fire Protection Plan, which states that CAL FIRE is to consider BLM’s resource protection standards to select the least cost/least damaging suppression strategy. On any vegetation fires within the Ocotillo Sol Project area, BLM is required to send a resource advisor to work directly with the CAL FIRE incident commander to fully protect or at least mitigate resource values.
Affected Environment
Ocotillo Sol Project Page 3-71 Draft EIS/Draft CDCA Plan Amendment April 2012
3.10 LANDS AND REALTY
The following discussion describes the applicable regulatory framework, land use plans, and existing land uses for the Ocotillo Sol Project area.
3.10.1 APPLICABLE REGULATIONS, PLANS, AND POLICIES/MANAGEMENT GOALS
The governing laws and applicable management plans for BLM-administered lands in and around the Ocotillo Sol Project area are detailed in Chapter 1, Section 1.6.7. These include FLPMA of 1976, as amended; the California Desert Protection Act of 1994; CDCA Plan of 1980, as amended; and CDCA Plan Amendment—Western Colorado (WECO) OHV Routes of Travel Designation Plan
The principal land use plans affecting the Ocotillo Sol Project area are the BLM’s CDCA Plan and the WECO Plan. The WECO Plan is described in Section 3.13, Recreation.
3.10.1.1 YUHA BASIN AREA OF CRITICAL ENVIRONMENTAL CONCERN MANAGEMENT PLAN
The Yuha Basin ACEC is in southwestern Imperial County (see Figure 1-1 in Appendix A). The ACEC is traversed by Interstate 8 and Highway 98 and is immediately adjacent to the Mexican International Border on the south. The eastern border abuts privately owned agricultural lands and the western border parallels the Jacumba Mountains Wilderness. The Yuha Basin ACEC includes the Yuha Desert Management Area designated for the flat-tailed horned lizard.
The Yuha Basin ACEC was designated to provide additional protection to unique cultural and natural resources found in the region. The unique cultural and natural resources within this ACEC include the flat-tailed horned lizard, prehistoric resources, and historic resources. The Yuha Basin ACEC Management Plan was developed to protect these unique resource values while also providing for multiple uses. The Management Plan contains an energy and transmission-related goal and action. The goal is to “Minimize potential impacts resulting from the traversing of the ACEC by two utility corridors.” The action is to “Permit the traversing of the ACEC by proposed lines and associated facilities if environmental analysis demonstrates that it is environmentally sound to do so.” The Management Plan also states that surface-disturbing projects should be located outside the ACEC if possible but does not preclude projects from the ACEC. If the project must be located within the ACEC every effort should be made to locate the project within a previously disturbed area or in an area where habitat quality is considered poor. In addition, construction activity should be timed to minimize mortality of species known to occur in the area (BLM 1981).
3.10.1.1.1 Flat-tailed Horned Lizard Rangewide Management Strategy The Flat-tailed Horned Lizard Rangewide Management Strategy, which includes the Yuha Desert Management Area for the flat-tailed horned lizard, is discussed in detail in Section 3.6, Biological Resources.

Affected Environment
Page 3-72 Ocotillo Sol Project Draft EIS/Draft CDCA Plan Amendment
April 2012
3.10.1.2 IMPERIAL COUNTY GENERAL PLAN
Lands under private ownership are near the Ocotillo Sol Project area. Private lands in the vicinity include a small parcel approximately one-half mile to the south, a larger parcel approximately 1 mile to the northwest, and private agricultural lands to the east. Applicable management plans and policies for these lands include the County of Imperial General Plan (Imperial County 2008) and Imperial County zoning regulations. The Ocotillo Sol Project area is entirely within BLM public lands. As Imperial County has no direct land use jurisdiction over public lands, neither the General Plan not Imperial County zoning regulations would be directly applicable to the Ocotillo Sol Project area.
3.10.2 EXISTING CONDITIONS
The 100-acre proposed solar facility and 15-acre temporary laydown area would be sited on BLM-managed lands adjacent to the existing Imperial Valley Substation, 4 miles south of Interstate 8, 5 miles south of Seeley, about 9 miles southwest of El Centro, and 82 miles east of San Diego. As previously mentioned, the Ocotillo Sol Project area is entirely within BLM-administered lands. The area is within the Yuha Basin ACEC, which includes the Yuha Desert Management Area. No Tribal or private lands are within or adjacent to the Ocotillo Sol Project area (see Figure 1-1 in Appendix A).
As detailed in Chapter 1, the Ocotillo Sol Project area is in the CDCA Plan area within Multiple Use Class L (Limited Use; Figure 3.10-1 in Appendix A). Under this classification, electrical generation plants are allowed in accordance with federal, state, and local laws. The CDCA Plan expressly provides for solar generation facilities on Class L lands after NEPA requirements are met.
3.10.2.1 EXISTING FACILITIES AND CORRIDORS
The Ocotillo Sol Project area lies immediately adjacent to the Imperial Valley Substation. This substation connects a 500 kV line that runs along the southern border of California to lines going to Mexico as well as local lines. The Sunrise Powerlink will also run to the Imperial Valley Substation once it is completed. The Sunrise Powerlink is currently under construction, with construction activities occurring adjacent to (west of) the Ocotillo Sol Project area. These construction activities include the following: laydown/staging area use, construction materials delivery (along route that connects to Highway 98), construction of towers, placement of power lines, and connection to the Imperial Valley Substation.
The Ocotillo Sol Project area is within CDCA Plan Utility Corridor N (see Figure 3.10-1 in Appendix A). This utility corridor is specified as being 2 to 5 miles in width. At the time the CDCA Plan was prepared, no energy-producing facilities existed within this designated corridor. The Imperial Valley and Dixieland substations are within Utility Corridor N, as well as transmission lines.

Affected Environment
Ocotillo Sol Project Page 3-73 Draft EIS/Draft CDCA Plan Amendment April 2012
3.11 SPECIAL DESIGNATIONS
The BLM manages a variety of lands, including lands with unique and important historical, anthropological, ecological, biological, geological, and paleontological features. These features include undisturbed wilderness areas, critical habitat, natural environments, open spaces, scenic landscapes, historic locations, cultural landmarks, and paleontologically rich regions. Some of these unique lands have special designations, including Wilderness, National Historic Trails, and ACECs.
3.11.1 APPLICABLE REGULATIONS, PLANS, AND POLICIES/MANAGEMENT GOALS
3.11.1.1 FEDERAL LAND POLICY MANAGEMENT ACT
The designation of ACECs was authorized in Section 202 (c)(3) of FLPMA, and was designed to be used as a process for determining the special management required by certain environmental resources or hazards (BLM 2001). According to Section 103(a) of FLPMA, an ACEC is defined as the following:
An area within the public lands where special management attention is required (when such areas are developed or used or where no development is required) to protect and prevent irreparable damage to important historic, cultural, or scenic values, fish and wildlife resources, or other natural systems or processes, or to protect life and safety from natural hazards.
Prior to its designation, management prescriptions are developed for each proposed ACEC. These prescriptions are site-specific and include actions that the BLM has authority to carry out, as well as recommendations for actions that the BLM does not have direct authority to implement, such as cooperative agreements with other agencies and mineral withdrawals (BLM 2001). Refer to Chapter 1 for additional discussion of FLPMA.
3.11.1.2 CALIFORNIA DESERT CONSERVATION AREA PLAN
ACECs are the primary active wildlife management tools used in the CDCA Plan. The project site is within the Yuha Basin ACEC, which was designated to protect cultural and natural resources within the area. Refer to Chapter 1 and Chapter 3, Sections 3.6 (Biological Resources) and 3.10 (Lands and Realty) for a more detailed discussion of the CDCA Plan.
3.11.1.3 YUHA BASIN ACEC PLAN AND YUHA DESERT MANAGEMENT PLAN
The CDCA Plan established two ACECs to conserve the flat-tailed horned lizard—Yuha Basin (40,622 acres) and East Mesa (40,712 acres). The CDCA Plan also directed that habitat management plans be written for lands adjacent to these ACECs. In 1981, a combined plan was prepared for the Yuha Basin ACEC (BLM 1981). Specific actions in the plan were designed to
Affected Environment
Page 3-74 Ocotillo Sol Project Draft EIS/Draft CDCA Plan Amendment
April 2012
protect sensitive cultural and wildlife resources while allowing for mineral material sales, geothermal development, and motorized vehicle competitive events.
The Yuha Desert Management Plan was prepared in response to indications of declining flat-tailed horned lizard populations and increasing damage to cultural resources due to route proliferation and cross-country vehicle travel in the Yuha Basin (BLM 1985). The Yuha Desert Management Plan covers both of the previous areas plus several adjacent ACECs and natural areas. The plan tightened controls on, but did not eliminate, OHV competitive events, and routes of travel were reduced in number, among other measures. In 1985, the Yuha Basin ACEC was expanded to 63,000 acres (BLM 1985).
The WECO Desert Routes of Travel Designations Plan amended the CDCA Plan and included route amendments within the Yuha Basin ACEC and Yuha Desert Management Area. The WECO Plan designated routes of travel within the Yuha Basin area as limited use, with the limitation to street legal vehicles for most of the routes, among other measures to help conserve the natural and cultural resources in the area (BLM 2003).
3.11.1.4 NATIONAL LANDSCAPE CONSERVATION SYSTEM
The National Landscape Conservation System (NLCS) was created by BLM in June 2000 in response to growing concern over the loss of open space. The NLCS brings into a single system some of the BLM’s premier land designations. The BLM hopes that by bringing these lands into an organized system public awareness of these areas’ scientific, cultural, educational, ecological, and other values will increase. Inclusion in the NLCS does not create any new legal protections for these lands, but it does provide BLM field offices with overall guidance and direction for management of the system. NLCS lands include the following: National Conservation Areas, National Monuments, Wilderness Areas, Wilderness Study Areas, Wild and Scenic Rivers, and National Historic and Scenic Trails.
3.11.1.5 CALIFORNIA DESERT PROTECTION ACT OF 1994
The California Desert Protection Act designated 69 Wilderness Areas on BLM-managed public lands in the California Desert. The Act states, “wilderness is a distinguishing characteristic of the public lands in the California desert.” and “The wilderness values of desert lands are increasingly threatened by . . . development.” The Act further states that there are no buffer zones designated along with wilderness areas: “The fact that non-wilderness activities or uses can be seen or heard from areas within a wilderness area shall not, of itself, preclude such activities or uses up to the boundary of the wilderness area” (PL103-433, Section 103(d)).
3.11.1.6 WILDERNESS ACT
Wilderness Areas are designated by Congress, under the authority of the Wilderness Act of 1964 as part of the National Wilderness Preservation System, and are managed by one of the following four land management agencies: the BLM, the USFWS, the U.S. Forest Service, or the National Park Service.

Affected Environment
Ocotillo Sol Project Page 3-75 Draft EIS/Draft CDCA Plan Amendment April 2012
According to the Wilderness Act, wilderness is defined as the following:
(c) A wilderness, in contrast with those areas where man and his own works dominate the landscape, is hereby recognized as an area where the earth and its community of life are untrammeled by man, where man himself is a visitor who does not remain. An area of wilderness is further defined to mean in this chapter an area of undeveloped federal land retaining its primeval character and influence, without permanent improvements or human habitation, which is protected and managed so as to preserve its natural conditions and which (1) generally appears to have been affected primarily by the forces of nature, with the imprint of man's work substantially unnoticeable; (2) has outstanding opportunities for solitude or a primitive and unconfined type of recreation; (3) has at least five thousand acres of land or is of sufficient size as to make practicable its preservation and use in an unimpaired condition; and (4) may also contain ecological, geological, or other features of scientific, educational, scenic, or historical value. (PL 88-577, Section 2[c])
A number of uses are specifically prohibited within Wilderness Areas. Prohibited uses include commercial enterprises; permanent and temporary roads (with exceptions for administration and emergency purposes); use of motorized vehicles, equipment, motorboats, or mechanical transport; landing of aircraft; or the erection of a structure or installation (PL 88-577, Section 4[c]).
BLM Manual 8560, Management of Designated Wilderness Areas, identifies BLM’s role in administering Wilderness Areas on public lands, provides policy guidance for BLM personnel, and sets the framework for wilderness management program development. It states the goals of wilderness management, as well as administrative functions and specific activities related to wilderness management.
3.11.2 EXISTING CONDITIONS
Existing special designations within or adjacent to the Ocotillo Sol Project area include only the Yuha Basin ACEC, which also includes the Yuha Desert Management Area, as described above. There are no NLCS lands or other BLM-supported special designations within the Ocotillo Sol Project area. The Juan Bautista de Anza National Historic Trail lies approximately 4.5 miles to the southwest of the Ocotillo Sol Project area (see Figure 1-1).
3.11.2.1 YUHA BASIN ACEC
The Yuha Basin ACEC consists of 63,000 acres in the Imperial Valley of California (see Figure 1-1 in Appendix A). The Yuha Desert is rich in both human and natural history. The Yuha Basin contains several unique areas, such as the Juan Bautista de Anza National Historic Trail, geoglyphs created by Native Americans, an area of rare crucifixion thorns, oyster shell beds, and the Yuha Well. The Yuha Basin ACEC was established to protect these unique cultural and natural resources, particularly habitat for the flat-tailed horned lizard.
The majority of the Yuha Basin ACEC overlaps the Yuha Desert Management Area (see Figure 3.10-1 in Appendix A). This management area was specifically designated by BLM for the flat-

Affected Environment
Page 3-76 Ocotillo Sol Project Draft EIS/Draft CDCA Plan Amendment
April 2012
tailed horned lizard, as outlined in the Flat-tailed Horned Lizard Rangewide Management Strategy, to provide guidance for the conservation and management of sufficient habitat to maintain the existing populations of flat-tailed horned lizard in five Management Areas and one research area.
3.11.2.2 JUAN BAUTISTA DE ANZA NATIONAL HISTORIC TRAIL
In 1774 and 1776, the Spanish crown commissioned the captain of the small Presidio of Tubac (promoted to Lieutenant-Colonel after the first expedition) Juan Bautista de Anza to lead two expeditions to establish a settlement on San Francisco Bay. Congress designated the route followed by Juan Bautista de Anza as a National Historic Trail in 1990. Within the U.S., the Juan Bautista de Anza National Historic Trail is approximately 1,200 miles long, extending from Tubac, Arizona, to San Francisco, California. In 1996, the National Park Service finalized a Comprehensive Management and Use Plan and EIS for the Juan Bautista de Anza National Historic Trail, which provides the BLM with trail management guidance. Local agencies were tasked to develop a recreational Juan Bautista de Anza National Historic Trail (see Figure 1-1 in Appendix A) inside of a one-mile wide corridor established by the National Park Service management plan and EIS. The de Anza Auto Route has already been established along Interstate 8.
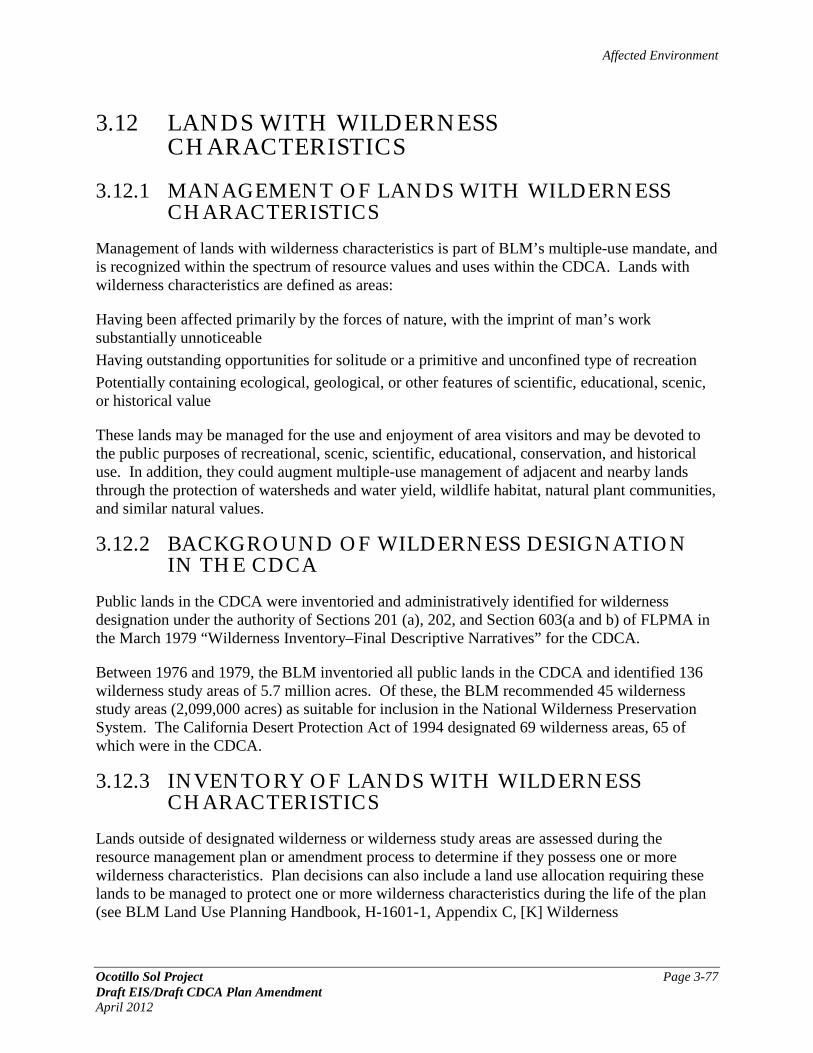
Affected Environment
Ocotillo Sol Project Page 3-77 Draft EIS/Draft CDCA Plan Amendment April 2012
3.12 LANDS WITH WILDERNESS CHARACTERISTICS
3.12.1 MANAGEMENT OF LANDS WITH WILDERNESS CHARACTERISTICS
Management of lands with wilderness characteristics is part of BLM’s multiple-use mandate, and is recognized within the spectrum of resource values and uses within the CDCA. Lands with wilderness characteristics are defined as areas:
Having been affected primarily by the forces of nature, with the imprint of man’s work substantially unnoticeable
Having outstanding opportunities for solitude or a primitive and unconfined type of recreation
Potentially containing ecological, geological, or other features of scientific, educational, scenic, or historical value
These lands may be managed for the use and enjoyment of area visitors and may be devoted to the public purposes of recreational, scenic, scientific, educational, conservation, and historical use. In addition, they could augment multiple-use management of adjacent and nearby lands through the protection of watersheds and water yield, wildlife habitat, natural plant communities, and similar natural values.
3.12.2 BACKGROUND OF WILDERNESS DESIGNATION IN THE CDCA
Public lands in the CDCA were inventoried and administratively identified for wilderness designation under the authority of Sections 201 (a), 202, and Section 603(a and b) of FLPMA in the March 1979 “Wilderness Inventory–Final Descriptive Narratives” for the CDCA.
Between 1976 and 1979, the BLM inventoried all public lands in the CDCA and identified 136 wilderness study areas of 5.7 million acres. Of these, the BLM recommended 45 wilderness study areas (2,099,000 acres) as suitable for inclusion in the National Wilderness Preservation System. The California Desert Protection Act of 1994 designated 69 wilderness areas, 65 of which were in the CDCA.
3.12.3 INVENTORY OF LANDS WITH WILDERNESS CHARACTERISTICS
Lands outside of designated wilderness or wilderness study areas are assessed during the resource management plan or amendment process to determine if they possess one or more wilderness characteristics. Plan decisions can also include a land use allocation requiring these lands to be managed to protect one or more wilderness characteristics during the life of the plan (see BLM Land Use Planning Handbook, H-1601-1, Appendix C, [K] Wilderness

Affected Environment
Page 3-78 Ocotillo Sol Project Draft EIS/Draft CDCA Plan Amendment
April 2012
Characteristics). These characteristics include naturalness, outstanding opportunities for solitude, and outstanding opportunities for primitive and unconfined recreation.
The BLM may consider whether there are lands with wilderness characteristics within areas proposed for a land use plan amendment. The proposed land use plan amendment for the Ocotillo Sol Project includes public lands that were inventoried for potential wilderness designation between 1976 and 1979. The proposed project site is on public lands that were inventoried but were not found to have values that justified further analysis as an inventory unit. Because of the intensive inventory and studies, which were completed under Section 603 of FLPMA in 1979, the BLM does not find that resource conditions or characteristics have changed on the site, and does not find that the area contains wilderness characteristics. For a complete description of the Inventory Units and the findings of the inventory, see the “Wilderness Inventory—Final Descriptive Narratives—California Desert Conservation Area” (1979) and the Draft CDCA Plan and Final EIS (1980).
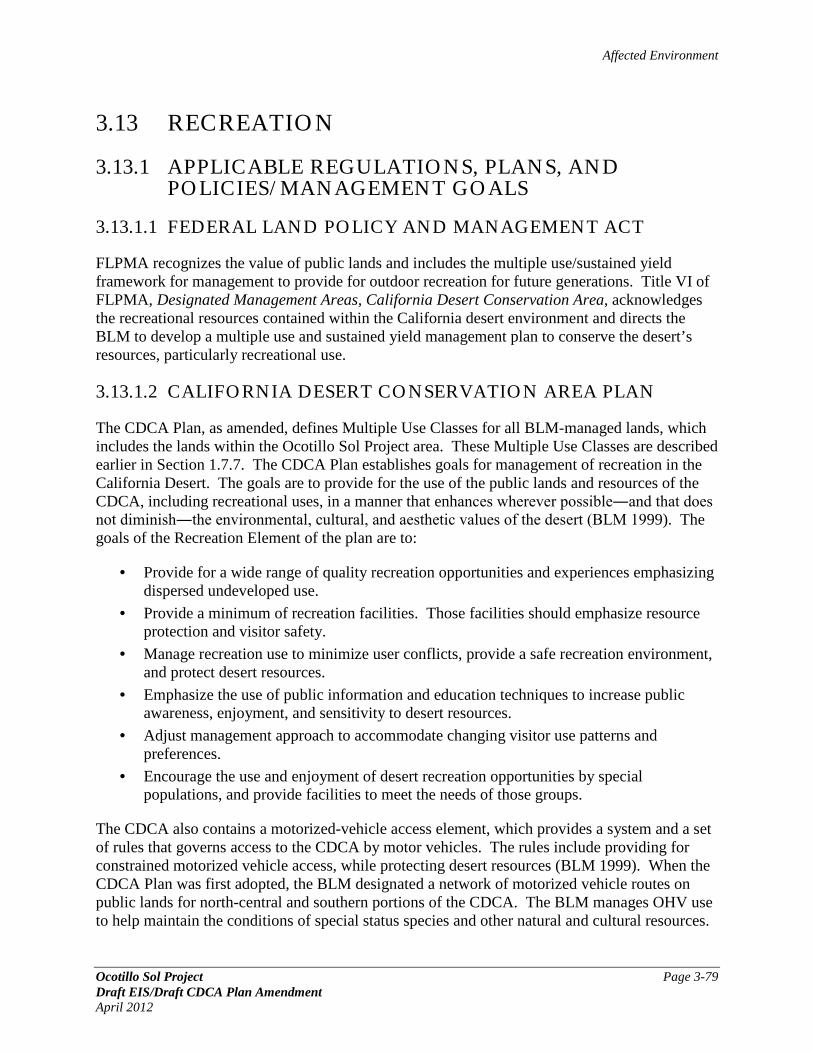
Affected Environment
Ocotillo Sol Project Page 3-79 Draft EIS/Draft CDCA Plan Amendment April 2012
3.13 RECREATION
3.13.1 APPLICABLE REGULATIONS, PLANS, AND POLICIES/MANAGEMENT GOALS
3.13.1.1 FEDERAL LAND POLICY AND MANAGEMENT ACT
FLPMA recognizes the value of public lands and includes the multiple use/sustained yield framework for management to provide for outdoor recreation for future generations. Title VI of FLPMA, Designated Management Areas, California Desert Conservation Area, acknowledges the recreational resources contained within the California desert environment and directs the BLM to develop a multiple use and sustained yield management plan to conserve the desert’s resources, particularly recreational use.
3.13.1.2 CALIFORNIA DESERT CONSERVATION AREA PLAN
The CDCA Plan, as amended, defines Multiple Use Classes for all BLM-managed lands, which includes the lands within the Ocotillo Sol Project area. These Multiple Use Classes are described earlier in Section 1.7.7. The CDCA Plan establishes goals for management of recreation in the California Desert. The goals are to provide for the use of the public lands and resources of the CDCA, including recreational uses, in a manner that enhances wherever possible―and that does not diminish―the environmental, cultural, and aesthetic values of the desert (BLM 1999). The goals of the Recreation Element of the plan are to:
• Provide for a wide range of quality recreation opportunities and experiences emphasizing dispersed undeveloped use.
• Provide a minimum of recreation facilities. Those facilities should emphasize resource protection and visitor safety.
• Manage recreation use to minimize user conflicts, provide a safe recreation environment, and protect desert resources.
• Emphasize the use of public information and education techniques to increase public awareness, enjoyment, and sensitivity to desert resources.
• Adjust management approach to accommodate changing visitor use patterns and preferences.
• Encourage the use and enjoyment of desert recreation opportunities by special populations, and provide facilities to meet the needs of those groups.
The CDCA also contains a motorized-vehicle access element, which provides a system and a set of rules that governs access to the CDCA by motor vehicles. The rules include providing for constrained motorized vehicle access, while protecting desert resources (BLM 1999). When the CDCA Plan was first adopted, the BLM designated a network of motorized vehicle routes on public lands for north-central and southern portions of the CDCA. The BLM manages OHV use to help maintain the conditions of special status species and other natural and cultural resources.

Affected Environment
Page 3-80 Ocotillo Sol Project Draft EIS/Draft CDCA Plan Amendment
April 2012
3.13.1.3 WESTERN COLORADO OFF-HIGHWAY VEHICLE ROUTES OF TRAVEL DESIGNATION PLAN
The WECO OHV Routes of Travel Designation Plan, an amendment to the CDCA Plan, covers approximately 475,000 acres and approximately 2,320 miles of OHV routes of travel on BLM-managed lands in Imperial County, California. The WECO Plan designates routes within the WECO as open, limited, or closed. The majority of routes in the Yuha Basin ACEC are designated as limited. Only street-legal vehicles are allowed on the routes in the Yuha Basin ACEC, except for the routes that are identified as part of the Back Country Discovery Route (Route 346) or Juan Bautista de Anza National Historic Trail (Routes 274 and 308), which are designated as open. Camping is allowed only in designated camping areas. Camping next to roads in areas that are not designated as camping areas is not allowed. The Yuha Basin ACEC is used for on-route touring and limited camping; off-route play is not allowed (BLM 2002).
3.13.1.4 OFF-ROAD VEHICLES (TITLE 43 CFR 8340, ET SEQ.)
Title 43 CFR 8340 establishes criteria for designating public lands as open, limited, or closed to the use of OHVs and for establishing controls governing the use and operation of OHVs in such areas, while protecting resources, promoting safety, and minimizing user conflicts. Recreational use under Title VI includes the use of OHVs.
3.13.2 EXISTING CONDITIONS
The Ocotillo Sol Project area is within the Yuha Basin ACEC, which is a limited use area suitable for low to moderate recreational use densities. Recreational opportunities within the Ocotillo Sol Project vicinity include sightseeing and on-route motor vehicle touring (street legal only), bicycling, hiking, wildlife viewing, rockhounding, and hunting. OHV use is not allowed within the limited use area or along the BLM routes near the Ocotillo Sol Project. There are no recreational facilities within the project vicinity.

Affected Environment
Ocotillo Sol Project Page 3-81 Draft EIS/Draft CDCA Plan Amendment April 2012
3.14 VISUAL RESOURCES
3.14.1 APPLICABLE REGULATIONS, PLANS, AND POLICIES/MANAGEMENT GOALS
3.14.1.1 FEDERAL LAND POLICY AND MANAGEMENT ACT AND VISUAL RESOURCE MANAGEMENT SYSTEM
BLM’s responsibility to manage the scenic resources of the public lands is established by law:
FLPMA states, “public lands will be managed in a manner which will protect the quality of the scenic (visual) values of these lands.”
NEPA requires that measures be taken to “assure for all Americans . . . aesthetically pleasing surroundings . . . .”
This responsibility is reinforced by BLM’s mission statement, “to sustain the health, diversity, and productivity of the public lands for the use and enjoyment of present and future generations.”
BLM’s policy is that it has a basic stewardship responsibility to identify and protect visual values on all BLM lands. In order to meet this, BLM has developed a Visual Resource Management (VRM) system that identifies and evaluates scenic values to determine the appropriate levels of management. The VRM system also provides a way to analyze potential visual impacts and apply visual design techniques to ensure that surface-disturbing activities are in harmony with their surroundings.
The VRM system is described in BLM Manual Section 8400–Visual Resource Management (BLM 1984), with additional guidance in handbooks H-8410-1 Visual Resource Inventory (BLM 1986a) and H-8431-1 Visual Resource Contract Rating (BLM 1986b), and in instruction memorandum, including Instruction Memorandum 2009-167, Application of the Visual Resource Management Program to Renewable Energy (BLM 2009).
The Visual Resource Inventory (VRI) measures three primary components (scenic quality, sensitivity level, and distance zones) and serves as the baseline for analysis of potential impacts.
3.14.1.2 CALIFORNIA DESERT CONSERVATION AREA PLAN
The CDCA attracts millions of visitors annually to its diverse landscape settings, which provide the opportunity for a desert experience of natural beauty and solitude. Scenic values are often cited by the public as the desert’s most important resource (BLM 1999). BLM manages the scenic and visual resources of the area in accordance with MUCs designated by the CDCA Plan. Acknowledging that management activities may involve alteration of the natural character of the landscape to some degree, BLM identifies appropriate levels of management, protection, and rehabilitation on all public lands in the CDCA, commensurate with visual resource management objectives in the Multiple Use Class guidelines.

Affected Environment
Page 3-82 Ocotillo Sol Project Draft EIS/Draft CDCA Plan Amendment
April 2012
The Multiple Use Class that applies to the Ocotillo Sol Project area is Class L (Limited Use). The CDCA Plan prescribes management for Class L as follows: “These lands are managed to protect sensitive, natural, scenic, ecological, and cultural resource values. They provide for generally lower-intensity, carefully controlled multiple uses that do not significantly diminish resource values” (BLM 1999). More specifically, the CDCA Plan provides for solar generation facilities on Class L lands after NEPA requirements have been met.
3.14.1.3 EL CENTRO FIELD OFFICE LANDSCAPE-LEVEL VISUAL RESOURCE INVENTORY
In 2010, the BLM completed a landscape-level VRI of the BLM-administered lands within the El Centro Field Office (Otak 2010). These lands were divided into Scenic Quality Rating Units (SQRU), Sensitivity Level Rating Units (SLRU), and Distance Zones.
The SQRUs are delineated based on physiographic characteristics such as geology, vegetation, hydrology, texture, color, variety, and topography. Each SQRU was given a number and name, and scenic quality was measured based on the scoring of seven factors including landform, vegetation, water, color, influence of adjacent scenery, scarcity, and cultural modification. Scenic Quality is then scored to meet one of three measures Scenic Quality A, B, or C with A being of the highest quality (or variability) and C being the lowest. The Ocotillo Sol Project area is entirely within the 52,666-acre SQRU 12, Yuha Desert
The SLRUs are delineated based on the measure of public concern for the maintenance of scenic quality. The sensitivity inventory addresses type of use, amount of use, public interest, adjacent land uses, special areas, and other factors that may be unique to a given setting. As with SQRUs, SLRUs are given a number and name. The Ocotillo Sol Project area is entirely within the 52,666-acre SLRU 12, Yuha Desert, which has a boundary that mirrors SQRU 12.
Distance Zones, landscapes are subdivided into three distanced zones based on relative visibility from travel routes or observation points. The three zones are the foreground–middleground, background, and seldom seen zones. The foreground–middleground zone includes areas seen from highways, rivers, or other viewing locations that are less than 3 to 5 miles away. Seen areas beyond the foreground–middleground zone but usually less than 15 miles away are in the background zone. Areas not seen as foreground–middleground or background (i.e., hidden from view) are in the seldom-seen zone.
Ocotillo Sol Project lies within a landscape setting that was inventoried to have the following visual values:
Scenic Quality: Scenic Quality C (total score of 7.5). Featureless landform with some unique areas of vegetation in the western portion and views of wilderness area and Coyote Mountains to the west. This unit does not stand out as being unique; without adjacent scenery and diversity of vegetation to the west, it would be common and ordinary. Scenic Quality C represents 71 percent of the total area inventoried within the El Centro Field Office.

Affected Environment
Ocotillo Sol Project Page 3-83 Draft EIS/Draft CDCA Plan Amendment April 2012
Sensitivity Level: Overall rating of High (Maintenance of Visual Quality has High Value). Culturally significant with many visually important features: Crucifixion Thorn Natural Area, Juan Bautista de Anza National Historic Trail. (All lands within SQRU 12 were shown to be within a 15-mile offset of this National Historic Trail. Additionally, the SQRU boundaries were defined by the Yuha ACEC.) Sensitivity Level High represents 48 percent of the total area inventoried within the El Centro Field Office.
Distance Zone: Foreground–Middleground Zone (area that can be seen from a travel route for a distance of 3 to 5 miles). All lands within the ECFO were identified as being within the Foreground/Middleground of either a major travel route or an established secondary travel route. Foreground/Middleground represents 93 percent of the overall El Centro VRI area.
Based on these evaluations, VRI Class III was assigned to this proximity of the inventoried boundary, as determined by the VRI Assignment Matrix Illustration 11 in the VRM Handbook and shown in Table 3.14-1. VRI Class III represents 36 percent of the total area inventoried within the El Centro Field Office.
TABLE 3.14-1 VISUAL RESOURCE INVENTORY CLASS DIAGRAM – BASIS FOR DETERMINING
VISUAL RESOURCE INVENTORY CLASSES

Affected Environment
Page 3-84 Ocotillo Sol Project Draft EIS/Draft CDCA Plan Amendment
April 2012
3.14.1.4 SITE-SPECIFIC VISUAL RESOURCE INVENTORY
For the purposes of this EIS, RECON Environmental, Inc. was directed to conduct a site-specific visual resource assessment of the Ocotillo Sol Project area to evaluate and document current conditions on a more detailed project level than previously done in the effort described above. This is discussed in sections 3.14.2 through 3.14.6 below.
3.14.1.5 IMPERIAL COUNTY GENERAL PLAN
The Imperial County General Plan contains guidance related to scenic resources and open spaces within the county. The Conservation and Open Space element of the General Plan recognizes the aesthetics of the Yuha Desert, and sets goals and objectives for protecting its unique geologic features including sand chimneys, painted gorge formations, and mountainous terrain. Unique features such as these, rock outcroppings, historic buildings, or prominent scenic landmarks do not occur within or near the Ocotillo Sol Project area.
The Circulation and Scenic Highways Element of the General Plan provides a means of protecting and enhancing scenic resources within highway corridors in Imperial County, consistent with the California Department of Transportation (Caltrans) State Scenic Highway Program. There are no county, state, or federally designated scenic highways within 15 miles or within viewing distance of the Ocotillo Sol Project area.
3.14.2 REGIONAL CONTEXT
3.14.2.1 LANDSCAPE CHARACTER AND TYPE
The regional location is the western portion of the Salton Trough, in the Basin and Range Province, and east of the rugged mountainous terrain of the Peninsular Ranges in the Lower California Province (California Geologic Survey 2002). This transitional zone between physiographic provinces is characterized by badlands landscape features, very rugged and sparsely vegetated low mountains, and relatively level alluvial plains with a sparse to moderate vegetated cover of creosote, saltbush, prickly pear, and other small subshrubs and grasses (creosote flats). The landscape type is panoramic, with a broad horizontal composition and little sense of boundary restriction other than distant views of rugged mountainous terrain. The regional landscape character is represented in Figure 3.14-1 (see Appendix A).
3.14.2.2 PROJECT VICINITY
The Ocotillo Sol Project area is in the Yuha Desert and within the boundaries of BLM’s Yuha Basin ACEC. The northern boundary of the 115-acre site abuts the existing Imperial Valley Substation. High-voltage power lines and supporting structures are aligned along the east boundary of the Ocotillo Sol Project area, extending south. The project vicinity is represented in Figure 3.14-2 (see Appendix A). Lands adjacent to the eastern, southern, and western boundaries are similarly characterized by creosote flats.
The Westside Irrigation Canal lies approximately 2 miles east of the Ocotillo Sol Project area. A dense band of tamarisk and other vegetation parallels the west side of this canal, east of which

Affected Environment
Ocotillo Sol Project Page 3-85 Draft EIS/Draft CDCA Plan Amendment April 2012
are cultivated agricultural lands. The nearest residences are approximately 1 mile to the north, 1.75 miles to the east, and over 2 miles to the southeast of the Ocotillo Sol Project area. There is a recreational vehicle resort and a mobile home park approximately 4 miles to the north/northeast of the Ocotillo Sol Project area. Views of the Ocotillo Sol Project site from these residences are either indistinguishable or screened from view due to the distance, tower structures at the existing Imperial Valley Substation, intervening vegetation and topography, and low angle of view.
3.14.3 DISTANCE ZONES AND KEY OBSERVATION POINTS
BLM considers landscape distance zones based on relative visibility from key observation points (KOPs). KOPs typically include scenic overlooks, important trails, significant viewpoints in Wilderness, nearby residential or sensitive use areas, and major recreational travel routes.
The distance zones include the foreground–middleground (visible areas within 3 to 5 miles), the background (visible areas beyond the foreground–middleground, but less than 15 miles away), and seldom-seen areas (i.e., areas hidden from view and/or over 15 miles away).
The Ocotillo Sol Project area is either not visible or is seldom seen from most locations within the Jacumba Mountains Wilderness. Certain locations at higher elevations and on east-facing slopes within the Jacumba Mountains Wilderness have a line of sight to the project area, but from these distances of over 12 miles, the project would be within distant background views and would not dominate nor detract from the viewshed. The viewshed analysis indicates that the total designated Wilderness with a line of site to the project area constitutes less than 5 percent of the Wilderness area (see map in Appendix L). The project would not visually dominate views from these locations due to the small size and scale within the overall viewshed, visual collocation with the existing substation, and the background agricultural development.
The project area is almost entirely screened from view by intervening trees and vegetation from locations within agricultural lands to the east. Views of the Ocotillo Sol Project area from the Juan Bautista de Anza National Historic Trail, at its nearest 4.5 miles to the southwest, are also indistinguishable due to distance and intervening vegetation and topography. The Ocotillo Sol Project area is not visible from the Vista de Anza kiosk and viewpoint location, at a distance of approximately 11 miles with intervening topography (see discussion below and Viewshed Analysis Map, Appendix L).
Three KOPs, representative of locations from which the viewing public could most often see the project area, were identified for this project in consultation with BLM. These include locations along Interstate 8 and Highway 98. The travel corridors of Interstate 8 and Highway 98 were both considered to be linear KOP features with the potential for foreground–middleground views of the Ocotillo Sol Project area. At its closest distance, Interstate 8 is over 4 miles to the north of the project area; Highway 98 is over 2 miles to the south at its closest distance. Both eastbound and westbound views of travelers along these corridors were considered. A detailed analysis (Visual Contrast Rating) and photographs for each of the KOPs is included in Appendix L, and is summarized as follows:

Affected Environment
Page 3-86 Ocotillo Sol Project Draft EIS/Draft CDCA Plan Amendment
April 2012
KOP #1: Location is 6-plus miles northwest of the project area, along Interstate 8 at the Dunaway Road Interchange. From this and similar locations along Interstate 8, views of the Ocotillo Sol Project area are indistinguishable due to the low angle of view and intervening line-of-sight obstructions between the KOP and the project area: vegetation, topography, and structures at the existing Imperial Valley Substation (the Imperial Valley Substation itself is indiscernible at this distance and blocks most views of the project area from locations along Interstate 8).
KOP #2: Location is 4-plus miles southwest of the project area, along Highway 98 Imperial Highway, at the San Diego Gas & Electric access road. From this location, views of the Ocotillo Sol Project area are indistinguishable due to the low angle of view, and intervening line-of-sight obstructions between the KOP and the project area: primarily vegetation and topography (the Imperial Valley Substation itself is indiscernible at this distance).
KOP #3: Location is approximately 2.5 miles southeast of the project area, along Highway 98 Imperial Highway, at Mount Signal Road, at approximately the same elevation. From this location along Highway 98, views of the Ocotillo Sol Project area are nearly indistinguishable due to the low angle of view, and intervening line-of-sight obstructions between the KOP and the project area: primarily vegetation, and topography (the Imperial Valley Substation and transmission line towers are barely discernible in the distance).
3.14.4 VISUAL SENSITIVITY
BLM lands are assigned a sensitivity rating of high, medium, or low, based on types of users, amount of use, public interest, adjacent land uses, and presence of special areas. Areas seen by large numbers of people engaged in recreational pursuits generally are assigned a high sensitivity level. Highway 98 is used by recreationists in the Yuha Basin ACEC. As discussed earlier, the Yuha Basin ACEC was assigned a high visual sensitivity level due to the presence of biological and cultural significant resources, wilderness access, recreational opportunities, travel corridors and other factors.
Visitor sensitivity to visual resources seen from the Juan Bautista de Anza National Historic Trail or the associated Vista de Anza Viewpoint is assumed to be high. BLM has interpretive information about the Juan Bautista de Anza National Historic Trail at the Vista de Anza Viewpoint, and has identified this as a location from which to view the National Historic Trail area.
Although the overall visual sensitivity of the Yuha Basin ACEC is considered high, viewer sensitivity to the Ocotillo Sol Project area and its immediate surroundings is considered to be relatively low to moderate. This is due to its location at the eastern boundary of the ACEC, in close proximity to agricultural lands and immediately adjacent to the Imperial Valley Substation and associated transmission corridors.
Numerous OHV routes are shown within the Yuha ACEC Limited Area, which generally includes the Ocotillo Sol Project area and extends west. Some of these nearby routes include locations with views of the Imperial Valley Substation and the Ocotillo Sol Project area. The OHV recreationists’ viewer sensitivity to the appearance of the Ocotillo Sol Project area is considered to be low due to the dominant visual presence of the adjacent Imperial Valley Substation towers, structures, and overhead transmission lines.

Affected Environment
Ocotillo Sol Project Page 3-87 Draft EIS/Draft CDCA Plan Amendment April 2012
3.14.5 SCENIC QUALITY
The on-site scenic quality field inventory was performed in March 2011. SQRUs were identified, evaluated, and mapped (see Figure 3.14-3 in Appendix A). SQRU evaluation forms were completed (see Appendix L) and are summarized in Table 3.14-2.
As discussed above, the Ocotillo Sol Project area is entirely within SQRU 12, Yuha Desert, identified by the El Centro Field Office landscape-level VRI. The site-specific field inventory identified two sub-areas of this SQRU, identified as SQRU 12a and SQRU 12b, which have differences related to vegetative density and diversity.
TABLE 3.14-2 SCENIC QUALITY RATING UNITS OF THE OCOTILLO SOL PROJECT AREA
SQRU Description Scenic Quality Classification*
SQRU-12a Creosote flats C SQRU-12b Xeroriparian shrub-scrub B
*Note: BLM classifies scenic quality as A (high), B (medium), or C (low).
A detailed assessment and photographs of these two SQRUs are included in Appendix L, and is summarized as follows:
SQRU 12a: Sparsely vegetated open area with slightly rounded, raised hummocks (low mounds). Vegetation consists primarily of creosote shrubs, with some occasional occurrences of mesquite and acacia. The ground plane is seasonally colorful when wildflowers bloom.
Views North: Views of Imperial Valley substation and transmission lines dominate the foreground views to the north and screen background and middleground views of areas further north.
Views West: Foreground and middleground views of creosote flats, and distant background views of the Jacumba Mountains and Wilderness, over 11 miles to the west.
Views South: Distant background views of Mount Signal in Mexico (4-plus miles), and linear alignment of transmission lines and support structures.
Views East: Existing unpaved road and continued creosote flats in foreground, and distant, linear grove of tamarisk trees, which screen middleground and background views of agricultural cultivated lands further east.
SQRU 12b: This unit is limited to the southeastern area of the study area, but does not extend into the Ocotillo Sol site boundary. Visual character and scenic quality are similar to SQRU 12a (i.e., sparsely vegetated with slight variations in predominantly flat terrain), but with somewhat higher degree of vegetative structure and species diversity, due to hydrology (seasonal surface flows associated with Pinto Wash) and resulting presence of several xeroriparian plant species (e.g., smoke tree, mesquite, acacia, and Mormon tea).

Affected Environment
Page 3-88 Ocotillo Sol Project Draft EIS/Draft CDCA Plan Amendment
April 2012
Views North: Views of Imperial Valley substation and transmission lines dominate the foreground views to the north and screen background and middleground views of areas further north.
Views West: Foreground and middleground views of creosote flats xeroriparian shrub-scrub, and distant background views of the Jacumba Mountains and Wilderness, over 11 miles to the west.
Views South: Distant background views to the south of Mount Signal in Mexico (4-plus miles), and linear alignment of transmission lines and support structures.
Views East: Existing unpaved road and continued creosote flats in foreground, and distant, linear grove of tamarisk trees, which screen middleground and background views of agricultural cultivated lands further east.
3.14.6 INTERIM VISUAL RESOURCE MANAGEMENT CLASS
Interim VRM Classes are established where a project is proposed and there are no VRM Classes designated by the land use or resource management plan for the area. That is the case for the Ocotillo Sol Project Area; VRM Classes are not designated by the CDCA Plan. As discussed above, BLM manages the scenic and visual resources of the project area in accordance with the Multiple Use Class guidelines of the CDCA Plan. The CDCA Plan allocation for the project area is Multiple Use Class L (Limited Use). The CDCA Plan prescribes management for Class L as follows: “These lands are managed to protect sensitive, natural, scenic, ecological, and cultural resource values. They provide for generally lower-intensity, carefully controlled multiple uses that do not significantly diminish resource values” (BLM 1999). More specifically, the CDCA Plan provides for solar generation facilities on Class L lands after NEPA requirements have been met.
In the absence of VRM Class designations in the CDCA, BLM identifies an Interim VRM Class for the project area that reflects maximum protection of the visual values that supports and does not conflict with the decisions within the CDCA. For Multiple Use Class L visual management prescriptions, the VRM Class with closely corresponding visual management objective is Class III. The visual management objective of Class III is
to partially retain the existing character of the landscape. The level of change to the characteristic landscape should be moderate. Management activities may attract attention but should not dominate the view of the casual observer. Changes should repeat the basic elements found in the predominant natural features of the characteristic landscape (BLM 1984).
An Interim VRM Class III assignment for the Ocotillo Sol Project area is consistent with the CDCA prescriptions and the inventory class (VRI Class III), and is proposed by BLM for the Ocotillo Sol Project area. Rationale for this is discussed further in Section 4.13.1. The ability to construct the project and maintain conformance with the VRM Class III objective is demonstrated in Chapter 4, Section 4.13.

Affected Environment
Ocotillo Sol Project Page 3-89 Draft EIS/Draft CDCA Plan Amendment April 2012
3.14.7 LIGHT AND GLARE
The Ocotillo Sol Project area is in a remote and undeveloped area of Imperial County. The surrounding land uses consist of open desert, the Imperial Valley Substation, transmission lines, Westside Main Canal, and agricultural uses to the east of the canal. The nearest residences are approximately 1 mile to the north, 1.75 miles to the east, and over 2 miles to the southeast of the Ocotillo Sol Project area. There is a recreational vehicle resort and a mobile home park located approximately 4 miles to the north/northeast of the Ocotillo Sol Project area. Views of the Ocotillo Sol Project site from these residences are either indistinguishable or screened from view due to the distance, tower structures at the existing Imperial Valley Substation, intervening vegetation and topography, and low angle of view.
The Imperial Valley Substation is the primary source of artificial lighting and glare in the Ocotillo Sol Project vicinity. Night lighting of the substation consists of security lighting that is shielded and directed downward. The substation and associated transmission lines may occasionally produce glare during daylight hours from the sun’s reflection on metal surfaces.
Routes and roads near the Ocotillo Sol Project area have little nighttime traffic overall. Major roadways, Highway 98 and Interstate 8, are 2 to 4 miles (and further), respectively, away from the Ocotillo Sol Project area. There is little light generated by the canal and agricultural fields to the east.

Affected Environment
Page 3-90 Ocotillo Sol Project Draft EIS/Draft CDCA Plan Amendment
April 2012
3.15 TRANSPORTATION AND PUBLIC ACCESS
3.15.1 APPLICABLE REGULATIONS, PLANS, AND POLICIES/MANAGEMENT GOALS
3.15.1.1 CALIFORNIA DESERT CONSERVATION AREA PLAN
The CDCA Plan provides a framework for land management decision-making for the BLM-administered lands in the California Desert District. First, land is assigned one of four BLM Multiple Use Classes. Then, specific land management decisions are made as needed based on the uses and usage level appropriate for that Class. The CDCA Plan addresses vehicle travel and access across public lands as follows:
The need for access across public lands to permit utilization of state- and privately owned lands and to permit authorized developments on public lands, including mining claims, is recognized. The routes of travel and construction standards are subject to such BLM control as is required to prevent unnecessary or undue degradation of the public lands and their resources or to afford environmental protection.
To engage in most desert recreational activities outside of open areas, visitors must use motorized vehicles and usually travel on some previously used or marked motorized-vehicle route. Understandably, vehicle access is among the most important recreation issues in the Desert. A primary consideration of the recreation program, therefore, is to ensure that access routes necessary for recreation enjoyment are provided. Specific route identification, as outlined in the Motorized-Vehicle Access Element, will be initiated upon adoption of this Plan. (BLM 1999)
3.15.1.2 WESTERN COLORADO OFF-HIGHWAY VEHICLE ROUTES OF TRAVEL DESIGNATION PLAN
The WECO Plan, an amendment to the CDCA Plan, covers approximately 475,000 acres and approximately 2,320 miles of OHV routes of travel on BLM-managed lands in Imperial County, California. The WECO Plan designates routes within the WECO as open, limited, or closed. BLM routes near the Ocotillo Sol Project area are designated as limited. Only street-legal vehicles are allowed on limited routes (BLM 2002). Additional detail on the WECO Plan is described in Section 3.13, Recreation.
3.15.1.3 FEDERAL TRANSPORTATION REGULATIONS (49 CFR, SUBTITLE B)
49 CFR, Subtitle B, contains procedures and regulations pertaining to interstate and intrastate transport, including hazardous materials program procedures, and provides safety measures for motor carriers and motor vehicles that operate on public highways.

Affected Environment
Ocotillo Sol Project Page 3-91 Draft EIS/Draft CDCA Plan Amendment April 2012
3.15.1.4 CALIFORNIA VEHICLE CODE
The California Vehicle Code contains regulations applicable to roadway damage; licensing, size, weight, and load of vehicles operated on highways; safe operation of vehicles; and the transportation of hazardous materials.
3.15.1.5 CALIFORNIA STREETS AND HIGHWAY CODE
The California Streets and Highways Code specifies that permits issued by Caltrans be required for any roadway encroachment during truck transportation and delivery, as well as for any load that exceeds Caltrans’s weight, length, or width standards for public roadways.
3.15.1.6 IMPERIAL COUNTY GENERAL PLAN
Use of Imperial County roads in the Ocotillo Sol Project area is subject to state regulation by the California Vehicle Code and enforced by the sheriffs’ departments of Imperial County. Planning and improvement of major local roads is under the jurisdiction of the Imperial County Department of Public Works. Policies and programs for improvement to regional transportation, congestion management, and capacities of major circulation routes are provided in the Imperial County General Plan Circulation and Scenic Highways Element (2006).
3.15.2 EXISTING CONDITIONS
The Ocotillo Sol project area is on BLM-managed lands adjacent to a rural area with few public roadways in the vicinity (Figure 3.15-1 in Appendix A). To the north of the Ocotillo Sol Project area is Interstate 8, a primary east–west route between Yuma, Arizona, and San Diego, California.
Paralleling Interstate 8 to the south of the Ocotillo Sol Project area is Highway 98, a state highway that begins at a junction with Interstate 8 near Ocotillo and runs east approximately 56 miles, passing through the city of Calexico, to a second junction with Interstate 8 near the Imperial Sand Dunes.
BLM Route 358 runs north/northwest from Highway 98 to Interstate 8. From Highway 98, this route runs north to the Ocotillo Sol Project area, turns west at the northeast corner and traverses the area between the project site and the Imperial Valley Substation before turning northwest to connect to Interstate 8 to the north. BLM Route 358 is designated under WECO as Limited and is restricted to street legal vehicles only. An unnamed route, not designated as a BLM route, runs north, northeast from Highway 98 to the Imperial Valley Substation and is currently used as construction access for the Sunrise Powerlink project. This unnamed route would also be the access road for the Ocotillo Sol Project.
Drew Road, an Imperial County road approximately 2 miles east of the Ocotillo Sol Project area, runs north from Highway 98.
In addition to these public roadways, there are numerous private roads to the north and east of the Ocotillo Sol Project area that are used in support of agricultural operations.

Affected Environment
Page 3-92 Ocotillo Sol Project Draft EIS/Draft CDCA Plan Amendment
April 2012
According to a traffic analysis conducted for a neighboring project, all intersections within the vicinity of the Ocotillo Sol Project area currently operate at level of service (LOS) C or better during peak hours (LOS Engineering as cited in BLM 2010). Additionally, all freeway segments operate at LOS B or better and all roadway segments operate at LOS A within the vicinity of the Ocotillo Sol Project area (LOS Engineering as cited in BLM 2010). Level of service is defined on a scale of A to F, where LOS A through C represent free-flowing traffic conditions with little or no delay. LOS D represents limited congestion and some delay; however, the duration of periods of delay is acceptable to most people. LOS E and F represent significant delay on local streets. LOS A represents the best operating condition and LOS F denotes the worst operating condition.

Affected Environment
Ocotillo Sol Project Page 3-93 Draft EIS/Draft CDCA Plan Amendment April 2012
3.16 NOISE AND VIBRATION
Noise is defined as unwanted sound. Airborne sound is a rapid fluctuation of air pressure above and below atmospheric pressure. There are several ways to measure noise, depending on the source of the noise, the receiver, and the reason for the noise measurement. Environmental noise levels are typically stated in terms of decibels on the A-weighted scale (dBA). Noise levels stated in terms of dBA reflect the response of the human ear by filtering out some of the noise in the low- and high-frequency ranges that the ear does not detect well. The A-weighted scale is used in most community ordinances and standards. Human hearing typically encompasses the sound range from just above 0 dBA at the quietest end to approximately 140 dBA, where pain is produced in most listeners and permanent hearing loss would result.
3.16.1 APPLICABLE REGULATIONS, PLANS, AND POLICIES/MANAGEMENT GOALS
3.16.1.1 FEDERAL AGENCIES
Noise and land use guidelines have been produced by a number of federal agencies, including the Federal Highway Administration, EPA, Department of Housing and Urban Development, and American National Standards Institute. These guidelines are all based upon statistical noise criteria, such as equivalent continuous sound level (Leq), day-night average sound level (Ldn), or Community Noise Equivalent Level (CNEL). The EPA identified outdoor and indoor noise levels to protect public health and assets. An Leq(24) of 70 dB (24-hour average) was identified as a level of environmental noise that would not lead to measurable hearing loss over a lifetime. An Ldn of 55 dBA outdoors and 45 dBA indoors were identified as noise levels that would not result in activity interference or annoyance (EPA 1974).
3.16.1.2 CALIFORNIA DESERT CONSERVATION AREA PLAN
The CDCA Plan contains provisions for public land-use management in the California Desert District under the BLM’s jurisdiction. Since its first date of publication in 1980, the CDCA Plan has been amended in order to incorporate public concerns and congressional mandates in regard to the use of desert resources, such as the provisions of the California Desert Protection Act of 1994.
In particular, noise-related guidelines established in the CDCA Plan include long-term monitoring of effects of vehicle noise on wildlife (Chapter 3, Wildlife Element) and implementation of land use compatibility standards within limited (vehicle use) areas in order to minimize conflicts between off-road vehicle use and other existing or proposed recreational uses of the same or neighboring public lands (Chapter 3, Motorized Vehicle Access). The CDCA Plan also identifies energy and utility corridors within the California Desert District, which are part of the effect analysis framework, particularly in terms of alternatives analysis and cumulative effects.

Affected Environment
Page 3-94 Ocotillo Sol Project Draft EIS/Draft CDCA Plan Amendment
April 2012
3.16.1.3 CALIFORNIA NOISE CONTROL ACT
The California Health and Safety Code finds that excessive noise is a serious hazard to the public health and welfare and that exposure to certain levels of noise can result in physiological, psychological, and economic damage. It also finds that there is a continuous and increasing bombardment of noise in the urban, suburban, and rural areas. The California Noise Control Act declares that the state of California has a responsibility to protect the health and welfare of its citizens by the control, prevention, and abatement of noise. It is the policy of the state of California to provide an environment for all Californians free from noise that jeopardizes their health or welfare.
3.16.1.4 IMPERIAL COUNTY
The Noise Element of the Imperial County General Plan (1993) provides information to be used in setting land use policies to protect noise sensitive land uses and for developing and enforcing a local noise ordinance. The Noise Element of the Imperial County General Plan provides a program for incorporating noise issues into the land use planning process, with a goal of minimizing adverse noise impacts to receptors that are sensitive to noise.
3.16.1.4.1 Operational Noise The Noise Element of the Imperial County’s General Plan states:
The increase of noise levels generally results in an adverse impact to the noise environment. The Noise/Land Use Compatibility Guidelines are not intended to allow the increase of ambient noise levels up to the maximum without consideration of feasible noise reduction measures. The following guidelines are established by the County of Imperial for the evaluation of significant noise impact:
a. If the future noise level after the project is completed will be within the "normally acceptable" noise levels shown in the Noise/Land Use Compatibility Guidelines, but will result in an increase of 5 dB CNEL or greater, the project will have a potentially significant noise impact and mitigation measures must be considered.
b. If the future noise level after the project is completed will be greater than the "normally acceptable" noise levels shown in the Noise/Land Use Compatibility Guidelines, a noise increase of 3 dB CNEL or greater shall be considered a potentially significant noise impact and mitigation measures must be considered. (1993)
3.16.1.4.2 Construction Noise The Noise Element of the County’s General Plan states:
Construction noise, from a single piece of equipment or a combination of equipment, shall not exceed 75 dB Leq, when averaged over an eight (8) hour period, and measured at the nearest sensitive receptor. This standard assumes a construction period, relative to an individual sensitive receptor of days or weeks. In cases of extended length construction times, the standard may be tightened so as not to exceed 75 dB Leq when averaged over a one (1) hour period.

Affected Environment
Ocotillo Sol Project Page 3-95 Draft EIS/Draft CDCA Plan Amendment April 2012
Construction equipment operation shall be limited to the hours of 7 A.M. to 7 P.M., Monday through Friday, and 9 A.M. to 5 P.M. Saturday. No commercial construction operations are permitted on Sunday or holidays.
3.16.2 NOISE AND VIBRATION IN THE OCOTILLO SOL PROJECT AREA
The Ocotillo Sol Project area is in a relatively remote desert region of the southeastern portion of the state, and lies within the Yuha Basin. The city of El Centro lies to the east, and Mexico lies to the south.
Ambient noise level measurements for the Ocotillo Sol Project area were taken by RECON Environmental, Inc. on September 14, 2011, using one Larson–Davis Model 820 Type 2 Integrating Sound Level Meters, serial number 1824.
The following parameters were used:
Filter: A-weighted Response: Fast Time History Period: 5 seconds
The meter was calibrated before the day’s measurements. Four ground-floor measurements (5 feet above the ground) were taken for 30 minutes each.
Noise measurements were taken between the hours of 10:00 A.M. and 2:00 P.M. to obtain existing ambient noise levels. Four measurements were made on and around the Ocotillo Sol Project area as described below. The primary source of on-site noise was due to traffic on the access roads and operational noise from the Imperial Valley Substation. The locations of the measurements are shown on Figure 3.16-1 (see Appendix A), and the noise measurement results are summarized below.
Measurement 1 was taken in the northwestern portion of the Ocotillo Sol Project area near the main access road. The dominant noise source was traffic on the access road. Measurement 2 was taken in the northern portion of the Ocotillo Sol Project area near the access road along the southern portion of the Imperial Valley Substation. The dominant noise source was operational noise from the Imperial Valley Substation. Measurement 3 was taken southeast of the project boundary near an access road and transmission towers. Measurement 4 was taken southwest of the project boundary near the main access road. During the 30-minute measurement period of Measurements 1 and 4, traffic on the access road was counted (Table 3.16-1). During the measurement period, the average noise levels were 49.4, 55.3, and 35.8, and 48.6 dBA Leq at Measurement Locations 1, 2, 3, and 4, respectively.

Affected Environment
Page 3-96 Ocotillo Sol Project Draft EIS/Draft CDCA Plan Amendment
April 2012
TABLE 3.16-1 30-MINUTE TRAFFIC COUNTS ON MAIN ACCESS ROAD ADJACENT TO THE OCOTILLO
SOL PROJECT AREA
Measurement Cars Motorcycles Buses Medium Trucks Heavy Trucks 1 3 0 0 2 1 4 2 0 0 2 0
Ambient noise levels in the Ocotillo Sol Project area and vicinity generally are low and typical of remote desert areas.
3.16.2.1 SENSITIVE RECEPTORS
Sensitive noise receptors are, in general, those areas of human habitation or substantial use where the intrusion of noise has the potential to adversely impact the occupancy, use, or enjoyment of the environment. These can include residences, schools, hospitals, parks, and places of business requiring low levels of noise. The Ocotillo Sol Project area is situated in a very remote area and there are no typical sensitive human receptors onsite or in the vicinity. The nearest residences to the Ocotillo Sol Project area occur approximately 1 mile to the north, 1.75 miles to the east, and over 2 miles to the southeast.
Sensitive receptors may also be non-human species. For example, some raptor and riparian bird species are sensitive to excessive noise.

Affected Environment
Ocotillo Sol Project Page 3-97 Draft EIS/Draft CDCA Plan Amendment April 2012
3.17 PUBLIC HEALTH AND SAFETY
3.17.1 APPLICABLE REGULATIONS, PLANS, AND POLICIES/MANAGEMENT GOALS
3.17.1.1 CLEAN WATER ACT
The CWA (33 USC §1251 et seq.) is the principal federal statute protecting navigable Waters of the U.S. and adjoining shorelines from the discharge of pollution from point sources. Since its enactment, the CWA has formed the foundation for the regulations and permitting of pollution prevention and response measures in waters subject to federal jurisdiction. The CWA establishes basic structure for regulating discharges of pollutants into the waters of the U.S., establishes pollution control programs such as setting wastewater standards for industry, and sets water quality standards for all contaminants in surface waters.
3.17.1.2 TOXIC SUBSTANCES CONTROL ACT
The Toxic Substances Control Act of 1976 (15 USC §2601 et seq.) provides EPA with authority to require reporting, record-keeping and testing requirements, and restrictions relating to chemical substances and mixtures. Toxic Substances Control Act addresses the production, importation, use, and disposal of specific chemicals including polychlorinated biphenyls (PCBs), asbestos, radon, and lead-based paint.
3.17.1.3 HAZARDOUS MATERIALS TRANSPORTATION ACT
The U.S. Department of Transportation has regulatory authority for the safe transportation of hazardous materials under the Hazardous Materials Transportation Act, as amended and codified in 49 USC 5101 et seq. Vehicles transporting hazardous materials must comply with strict containment, safety, labeling and manifesting requirements.
3.17.1.4 RESOURCE CONSERVATION AND RECOVERY ACT
The Resource Conservation and Recovery Act (RCRA) of 1976 (42 USC § 6901 et seq.) establishes a program administered by the EPA for the regulation of the generation, transportation, treatment, storage and disposal of hazardous waste. RCRA was amended in 1984 by the Hazardous and Solid Waste Act, which affirmed and extended the “cradle to grave” system of regulating hazardous waste. The use of certain techniques for the disposal of some hazardous wastes was specifically prohibited by the Hazardous and Solid Waste Act. RCRA regulates hazardous waste from the time that the waste is generated, through to its management, storage, transport, and treatment until its final disposal. In California, the EPA has authorized the Department of Toxic Substance Control to administer the RCRA program, pursuant to the state’s Hazardous Waste Control Law.
Affected Environment
Page 3-98 Ocotillo Sol Project Draft EIS/Draft CDCA Plan Amendment
April 2012
3.17.1.5 COMPREHENSIVE ENVIRONMENTAL RESPONSE, COMPENSATION, AND LIABILITY ACT (SUPERFUND)
The Comprehensive Environmental Response, Compensation and Liability Act (CERCLA) 1980 (42 USC § 9601 et seq.) provides a federal Superfund to clean up uncontrolled or abandoned hazardous waste sites as well as accidents, spills and other emergency releases of pollutants and contaminants into the environment. The EPA generally administers CERCLA. This law provides broad federal authority to respond directly to releases or threatened releases of hazardous substances that may endangered public health or the environment.
3.17.1.6 THE SUPERFUND AMENDMENTS AND REAUTHORIZATION ACT OF 1986
The Superfund Amendments and Reauthorization Act (Title III 40 CFR§ 68.110 et seq.) amended CERCLA and established a nationwide emergency planning and response program, and imposed reporting requirements for businesses that store, handle or produce significant quantities of extremely hazardous materials. Administered by the EPA, the act requires states to implement a comprehensive system to inform local agencies and the public when a significant quantity of such materials is stored or handled at a facility. Additionally, the Superfund Amendments and Reauthorization Act identifies requirements for planning, reporting, and notification concerning hazardous materials.
3.17.1.7 ENVIRONMENTAL PLANNING AND COMMUNITY RIGHT-TO-KNOW ACT
The Superfund Amendments and Reauthorization Act of 1986 also created Environmental Planning and Community Right-to-Know Act (40 CFR Parts 350-372), a statute designed to improve community access to information about chemical hazards and to facilitate the development of chemical emergency response plans by state/tribe and local governments. The Community Right-to-Know Act required the establishment of state/tribe emergency response commissions, responsible for coordinating certain emergency response activities and for appointing local emergency planning committees.
3.17.1.8 IMPERIAL COUNTY–MEXICALI EMERGENCY RESPONSE PLAN
The EPA’s U.S.–Mexico Environmental Program (Border 2012) is collaboration between the U.S. and Mexico to improve the environment and protect the health of people living along the border. The bi-national program focuses on cleaning the air, providing safe drinking water, reducing the risk of exposure to hazardous waste, and ensuring emergency preparedness along the U.S.–Mexico border. According to the EPA, rapid economic and population growth along the U.S.–Mexico border has increased the potential for hazardous waste releases and emergencies. The ability to plan and prepare bi-nationally improves the probability of adequately responding to incidents and protecting the environment and public from exposure to harmful contaminants and possible serious environmental or health impacts.

Affected Environment
Ocotillo Sol Project Page 3-99 Draft EIS/Draft CDCA Plan Amendment April 2012
The Imperial County–Mexicali Emergency Response Plan is intended to streamline emergency response, notification, and communication efforts. The plan also guarantees cooperation among all levels of emergency response personnel. Along with reducing risks associated with hazardous materials, the plan calls for necessary training, a crucial element in emergency response (EPA 2005).
3.17.1.9 CALIFORNIA DEPARTMENT OF TOXIC SUBSTANCES CONTROL
The California Department of Toxic Substances Control, part of the California Environmental Protection Agency, regulates the generation, handling, treatment, and disposal of hazardous waste in California. The California Department of Toxic Substances Control also cleans up thousands of hazardous waste sites in California including disposal sites and industrial sites that resulted in contamination of soil and groundwater.
3.17.1.10 CALIFORNIA EMERGENCY MANAGEMENT AGENCY
The California Emergency Management Agency was formed in January 1, 2009 as a result of a merger between the Governor’s Office of Emergency Services and the Office of Homeland Security. The Hazardous Materials Unit of the California Emergency Management Agency is responsible for hazardous materials emergency planning and response, spill release notifications, and enforcement of the Unified Program. The Office of Emergency Services provides emergency response services in support of local jurisdictions.
3.17.1.11 SAFE DRINKING WATER AND TOXIC ENFORCEMENT ACT OF 1986
The Safe Drinking Water and Toxic Enforcement Act of 1986 (Proposition 65), was enacted as a ballot initiative in November 1986. The proposition was intended by its authors to protect California citizens and the state’s drinking water sources from chemicals known to cause cancer, birth defects, or other reproductive harm, and to inform citizens about exposures to such chemicals. The act requires the Governor to publish, at least annually, a list of chemicals known to the state to cause cancer or reproductive toxicity.
3.17.1.12 CALIFORNIA HEALTH AND SAFETY CODE SECTION 25501
California law defines a hazardous material as any material that, because of its quantity, concentration, or physical, chemical, or infectious characteristics, may pose a present or potential hazard to human health and safety or to the environment if released in the workplace or the environment.
3.17.1.13 TOXIC RELEASE CONTINGENCY PLAN
The Toxic Release Contingency Plan (California Government Code Section 8574.16) requires that regional and local planning agencies incorporate within their planning the state’s effort to respond to emergency toxic releases, and ensure the effective and efficient use of regional and
Affected Environment
Page 3-100 Ocotillo Sol Project Draft EIS/Draft CDCA Plan Amendment
April 2012
local resources in the areas of traffic and crowd control, firefighting, hazardous materials response and cleanup, radio and communications control, and provision of medical emergency services.
3.17.1.14 IMPERIAL COUNTY GENERAL PLAN
Imperial County General Plan provides a regulatory framework to address potential environmental impacts that may result from a proposed project within Imperial County. Fire protection is provided to the County of Imperial by the Imperial County Fire Department. Imperial County Environmental Services participates within the Imperial County Hazardous Emergency Assistance Team in providing health and safety expertise in containment and cleanup of accidental spills or releases of hazardous material within Imperial County.
Sections within the Imperial County General Plan that are applicable include Seismic and Public Safety, Land Use and Water Elements. Pursuant to Section 25500 et seq. of the California Health and Safety Code, the County Health Services Department is designated as the "administering agency" responsible for maintaining a list of handlers/vendors of toxic materials within the County (Imperial County 1997).
3.17.2 EXISTING CONDITIONS
A Phase I Environmental Site Assessment of the 351-acre original study area was conducted in 2010 (Ninyo and Moore 2010). The following is a summary of the findings for the 351-acre original study area:
The study area consisted of 351 acres of vacant, undeveloped desert land. The study area surrounds the existing Imperial Valley Substation on its eastern, southern, and southwestern sides. There are no structures currently or historically present in the study area, based on historical aerial photographs and maps reviewed for the assessment.
The study area was not listed on regulatory databases reviewed. Facilities of potential environmental concern were not listed on environmental databases within the American Society for Testing and Materials specified search distances. Review of online environmental regulatory databases indicated the presence of the former Camp Seeley Ordnance Desert Proving Ground, approximately 1 mile to the south of the study area. The proving ground consisted of 1,040 acres acquired by the Army from the Department of Interior in 1944 for use as a dust proving ground by the Desert Test Command headquartered at Camp Seeley, which was approximately 8 miles north of the proving ground. The proving ground allowed the Army to test transport and combat vehicles under dusty conditions. Such tests reportedly did not involve the use of ordnance or explosive materials. The property was retransferred to the DOI in April 1946 and has been administered by the BLM as a desert recreational area. The U.S. Navy used part of the proving ground property as a parachute drop testing area from 1954 to 1959.
According to the San Diego Gas & Electric representative interviewed for the assessment, a spill of mineral oil/transformer oil reportedly occurred at the substation adjacent to the study area between 2002 and 2003, and was reportedly cleaned up (i.e., all visible signs were excavated and removed). Soil sampling was conducted during and after the spill cleanup, but no laboratory analytical reports were found in San Diego Gas & Electric files. Regulatory agencies were
Affected Environment
Ocotillo Sol Project Page 3-101 Draft EIS/Draft CDCA Plan Amendment April 2012
notified of the spill, including the National Response Center, RWQCB, and the Imperial County Environmental Services were notified but the regulatory agencies were not involved with the spill beyond the initial notification.
3.17.2.1 TYPES OF HAZARDOUS MATERIALS
Hazardous materials past and present on site include transformer oil and mineral oil. Transformer oil and mineral oil are known to contain PCBs, which are considered hazardous to human health. According to the San Diego Gas & Electric representative, the substation on-site was commissioned in 1983; therefore, PCBs were not present in the mineral oil. Soil sampling was conducted during and after the spill cleanup (Ninyo and Moore 2010). CdTe is present from photovoltaic solar panels used within the energy project. CdTe is considered toxic if ingested or inhaled via dust particles.
3.17.2.2 TRANSPORT OF HAZARDOUS MATERIALS
Potential land use hazards may exist with the transport of potentially hazardous cargo on major highways; specifically Interstate 8 to the north and State Highway 98 to the south. Types of hazardous cargo that may be transported by freeway include flammable liquids, corrosive materials, compressed and/or poisonous gases, explosives, and flammable solids (Imperial County 1997). Some potential exists for a highway mishap that could cause hazardous cargo to spill, contaminating surrounding areas. If flammable liquids were to ignite, they could quickly spread fire and poisonous fumes that could impact human health and/or cause property damage. Provisions to address highway accidents have been formulated within the County of Imperial General Plan.
3.17.2.3 LANDFILLS
Three different types of landfills (Class I, Class II, Class III) exist within Imperial County. Class I landfill sites are designated solely for the disposal of hazardous wastes. Class II landfill sites are designated for disposal of special waste. Class III landfill sites are designated for disposal of non-hazardous/municipal waste. The nearest landfill to the Ocotillo Sol Project area is the Mesquite Regional Landfill (Class III) approximately 10.4 miles to the northwest.
3.17.2.4 METEOROLOGICAL CONDITIONS
Meteorological conditions, including wind speed, wind direction, and air temperature, affect both the extent to which accidentally released hazardous materials would be dispersed into the air and the direction in which they would be transported. These conditions affect the potential magnitude and extent of public exposure to such materials, as well as their health risks. When wind speeds are low and the atmosphere is stable, dispersion is significantly reduced and can lead to increased localized public exposure (Imperial County 1997).

Affected Environment
Page 3-102 Ocotillo Sol Project Draft EIS/Draft CDCA Plan Amendment
April 2012
3.18 SOCIOECONOMICS
This section identifies the existing conditions (a baseline) for the socioeconomic characteristics of the Ocotillo Sol Project in terms of the regional economy of Imperial County and the local socioeconomic impact area as defined below.
3.18.1 APPLICABLE REGULATIONS, PLANS, AND POLICIES/MANAGEMENT GOALS
By statute, regulation, and EO the BLM must use social science in the preparation of informed, sustainable land use planning decisions. Section 202(c)(2) of FLPMA requires BLM to integrate physical, biological, economic, and other sciences in developing land-use plans (43 USC 1712(c)(2)). FLPMA regulations 43 CFR 1610.43 and 1610.46 also require BLM to analyze social, economic, and institutional information. Section 102(2)(A) of NEPA requires federal agencies to “ensure the integrated use of the natural and social sciences in planning and decision making” (42 USC 4332(2)(A)).
3.18.2 DEMOGRAPHIC AND SOCIOECONOMIC CHARACTERISTICS
The Ocotillo Sol Project area is relatively isolated, undeveloped desert land and is not closely associated with residential neighborhoods or commercial activities. The Ocotillo Sol Project would be located entirely on BLM-managed land and would not directly impact any private land. Public access to the site is limited, there are no improved roads in the vicinity, and it is in an area of Imperial County that is not generally known or frequented by the general public. For the purposes of the socioeconomic analysis, the Local Socioeconomic Impact Area (LSIA) was defined as the 18 Census Tracts encompassing a radius of approximately 15 miles and including the major local cities of El Centro and Calexico, as well as Heber and the city of Imperial. This LSIA was chosen due to proximity and the likelihood of providing commercial and public services for the construction activities and the post-construction operation of the Ocotillo Sol Project area.
This section describes and compares the demographic and socioeconomic characteristics of the residents of the LSIA and the regional socioeconomic impact area as defined as Imperial County. Data for the LSIA were aggregated from 18 Census Tracts (i.e., Census Tracts 110, 111, 112.01, 112.02, 113, 114, 115, 116, 117, 118.01, 118.02, 118.03, 119, 120.01, 120.02, 121, 122, and 123.01).
The demographic data presented in the following Table 3.18-1 were derived from the U.S. Bureau of the Census, 2000 U.S. Census (2012a), 2010 U.S. Census (2012b), and the 2010 U.S. Census American Community Survey (2012b). The Southern California Association of Governments (SCAG) provided a 2030 forecast of population for Imperial County (2011).

Affected Environment
Ocotillo Sol Project Page 3-103 Draft EIS/Draft CDCA Plan Amendment April 2012
TABLE 3.18-1 DEMOGRAPHIC PROFILES FOR THE LOCAL SOCIOECONOMIC IMPACT
AREA AND IMPERIAL COUNTY, CALIFORNIA
Characteristic LSIA Imperial County Total Population 2000 (U.S. Census) 95,272 142,361 2010 (U.S. Census) 119,075 174,528 2030 (SCAG) N/A 312,316 Population percent change (2000-2010) 25.0% 22.6% Population percent change (2010-2030) N/A 78.9% Gender1 100.0% 100.0% Male 50.6% 51.4% Female 49.4% 48.6% Age Distribution and Median Age1 100.0% 100.0% Under 5 years 7.6% 7.8% 5 to 19 3.7% 9.9% 20 to 34 21.5% 21.5% 35 to 54 26.4% 26.0% 55 to 64 9.3% 9.5% 65 years or older 9.9% 10.4% Median Age in Years1 31.7 31.9 Household Income and Poverty Level Median Household Income (1999)2 $31,394 $31,870 Median Household Income (2010)1 N/A $41,802 Families Below Poverty (1999)2 21.4% 19.4% Families Below Poverty (2010)1 N/A 19.6% College Graduate (Population 25+years)2 11.9% 10.3% Race and Ethnicity1 100.0% 100.0% Non-Hispanic 15.7% 19.6% American Indian and Alaska Native 0.2% 0.9% Asian and Pacific Islander 1.4% 1.3% Black or African American 2.4% 2.9% White 11.1% 13.7% Other or Multiple Race 0.6% 0.7% Hispanic1 84.3% 80.4% Language Spoken at Home2 100.0% 100.0% English Only 23.5% 32.2% Spanish 73.9% 65.3% Other Language 0.0% 2.5% Total Housing Units1 36,206 56,067 Occupied Housing Units2 32,820 49,126 Owner Occupied (%) 56.2% 55.9% Renter Occupied (%) 43.8% 44.1% Persons Per Dwelling Unit2 3.4 3.3 Employment and Unemployment Rate2 122 44,092 Employment (2000)2 31,712 44,092 Employment (2010)1 N/A 56,573 Unemployed (%)2 N/A 12.6% Unemployed (%)1 N/A 20.5%

Affected Environment
Page 3-104 Ocotillo Sol Project Draft EIS/Draft CDCA Plan Amendment April 2012
TABLE 3.18-1 DEMOGRAPHIC PROFILES FOR THE LOCAL SOCIOECONOMIC IMPACT
AREA AND IMPERIAL COUNTY, CALIFORNIA
Characteristic LSIA Imperial County Occupation1,2 100.0% 100.0% Management, professional, and related occupations 24.5% 22.6% Service occupations 22.1% 22.9% Sales and office occupations 28.3% 26.5% Natural Resource, construction, extraction, and maintenance 12.7% 13.3% Production, transportation, and materials moving occupations
12.4% 14.7%
1 U.S. Bureau of the Census 2012c 2 U.S. Bureau of the Census 2012a 3 SCAG 2011
3.18.2.1 POPULATION
There were 119,075 residents in the LSIA in 2010, representing about 68 percent of the 174,528 residents in Imperial County. Over the last decade (2000 to 2010), the population of the LSIA has increased 25 percent and the population of Imperial County has increased 22.6 percent. The 2030 population forecast by SCAG expects the population of Imperial County to increase by about 80 percent to 312,000 residents.
3.18.2.2 GENDER AND AGE
The male-to-female gender ratio for the LSIA was about 51 percent male to 49 percent female. In contrast, the U.S. population is about 49 percent male and 51 percent female. The percentage of males is higher as well in Imperial County (51 percent male v. 49 percent female). The median age of residents of the LSIA was 31.7 years in 2010, which is about equal to the median age of 31.9 years for Imperial County residents and significantly lower than the median age of 37.2 years for the U.S. population.
3.18.2.3 HOUSEHOLD INCOME AND POVERTY
The median household income for the LSIA was $31,394 in 1999 (U.S Census Bureau 2012a) and was very close to the median income of $31,870 reported for Imperial County. The median household income of residents in Imperial County rose about 31 percent to $41,802 by 2010, but was still substantially below the median U.S. household income of $50,046. The percentage of families below the poverty level in Imperial County was estimated at 19.6 percent in 2010 based on the U.S. Census American Community Survey (2012c) and was substantially higher than the 11.3 percent of families below the poverty level in the United States. No household income data are currently available for the LSIA.

Affected Environment
Ocotillo Sol Project Page 3-105 Draft EIS/Draft CDCA Plan Amendment April 2012
3.18.2.4 EDUCATION LEVEL
The proportion of the population 25 years or older with a bachelor’s degree or higher was 11.9 percent in the LSIA and 10.3 percent for Imperial County. This level of educational attainment was substantially lower than the 28.2 percent reported for the U.S. population.
3.18.2.5 RACE, ETHNICITY, AND LANGUAGE SPOKEN AT HOME
A notable characteristic of the LSIA and Imperial County residents was the large Hispanic population. The proportion of the population reporting a Hispanic ethnicity was 84 percent in the LSIA and 80 percent for Imperial County. In contrast, 16 percent of the U.S. population was recorded as Hispanic. Both the LSIA and Imperial County reported a very small proportion of residents who were Non-Hispanic and Asian, Black/African American, or American Indian. The residents of the LSIA and the county reported that Spanish language was predominately spoken in the home.
3.18.2.6 HOUSING, OWNERSHIP, AND HOUSEHOLD SIZE
There were 36,206 housing units in the LSIA, which represented about 65 percent of the 56,067 housing units in Imperial County. There were 32,820 occupied housing units or about 9 percent of the units were vacant in the LSIA. Imperial County reported a housing vacancy rate of about 12 percent. These are relatively high levels of vacant housing in the LSIA and Imperial County, but it is also equivalent to the U.S. housing vacancy rate of 11 percent. The proportion of owner-occupied (56 percent) and renter occupied housing (44 percent) in the LSIA and Imperial County were very similar. About 65 percent of the housing units are owner-occupied in the United States. A relatively large average household size was reported for the LSIA with 3.4 people and Imperial County with 3.3 people. In contrast, the average household size for the U.S. was substantially smaller at 2.6 people.
3.18.2.7 EMPLOYMENT AND UNEMPLOYMENT
Total non-farm employment for residents of the LSIA was 31,712 as reported in the 2000 U.S. Census (U.S Census Bureau 2012a). This represented about 72 percent of the 44,092 total employed residents in Imperial County. Employment of residents within Imperial County rose 28 percent to 56,573 in 2010. Even with this growth in jobs, the unemployment rate has skyrocketed to 20.6 percent in 2010 from a relatively low 6.2 percent unemployment rate reported in the 2000 Census. For December 2011, an unemployment rate of 26.8 percent was reported for Imperial County by the California Economic Development Department.1 The U.S. Department of Labor reported a nationwide unemployment rate of 8.5 percent for December 2011.
1 Please note that the labor force and employment of U.S. residents as reported by the U.S. Census is not strictly comparable with the measurement of covered employment (covered by state unemployment insurance) and the unemployment rate as reported monthly by the California Employment Development Department. The annual average unemployment rate reported by California Economic Development Department for Imperial County was 17.4 percent in 2000 compared to 6.2 percent as reported by the 2000 U.S. Census (U.S Census Bureau 2012a).

Affected Environment
Page 3-106 Ocotillo Sol Project Draft EIS/Draft CDCA Plan Amendment April 2012
3.18.2.8 OCCUPATION
About 28 percent of the residents of the LSIA who were in the labor force reported occupations in sales and office work and about one-quarter reported management or professional occupations. About 22 percent reported working in a service occupation, while about 13 percent were in natural resource, mining, or construction occupations. The remaining 12 percent of the labor force reported occupations in manufacturing, transportation, and materials. Very similar proportions of occupations were reported for the resident workforce of Imperial County.
3.18.2.9 SUMMARY OF DEMOGRAPHIC CHARACTERISTICS
In general, the residents of the LSIA and Imperial County are primarily Hispanic and the median age is much younger than the general population of the United States. Educational attainment levels are below average, income is below average, and the poverty rate among families is substantially higher than the national average. The unemployment rate among residents of Imperial County is nearly three times the national average.
3.18.3 REGIONAL ECONOMIC CONDITIONS
To produce estimates of employment and the value of regional product, CIC developed an input-output model for the regional economy. The regional economy was defined as Imperial County. The regional input-output model was based on software and data provided by Impact Analysis for Planning (IMPLAN).2 The value of using the IMPLAN system was to provide a basis for measuring the size of key economic sectors of the regional economy in terms of output, income, and employment. In addition to providing measurements of existing economic conditions for the region, the input-output system also provided the ability to model the expected impact of exogenous changes in the regional economy based on the proposed project alternatives.
The economic impacts (direct, indirect, and induced) were determined for each of the proposed project alternatives for Imperial County and are presented in Chapter 4. The economic impact definitions listed below explain the terms that will be used in the following paragraphs and the economic impact tables:
Output is a measure of the sales generated within the regional economy. The total output (cumulative impact) has three sub-components: the direct sales impact, the indirect sales impact, and the induced sales impact.
1. Direct sales impacts would occur when the Ocotillo Sol Project construction contractor(s) are hired to construct and/or install the photovoltaic equipment and supporting structures, facilities, access, and transmission systems as required by the Project design.
2 IMPLAN was based on software originally developed by the U.S. Forest Service in cooperation with FEMA and the BLM to assist the U.S. Forest Service in land and resource management planning.

Affected Environment
Ocotillo Sol Project Page 3-107 Draft EIS/Draft CDCA Plan Amendment April 2012
2. Indirect sales impacts would occur when the construction contractor(s) make purchases of supplies, materials, and services from other businesses in Imperial County (e.g. construction materials, fuel, equipment, equipment repairs, parts, utilities, insurance, legal, and accounting). In turn, each of the indirect businesses would also make purchases from their suppliers.
3. Induced sales are generated by the purchases of employees and owners of the businesses with direct, indirect, and induced sales. The employees and owners spend their incomes from the compensation for labor and ownership that were required to produce the direct output, as well as all indirect and induced output required by the direct sales impacts.
Employment is a measure of the amount of full and part-time annual average employment, including self-employed proprietors, within the regional economy.
Value-added is a measure of the amount of value created within the economy. In this study, value-added refers to the amount of value created within the Imperial County economy. There are four sub-components of value-added.
1. Employee compensation includes the wages and salaries of workers who are paid by employers, as well as the cost of benefits such as health and life insurance, retirement payments, and non-cash compensation.
2. Proprietary income consists of payments received by self-employed individuals as income from the private businesses they own. This includes income received by many private business owners such as farmers, lawn care service operators, or a dry-cleaning business, as well as doctors, attorneys, consultants, and other professionals that own their business.
3. Other property type income consists of payments for interest, rents, royalties, and dividends. Payments to individuals in the form of rents received on property, royalties from contracts, and dividends paid by corporations are included here as well as corporate profits earned by corporations.
4. Indirect business taxes consist of excise taxes, property taxes, fees, licenses, and sales taxes paid by businesses. These taxes occur during the normal operation of businesses, but do not include taxes on profit or income.
Imperial County generates about $4.6 billion in gross regional product as measured by value added (Table 3.18-2). The economy supports almost 70,000 jobs and generates $2.7 billion in employment income. The total value added per job is approximately $66,000.

Affected Environment
Page 3-108 Ocotillo Sol Project Draft EIS/Draft CDCA Plan Amendment April 2012
TABLE 3.18-2 IMPERIAL COUNTY TOTAL ECONOMIC VALUE ADDED BY MAJOR SECTOR DURING
2011
Major Category Value Added (millions) Number of Employees Agriculture, Forestry, Fishing, and Hunting 810.5 14,481 Retail Trade 384.1 7,884 Real Estate and Rental 345.1 940 Manufacturing 218.5 2,566 Health and Social Services 192.0 4,217 Wholesale Trade 186.6 2,060 Transportation and Warehousing 153.6 2,432 Utilities 150.7 395 Other Services (not elsewhere listed) 107.7 4,013 Construction 105.8 1,465 Finance and Insurance 104.6 1,336 Accommodation and Food Services 94.5 3,379 Administrative and Waste Services 70.5 1,725 Professional, Scientific, and Technical Services 66.8 1,197 Information 46.7 369 Management of Companies 18.5 386 Educational Services 15.4 472 Arts, Entertainment, and Recreation 8.7 276 Mining 5.0 51 Government and non-NAICS* 1,518.4 17,923 Totals 4,603.7 69,467
*North American Industrial Classification System Source: IMPLAN 2011
The largest non-government sector in the county in terms of value added is agriculture. This sector added $810.5 million for the local economy while employing nearly 14,500 people. Retail trade was the next most important sector, contributing $384.1 million and employing about 7,900 people, followed by the real estate sector, which added $345.1 million while employing 940 people. Manufacturing generated about $218.5 million and nearly 2,600 jobs in the region. Health and social services contributed $192.0 million and employed more than 4,200 people (Figure 3.18-1).
The construction sector of the local economy generated about $106 million in regional product during 2011 with 1,465 jobs in the sector. As of 2011, the construction sector in Imperial County had declined by more than one-third from a peak of more than 2,200 jobs in 2006, representing a loss of more than 700 jobs for the industry. In contrast, the government sector is the largest employer in the region with 19,900 jobs and a value added of about $1.5 billion for the regional economy.


Affected Environment
Page 3-110 Ocotillo Sol Project Draft EIS/Draft CDCA Plan Amendment April 2012
3.18.4 TAXABLE RETAIL SALES
Taxable retail sales are one measure of the health of the economy. Historical retail sales data were compiled for the local socioeconomic impact area and for Imperial County for the period of 2000 through 2011 (forecast estimate). Total reported retail sales within Imperial County were about $1.4 billion in 2000. The LSIA local impact area which is largely represented by the cities of Calexico and El Centro, had retail sales of about $840 million in 2000. The LSIA represented about 60 percent of the retail sales in Imperial County. Retail sales peaked in the LSIA in 2006 and in the County in 2007. Retail sales volume declined dramatically in 2009 reflecting the collapse of the local construction industry and the national economic recession (Table 3.18-3).
Retail sales volume in 2010 began to recover for the LSIA and for Imperial County. Recovery has continued in 2011, but at a slower pace than 2010. As of the end of 2011, the retail sales volumes for the LSIA and for Imperial County are about equal to the 2005 retail sales volume (without adjustment for inflation). This is a strong indicator of the weakened local economy. It is likely that retail sales volumes will not recover to the prior peak levels until 2013 (or 2015 with adjustment for inflation).
TABLE 3.18-3 TAXABLE RETAIL SALES
Year LSIA Sales
($000s) LSIA Percent
Change Imperial County
Sales ($000s) Imperial County Percent Change
2000 840,698 N/A 1,403,560 N/A 2001 871,600 3.7% 1,381,668 -1.6% 2002 934,158 1.7% 1,462,537 5.9% 2003 970,427 3.9% 1,528,886 4.5% 2004 1,070,493 10.3% 1,689,539 10.5% 2005 1,246,395 16.4% 2,000,619 18.4% 2006 1,350,070 8.3% 2,148,730 7.4% 2007 1,342,109 -0.6% 2,253,133 4.9% 2008 1,268,457 -5.5% 2,179,276 -3.3% 2009 1,070,742 -15.6% 1,773,930 -18.6% 2010p 1,137,268 6.2% 1,930,036 8.8% 2011f 1,180,000 3.8% 2,007,000 4.0% Percent Change (2000–2011f)
40.4% 43.0%
p=preliminary estimate; f=forecast (CIC Research, Inc.) Source: California State Board of Equalization 2012
3.18.5 OVERNIGHT TRANSIENT ACCOMMODATIONS
The proposed Ocotillo Sol Project construction period would be 8 to 11 months with a peak onsite labor force of 250 workers. On average, 80 to 120 construction and supervisory personnel would be required onsite to construct the Ocotillo Sol Project. The construction workforce would consist of, but would not be limited to, surveyors, inspectors, linemen, laborers, operators, supervisors, health and safety personnel, and environmental monitors (San Diego Gas & Electric 2010). The construction workers required for the Ocotillo Sol Project would be hired predominately from the available labor pool in Imperial County. There are substantial

Affected Environment
Ocotillo Sol Project Page 3-111 Draft EIS/Draft CDCA Plan Amendment April 2012
construction labor resources available in Imperial County. It is likely that a portion of the labor would be drawn from outside Imperial County. This would be especially true of some specialized trades required by the project design.
Imperial County has 45 hotels and motels with a total room inventory of 2,741 rooms (CIC Research 2012a). Thirty-five of these lodging establishments are in El Centro and Calexico. Seasonal occupancy rates for the hotels and motels vary substantially with the higher occupancy period during the months of October through May. Holiday weekends and weekends at the start of bird/waterfowl hunting season also record peak room occupancy regardless of the time of year. Long-term stay construction workers would find transient housing resources available in Imperial County even during peak periods, because of their ability to commit to stays of longer than two or three nights.
In addition to the transient hotel rooms for the temporary construction workforce, there would be available rental housing resources as identified in Table 3.18-1 above. Currently there are 3,400 vacant housing units within the LSIA and there are nearly 7,000 vacant housing units within the County. Finally, there are housing resources available for campers and recreational vehicles within the LSIA, comprising 1,333 spaces in five RV parks (CIC Research 2012b).

Affected Environment
Page 3-112 Ocotillo Sol Project Draft EIS/Draft CDCA Plan Amendment April 2012
3.19 ENVIRONMENTAL JUSTICE
3.19.1 APPLICABLE REGULATIONS, PLANS, AND POLICIES/MANAGEMENT GOALS
On February 11, 1994, President Clinton issued an “Executive Order on Federal Actions to Address Environmental Justice in Minority Populations and Low-Income Populations” (EO 12898, 1994). This EO focuses federal attention on environmental and human health conditions in minority communities and low-income communities. The EO promotes non-discrimination in federal programs substantially affecting human health and the environment and provides for information access and public participation relating to such matters.
Environmental Justice involves the fair treatment and meaningful involvement of all people regardless of race, color, national origin, or income with respect to the development, implementation, and enforcement of environmental laws, regulations, and policies. Fair treatment means that no group of people, including racial, ethnic, or socioeconomic group should bear a disproportionate share of the negative environmental consequences resulting from industrial, municipal, and commercial operations or the execution of federal, state, local, and Tribal programs and policies.
3.19.1.1 BLM GUIDANCE FOR ENVIRONMENTAL JUSTICE
BLM’s Environmental Justice principles include the following:
1. The BLM will determine if its proposed actions will adversely and disproportionally impact minority populations, low-income communities, and Tribes (reference EO 12898, Environmental Justice) and consider aggregate, cumulative, and synergistic effects, including results of actions taken by other parties. While Environmental Justice analysis is specifically concerned with disproportionate effects on the three populations, the social and economic analysis produced in accord with NEPA considers all potential social and economic effects, positive and negative, on any distinct group.
2. The BLM will promote and provide opportunities for full involvement of minority populations, low-income communities, and Tribes in BLM decisions that affect their lives, livelihoods, and health.
3. The BLM will incorporate Environmental Justice considerations in land use planning alternatives to adequately respond to Environmental Justice issues and problems facing minority populations, low-income communities, and Tribes living near public lands, working with, and/or using public land resources.
4. Where disproportionately high adverse impacts are anticipated, the BLM will work with local community groups/associations, governments, and Tribal leaders to determine if land disposition and/or acquisition policies affect real estate values and real income of minority and low-income communities, and Tribes.
5. The BLM State and Field Offices will continue to make Environmental Justice a mandatory critical element for consideration in all land use planning and NEPA documents.

Affected Environment
Ocotillo Sol Project Page 3-113 Draft EIS/Draft CDCA Plan Amendment April 2012
The President’s Council on Environmental Quality has defined minority populations as including members of the following population groups: American Indian or Alaskan Native; Asian or Pacific Islander; Black/African-American; or Hispanic regardless of race. Further, the President’s Council on Environmental Quality has provided guidance that an Environmental Justice impact threshold would be met if the low-income or minority population represents more than 50 percent of the affected area’s population.
The President’s Council on Environmental Quality has defined “low-income populations” as populations with mean annual incomes below the annual statistical poverty level as annually published by the U.S. Department of Health and Human Services.
3.19.2 ENVIRONMENTAL SETTING FOR ENVIRONMENTAL JUSTICE
As previously identified in Table 3.18-1 (Section 3.18 Socioeconomics), the residents of the LSIA and Imperial County are predominately Hispanic, comprising nearly three-quarters of the population in the LSIA and about two-thirds of the population of Imperial County. When other minority populations (not also identified as Hispanic) are included, the cumulative total minority population of the LSIA (89 percent) and Imperial County (86 percent) are substantially above the threshold impact level as established by the President’s Council on Environmental Quality. Based on the demographic characteristics of the affected socioeconomic environment a population of concern has been identified for the Environmental Justice impact analysis. Whether the minority population of the affected environment would sustain disproportionately high and adverse environmental impacts is analyzed for each project alternative in Chapter 4–Environmental Consequences, of this environmental document.

Affected Environment
Page 3-114 Ocotillo Sol Project Draft EIS/Draft CDCA Plan Amendment April 2012
This page is intentionally blank.

Environmental Consequences
Ocotillo Sol Project Page 4-1 Draft EIS/Draft CDCA Plan Amendment April 2012
CHAPTER 4.0 ENVIRONMENTAL CONSEQUENCES
4.1 INTRODUCTION AND OVERVIEW
This chapter analyzes the environmental consequences or impacts that may be expected to occur due to implementation of the alternatives to the Ocotillo Sol Project and associated Plan Amendment that are described in Chapter 2. The scope of the impact analysis presented in this chapter is commensurate with the detail level of the actions considered in Chapter 2 and the availability and/or quality of the data necessary to assess impacts. Current conditions (existing environment) in the Ocotillo Sol Project area as described in Chapter 3 were used as a baseline for assessing the expected impacts of the Applicant’s proposed Ocotillo Sol Project and alternatives. Chapter 4 is organized by resource, parallel to their presentation in Chapter 3.
The analysis in this chapter considers direct, indirect, and cumulative impacts of the alternatives, including both short-term impacts during construction and decommissioning, and long-term impacts from operation and maintenance activities. This chapter also identifies mitigation measures to address adverse impacts and summarizes unavoidable adverse impacts.
4.1.1 METHODOLOGY
The assessment of environmental consequences in this chapter focuses on the general impacts that could due to implementation of each of the alternatives presented in Chapter 2. The methodology for this assessment conforms to the guidance found in the following section of the CEQ regulations for implementing NEPA: 40 CFR 1502.24 (Methodology and Scientific Accuracy); 40 CFR 1508.7 (Cumulative impact); 40 CFR 1508.8 (Effects); and the BLM NEPA Handbook (H-1790-1).
4.1.2 ANALYTICAL ASSUMPTIONS
The following impacts analysis was conducted with the following assumptions:
• The laws, regulations, and policies applicable to the BLM authorizing ROW grants for renewable energy development facilities would be applied consistently for all action alternatives.
• The proposed facility would be constructed, operated, maintained, and decommissioned as described in the action alternatives.
• Short-term impacts are those expected to occur during the construction phase, the first five years of the operation and maintenance phase, and during project decommissioning. Long-term impacts are those that would occur after the first five years of operation.

Environmental Consequences
Page 4-2 Ocotillo Sol Project Draft EIS/Draft CDCA Plan Amendment April 2012
4.1.3 TYPES OF EFFECTS
This chapter considers three types of potential impacts for each resource: direct, indirect, and cumulative effects. Effects and impacts as used in this document are synonymous and could be beneficial or adverse.
Direct effects are caused by the action and occur at the same time and place as the action. Indirect effects are caused by the action and occur later in time or further in distance, but are still reasonably foreseeable. Because it can be difficult to distinguish between direct and indirect effects, BLM policy does not require an EIS to differentiate between the two (BLM NEPA Handbook H-1790-1, Section 6.8.2). This chapter considers indirect and direct impacts together.
Section 1502.16 of the CEQ regulations forms the scientific and analytic basis for the comparisons of alternatives. Section 102(2)(C) of NEPA sets forth the elements that must be addressed in an EIS. The environmental consequences section consolidates that discussion. The discussion will include the environmental impacts of the alternatives, including any adverse environmental effects that cannot be avoided, the relationship between short-term uses of the human environment and the maintenance and enhancement of long-term productivity, and any irreversible or irretrievable commitments of resources which would be involved in the proposal should it be implemented.
4.1.4 CUMULATIVE IMPACTS
Cumulative impacts are those effects resulting from the incremental impacts of an action when combined with other past, present, and reasonably foreseeable future actions (regardless of which agency or person undertakes such actions; 40 CFR 1508.7). They can result from similar projects or actions, as well as projects or actions that have similar impacts. Additionally, they can occur as a result of individually insignificant but collectively significant actions taking place over the same period of time. For cumulative impact analysis, short-term impacts occur only for a short time after implementation of an action (e.g., noise impacts from construction activities would be considered short-term in nature). Long-term effects occur for an extended period after implementation of an action (e.g., removal of vegetation in desert environments can result in long-term impacts as regeneration is slow).
4.1.4.1 GEOGRAPHIC AND TEMPORAL SCALE
The intensity or severity of cumulative impacts considers the magnitude, geographic extent, duration, and frequency of effects (CEQ 1997). The magnitude of an effect reflects relative size or amount of an effect. Geographic extent considers how widespread the effect might be. Duration or frequency refers to whether the effect is a one-time event, intermittent, or chronic (CEQ 1997). This cumulative effects analysis is limited to those resources that would be directly impacted by the Applicant’s Ocotillo Sol Project or the alternatives.

Environmental Consequences
Ocotillo Sol Project Page 4-3 Draft EIS/Draft CDCA Plan Amendment April 2012
4.1.4.2 OTHER ONGOING/FORESEEABLE PROJECTS/ACTIVITIES AFFECTING RESOURCE
This EIS analyzes the cumulative impacts of the construction, operation and maintenance, and decommissioning of the Applicant’s proposed Ocotillo Sol Project and alternatives, taking into account the effects in common with other past, present, and reasonably foreseeable future actions. The cumulative impacts analysis highlights past actions that are closely related either in geographically or temporally (proximity in space or time) to the Ocotillo Sol Project; present actions that are ongoing at the same time this EIS was being prepared; and reasonably foreseeable future actions, including those for which there are existing decisions, funding, formal proposals, or which are highly probably, based on known opportunities of trends.
The geographic extent of the analysis considers how widespread the effect may be. The specific area of cumulative effect varies by resource. The geographic extent of analysis is based on the topography surrounding the Ocotillo Sol Project area and the natural boundaries of the resource affected, rather than jurisdictional boundaries. The geographic extent of cumulative effects often extends beyond the scope of the direct effects but not beyond the scope of the direct and indirect effects of the alternatives.
The cumulative scenario for the Ocotillo Sol Project EIS includes projects and actions identified in Table 4.1-1, which provides a listing of the foreseeable projects that could contribute to a cumulative impact on the environment. Projects listed include renewable energy projects located on BLM-administered lands and private lands, other BLM actions and activities, and projects identified by local governments, such as Imperial County. Table 4.1-1 presents the project name, location, type, status, total acres, and a brief description of each project, to the extent available. The majority of projects listed in Table 4.1-1 have been, are being, or would be required to undergo appropriate independent environmental review under NEPA or the California Environmental Quality Act (CEQA), as applicable. Figure 4.1-1 in Appendix A shows the location of each of the projects listed in Table 4.1-1 using a corresponding identification number.
The cumulative scenario for specific resources was compiled from information provided during public scoping, BLM staff input, BLM project lists near the Ocotillo Sol Project area, and information gathered from Imperial County agencies. Table 4.1-2 identifies each resource or BLM program, the cumulative analysis impact area (which is the geographic scope for each cumulative effects issue), elements to consider, BLM authorized actions, and other known actions or activities that are located or would occur within the cumulative impacts area. Additional analysis is included for each resource area within the sub-sections of this chapter.

Environmental Consequences
Page 4-4 Ocotillo Sol Project Draft EIS/Draft CDCA Plan Amendment April 2012
TABLE 4.1-1 CUMULATIVE PROJECTS LIST
# Project Name Location Project Type Status Acres Project Description
1 Geothermal Overlay
Imperial County 8 miles east of Brawley
Geothermal Environmental Impact Report initiation in progress
27,875 The project would create the East Brawley Geothermal Zone Overlay, which would be a contiguous area of private lands with the potential for geothermal resource development
2 Rancho Los Lagos Specific Plan
Adjacent to City of Brawley
Residential Draft Environmental Impact Report comment response in progress; Draft EIS October 2009
1,076 Up to 3,830 homes, golf course, and business park; multiple use
3 Brookfield 101 Ranch Specific Plan
Adjacent to City of Brawley to south
Residential Draft Environmental Impact Report is in progress
1,897 Up to 6,986, schools, mixed use commercial and parks
4 Keystone Solar Farm
South of Brawley Solar Environmental Impact Report under review
40 6.06 MW solar field
5 Desert Springs Oasis
City of El Centro Resort Draft Environmental Impact Report in progress
1,105 Luxury resort community
6 Alder 70 City of El Centro Residential Application in progress
75 Mixed residential community
7 Mosaic Specific Plan
South Imperial County
Residential Draft Environmental Impact Report September 2008; in progress
201.5 Up to 1,154 homes, commercial uses
9 Calexico Solar Farm II
West of Calexico Solar Energy In progress, service date estimate 2014
1,477 200 MW solar project (two phases of 100 MW each)

Environmental Consequences
Ocotillo Sol Project Page 4-5 Draft EIS/Draft CDCA Plan Amendment April 2012
TABLE 4.1-1 CUMULATIVE PROJECTS LIST
# Project Name Location Project Type Status Acres Project Description
8 Mount Signal Solar Farm
Imperial Valley south
Solar Energy Request For Proposals in process
1,375 Proposed 200 MW solar thermal generating station with a biomass generation component, associated 230 kV transmission line for the Imperial Irrigation District
10 Calexico Solar Farm I
West of Calexico Solar Energy Under construction 1,013 200 MW solar project on agricultural lands (two phases of 100 MW each)
11 Imperial Solar Energy Center South Solar Farm
Imperial Valley south
Solar Energy ROW granted 6/14/2011
946.6 200 MW solar facility; transmission line to Imperial Valley Substation; roadway widening for access
12 Centinela Solar Farm
Imperial Valley south
Solar Energy Decision Record 11/2011
2,067 175 MW solar facility (planned completion in 2014); associated transmission line
13 Acorn Greenworks Solar Farm
Imperial Valley southwest
Solar Energy Application in process 693 150 MW solar energy facility
14 Silverleaf Solar Farm
Imperial Valley southwest
Solar Energy Application in process 1,096 160 MW solar photovoltaic energy facility
15 Campo Verde Solar Farm
Imperial Valley southwest
Solar Energy Active Environmental Impact Report
2,266 226 MW solar energy facility
16 Imperial Valley Solar West Solar Farm
Imperial Valley southwest of Seeley
Solar Energy Decision Record 8/2011
1,130 250 MW solar energy facility and associated transmission line to Imperial Valley Substation
17 Sunrise Powerlink - Transmission
San Diego County to Imperial Valley Substation
Transmission Line
Under construction 282.3 150-mile transmission line from Imperial County (Imperial Valley Substation) to Sycamore Canyon near Poway

Environmental Consequences
Page 4-6 Ocotillo Sol Project Draft EIS/Draft CDCA Plan Amendment April 2012
TABLE 4.1-1 CUMULATIVE PROJECTS LIST
# Project Name Location Project Type Status Acres Project Description
18 Ocotillo Express Wind Farm
Imperial County West
Wind Final Environmental Impact Report and Final EIS 3/2012
1,167 About 465 MW wind energy project
BLM Actions Imperial Valley, within BLM-administered lands
Various Ongoing n/a Road maintenance, recreation designations
Other Actions Imperial Valley Various Ongoing n/a Imperial Valley Substation operation and maintenance, Imperial Valley Substation expansion for North Gila to Imperial Valley Substation #2 transmission line, Sunrise Powerlink, transmission and utility corridor maintenance, Interstate 8 and Highway 98, agricultural activities, Mosaic Specific Plan, recreational activity, North Gila to Imperial Valley Substation #2 transmission line, Dixieland Imperial Irrigation District transmission line and connection, sand and gravel mining, Imperial Irrigation District canal and drain maintenance

Environmental Consequences
Ocotillo Sol Project Page 4-7 Draft EIS/Draft CDCA Plan Amendment April 2012
TABLE 4.1-2 CUMULATIVE SCENARIO BY RESOURCE OR BLM PROGRAM
Resource or BLM Program
Cumulative Analysis Impact Area Elements to Consider BLM-authorized Actions; Other Known Actions or Activities
Air Quality An approximate 6-mile radius around the Ocotillo Sol Project area; a 1-mile radius for sensitive receptors
PM2.5, PM10, O3 BLM Actions: Road maintenance, recreation designations Renewable energy projects: • Calexico Solar Farm II • Mount Signal Solar Farm • Calexico Solar Farm I • Imperial Solar Energy Center South Solar Farm • Centinela Solar Farm • Acorn Greenworks Solar Farm • Campo Verde Solar Farm (and shared transmission line
with Acorn Greenworks Solar Farm) • Imperial Valley Solar West Solar Farm • Solar Reserve Imperial Valley
Other Actions: Imperial Valley Substation operation and maintenance; Imperial Valley Substation expansion for North Gila to Imperial Valley Substation #2 transmission line; Sunrise Powerlink; transmission and utility corridor maintenance; Interstate 8, Highway 98; agricultural activities; recreational activity; North Gila to Imperial Valley Substation #2 transmission line; Dixieland Imperial Irrigation District transmission line and connection; sand and gravel mining; Imperial Irrigation District canal and drain maintenance
Global Climate Change / GHG
International, national, and regional
CO2 equivalent All projects listed in Table 4.1-1
Geology and Soil Resources
An approximate 1-mile radius around the Ocotillo Sol Project area
Erosion; surface disturbing activities
BLM Actions: Road maintenance, recreation designations
Other Actions: Sunrise Powerlink; Imperial Valley Substation; transmission and utility corridor maintenance; agricultural activities; recreational activity

Environmental Consequences
Page 4-8 Ocotillo Sol Project Draft EIS/Draft CDCA Plan Amendment April 2012
TABLE 4.1-2 CUMULATIVE SCENARIO BY RESOURCE OR BLM PROGRAM
Resource or BLM Program
Cumulative Analysis Impact Area Elements to Consider BLM-authorized Actions; Other Known Actions or Activities
Water Resources Groundwater basin Hydrology and quality basin balance, levels and quality
All projects listed in Table 4.1-1
Biological Resources
Yuha Desert Wildlife Management Area
Natural vegetation communities, special status plants; invasive species; flat-tailed horned lizard; burrowing owl; eagle; migratory birds
BLM Actions: Road maintenance, recreation designations Renewable energy projects (with gen-ties to the Imperial Valley Substation): • Mount Signal Solar Farm • Imperial Solar Energy Center South Solar Farm • Centinela Solar Farm • Silverleaf Solar Farm • Campo Verde Solar Farm (and shared transmission line
with Silverleaf Solar Farm) • Imperial Valley Solar West Solar Farm • Solar Reserve Imperial Valley
Other Actions: Imperial Valley Substation operation and maintenance; Imperial Valley Substation expansion for North Gila to Imperial Valley Substation #2 transmission line; Sunrise Powerlink; transmission and utility corridor maintenance; recreational activity; North Gila to Imperial Valley Substation #2 transmission line; Dixieland Imperial Irrigation District transmission line and connection; sand and gravel mining; Imperial Irrigation District canal and drain maintenance

Environmental Consequences
Ocotillo Sol Project Page 4-9 Draft EIS/Draft CDCA Plan Amendment April 2012
TABLE 4.1-2 CUMULATIVE SCENARIO BY RESOURCE OR BLM PROGRAM
Resource or BLM Program
Cumulative Analysis Impact Area Elements to Consider BLM-authorized Actions; Other Known Actions or Activities
Cultural Resources
Cultural sites, traditional use areas, and cultural landscapes within an approximate 2-mile radius of the Ocotillo Sol Project area
Cultural resources (prehistoric and historic); ethnographic resources; cultural character of sites and vicinity
BLM Actions: Road maintenance, recreation designations Renewable energy projects: • Calexico Solar Farm II • Mount Signal Solar Farm • Calexico Solar Farm I • Imperial Solar Energy Center South Solar Farm • Centinela Solar Farm • Acorn Greenworks Solar Farm • Silverleaf Solar Farm • Campo Verde Solar Farm (and shared transmission line
with Silverleaf Solar Farm) • Imperial Solar Energy Center West Solar Farm • Keystone Solar • Ocotillo Express Wind Farm • Solar Reserve Imperial Valley
Other Actions: Imperial Valley Substation operation and maintenance; Imperial Valley Substation expansion for North Gila to Imperial Valley Substation #2 transmission line; Sunrise Powerlink; transmission and utility corridor maintenance; Interstate 8, Highway 98; agricultural activities; recreational activity; North Gila to Imperial Valley Substation #2 transmission line; Dixieland Imperial Irrigation District transmission line and connection; Geothermal Overlay; Rancho Los Lagos; Brookfield Specific Plan; Desert Springs Oasis; Alder 70; Mosaic Specific Plan; sand and gravel mining; Imperial Irrigation District canal and drain maintenance

Environmental Consequences
Page 4-10 Ocotillo Sol Project Draft EIS/Draft CDCA Plan Amendment April 2012
TABLE 4.1-2 CUMULATIVE SCENARIO BY RESOURCE OR BLM PROGRAM
Resource or BLM Program
Cumulative Analysis Impact Area Elements to Consider BLM-authorized Actions; Other Known Actions or Activities
Paleontological Resources
An approximate 1-mile radius around the Ocotillo Sol Project area
Surface disturbing activities within the project area
BLM Actions: Road maintenance, recreation designations
Other Actions: Sunrise Powerlink; Imperial Valley Substation; transmission and utility corridor maintenance; agricultural activities; recreational activity
Fire/Fuels An approximate 2-mile radius around the Ocotillo Sol Project area
Mortality of plants and wildlife, loss of forage and cover; changes to vegetation communities; spread of invasive species; air quality
BLM Actions: Road maintenance, recreation designations Renewable energy projects: • Calexico Solar Farm II • Mount Signal Solar Farm • Calexico Solar Farm I • Imperial Solar Energy Center South Solar Farm • Centinela Solar Farm • Acorn Greenworks Solar Farm • Silverleaf Solar Farm • Campo Verde Solar Farm (and shared transmission line
with Silverleaf Solar Farm) • Imperial Solar Energy Center West Solar Farm
Other Actions: Imperial Valley Substation operation and maintenance; Imperial Valley Substation expansion for North Gila to Imperial Valley Substation #2 transmission line; Sunrise Powerlink; transmission and utility corridor maintenance; agricultural activities; recreational activity; North Gila to Imperial Valley Substation #2 transmission line; Dixieland Imperial Irrigation District transmission line and connection; Imperial Irrigation District canal and drain maintenance

Environmental Consequences
Ocotillo Sol Project Page 4-11 Draft EIS/Draft CDCA Plan Amendment April 2012
TABLE 4.1-2 CUMULATIVE SCENARIO BY RESOURCE OR BLM PROGRAM
Resource or BLM Program
Cumulative Analysis Impact Area Elements to Consider BLM-authorized Actions; Other Known Actions or Activities
Lands and Realty Imperial County area in the region surrounding the Ocotillo Sol Project area
Designated utility corridors (e.g., transmission lines, communication sites); existing ROWs; Interstate 8 and Highway 98
All projects listed in Table 4.1-1

Environmental Consequences
Page 4-12 Ocotillo Sol Project Draft EIS/Draft CDCA Plan Amendment April 2012
TABLE 4.1-2 CUMULATIVE SCENARIO BY RESOURCE OR BLM PROGRAM
Resource or BLM Program
Cumulative Analysis Impact Area Elements to Consider BLM-authorized Actions; Other Known Actions or Activities
Special Designations
An approximate 15-mile radius around the Ocotillo Sol Project area
Views, noise, recreation activities
BLM Actions: Road maintenance, recreation designations Renewable energy projects: • Calexico Solar Farm II • Mount Signal Solar Farm • Calexico Solar Farm I • Imperial Solar Energy Center South Solar Farm • Centinela Solar Farm • Acorn Greenworks Solar Farm • Silverleaf Solar Farm • Campo Verde Solar Farm (and shared transmission line
with Silverleaf Solar Farm) • Imperial Solar Energy Center West Solar Farm • Keystone Solar • Ocotillo Express Wind Farm • Solar Reserve Imperial Valley
Other Actions: Imperial Valley Substation operation and maintenance; Imperial Valley Substation expansion for North Gila to Imperial Valley Substation #2 transmission line; Sunrise Powerlink; transmission and utility corridor maintenance; Interstate 8, Highway 98; agricultural activities; recreational activity; North Gila to Imperial Valley Substation #2 transmission line; Dixieland Imperial Irrigation District transmission line and connection; Mosaic Specific Plan; sand and gravel mining; Imperial Irrigation District canal and drain maintenance

Environmental Consequences
Ocotillo Sol Project Page 4-13 Draft EIS/Draft CDCA Plan Amendment April 2012
TABLE 4.1-2 CUMULATIVE SCENARIO BY RESOURCE OR BLM PROGRAM
Resource or BLM Program
Cumulative Analysis Impact Area Elements to Consider BLM-authorized Actions; Other Known Actions or Activities
Recreation An approximate 2-mile radius around the Ocotillo Sol Project area
Dispersed recreation opportunities and experiences, ACECs, designated wilderness
BLM Actions: Road maintenance, recreation designations Renewable energy projects: • Calexico Solar Farm II • Mount Signal Solar Farm • Calexico Solar Farm I • Imperial Solar Energy Center South Solar Farm • Centinela Solar Farm • Acorn Greenworks Solar Farm • Silverleaf Solar Farm • Campo Verde Solar Farm (and shared transmission line
with Silverleaf Solar Farm) • Imperial Solar Energy Center West Solar Farm
Other Actions: Imperial Valley Substation operation and maintenance; Imperial Valley Substation expansion for North Gila to Imperial Valley Substation #2 transmission line; Sunrise Powerlink; transmission and utility corridor maintenance; agricultural activities; recreational activity; North Gila to Imperial Valley Substation #2 transmission line; Dixieland Imperial Irrigation District transmission line and connection; Imperial Irrigation District canal and drain maintenance

Environmental Consequences
Page 4-14 Ocotillo Sol Project Draft EIS/Draft CDCA Plan Amendment April 2012
TABLE 4.1-2 CUMULATIVE SCENARIO BY RESOURCE OR BLM PROGRAM
Resource or BLM Program
Cumulative Analysis Impact Area Elements to Consider BLM-authorized Actions; Other Known Actions or Activities
Visual Resources An approximate 15-mile radius around the Ocotillo Sol Project area
OHV recreation-related dust and activity, other recreational activity, development (renewable energy), views from KOPs
BLM Actions: Road maintenance, recreation designations Renewable energy projects: • Calexico Solar Farm II • Mount Signal Solar Farm • Calexico Solar Farm I • Imperial Solar Energy Center South Solar Farm • Centinela Solar Farm • Acorn Greenworks Solar Farm • Silverleaf Solar Farm • Campo Verde Solar Farm (and shared transmission line
with Silverleaf Solar Farm) • Imperial Solar Energy Center West Solar Farm • Keystone Solar • Ocotillo Express Wind Farm • Solar Reserve Imperial Valley
Other Actions: Imperial Valley Substation operation and maintenance; Imperial Valley Substation expansion for North Gila to Imperial Valley Substation #2 transmission line; Sunrise Powerlink; transmission and utility corridor maintenance; Interstate 8, Highway 98; agricultural activities; recreational activity; North Gila to Imperial Valley Substation #2 transmission line; Dixieland Imperial Irrigation District transmission line and connection; Mosaic Specific Plan; sand and gravel mining; Imperial Irrigation District canal and drain maintenance

Environmental Consequences
Ocotillo Sol Project Page 4-15 Draft EIS/Draft CDCA Plan Amendment April 2012
TABLE 4.1-2 CUMULATIVE SCENARIO BY RESOURCE OR BLM PROGRAM
Resource or BLM Program
Cumulative Analysis Impact Area Elements to Consider BLM-authorized Actions; Other Known Actions or Activities
Transportation and Public Access
An approximate 2-mile radius around the Ocotillo Sol Project area
Traffic and access, OHV recreation opportunities, changes in viewscape, unauthorized routes
BLM Actions: Road maintenance, recreation designations Renewable energy projects: • Ocotillo Express Wind Farm • Imperial Valley Solar • CSOLAR West • CSOLAR South • Centinela Solar Farm
Other Actions: Sunrise Powerlink; Imperial Valley Substation; transmission and utility corridor maintenance; agricultural activities; recreational activity
Noise and Vibration
An approximate 2-mile radius around the Ocotillo Sol Project area
Sensitive receptors BLM Actions: Road maintenance, recreation designations Renewable energy projects: • Ocotillo Express Wind Farm • Imperial Valley Solar • CSOLAR West • CSOLAR South • Centinela Solar Farm
Other Actions: Sunrise Powerlink; Imperial Valley Substation; transmission and utility corridor maintenance; agricultural activities; recreational activity
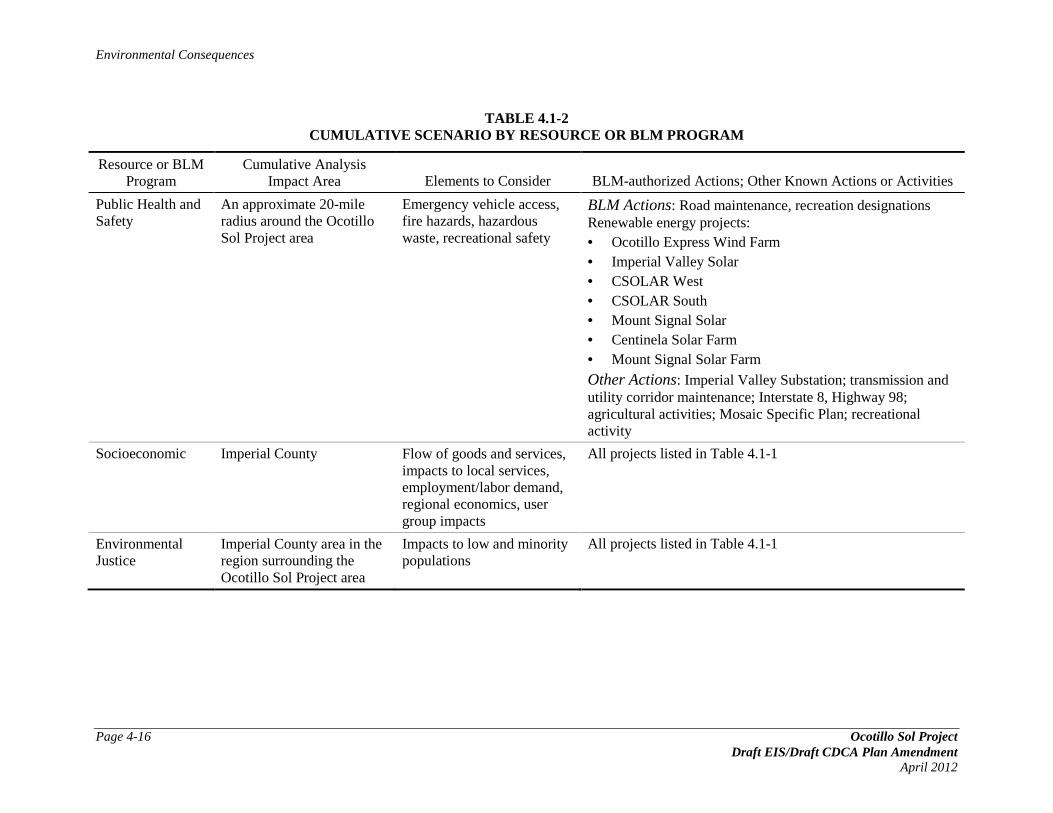
Environmental Consequences
Page 4-16 Ocotillo Sol Project Draft EIS/Draft CDCA Plan Amendment April 2012
TABLE 4.1-2 CUMULATIVE SCENARIO BY RESOURCE OR BLM PROGRAM
Resource or BLM Program
Cumulative Analysis Impact Area Elements to Consider BLM-authorized Actions; Other Known Actions or Activities
Public Health and Safety
An approximate 20-mile radius around the Ocotillo Sol Project area
Emergency vehicle access, fire hazards, hazardous waste, recreational safety
BLM Actions: Road maintenance, recreation designations Renewable energy projects: • Ocotillo Express Wind Farm • Imperial Valley Solar • CSOLAR West • CSOLAR South • Mount Signal Solar • Centinela Solar Farm • Mount Signal Solar Farm
Other Actions: Imperial Valley Substation; transmission and utility corridor maintenance; Interstate 8, Highway 98; agricultural activities; Mosaic Specific Plan; recreational activity
Socioeconomic Imperial County Flow of goods and services, impacts to local services, employment/labor demand, regional economics, user group impacts
All projects listed in Table 4.1-1
Environmental Justice
Imperial County area in the region surrounding the Ocotillo Sol Project area
Impacts to low and minority populations
All projects listed in Table 4.1-1

Environmental Consequences
Ocotillo Sol Project Page 4-17 Draft EIS/Draft CDCA Plan Amendment April 2012
4.1.5 MITIGATION
Section 1508.20 of the CEQ regulations for implementing NEPA define mitigation as follows:
a) Avoiding the impact altogether by not taking a certain action or parts of an action b) Minimizing impacts by limiting the degree or magnitude of the action and its implementation c) Rectifying the impact by repairing, rehabilitating, or restoring the affected environment d) Reducing or eliminating the impact over time by preservation and maintenance operations
during the life of the action e) Compensating for the impact by replacing or providing substitute resources or environments
For impacts identified in the resource sections, mitigation measures have been developed that would be implemented during all appropriate phases of the Applicant’s proposed project from initial ground breaking to operations, through closure and decommissioning. The mitigation measures include a combination of the following:
• Measures that have been proposed by the Applicant
• Regulatory requirements of other federal, state, and local agencies
• Additional BLM-proposed mitigation measures, standard ROW grant terms and conditions, and BMPs
Some of these measures have been incorporated into the Applicant’s project design features and discussed in Chapter 2. Additional mitigation measures designed to reduce, avoid, or compensate for impacts are included in under each resource topic and are the same for each action alternative.
4.1.6 IRREVERSIBLE AND IRRETRIEVABLE COMMITMENT OF RESOURCES
CEQ regulations (40 CFR, Part 1502.16) and the BLM NEPA Handbook (H-1790-1) require a discussion of adverse impacts that would remain after all reasonable and effective mitigation is applied, and disclosure of irreversible and irretrievable commitments of resources if the project is implemented. A resource commitment is considered irreversible when direct and indirect effects from its use limit future use options. Irreversible commitments apply primarily to nonrenewable resources, such as cultural resources, and to those resources that are renewable only over long periods of time, such as soil productivity. A resource commitment is considered irretrievable when the use of the resource is neither renewable nor recoverable for future use. Irretrievable commitments apply to loss of production, harvest, or use of natural resources.

Environmental Consequences
Page 4-18 Ocotillo Sol Project Draft EIS/Draft CDCA Plan Amendment April 2012
4.2 AIR QUALITY
4.2.1 MANAGEMENT GOALS
The CDCA Plan provides management direction for air quality protection in the region. Under this plan, areas will be managed to protect their air quality and visibility in accordance with Class II objectives of Part C of the Clean Air Act Amendments, unless otherwise designated another class by the State of California as a result of recommendations developed by any BLM air quality management plan. The Ocotillo Sol Project area has not been designated another class by the state.
4.2.2 EMISSION CALCULATIONS
Air quality impacts can result from the construction and operation of a project. Construction impacts are generally short-term and result from fugitive dust, equipment exhaust, and indirect effects associated with construction workers and deliveries. Operational impacts can occur from siting stationary emitting equipment, traffic associated with facility operation, regional impacts resulting from growth-inducing development, or local hot-spot effects stemming from sensitive receivers being placed close to highly congested roadways. In the case of this project, the primary source of emissions would be construction activities. As discussed below, operational emissions would be primarily related to facility worker trips associated with maintenance and operation of the facility.
Air emissions were calculated using emission factors and other inputs from the California Emissions Estimator Model (CalEEMod) computer program (CARB 2011), the Emissions Factor (EMFAC) 2007 emissions model (CARB 2007), and the SCAQMD ICAPCD CEQA Air Quality Handbook (ICAPCD 2007), and the SCAQMD CEQA Air Quality Handbook (SCAQMD 1993). The CalEEMod program estimates air emissions resulting from land development projects in California. The model generates estimates of emissions from three basic sources: construction sources, area sources (e.g., natural gas heating), and operational sources (e.g., traffic). The EMFAC 2007 model was developed by CARB to calculate emission rates from all motor vehicles, such as passenger cars and heavy-duty trucks, operating on highways, freeways, and local roads in California. The SCAQMD CEQA Air Quality Handbook provided emission factors for certain types of equipment not found in CalEEMod or EMFAC. Adopted thresholds from the ICAPCD CEQA Air Quality Handbook are presented in Table 4.2-1 and general conformity de minimus thresholds are presented in Table 4.2-2.

Environmental Consequences
Ocotillo Sol Project Page 4-19 Draft EIS/Draft CDCA Plan Amendment April 2012
TABLE 4.2-1 ICAPCD THRESHOLDS OF SIGNIFICANCE
Pollutant Construction (pounds/day)
Operation (pounds/day) Tier I
Operation (pounds/day) Tier II
CO 550 < 550 ≥ 550 NO2 100 < 55 ≥ 55 SO2 -- < 150 ≥ 150 PM10 150 < 150 ≥ 150 PM2.5 150 -- -- VOC 75 < 55 ≥ 55 Level of Significance Significant Less than Significant Significant Level of Analysis Initial Study Comprehensive Air
Quality Report Environmental Document
Negative Declaration Mitigated Negative Declaration or
Environmental Impact Report
Source: ICAPCD 2007
TABLE 4.2-2 FEDERAL DE MINIMIS THRESHOLDS—IMPERIAL VALLEY NONATTAINMENT AREAS
Pollutant Federal Designation Threshold (tons/year)
O3* (VOCs) Nonattainment, Moderate 100
O3* (NOx) Nonattainment, Moderate 100
PM10 Nonattainment, Serious 70 PM2.5 Direct Emissions SO2 NOx
†
VOC or ammonia‡
Nonattainment 100 100 100 100
CO Attainment N/A
Source of Thresholds: 40 CFR 93 VOCs=volatile organic compounds; NOx=oxides of nitrogen; N/A: not applicable *Emission thresholds are given for O3 precursor elements, VOCs and NOx, based on the attainment status of O3. † unless determined not to be significant precursors ‡ if determined to be significant precursors
4.2.3 IMPACTS BY ALTERNATIVE
4.2.3.1 ALTERNATIVES 1, 4, AND 5
Under Alternative 1, the Ocotillo Sol Project would not be approved by the BLM and the CDCA Plan would not be amended. The Ocotillo Sol Project would not be constructed and the BLM

Environmental Consequences
Page 4-20 Ocotillo Sol Project Draft EIS/Draft CDCA Plan Amendment April 2012
would continue to manage the site consistent with the CDCA Plan (1980, as amended), Yuha Basin ACEC Management Plan (1981), Yuha Desert Wildlife Habitat Management Plan (1983), Yuha Desert Management Plan (1985), and the Flat-tailed Horned Lizard Rangewide Management Strategy.
Under Alternative 4, the Ocotillo Sol Project would not be approved and no ROW grant would be issued to the Applicant. The project area would remain in its existing condition, with no construction of structures or facilities resulting in ground disturbance, and no impacts associated with the Ocotillo Sol Project would occur. Under Alternative 4, the CDCA Plan would be amended to identify the Ocotillo Sol Project area as suitable for solar energy development. As a result, a project might be proposed in the future using the same or different solar energy technology on the project site, possibly resulting in impacts similar to the proposed Ocotillo Sol Project. The impacts of such a future project, however, are speculative at this time.
Under Alternative 5, the Ocotillo Sol Project would not be approved and no ROW grant would be issued to the Applicant. The project area would remain in its existing condition, with no construction of structures or facilities resulting in ground disturbance, and no impacts associated with the Ocotillo Sol Project would occur. Under Alternative 5, the CDCA Plan would be amended to identify the Ocotillo Sol Project area as unsuitable for solar energy development.
Under Alternatives 1, 4, and 5, there would be no direct or indirect impacts to air quality related to the Ocotillo Sol Project.
4.2.3.2 ALTERNATIVE 2
Under Alternative 2, the Applicant would construct, operate, maintain, and decommission a 100-acre solar PV facility on BLM-managed lands under an authorized ROW. This alternative includes a 15-acre temporary ROW that would be used as a laydown are during construction of the solar facility. Construction of the Ocotillo Sol Project would include grading, foundation excavation, trenching, and fencing.
4.2.3.2.1 Construction Construction-related pollutants result from dust raised during grading, emissions from construction vehicles and equipment, and chemicals used during construction. Fugitive dust emissions vary greatly during construction and are dependent on the amount and type of activity, silt content of the soil, and the weather. Vehicles moving over paved and unpaved surfaces, demolition, excavation, earth movement, grading, and wind erosion from exposed surfaces are all sources of fugitive dust.
Heavy-duty construction equipment is usually diesel powered. In general, emissions from diesel-powered equipment contain more nitrogen oxides, sulfur oxides, and particulate matter than gasoline-powered engines. Diesel-powered engines generally produce less carbon monoxide and less reactive organic gases than do gasoline-powered engines. Standard construction equipment includes dozers, rollers, scrapers, dewatering pumps, backhoes, loaders, paving equipment, delivery/haul trucks, jacking equipment, welding machines, pile drivers, and so on.

Environmental Consequences
Ocotillo Sol Project Page 4-21 Draft EIS/Draft CDCA Plan Amendment April 2012
Construction for the Ocotillo Sol Project would occur over an 11-month period. This schedule is based on “typical working hours” with hours of operation assumed to be between 7:00 A.M. and 7:00 P.M., Monday through Friday. The Ocotillo Sol Project’s overall construction schedule is shown in Table 4.2-3.
Construction equipment parameters (e.g., types, hours of operation) were provided by the Applicant and are summarized in Table 4.2-4. Since the conformity de minimis thresholds are expressed in tons per year, it was assumed that all construction equipment indicated in Table 4.2-4 could operate in a single year.
TABLE 4.2-3 CONSTRUCTION TIMELINE
Phase
Construction Month
1 2 3 4 5 6 7 8 9 10 11
Site Preparation/Access Roads X Module Rack Supports
X X X
Security Fencing
X Underground Electrical
X X X
Rack Installation
X X X X Module Installation
X X X X X
Above Ground Electrical
X X Power Conversion Stations
X X
Maintenance Building
X X X X
Combining Switchgear
X Commissioning
X
Source: S. Peterson pers. comm., 2012

Environmental Consequences
Page 4-22 Ocotillo Sol Project Draft EIS/Draft CDCA Plan Amendment April 2012
TABLE 4.2-4 CONSTRUCTION EQUIPMENT PARAMETERS
Phase Equipment Quantity Fuel Type
Engine hp
Operating Hours per
Day
Operating Duration
(days)
Total Operating
Hours
Total Hours Unit
VTM/ Unit
Site Preparation/ Access Roads
ATV 10 gas 50 4 40 160 160 2400
Site Preparation/ Access Roads
Backhoe/trencher 2 diesel 350 8 2 16 16
Site Preparation/ Access Roads
Dump Truck 2 diesel 350 8 20 160 160
Site Preparation/ Access Roads
Front End Loader 1 diesel 350 8 20 160 160
Site Preparation/ Access Roads
Generators/Compressors
1 diesel 100 8 20 160 160
Site Preparation/ Access Roads
Grader 1 diesel 350 8 50 400 400
Site Preparation/ Access Roads
Personal Cars 20 gas 150 2 40 80 80 1200
Site Preparation/ Access Roads
Roller/Compactor 1 diesel 350 8 40 320 320
Site Preparation/ Access Roads
Scraper/Dozer 1 diesel 400 8 40 320 320
Site Preparation/ Access Roads
Semi (equipment & supplies delivery)
1 diesel 350 4 20 80 80 1200
Site Preparation/ Access Roads
Water Truck 2 diesel 350 4 40 160 160
Module Rack Supports
ATV 10 gas 50 8 40 320 320 4800
Module Rack Supports
Crew Delivery Bus 3 diesel 250 2 40 80 80 1200
Module Rack Supports
Flat-bed truck 2 diesel 200 2 20 40 40 600
Module Rack Supports
Personal cars 20 gas 150 1 40 40 40 600

Environmental Consequences
Ocotillo Sol Project Page 4-23 April 2012
TABLE 4.2-4 CONSTRUCTION EQUIPMENT PARAMETERS
Phase Equipment Quantity Fuel Type
Engine hp
Operating Hours per
Day
Operating Duration
(days)
Total Operating
Hours
Total Hours Unit
VTM/ Unit
Module Rack Supports
Semi (equipment & supplies delivery)
1 diesel 350 4 30 120 120 1800
Module Rack Supports
Vibratory Post Driver
2 diesel 100 8 30 240 240
Module Rack Supports
Water Truck 2 diesel 350 4 40 160 160
Security Fencing ATV 10 gas 50 4 20 80 80 1200 Security Fencing Backhoe/trencher 2 diesel 350 8 2 16 16 Security Fencing Concrete Truck 1 diesel 350 8 10 80 80 Security Fencing Flat-bed truck 2 diesel 200 4 3 12 12 180 Security Fencing Forklift 2 diesel 100 8 3 24 24 Security Fencing Hand Held Vibrator 2 gas 50 8 20 160 160 Security Fencing Personal cars 20 gas 150 1 20 20 20 Security Fencing Semi (equipment &
supplies delivery) 1 diesel 350 4 5 20 20 300
Underground Electrical
ATV 10 gas 50 8 50 400 400 6000
Underground Electrical
Backhoe/trencher 2 diesel 350 8 20 160 160
Underground Electrical
Crew Delivery Bus 3 diesel 250 2 40 80 80 1200
Underground Electrical
Flat-bed truck 2 diesel 200 2 40 80 80 1200
Underground Electrical
Forklift 2 diesel 100 4 40 160 160
Underground Electrical
Hand Held Vibrator 2 gas 50 8 10 80 80
Underground Electrical
Personal cars 20 gas 150 1 40 40 40 600

Environmental Consequences
Page 4-24 Ocotillo Sol Project Draft EIS/Draft CDCA Plan Amendment April 2012
TABLE 4.2-4 CONSTRUCTION EQUIPMENT PARAMETERS
Phase Equipment Quantity Fuel Type
Engine hp
Operating Hours per
Day
Operating Duration
(days)
Total Operating
Hours
Total Hours Unit
VTM/ Unit
Underground Electrical
Roller/Compactor 1 diesel 350 8 20 160 160
Underground Electrical
Semi (equipment & supplies delivery)
1 diesel 350 4 40 160 160 2400
Underground Electrical
Water Truck 2 diesel 350 4 40 160 160
Rack Installation ATV 10 gas 50 8 40 320 320 4800 Rack Installation Cranes/Lifts 1 diesel 150 8 40 320 320 Rack Installation Crew Delivery Bus 3 diesel 250 2 40 80 80 1200 Rack Installation Flat-bed truck 2 diesel 200 2 50 100 100 1500 Rack Installation Forklift 2 diesel 100 4 50 200 200 Rack Installation Personal cars 20 gas 150 1 40 40 40 600 Rack Installation Semi (equipment &
supplies delivery) 1 diesel 350 4 40 160 160 2400
Rack Installation Water Truck 2 diesel 350 4 40 160 160 Module Installation ATV 10 gas 50 8 40 320 320 4800 Module Installation Crew Delivery Bus 3 diesel 250 2 40 80 80 1200 Module Installation Flat-bed truck 2 diesel 200 2 50 100 100 1500 Module Installation Forklift 2 diesel 100 8 50 400 400 Module Installation Personal cars 20 gas 150 1 40 40 40 600 Module Installation Semi (equipment &
supplies delivery) 1 diesel 350 4 60 240 240 3600
Module Installation Water Truck 2 diesel 350 4 40 160 160 Aboveground Electrical
ATV 10 gas 50 8 30 240 240 3600
Aboveground Electrical
Concrete Truck 1 diesel 350 8 5 40 40

Environmental Consequences
Ocotillo Sol Project Page 4-25 April 2012
TABLE 4.2-4 CONSTRUCTION EQUIPMENT PARAMETERS
Phase Equipment Quantity Fuel Type
Engine hp
Operating Hours per
Day
Operating Duration
(days)
Total Operating
Hours
Total Hours Unit
VTM/ Unit
Aboveground Electrical
Cranes/Lifts 1 diesel 150 8 10 80 80
Aboveground Electrical
Crew Delivery Bus 3 diesel 250 2 20 40 40 600
Aboveground Electrical
Flat-bed truck 2 diesel 200 2 40 80 80 1200
Aboveground Electrical
Forklift 2 diesel 100 4 40 160 160
Aboveground Electrical
Personal cars 20 gas 150 1 20 20 20 300
Aboveground Electrical
Semi (equipment & supplies delivery)
1 diesel 350 4 20 80 80 1200
Aboveground Electrical
Water Truck 10 diesel 350 8 20 160 160 2400
Power Conversion Stations
ATV 2 gas 50 8 30 240 240 3600
Power Conversion Stations
Backhoe/trencher 1 diesel 350 8 2 16 16
Power Conversion Stations
Concrete Truck 1 diesel 350 8 20 160 160
Power Conversion Stations
Cranes/Lifts 3 diesel 150 8 10 80 80
Power Conversion Stations
Crew Delivery Bus 2 diesel 250 2 20 40 40 600
Power Conversion Stations
Flat-bed truck 2 diesel 200 2 40 80 80 1200
Power Conversion Stations
Forklift 1 diesel 100 4 40 160 160
Power Conversion Stations
Generators/ Compressors
2 diesel 100 8 10 80 80

Environmental Consequences
Page 4-26 Ocotillo Sol Project Draft EIS/Draft CDCA Plan Amendment April 2012
TABLE 4.2-4 CONSTRUCTION EQUIPMENT PARAMETERS
Phase Equipment Quantity Fuel Type
Engine hp
Operating Hours per
Day
Operating Duration
(days)
Total Operating
Hours
Total Hours Unit
VTM/ Unit
Power Conversion Stations
Hand Held Vibrator 20 gas 50 8 10 80 80
Power Conversion Stations
Personal cars 1 gas 150 1 20 20 20 300
Power Conversion Stations
Roller/Compactor 1 diesel 350 8 2 16 16
Power Conversion Stations
Semi (equipment & supplies delivery)
2 diesel 350 4 40 160 160 2400
Power Conversion Stations
Water Truck 10 diesel 350 4 20 80 80
Maintenance Building
ATV 2 gas 50 8 30 240 240 3600
Maintenance Building
Backhoe/trencher 1 diesel 350 8 2 16 16
Maintenance Building
Concrete Truck 1 diesel 350 8 10 80 80
Maintenance Building
Cranes/Lifts 3 diesel 150 8 4 32 32
Maintenance Building
Crew Delivery Bus 2 diesel 250 2 40 80 80 1200
Maintenance Building
Forklift 1 diesel 100 4 40 160 160
Maintenance Building
Front End Loader 1 diesel 350 8 1 8 8
Maintenance Building
Grader 20 diesel 350 8 5 40 40
Maintenance Building
Personal cars 1 gas 150 1 40 40 40 600
Maintenance Building
Roller/Compactor 1 diesel 350 8 2 16 16

Environmental Consequences
Ocotillo Sol Project Page 4-27 April 2012
TABLE 4.2-4 CONSTRUCTION EQUIPMENT PARAMETERS
Phase Equipment Quantity Fuel Type
Engine hp
Operating Hours per
Day
Operating Duration
(days)
Total Operating
Hours
Total Hours Unit
VTM/ Unit
Maintenance Building
Scraper/Dozer 1 diesel 400 8 2 16 16
Maintenance Building
Semi (equipment & supplies delivery)
2 diesel 350 4 30 120 120 1800
Maintenance Building
Water Truck 10 diesel 350 8 40 320 320
Combining Switchgear
ATV 2 gas 50 8 30 240 240 3600
Combining Switchgear
Backhoe/trencher 1 diesel 350 8 1 8 8
Combining Switchgear
Concrete Truck 1 diesel 350 8 5 40 40
Combining Switchgear
Cranes/Lifts 3 diesel 150 8 4 32 32
Combining Switchgear
Crew Delivery Bus 2 diesel 250 2 20 40 40 600
Combining Switchgear
Flat-bed truck 2 diesel 200 2 20 40 40 600
Combining Switchgear
Forklift 20 diesel 100 4 20 80 80
Combining Switchgear
Personal cars 1 gas 150 1 20 20 20 300
Combining Switchgear
Semi (equipment & supplies delivery)
2 diesel 350 4 30 120 120 1800
Combining Switchgear
Water Truck 10 diesel 350 8 20 160 160
Commissioning ATV 1 gas 50 8 40 320 320 4800 Commissioning Cranes/Lifts 3 diesel 150 8 2 16 16 Commissioning Crew Delivery Bus 2 diesel 250 2 10 20 20 300

Environmental Consequences
Page 4-28 Ocotillo Sol Project Draft EIS/Draft CDCA Plan Amendment April 2012
TABLE 4.2-4 CONSTRUCTION EQUIPMENT PARAMETERS
Phase Equipment Quantity Fuel Type
Engine hp
Operating Hours per
Day
Operating Duration
(days)
Total Operating
Hours
Total Hours Unit
VTM/ Unit
Commissioning Flat-bed truck 2 diesel 200 1 20 20 20 300 Commissioning Forklift 1 diesel 100 2 20 40 40 Commissioning Generators/Compres
sors 20 diesel 100 8 10 80 80
Commissioning Personal cars 2 gas 150 0.5 40 20 20 300 Commissioning Water Truck 10 diesel 350 8 30 240 240
Source: S. Peterson, pers. com. 2012
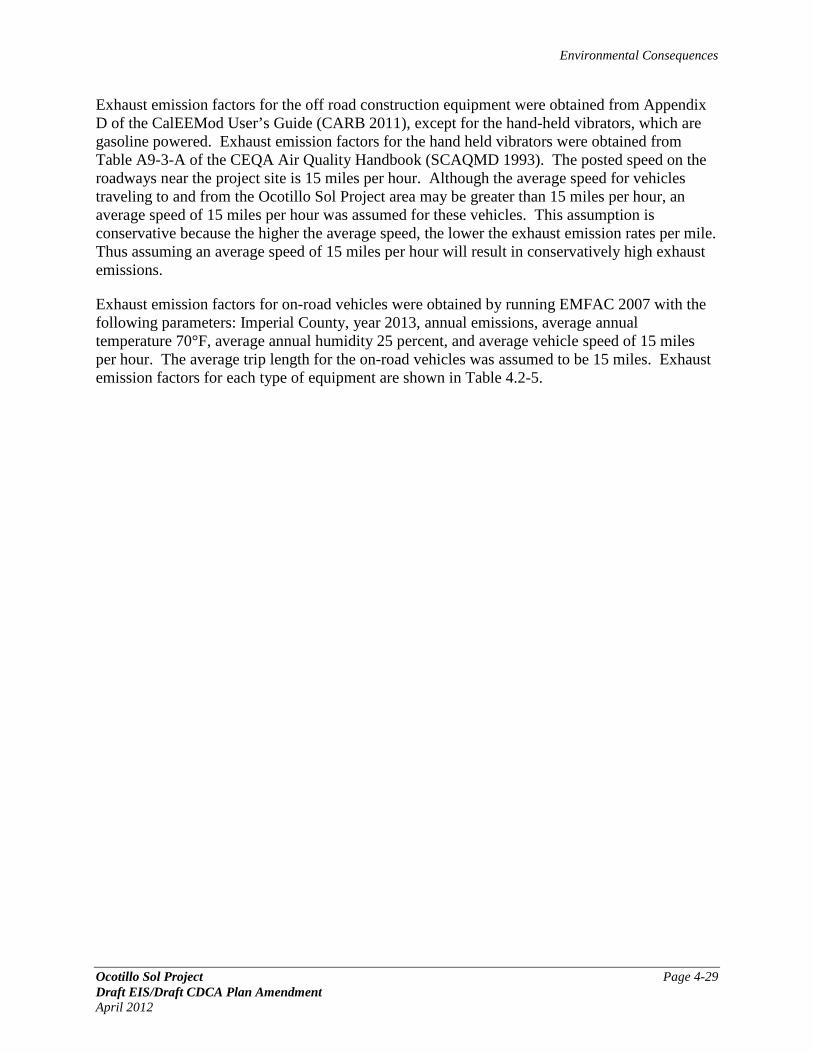
Environmental Consequences
Ocotillo Sol Project Page 4-29 Draft EIS/Draft CDCA Plan Amendment April 2012
Exhaust emission factors for the off road construction equipment were obtained from Appendix D of the CalEEMod User’s Guide (CARB 2011), except for the hand-held vibrators, which are gasoline powered. Exhaust emission factors for the hand held vibrators were obtained from Table A9-3-A of the CEQA Air Quality Handbook (SCAQMD 1993). The posted speed on the roadways near the project site is 15 miles per hour. Although the average speed for vehicles traveling to and from the Ocotillo Sol Project area may be greater than 15 miles per hour, an average speed of 15 miles per hour was assumed for these vehicles. This assumption is conservative because the higher the average speed, the lower the exhaust emission rates per mile. Thus assuming an average speed of 15 miles per hour will result in conservatively high exhaust emissions.
Exhaust emission factors for on-road vehicles were obtained by running EMFAC 2007 with the following parameters: Imperial County, year 2013, annual emissions, average annual temperature 70°F, average annual humidity 25 percent, and average vehicle speed of 15 miles per hour. The average trip length for the on-road vehicles was assumed to be 15 miles. Exhaust emission factors for each type of equipment are shown in Table 4.2-5.

Environmental Consequences
Page 4-30 Ocotillo Sol Project Draft EIS/Draft CDCA Plan Amendment April 2012
TABLE 4.2-5 EQUIPMENT EMISSION FACTORS
Equipment Fuel Type
Engine hp Load Factor* TOG1 ROG1 CO1 NOX
1 SO21 PM10
1 PM2.51 CO2
1 CH41
Backhoe/trencher diesel 350 0.55 21.129 0.377 1.226 3.404 0.006 0.115 0.115 568.299 0.034 Concrete Truck diesel 350 0.57 3.173 0.452 1.327 3.728 0.005 0.132 0.132 568.299 0.040 Cranes/Lifts diesel 150 0.43 6.607 0.729 3.41 5.495 0.006 0.314 0.314 568.299 0.065 Dump Truck diesel 350 0.57 3.173 0.452 1.327 3.728 0.005 0.132 0.132 568.299 0.040 Forklift diesel 100 0.3 4.118 0.788 3.953 5.038 0.006 0.434 0.434 568.299 0.071 Front End Loader diesel 350 0.54 16.768 0.447 1.533 4.114 0.005 0.147 0.147 568.299 0.040 Generators / Compressors diesel 100 0.74 16.078 0.792 3.567 5.478 0.006 0.424 0.424 586.299 0.071 Grader diesel 350 0.61 8.815 0.459 1.557 4.171 0.005 0.150 0.150 568.299 0.041 Hand-held Vibrator gas 50 0.371 NA 0.0033 0.0872 0.0023 0.0001 0.0001 NA NA NA Roller/Compactor diesel 350 0.56 34.702 0.428 1.637 4.362 0.005 0.153 0.153 568.299 0.038 Scraper/Dozer diesel 400 0.72 5.862 0.563 2.141 5.001 0.005 0.194 0.194 568.300 0.005 Vibratory Post Driver diesel 100 0.62 13.792 0.581 3.625 4.225 0.006 0.31 0.31 568.299 0.52 Water Truck diesel 350 0.57 3.173 0.452 1.327 3.728 0.005 0.132 0.132 568.299 0.040 SOURCE: CalEEMod 2011 (CARB 2011). *Described in SCAQMD 1993 as an “efficiency factor.” 1 OFFROAD Equipment Emission Factors (g/bhp-hr) NA: not available.

Environmental Consequences
Ocotillo Sol Project Page 4-31 Draft EIS/Draft CDCA Plan Amendment April 2012
TABLE 4.2-5 EQUIPMENT EMISSION FACTORS (CONT.)
Equipment Fuel Type
Engine hp TOG2 ROG2 CO2 NOX
2 SO22 PM10
2 PM2.52 CO2
2 CH42
ATV gas 50 NA 2.380 12.289 1.089 0.002 0.003 0.003 195.937 NA Crew Delivery Bus diesel 250 NA 0.303 3.227 6.550 0.014 0.388 0.357 1505.000 NA Flat-bed truck diesel 200 NA 0.310 3.233 6.712 0.014 0.379 0.349 1505.000 NA Personal cars gas 150 NA 0.468 5.695 0.654 0.006 0.025 0.023 597.267 NA Semi (equipment & supplies delivery) diesel 350 NA 2.022 6.225 13.944 0.025 0.675 0.621 2595.958 NA
SOURCE: EMFAC 2007 (CARB 2007). 2 EMFAC Emission Factors (grams/mile)

Environmental Consequences
Page 4-32 Ocotillo Sol Project Draft EIS/Draft CDCA Plan Amendment April 2012
Fugitive dust emissions associated with grading activities were estimated using default assumptions from CalEEMod (e.g., a scraper is assumed to grade 1 acre per 8-hour day). With these assumptions, Table 4.2-6 shows the projected construction emissions associated with the Ocotillo Sol Project.
As seen in Table 4.2-6, none of the criteria pollutant emissions due to construction of the Ocotillo Sol Project are anticipated to exceed the pertinent de minimis thresholds. Comparison with Tables 3.2-7 and 3.2-8 indicates that the construction emissions are well below 10 percent of the air basin emissions. Emissions due to construction of the Ocotillo Sol Project would not be locally or regionally significant. Therefore, the Ocotillo Sol Project is presumed to conform to the applicable SIP and adverse direct and indirect impacts to air quality would be negligible. Dust Control Plans for construction and operation (two plans) will be implemented to further avoid and reduce dust emissions in the project area associated with project construction and operation. Potential adverse impacts associated with CO hot spot formation and air toxics would similarly be negligible.
TABLE 4.2-6 ESTIMATED ANNUAL CONSTRUCTION AIR QUALITY EMISSIONS DUE TO THE
OCOTILLO SOL PROJECT (TONS/YEAR)
Pollutant Ocotillo Sol
Project Imperial County de minimis
Threshold Exceed Threshold? Reactive organic gas
2.0 100 No
CO 10.0 N/A N/A NOX 7.6 100 No SOX 0.0 100* No PM10 0.3 70 No PM2.5 0.3 100 No *Threshold applies to SO2 as a PM2.5 non-attainment area
4.2.3.2.2 Operation Operational emissions would be due primarily to worker vehicle travel to and from the site, as well as on-site vehicle emissions associated with maintenance activities. Table 4.2-7 shows the anticipated sources associated with facility operations.
Using the same general assumptions as described above for construction (e.g., average trip length of 15 miles), Table 4.2-8 shows the projected operational emissions associated with the Ocotillo Sol Project.
As seen in Table 4.2-8, none of the criteria pollutant emissions due to operation of the Ocotillo Sol Project are anticipated to exceed the pertinent de minimis thresholds. Comparison with Tables 3.2-7 and 3.2-8 indicate that the operational emissions are well below 10 percent of the air basin emissions.

Environmental Consequences
Ocotillo Sol Project Page 4-33 Draft EIS/Draft CDCA Plan Amendment April 2012
TABLE 4.2-7 OPERATIONAL ACTIVITIES
Equipment Fuel Type Engine hp
Total Annual Operation and Maintenance Hours Per
Equipment Category VMT ATV Gas 50 720 10,800 Flat-bed truck Diesel 200 120 1,800 Semi-truck Diesel 350 20 300 Personal car Gas 150 720 10,800 Crane/Lift Diesel 150 40 - Forklift Diesel 100 360 - Water Truck Diesel 350 20 -
Source: S. Peterson, pers. comm. 2012 hp = horsepower; VMT = vehicle miles traveled
TABLE 4.2-8 ESTIMATED ANNUAL OPERATIONAL AIR QUALITY EMISSIONS DUE TO THE
OCOTILLO SOL PROJECT (TONS/YEAR)
Pollutant Ocotillo Sol Project Imperial County de minimis Threshold Exceed Threshold?
Reactive organic gas 16.0 100 No CO 101.0 N/A N/A NOX 17.6 100 No SOX 0.1 100* No PM10 0.6 70 No PM2.5 0.6 100 No *Threshold applies to SO2 as a PM2.5 non-attainment area
In addition to the operational sources discussed above, it is possible that the energy produced by the solar facility would avoid the production of an equal amount of energy by a conventional power plant. The Applicant’s proposed Ocotillo Sol Project is anticipated to generate between 32,000 and 44,000 MW hours (MWh) per year (San Diego Gas & Electric 2012). Table 4.2-9 shows the emission factors associated with conventional (i.e., fossil fuel) energy production obtained from Table A9-11-B in the SCAQMD’s CEQA Air Quality Handbook (SCAQMD 1993). Emission factors are not provided for PM2.5 in Table A9-11-B of the Handbook. Per the guidance found in the SCAQMD’s Final Methodology to Calculate PM2.5 and PM2.5 Significance Thresholds (2006), for gaseous combustion the PM2.5 fraction of PM10 emissions is estimated to be nearly 100 percent. Therefore, PM2.5 emissions were assumed to be equal to PM10 emissions.

Environmental Consequences
Page 4-34 Ocotillo Sol Project Draft EIS/Draft CDCA Plan Amendment April 2012
TABLE 4.2-9 EMISSIONS FROM ELECTRICAL ENERGY GENERATION
CO
Reactive organic
gas NOX SOX PM10 PM2.5 Emission Factor (lbs/MWh) 0.20 0.01 1.15 0.12 0.04 0.04 For 32,000 MWh/year
Emissions (lbs/year) 6,400 320 36,800 3,840 1,280 6,400 Emissions (tons/year) 3.2 0.16 18.4 1.92 0.64 3.2
For 44,000 MWh/year Emissions (lbs/year) 8,800 440 50,600 5,280 1,760 8,800 Emissions (tons/year) 4.4 0.22 25.3 2.64 0.88 4.4
lbs. = pounds
Table 4.2-9 also shows the projected criteria pollutant emissions associated with the generation of 32,000 and 44,000 MWh of electricity per year.
The net emissions in the region could be less than those shown in Table 4.2-8 due to operation of the Ocotillo Sol Project.
The ICAPCD has set a significance threshold of 150 pounds per day for construction PM10 emissions. Worst-case daily exhaust PM10 emissions are less than 13 pounds per day. There are no sensitive receptors within one-quarter mile of the Ocotillo Sol Project area.
Because the Ocotillo Sol project is located in an area designated as nonattainment of the federal standards and State of California standards for both O3 and PM10, a conformity review was conducted for O3 (NOx and VOCs) and PM10 (see Table 4.2-6). Emissions due to construction of the Ocotillo Sol Project would not be locally or regionally significant and the project would conform to the applicable SIP.
Traffic “Hot Spots”
Small-scale, localized concentrations of CO above the state and national standards have the potential to occur at intersections with stagnation points such as those that occur on major highways and heavily traveled and congested roadways. Localized high concentrations of CO are referred to as “CO hot spots” and are a concern at congested intersections, where automobile engines burn fuel less efficiently and their exhaust contains more CO.
According to a traffic analysis conducted for a neighboring project, all intersections within the vicinity of the Ocotillo Sol Project area currently operate at LOS C or better during peak hours (BLM 2011), with those nearest to the Ocotillo Sol Project area operating at LOS B or better. Additionally, all freeway segments operate at LOS B or better and all roadway segments operate at LOS A within the vicinity of the Ocotillo Sol Project area (BLM 2011). Operational traffic associated with the Ocotillo Sol Project would be minimal. Furthermore, Imperial County is an attainment of the CO NAAQS and CAAQS. Therefore, CO hot spot formation is not of concern.

Environmental Consequences
Ocotillo Sol Project Page 4-35 Draft EIS/Draft CDCA Plan Amendment April 2012
Air Toxics
The Ocotillo Sol Project would not emit substantial air toxic pollutants. As a solar generating facility, it could indirectly reduce the emissions of air toxics in the region and beyond by offsetting the need for electrical generation by conventional (e.g., natural gas fired) facilities.
4.2.3.3 ALTERNATIVE 3
Under Alternative 3, the Applicant would construct, operate, maintain, and decommission a 100-acre solar PV facility on BLM-managed lands under an authorized ROW. The temporary ROW would be reduced to 2 acres. The 2-acre temporary ROW would provide for parking during construction of the Ocotillo Sol Project. Laydown and staging would occur within the 100-acre Ocotillo Sol Project area as construction activities progress.
Construction of the Applicant’s 100-acre Ocotillo Sol Project would include grading, foundation excavation, trenching, and fencing. Because the 15-acre temporary ROW would be reduced to 2 acres, emissions associated with Alternative 3 would be equal to or slightly less than those associated with Alternative 2.
4.2.4 CUMULATIVE IMPACTS
4.2.4.1 GEOGRAPHIC SCOPE
The geographic scope of air quality impacts is a 6-mile radius for regionally based impacts and a 1-mile radius for sensitive receptor impacts. These cumulative analysis impact areas are appropriate for air quality due to the state, regional, and local nature of air quality impacts that could occur cumulatively. Generally, the identification of cumulative projects for air quality ranges from approximately 1 mile to as far as 6 miles of a proposed project because the effect of downwind dispersion eliminates the potential for project-level significant cumulative air quality impacts over areas larger than a few square miles. The cumulative impacts to regional ambient air quality concentrations from projects more than approximately 6 miles apart are typically minimal due to dispersion that would occur over that distance. The emissions sources for this project would be minimal, ground-based, and have limited exhaust plume buoyancy. During construction, dust and vehicle emissions would be highest within the project site (up to the site boundary where construction activity would be occurring) and would disperse rapidly with distance. For fossil-fuel fired plants, the California Energy Commission typically applies a 6-mile radius for air quality cumulative analysis. A similar standard was used for the proposed Ocotillo Sol project and alternatives.
4.2.4.2 EXISTING CONDITIONS
Past, present, and reasonably foreseeable future projects are listed in Table 4.1-1. Projects within the air quality cumulative analysis impact area are listed in Table 4.1-2. These projects include the following: BLM actions (within BLM-administered lands) include ongoing road maintenance and recreation designations. Other actions include the following: Imperial Valley Substation operation and maintenance, Imperial Valley Substation expansion for North Gila to Imperial Valley Substation #2 transmission line, Sunrise Powerlink, transmission and utility corridor

Environmental Consequences
Page 4-36 Ocotillo Sol Project Draft EIS/Draft CDCA Plan Amendment April 2012
maintenance, Interstate 8 and Highway 98, agricultural activities, recreational activity, North Gila to Imperial Valley Substation #2 transmission line, Dixieland Imperial Irrigation District transmission line and connection, sand and gravel mining, Imperial Irrigation District canal and drain maintenance. Reasonably foreseeable future renewable energy projects within 6 miles of the Ocotillo Sol Project area include the following:
• Calexico Solar Farm II • Mount Signal Solar Farm • Calexico Solar Farm I • Imperial Solar Energy Center South Solar Farm • Centinela Solar Farm • Acorn Greenworks Solar Farm • Silverleaf Solar Farm • Campo Verde Solar Farm (and shared transmission line with the Silverleaf Solar Farm) • Imperial Solar Energy Center West Solar Farm
The existing conditions for air resources in the Ocotillo Sol Project area are described in Chapter 3, Section 3.2. The existing cumulative conditions for the project area are represented by the current area designations for criteria air pollutants. The SSAB is in attainment of all federal pollutant standards except for O3, PM10, and PM2.5. The Imperial Valley Planning Area, which includes the Ocotillo Sol Project area, is a serious PM10 nonattainment area, nonattainment for the PM2.5 24-hour standard, and a moderate 8-hour O3 nonattainment area under Subpart 2. The reasonably foreseeable future projects listed above would result in short-term adverse impacts to air quality, primarily during construction and decommissioning activities. The combination of these projects could deteriorate the air quality in the area over a short period if they occur concurrently. Operation and maintenance activities are anticipated to result in minimal emissions over the long-term and are not anticipated to result in significant impacts to air quality. Air quality mitigation measures will be required for all reasonably foreseeable future projects.
4.2.4.3 ALTERNATIVES 1, 4, AND 5
Under Alternatives 1, 4, and 5, there would be no direct or indirect impacts to air quality related to the Ocotillo Sol Project. These alternatives, in combination with other reasonably foreseeable future projects, would not contribute to cumulative air quality impacts within the 6-mile radius of the project area or within the larger region.
4.2.4.4 ALTERNATIVES 2 AND 3
Negligible short-term impacts to air quality would occur during construction and decommissioning of the Applicant’s proposed Ocotillo Sol Project under Alternatives 2 and 3. Emissions under these alternatives are projected to be below the de minimis thresholds and impacts would be negligible. These impacts would not be locally or regionally significant. Approved renewable energy projects or those pending approval are not expected to be under peak construction concurrent with the proposed Ocotillo Sol Project (cumulative peak construction would not likely coincide with construction activities described under Alternatives 2 and 3). The majority of past, present, and reasonably foreseeable activities, with the exception of activities at the Imperial Valley Substation, would occur 2 miles or more away from the

Environmental Consequences
Ocotillo Sol Project Page 4-37 Draft EIS/Draft CDCA Plan Amendment April 2012
proposed Ocotillo Sol Project area. The renewable energy projects, along with other activities within the 6-mile geographic scope for air quality, combined with construction activities under Alternatives 2 and 3, would result in short-term cumulative impacts to air quality. These impacts are not expected to have a significant cumulative effect on local or regional air quality. All renewable energy projects within a 6-mile radius of the proposed Ocotillo Sol Project area have or will be required to implement air quality dust control plans or mitigation measures to reduce impacts.
During operation and maintenance, no long-term air quality impacts are anticipated, and no increases in traffic would occur during the operational life of the proposed solar facility. During operation and maintenance activities under Alternatives 2 and 3, emissions for all criteria pollutants would be near zero. No direct cumulative impacts to air quality are anticipated during operation and maintenance activities under Alternatives 2 and 3 in combination with other reasonably foreseeable future projects in the area.
4.2.5 MITIGATION
Dust control plans for the construction period as well as the operation and maintenance period would be implemented to reduce emissions (the dust control plan will be developed prior to the Record of Decision). Dust control measures would be taken from the Water Quality Construction BMP Manual (San Diego Gas & Electric 2002) and Renewable Energy Action Team BMPs and Guidance Manual (2010). The Applicant would conduct construction dust control within the project area, construction laydown areas, and the access road by using water applied by trucks or other palliative means deemed acceptable by BLM. Wind erosion control techniques (such as windbreaks, water, chemical dust suppressants, or vegetation) would be used where soils are disturbed (Renewable Energy Action Team 2010).
4.2.6 IRREVERSIBLE AND IRRETRIEVABLE COMMITMENT OF RESOURCES
Construction and decommissioning activities for the Ocotillo Sol Project would result in unavoidable adverse impacts to air quality from particulate matter and vehicle emissions. These impacts would be temporary negligible residual effects. BMPs and implementation of a dust control plan would minimize impacts. The Ocotillo Sol Project would not trigger federal or state conformity levels, and would not cause irreversible or irretrievable commitment of air resources. Unavoidable adverse impacts to air quality would be temporary and negligible, primarily during the construction period of the Ocotillo Sol project under Alternatives 2 and 3. No unavoidable or adverse impacts to air quality would result from selection of Alternatives 1, 4, or 5.

Environmental Consequences
Page 4-38 Ocotillo Sol Project Draft EIS/Draft CDCA Plan Amendment April 2012
4.3 GREENHOUSE GASES AND CLIMATE CHANGE
4.3.1 MANAGEMENT GOALS
Based on the applicable BLM guidance, climate change analyses should attempt to account for and disclose the BLM’s potential contribution to or mitigation of climate change and/or related impact and compare those contributions or mitigation to other relevant climate drivers (SO 3289, Amendment 1).
4.3.2 EMISSIONS CALCULATIONS
As with air emissions, GHG emissions can result from the construction and operation of a project. Construction impacts are generally short term and result from equipment exhaust and indirect effects associated with construction workers and deliveries. Operational impacts can occur from siting stationary emitting equipment, traffic associated with facility operation, or regional impacts resulting from growth-inducing development. In the case of the Ocotillo Sol Project, the primary source of emissions would be construction activities. As discussed below, operational emissions would be primarily related to facility worker trips associated with maintenance and operation of the facility.
GHG emissions were calculated using emission factors and other inputs from the CalEEMod computer program (SCAQMD 2011) and the EMFAC 2007 emissions model (CARB 2007). The CalEEMod program is a tool used to estimate air emissions, including GHG emissions, resulting from land development projects in the state of California. The model generates emissions from three basic sources: construction sources, area sources (e.g., fireplaces and natural gas heating), and operational sources (e.g., traffic). The EMFAC 2007 model was developed by CARB to calculate emission rates from all motor vehicles, such as passenger cars and heavy-duty trucks, operating on highways, freeways, and local roads in California.
4.3.3 IMPACTS BY ALTERNATIVE
4.3.3.1 ALTERNATIVES 1, 4, AND 5
Under Alternative 1, the Ocotillo Sol Project would not be approved by the BLM and the CDCA Plan would not be amended. The Ocotillo Sol Project would not be constructed and the BLM would continue to manage the site consistent with the CDCA Plan (1980, as amended), Yuha Basin ACEC Management Plan (1981), Yuha Desert Wildlife Habitat Management Plan (1983), Yuha Desert Management Plan (1985), and the Flat-tailed Horned Lizard Rangewide Management Strategy.
Under Alternative 4, the Ocotillo Sol Project would not be approved and no ROW grant would be issued to the Applicant. The project area would remain in its existing condition, with no construction of structures or facilities resulting in ground disturbance, and no impacts associated with the Ocotillo Sol Project would occur. Under Alternative 4, the CDCA Plan would be amended to identify the Ocotillo Sol Project area as suitable for solar energy development. As a

Environmental Consequences
Ocotillo Sol Project Page 4-39 Draft EIS/Draft CDCA Plan Amendment April 2012
result, a project might be proposed in the future using the same or different solar energy technology on the project site, possibly resulting in impacts similar to the proposed Ocotillo Sol Project. The impacts of such a future project, however, are speculative at this time.
Under Alternative 5, the Ocotillo Sol Project would not be approved and no ROW grant would be issued to the Applicant. The project area would remain in its existing condition, with no construction of structures or facilities resulting in ground disturbance, and no impacts associated with the Ocotillo Sol Project would occur. Under Alternative 5, the CDCA Plan would be amended to identify the Ocotillo Sol Project area as unsuitable for solar energy development.
Under Alternatives 1, 4, and 5, the project area would remain in its existing condition, with no construction of structures or facilities resulting in ground disturbance. Under these alternatives, there would be no adverse direct or indirect impacts from GHG emissions. These alternatives would result in continued production of energy by a conventional (fossil fueled) power plant, however, and there would be no GHG emissions reductions from the use of a renewable energy source.
4.3.3.2 ALTERNATIVE 2
Under Alternative 2, the Applicant would construct, operate, maintain, and decommission a 100-acre solar PV facility on BLM-managed lands under an authorized ROW. This alternative includes a 15-acre temporary ROW that would be used as a laydown area during construction of the solar facility. Construction of the Ocotillo Sol Project would include grading, foundation excavation, trenching, and fencing.
4.3.3.2.1 Construction Under Alternative 2, construction-related GHG emissions would result primarily from construction vehicles and equipment. Heavy-duty construction equipment is usually diesel powered. Standard construction equipment includes bulldozers, rollers, scrapers, dewatering pumps, backhoes, loaders, paving equipment, delivery/haul trucks, jacking equipment, welding machines, pile drivers, and so on.
Construction equipment parameters (e.g., types, hours of operation) were provided by the applicant and are summarized in Table 4.2-4 for each phase. Under Alternative 2, overall project construction is anticipated to take 11 months as discussed in Section 4.2. Since the GHG threshold (25,000 MTCO2E) is expressed in metric tons per year, it was assumed that all construction equipment indicated in Table 4.2-4 could operate in a single calendar year.
Under Alternative 2, construction is assumed to occur in the year 2013. Exhaust emission factors for the off road construction equipment were obtained from Appendix D of the CalEEMod User’s Guide (CARB 2011), except for the hand held vibrators, which are gasoline powered. Emission factors for N2O are not provided in this appendix. It is assumed that N2O emissions from construction equipment are minimal.
GHG exhaust emission factors for the hand held vibrators are not available. This relatively small piece of equipment is only used occasionally during project construction and is not anticipated to

Environmental Consequences
Page 4-40 Ocotillo Sol Project Draft EIS/Draft CDCA Plan Amendment April 2012
contribute substantial GHG emissions. Therefore, this piece of equipment was omitted from the GHG analysis.
For the on-road traffic, emissions were estimated using the EMFAC 2007 model as indicated. This model does not provide emission factors for N2O or CH4. It is assumed that vehicular emissions of these pollutants are minimal. The EMFAC parameters are the same as those discussed in Section 4.2. Exhaust emission factors for each type of equipment are shown in Table 4.2-5.
With these assumptions, Table 4.3-1 shows the projected construction emissions associated with the Ocotillo Sol Project under Alternative 2.
TABLE 4.3-1 ALTERNATIVE 2 ESTIMATED ANNUAL CONSTRUCTION GHG EMISSIONS
(METRIC TONS/YEAR)
Pollutant Ocotillo Sol Project GWP CO2E CO2 1,077 1.0 1,077 CH4 0.07 21 1.5
Total -- -- 1,078 Note: The sum of values may not equal total shown, due to rounding. CO2E=carbon dioxide equivalent
As seen in Table 4.3-1, GHG equivalent emissions during project construction under Alternative 2 are projected to be well below 25,000 MTCO2E per year. Under Alternative 2, the construction related GHG emissions would be negligible.
4.3.3.2.2 Operation Under Alternative 2, operational emissions would be due primarily to worker vehicle travel to and from the site, as well as on-site vehicle emissions associated with maintenance activities. Table 4.2-8 shows the anticipated sources associated with facility operations.
Using the same general assumptions as described above for construction (e.g., average trip length of 15 miles), Table 4.3-2 shows the projected operational emissions associated with the Ocotillo Sol Project under Alternative 2.
TABLE 4.3-2 ALTERNATIVE 2 ESTIMATED ANNUAL OPERATIONAL GHG EMISSIONS
(METRIC TONS/YEAR)
Pollutant Ocotillo Sol Project GWP CO2E CO2 5,478 1.0 5,478 CH4 0.00 21 0.02
Total -- -- 5,478 Note: The sum of values may not equal total shown, due to rounding. CO2E=carbon dioxide equivalent

Environmental Consequences
Ocotillo Sol Project Page 4-41 Draft EIS/Draft CDCA Plan Amendment April 2012
As seen in Table 4.3-2, GHG equivalent emissions under Alternative 2 are projected to be less than 25,000 MTCO2E per year for the operation and maintenance period.
In addition to the operational sources discussed above, it is possible that the energy produced by the Ocotillo Sol solar facility would avoid the production of an equal amount of energy by a conventional (fossil fueled) power plant. Under Alternative 2, the Ocotillo Sol Project is anticipated to generate between 32,000 and 44,000 MWh per year (San Diego Gas & Electric 2012). Table 4.3-3 shows the emission factors associated with conventional (fossil fueled) energy production obtained from the CalEEMod program for the Applicant as the utility provider. Table 4.3-3 also shows the projected criteria pollutant emissions associated with the generation of 32,000 and 44,000 MWh of electricity per year.
TABLE 4.3-3 GHG EMISSIONS FROM ELECTRICAL ENERGY GENERATION BY A CONVENTIONAL
POWER PLANT
Emission Factor (pounds/MWh) Emissions GWP
CO2E
For 32,000 MWh/year CO2 780.79 11,333 1 11,333 CH4 0.029 0.4 21 8.8 N2O 0.011 0.2 310 49.5
Total 11,392 For 44,000 MWh/year
CO2 780.79 15,583 1 15,583 CH4 0.029 0.6 21 12.2 N2O 0.011 0.2 310 68.1
Total 15,663 Note: CO2E=carbon dioxide equivalent
Under Alternative 2, the net emissions in the region would likely be less than those shown in Table 4.3-2 due to operation of the Ocotillo Sol Project.
4.3.3.3 ALTERNATIVE 3
Under Alternative 3, the Applicant would construct, operate, maintain, and decommission a 100-acre solar PV facility on BLM-managed lands under an authorized ROW. The temporary ROW would be reduced to 2 acres. The 2-acre temporary ROW would provide for parking during construction of the Ocotillo Sol Project. Laydown and staging would occur within the 100-acre Ocotillo Sol Project area as construction activities progress. Because the 15-acre temporary ROW would be reduced to 2 acres, emissions associated with this alternative would be equal to or slightly less than those associated with Alternative 2 for construction. Emissions for operation and maintenance activities would be the same under Alternatives 2 and 3.

Environmental Consequences
Page 4-42 Ocotillo Sol Project Draft EIS/Draft CDCA Plan Amendment April 2012
4.3.4 CUMULATIVE IMPACTS
The existing conditions for air resources in the Ocotillo Sol Project area are described in Chapter 3, Section 3.3. This section also provides a summary of climate changes issues and effects.
It is generally agreed within the scientific community that increases in global GHG emission concentration can cause changes to current global climate conditions, which could include changes to the local climate at the project site. The specific nature of any localized climate change cannot be reasonably predicted, but could include increases or decreases in temperature and rainfall, the increase in severe weather events, or otherwise cause changes to the local climatology that could be disruptive to the existing flora and fauna, could increase surface soil loss, and could decrease agricultural productivity.
This entire GHG impact assessment is a cumulative impact assessment; there are no direct localized impacts from project-level GHG emissions. The information needed to link any particular instance of GHG emissions or sequestration to any specific climate-related environmental effects does not currently exist, and the effect of GHG emissions must be understood in the aggregate. The proposed Ocotillo Sol Project alone, or any of the project alternatives, would not be sufficient to effect global climate change, but the project would emit GHGs and, therefore, has been analyzed as a source of potential cumulative impacts in the context of long-term global impacts and existing GHG regulatory requirements and GHG energy policies. The broad integration of renewable energy, however, would allow for a sizable reduction in current GHG emission rates and could have long-term beneficial impacts in relation to climate change. Specifically, the Ocotillo Sol Project would enable GHG emission reductions, and so has been found to provide beneficial cumulative GHG impacts.
4.3.5 MITIGATION
No specific mitigation measures for GHG would be required.
4.3.6 IRREVERSIBLE AND IRRETRIEVABLE COMMITMENT OF RESOURCES
Construction and decommissioning activities for the Ocotillo Sol Project would result in negligible GHG emissions. The Ocotillo Sol Project would not result in a significant increase of GHG emissions within the region nor would it hinder attainment of the state’s goals of reducing GHG emissions to 1990 levels by 2020. As a result, it would not result in an irreversible or irretrievable commitment of air resources causing a significant increase in GHG emissions.

Environmental Consequences
Ocotillo Sol Project Page 4-43 Draft EIS/Draft CDCA Plan Amendment April 2012
4.4 GEOLOGY AND SOILS
4.4.1 MANAGEMENT GOALS
The CDCA Plan did not establish any goals for geology or soil resources.
4.4.2 TYPICAL IMPACTS FROM SOLAR ENERGY DEVELOPMENT
The Ocotillo Sol Project area is relatively flat and overall grading would be minimal to prepare the site for solar panels. No significant soil conditions were observed or are known to exist. Moreover, compaction and erosion of soil resources have the potential to occur from construction activities, maintenance activities, and decommissioning related to solar energy development.
4.4.3 IMPACTS BY ALTERNATIVE
4.4.3.1 ALTERNATIVES 1, 4, AND 5
Under Alternative 1, the Ocotillo Sol Project would not be approved by the BLM and the CDCA Plan would not be amended. The Ocotillo Sol Project would not be constructed and the BLM would continue to manage the site consistent with the CDCA Plan (1980, as amended), Yuha Basin ACEC Management Plan (1981), Yuha Desert Wildlife Habitat Management Plan (1983), Yuha Desert Management Plan (1985), and the Flat-tailed Horned Lizard Rangewide Management Strategy.
Under Alternative 4, the Ocotillo Sol Project would not be approved and no ROW grant would be issued to the Applicant. The project area would remain in its existing condition, with no construction of structures or facilities resulting in ground disturbance, and no impacts associated with the Ocotillo Sol Project would occur. Under Alternative 4, the CDCA Plan would be amended to identify the Ocotillo Sol Project area as suitable for solar energy development. As a result, a project might be proposed in the future using the same or different solar energy technology on the project site, possibly resulting in impacts similar to the proposed Ocotillo Sol Project. The impacts of such a future project, however, are speculative at this time.
Under Alternative 5, the Ocotillo Sol Project would not be approved and no ROW grant would be issued to the Applicant. The project area would remain in its existing condition, with no construction of structures or facilities resulting in ground disturbance, and no impacts associated with the Ocotillo Sol Project would occur. Under Alternative 5, the CDCA Plan would be amended to identify the Ocotillo Sol Project area as unsuitable for solar energy development.
Under Alternatives 1, 4, and 5, the project area would remain in its existing condition, with no construction of structures or facilities resulting in ground disturbance. No loss or degradation of geological and soil resources from construction, operation, or decommissioning would occur. The area would continue to be available for other uses that are consistent with the CDCA Plan,

Environmental Consequences
Page 4-44 Ocotillo Sol Project Draft EIS/Draft CDCA Plan Amendment April 2012
Yuha Basin ACEC Management Plan, and Flat-tailed Horned Lizard Rangewide Management Strategy. There would be no direct or indirect impacts to geology or soils under Alternatives 1, 4, and 5.
4.4.3.2 ALTERNATIVE 2
Under Alternative 2, the Applicant would construct, operate, maintain, and decommission a 100-acre solar PV facility on BLM-managed lands under an authorized ROW. This alternative includes a 15-acre temporary ROW that would be used as a laydown area during construction of the solar facility. Construction of the Ocotillo Sol Project would include grading, foundation excavation, trenching, and fencing. Based on the known geologic features within the Ocotillo Sol Project area, no impacts to geology are anticipated under Alternative 2.
No known faults exist on or in the immediate vicinity of the Ocotillo Sol Project area. The site is within an area that historically has experienced seismic activity due to the presence of nearby active faults capable of producing moderately high magnitude and intensity earthquakes. Structures built within the Ocotillo Sol Project area would likely experience ground shaking related to seismic activity, but any potential impact would be mitigated by incorporation of standard building practices and design recommendations from the geotechnical report. Liquefaction, another geologic hazard associated with seismic shaking, would not be significant due to the depth to groundwater and types of geologic materials reported near the Ocotillo Sol Project area. Differential settlement resulting from land subsidence, due to its regional nature, would be negligible; impacts from expansive soils would not be significant. Under Alternative 2, the proposed Ocotillo Sol Project would not result in impacts to geologic features in the area.
Almost none of the soils within a 1-mile radius of the Ocotillo Sol Project area have been or are currently being used for agricultural purposes. Active agricultural fields are present, however, approximately 1 mile downslope from the project site. Construction activities under Alternative 2 would involve grading to level the site. Erosion could occur within graded areas due to removal of vegetation and soil exposure. Soil erosion and compaction could occur due to maintenance and decommissioning activities. As outlined in Chapter 2, erosion control measures would be implemented to minimize the amount of soil erosion during construction. In addition, a SWPPP would be implemented, which would also minimize erosion potential. These measures would also be used during operation and maintenance activities, as well as decommissioning.
The incorporation of standard building practices and design recommendations from the geotechnical report would minimize any potential impacts related to faulting and seismicity. Erosion control measures, the SWPPP, and BMPs outlined under Alternative 2 in Chapter 2 would also minimize impacts to soil resources. Direct and indirect adverse impacts to soil resources within the Ocotillo Sol Project area would be negligible under Alternative 2.
4.4.3.3 ALTERNATIVE 3
Under Alternative 3, the Applicant would construct, operate, maintain, and decommission a 100-acre solar PV facility on BLM-managed lands under an authorized ROW. The 15-acre temporary ROW described under Alternative 2 would be reduced to 2 acres under Alternative 3. The 2-acre temporary ROW would provide for parking during construction of the Ocotillo Sol

Environmental Consequences
Ocotillo Sol Project Page 4-45 Draft EIS/Draft CDCA Plan Amendment April 2012
Project. Laydown and staging would occur within the 100 acres as construction activities progress. Construction under Alternative 3 would include grading, foundation excavation, trenching, and fencing. As with Alternative 2, no impacts to geologic features are anticipated and impacts to soil resources would be negligible under Alternative 3. The erosion control measures, SWPPP, and BMPs outlined under Alternative 2 in Chapter 2 would be the same under Alternative 3. Impacts related to seismic activity would the same for Alternative 3 as for Alternative 2.
4.4.4 CUMULATIVE IMPACTS
4.4.4.1 GEOGRAPHIC SCOPE
The cumulative analysis impact area for geology and soil resources is a 1-mile radius surrounding the Ocotillo Sol Project area. Potential impacts to geology and soils related to construction, operation and maintenance, and decommissioning activities from to the Applicant’s proposed Ocotillo Sol Project would be site specific and would only occur within the proposed project boundaries. The geographic scope of cumulative impact analysis, however, includes a 1-mile area surrounding the project site to incorporate projects in the vicinity to address any effects on topography, soil erosion potential, or geology.
Project or actions within the 1-mile radius include BLM actions (within BLM-administered lands) such as ongoing road maintenance and recreation designations. Other actions include Imperial Valley Substation operation and maintenance, Sunrise Powerlink, transmission and utility corridor maintenance, recreational activity, and agricultural activities. The existing conditions for geology and soils in the Ocotillo Sol Project area are described in Chapter 3, Section 3.4. Past, present, and reasonably foreseeable future projects are listed in Table 4.1-1. Projects within the cumulative analysis impact area are listed in Table 4.1-2. Reasonably foreseeable future projects could result in adverse impacts to geology and soils, primarily during construction and decommissioning activities. The combination of these projects could result in increased levels of erosion, particularly if they occur concurrently. Operation and maintenance activities are anticipated to result in minimal cumulative impacts to soils over the long term and are not anticipated to result in significant impacts. Soil resource mitigation measures will be required for all reasonably foreseeable future projects. Operation and maintenance activities for these projects are not likely to result in cumulative impacts to geology.
4.4.4.2 ALTERNATIVES 1, 4, AND 5
Based on direct and indirect impact analysis presented in Section 4.4.3, it is expected that Alternatives 1, 4, and 5 would not result in impacts to geology or soil resources. These alternatives, in combination with other reasonably foreseeable future projects, would not contribute to geology and soil resource cumulative impacts in the area.
4.4.4.3 ALTERNATIVES 2 AND 3
Alternatives 2 and 3 would result in negligible impacts to soil resources. Activities occurring on lands within a 1-mile radius of the Ocotillo Sol Project area (e.g., recreation, transmission line

Environmental Consequences
Page 4-46 Ocotillo Sol Project Draft EIS/Draft CDCA Plan Amendment April 2012
development and maintenance, and agricultural activities) have had minimal impacts to geology and soils within the Ocotillo Sol Project area, and these ongoing activities would likely continue to have minimal impacts to geology and soil resources, even when combined with potential impacts from the Ocotillo Sol Project.
Erosion control measures would be implemented during construction, operation and maintenance, and decommissioning to minimize impacts related to erosion and compaction. These measures, along with measures incorporated into present and reasonably foreseeable future projects, would minimize cumulative impacts to soil resources under Alternatives 2 and 3.
Alternatives 2 and 3 would not result in impacts to geologic resources. Alternatives 2 and 3, when combined with other reasonably foreseeable future projects, are not expected to result in cumulative impacts to geologic resources.
4.4.5 MITIGATION
The following mitigation measures for geology and soils would be implemented. The potential effects of ground shaking on any project-associated structures would be mitigated by adhering to the Uniform Building Code or the standards of care established by the Structural Engineers Association of California (EGA 2011) and the recommendations of any subsequent geotechnical investigations during final Project design.
A detailed SWPPP would be developed and implemented to minimize erosion during construction in compliance with the NPDES General Construction Permit.
4.4.6 IRREVERSIBLE AND IRRETRIEVABLE COMMITMENT OF RESOURCES
No direct or indirect impacts to geology would occur due to the Ocotillo Sol Project and no irreversible or irretrievable commitment of geological resources would occur. The Ocotillo Sol Project would result in negligible adverse impacts to soil erosion and compaction during construction, operation and maintenance, and decommissioning activities. Erosion control measures would be implemented to minimize soil erosion during construction. In addition, a SWPPP would be implemented, which would also minimize erosion potential. There would be an irreversible and irretrievable commitment of soil resources on areas where revegetation fails and subsequent erosion occurs. It is expected that these areas would be small overall and minimal, if any, erosion would occur.
Effects to soils could also occur from petroleum or other hazardous material spills. BMPs related to hazardous materials spills would be implemented and the affected area would be cleaned. If a spill occurred, affected soils would be irretrievably and irreversibly lost.

Environmental Consequences
Ocotillo Sol Project Page 4-47 Draft EIS/Draft CDCA Plan Amendment April 2012
4.5 WATER RESOURCES
4.5.1 MANAGEMENT GOALS
There are no management goals for water resources in the CDCA Plan.
4.5.2 TYPICAL IMPACTS FROM SOLAR ENERGY DEVELOPMENT
4.5.2.1 HYDROLOGY
Impacts to water resources are typically related to surface and groundwater use and quality, and changes in hydrologic function from surface alteration. Impacts to water resources are generally confined to watersheds, groundwater basins, and recharge zones.
The Ocotillo Sol Project area is largely undeveloped, with minimal recreational use. There would be few new structures (which would be relatively small), and new impervious surfaces (such as building pads) would be a relatively minor source of increased surface runoff and would not substantially change runoff characteristics. Therefore, the risk associated with potential impacts to surface water hydrology would be negligible.
4.5.2.2 SURFACE WATER QUALITY
Construction activities associated with solar field development may result in the erosion of disturbed soil from stormwater events. Development of the Applicant’s Ocotillo Sol Project, however, would not significantly alter the existing drainage patterns because grading of the project site would not require significant landform modification.
4.5.2.3 GROUNDWATER QUALITY
Development of the Applicant’s Ocotillo Sol Project would not significantly alter the existing drainage pattern of groundwater infiltration because grading of the project site would not require significant landform modification. The risk associated with potential impacts to groundwater quality or quantity is low and would not be considered adverse.
4.5.2.4 FLOODPLAINS
The Pinto Wash drainage area located south of the Ocotillo Sol Project area may be subject to flash floods during heavy rainstorms. Flash floods could cause damage to roads or other structures developed within the solar field. The Ocotillo Sol Project has been sited to avoid the Pinto Wash drainage area. Under the action alternatives, very few acres would be paved for building pads and land needed for solar panel placement. Overland flow would not likely be increased and would not contribute to flash flood potential in the area.

Environmental Consequences
Page 4-48 Ocotillo Sol Project Draft EIS/Draft CDCA Plan Amendment April 2012
4.5.2.5 WATER SUPPLY
The Ocotillo Sol Project area is relatively flat with a topographical drainage feature, Pinto Wash, near the southeast corner of the project site. None of the project development intersects this wash; flooding due to precipitation would not result in significant impact to the structures within the Ocotillo Sol Project area.
The amount of water required for the development of the Ocotillo Sol Project has been estimated to be approximately 150 acre-feet for construction activities, and approximately 1,350 gal of potable water for construction personnel uses. For operation and maintenance (primarily panel washing), water use is estimated to be between 1 and 2 acre-feet of water per year. Potential water sources include the Imperial Irrigation District and municipal sources. Groundwater would not be extracted from beneath the project site under any alternative.
4.5.3 IMPACTS BY ALTERNATIVE
4.5.3.1 ALTERNATIVES 1, 4, AND 5
Under Alternative 1, the Ocotillo Sol Project would not be approved by the BLM and the CDCA Plan would not be amended. The Ocotillo Sol Project would not be constructed and the BLM would continue to manage the site consistent with the CDCA Plan (1980, as amended), Yuha Basin ACEC Management Plan (1981), Yuha Desert Wildlife Habitat Management Plan (1983), Yuha Desert Management Plan (1985), and the Flat-tailed Horned Lizard Rangewide Management Strategy.
Under Alternative 4, the Ocotillo Sol Project would not be approved and no ROW grant would be issued to the Applicant. The project area would remain in its existing condition, with no construction of structures or facilities resulting in ground disturbance, and no impacts associated with the Ocotillo Sol Project would occur. Under Alternative 4, the CDCA Plan would be amended to identify the Ocotillo Sol Project area as suitable for solar energy development. As a result, a project might be proposed in the future using the same or different solar energy technology on the project site, possibly resulting in impacts similar to the proposed Ocotillo Sol Project. The impacts of such a future project, however, are speculative at this time.
Under Alternative 5, the Ocotillo Sol Project would not be approved and no ROW grant would be issued to the Applicant. The project area would remain in its existing condition, with no construction of structures or facilities resulting in ground disturbance, and no impacts associated with the Ocotillo Sol Project would occur. Under Alternative 5, the CDCA Plan would be amended to identify the Ocotillo Sol Project area as unsuitable for solar energy development.
Under Alternatives 1, 4, and 5, the project area would remain in its existing condition, with no construction of structures or facilities resulting in ground disturbance. No loss or degradation of water resources from construction, operation, or decommissioning would occur. There would be no direct or indirect impacts to water resources under Alternatives 1, 4, and 5.

Environmental Consequences
Ocotillo Sol Project Page 4-49 Draft EIS/Draft CDCA Plan Amendment April 2012
4.5.3.2 ALTERNATIVE 2
Under Alternative 2, the Applicant would construct, operate, maintain, and decommission a 100-acre solar PV facility on BLM-managed lands under an authorized ROW. This alternative includes a 15-acre temporary ROW that would be used as a laydown area during construction of the solar facility. Construction of the Applicant’s Ocotillo Sol Project would include grading, foundation excavation, trenching, and fencing.
The Ocotillo Sol Project area is within a relatively flat desert area with drainage to the northeast and east. Pinto Wash, located southeast of the site, is a well-defined ephemeral desert wash conveying seasonal runoff. Due to site topography and SWPPP measures that will be implemented prior to construction, impacts to site structures resulting from flooding or erosion due to seasonal surface water runoff to Pinto Wash and conveyance of water within the wash would be minimal, if any. The Ocotillo Sol Project area is also outside of the area that would experience a 100-year flood event. The Ocotillo Sol Project would be designed in compliance with all water quality standards or waste discharge requirements. Additionally, potential impacts due to surface water runoff and quality would be mitigated by implementation of BMPs as part of a SWPPP, in compliance with the NPDES Construction Permit requirements. The estimated water requirements for the Ocotillo Sol Project would be met by importation from water sources, such as the Imperial Irrigation District and municipal sources. Groundwater resources at or near the Ocotillo Sol Project area are limited, vary in quality, and are not proposed to be used. As a result, there are no direct or indirect impacts to water resources under Alternative 2.
No drainages, wetlands, or other topographical or hydrological features with potential to be subject to USACE, RWQCB, or CDFG jurisdiction were observed within the 115-acre Ocotillo Sol Project area. No evidence of streambed and banks as defined by CDFG was observed within the project area, nor were any defined channels observed that would be subject to agency jurisdiction. No impacts to USACE, RWQCB, or CDFG jurisdictional waters would occur under Alternative 2.
4.5.3.3 ALTERNATIVE 3
Under Alternative 3, the Applicant would construct, operate, maintain, and decommission a 100-acre solar PV facility on BLM-managed lands under an authorized ROW. The 15-acre temporary ROW described under Alternative 2 would be reduced to 2 acres under Alternative 3. The 2-acre temporary ROW would provide for parking during construction of the Ocotillo Sol Project. Laydown and staging would occur within the 100 acres as construction activities progress. The direct or indirect impacts to water resources under Alternative 3 would be the same or slightly less than Alternative 2.
4.5.4 CUMULATIVE IMPACTS
4.5.4.1 GEOGRAPHIC SCOPE
The cumulative analysis impact area for water resources is the West Mesa groundwater recharge area, within the Imperial Valley Groundwater Basin, of the Ocotillo Sol Project area. Any water used within the project site during construction (e.g., dust control) or maintenance (e.g., panel

Environmental Consequences
Page 4-50 Ocotillo Sol Project Draft EIS/Draft CDCA Plan Amendment April 2012
washing) that does not evaporate on the ground could potentially be absorbed into the groundwater basin. Minimal water use would be required for the Applicant’s proposed Ocotillo Sol Project and no water is likely to reach the Imperial Valley Groundwater Basin.
The existing condition for water resources in the Ocotillo Sol Project area, which represents the aggregate effect of past and present actions impacting water resources, is described in Chapter 3, Section 3.5.2. All the projects described in Table 4.1-1 would fall within the geographic scope for water resource cumulative impacts. The reasonably foreseeable future projects listed in Table 4.1-1 are likely to have minimal adverse impacts on water resources. These projects are anticipated to use minimal, if any, groundwater. These projects would likely result in impacts to surface water and drainage patterns; however, these impacts would be mitigated and are not likely to be cumulatively significant in the area. Reasonably foreseeable future projects are not likely to impact groundwater or water and drainage during operation and maintenance as these activities would occur within previously disturbed areas and require minimal, if any, groundwater resources. Agricultural activities in the area use Colorado River water supplied through a network of canals, not groundwater resources, and would not contribute to cumulative impacts to groundwater resources or surface water and drainage patterns.
4.5.4.2 ALTERNATIVES 1, 4, AND 5
Based on direct and indirect impact analysis presented in Section 4.5.3, it is expected that Alternatives 1, 4, and 5 would not result in impacts to water resources. These alternatives, in combination with other reasonably foreseeable future projects, would not contribute to cumulative impacts to water resources in the groundwater basin.
4.5.4.3 ALTERNATIVES 2 AND 3
Alternatives 2 and 3 would not result in direct or indirect impacts to water resources. Existing and reasonably foreseeable projects occurring on lands within the ground water basin (e.g., renewable energy projects, recreation, transmission line development and maintenance, and agricultural activities) have had minimal impacts to ground water resources. Therefore, these ongoing activities, in combination with Alternatives 2 and 3, would likely continue to have minimal cumulative impacts on water resources.
Mitigation measures in the form of a SWPPP and erosion control measures (described below in Section 4.5.5) would be implemented during construction, operation and maintenance, and decommissioning to minimize impacts to water resources. Alternatives 2 and 3, when added to other reasonably foreseeable future projects, are not expected to result in cumulative impacts to water resources.
4.5.5 MITIGATION
Although no direct or indirect impacts to water resources are anticipated as a result of construction, operation and maintenance, and decommissioning of the proposed Ocotillo Sol Project under Alternatives 2 or 3, several standard mitigation measures would be employed to ensure impacts to water resource are avoided. The measures would include the following:

Environmental Consequences
Ocotillo Sol Project Page 4-51 Draft EIS/Draft CDCA Plan Amendment April 2012
• Development and implementation of a SWPPP as required by the State General Construction Activity Storm Water Permit. The SWPPP would include:
o a detailed description of all BMPs that would be employed; o an outline of the areas onsite that would be disturbed during the construction project; o an outline of all areas that would be stabilized by temporary or permanent erosion
control measures; and o a proposed schedule for the implementation of erosion control measures.
• Surface waters (canals/drains) and wells within 1,000 feet of construction activities would be identified. Construction activities would not be carried out within 100 feet of these resources without using BMPs.
• The use or storage of hazardous material near a canal, drain, or well would be prohibited. Additionally, special precautions would be implemented to prevent spills of hazardous materials, discharges of foreign materials, and sedimentation discharges near a canal, drain, or well.
4.5.6 IRREVERSIBLE AND IRRETRIEVABLE COMMITMENT OF RESOURCES
No direct or indirect impacts to water resources would occur due to the Ocotillo Sol Project and no irreversible or irretrievable commitment of water resources would occur. By implementing the mitigation measures identified above, and by avoiding groundwater extraction from beneath the project site, no unavoidable adverse impacts to water resources are expected to occur under any of the alternatives.

Environmental Consequences
Page 4-52 Ocotillo Sol Project Draft EIS/Draft CDCA Plan Amendment April 2012
4.6 BIOLOGICAL RESOURCES
Biological resources within the Ocotillo Sol Project area would be susceptible to direct and indirect adverse impacts from surface disturbing activities, construction activities, and operation and maintenance. These impacts could lead to the disturbance, destruction, or loss of biological resources. Measures to minimize potential disturbance of biological resources as outlined below would avoid, minimize, or compensate for those impacts to prevent the reduction of habitats and special status species’ populations to an unsustainable level.
This section is organized as follows: separate direct and indirect impact analyses are provided for vegetation (including noxious, invasive, non-native weeds) and wildlife resources (including jurisdictional waters); cumulative impacts analysis and mitigation measures for vegetation and wildlife resources follow the impact analysis by alternative; the section concludes with a discussion of irreversible and irretrievable commitment of resources for vegetation and wildlife resources.
4.6.1 VEGETATION RESOURCES
4.6.1.1 MANAGEMENT GOALS
4.6.1.1.1 Management Goals for Vegetation The BLM management goals for vegetation from the CDCA Plan, as amended, are outlined below:
• Maintain the productivity of the vegetative resource while meeting the consumptive needs of wildlife, livestock, wild horses and burros, and man. Provide for such uses under principles of sustained yield.
• Manage plant species on the federal and state lists of threatened and endangered species and their habitats, so that the continued existence of each will not be jeopardized. Stabilize and, where possible, improve populations through management and recovery plans developed and implemented cooperatively with the USFWS and the CDFG.
• Manage plant species that BLM has officially designated as sensitive for California and their habitats, so that the potential for federal or state listing is minimized. Include consideration of sensitive species habitats in all decisions, so that impacts are avoided, mitigated, or compensated.
• Manage unusual plant assemblages, so that their continued existence is maintained. In all actions, include consideration of unusual plant assemblages, so that impacts are avoided, mitigated, or compensated.
• Manage wetland and riparian areas in the CDCA with the following specific objectives: a) avoid the long-term and short-term impacts associated with the destruction, loss, or degradation of wetland and riparian area; b) preserve and enhance the natural and beneficial values of wetland and riparian areas which may include constraining or excluding those uses that would cause significant long-term ecological damage; c) include practical measures to minimize harm in all actions causing adverse impacts on wetlands and riparian areas; and

Environmental Consequences
Ocotillo Sol Project Page 4-53 Draft EIS/Draft CDCA Plan Amendment April 2012
d) retain all wetlands and riparian habitats presently under BLM administration wherever high resource values exist and adverse impacts cannot be mitigated.
• Accomplish the objectives of other resources by altering plant composition, density, and/or cover. Objectives include eliminating harmful or noxious plants, increasing livestock or wildlife forage production, and improving wildlife habitat characteristics. Diversified native plant communities are favored over monocultures or communities based on non-native species.
4.6.1.1.2 Management Goals for Noxious, Invasive, and Non-native Weeds The primary management goal related to noxious, invasive, and non-native weeds is to eliminate these harmful species to increase livestock or wildlife forage production, and improve wildlife habitat characteristics. Diversified native plant communities are favored over monocultures or communities based on non-native species.
4.6.1.2 TYPICAL IMPACTS FROM SOLAR ENERGY DEVELOPMENT
4.6.1.2.1 Impacts to Vegetative Resources Impacts from solar energy development could occur to terrestrial vegetation, priority plant species, and desired plant communities from the following: 1) direct loss of vegetative resource; 2) increase in non-native invasive species; and 3) change in cover species composition and structure, including density and vegetation.
Impacts on vegetation could include:
• A net loss in the functional habitat value of a sensitive biological habitat
• Disturbance of a substantial portion of a vegetation type within the local region to the point where natural or enhanced regeneration would not restore the resource to pre-disturbance conditions in at least three years
• The introduction of new (or contributing to the expanded range of existing) noxious, invasive, non-native weed species or soil pests, so that they substantially interfere with successful revegetation
• An adverse effect on a species, special status plant, natural community, or habitat that is recognized specifically as biologically significant in local, state, or federal policies, statutes, or regulations
• Adverse impacts to vegetation, riparian habitat, special status plants, or sensitive natural communities from the construction of building pads, grading activities, transmission lines, other generation or transmission facilities, and any temporary extra workspace. The impacts to vegetation from these activities would depend on the scale, intensity, duration, and permanence of construction activities. Potential adverse impacts could include direct mortality, loss of plant habitat, plant injury, alteration of plant community structure and community fragmentation, invasive species introduction, soil compaction and erosion, and dust, which could decrease plant photosynthesis.

Environmental Consequences
Page 4-54 Ocotillo Sol Project Draft EIS/Draft CDCA Plan Amendment April 2012
4.6.1.2.2 Impacts Related to Noxious, Invasive, and Non-Native Weeds The Final Environmental Impact Report/Environmental Assessment for the Imperial Solar Energy Center South (BLM and Imperial County 2011) describes the potential impacts due to the noxious, invasive, and non-native weeds occurring in and adjacent to their proposed solar facility. The spread of invasive and noxious weeds poses a threat to natural resources by displacing native plant species, increasing the threat of wildfires, supplanting natural food for wildlife, and altering the structure and ecological functions of natural habitats (BLM and Imperial County 2011). Construction activities and soil disturbance can facilitate the introduction and/or spread of invasive, noxious, and/or non-native plant species. New introductions may occur when seed is inadvertently brought into an area, most often in mulch, straw wattles, hay bales, and seed mixes used for erosion control. Seed may also be introduced into an area by transport on construction equipment or vehicle tires. Additionally, construction activities can result in the proliferation and spread of weed species that may already be present in the area because of grading and other site disturbances that alter the natural vegetation and disrupt the soils (BLM and Imperial County 2011).
The solar panels also have the potential to facilitate the growth and spread of weed species by altering the natural hot, dry conditions typical of the project area. Increased shading of the ground results in cooler moister areas that may favor colonization of weedy species (Smith 1984). Additionally, routine washing of the solar panels increases soil moisture availability.
4.6.1.3 IMPACTS BY ALTERNATIVE
4.6.1.3.1 Alternatives 1, 4, and 5 Under Alternative 1, the Ocotillo Sol Project would not be approved by the BLM and the CDCA Plan would not be amended. The Ocotillo Sol Project would not be constructed and the BLM would continue to manage the site consistent with the CDCA Plan (1980, as amended), Yuha Basin ACEC Management Plan (1981), Yuha Desert Wildlife Habitat Management Plan (1983), Yuha Desert Management Plan (1985), and the Flat-tailed Horned Lizard Rangewide Management Strategy.
Under Alternative 4, the Ocotillo Sol Project would not be approved and no ROW grant would be issued to the Applicant. The project area would remain in its existing condition, with no construction of structures or facilities resulting in ground disturbance, and no impacts associated with the Ocotillo Sol Project would occur. Under Alternative 4, the CDCA Plan would be amended to identify the Ocotillo Sol Project area as suitable for solar energy development. As a result, a project might be proposed in the future using the same or different solar energy technology on the project site, possibly resulting in impacts similar to the proposed Ocotillo Sol Project. The impacts of such a future project, however, are speculative at this time.
Under Alternative 5, the Ocotillo Sol Project would not be approved and no ROW grant would be issued to the Applicant. The project area would remain in its existing condition, with no construction of structures or facilities resulting in ground disturbance, and no impacts associated with the Ocotillo Sol Project would occur. Under Alternative 5, the CDCA Plan would be amended to identify the Ocotillo Sol Project area as unsuitable for solar energy development.

Environmental Consequences
Ocotillo Sol Project Page 4-55 Draft EIS/Draft CDCA Plan Amendment April 2012
Vegetation Resources
Under Alternatives 1, 4, and 5, the project area would remain in its existing condition, with no construction of structures or facilities resulting in ground disturbance. No loss or disturbance of vegetation, riparian habitat, special status plants, or sensitive natural communities from construction, operation, or decommissioning of the Ocotillo Sol Project would occur. Under Alternatives 1, 2, and 5, no direct or indirect adverse impacts to vegetation would occur.
Noxious, Invasive, or Non-native Weeds
Under Alternatives 1, 4, and 5, no direct or indirect adverse impacts from noxious, invasive, or non-native weed species would be expected to occur. No Weed Management Plan would be required to offset the potential spread of noxious, invasive, non-native weed species under these alternatives.
4.6.1.3.2 Alternative 2 Vegetation Resources
Under Alternative 2, the Applicant’s proposed Ocotillo Sol Project, the Applicant would construct, operate, maintain, and decommission a 100-acre solar PV facility on BLM-managed lands pursuant to a ROW grant (see Figure 2-3 in Appendix A). In addition, this alternative includes a 15-acre temporary ROW to be used as a laydown area during construction of the solar facility. Under Alternative 2, BLM would amend the CDCA Plan to identify all 115 acres as suitable for solar development and allow solar development on this land. Within the Ocotillo Sol Project area, the solar field, operation and maintenance building, laydown area, and the switchyard would occupy nearly the entire site. About 74 percent of the 115-acre ROW (86 acres) would be used for the solar panels, and the remaining acreage would be used for internal access roads, power lines, switchgear, an operation and maintenance building (together approximately 14 acres), and the temporary laydown area (15 acres).
Permanent impacts to the 100 acres of creosote bush–white burr sage scrub vegetation would occur. The area would remain un-vegetated after the facility is constructed and during its entire operation period. No other vegetation community would be disturbed or removed within the 100-acre construction area. The 100-acre solar field would be reclaimed after operations are terminated. The 15-acre temporary laydown area would be considered a temporary impact to creosote bush–white burr sage scrub vegetation, and the laydown area would be revegetated to repair impacts to the habitat after construction is complete.
Vegetation communities are also protected if they provide habitat for sensitive wildlife species. Although the creosote bush–white burr sage scrub is typically not considered a sensitive natural community, the vegetation within the Ocotillo Sol Project area is located within a flat-tailed horned lizard management area and has been determined to be occupied by the flat-tailed horned lizard. Impacts within the flat-tailed horned lizard management area are discouraged unless unavoidable impacts can be mitigated consistent with the Flat-tailed Horned Lizard Rangewide Management Strategy (see discussion below).

Environmental Consequences
Page 4-56 Ocotillo Sol Project Draft EIS/Draft CDCA Plan Amendment April 2012
Removal of creosote bush–white burr sage scrub vegetation may affect flat-tailed horned lizard, burrowing owl, and other wildlife species that rely on the creosote bush–white burr sage scrub vegetation. Discussion of these impacts is discussed in Section 4.6.2 below.
In addition, soil disturbed due to grading during construction and continued use of the access road to the Ocotillo Sol Project area may result in the introduction or increased density of non-native invasive plant species. These species can undermine the habitat quality and integrity of the native plant communities. Alternative 2 would result in direct and indirect adverse impacts to vegetation resources and the creosote bush–white burr sage scrub sensitive natural community. Mitigation measures detailed in Section 4.6.4 below would be implemented to minimize or compensate for these impacts.
One target plant species, Thurber’s pilostyles, was found within the 350-acre biological resource spring survey area but outside the 115-acre project footprint, as seen in Figure 4.6-1 (see Appendix A). Based on the level of disturbance within the survey area and the results of the focused rare plant surveys, no special status plant species are expected to occur within the 115-acre maximum project footprint. Thus, no impacts to special status plant species are anticipated under all alternatives, and no mitigation would be required.
Noxious, Invasive, or Non-native Weeds
Under Alternative 2, 100 acres of permanent and 15 acres of temporary impacts would occur that may result in the spread of noxious, invasive, or non-native weed species. Soil disturbed due to grading during construction and continued use of the Ocotillo Sol Project area could result in the introduction or increased density of non-native invasive plant species.
To reduce the potential for the introduction and spread of non-native invasive plant species under Alternative 2, a Weed Management Plan (see Section 4.6.4 and Appendix D) has been prepared and would be implemented during both the construction and general operation and maintenance phases of the project, within and adjacent to the solar field as a mitigation measure.
4.6.1.3.3 Alternative 3 Vegetation Resources
Alternative 3 would be the same as Alternative 2 except that it would be modified to reduce new impacts to the Yuha Desert. The temporary construction laydown area described under Alternative 2 would be reduced to 2 acres under Alternative 3. Alternative 3 would require the Applicant to manage laydown and staging within the 100-acre Ocotillo Sol Project area as construction activities progress. The 2-acre temporary laydown area would be used for construction workforce parking. Under Alternative 3, impacts to vegetation resources would be similar to, but slightly less than, those discussed under Alternative 2. As with Alternative 2, mitigation measures detailed in Section 4.6.4 below would be implemented to minimize or compensate for impacts under Alternative 3.

Environmental Consequences
Ocotillo Sol Project Page 4-57 Draft EIS/Draft CDCA Plan Amendment April 2012
Noxious, Invasive, or Non-native Weeds
Under Alternative 3, 100 acres of permanent and 2 acres of temporary impacts would occur that may result in the spread of noxious, invasive, or non-native weed species. Soil disturbed due to grading during construction and continued use of the Ocotillo Sol Project area could result in the introduction or increased density of non-native invasive plant species.
To reduce the potential for the introduction and spread of non-native invasive plant species under Alternatives 2 and 3, a Weed Management Plan (see Section 4.6.4 and Appendix D) has been prepared and would be implemented during both the construction and general operation and maintenance phases of the project, within and adjacent to the solar field as a mitigation measure.
4.6.2 WILDLIFE RESOURCES
4.6.2.1 MANAGEMENT GOALS
Through the Wildlife Element of the CDCA Plan, the BLM has developed the following five goals for managing and promoting wildlife resources, as well as special status species and their habitats:
1. Avoid, mitigate, or compensate for impacts of conflicting uses on wildlife populations and habitats. Promote wildlife populations through habitat enhancement projects so balanced ecosystems are maintained and wildlife abundance provides for human enjoyment.
2. Develop and implement detailed plans to provide special management for: 1) areas that contain rare or unique habitat; 2) areas with habitat sensitive to conflicting uses; 3) areas with habitat especially rich in wildlife abundance or diversity; and 4) areas that are good representatives of common habitat types. Many areas falling into these categories contain listed species, which, as indicator species, may become the focus of management.
3. Manage wildlife species on the federal and state lists of threatened and endangered species and their habitats so their continued existence is not jeopardized. Stabilize and, where possible, improve populations through management and recovery plans developed and implemented cooperatively with the USFWS and the CDFG.
4. Manage wildlife species officially designated as sensitive by the BLM for California and their habitats so the potential for federal or state listing is minimized.
5. Include consideration of crucial habitats of sensitive species in all decisions so impacts are avoided, mitigated, or compensated.
4.6.2.2 TYPICAL IMPACTS FROM SOLAR ENERGY DEVELOPMENT TO WILDLIFE RESOURCES
Solar field construction activities could cause the following impacts to wildlife resources:
• Result in adverse impacts to special status species by direct mortality, disturbance, and habitat degradation or loss
• Increase in surrounding noise levels
• Change in wildlife migrating and wintering patterns

Environmental Consequences
Page 4-58 Ocotillo Sol Project Draft EIS/Draft CDCA Plan Amendment April 2012
• Soil contamination
• Electrocution from exposed transmission lines
• Wildlife movement corridor loss or disruption
• Obstacles to collide with (e.g., pipelines and well drilling structures)
4.6.2.3 IMPACTS TO WILDLIFE RESOURCES BY ALTERNATIVE
4.6.2.3.1 Alternatives 1, 4, and 5 Under Alternative 1, the Ocotillo Sol Project would not be approved by the BLM and the CDCA Plan would not be amended. The Ocotillo Sol Project would not be constructed and the BLM would continue to manage the site consistent with the CDCA Plan (1980, as amended), Yuha Basin ACEC Management Plan (1981), Yuha Desert Wildlife Habitat Management Plan (1983), Yuha Desert Management Plan (1985), and the Flat-tailed Horned Lizard Rangewide Management Strategy.
Under Alternative 4, the Ocotillo Sol Project would not be approved and no ROW grant would be issued to the Applicant. The project area would remain in its existing condition, with no construction of structures or facilities resulting in ground disturbance, and no impacts associated with the Ocotillo Sol Project would occur. Under Alternative 4, the CDCA Plan would be amended to identify the Ocotillo Sol Project area as suitable for solar energy development. As a result, a project might be proposed in the future using the same or different solar energy technology on the project site, possibly resulting in impacts similar to the proposed Ocotillo Sol Project. The impacts of such a future project, however, are speculative at this time.
Under Alternative 5, the Ocotillo Sol Project would not be approved and no ROW grant would be issued to the Applicant. The project area would remain in its existing condition, with no construction of structures or facilities resulting in ground disturbance, and no impacts associated with the Ocotillo Sol Project would occur. Under Alternative 5, the CDCA Plan would be amended to identify the Ocotillo Sol Project area as unsuitable for solar energy development.
Under Alternatives 1, 4, and 5, no direct or indirect adverse impacts to wildlife or special status species would occur.
4.6.2.3.2 Alternative 2 Under Alternative 2, the Applicant would construct, operate, maintain, and decommission a 100-acre solar PV facility on BLM-managed lands under an authorized ROW. This alternative includes a 15-acre temporary ROW that would be used as a laydown area during construction of the solar facility. Construction of the Ocotillo Sol Project would include grading, foundation excavation, trenching, and fencing. Under Alternative 2, 100 acres of permanent and 15 acres of temporary impacts to wildlife habitat, including impact to habitat of the following special status species:
• Flat-tailed horned lizard (BLM Sensitive, California Species Special Concern)
• Burrowing owl (BLM Sensitive, California Species of Special Concern)
• Colorado Desert fringe-toed lizard (BLM Sensitive, California Species of Special Concern)
• Loggerhead shrike (California Species of Special Concern)
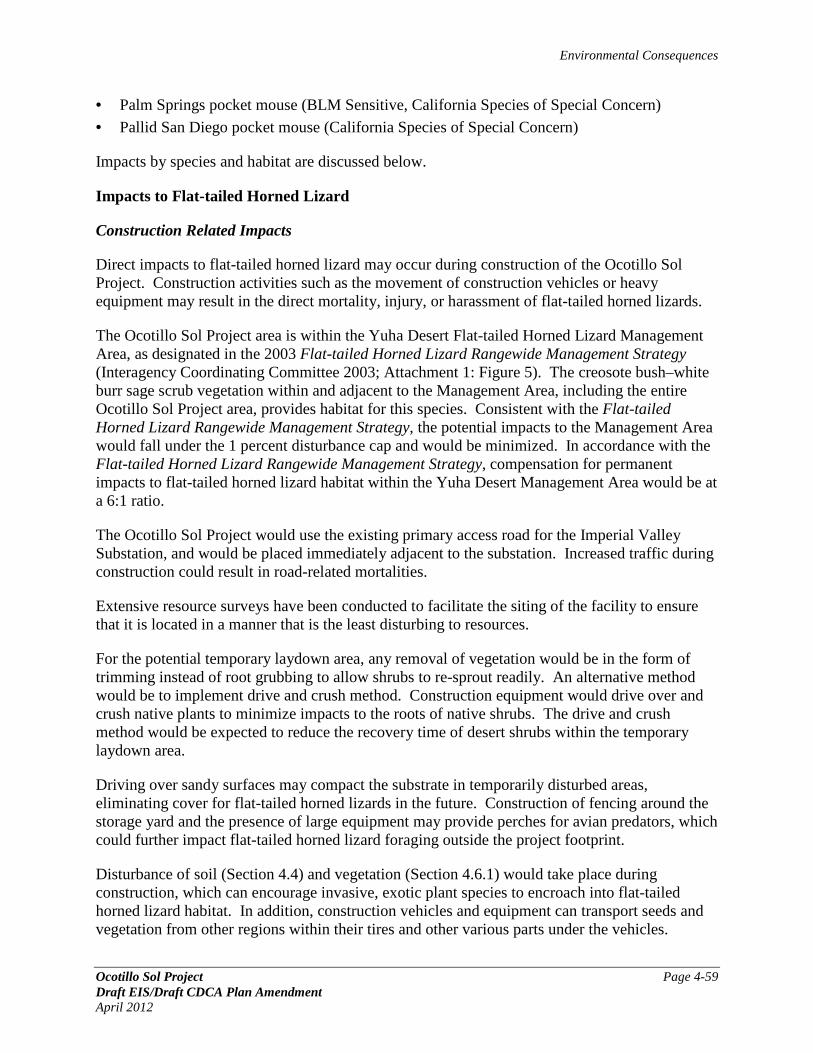
Environmental Consequences
Ocotillo Sol Project Page 4-59 Draft EIS/Draft CDCA Plan Amendment April 2012
• Palm Springs pocket mouse (BLM Sensitive, California Species of Special Concern)
• Pallid San Diego pocket mouse (California Species of Special Concern)
Impacts by species and habitat are discussed below.
Impacts to Flat-tailed Horned Lizard
Construction Related Impacts
Direct impacts to flat-tailed horned lizard may occur during construction of the Ocotillo Sol Project. Construction activities such as the movement of construction vehicles or heavy equipment may result in the direct mortality, injury, or harassment of flat-tailed horned lizards.
The Ocotillo Sol Project area is within the Yuha Desert Flat-tailed Horned Lizard Management Area, as designated in the 2003 Flat-tailed Horned Lizard Rangewide Management Strategy (Interagency Coordinating Committee 2003; Attachment 1: Figure 5). The creosote bush–white burr sage scrub vegetation within and adjacent to the Management Area, including the entire Ocotillo Sol Project area, provides habitat for this species. Consistent with the Flat-tailed Horned Lizard Rangewide Management Strategy, the potential impacts to the Management Area would fall under the 1 percent disturbance cap and would be minimized. In accordance with the Flat-tailed Horned Lizard Rangewide Management Strategy, compensation for permanent impacts to flat-tailed horned lizard habitat within the Yuha Desert Management Area would be at a 6:1 ratio.
The Ocotillo Sol Project would use the existing primary access road for the Imperial Valley Substation, and would be placed immediately adjacent to the substation. Increased traffic during construction could result in road-related mortalities.
Extensive resource surveys have been conducted to facilitate the siting of the facility to ensure that it is located in a manner that is the least disturbing to resources.
For the potential temporary laydown area, any removal of vegetation would be in the form of trimming instead of root grubbing to allow shrubs to re-sprout readily. An alternative method would be to implement drive and crush method. Construction equipment would drive over and crush native plants to minimize impacts to the roots of native shrubs. The drive and crush method would be expected to reduce the recovery time of desert shrubs within the temporary laydown area.
Driving over sandy surfaces may compact the substrate in temporarily disturbed areas, eliminating cover for flat-tailed horned lizards in the future. Construction of fencing around the storage yard and the presence of large equipment may provide perches for avian predators, which could further impact flat-tailed horned lizard foraging outside the project footprint.
Disturbance of soil (Section 4.4) and vegetation (Section 4.6.1) would take place during construction, which can encourage invasive, exotic plant species to encroach into flat-tailed horned lizard habitat. In addition, construction vehicles and equipment can transport seeds and vegetation from other regions within their tires and other various parts under the vehicles.

Environmental Consequences
Page 4-60 Ocotillo Sol Project Draft EIS/Draft CDCA Plan Amendment April 2012
Operation and Maintenance Impacts
General operation and maintenance activities that may be conducted within flat-tailed horned lizard or adjacent to habitat include equipment inspection and/or repairs, panel washing, maintenance or inspection vehicles driving within the solar facility, and weed abatement or habitat restoration activities. Flat-tailed horned lizard injury or mortality could potentially occur due to any of these activities.
Construction of fencing around the generation facility may provide perches for avian predators, which could further impact flat-tailed horned lizard foraging outside the project footprint.
Occasional maintenance and/or inspections may be required within the solar facility. Operation and maintenance vehicles and equipment can transport seeds and vegetation from other regions within their tires and other various parts under the vehicles.
Impact Determination
Alternative 2 would result in adverse impacts to flat-tailed horned lizard. Conservation and mitigation measures outlined in Section 4.6.4 below would be implemented to avoid, minimize, and/or compensate for impacts under this alternative. In accordance with the Flat-tailed Horned Lizard Rangewide Management Strategy, compensation for permanent impacts to flat-tailed horned lizard habitat within the Yuha Desert Wildlife Management Area would be at a 6:1 ratio.
Impacts to Burrowing Owl
In accordance with the 2012 CDFG’s Staff Report on Burrowing Owl Mitigation, the following are examples of activities that have the potential to take burrowing owls, their nests or eggs, or destroy or degrade burrowing owl habitat: grading, disking, cultivation, earthmoving, burrow blockage, heavy equipment compacting and crushing burrow tunnels, levee maintenance, flooding, burning and mowing (if burrows are impacted), and operating wind turbine collisions. In addition, the following activities may have impacts to burrowing owl populations: eradication of host burrowers; changes in vegetation management (i.e. grazing); use of pesticides and rodenticides; destruction, conversion or degradation of nesting, foraging, over-wintering or other habitats; destruction of natural burrows and burrow surrogates; and disturbance which may result in harassment of owls at occupied burrows.
Construction Impacts
The creosote bush–white burr sage scrub vegetation within the Ocotillo Sol Project area provides habitat for burrowing owl. During the rare plant survey in late March 2010, one burrowing owl individual was observed near a burrow with owl sign near the center of the survey area.
Construction of the Ocotillo Sol Project is expected to last 8 to 11 months; therefore, some aspect of construction would occur during all or part of the burrowing owl breeding season. If burrowing owls are present within the project area prior to or during construction, direct impacts could potentially occur to burrowing owl individuals and/or active burrowing owl burrows during grading, vegetation clearing, and other construction activities. In addition, indirect impacts such as noise and vibrations from construction equipment may disturb or disrupt

Environmental Consequences
Ocotillo Sol Project Page 4-61 Draft EIS/Draft CDCA Plan Amendment April 2012
burrowing owl nesting behavior if construction occurs within 500 meters of an active burrow during breeding season for the burrowing owl. To avoid, minimize, and compensate for potential construction impacts to burrowing owl, mitigation measures are outlined in Section 4.6.4.
Operation and Maintenance Impacts
After construction of the solar field is complete, burrowing owl are expected to persist along and outside the perimeter of the solar facility for foraging. The owls are also expected to use the solar field perimeter fence as a foraging perch. Raptors species, including burrowing owl predators, may also perch on the perimeter fence.
Direct impacts to burrowing owls may occur during operation and maintenance activities within the solar field. Vehicles driving on access roads where burrowing owls are foraging may result in the direct mortality, injury, or harassment of this species.
After the solar field is constructed, burrowing owls are unlikely to forage within the solar facility and other areas underneath the solar panels due to the lack of vegetation and gravel surface (that discourages burrowing owls and their arthropod prey base) that will be maintained. If foraging within the solar facility occurs, given the static and highly visible nature of the solar panels, burrowing owls are not expected to collide with the structures during daytime foraging activities when they may be hovering or flying in search for prey. When foraging at night, they are not expected to collide with facility structures given their walking/hopping manner of foraging (Coulombe 1971), coupled with the static and highly visible nature of the solar panels. No impacts to burrowing owl are anticipated due to collision with facility structures, and no mitigation would be required.
All permanent lighting within the solar field would be by low-profile fixtures that point inward toward the solar field with directional hoods or shades to reduce light from shining into the adjacent lands. In addition, any lighting not required daily for security purposes would have motion sensor or temporary use capabilities. No impacts due to lighting are expected to occur to this species.
No equipment or component of the solar field is expected to produce noise that would exceed ambient noise in the vicinity. No impacts due to noise are expected to occur to this species.
Impact Determination
Alternative 2 would result in adverse impacts to burrowing owl. Conservation and mitigation measures outlined in Section 4.6.4 below would be implemented to avoid, minimize, and/or compensate for impacts under this alternative.
Impacts to Raptors
Construction Impacts
The creosote bush–white burr sage scrub within the Ocotillo Sol Project area may provide foraging habitat for a variety of raptors. No direct impacts to tree nesting raptors, including

Environmental Consequences
Page 4-62 Ocotillo Sol Project Draft EIS/Draft CDCA Plan Amendment April 2012
golden eagles, are expected to occur due to the lack of tall trees and structures within the Ocotillo Sol Project area. The transmission towers east of the Ocotillo Sol Project area do provide nesting and perching opportunities. If initial grading and construction occurs between February 1 and July 15, impacts to an active raptor nest may occur. Mitigation measures outlined in Section 4.6.4 would reduce impacts to raptors.
Operation and Maintenance Indirect Impacts
Electrocution
The Avian Powerline Interaction Committee’s (APLIC) 1996 report on power line electrocution in the U.S. reports that avian electrocution risk is highest along distribution lines (generally less than 69 kV) where the distance between energized phases, ground wires, transformers, and other components of an electrical distribution system are less than the length or skin-to-skin contact distance of birds. The distance between energized components along transmission lines (>69 kV) is generally insufficient to present avian electrocution risk (APLIC 1996 as cited in California Energy Commission [CEC] 2002a).
No impacts to raptors, including golden eagles, are expected to occur due to electrocution within the solar field, and no mitigation would be required.
Collision
Potential indirect impacts to raptors and other avian species due to collision with the solar facility are discussed below under the Migratory Birds subsection.
Impacts to Migratory Birds
“Take” of a migratory bird species, which includes unintentionally killing adult birds or destroying active nests, would be considered a violation of the MBTA. Migratory bird species include special status species that may nest on-site such as loggerhead shrike.
Construction Impacts
Impacts in the form of direct mortality, disturbance of breeding activity, and loss of nesting areas may occur during construction activities during the breeding season for migratory birds. Mitigation in the form of avoidance and impacts minimization is discussed in Section 4.6.4 below.
Operation and Maintenance Impacts
All permanent lighting within the solar field would be low-profile fixtures that point inward toward the solar field with directional hoods or shades to reduce light from shining into the adjacent habitat. In addition, any lighting not required daily for security purposes would have motion sensor or temporary use capabilities. No impact due to lighting is expected to occur to migratory birds.

Environmental Consequences
Ocotillo Sol Project Page 4-63 Draft EIS/Draft CDCA Plan Amendment April 2012
No equipment or components of the solar field are expected to produce noise that would exceed ambient noise in the vicinity. No impacts due to noise are expected to occur.
Collision with the terminal ground wire (or static wire) of transmission lines has been reported as a primary cause of avian fatality from power line strikes (Meyer 1978; James and Haak 1979; Beaulaurier 1981 as cited in CEC 2002b). Ground wires are installed on transmission lines to dissipate lightning strikes thereby preventing damage to transmission structures and equipment. Fatal strikes may also occur when birds collide with transmission and distribution wires, transmissions tower guy wires, and other structures associated primarily with electrical power transmission (CEC 2002b).
The Ocotillo Sol Project area is situated along the Pacific Coast Migratory Route (USGS 2012), which encounters migratory birds moving northwest from Mexico into California and the Pacific northwestern United States. The agricultural fields east of the Ocotillo Sol Project area, as well as the Westside Main Canal and other irrigation channels, are known to provide habitat for many of the migratory bird species moving through the area.
The Ocotillo Sol Project area is situated to the west of the agricultural complex that attracts many migratory birds, and is immediately south of the existing Imperial Valley Substation. The short segment of transmission line that would connect the solar facility to the Imperial Valley Substation would be placed underground, and therefore would not pose a threat for avian collision. Due to the proximity to existing highly visible structures such as the Substation, the likelihood of bird species colliding with the solar facilities is minimal.
Bird species have been known to enter fence post holes and become trapped. The Ocotillo Sol Project would require fence posts to support fencing surrounding the perimeter of the project site. All fence posts would be covered to avoid potential impacts to avian species from entrapment and no impacts to migratory birds are anticipated.
This minimal potential for indirect impacts to migratory birds, while considered adverse to individuals, would not be detrimental to the migratory populations.
Impact Determination
Alternative 2 could result in adverse impacts to migratory bird species. Conservation and mitigation measures outlined in Section 4.6.4 below would be implemented to avoid, minimize, and/or compensate for impacts under this alternative.
Impacts to Other Special Status Small Mammals and Reptiles
Construction Impacts
Direct impacts to special status small mammals and reptiles such as the Colorado Desert fringe-toed lizard, Palm Springs pocket mouse, and pallid San Diego pocket mouse may occur during construction of the Ocotillo Sol Project. Construction activities such as the movement of construction vehicles or heavy equipment may result in the direct mortality, injury, or harassment of these species.

Environmental Consequences
Page 4-64 Ocotillo Sol Project Draft EIS/Draft CDCA Plan Amendment April 2012
Operation and Maintenance Impacts
General operation and maintenance activities include equipment inspection and/or repairs, panel washing, maintenance or inspection vehicles driving within the solar facility, and weed abatement or habitat restoration activities. Injury or mortality of special status small mammals or reptiles could potentially occur due to any of these activities.
Alternative 2 could result in adverse impacts to special status small mammals and reptiles. Conservation and mitigation measures outlined in Section 4.6.4 would be implemented to avoid, minimize, and/or compensate for impacts under this alternative.
Impacts to Wildlife Movement
Wildlife movement corridors are considered sensitive by resource and conservation agencies. Mitigation measures found in the Flat-tailed Horned Lizard Rangewide Management Strategy that require a minimization of habitat disturbance would ensure the continued ability of wildlife to move freely through the vicinity of the Ocotillo Sol Project area. These measures include use of existing roads, minimization of habitat disturbance, a Worker Environmental Awareness Program for all crew and personnel, and speed limits during construction and operation and maintenance activities.
A chain link fence with a 2-inch gap at the base would surround the solar field, allowing small mammals and reptiles to move freely through the site. Although medium- and large-sized mammals would not be able to move through the solar field, it should not inhibit their movement through the Yuha Basin. While many terrestrial species move through the area, the presence of the solar facility would not likely limit wildlife movement. Thus, impacts to wildlife movement are not anticipated to occur under Alternative 2.
Impacts to Jurisdictional Waters
No drainages, wetlands, or other topographical or hydrological features with potential to be subject to USACE, RWQCB, or CDFG jurisdiction were observed within the 115-acre Ocotillo Sol Project area. No evidence of streambed and banks as defined by CDFG was observed within the project area, nor were any defined channels that would be subject to agency jurisdiction. No impacts to USACE, RWQCB, or CDFG jurisdictional waters would occur under Alternative 2.
4.6.2.3.3 Alternative 3 Under Alternative 3, the Applicant would construct, operate, maintain, and decommission a 100-acre solar PV facility on BLM-managed lands under an authorized ROW. The 15-acre temporary ROW described under Alternative 2 would be reduced to 2 acres under Alternative 3. The 2-acre temporary ROW would provide for parking during construction of the Ocotillo Sol Project. Laydown and staging would occur within the 100 acres as construction activities progress. Construction under Alternative 3 would include grading, foundation excavation, trenching, and fencing. Impacts to wildlife and habitat for special status wildlife would occur under Alternative 3. These impacts would be similar to, but slightly less than, those discussed under Alternative 2 above. No impacts to USACE, RWQCB, or CDFG jurisdictional waters

Environmental Consequences
Ocotillo Sol Project Page 4-65 Draft EIS/Draft CDCA Plan Amendment April 2012
would occur under Alternative 3. All mitigation measures identified under Alternative 2 would be applicable under Alternative 3.
4.6.3 CUMULATIVE IMPACTS
4.6.3.1 VEGETATION RESOURCES
4.6.3.1.1 Geographic Scope The geographic scope for vegetation resource impacts is the Yuha Desert Wildlife Management Area (with approximately the same general boundary as the Yuha Basin ACEC). Due to the small size (115-acre disturbance area) of the Applicant’s proposed Ocotillo Sol Project, only one vegetation community, creosote bush–white burr sage scrub, would be impacted. This vegetation community is not considered sensitive or regionally significant. This community is, however, important habitat for the flat-tailed horned lizard within the Yuha Desert Wildlife Management Area. The Yuha Basin ACEC was designated in part to protect sensitive cultural, natural, and biological resources of the region. The Yuha Desert Wildlife Management Area was designated for protection of sensitive biological resources, primarily for the flat-tailed horned lizard. Management of the area follows guidelines from the Flat-tailed Horned Lizard Rangewide Management Strategy.
Agricultural areas within approximately 1 mile of the Applicant’s proposed Ocotillo Sol Project area have experienced long-term disturbance and loss of native vegetation communities. These areas do not contain sensitive vegetation or special status plant communities.
The existing conditions for vegetation resources, including sensitive natural communities, in the Ocotillo Sol Project area are described in Chapter 3, Section 3.6. Past, present, and reasonably foreseeable future projects are listed in Table 4.1-1. Projects within the Yuha Desert Wildlife Management Area are listed in Table 4.1-2. These projects include the following: BLM actions (within BLM-administered lands) include ongoing road maintenance and recreation designations. Other actions include: Imperial Valley Substation operation and maintenance, Imperial Valley Substation expansion for North Gila to Imperial Valley Substation #2 transmission line, Sunrise Powerlink, transmission and utility corridor maintenance, Interstate 8 and Highway 98, agricultural activities, recreational activity, North Gila to Imperial Valley Substation #2 transmission line, Dixieland Imperial Irrigation District transmission line and connection, sand and gravel mining, and Imperial Irrigation District canal and drain maintenance. Renewable energy projects that would impact the Yuha Desert Wildlife Management Area include the following:
Mount Signal Solar Farm Imperial Solar Energy Center South Solar Farm Centinela Solar Farm Silverleaf Solar Farm Campo Verde Solar Farm (and shared transmission line with Silverleaf Solar Farm) Imperial Valley Solar West Solar Farm
The reasonably foreseeable future projects listed above would result in adverse impacts to vegetation resources, primarily during construction activities. Operation and maintenance

Environmental Consequences
Page 4-66 Ocotillo Sol Project Draft EIS/Draft CDCA Plan Amendment April 2012
activities are anticipated to result in minimal, if any, impacts to vegetation resources. Decommissioning activities for renewable energy projects would likely result in beneficial cumulative impacts to vegetation resources in the form of habitat restoration and revegetation of developed areas. Vegetation resource mitigation measures will be required for all reasonably foreseeable future projects.
4.6.3.1.2 Alternatives 1, 4, and 5 Based on direct and indirect impact analysis presented in Section 4.6.2, it is expected that Alternatives 1, 4, and 5 would not result in impacts to vegetation resources. These alternatives, in combination with other reasonably foreseeable future projects, would not contribute to cumulative impacts to vegetation within the Yuha Desert Wildlife Management Area.
4.6.3.1.3 Alternatives 2 and 3 Past, approved, and proposed projects within the Yuha Desert Wildlife Management Area are shown in Table 4.6-1. This table also shows the number of acres these projects have impacted or would impact (pending approval) flat-tailed horned lizard habitat within the Yuha Desert Wildlife Management Area. As shown in Table 4.6-1, the cumulative impact to the 57,304-acre Yuha Desert Wildlife Management Area would be 374.6 acres of flat-tailed horned lizard habitat disturbance from impacts 1) that have occurred since the 1997 adoption of the Flat-tailed Horned Lizard Rangewide Management Strategy, 2) that could result from reasonably foreseeable projects, and 3) that would occur under Alternative 2 (or 361.6 under Alternative 3). These habitat disturbances would comprise about two-thirds of the 1 percent (1 percent of the 57,304-acre area is 573.04 acres) of habitat disturbance allowance within the Yuha Desert Wildlife Management Area.

Environmental Consequences
Ocotillo Sol Project Page 4-67 Draft EIS/Draft CDCA Plan Amendment April 2012
TABLE 4.6-1 PAST, APPROVED, AND PROPOSED PROJECTS WITHIN THE YUHA DESERT
WILDLIFE MANAGEMENT AREA
Project Name (Project Proponent)
Impacts to Yuha Desert Wildlife
Management Area (acres)
Authorized Projects
Existing disturbance, including Sunrise Powerlink and Imperial Valley Substation; 1997-2009
136.9
ISEC West (CSOLAR) 13.7 ISEC South (CSOLAR) 3.1 Centinela Solar Project 13.3 Proposed Projects Mount Signal Solar Farm-I (82LV 8ME, LLC)
10.0
Solar Reserve Imperial Valley 5.0 North Gila to Imperial Valley #2 (Southwest Transmission Partners) and Imperial Valley Substation expansion N. Gila
23.8
Dixieland Imperial Irrigation District Connection 34.6 Silverleaf/Campo Verde Transmission Line 5.2 Ocotillo Sol Solar Farm 115.0 Other Proposed Projects (Border Patrol) 14.0 Recreation Activities Limited to routes
Total Disturbance 374.6
Yuha Desert Wildlife Management Area 57,304
Percent Disturbance 0.06
Short-term and long-term adverse impacts to vegetation resources would occur during construction, operation and maintenance, and decommissioning of the Applicant’s proposed Ocotillo Sol Project under Alternatives 2 and 3. The proposed Ocotillo Sol Project would result in adverse impacts to creosote bush–white burr sage scrub vegetation and would require mitigation to offset impacts. Permanent impacts under Alternatives 2 and 3 would be limited to a 115-acre area. These impacts, combined with other approved and reasonably foreseeable future projects described above, would result in 374.6 acres of cumulative impacts to flat-tailed horned lizard habitat within the Yuha Desert Wildlife Management Area (see Table 4.6-1). Alternatives 2 and 3, along with the reasonably foreseeable future projects listed in Table 4.6-1, would also likely result in cumulative impacts related to the spread of noxious, invasive, and non-native weed species.
All projects within the area of cumulative impact analysis for vegetation resources that impact flat-tailed horned lizard habitat, such as loss of creosote bush–white burr sage scrub habitat, are required to implement mitigation to reduce adverse impacts. In accordance with the Flat-tailed

Environmental Consequences
Page 4-68 Ocotillo Sol Project Draft EIS/Draft CDCA Plan Amendment April 2012
Horned Lizard Rangewide Management Strategy, compensation for permanent impacts to flat-tailed horned lizard habitat within the Yuha Desert Wildlife Management Area will be at a 6:1 ratio. All projects are also required to implement mitigation measures for weed management. As a result of implementing the mitigation measures identified below, Alternatives 2 and 3, when combined with other past, present, and reasonably foreseeable projects in the area, would not result in significant cumulative adverse impacts to vegetation resources.
4.6.3.2 WILDLIFE RESOURCES
4.6.3.2.1 Geographic Scope The geographic scope for wildlife resource impacts is the Yuha Desert Wildlife Management Area, as described above for vegetation resources (Section 4.6.3.1.1). Agricultural areas located within approximately 1 mile of the Applicant’s proposed Ocotillo Sol Project area have experienced long-term disturbance and loss of native vegetation communities. These areas have minimal habitat suitable for wildlife and special status species.
The existing conditions for wildlife, including special status species, in the Ocotillo Sol Project area are described in Chapter 3, Section 3.6. The reasonably foreseeable future projects listed above (Section 4.6.3.1.1) would result in adverse impacts to wildlife resources, primarily during construction activities. Operation and maintenance activities are anticipated to result in minimal impacts to wildlife resources. Decommissioning activities for renewable energy projects would likely result in short-term negligible impacts during disturbance activities as well as beneficial cumulative impacts to wildlife resources in the form of habitat restoration and revegetation of developed areas. Wildlife resource mitigation measures will be required for all reasonably foreseeable future projects.
4.6.3.2.2 Alternatives 1, 4, and 5 Based on direct and indirect impact analysis presented in Section 4.6.2, it is expected that Alternatives 1, 4, and 5 would not result in impacts to wildlife resources. These alternatives, in combination with other reasonably foreseeable future projects, would not contribute to cumulative impacts to wildlife within the Yuha Desert Wildlife Management Area.
4.6.3.2.3 Alternatives 2 and 3 Cumulative Impacts to Flat-Tailed Horned Lizard
As shown in Table 4.6-1, the cumulative impact to the 57,304-acre Yuha Desert Wildlife Management Area would be 374.6 acres of flat-tailed horned lizard habitat disturbance from impacts that have occurred since the 1997 adoption of the Flat-tailed Horned Lizard Rangewide Management Strategy, those that could result from reasonably foreseeable projects, and those under Alternative 2 (or 361.6 under Alternative 3). These habitat disturbances would comprise about two-thirds of the 1 percent (1 percent of the 57,304-acre area is 573.04 acres) of habitat disturbance allowance within the Yuha Desert Wildlife Management Area. Impacts from the Ocotillo Sol Project, along with those listed in Table 4.6-1, would be mitigated in accordance with the Flat-tailed Horned Lizard Rangewide Management Strategy (compensation for permanent impacts to flat-tailed horned lizard habitat will be at a 6:1 ratio), thereby reducing cumulative impacts to less than significant. Based on the USFWS determination not to list the flat-tailed horned lizard, the success of BLM’s Flat-tailed Horned Lizard Rangewide

Environmental Consequences
Ocotillo Sol Project Page 4-69 Draft EIS/Draft CDCA Plan Amendment April 2012
Management Strategy, and implementation of mitigation and mitigation measures outlined in Section 4.6.4, the Ocotillo Sol Project, when combined with the other reasonably foreseeable future projects, would not result in significant cumulative adverse impacts to flat-tailed horned lizards.
Cumulative Impacts to Burrowing Owl
There was an incidental sighting of one active burrow occupied by a single owl in the spring of 2010 within the 115-acre Ocotillo Sol Project area footprint. Burrowing owls are protected by the CDFG mitigation guidelines for burrowing owl (1995) and California Burrowing Owl Consortium guidance (1993), which require a suite of mitigation measures to ensure direct effects to burrowing owls during construction activities are avoided and indirect effects through burrow destruction and loss of foraging habitat are mitigated at prescribed ratios. BLM also considers burrowing owls a sensitive species, and generally follows CDFG recommendations for burrowing owl issues occurring under BLM jurisdiction.
Mitigation measures outlined in Section 4.6.4 provide for burrowing owl mitigation consistent with the CDFG guidelines for burrowing owls. A Burrowing Owl Mitigation Plan, prepared in consultation with and approved by CDFG, would be required prior to construction. The Applicant would mitigate for impacts to foraging habitat either through the National Fish and Wildlife Federation’s Impact-Directed Environmental Accounts program or independent acquisition of like habitat. Exact mitigation acreages would be determined in consultation with CDFG and in accordance with the CDFG Staff Report Guidelines on Burrowing Owl Mitigation.
Past, present, and reasonably foreseeable projects in the area may impact burrowing owls through direct impacts to burrowing owls and their burrows or through direct contact. Burrowing owls are relatively widespread throughout the Imperial Valley and although habitat may be fragmented around urban sites, it is considered one metapopulation. Aggregations occur in association with such features as abandoned rodent burrows or agricultural culverts. Due to ephemeral burrow selection characteristics of burrowing owls, site-specific preconstruction surveys are required to determine to what extent a proposed project would have direct impacts on owls in burrows or to foraging habitat associated with burrows. As a result, it is not possible to provide a meaningful quantitative analysis of direct cumulative impacts to burrowing owls and their burrows.
It is anticipated that many of the cumulative projects would also have indirect impacts to burrowing owls through conversion of foraging habitat, such as creosote bush–white burr sage scrub vegetation and agricultural fields. Although the habitat value of native desert scrub and agricultural fields is not equal, it is anticipated that BLM policies to protect desert scrub land for flat-tailed horned lizard within the Yuha Desert Wildlife Management Area, agricultural practices, and county practices encouraging continued agricultural land use would protect a substantial portion of burrowing owl foraging habitat in the Imperial Valley.
With implementation of mitigation measures outlined in Section 4.6.4, the Ocotillo Sol Project, when combined with other past, present, and reasonably foreseeable projects in the area, would not result in a cumulatively adverse impact to burrowing owl.
Environmental Consequences
Page 4-70 Ocotillo Sol Project Draft EIS/Draft CDCA Plan Amendment April 2012
Cumulative Impacts to Nesting Raptors and Migratory Birds
Past, present, and reasonably foreseeable projects in the area may impact nesting raptors and migratory birds through direct impacts to foraging and nesting habitat or through direct contact. Nesting raptors and migratory birds are widespread throughout the Yuha Desert Wildlife Management Area and it is not possible to provide a meaningful quantitative analysis of direct cumulative impacts to these species.
Alternatives 2 and 3, in combination with other reasonably foreseeable future projects, could result in impacts in the form of direct mortality, disturbance of breeding activity, and loss of nesting areas during construction activities during the breeding season for migratory birds. Impacts may also occur during operation and maintenance; however, these cumulative impacts would be minimal as compared to construction related impacts.
With implementation of mitigation measures outlined in Section 4.6.4 below, the Ocotillo Sol Project would not result in a cumulatively adverse impact to nesting raptors or migratory birds when combined with other past, present, and reasonably foreseeable projects in the area.
4.6.4 MITIGATION
4.6.4.1 MITIGATION FOR IMPACTS TO VEGETATION RESOURCES
Measure 1: In accordance with the Flat-tailed Horned Lizard Rangewide Management Strategy, mitigation would be required for permanent and temporary impacts to flat-tailed horned lizard habitat. Flat-tailed horned lizard is known to occur in the creosote bush–white burr sage scrub vegetation within the Ocotillo Sol Project area. In accordance with the Flat-tailed Horned Lizard Rangewide Management Strategy, compensation for permanent impacts to this habitat within the Management Area will be at a 6:1 ratio. Under Alternative 2, compensation would equal 690 acres for impacts to the 100 acres of permanent and 15 acres of temporary impacts to creosote bush–white burr sage scrub vegetation. Under Alternative 3, compensation would equal 602 acres for impacts to the 100 acres of permanent and 2 acres of temporary impacts to creosote bush–white burr sage scrub vegetation. This compensation would be in the form of acquisition of specific land parcels and/or depositing funds into the Renewable Energy Action Team Account established with the National Fish and Wildlife Foundation for mitigation land search, acquisition, and management.
Measure 2: Re-vegetation of temporary impacts is required to restore the habitat functions and values to their pre-construction state. A detailed Habitat Restoration Plan will be prepared and implemented to ensure the restoration of the temporarily impacted areas is successful. The Habitat Restoration Plan must be approved in writing prior to the initiation of any vegetation-disturbing activities. Restoration involves recontouring the land, replacing the topsoil (if it was collected), planting seed and/or container stock, and maintaining (e.g., weeding, replacement planting, supplemental watering) and monitoring the restored area for a period of 5 years (or less if the restoration meets all success criteria). Components of the Habitat Restoration Plan will include the incorporation of any BLM revegetation/restoration guidance measures. These measures generally include alleviating soil compaction, returning the surface to its original

Environmental Consequences
Ocotillo Sol Project Page 4-71 Draft EIS/Draft CDCA Plan Amendment April 2012
contour, pitting or imprinting the surface to allow small areas where seeds and rain water can be captured, planting seedlings that have acquired the necessary root mass to survive without watering, planting seedlings in the spring with herbivory cages, broadcasting locally collected seed immediately prior to the rainy season, and covering the seeds with mulch.
Measure 3: To reduce the potential for the introduction and spread of noxious, invasive, and non-native weed species, a Weed Management Plan has been prepared for general operations and management within the solar field (see Appendix D).
Measure 4: Prior to project initiation, a Worker Environmental Awareness Program will be developed and implemented, and will be available in both English and Spanish. Wallet-sized cards summarizing this information will be provided to all construction, operation, and maintenance personnel. The education program will include the following aspects:
• biology and status of the flat-tailed horned lizard,
• protection measures designed to reduce potential impacts to the species,
• function of flagging designating authorized work areas,
• reporting procedures to be used if a flat-tailed horned lizard is encountered in the field, and
• driving procedures and techniques, for commuting, and driving on, to the project site, to reduce mortality of flat-tailed horned lizard on roads.
After construction is complete, and in order to prevent future unauthorized impacts to vegetation communities, the Worker Environmental Awareness Program will detail the authorized access roads and work areas, including speed limits for all access roads and internal work areas, and highlight biologically sensitive areas to be avoided during operations and management activities.
Measure 5: A brief Annual Report will be submitted to the relevant resource agencies documenting the implementation of all conservation measures such as habitat restoration, compensation, and avoidance and minimization measures.
4.6.4.1.1 Noxious, Invasive, and Non-Native Weeds To minimize the introduction and spread of noxious, invasive, and non-native weed species, a Weed Management Plan (Measure 3 above) and a Habitat Restoration Plan (Measure 2 above) have been developed and would be implemented. The management plan for temporary disturbance construction sites will have the following objectives:
• Weed identification and risk assessment: identifying the presence, location, and abundance of weed species in the project areas, both existing conditions and conditions over time.
• Weed suppression: reducing or maintaining current infestation densities. The weeds present are widely distributed, higher density weeds for which eradication is not feasible. No weed control is being administered on adjacent properties and therefore there is a strong possibility that the project area will be continuously re-infested.
• Weed containment: preventing infestation expansion or spread because of the proposed project.

Environmental Consequences
Page 4-72 Ocotillo Sol Project Draft EIS/Draft CDCA Plan Amendment April 2012
The Weed Management Plan and Habitat Restoration Plan include a discussion of specific weeds identified on-site that will be targeted for eradication or control as well as a variety of measures that will be undertaken to prevent the introduction and spread of new weed species as a result of the project.
General measures to prevent the spread of weeds include the following:
• Limiting disturbance areas during construction to the minimal required to perform work and limiting ingress and egress to defined routes.
• Maintaining vehicle wash and inspection stations, and closely monitoring the types of materials brought onto the site to minimize the potential for weed introduction.
• Use of certified weed free mulch, straw wattles, hay bales and seed mixes.
• Reestablishing native vegetation as quickly as practicable on disturbed sites as the most effective long-term strategy to avoid weed invasions.
• Monitoring and rapid implementation of control measures to ensure early detection and eradication for need weed invasions.
Weed control methods that may be used included both physical and chemical control. Physical control methods include manual hand pulling of weeds, or the use of hand and power tools to uproot, girdle, or cut plants. Herbicide applications are a widely used, effective control method for removing infestations of invasive weed species. Inadvertent application of herbicide to adjacent native plants must be avoided, which can often be challenging when weeds are interspersed with native cover. Before applying herbicide, contractors will be required to obtain any required permits from state and local authorities. Only a State of California and federally certified contractor will be permitted to perform herbicide applications. All herbicides will be applied in accordance with applicable laws, regulations, and permit stipulations. Only herbicides and adjuvants approved by the State of California and federal agency for use on public lands will be used within or adjacent to the project site. The Programmatic EIS Vegetation Treatments Using Herbicides on BLM Lands in 17 Western States lists 10 herbicides acceptable for use on BLM lands (2007). Guidelines for the use of chemical control of vegetation on BLM lands are presented in the Chemical Pest Control Manual (BLM n.d.). These guidelines require submittal of a pesticide use proposal and pesticide application records for the use of herbicides on BLM lands.
4.6.4.2 MITIGATION FOR IMPACTS TO WILDLIFE RESOURCES
4.6.4.2.1 Flat-tailed Horned Lizard As noted in Measure 1 above, disturbance to flat-tailed horned lizard habitat would be mitigated at a 6:1 ratio through the compensatory mitigation requirements of the Flat-tailed Horned Lizard Rangewide Management Strategy.
Construction Avoidance, Minimization, and Compensation Measures
In accordance with the Flat-tailed Horned Lizard Rangewide Management Strategy, the measures below are designed to avoid, minimize, and/or compensate for potential direct and

Environmental Consequences
Ocotillo Sol Project Page 4-73 Draft EIS/Draft CDCA Plan Amendment April 2012
indirect effects construction of the Ocotillo Sol Project may have on flat-tailed horned lizard. The following measures would be implemented.
Measure 6: Prior to ground-disturbing activities, an individual shall be designated and approved by the BLM as a Designated Biologist1 (i.e., field contact representative). A Designated Biologist will be designated for the period during which on-going construction and post-construction monitoring and reporting by an approved biologist is required, such as annual reporting on habitat restoration. Each successive Designated Biologist will be approved by the BLM’s Authorized Officer (i.e., BLM field manager, El Centro). The Designated Biologist will have the authority to ensure compliance with the conservation measures for the flat-tailed horned lizard and will be the primary agency contact for the implementation of these measures. The Designated Biologist will have the authority and responsibility to halt activities that are in violation of the conservation measures. A detailed list of responsibilities for the Designated Biologist is summarized below. To avoid and minimize impacts to biological resources, the Designated Biologist and/or Biological Monitor(s) will:
• Notify BLM’s Authorizing Officer at least 14 calendar days before initiating ground-disturbing activities.
• Immediately notify BLM’s Authorized Officer in writing, if the project proponent does not comply with any conservation measures, including but not limited to any actual or anticipated failure to implement conservation measures within the periods specified.
• Conduct compliance inspections at a minimum of once per month during on-going construction after clearing, grubbing, and grading are completed, and submit a monthly compliance report to BLM’s Authorized Officer until construction is complete.
Measure 7: The boundaries of all areas to be disturbed (including staging areas, access roads, and sites for temporary placement of spoils) will be delineated with stakes and flagging prior to construction activities. Spoils will be stockpiled in disturbed areas lacking native vegetation or where habitat quality is poor. To the extent possible, disturbance of shrubs and surface soils due to stockpiling will be minimized. All disturbances, vehicles, and equipment will be confined to the flagged areas. To the extent possible, surface disturbance will be timed to minimize mortality to flat-tailed horned lizard (see flat-tailed horned lizard Measure 11 below).
Measure 8: Approved Biological Monitor(s) will assist the Designated Biologist in conducting pre-construction surveys and monitoring mobilization, ground disturbance, grading, construction, operation, closure, and restoration activities. The Biological Monitor(s) will have experience conducting flat-tailed horned lizard field monitoring, have sufficient education and field experience to understand flat-tailed horned lizard biology, be able to identify flat-tailed horned lizard scat, and be able to identify and follow flat-tailed horned lizard tracks. The Designated Biologist will submit a resume, at least three references, and contact information of the proposed
1 A qualified Designated Biologist must have the following: 1) a Bachelor’s degree with an emphasis in ecology, natural resource management, or related science; 2) 3 years of experience in field biology or a current certification of a nationally recognized biological society such as The Ecological Society of America or the Wildlife Society; 3) previous experience with applying terms and conditions of a biological opinion; and 4) an appropriate permit and/or training if conducting focused or protocol surveys for listed or proposed species.

Environmental Consequences
Page 4-74 Ocotillo Sol Project Draft EIS/Draft CDCA Plan Amendment April 2012
Biological Monitors to the BLM for approval. To avoid and minimize impacts to biological resources, the Biological Monitors will assist the Designated Biologist with the following:
• Be present during construction (e.g., grubbing, grading, tower installation, wire stringing) activities that take place in flat-tailed horned lizard habitat to avoid or minimize take of flat-tailed horned lizard. Activities include, but are not limited to, ensuring compliance with all impact avoidance and minimization measures, monitoring for flat-tailed horned lizards and removing lizards from harm’s way, and checking avoidance areas (e.g., washes) to ensure that signs, and stakes are intact and that human activities are restricted in these avoidance zones.
• At the end of each workday, inspect all potential wildlife pitfalls (trenches, bores and other excavations) for wildlife and then backfill. If backfilling is not feasible, all trenches, bores, and other excavations will be contoured at a 3:1 slope at the ends to provide wildlife escape ramps, or completely and securely covered to prevent wildlife access.
• During construction, examine areas of active surface disturbance periodically, at least hourly, when surface temperatures exceed 85°F for the presence of flat-tailed horned lizard.
Measure 9: Flat-tailed horned lizards will be removed from harm’s way during all construction activities, per Measure 10 below. Flat-tailed horned lizard removal will be conducted by two or more Biological Monitors when construction activities are being conducted in suitable flat-tailed horned lizard habitat. To the extent feasible, methods to find flat-tailed horned lizards will be designed to achieve a maximal capture rate and will include, but not be limited to using strip transects, tracking, and raking around shrubs. During construction, the minimum survey effort will be 30 minutes per 0.40 hectare (30 minutes per 1 acre). Persons that handle flat-tailed horned lizards will first obtain all necessary permits and authorization from the CDFG. Flat-tailed horned lizard removal surveys will also include a Horned Lizard Observation Data Sheet and a Project Reporting Form, per Appendix 8 of the Flat-tailed Horned Lizard Rangewide Management Strategy. During construction, quarterly reports describing flat-tailed horned lizard removal activity, per the reporting requirements described in Measure 1 above, will be submitted to the BLM and CDFG.
Measure 10: The removal of flat-tailed horned lizards out of harm’s way will include relocation to nearby suitable habitat in low-impact (e.g., away from roads and solar panels) areas of the Yuha Management Area. Relocated flat-tailed horned lizards will be placed in the shade of a large shrub in undisturbed habitat. If surface temperatures in the sun are less than 75°F or exceed 100°F, the Designated Biologist or Biological Monitor, if authorized, will hold the flat-tailed horned lizard for later release. Initially, captured flat-tailed horned lizards will be held in a cloth bag, cooler, or other appropriate clean, dry container from which the lizard cannot escape. Lizards will be held at temperatures between 75°F and 90°F and will not be exposed to direct sunlight. Release will occur as soon as possible after capture and during daylight hours. The Designated Biologist or Biological Monitor will be allowed some judgment and discretion when relocating lizards to maximize survival of flat-tailed horned lizards found in the project area.
Measure 11: To the maximum extent practicable, grading in flat-tailed horned lizard habitat will be conducted during the active season, which is defined as March 1 through September 30, or when ground temperatures are between 75°F and 100°F. If grading cannot be conducted

Environmental Consequences
Ocotillo Sol Project Page 4-75 Draft EIS/Draft CDCA Plan Amendment April 2012
during this time, any flat-tailed horned lizards found will be removed to low-impact areas (see above) where suitable burrowing habitat exists, (e.g., sandy substrates and shrub cover).
Operation and Maintenance Avoidance, Minimization, and Compensation Measures
To reduce the potential impacts to flat-tailed horned lizard during operation and maintenance, the following would be implemented when conducting operation and maintenance:
Measure 12: No later than January 31 of every year that the Ocotillo Sol Project remains in operation, the Designated Biologist will provide the BLM’s Authorized Officer, CDFG, and the Flat-tailed Horned Lizard Interagency Coordinating Committee an annual flat-tailed horned lizard Status Report, which will include the following, at a minimum:
• A general description of the status of the project site
• A copy of the table in the project biological monitoring report with notes showing the current implementation status of each conservation measure
• An assessment of the effectiveness of each completed or partially completed measure in avoiding and minimizing project impacts
• A completed Project Reporting Form from the Flat-tailed Horned Lizard Rangewide Management Strategy
• A summary of information regarding any flat-tailed horned lizard mortality in conjunction with the project’s Wildlife Mortality Reporting Program
• Recommendations on how conservation measures might be changed to more effectively avoid, minimize, and offset future project impacts on the flat-tailed horned lizard
Measure 13: Adaptive Management for flat-tailed horned lizard; the Designated Biologist or Biological Monitor(s) will evaluate and implement the best measures to reduce flat-tailed horned lizard mortality along access roads, particularly during the flat-tailed horned lizard active season (March 1 through September 30). These measures will include the following:
• A speed limit of 15 miles per hour when driving the access road to the facility, and any roads within the facility. All vehicles required for operation and maintenance must remain on the designated access/maintenance roads.
• Operation and maintenance activities including weed abatement, or any other operation and maintenance activity that may result in ground disturbance will be conducted outside of the flat-tailed horned lizard active season whenever feasible.
• If any operation and maintenance activities must be conducted during the flat-tailed horned lizard active season that may result in ground disturbance, such as weed abatement or vehicles requiring access outside of a designated access road, a Biological Monitor will be present during activities to ensure that no flat-tailed horned lizards are impacted.
Implementation of these measures would be based on flat-tailed horned lizard activity levels, the best professional judgment of the Designated Biologist, and site-specific road utilization. Flat-tailed horned lizard found on access roads, if monitoring is required, will be relocated per Measure 11.

Environmental Consequences
Page 4-76 Ocotillo Sol Project Draft EIS/Draft CDCA Plan Amendment April 2012
4.6.4.2.2 Burrowing Owl Construction Avoidance, Minimization, and Compensation Measures
The following measures would avoid, minimize, or mitigate potential impacts to burrowing owl during construction activities.
Measure 14: Initial grading of the creosote bush–white burr sage scrub vegetation for the solar field will take place between September 1 and January 31 to avoid impacts to breeding burrowing owls (CDFG 2012). This measure is in conflict with mitigation for the flat-tailed horned lizard. If this conflict cannot be resolved, BLM may select Measure 15.
Measure 15: The avoidance and minimization Measures 16 through 20 below shall be implemented prior to construction to avoid impacts to nesting, migrating, or wintering burrowing owls. If construction is to begin during the breeding season, it is recommended that Measures 16 through 20 below be implemented prior to February 1 to discourage the nesting of burrowing owls within the area of impact. As construction continues, any area where owls are sighted shall be subject to frequent surveys for burrows before the breeding season begins, so that owls can be relocated before nesting occurs.
Measure 16: No less than 14 days prior to initiating ground-disturbance activities, an initial take avoidance survey shall be conducted using the recommended methods described in the Detection Surveys section of Appendix D of the 2012 CDFG Staff Report on Burrowing Owl Mitigation. This survey shall be conducted to determine the presence or absence of the species within the construction area, because burrowing owls may not use the same burrow every year, and numbers and locations of burrowing owl burrows at the time of construction may differ from the data collected during previous focused surveys. The construction areas will need to be clearly demarcated in the field by engineers prior to the commencement of the pre-construction clearance survey. Implementation of further avoidance and minimization measures would be triggered by positive owl presence on the site where project activities will occur.
Once the initial take avoidance survey is conducted, burrowing owls may recolonize a site after only a few days. Time lapses between project activities trigger subsequent take avoidance surveys including, but not limited to, a final survey conducted within 24 hours prior to ground disturbance.
Measure 17: If burrowing owls are detected adjacent to the project footprint and can be protected in place, buffer zones, visual screens, or other measures may be used to protect the owls in place while project activities are occurring to minimize disturbance impacts. The guidelines for implementing buffers, as detailed on pages 9 and 10 of the 2012 CDFG Staff Report on Burrowing Owl Mitigation, should be adjusted to address site-specific conditions. BLM and the Applicant shall consult with the CDFG and other burrowing owl experts for assistance in developing site-specific buffer zones or visual screens. One example of a visual screen used by a qualified biologist to shelter an owl in place is a stack of hay bales. If buffers or visual screens are employed, a monitoring program by a qualified biologist will be implemented to ensure that the burrowing owls are not detrimentally affected by the alternative approaches.

Environmental Consequences
Ocotillo Sol Project Page 4-77 Draft EIS/Draft CDCA Plan Amendment April 2012
Measure 18: If active burrows are observed within the project footprint during the pre-construction take avoidance survey(s), the following mitigation measures shall be implemented. Passive relocation methods are to be used to move the owls out of the impact zone. Passive relocation shall only be done in the non-breeding season in accordance with the 2012 CDFG Staff Report on Burrowing Owl Mitigation. A Burrowing Owl Exclusion Plan should be developed in accordance with Appendix E of the 2012 CDFG Staff Report on Burrowing Owl Mitigation and approved by CDFG. This includes covering or excavating all burrows and installing one-way doors into occupied burrows. This will allow any animals inside to leave the burrow, but will exclude any animals from re-entering the burrow. One-way doors will be left in place for 48 hours if scoping indicates occupancy. Burrow will be scoped prior to excavation. Excavation will be done using hand tools and refilled to prevent reoccupation. After burrow is collapsed, contractor will immediately disk down area to prevent reoccupation. The destruction of the active burrows on-site requires construction of new burrows at a mitigation ratio of 2:1 approximately 50 to 75 meters from the impacted area and must be constructed as part of the above-described relocation efforts. The construction of new burrows will take place within open areas that allow for foraging. All passive relocation efforts will be documented with photographs, GPS coordinates of created burrows, and a description of relocation efforts, all of which are to be submitted to CDFG in report format.
Measure 19: As the construction schedule and details are finalized, an approved biologist shall prepare a Burrowing Owl Exclusion Plan that will detail the methodology proposed to minimize and mitigate impacts to this species. Passive relocation, destruction of burrows, and construction of artificial burrows can only be completed upon approval by CDFG.
Measure 20: In accordance with the 2012 CDFG Staff Report on Burrowing Owl Mitigation, the entire project site is considered occupied, as burrowing owls have been recorded using the site on multiple years and during various seasons. The 15 acres of temporarily impacted land shall be restored to pre-project condition, including de-compacting the soil and re-vegetating with native species. The 100 acres of permanent impacts to burrowing owl habitat shall be mitigated at a 1:1 ratio by permanently protecting in-kind habitat off-site through a conservation easement in accordance with pages 11-13 (Mitigating Impacts) of the 2012 CDFG Staff Report on Burrowing Owl Mitigation. As the habitat for this burrowing owl is creosote bush–white burr sage scrub, the same habitat requiring mitigation for impacts to flat-tailed horned lizards, the mitigation required for impacts to burrowing owl foraging habitat can be achieved in conjunction with the flat-tailed horned lizard mitigation if approved by CDFG.
Operation and Maintenance Avoidance and Minimization Measures
To reduce the potential impacts to burrowing owl during operation and maintenance, general mitigation measures discussed above such as speed limits and a Worker Environmental Awareness Program shall be implemented.
4.6.4.2.3 Raptors Construction Avoidance, Minimization, and Compensation Measures
Raptors and active raptor nests are protected under California Fish and Game Code 3503.5, 3503, 3513, and the Bald and Golden Eagle Protection Act. In order to prevent direct and
Environmental Consequences
Page 4-78 Ocotillo Sol Project Draft EIS/Draft CDCA Plan Amendment April 2012
indirect noise impacts to nesting raptors such as red-tailed hawk, the following measures shall be implemented:
Measure 21: Initial grading and construction within the Ocotillo Sol Project area shall take place outside raptor breeding season of February 1 to July 15.
Measure 22: If construction occurs between February 1 and July 15, a qualified biologist shall conduct a pre-construction clearance survey for nesting raptors in suitable nesting habitat (e.g., transmission towers) that occurs within 500 feet of the Ocotillo Sol Project area. If any in-active nests are identified within the adjacent transmission towers, the nests shall be removed by a qualified biologist, or by construction personnel with a qualified biologist immediately present to over-see the removal. If any active raptor nest is located, the nest area will be flagged, and a 500-foot buffer zone delineated, flagged, or otherwise marked. No work activity may occur within this buffer area, until a qualified biologist determines that the fledglings are independent of the nest.
Mitigation for impacts to potential raptor foraging habitat would be conducted in concert with the purchase/acquisition of mitigation for flat-tailed horned lizard habitat as detailed above. It is not anticipated that additional mitigation for impacts to raptors would be necessary.
4.6.4.2.4 Other Special Status Small Mammals and Reptiles Construction Avoidance, Minimization, and Compensation Measures
The construction impact avoidance, minimization, and compensation measures detailed for flat-tailed horned lizard above provide adequate protection and compensation for these species and their habitats, given the similarity in their habitat requirements and behaviors.
Operation and Maintenance Avoidance, Minimization, and Compensation Measures
The operation and maintenance impact avoidance, minimization, and compensation measures detailed for flat-tailed horned lizard above provide adequate protection and compensation for these species and their habitats, given the similarity in their habitat requirements and behaviors.
4.6.5 IRREVERSIBLE AND IRRETRIEVABLE COMMITMENT OF RESOURCES
Construction, operation and maintenance, and decommissioning activities of the Ocotillo Sol Project would result in direct and indirect impacts to biological resources. The Ocotillo Sol Project would result in the loss of 100 acres of native vegetation and habitat, as well as 15 acres (2 acres under Alternative 3) of disturbed vegetation and habitat. These permanent and temporary losses of native vegetation would result in unavoidable adverse impacts to native vegetation and wildlife. Implementation of avoidance and mitigation measures would minimize adverse impacts. Compensation for permanent impacts to flat-tailed horned lizard habitat within the Yuha Desert Wildlife Management Area will be at a 6:1 ratio. Acquisition of compensation lands would occur within undisturbed habitat suitable for flat-tailed horned lizards. This mitigation would result in beneficial impacts to flat-tailed horned lizards, as well as other species

Environmental Consequences
Ocotillo Sol Project Page 4-79 Draft EIS/Draft CDCA Plan Amendment April 2012
occurring within this habitat, due to an increase in undisturbed area and likely limitations on future disturbance within acquired lands.
With these measures, the Ocotillo Sol Project would not substantially alter or interfere with wildlife or plant populations in the project area. Adverse impacts would be negligible overall and would affect a small, localized area. The impacts to native vegetation and wildlife would not cause an irreversible and irretrievable commitment of the resources.

Environmental Consequences
Page 4-80 Ocotillo Sol Project Draft EIS/Draft CDCA Plan Amendment April 2012
4.7 CULTURAL RESOURCES
Class III Inventory Ocotillo Sol Project prepared by LSA Associates, Inc. (December 2011) has been completed for this undertaking. In addition, to meet NEPA and NHPA requirements for tribal consultation, the BLM has invited tribes to consult on a government-to-government basis in the earliest stages of project planning. Initial Tribal consultation letters were sent in February 2010 to 15 tribes. Additional correspondence and communication has occurred since the initial letters were sent. Tribes were also invited to the August 2011 affected agency pre-application meeting. Consultation with Tribes will continue throughout the NEPA and Section 106 processes. See Section 5.2.1 for more information and a list of the participating tribes.
4.7.1 NEPA INDICATORS / METHODOLOGY
NATIONAL REGISTER OF HISTORIC PLACES
A resource must qualify under one or more criteria to be considered eligible for NRHP listing. The National Register Criteria for Evaluation (36 CFR 60.4) provides guidance in determining a property’s eligibility for listing on the NRHP. These regulations state that the quality of significance in American history, architecture, archaeology, engineering, and culture is present in districts, sites, buildings, structures, and objects that possess integrity of location, design, setting, materials, workmanship, feeling, and association, and that meet one or more of the following four established criteria (36 CFR §60.4):
A) is associated with events that have made a significant contribution to the broad patterns of our history; or
B) is associated with the lives of persons significant in our past; or, C) embodies the distinctive characteristics of a type, period, or method of construction, or that
represents the work of a master, or that possesses high artistic values, or that represents a significant and distinguishable entity whose components may lack individual distinction; or
D) has yielded, or may be likely to yield, information important in prehistory or history.
Additionally, unless the property possesses exceptional significance, it must be at least 50 years old to be eligible for the NRHP listing. The properties must also have integrity, which is defined as “the ability of a property to convey its significance” (DOI 1990). The NRHP recognizes seven qualities that, in various combinations, define integrity, including location, design, setting, materials, workmanship, feeling, and association. For Criteria A, B, and C, integrity means that the property must evoke the resource’s period of significance to a non-historian or non-archaeologist. If site materials have been removed or vandalized to the extent that an ordinary citizen can no longer envision or grasp the historic activities that took place there, the property is said to lack integrity (National Park Service 1997). Archaeological sites usually qualify for listing in the NRHP under Criterion D, research potential; therefore, integrity in this case means that the deposits are intact and undisturbed to the point a meaningful data contribution to regional research issues can be made. Cultural isolates are not considered eligible for the listing

Environmental Consequences
Ocotillo Sol Project Page 4-81 Draft EIS/Draft CDCA Plan Amendment April 2012
on the NRHP because they generally lack qualities that would qualify them. Isolates do not have research potential.
An archeological testing and evaluation phase investigation is needed to determine the eligibility of archaeological sites under Criterion D. This usually involves instrument mapping with a global positioning system unit and excavation and ancillary studies such as radiocarbon dating, pollen analysis, macrobotanical analysis, lithic analysis, faunal analysis, and so on. At the survey level, one can make provisional recommendations based on site attributes noted on the site surface. A formal testing and evaluation program would be necessary to definitively document the presence or absence of subsurface deposits and the specific research potential of each site.
Under Section 106 of the NHPA subsection 800.5 (Assessment of adverse effects) criteria for determining adverse effects are as follows:
• Physical destruction, damage or alteration to all or part of the historic property
• Isolation of the property or alteration of the character of the property’s setting when that character contributes to the property’s qualifications for the NRHP
• Introduction of visual, audible, or atmospheric elements that are out of character with the property or changes that may alter its setting
• Neglect of a property, resulting in its deterioration or destruction
Transfer, lease, or sale of a property without adequate provisions to protect the property’s historic integrity
4.7.2 TYPICAL IMPACTS FROM SOLAR ENERGY DEVELOPMENT
Direct impacts to cultural resources can occur wherever ground-disturbing activities occur. Impacts are most likely during construction activities. These activities can damage surface and subsurface artifacts; compromise the original spatial relationships of artifacts that archaeologists use to reconstruct prehistoric cultural patterns; destroy stratigraphic relationships of buried deposits; contaminate radiocarbon samples and paleo-ecological data; and damage the integrity of buried archaeological features such as hearths and cooking pits, house pits, fish traps, and cremation burials. Native American spiritual values and sensitivities can also be affected by disturbance of cultural resources.
4.7.3 IMPACTS BY ALTERNATIVE
4.7.3.1 ALTERNATIVES 1, 4, AND 5
Under Alternative 1, the Ocotillo Sol Project would not be approved by the BLM and the CDCA Plan would not be amended. The Ocotillo Sol Project would not be constructed and the BLM would continue to manage the site consistent with the CDCA Plan (1980, as amended), Yuha Basin ACEC Management Plan (1981), Yuha Desert Wildlife Habitat Management Plan (1983), Yuha Desert Management Plan (1985), and the Flat-tailed Horned Lizard Rangewide Management Strategy.
Environmental Consequences
Page 4-82 Ocotillo Sol Project Draft EIS/Draft CDCA Plan Amendment April 2012
Under Alternative 4, the Ocotillo Sol Project would not be approved and no ROW grant would be issued to the Applicant. The project area would remain in its existing condition, with no construction of structures or facilities resulting in ground disturbance, and no impacts associated with the Ocotillo Sol Project would occur. Under Alternative 4, the CDCA Plan would be amended to identify the Ocotillo Sol Project area as suitable for solar energy development. As a result, a project might be proposed in the future using the same or different solar energy technology on the project site, possibly resulting in impacts similar to the proposed Ocotillo Sol Project. The impacts of such a future project, however, are speculative at this time.
Under Alternative 5, the Ocotillo Sol Project would not be approved and no ROW grant would be issued to the Applicant. The project area would remain in its existing condition, with no construction of structures or facilities resulting in ground disturbance, and no impacts associated with the Ocotillo Sol Project would occur. Under Alternative 5, the CDCA Plan would be amended to identify the Ocotillo Sol Project area as unsuitable for solar energy development.
There would be no direct or indirect impacts to cultural resources or historic properties under Alternatives 1, 4, and 5. No mitigation measures would be required under these alternatives.
4.7.3.2 ALTERNATIVE 2
Under Alternative 2, the Applicant’s proposed project (Ocotillo Sol Project), the Applicant would construct, operate, maintain, and decommission a 100-acre solar PV facility on BLM-managed lands under an authorized ROW (see Figure 2-3 in Appendix A). In addition, this alternative includes a 15-acre temporary ROW to be used as a laydown area during construction of the solar facility. Construction of the Applicant’s Ocotillo Sol Project would include grading, foundation excavation, trenching, and fencing. Under Alternative 2, BLM would amend the CDCA Plan to identify all 115 acres as suitable for solar development and allow solar development on this land.
The following discussion provides an analysis of potential effects to cultural resources that could occur in association with the construction, operation and maintenance, and decommissioning of the Ocotillo Sol Project under Alternative 2. One prehistoric site and twelve isolated artifacts were identified within the APE.
Direct impacts during construction would include grading, foundation excavation, trenching, and fencing. There are 12 isolates and one recorded archaeological site (CA-IMP-11741) within the Ocotillo Sol Project area. The 12 isolates and 1 recorded site would be destroyed during construction. The isolates that are within the APE have been determined to be ineligible for the NRHP and thus are not historic properties. The one archaeological site has been recommended not eligible for the NRHP (LSA 2011). This site appears to lack a subsurface component. By recording and completing Department of Parks and Recreation site forms, the archaeological information potential for this site has been exhausted. The site is not likely to yield additional research information. The site would be destroyed during construction, but effects to this resource would not be considered adverse. No historic properties would be impacted by construction under Alternative 2.

Environmental Consequences
Ocotillo Sol Project Page 4-83 Draft EIS/Draft CDCA Plan Amendment April 2012
Subsurface excavation activities always have the potential to impact previously unknown subsurface archaeological resources. The potential for buried cultural resources is considered low in the APE (LSA 2011). Cultural Resources Mitigation Measure 1 (Section 4.7.6) has been incorporated as a project design feature in order to ensure that impacts do not result in an adverse effect.
There is a potential for indirect effects due to increased traffic during construction. It is also possible that grading within the construction area could increase the amount of sheet flow and water runoff during heavy rainfall events that could cause damage to cultural resources outside the construction area. There are 4 numbered sites (CA-IMP-11742, -11743, 11749, and -11752) within 100 feet of the direct effects; these sites may be indirectly affected by the proposed Ocotillo Sol Project under Alternative 2. Cultural Resources Mitigation Measure 2 (Section 4.7.6) has been incorporated as a project design feature in order to ensure that project impacts for the above mentioned four sites do not result in an adverse effect.
Under Alternative 2, construction would require grading, excavation, and trenching within the project site. While the project has been designed to avoid any known areas of potential human remains, subsurface activities always have some potential to impact previously unknown remains. Cultural Resources Mitigation Measure 3 would ensure that the potential impacts to previously unknown human remains do not result in adverse effects.
Under Alternative 2, no adverse impacts to historic properties are anticipated to occur during operation and maintenance activities. All operation and maintenance activities would occur within previously graded and developed areas.
4.7.3.3 ALTERNATIVE 3
Alternative 3 would be the same as Alternative 2 except it would be modified to reduce new impacts to 102 acres. The temporary construction laydown area described under Alternative 2 would be reduced to 2 acres under Alternative 3. Alternative 3 would require the Applicant to manage laydown and staging within the 100-acre Ocotillo Sol Project area as construction activities progress. The 2-acre temporary laydown area would be used for construction workforce parking. Under Alternative 3, BLM would amend the CDCA Plan to identify all 102 acres as suitable for solar development and allow solar development on this land.
Direct impacts during construction would include grading, foundation excavation, trenching, and fencing. There are nine isolates and one recorded archaeological site (CA-IMP-11741) within the Ocotillo Sol Project area under Alternative 3. The nine isolates and one recorded site would be destroyed during construction. The isolates that are within the APE have been determined to be ineligible for the NRHP and thus are not historic properties. As described above for Alternative 2, the one archaeological site has been recommended not eligible for the NRHP. No historic properties would be impacted by construction under Alternative 3.
Subsurface excavation activities always have the potential to impact previously unknown archaeological subsurface resources. The potential for buried cultural resources is considered low in the APE (LSA 2011). Cultural Resources Mitigation Measure 1 (Section 4.7.6) has been

Environmental Consequences
Page 4-84 Ocotillo Sol Project Draft EIS/Draft CDCA Plan Amendment April 2012
incorporated as a project design feature in order to ensure that impacts do not result in an adverse effect.
There is a potential for indirect effects due to increased traffic during construction. It is also possible that grading within the construction area could increase the amount of sheet flow and water runoff during heavy rainfall events that could cause damage to cultural resources outside the construction area. There are 4 numbered sites (CA-IMP-11742, -11743, 11749, and -11752) within 100 feet of the direct effects; these sites may be indirectly affected by the proposed Ocotillo Sol Project under Alternative 3. Cultural Resources Mitigation Measure 2 has been incorporated as a project design feature in order to ensure that project impacts for the above mentioned four sites do not result in an adverse effect.
Under Alternative 3, construction would require grading, excavation, and trenching within the project site. While the project has been designed to avoid any known areas of potential human remains, subsurface activities always have some potential to impact previously unknown remains. Cultural Resources Mitigation Measure 3 would ensure that the potential impacts to previously unknown human remains do not result in adverse effects.
Under Alternative 3, no adverse impacts to historic properties are anticipated to occur during operation and maintenance activities. All operation and maintenance activities would occur within previously graded and developed areas.
4.7.4 CUMULATIVE IMPACTS
4.7.4.1 GEOGRAPHIC SCOPE
The cumulative analysis geographic scope for cultural resources is cultural sites, traditional use areas, and cultural landscapes within a 1-mile radius of the 40-foot contour of ancient Lake Cahuilla and an approximate 2-mile radius northwest and southeast of the Ocotillo Sol Project area along the shoreline of ancient Lake Cahuilla. The 40-foot contour of ancient Lake Cahuilla is the high water stand. This shoreline provided significant water sources to prehistoric peoples and is viewed as a primary economic attraction for regional hunter/gatherer and foragers during the Late Prehistoric Period (about 1,00 to 450 years ago). Whether the settlement pattern is based on small temporary camps as suggested by Weide (1976) or relatively permanent villages as argued by Wilke (1978), the cycles of infilling and drying of Lake Cahuilla appear to have been the major reason for shifts in land use patterns in southeastern California. The ancient shoreline has been associated with extensive prehistoric use and occupation.
A number of cultural resources studies have documented the potential for cultural resources along the 40-foot contour within this region. The area around the 40-foot contour can be identified as containing cultural resource sites of the similar types (such as lithic scatters, ceramic scatters, and a combination of lithic and ceramic scatters) and sites that were occupied within similar timeframes. Those sites located at or above the 40-foot contour were occupied during one of Lake Cahuilla’s high water stands. Those located below the 40-foot contour were occupied during a time when the lake was receding and evaporating.

Environmental Consequences
Ocotillo Sol Project Page 4-85 Draft EIS/Draft CDCA Plan Amendment April 2012
Past, present, and reasonably foreseeable future projects are listed in Table 4.1-1. Projects within the cumulative analysis impact area are listed in Table 4.1-2. Project or actions within the 1-mile and 2-mile radius include BLM actions (within BLM-administered lands) such as ongoing road maintenance and recreation designations. Other actions include the following: Imperial Valley Substation operation and maintenance, Imperial Valley Substation expansion for North Gila to Imperial Valley Substation #2 transmission line, Sunrise Powerlink, transmission and utility corridor maintenance, Interstate 8, Highway 98, agricultural activities, recreational activity, North Gila to Imperial Valley Substation #2 transmission line, Dixieland Imperial Irrigation District transmission line and connection, Geothermal Overlay, Rancho Los Lagos, Brookfield Specific Plan, Desert Springs Oasis, Alder 70, Mosaic Specific Plan, sand and gravel mining, and Imperial Irrigation District canal and drain maintenance. Renewable energy projects include the following:
Calexico Solar Farm II Mount Signal Solar Farm Calexico Solar Farm I Imperial Solar Energy Center South Solar Farm Centinela Solar Farm Acorn Greenworks Solar Farm Silverleaf Solar Farm Campo Verde Solar Farm (and shared transmission line with Silverleaf Solar Farm) Imperial Solar Energy Center West Solar Farm Keystone Solar Ocotillo Express Wind Farm
The existing condition for cultural resources and historic properties in the Ocotillo Sol Project area, which represents the aggregate effect of past and present actions impacting cultural resources, is described in Chapter 3, Section 3.7. The reasonably foreseeable future projects listed above would result in adverse cumulative impacts cultural resources, primarily during construction activities. Operation and maintenance activities are not anticipated to result in impacts to cultural resources. Cultural resource mitigation measures will be required for all reasonably foreseeable future projects.
4.7.4.2 ALTERNATIVES 1, 4, AND 5
Based on direct and indirect impact analysis presented in Section 4.7.4, it is expected that Alternatives 1, 4, and 5 would not result in impacts to historic properties. These alternatives, in combination with other reasonably foreseeable future projects, would not contribute to cumulative impacts to historic properties or landscapes in the area.
4.7.4.3 ALTERNATIVES 2 AND 3
Under Alternatives 2 and 3, grading, excavation, and trenching would occur during construction. These alternatives, combined with other reasonably foreseeable future projects, have the potential to affect known and previously unknown surface archaeological resources.

Environmental Consequences
Page 4-86 Ocotillo Sol Project Draft EIS/Draft CDCA Plan Amendment April 2012
These alternatives, combined with other reasonably foreseeable future projects, also have the potential to result in indirect effects to sites due to increased traffic during construction. It is also possible that grading during construction could increase the amount of runoff water during heavy rainfall events.
Because federal agencies are required to identify potentially affected historic properties; assess effects to such properties; and seek ways to avoid, minimize, or mitigate any adverse effects on such properties under Section 106, projects within the cumulative analysis impact area will also have cultural resource mitigation measures in place to resolve adverse effects to historic properties.
Because historic properties within the cumulative analysis impact area are important for their potential contribution to knowledge of history (Criterion 4), mitigation measures to collect scientific value from archaeological historic properties include systematic data recovery programs and historic properties treatment plans. Based on mitigation and avoidance measures, Alternatives 2 and 3, in combination with reasonably foreseeable future projects, are not likely to result in significant cumulative impacts to historic properties within the 1-mile and 2-mile geographic extent for cultural resources. Therefore, no cumulative adverse effects to historic properties are expected under Alternatives 2 and 3 when combined with other reasonably foreseeable future projects.
4.7.5 MITIGATION
To mitigate impacts to any inadvertent discoveries of archaeological sites during construction, the following mitigation measures shall be implemented prior to the start of any ground-disturbing activities.
Cultural Resource Mitigation Measure 1: Sites within 100 feet of the direct impacts may be indirectly affected due to their proximity to construction areas (Section 4.7.4). These sites shall be designated as Environmentally Sensitive Areas. Temporary fencing around their perimeters will be required in order to identify them as Environmentally Sensitive Areas to ensure that these cultural resources are avoided by project personnel. An archaeologist shall monitor Environmentally Sensitive Areas during ground-disturbing activities. In addition, grading within the construction area shall be performed in a manner that incorporates sheet flow and water runoff diversion techniques to prevent surface water from damaging off-site cultural sites.
Cultural Resource Mitigation Measure 2: In the event that unknown historic or unique archaeological resources are encountered during construction or operational repairs, archaeological monitors will be authorized to temporarily divert construction work within 100 feet of the area of discovery until the significance and the appropriate mitigation measures are determined by a Registered Professional Archaeologist in consultation with BLM. Project redesign to avoid the cultural resources, or the implementation of a data recovery program, are two mitigation measures that may be used. The qualified archaeologist shall be familiar with the resources of the region. Applicant shall notify the BLM within 24 hours. Applicant shall provide contingency funding sufficient to allow for implementation of avoidance measures or appropriate mitigation.

Environmental Consequences
Ocotillo Sol Project Page 4-87 Draft EIS/Draft CDCA Plan Amendment April 2012
Cultural Resource Mitigation Measure 3: If human remains are discovered, work will be halted in that area, and the procedures set forth in the Native American Graves Protection and Repatriation Act shall be followed, as applicable.
4.7.6 IRREVERSIBLE AND IRRETRIEVABLE COMMITMENT OF RESOURCES
Construction of the Ocotillo Sol Project would result in ground disturbance; however, the project area does not contain cultural resources or historic properties. No unavoidable adverse impacts to cultural resources or historic properties would occur from the Ocotillo Sol Project and no irreversible and irretrievable commitment of cultural resources would occur.
Environmental Consequences
Page 4-88 Ocotillo Sol Project Draft EIS/Draft CDCA Plan Amendment April 2012
4.8 PALEONTOLOGICAL RESOURCES
Potential paleontological resources within the Ocotillo Sol Project area would be susceptible to impacts from surface disturbing activities, construction activities, and vegetation removal and treatments. These impacts could lead to the disturbance, destruction, or loss of paleontological resources.
4.8.1 MANAGEMENT GOALS
The CDCA Plan includes management goals for paleontological resources along with those for cultural resources. Planning and management actions for paleontological resources on BLM lands are implemented in accordance with the BLM Manual H-8270-1, General Procedural Guidance for Paleontological Resource Management (7/13/98); Management of Museum Collections (DM 411); FLMPA; NEPA; IM 2008-009; and other specific federal regulations outlined in BLM Manual H8270-1. BLM policy laid forth in these guidelines promotes the scientific, educational, and recreational uses of fossils on public lands, mitigates resource conflicts, and develops strategies to regularly monitor public lands where important paleontological localities have been identified. Additionally, the following CDCA management goals apply to the protection of paleontological resources:
• Ensure paleontological resources are given full consideration in land-use planning and management decisions
• Preserve and protect a representative sample of the full array of the CDCA’s paleontological resources
• Ensure proper data recovery of significant paleontological resources where adverse impacts cannot be avoided or otherwise mitigated
In addition to the above requirements, in March 2009, OPLA–PRP was enacted. Title VI, Subtitle D sets forth the law pertaining to paleontological resources on all federally administered lands. OPLA–PRP codifies the BLM practice of requiring that rare and scientifically significant fossils be collected only by qualified researchers who obtain a permit, and is consistent with paleontological guidelines outlined in the Paleontology Resources Management Manual and Handbook H-8270-1. As a result of the enactment of OPLA–PRP, federal agencies will begin developing appropriate plans for the management of paleontological resources and the implementation of OPLA–PRP.
4.8.2 TYPICAL IMPACTS FROM SOLAR ENERGY DEVELOPMENT
Construction of the Applicant’s Ocotillo Sol Project would include grading, foundation excavation, trenching, and fencing. These activities could result in damage, loss, and/or degradation of vertebrate fossils and scientifically significant invertebrate resources. These activities could also result in the discovery of an otherwise undetected paleontological resource.

Environmental Consequences
Ocotillo Sol Project Page 4-89 Draft EIS/Draft CDCA Plan Amendment April 2012
Operation of the Ocotillo Sol Project would not result in additional risks to paleontological resources. After completion of construction activities, solar facility operation would not likely result in further affects to these resources.
Decommissioning of the Ocotillo Sol Project would not be expected to result in adverse impacts to paleontological resources as no additional subsurface grading beyond that conducted under construction activities would occur. Potential impacts to any resources found within the Ocotillo Sol Project area would occur during the ground-disturbing phase of project construction.
Indirect impacts include the potential for increased unauthorized collection of fossils and other paleontological resources resulting from increased numbers of people in the vicinity (i.e., personnel involved in construction and operation of facilities).
4.8.3 IMPACTS BY ALTERNATIVE
4.8.3.1 ALTERNATIVES 1, 4, AND 5
Under Alternative 1, the Ocotillo Sol Project would not be approved by the BLM and the CDCA Plan would not be amended. The Ocotillo Sol Project would not be constructed and the BLM would continue to manage the site consistent with the CDCA Plan (1980, as amended), Yuha Basin ACEC Management Plan (1981), Yuha Desert Wildlife Habitat Management Plan (1983), Yuha Desert Management Plan (1985), and the Flat-tailed Horned Lizard Rangewide Management Strategy.
Under Alternative 4, the Ocotillo Sol Project would not be approved and no ROW grant would be issued to the Applicant. The project area would remain in its existing condition, with no construction of structures or facilities resulting in ground disturbance, and no impacts associated with the Ocotillo Sol Project would occur. Under Alternative 4, the CDCA Plan would be amended to identify the Ocotillo Sol Project area as suitable for solar energy development. As a result, a project might be proposed in the future using the same or different solar energy technology on the project site, possibly resulting in impacts similar to the proposed Ocotillo Sol Project. The impacts of such a future project, however, are speculative at this time.
Under Alternative 5, the Ocotillo Sol Project would not be approved and no ROW grant would be issued to the Applicant. The project area would remain in its existing condition, with no construction of structures or facilities resulting in ground disturbance, and no impacts associated with the Ocotillo Sol Project would occur. Under Alternative 5, the CDCA Plan would be amended to identify the Ocotillo Sol Project area as unsuitable for solar energy development.
There would be no direct or indirect impacts to paleontological resources under Alternatives 1, 4, and 5.
4.8.3.2 ALTERNATIVE 2
Under Alternative 2, the Applicant would construct, operate, maintain, and decommission a 100-acre solar PV facility on BLM-managed lands under an authorized ROW. This alternative includes a 15-acre temporary ROW that would be used as a laydown are during construction of

Environmental Consequences
Page 4-90 Ocotillo Sol Project Draft EIS/Draft CDCA Plan Amendment April 2012
the solar facility. Construction of the Ocotillo Sol Project would include grading, foundation excavation, trenching, and fencing. As noted in Section 4.8.3, these activities could result in damage, loss, and/or degradation of vertebrate fossils and scientifically significant invertebrate resources. Decommissioning of the Ocotillo Sol Project would not result in adverse impacts to paleontological resources.
As detailed in Chapter 3, Section 3.8, the Lake Cahuilla sediments within the Ocotillo Sol Project area are classified under PFYC Class 2 and the Plio-Pleistocene (more recent than circa 5 million years ago) sediments are classified under PFYC Class 3b. The potential for adverse impacts to vertebrate fossils or uncommon invertebrate or plant fossils is low within PFYC Class 2. No assessment or mitigation would be necessary for areas within this class. No direct or indirect impacts to paleontological resources would occur in Class 2 areas.
For portions of the 115-acre Ocotillo Sol Project area that fall within PFYC Class 3b, significant fossils could be present and actions under Alternative 2 could adversely impact paleontological resources. Southwest of the Ocotillo Sol Project area, sediments exhibit geologic features and preservational conditions suggesting significant fossils could be present, and may be the source of the mineralized bone and wood fragments found on the surface within the Ocotillo Sol Project area. Potential adverse impacts to paleontological resource may occur within Class 3b areas.
Mitigation measures as outlined below in Section 4.8.6 would be implemented to avoid and minimize potential adverse impacts to paleontological resource within Class 3b areas. There would be negligible, if any, direct or indirect impacts to paleontological resources under Alternative 2.
4.8.3.3 ALTERNATIVE 3
Under Alternative 3, the Applicant would construct, operate, maintain, and decommission a 100-acre solar PV facility on BLM-managed lands under an authorized ROW. The 15-acre temporary ROW described under Alternative 2 would be reduced to 2 acres under Alternative 3. The 2-acre temporary ROW would provide for parking during construction of the Ocotillo Sol Project. Laydown and staging would occur within the 100-acre Ocotillo Sol Project area as construction activities progress.
Construction of the Ocotillo Sol Project under Alternative 3 would include grading, foundation excavation, trenching, fencing, and laydown area. Adverse impacts described for Alternative 2 would also occur under Alternative 3, with the exception of the reduction in temporary ROW acreage. Mitigation measures as outlined below in Section 4.8.6 would be implemented to avoid and minimize potential adverse impacts to paleontological resources within Class 3b areas. There would be negligible, if any, direct or indirect impacts to paleontological resources under Alternative 3.

Environmental Consequences
Ocotillo Sol Project Page 4-91 Draft EIS/Draft CDCA Plan Amendment April 2012
4.8.4 CUMULATIVE IMPACTS
4.8.4.1 GEOGRAPHIC SCOPE
The cumulative analysis impact area for paleontological resources is the Ocotillo Sol Project area and projects within approximately 1-mile, similar to soil resources. Potential impacts to paleontological resources related to construction, operation and maintenance, and decommissioning activities from to the Applicant’s proposed Ocotillo Sol Project would be site specific and would only occur within the proposed project boundaries. The geographic scope of analysis for cumulative impacts includes a 1-mile area surrounding the project site to incorporate projects in the vicinity that may affect soil sediments and geology.
Past, present, and reasonably foreseeable future projects are listed in Table 4.1-1. Projects within the cumulative analysis impact area are listed in Table 4.1-2. Projects or actions within the 1-mile radius include BLM actions (within BLM-administered lands) such as ongoing road maintenance and recreation designations. Other actions include Imperial Valley Substation operation and maintenance, Sunrise Powerlink, transmission and utility corridor maintenance, recreational activity, and agricultural activities.
The existing condition for paleontological resources in the Ocotillo Sol Project area, which represents the aggregate effect of past and present actions impacting paleontological resources, is described in Chapter 3, Section 3.8. The reasonably foreseeable future projects listed above could result in adverse impacts to paleontological resources, primarily during construction and decommissioning activities. The combination of these projects could deteriorate paleontological resources in the area, but few, if any, paleontological resources are known to occur in the area. Operation and maintenance activities are not anticipated to result cumulative impacts to paleontological resources. Paleontological resource mitigation measures may be required for reasonably foreseeable future projects, depending on the potential for these resources to occur.
4.8.4.2 ALTERNATIVES 1, 4, AND 5
Based on direct and indirect impact analysis presented in Section 4.8.3, it is expected that Alternatives 1, 4, and 5 would not result in impacts to paleontological resources. These alternatives, in combination with other reasonably foreseeable future projects, would not contribute to paleontological resource cumulative impacts in the area.
4.8.4.3 ALTERNATIVES 2 AND 3
Alternatives 2 and 3 would not likely result in adverse impacts to paleontological resources. Activities occurring on lands within a 1-mile radius of the Ocotillo Sol Project area (e.g., recreation, transmission line development and maintenance, and agricultural activities) have had minimal, if any, impacts to paleontological resources within the Ocotillo Sol Project area, and these ongoing activities would likely continue to have minimal, if any, impacts to paleontological resources. Alternatives 2 and 3, when combined with reasonably foreseeable future projects in the area, would not likely result in significant cumulative impacts to paleontological resources in the area.

Environmental Consequences
Page 4-92 Ocotillo Sol Project Draft EIS/Draft CDCA Plan Amendment April 2012
In order to avoid unknown and undiscovered paleontological resources, a Paleontological Monitoring and Recovery Plan would be written to address potential paleontological discoveries, as described below under mitigation measures.
4.8.5 MITIGATION
A project-specific paleontological resources impact mitigation program, including excavation monitoring and fossil salvage by qualified paleontologists, is recommended if, after the project design is finalized, any excavations would extend below Holocene (circa 12,000 years ago to present) sediments. Paleontological monitoring shall be conducted during excavation to mitigate potential adverse impacts to significant nonrenewable paleontological resources, if there are no further geotechnical reports for the Ocotillo Sol Project area. Additional geotechnical information on subsurface geology may provide sufficient information to reduce the need for monitoring during excavation.
4.8.5.1 PALEONTOLOGICAL RESOURCES IMPACT MITIGATION PROGRAM
A qualified paleontologist will develop a paleontological resources impact mitigation program prior to construction to mitigate adverse impacts on paleontological resources if excavations will extend below Holocene sediments. The plan will include the following measures to be followed in the event that fossil materials are encountered during construction:
The monitoring and mitigation plan shall include a schedule and plan for monitoring earth-moving activities, and a provision that monitoring personnel have the authority to temporarily halt or divert excavation activities to allow removal of fossil specimens and recording of information on the location, orientation, etc. associated with the collected specimen.
Worker awareness training will be implemented to ensure that the construction personnel understand the potential for fossil remains being uncovered and/or disturbed by earth-moving activities; where such remains are most likely to be encountered during earth moving; and requirements and procedures to be followed in the event of suspected fossil discoveries. The awareness training may be given along with other sensitivity trainings (e.g., for biological resources) or incorporated into tailgate safety meetings.
The Applicant will have a paleontology monitor on site during construction when there are ground-disturbing activities in areas of identified moderate to high paleontological sensitivity.
Recovered fossils will be curated with a museum or other curation facility approved by the BLM.
Emergency stop work and notification procedures in the case of encountering significant paleontological resources.
4.8.6 IRREVERSIBLE OR IRRETRIEVABLE COMMITMENT OF RESOURCES
Construction and decommissioning of the Ocotillo Sol Project would not likely result in adverse impacts to paleontological resources. Mitigation measures would be implemented to avoid and minimize potential adverse impacts to undiscovered paleontological resources within Class 3b

Environmental Consequences
Ocotillo Sol Project Page 4-93 Draft EIS/Draft CDCA Plan Amendment April 2012
areas. No unavoidable adverse impacts to paleontological resources are likely to occur and no irreversible or irretrievable commitment of paleontological resources would likely occur.

Environmental Consequences
Page 4-94 Ocotillo Sol Project Draft EIS/Draft CDCA Plan Amendment April 2012
4.9 FIRE AND FUELS
4.9.1 MANAGEMENT GOALS
The Ocotillo Sol Project area falls within the San Diego Fire Management Unit. Planning and management actions for fire and fuels on BLM lands are implemented under the Fire and Aviation Directorate as well as the fuels management program.
4.9.2 TYPICAL IMPACTS FROM SOLAR ENERGY DEVELOPMENT
Primary impacts to wildland fire ecology can be characterized as those actions that limit or enhance the ability to suppress fire. Wildland fires are typically infrequent in desert areas, but can be more common within riparian zones. Areas leased for ROWs, or other land use authorizations may inadvertently create fuel breaks that provide access routes for wildfire suppression. Any development within ROWs or other land use authorizations may also result in wildland fire hazards by promoting the spread of noxious weeds.
4.9.3 IMPACTS BY ALTERNATIVE
4.9.3.1 ALTERNATIVES 1, 4, AND 5
Under Alternative 1, the Ocotillo Sol Project would not be approved by the BLM and the CDCA Plan would not be amended. The Ocotillo Sol Project would not be constructed and the BLM would continue to manage the site consistent with the CDCA Plan (1980, as amended), Yuha Basin ACEC Management Plan (1981), Yuha Desert Wildlife Habitat Management Plan (1983), Yuha Desert Management Plan (1985), and the Flat-tailed Horned Lizard Rangewide Management Strategy.
Under Alternative 4, the Ocotillo Sol Project would not be approved and no ROW grant would be issued to the Applicant. The project area would remain in its existing condition, with no construction of structures or facilities resulting in ground disturbance, and no impacts associated with the Ocotillo Sol Project would occur. Under Alternative 4, the CDCA Plan would be amended to identify the Ocotillo Sol Project area as suitable for solar energy development. As a result, a project might be proposed in the future using the same or different solar energy technology on the project site, possibly resulting in impacts similar to the proposed Ocotillo Sol Project. The impacts of such a future project, however, are speculative at this time.
Under Alternative 5, the Ocotillo Sol Project would not be approved and no ROW grant would be issued to the Applicant. The project area would remain in its existing condition, with no construction of structures or facilities resulting in ground disturbance, and no impacts associated with the Ocotillo Sol Project would occur. Under Alternative 5, the CDCA Plan would be amended to identify the Ocotillo Sol Project area as unsuitable for solar energy development.

Environmental Consequences
Ocotillo Sol Project Page 4-95 Draft EIS/Draft CDCA Plan Amendment April 2012
No wildland fire-related direct or indirect adverse impacts would occur under Alternatives 1, 4, and 5.
4.9.3.2 ALTERNATIVE 2
Under Alternative 2, the Applicant would construct, operate, maintain, and decommission a 100-acre solar PV facility on BLM-managed lands under an authorized ROW. This alternative includes a 15-acre temporary ROW that would be used as a laydown area during construction of the solar facility. Construction of the Applicant’s Ocotillo Sol Project would include grading, foundation excavation, trenching, and fencing. Construction of the project would result in the removal of vegetation within the 115-acre ROW. Vegetation removal would reduce the already low fire risk within the project area and would not change the fire risk near the project. Grading of the area as well as disturbance to native vegetation could lead to increased noxious, invasive weed species, which may increase wildland fire potential within and surrounding the project area. A Weed Management Plan (as outlined in Section 4.9.5) as well as construction, operation and maintenance, and decommissioning BMPs would be implemented to reduce the invasion and spread of noxious and invasive weed species and reduce the potential for wildland fire.
Under Alternative 2, potential wildland fire related negligible adverse impacts may occur. These impacts would be avoided by implementing a Weed Management Plan and BMPs, as previously described.
4.9.3.3 ALTERNATIVE 3
Under Alternative 3, the Applicant would construct, operate, maintain, and decommission a 100-acre solar PV facility on BLM-managed lands under an authorized ROW. The 15-acre temporary ROW described under Alternative 2 would be reduced to 2 acres under Alternative 3. The 2-acre temporary ROW would provide for parking during construction of the Ocotillo Sol Project. Laydown and staging would occur within the 100-acre ROW as construction activities progress.
Construction under Alternative 3 would include grading, foundation excavation, trenching, and fencing. As with Alternative 2, construction of the project would result in the removal of vegetation within the approved ROW (102 acres under Alternative 3). Vegetation removal would reduce the already low fire risk within the project area and would not change the fire risk near the project. The potential for wildland fire from the spread of noxious, invasive weed species would be similar as described under Alternative 2. A Weed Management Plan (as outlined in Section 4.9.5) in addition to construction, operation and maintenance, and decommissioning BMPs would be implemented to reduce the invasion and spread of noxious, invasive weed species and reduce the potential for wildland fire.
Under Alternative 3, potential wildland fire related negligible adverse impacts may occur. These impacts would be avoided by implementing a Weed Management Plan and BMPs, as previously described.

Environmental Consequences
Page 4-96 Ocotillo Sol Project Draft EIS/Draft CDCA Plan Amendment April 2012
4.9.4 CUMULATIVE IMPACTS
4.9.4.1 GEOGRAPHIC SCOPE
The cumulative analysis impact area for wildland fire is an approximate 1-mile radius around the Ocotillo Sol Project area. The vegetation community surrounding the Ocotillo Sol Project area (creosote bush–white burr sage scrub vegetation) is not known to be highly flammable or burn at high heat. Fire is not likely to spread at a rapid rate within this sparse vegetation community. Projects in the vicinity would also not likely result in a fire that would spread at a rapid rate. Any fire would be detected by remote surveillance of the project site or adjacent Imperial Valley Substation security detection system.
Past, present, and reasonably foreseeable future projects are listed in Table 4.1-1. Projects within the cumulative analysis impact area are listed in Table 4.1-2. Projects or actions within the 1-mile radius include BLM actions (within BLM-administered lands) such as ongoing road maintenance and recreation designations. Other actions include Imperial Valley Substation operation and maintenance; Sunrise Powerlink; transmission and utility corridor maintenance; recreational activity; and agricultural activities.
The existing condition for fire and fuels in the Ocotillo Sol Project area, which represents the aggregate effect of past and present actions resulting in fire risk, is described in Chapter 3, Section 3.9. Reasonably foreseeable future projects could result in adverse impacts related to fire and fuels, primarily during construction and decommissioning activities. The combination of these projects could result in increased fire danger due to the spread of weed species or ignition sources (e.g., construction vehicles or increased traffic). No fires have occurred historically in the area, however, and little fuel for the spread of fire exists within the area. Operation and maintenance activities are not anticipated to result cumulative impacts related to fire and fuels. Fire and fuels BMPs and mitigation measures would be required for reasonably foreseeable future projects.
4.9.4.2 ALTERNATIVES 1, 4, AND 5
Based on direct and indirect impact analysis presented in Section 4.9.3, it is expected that Alternatives 1, 4, and 5 would not result in fire related impacts. These alternatives, in combination with other reasonably foreseeable future projects, would not contribute to wildland fire cumulative impacts in the area.
4.9.4.3 ALTERNATIVES 2 AND 3
Alternatives 2 and 3, as well as other reasonably foreseeable future projects, may result in fire related adverse impacts. Activities occurring on lands within a 1-mile radius of the Ocotillo Sol Project area (e.g., recreation, transmission line development and maintenance, and agricultural activities) have not resulted in wildland fires, and these ongoing activities would likely continue to have minimal, if any, impacts related to fire potential. The Imperial Valley Substation, immediately adjacent to the Ocotillo Sol Project area, has a water tank to combat fires. In addition, fire extinguishers would be placed within the Ocotillo Sol Project site, once developed. These resources would be available to combat wildfires.

Environmental Consequences
Ocotillo Sol Project Page 4-97 Draft EIS/Draft CDCA Plan Amendment April 2012
With implementation of mitigation measures outlined in Section 4.9.5 below, as well as BMPs during construction, operation and maintenance, and decommissioning, Alternatives 2 and 3 would not likely result in a cumulatively adverse impacts related to wildland fire when combined with other past, present, and reasonably foreseeable projects in the area.
4.9.5 MITIGATION
A Weed Management Plan, described in Section 4.6.4, would be implemented to reduce the invasion and spread of noxious, non-native weed species that could increase wildland fire risk. BMPs during construction, operation and maintenance, and decommissioning to avoid fire risk would also be implemented.
4.9.6 IRREVERSIBLE AND IRRETRIEVABLE COMMITMENT OF RESOURCES
Construction, operation and maintenance, and decommissioning of the Ocotillo Sol Project could result in negligible adverse impacts related to fire and fuels hazards. Mitigation measures would be implemented to avoid impacts related to fire and fuels hazards, as detailed above. No unavoidable adverse impacts related to fire and fuels hazards are likely to occur and no irreversible and irretrievable commitment of resources would occur.

Environmental Consequences
Page 4-98 Ocotillo Sol Project Draft EIS/Draft CDCA Plan Amendment April 2012
4.10 LANDS AND REALTY
4.10.1 MANAGEMENT GOALS
The CDCA Plan does not have any formal management goals for the lands and realty program.
4.10.2 TYPICAL IMPACTS FROM SOLAR ENERGY DEVELOPMENT
Impacts to lands and realty could occur during construction of solar fields by interrupting routes of travel through additional traffic from construction vehicles, equipment haul vehicles (possibly oversized), and workers. Solar facilities may conflict with other land use activities such as recreation. Solar facilities could also eliminate all other potential uses of an area.
4.10.3 IMPACTS BY ALTERNATIVE
4.10.3.1 ALTERNATIVES 1, 4, AND 5
Under Alternative 1, the Ocotillo Sol Project would not be approved by the BLM and the CDCA Plan would not be amended. The Ocotillo Sol Project would not be constructed and the BLM would continue to manage the site consistent with the CDCA Plan (1980, as amended), Yuha Basin ACEC Management Plan (1981), Yuha Desert Wildlife Habitat Management Plan (1983), Yuha Desert Management Plan (1985), and the Flat-tailed Horned Lizard Rangewide Management Strategy.
Under Alternative 4, the Ocotillo Sol Project would not be approved and no ROW grant would be issued to the Applicant. The project area would remain in its existing condition, with no construction of structures or facilities resulting in ground disturbance, and no impacts associated with the Ocotillo Sol Project would occur. Under Alternative 4, the CDCA Plan would be amended to identify the Ocotillo Sol Project area as suitable for solar energy development. As a result, a project might be proposed in the future using the same or different solar energy technology on the project site, possibly resulting in impacts similar to the proposed Ocotillo Sol Project. The impacts of such a future project, however, are speculative at this time.
Under Alternative 5, the Ocotillo Sol Project would not be approved and no ROW grant would be issued to the Applicant. The project area would remain in its existing condition, with no construction of structures or facilities resulting in ground disturbance, and no impacts associated with the Ocotillo Sol Project would occur. Under Alternative 5, the CDCA Plan would be amended to identify the Ocotillo Sol Project area as unsuitable for solar energy development.
There would be no direct or indirect adverse impacts to lands and realty under Alternatives 1, 4, and 5.

Environmental Consequences
Ocotillo Sol Project Page 4-99 Draft EIS/Draft CDCA Plan Amendment April 2012
4.10.3.2 ALTERNATIVE 2
Under Alternative 2, the Applicant would construct, operate, maintain, and decommission a 100-acre solar PV facility on BLM-managed lands under an authorized ROW. This alternative includes a 15-acre temporary ROW that would be used as a laydown area during construction of the solar facility. Under Alternative 2, the CDCA Plan would be amended to identify the Ocotillo Sol Project area as suitable for solar energy development. The CDCA Plan amendment would result in the possibility of development of the same or different solar energy technology in the project area after decommissioning of the Ocotillo Sol Project.
Solar energy development within the Ocotillo Sol Project area would occur within the designated Utility Corridor N and would not conflict with the CDCA Plan. The Ocotillo Sol Project would not conflict with existing BLM land use authorizations or existing realty agreements. With implementation of mitigation measures previously outlined for biological resource impacts (Section 4.6.4), the Ocotillo Sol Project would be compatible with the Yuha Basin ACEC Plan, the Yuha Desert Wildlife Management Area plan, and Flat-tailed Horned Lizard Rangewide Management Strategy.
Alternative 2 would not result in direct or indirect adverse impacts to lands and realty.
4.10.3.3 ALTERNATIVE 3
Under Alternative 3, the Applicant would construct, operate, maintain, and decommission a 100-acre solar PV facility on BLM-managed lands under an authorized ROW. The 15-acre temporary ROW described under Alternative 2 would be reduced to 2 acres under Alternative 3. The 2-acre temporary ROW would provide for parking during construction of the Ocotillo Sol Project. Laydown and staging would occur within the 100-acre ROW as construction activities progress.
Under Alternative 3, the CDCA Plan would be amended to identify the Ocotillo Sol Project area as suitable for solar energy development. The CDCA Plan amendment would result in the possibility of development of the same or different solar energy technology in the project area after decommissioning of the Ocotillo Sol Project.
As described under Alternative 2, under Alternative 3 the Ocotillo Sol Project area would occur within the designated Utility Corridor N, would not conflict with the CDCA Plan, or conflict with existing BLM land use authorizations or existing realty agreements. With implementation of mitigation measures previously outlined for biological resource impacts (Section 4.6.4), the Ocotillo Sol Project would be compatible with the Yuha Basin ACEC Management Plan and Flat-tailed Horned Lizard Rangewide Management Strategy.
Alternative 3 would not result in direct or indirect adverse impacts to lands and realty.

Environmental Consequences
Page 4-100 Ocotillo Sol Project Draft EIS/Draft CDCA Plan Amendment April 2012
4.10.4 CUMULATIVE IMPACTS
4.10.4.1 GEOGRAPHIC SCOPE
The cumulative analysis impact area for lands and realty is the Imperial County area in the region surrounding the Ocotillo Sol Project. Cumulative impacts to lands and realty could result from conflicts with any applicable land use plans, policies, or regulations adopted for the purpose of avoiding or mitigating environmental impacts. Cumulative analysis includes the renewable energy projects and other actions within approximately 20 miles of the Ocotillo Sol Project area which may incur impacts to the existing on-site land uses or need to undergo a similar consistency analysis for plans, policies, and regulations.
Past, present, and reasonably foreseeable future projects are listed in Table 4.1-1. Projects within the cumulative analysis impact area are listed in Table 4.1-2. Project or actions include BLM actions (within BLM-administered lands) such as ongoing road maintenance and recreation designations. Other actions include the following: Imperial Valley Substation operation and maintenance, Imperial Valley Substation expansion for North Gila to Imperial Valley Substation #2 transmission line, Sunrise Powerlink, transmission and utility corridor maintenance, Interstate 8 and Highway 98, agricultural activities, recreational activity, North Gila to Imperial Valley Substation #2 transmission line, Dixieland Imperial Irrigation District transmission line and connection, Geothermal Overlay, Rancho Los Lagos, Brookfield Specific Plan, Desert Springs Oasis, Alder 70, Mosaic Specific Plan, sand and gravel mining, and Imperial Irrigation District canal and drain maintenance. Renewable energy projects include the following:
Calexico Solar Farm II Mount Signal Solar Farm Calexico Solar Farm I Imperial Solar Energy Center South Solar Farm Centinela Solar Farm Acorn Greenworks Solar Farm Silverleaf Solar Farm Campo Verde Solar Farm (and shared transmission line with Silverleaf Solar Farm) Imperial Solar Energy Center West Solar Farm Keystone Solar Ocotillo Express Wind Farm
The existing condition for lands and realty in the Ocotillo Sol Project area, which represents the aggregate effect of past and present actions impacting lands and realty, is described in Chapter 3, Section 3.10. The reasonably foreseeable future projects listed above could result in conflicts with existing land uses, conflict with applicable plans, policies, or regulations. Renewable energy projects in the area, however, would occur primarily on undeveloped lands or areas of rural development. In addition, these projects would not create a physical division of established communities. Mitigation measures related to decommissioning would result in restoration of sites to pre-construction conditions as much as possible.

Environmental Consequences
Ocotillo Sol Project Page 4-101 Draft EIS/Draft CDCA Plan Amendment April 2012
4.10.4.2 ALTERNATIVES 1, 4, AND 5
Based on direct and indirect impact analysis presented in Section 4.10.3, it is expected that Alternatives 1, 4, and 5 would not result in impacts to lands and realty. These alternatives would be consistent with applicable plans, policies, and regulations and would not interfere with existing land uses. These alternatives, in combination with other reasonably foreseeable future projects, would not contribute to cumulative impacts to lands and realty.
4.10.4.3 ALTERNATIVES 2 AND 3
Alternatives 2 and 3 would not result in adverse impacts to lands and realty. Renewable energy projects and other activities within approximately 20 miles of the Ocotillo Sol Project area have been consistent with applicable plans, policies, and regulations in the region. Alternatives 2 and 3 would also be consistent with applicable plans, policies, and regulations and would not interfere with existing land uses. Alternatives 2 and 3, in combination with other reasonably foreseeable future projects, would not contribute to cumulative impacts to lands and realty.
4.10.5 MITIGATION
No mitigation measures for lands and realty would be required.
4.10.6 IRREVERSIBLE AND IRRETRIEVABLE COMMITMENT OF RESOURCES
No direct or indirect impacts to lands and realty would occur due to the Ocotillo Sol Project. The footprint of the Ocotillo Sol Project would limit future use of 100 acres of BLM-administered land for other uses for the life of the project and would result in irreversible and irretrievable commitment of the resource. The Ocotillo Sol Project, however, would not interfere with existing land uses such as recreation, and would not conflict with current plans, policies, and regulations.

Environmental Consequences
Page 4-102 Ocotillo Sol Project Draft EIS/Draft CDCA Plan Amendment April 2012
4.11 SPECIAL DESIGNATIONS
4.11.1 MANAGEMENT GOALS
BLM Wilderness Area management goals are as follows:
• Until Congressional release or designation as wilderness, provide protection of wilderness values so those values are not degraded to a point that significantly constrains the recommendation with respect to an area’s suitability or non-suitability for preservation as wilderness
• Provide a wilderness system possessing a variety of opportunities for primitive and unconfined types of recreation, involving a diversity of ecosystems and landforms, geographically distributed throughout the desert.
• Manage a wilderness system in an unimpaired state, preserving wilderness values and primitive recreation opportunities while providing for acceptable use.
For ACECs and Special Areas, the CDCA Plan provides the following management goals:
• Identify and protect the significant natural and cultural resources requiring special management attention found in BLM-administered lands in the CDCA.
• Provide for other uses in the designated areas, compatible with the protection and enhancement of the significant natural and cultural resources.
• Systematically monitor the preservation of the significant natural and cultural resources on BLM-administered lands, and the compatibility of other allowable uses with these resources.
National Historic Trails are managed to protect historic routes, historic remnants, and artifacts for public use and enjoyment.
4.11.2 TYPICAL IMPACTS FROM SOLAR ENERGY DEVELOPMENT
Impacts to special designations could occur from the loss or disturbance of significant features within these areas, such as the degradation of wilderness values or the loss or degradation of significant natural and cultural resources. Impacts could occur to National Historic Trails from construction of facilities by diminishing scenic quality or affecting access to trails.
4.11.3 IMPACTS BY ALTERNATIVE
4.11.3.1 ALTERNATIVES 1, 4, AND 5
Under Alternative 1, the Ocotillo Sol Project would not be approved by the BLM and the CDCA Plan would not be amended. The Ocotillo Sol Project would not be constructed and the BLM

Environmental Consequences
Ocotillo Sol Project Page 4-103 Draft EIS/Draft CDCA Plan Amendment April 2012
would continue to manage the site consistent with the CDCA Plan (1980, as amended), Yuha Basin ACEC Management Plan (1981), Yuha Desert Wildlife Habitat Management Plan (1983), Yuha Desert Management Plan (1985), and the Flat-tailed Horned Lizard Rangewide Management Strategy.
Under Alternative 4, the Ocotillo Sol Project would not be approved and no ROW grant would be issued to the Applicant. The project area would remain in its existing condition, with no construction of structures or facilities resulting in ground disturbance, and no impacts associated with the Ocotillo Sol Project would occur. Under Alternative 4, the CDCA Plan would be amended to identify the Ocotillo Sol Project area as suitable for solar energy development. As a result, a project might be proposed in the future using the same or different solar energy technology on the project site, possibly resulting in impacts similar to the proposed Ocotillo Sol Project. The impacts of such a future project, however, are speculative at this time.
Under Alternative 5, the Ocotillo Sol Project would not be approved and no ROW grant would be issued to the Applicant. The project area would remain in its existing condition, with no construction of structures or facilities resulting in ground disturbance, and no impacts associated with the Ocotillo Sol Project would occur. Under Alternative 5, the CDCA Plan would be amended to identify the Ocotillo Sol Project area as unsuitable for solar energy development.
There would be no direct or indirect impacts to special designations under Alternatives 1, 4, and 5.
4.11.3.2 ALTERNATIVE 2
Under Alternative 2, the Applicant would construct, operate, maintain, and decommission a 100-acre solar PV facility on BLM-managed lands under an authorized ROW. This alternative includes a 15-acre temporary ROW that would be used as a laydown area during construction of the solar facility. Under Alternative 2, the CDCA Plan would be amended to identify the Ocotillo Sol Project area as suitable for solar energy development. The CDCA Plan amendment would result in the possibility of development of the same or different solar energy technology in the project area after decommissioning of the Ocotillo Sol Project.
Solar energy development within the Ocotillo Sol Project area would occur within the designated Utility Corridor N and would not conflict with the CDCA Plan. With implementation of mitigation measures outlined for biological resources (Section 4.6.4), the Ocotillo Sol Project would be compatible with the Yuha Basin ACEC Plan, the Yuha Desert Wildlife Management Area plan, and Flat-tailed Horned Lizard Rangewide Management Strategy.
The Ocotillo Sol Project area lies 11.6 miles to the northeast of the Jacumba Mountain Wilderness. The solar facility may be visible from a small portion of the wilderness area (see Visual Resources analysis in Section 4.13). The Ocotillo Sol Project area is approximately 4.5 miles northeast of the nearest portion of the Juan Bautista de Anza National Historic Trail. Views of the solar facility would be minimal, if visible at all (see Visual Resource analysis in Section 4.13). Construction, operation and maintenance, and decommissioning related activities for the Ocotillo Sol Project would not impact these areas or affect access.

Environmental Consequences
Page 4-104 Ocotillo Sol Project Draft EIS/Draft CDCA Plan Amendment April 2012
Under Alternative 2, no direct or indirect impacts would occur to special designation areas.
4.11.3.3 ALTERNATIVE 3
Under Alternative 3, the Applicant would construct, operate, maintain, and decommission a 100-acre solar PV facility on BLM-managed lands under an authorized ROW. The 15-acre temporary ROW described under Alternative 2 would be reduced to 2 acres under Alternative 3. The 2-acre temporary ROW would provide for parking during construction of the Ocotillo Sol Project. Laydown and staging would occur within the 100-acre ROW as construction activities progress.
Impacts to special designation areas would be the same under Alternative 3 as discussed above for Alternative 2. Implementation mitigation measures outlined for biological resources (Section 4.6.7) would also occur under Alternative 3. Alternative 3 would not conflict with the CDCA Plan and would be compatible with the Yuha Basin ACEC Management Plan and Flat-tailed Horned Lizard Rangewide Management Strategy.
Construction, operation and maintenance, and decommissioning related activities for the Ocotillo Sol Project would not impact the Jacumba Mountains Wilderness or Juan Bautista de Anza National Historic Trail, nor affect access to these areas.
Under Alternative 3, no direct or indirect impacts would occur to special designation areas.
4.11.4 CUMULATIVE IMPACTS
4.11.4.1 GEOGRAPHIC SCOPE
The cumulative analysis impact area for special designations is similar to that analyzed for lands and realty, which is the Imperial County area in the region surrounding the Ocotillo Sol Project area. Cumulative impacts to special designations could result from conflicts with any applicable land use plans, policies, or regulations adopted for the purpose of avoiding or mitigating environmental impacts within these areas. Cumulative analysis includes the renewable energy projects and other actions within approximately 20 miles of the Ocotillo Sol Project area that may incur impacts to special designation areas and require an analysis for consistency with applicable plans or policies.
Past, present, and reasonably foreseeable future projects are listed in Table 4.1-1. Projects within the cumulative analysis impact area are listed in Table 4.1-2. Project or actions include BLM actions (within BLM-administered lands) such as ongoing road maintenance and recreation designations. Other actions include the following: Imperial Valley Substation operation and maintenance, Imperial Valley Substation expansion for North Gila to Imperial Valley Substation #2 transmission line, Sunrise Powerlink; transmission and utility corridor maintenance, Interstate 8 and Highway 98, agricultural activities, recreational activity, North Gila to Imperial Valley Substation #2 transmission line, Dixieland Imperial Irrigation District transmission line and connection, Geothermal Overlay, Rancho Los Lagos, Brookfield Specific Plan, Desert Springs Oasis, Alder 70, Mosaic Specific Plan, sand and gravel mining, and Imperial Irrigation District canal and drain maintenance. Renewable energy projects include the following:

Environmental Consequences
Ocotillo Sol Project Page 4-105 Draft EIS/Draft CDCA Plan Amendment April 2012
Calexico Solar Farm II Mount Signal Solar Farm Calexico Solar Farm I Imperial Solar Energy Center South Solar Farm Centinela Solar Farm Acorn Greenworks Solar Farm Silverleaf Solar Farm Campo Verde Solar Farm (and shared transmission line with Silverleaf Solar Farm) Imperial Solar Energy Center West Solar Farm Keystone Solar Ocotillo Express Wind Farm
The existing condition for special designations in the Ocotillo Sol Project area, which represents the aggregate effect of past and present actions impacting lands and realty, is described in Chapter 3, Section 3.11. The reasonably foreseeable future projects listed above could result in minor adverse impacts to special designation areas in the region. The combination of these industrial development projects could deteriorate the scenic quality of an area and create emissions and noise. Reasonably foreseeable future projects would occur outside of special designation areas and primarily within fallow agricultural fields or adjacent to existing industrial development or structures (e.g., along existing utility corridors or adjacent to the Imperial Valley Substation). Cumulative impacts to special designation areas from reasonably foreseeable future development are anticipated to be negligible overall.
4.11.4.2 ALTERNATIVES 1, 4, AND 5
Based on direct and indirect impact analysis presented in Section 4.11.3, it is expected that Alternatives 1, 4, and 5 would not result in impacts to special designations. These alternatives would be consistent with applicable plans, policies, and regulations for these areas and would not interfere with management. These alternatives, in combination with other reasonably foreseeable future projects, would not contribute to cumulative impacts to special designation areas.
4.11.4.3 ALTERNATIVES 2 AND 3
Alternatives 2 and 3 would not result in adverse impacts to special designation areas. Renewable energy projects and other activities within approximately 20 miles of the Ocotillo Sol Project area have been consistent with applicable plans, policies, and regulations for these special designation areas. Alternatives 2 and 3 would also be consistent with applicable plans, policies, and regulations for special designation areas and would not interfere with management. Alternatives 2 and 3, when combined with other reasonably foreseeable future projects, would not contribute to cumulative impacts to special designation areas.
4.11.5 MITIGATION
No mitigation measures for special designations would be required.

Environmental Consequences
Page 4-106 Ocotillo Sol Project Draft EIS/Draft CDCA Plan Amendment April 2012
4.11.6 IRREVERSIBLE AND IRRETRIEVABLE COMMITMENT OF RESOURCES
No direct or indirect impacts to special designations would occur due to the Ocotillo Sol Project and no irreversible and irretrievable commitment of these resources would occur. No unavoidable adverse impacts to special designations are expected to occur.

Environmental Consequences
Ocotillo Sol Project Page 4-107 Draft EIS/Draft CDCA Plan Amendment April 2012
4.12 RECREATION
4.12.1 MANAGEMENT GOALS
The CDCA Plan provides overall management direction for all public lands in the CDCA. The CDCA Plan lists the following management goals:
• Provide for a wide range of quality recreation opportunities and experiences emphasizing dispersed undeveloped use
• Provide minimum use recreation facilities. These facilities should emphasize resource protection and visitor safety
• Manage recreation use to minimize user conflicts, provide a safe recreation environment, and protect desert resources
• Emphasize the use of public information and education techniques to increase public awareness, enjoyment, and sensitivity to desert resources
• Adjust management approach to accommodate changing visitor use patterns and preferences
• Encourage the use and enjoyment of desert recreation opportunities by special populations, and provide facilities to meet the needs of these groups
4.12.2 TYPICAL IMPACTS FROM SOLAR ENERGY DEVELOPMENT
Solar development could result in a short-term reduction in the land available for recreational use and in diminished experiences for recreational users on lands that remain open for recreation. Visual impacts, intermittent noise associated with construction, and the temporary loss of access for recreational use affecting the recreational experience could also result during the construction of solar facilities.
4.12.3 IMPACTS BY ALTERNATIVE
4.12.3.1 ALTERNATIVES 1, 4, AND 5
Under Alternative 1, the Ocotillo Sol Project would not be approved by the BLM and the CDCA Plan would not be amended. The Ocotillo Sol Project would not be constructed and the BLM would continue to manage the site consistent with the CDCA Plan (1980, as amended), Yuha Basin ACEC Management Plan (1981), Yuha Desert Wildlife Habitat Management Plan (1983), Yuha Desert Management Plan (1985), and the Flat-tailed Horned Lizard Rangewide Management Strategy.
Under Alternative 4, the Ocotillo Sol Project would not be approved and no ROW grant would be issued to the Applicant. The project area would remain in its existing condition, with no construction of structures or facilities resulting in ground disturbance, and no impacts associated with the Ocotillo Sol Project would occur. Under Alternative 4, the CDCA Plan would be amended to identify the Ocotillo Sol Project area as suitable for solar energy development. As a
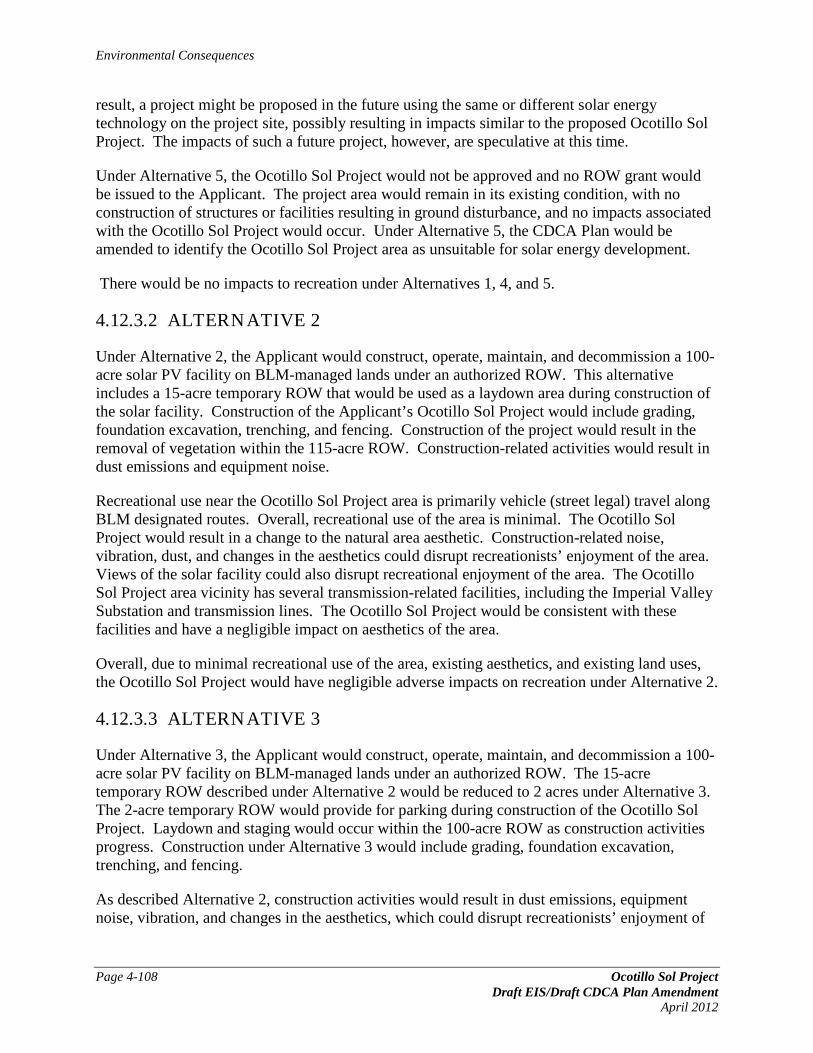
Environmental Consequences
Page 4-108 Ocotillo Sol Project Draft EIS/Draft CDCA Plan Amendment April 2012
result, a project might be proposed in the future using the same or different solar energy technology on the project site, possibly resulting in impacts similar to the proposed Ocotillo Sol Project. The impacts of such a future project, however, are speculative at this time.
Under Alternative 5, the Ocotillo Sol Project would not be approved and no ROW grant would be issued to the Applicant. The project area would remain in its existing condition, with no construction of structures or facilities resulting in ground disturbance, and no impacts associated with the Ocotillo Sol Project would occur. Under Alternative 5, the CDCA Plan would be amended to identify the Ocotillo Sol Project area as unsuitable for solar energy development.
There would be no impacts to recreation under Alternatives 1, 4, and 5.
4.12.3.2 ALTERNATIVE 2
Under Alternative 2, the Applicant would construct, operate, maintain, and decommission a 100-acre solar PV facility on BLM-managed lands under an authorized ROW. This alternative includes a 15-acre temporary ROW that would be used as a laydown area during construction of the solar facility. Construction of the Applicant’s Ocotillo Sol Project would include grading, foundation excavation, trenching, and fencing. Construction of the project would result in the removal of vegetation within the 115-acre ROW. Construction-related activities would result in dust emissions and equipment noise.
Recreational use near the Ocotillo Sol Project area is primarily vehicle (street legal) travel along BLM designated routes. Overall, recreational use of the area is minimal. The Ocotillo Sol Project would result in a change to the natural area aesthetic. Construction-related noise, vibration, dust, and changes in the aesthetics could disrupt recreationists’ enjoyment of the area. Views of the solar facility could also disrupt recreational enjoyment of the area. The Ocotillo Sol Project area vicinity has several transmission-related facilities, including the Imperial Valley Substation and transmission lines. The Ocotillo Sol Project would be consistent with these facilities and have a negligible impact on aesthetics of the area.
Overall, due to minimal recreational use of the area, existing aesthetics, and existing land uses, the Ocotillo Sol Project would have negligible adverse impacts on recreation under Alternative 2.
4.12.3.3 ALTERNATIVE 3
Under Alternative 3, the Applicant would construct, operate, maintain, and decommission a 100-acre solar PV facility on BLM-managed lands under an authorized ROW. The 15-acre temporary ROW described under Alternative 2 would be reduced to 2 acres under Alternative 3. The 2-acre temporary ROW would provide for parking during construction of the Ocotillo Sol Project. Laydown and staging would occur within the 100-acre ROW as construction activities progress. Construction under Alternative 3 would include grading, foundation excavation, trenching, and fencing.
As described Alternative 2, construction activities would result in dust emissions, equipment noise, vibration, and changes in the aesthetics, which could disrupt recreationists’ enjoyment of
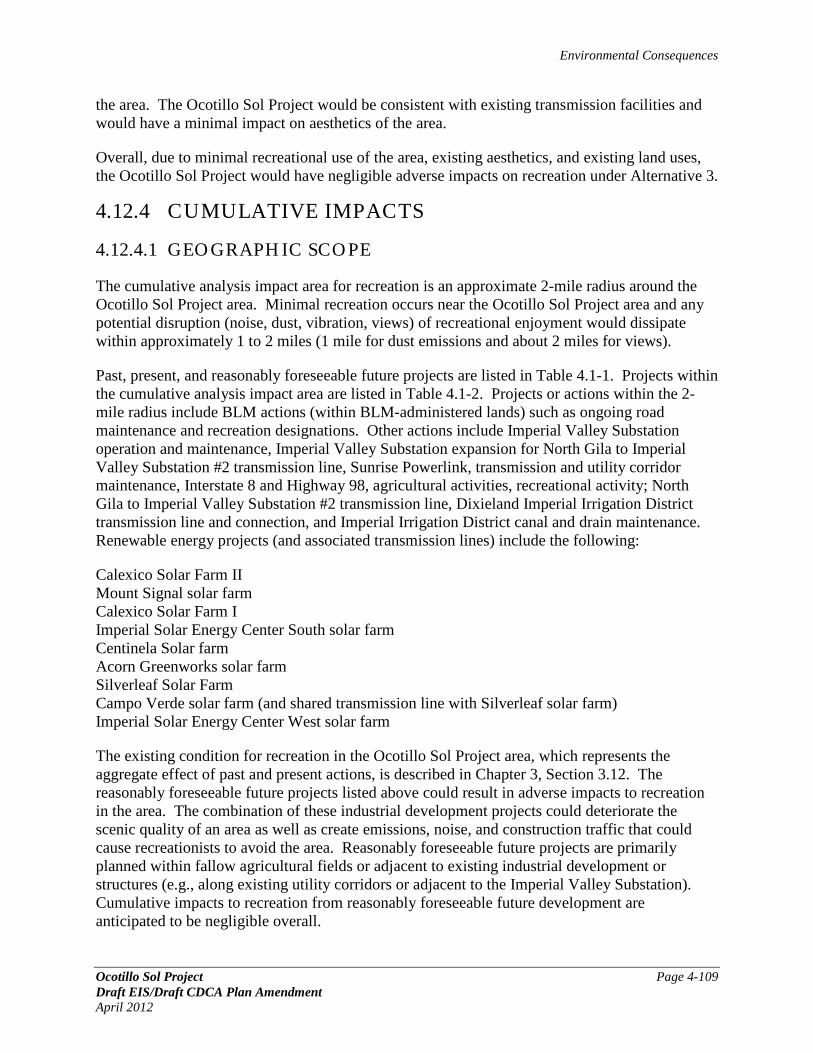
Environmental Consequences
Ocotillo Sol Project Page 4-109 Draft EIS/Draft CDCA Plan Amendment April 2012
the area. The Ocotillo Sol Project would be consistent with existing transmission facilities and would have a minimal impact on aesthetics of the area.
Overall, due to minimal recreational use of the area, existing aesthetics, and existing land uses, the Ocotillo Sol Project would have negligible adverse impacts on recreation under Alternative 3.
4.12.4 CUMULATIVE IMPACTS
4.12.4.1 GEOGRAPHIC SCOPE
The cumulative analysis impact area for recreation is an approximate 2-mile radius around the Ocotillo Sol Project area. Minimal recreation occurs near the Ocotillo Sol Project area and any potential disruption (noise, dust, vibration, views) of recreational enjoyment would dissipate within approximately 1 to 2 miles (1 mile for dust emissions and about 2 miles for views).
Past, present, and reasonably foreseeable future projects are listed in Table 4.1-1. Projects within the cumulative analysis impact area are listed in Table 4.1-2. Projects or actions within the 2-mile radius include BLM actions (within BLM-administered lands) such as ongoing road maintenance and recreation designations. Other actions include Imperial Valley Substation operation and maintenance, Imperial Valley Substation expansion for North Gila to Imperial Valley Substation #2 transmission line, Sunrise Powerlink, transmission and utility corridor maintenance, Interstate 8 and Highway 98, agricultural activities, recreational activity; North Gila to Imperial Valley Substation #2 transmission line, Dixieland Imperial Irrigation District transmission line and connection, and Imperial Irrigation District canal and drain maintenance. Renewable energy projects (and associated transmission lines) include the following:
Calexico Solar Farm II Mount Signal solar farm Calexico Solar Farm I Imperial Solar Energy Center South solar farm Centinela Solar farm Acorn Greenworks solar farm Silverleaf Solar Farm Campo Verde solar farm (and shared transmission line with Silverleaf solar farm) Imperial Solar Energy Center West solar farm
The existing condition for recreation in the Ocotillo Sol Project area, which represents the aggregate effect of past and present actions, is described in Chapter 3, Section 3.12. The reasonably foreseeable future projects listed above could result in adverse impacts to recreation in the area. The combination of these industrial development projects could deteriorate the scenic quality of an area as well as create emissions, noise, and construction traffic that could cause recreationists to avoid the area. Reasonably foreseeable future projects are primarily planned within fallow agricultural fields or adjacent to existing industrial development or structures (e.g., along existing utility corridors or adjacent to the Imperial Valley Substation). Cumulative impacts to recreation from reasonably foreseeable future development are anticipated to be negligible overall.

Environmental Consequences
Page 4-110 Ocotillo Sol Project Draft EIS/Draft CDCA Plan Amendment April 2012
4.12.4.2 ALTERNATIVES 1, 4, AND 5
Based on direct and indirect impact analysis presented in Section 4.12.3, it is expected that Alternatives 1, 4, and 5 would not result in impacts to recreation. These alternatives would be consistent with recreational use of the area. These alternatives, in combination with other reasonably foreseeable future projects, would not contribute to cumulative impacts to recreation.
4.12.4.3 ALTERNATIVES 2 AND 3
Alternatives 2 and 3, in combination with other reasonably foreseeable future projects, would result in negligible adverse impacts to recreational users of the area. Impacts would be negligible overall due to minimal recreational use of the area. Renewable energy projects and other activities within approximately 2 miles of the Ocotillo Sol Project area have been consistent with recreational use of the area. The Ocotillo Sol Project, when combined with other past, present, and reasonably foreseeable future projects in the area, would not result in a cumulatively adverse impact to recreation.
4.12.5 MITIGATION
No mitigation measures for recreation would be required.
4.12.6 IRREVERSIBLE AND IRRETRIEVABLE COMMITMENT OF RESOURCES
Construction, operation and maintenance, and decommissioning of the Ocotillo Sol Project would have negligible adverse impacts on recreation. Overall, due to minimal recreational use of the area, existing aesthetics, and existing land uses, the Ocotillo Sol Project would have no unavoidable adverse impacts to recreation and no irreversible and irretrievable commitment of resources related to recreation would occur.

Environmental Consequences
Ocotillo Sol Project Page 4-111 Draft EIS/Draft CDCA Plan Amendment April 2012
4.13 VISUAL RESOURCES
4.13.1 MANAGEMENT GOALS
The overarching management goals for visual resources in the project area are established by the California Desert Conservation Area Plan (BLM 1999), as follows:
The CDCA has a superb variety of scenic values. The public considers these scenic values a significant resource. The Bureau recognizes these values as a definable resource and an important recreation experience. These visual resources will receive consideration in Bureau of Land Management resource management decisions. Many management activities involve alteration of the natural character of the landscape to some degree; the Bureau will take the following actions to effectively manage for these activities:
1) The appropriate levels of management, protection, and rehabilitation on all public lands in the CDCA will be identified, commensurate with visual resource management objectives in the multiple-use class guidelines.
2) Proposed activities will be evaluated to determine the extent of change created in any given landscape and to specify appropriate design or mitigation measures using the Bureau’s contrast rating process.
The CDCA Multiple Use Class that applies to the study area is Class L (Limited Use). The CDCA Plan prescribes management for Class L as follows: “These lands are managed to protect sensitive, natural, scenic, ecological, and cultural resource values. They provide for generally lower-intensity, carefully controlled multiple uses that do not significantly diminish resource values” (BLM 1999).
The CDCA Plan guidelines for electrical generation facilities are stated as follows: “Electrical generation plants may be allowed” (BLM 1999). More specifically, the CDCA Plan provides for solar generation facilities on Class L lands after NEPA requirements are met.
BLM has established visual management objectives for each of four VRM Classes. As discussed in Section 3.14, VRM Classes have not been designated by the CDCA or other resource management plan covering the Ocotillo Sol Project area. In the absence of VRM Class designations in the CDCA, BLM identifies an Interim VRM Class for a project area that reflects maximum protection of the visual values, and that supports and does not conflict with the decisions within the CDCA.
An analysis of scenic quality, viewer sensitivity and distance zones in the most recent VRI for the project area concluded that the inventory class is VRI III (see Sections 3.14.1-5 for a complete discussion of VRI). The CDCA Plan allocation for the Ocotillo Sol Project area is Multiple Use Class L, which may allow for solar energy facilities after NEPA requirements are met. Specific projects must be evaluated through a plan amendment to ensure consistency with all goals and objectives for this Multiple Use Class.

Environmental Consequences
Page 4-112 Ocotillo Sol Project Draft EIS/Draft CDCA Plan Amendment April 2012
Mitigation measures (described in Section 4.13.5 below) would be implemented to minimize potential visual impacts of the proposed project, even though the level of contrast with the surrounding landscape would be low when viewed from a variety of KOPs. This practice would mitigate visual contrast from other areas the proposed project may be seen from, but that were not included as, critical KOPs.
Taking into consideration the inventory class, recent developments that have been undertaken and/or approved in the Ocotillo Sol Project area, the implementation of mitigation measures, and the project’s consistency with the Multiple Use Class, the BLM proposes establishment of an Interim VRM Class III for the area. The BLM proposes this Interim VRM Class because of the demonstrated ability to construct the project and maintain conformance with VRM Class III objective. The objective of VRM Class III is to partially retain the existing character of the landscape. Under VRM Class III, the level of change to the characteristic landscape should be moderate, and management activities may attract attention, but should not dominate the view of the casual observer. Any changes must repeat the basic elements of form, line, color, and texture found in the predominant natural features of the characteristic landscape.
The ability to construct the Ocotillo Sol Project and maintain conformance with the Class III VRM objective is discussed below, under Section 4.13.3, Impacts by Alternative.
4.13.2 TYPICAL IMPACTS FROM SOLAR ENERGY DEVELOPMENT
Visual resources are susceptible to impacts from surface disturbing activities, vegetation removal, construction activities, and the subsequent presence of solar panels, transformer boxes, fencing, and ancillary buildings associated with solar energy development. These impacts contribute to visual contrast, considered by BLM to be the leading indicator of visual impact- between the project facilities and the adjacent landscape.
Related visual impact considerations include the extent to which views from designated scenic highways, National Historic Trails, Wilderness areas, or culturally sensitive landscapes are affected. Excessive dust generated by construction or operation activities is considered to be a visual quality impact.
4.13.3 IMPACTS BY ALTERNATIVE
4.13.3.1 ALTERNATIVES 1, 4, AND 5
Under Alternative 1, the Ocotillo Sol Project would not be approved by the BLM and the CDCA Plan would not be amended. The Ocotillo Sol Project would not be constructed and the BLM would continue to manage the site consistent with the CDCA Plan (1980, as amended), Yuha Basin ACEC Management Plan (1981), Yuha Desert Wildlife Habitat Management Plan (1983), Yuha Desert Management Plan (1985), and the Flat-tailed Horned Lizard Rangewide Management Strategy.
Under Alternative 4, the Ocotillo Sol Project would not be approved and no ROW grant would be issued to the Applicant. The project area would remain in its existing condition, with no

Environmental Consequences
Ocotillo Sol Project Page 4-113 Draft EIS/Draft CDCA Plan Amendment April 2012
construction of structures or facilities resulting in ground disturbance, and no impacts associated with the Ocotillo Sol Project would occur. Under Alternative 4, the CDCA Plan would be amended to identify the Ocotillo Sol Project area as suitable for solar energy development. As a result, a project might be proposed in the future using the same or different solar energy technology on the project site, possibly resulting in impacts similar to the proposed Ocotillo Sol Project. The impacts of such a future project, however, are speculative at this time.
Under Alternative 5, the Ocotillo Sol Project would not be approved and no ROW grant would be issued to the Applicant. The project area would remain in its existing condition, with no construction of structures or facilities resulting in ground disturbance, and no impacts associated with the Ocotillo Sol Project would occur. Under Alternative 5, the CDCA Plan would be amended to identify the Ocotillo Sol Project area as unsuitable for solar energy development.
There would be no direct or indirect adverse impacts to visual resources under Alternatives 1, 4, and 5.
4.13.3.2 ALTERNATIVE 2
Under Alternative 2, the Applicant would construct, operate, maintain, and decommission a 100-acre solar PV facility on BLM-managed lands under an authorized ROW. This alternative includes a 15-acre temporary ROW that would be used as a laydown area during construction of the solar facility. Construction of the Ocotillo Sol Project would include grading, excavation, trenching, fencing, installation of solar panels, and construction of buildings.
4.13.3.2.1 Visual Contrast Rating and VRM Objectives BLM’s Visual Contrast Rating System is a systematic process used to analyze potential visual impacts of proposed projects and activities. The underlying assumption is that the degree of visual impact depends on the visual contrast created by a project. Visual contrast is analyzed from the KOPs. To evaluate the potential visual contrast between the constructed project and the surrounding landscape, a Visual Contrast Rating form was prepared for each of three KOPs (see Appendix L). The KOP contrast ratings were then compared with the objectives for the recommended Interim VRM Class to determine the extent to which the contrast would meet the objectives and be compatible with the VRM Class.
The description of views of the Ocotillo Sol Project area from the KOP locations, and the potential effects on those views are summarized below and discussed in detail in the Visual Contrast Forms in Appendix L, which includes representative photographs taken from the KOPs and visual simulations of the proposed project.
KOP 1. Location: On Interstate 8 at Dunaway Interchange, 5.6 miles northwest of the Ocotillo Sol Project area.
Description of View of Project Area from KOP: From this and similar locations along Interstate 8, views of the Ocotillo Sol Project would be indistinguishable due to the low angle of view and intervening line-of-sight obstructions between the KOP and the project area—vegetation, topography, and existing structures at the existing Imperial Valley Substation (the Imperial Valley Substation itself is

Environmental Consequences
Page 4-114 Ocotillo Sol Project Draft EIS/Draft CDCA Plan Amendment April 2012
indiscernible at this distance and blocks most views of the project area from locations along Interstate 8).
Other environmental factors that diminish the visibility and would reduce the visual contrast of the Ocotillo Sol Project from this KOP include the following:
• Length of time the project area is in view: viewers traveling along Interstate 8 have only brief glimpses of the project area due to intervening obstructions described above and their movement along the highway.
• Spatial relationship: compared to the visible panoramic landscape of the Yuha Basin, the project area is relatively obscured and not visually prominent.
• Relative size and scale: compared to the visible expanse of the landscape setting, the project area is relatively insignificant in size and scale.
• Atmospheric conditions: visibility of the project area is affected by natural haze and particulate matter, which diminish clarity and visual contrast.
In summary, the Ocotillo Sol Project would not dominate the view or draw the attention of observers in vehicles traveling eastbound or westbound along Interstate 8.
Degree of visual contrast from this KOP: none-to-weak.
Level of potential effect: No visual impact.
KOP 2. Location: On Highway 98, Imperial Highway at the Imperial Valley Substation access road, 3.6 miles southwest of the Ocotillo Sol Project area.
Description of View of Project Area from KOP: From this location along Highway 98, views of the Ocotillo Sol Project area would be indistinguishable due to the low angle of view and intervening line-of-sight obstructions between the KOP and the project area—primarily vegetation and topography (the Imperial Valley Substation itself is indiscernible at this distance). Other environmental factors that affect visibility and would reduce the visual contrast of the project from this KOP include those described above for KOP 1.
In summary, the Ocotillo Sol Project would not dominate the view or draw the attention of viewers in vehicles traveling eastbound or westbound along Highway 98.
Degree of visual contrast from this KOP: none-to-weak.
Level of potential effect: No visual impact.
KOP 3. Location: On Highway98, Imperial Highway at the Mount Signal Road approximately 2.5 miles southeast of the Ocotillo Sol Project area, at approximately the same elevation.

Environmental Consequences
Ocotillo Sol Project Page 4-115 Draft EIS/Draft CDCA Plan Amendment April 2012
Description of View of Project Area from KOP: From this location along Highway 98, views of the Ocotillo Sol Project area would be nearly indistinguishable due to the low angle of view and intervening line-of-sight obstructions between the KOP and the project area—primarily vegetation and topography (the Imperial Valley Substation and transmission line towers are barely discernible in the distance). Other environmental factors that affect visibility and would reduce the visual contrast of the project from this KOP include those described above for KOP 1.
The Ocotillo Sol Project would not dominate the view or draw the attention of viewers in vehicles traveling eastbound or westbound along Highway 98.
Degree of visual contrast from this KOP: none-to-weak. From certain locations, the project may be seen and could attract attention of viewers, but it would not dominate the view of the casual observer.
Level of potential effect: Minor effect; low level of visual impact.
For all KOPs, the expected degree of visual contrast of the Ocotillo Sol Project would meet and be compatible with the VRM Objective of Class III: to partially retain the existing character of the landscape. The level of change to the characteristic landscape should be moderate. Management activities may attract attention but should not dominate the view of the casual observer. Changes should repeat the basic elements found in the predominant natural features of the characteristic landscape (BLM 1984).
An Interim VRM Class III assignment for the Ocotillo Sol Project area is consistent with the CDCA prescriptions and the inventory class (VRI Class III). The project would be constructed and maintained in conformance with the VRM Class III objective, and would not result in adverse visual impacts under Alternative 2.
4.13.3.2.2 Visual Inventory Values In addition to determining consistency with VRM objectives, BLM analyzes potential impacts to the underlying Visual Inventory Values, which include scenic quality, visual sensitivity, and distance zones. As described in Section 3.14, the Ocotillo Sol Project area lies within a landscape setting that was inventoried to have the following visual values:
Scenic Quality: As with the majority (71 percent) of lands within the Yuha Basin, the Ocotillo Sol Project area was rated C (low), a featureless area having relatively low scenic quality. The area is not unique, and has little visual diversity.
Sensitivity Level: The overall rating of the Yuha Basin was high (Maintenance of Visual Quality has High Value). Contributing to this is the presence of the Juan Bautista de Anza National Historic Trail. The site-specific inventory of sensitivity for the Ocotillo Sol Project area considered this area to be less sensitive than other areas within the Yuha Basin due in part to its location immediately adjacent to the Imperial Valley Substation, near the far eastern boundary of the Yuha Basin, and near cultivated agricultural lands.

Environmental Consequences
Page 4-116 Ocotillo Sol Project Draft EIS/Draft CDCA Plan Amendment April 2012
Distance Zone: The Ocotillo Sol Project area was identified as being within the foreground–middleground zone (area that can be seen from a travel route for a distance of 3 to 5 miles).
These values resulted in the assignment of VRI Class III. The BLM’s proposed Interim VRM Class III and its management objective are consistent with and would support VRI Class III visual inventory values. Visual Inventory Values would not be diminished by the assignment of Interim VRM Class III or the proposed Ocotillo Sol Project.
4.13.3.2.3 Other Considerations Dust control measures would be included as BMPs to help reduce potential air quality concerns associated with the construction and operational phases of the Ocotillo Sol Project. Dust control of the Ocotillo Sol Project area, lay down areas, and the access road during construction would be accomplished by using water applied by trucks or other palliative means deemed acceptable by BLM. Impacts to visual resources from dust emissions would be temporary and negligible under Alternative 2.
Decommissioning of the Ocotillo Sol Project would include removal of all equipment, buildings, fencing, and other facilities, and preparation of the site for reclamation. The Applicant would develop and implement a detailed decommissioning plan that includes specific procedures to visually restore the site to predevelopment conditions, including restorative grading, erosion control, and revegetation. This plan would also require monitoring of the site for a five-year period and evaluating the conformance using the VRM Contrast Rating procedures. The Applicant would submit an annual report to the BLM documenting the status, and the BLM would determine if corrective actions were necessary. A separate NEPA document would be completed to analyze the potential effects of the alternatives for decommissioning and reclamation. A bond would be required from the Applicant to ensure that decommission and reclamation is completed.
The revegetation required to restore the site’s visual appearance to pre-construction state (i.e., creosote bush–white burr sage scrub vegetation) would be detailed in a Restoration Plan to be prepared and implemented to ensure the restoration of the decommissioned site is successful. Decommissioning of the solar facility and habitat restoration would result in beneficial long-term impacts to visual resources of the area. Review and approval of this Restoration Plan by BLM VRM staff would be required as part of the project approval and permitting process.
The Ocotillo Sol Project area is either not visible or is seldom seen from most locations within the Jacumba Mountains Wilderness over 12 miles to the west/southwest. Certain locations at higher elevations and on east facing slopes within the Jacumba Mountains Wilderness have a line of sight to the Ocotillo Sol Project area, but from these distances, the project would be within distant background views and would not dominate nor detract from the viewshed. The project would not visually dominate views from these locations due to the small size and scale within the overall viewshed, visual collocation with the existing substation, and the background agricultural development.
Views of the Ocotillo Sol Project area from the Juan Bautista de Anza National Historic Trail, at its nearest 4.5 miles to the south and southwest, would also be obstructed or indistinguishable