3/2018 - finestlink.fi · channel tunnel gotthard base ... systems, rail systems, project...
TRANSCRIPT
1
Benchmark and Financial Analysis – Executive summary
3/2018

2
Table of contents 1. Benchmarking introduction .....................................................................................................................3
1.1. Technical benchmarking ..................................................................................................................3
1.2. Economical benchmarking ...............................................................................................................6
1.3. Benchmarking conclusions and issues to consider ..........................................................................7
2. Financing model evaluation .....................................................................................................................8
2.1. Alternative project contract and financing models .........................................................................8
2.2. Alternative risk allocation models ................................................................................................ 10
2.3. Issues to consider regarding financial structure ........................................................................... 11
3. Financial modelling ............................................................................................................................... 12
3.1. Financial modelling assumptions .................................................................................................. 12
3.2. Financial modelling results ........................................................................................................... 14
3.3. Financial modelling conclusions.................................................................................................... 17
4. Conclusions ........................................................................................................................................... 19

3
1. Benchmarking introduction
The aim of the benchmarking study has been to provide a point of reference for the project to which it can measure its performance both from a technical perspective, and from an economical perspective. The benchmarked projects have been defined in co-operation between the WP4 consultants and the FinEst Link project.
1.1. Technical benchmarking
The selected peer projects and their technical characteristics are presented in the table below:
Table 1: Technical benchmarks summary with tunnel construction cost factors1
Channel tunnel Gotthard base tunnel
Brenner base tunnel Mont d’Ambin base tunnel
FinEst Link
Status In operation In operation Under construction Under construction Planning
Completion (*estimated)
1994 2016 2025* 2029* 2050
Tunnel length 50.5 km 57.1 km 55.0 km 57.5 km 102.3 km
Tunnel layout 2 bores with one track
1 service tunnel 2 bores with one track
2 bores with one track
1 service tunnel 2 bores with one track
2 bores with one track
1 service tunnel
Tunnel diameter 8.8 m 9 m 10.5 m 10.5 m 10 m
Service tunnel Yes, diameter 5.8 m No Yes, diameter 6 m No Yes, diameter 8 m
Passenger crossovers between tunnels
Every 375 m, from running tunnels to service tunnel
Every 325 m, between running tunnels
Every 333 m, between running tunnels
Every 333 m, between running tunnels
None
Train crossovers Two, with crossing tracks (x)
Two, non-crossing tracks (/\)
None
One, non-crossing tracks (/\). Also two passing tracks between crossovers.
Three, non-crossing tracks (/\)
Emergency stations None Two Three One None
Type of geology Chalk marl Crystalline rock Various, including tectonic plate boundary.
Complex geology
Mostly crystalline Precambrian bedrock of gneisses and granitoids
Construction methods
11 TBMs
4 TBMs (= 91 km) Drill & blast (= 23 km) 3 intermediate access sites
9 TBMs (= 77 km) Drill & blast (= 33 km) 3 intermediate access sites
8 TBMs + drill & blast 4 intermediate access sites
Proposal to create 2 artificial islands as intermediate access.
Spoil material 7,500,000 m³ 13,300,000 m³ 11,100,000 m³ 14,700,000 m³ 21,600,000 m³
All of the tunnels in this benchmark are twin-tube tunnels with a single track in each. In terms of length, the tunnels are somewhat comparable to each other, in the range of 51 – 58 km. The planned FinEst link is significantly longer at over 100 km. The schematic overview of the benchmarked tunnels are shown in Figure 1.
1 Sources for data presented in the table can be found in the full FinEst Link report references

4
Figure 1 Schematic overview of the technically benchmarked tunnels projects (black are running tunnels, red is service tunnel, work access points are the places from which the tunnels were constructed)
Both the passenger as well as the freight demand are lower for the FinEst Link tunnel than for its peers as can be seen in Figure 2 below:
Figure 2 Passenger and freight demand just before opening of operating tunnels and current demands on projects under construction or in the project phase
The FinEst Link tunnel has higher growth perspectives than current projects or the benchmarked tunnels in use. The foreseen increase in demand for FinEst Link is based on the move from current weekly commuting to daily commuting and a market increase between Helsinki (and further) and Tallinn (and further).
After normalizing the project capex to 2016 Finland euros, a comparison has been made between the five tunnels shown in Figure 3. The lowest capex can be found in the Gotthard base tunnel. The two tunnels still under construction are somewhat comparable in costs, while the Channel tunnel had the highest investment cost (capex):

5
To facilitate a comparative cost comparison among the peer tunnels, only the tunneling costs, tunnel systems, rail systems, project management and connecting track cost are taken into account (for example terminals and rolling stock are not taken into account in the comparison). The results are shown in Figure 4 below.
Figure 4 Cost expressed in normalized EUR(2016) for Finland excluding stations and terminals and rolling stock (2=2 running tunnels; 3=2 running tunnels + 1 service tunnel)
From the results following can be concluded:
- The FinEst Link estimations come close to the estimations for the Gotthard Base tunnel (with a smaller diameter) and the Mont d’Ambin tunnel (with a bigger diameter), however, these are both tunnels without an extra service tunnel.
Figure 3 Cost comparison between the benchmarked tunnels in normalized Finnish 2016 Euro’s

6
- The Channel Tunnel has the smallest excavation diameter, but the highest cost per tunnel length (as expressed here in the length between tunnel entrance and exit, not in the total tunnel length excavated)
- The Mont d’Ambin tunnel is most expensive per km of tunnel for a double-tube tunnel, probably due to the extra excavations necessary for the intermediate stations (including extra tracks)
- The Brenner Base Tunnel and Channel Tunnel, both 3 bore tunnels thus including a service tunnel and comparable to the FinEst project are 35-70% more expensive per tunnel kilometer than the current estimations of the FinEst Link tunnel project.
The low cost for the FinEst can be justified with geological conditions. However, from a logistics point of view the FinEst Link tunnel is more comparable to the Channel Tunnel, than to the other peer tunnels with a higher number of intermediate access points.
1.2. Economical benchmarking
One major organizational challenge of the FinEst Link tunnel project is that it is a cross-border project between two EU countries and two capital regions. Several projects can be identified which have similar characteristics and will provide a good reference for the FinEst link project. The following were selected for study in the economical benchmarking:
Table 2 Economical benchmarks summary2
Channel tunnel Oresund fixed link HSL zuid Brenner base tunnel Fehmarn Belt fixed
link
Mont dont dl base
tunnel
Status In operation In operation In operation Under construction Planning Under construction
Type Railway tunnel Combined rail/road
bridge/tunnel
High speed railway
line Railway tunnel
Combined rail/road
tunnel Railway tunnel
Completion
(*estimated) 1994 2000 2009 2025* 2028* 2029*
EU-grants No Yes No Yes, 40% of total
costs
Yes, 16% of total
costs
Yes, 40% of total
costs
Public-private
financing Private Private
Partly private, partly
public Public Private Public
User financed
structures Yes Yes No No Yes No
The economical benchmarking projects can be split into two categories in terms of funding and organization shown in Figure 5. The organization responsible for building and operating the Channel Tunnel was a private consortium of construction and engineering firms and banks. This is the only example of a privately organized and financed project in this benchmark.
2 Sources for data presented in the table can be found in the full FinEst Link report references

7
Figure 5 Positioning of the different projects for their organization and financing
In the benchmark, five projects are cross-border between two EU countries. The only exception in this
benchmark is the HSL-Zuid project in the Netherlands, which is a domestic project. Except for the Channel
tunnel, all of the cross-border projects have received EU grants.
Figure 6 Cost estimations for different projects indexed around the start of construction (when the exact amount is fixed in a contract) and standardized in 2016 Finnish Euros
In Figure 6 above, the cost estimation for several projects can be seen in the different phases. The
projects all show a linear increasing trend throughout the projects time frames. The maximum increase
can be found in the case of the Channel tunnel. The main reason for the increase in final cost for the
Channel tunnel has been identified as problems with overall project management and interfaces and
changes in requirements in safety, environment and security.
1.3. Benchmarking conclusions and issues to consider
The main conclusions from the benchmark are the following
8
1. The FinEst Link has lower projections for the combined freight and passenger demands than the compared projects. As a result, the expected revenues are lower.
2. The demand for FinEst is largely based on the commuting market, which does not yet exist at the level of the demand estimates, while the peer projects tap into existing markets.
3. The projected cost for FinEst link is lower than for peers. Given the fact that similar construction technologies are used, it is possible that the cost could be higher/ in the range of peers.
4. Benchmark projects indicate cost increases between feasibility study and project finish of a factor 0.5 to 6 in the compared projects with no experiences of reducing costs after construction start.
5. Several alternative financing and funding options are available which have shown their value and can be of interest for the FinEst project
2. Financing model evaluation
The preferred financing and procurement model will depend on several factors such as preferences and requirements for risk allocation flexibility, cost of capital and the public and the financial market’s ability to finance and fund the project over time.
2.1. Alternative project contract and financing models
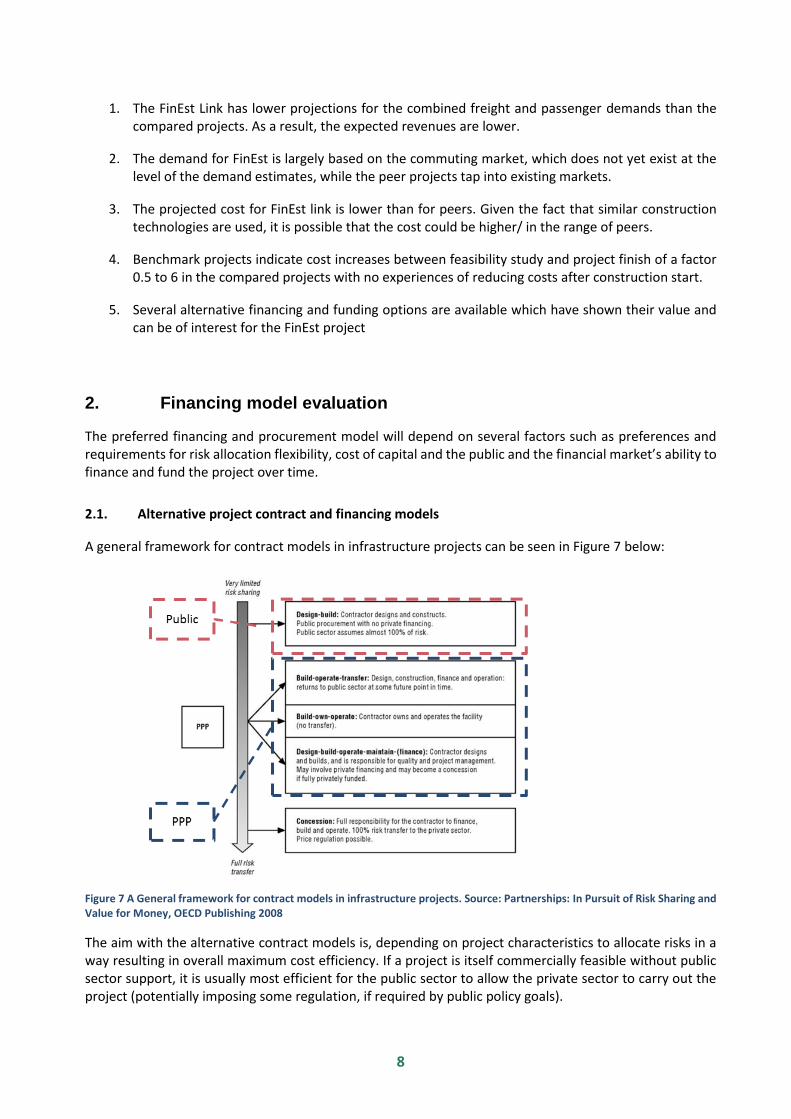
A general framework for contract models in infrastructure projects can be seen in Figure 7 below:
Figure 7 A General framework for contract models in infrastructure projects. Source: Partnerships: In Pursuit of Risk Sharing and Value for Money, OECD Publishing 2008
The aim with the alternative contract models is, depending on project characteristics to allocate risks in a way resulting in overall maximum cost efficiency. If a project is itself commercially feasible without public sector support, it is usually most efficient for the public sector to allow the private sector to carry out the project (potentially imposing some regulation, if required by public policy goals).

9
In a publicly financed and owned project, the public sector is responsible for procurement, construction and operation of the transport link. In the benchmark study, typical examples are the Öresund Bridge and the Fehmarn link –tunnel.
Benefits of the publicly owned and financed project model are:
- The public model can be implemented quickly when political and funding decisions have been made
- If public credit support such as public loans or debt guarantees are used, the project will have the lowest possible cost of capital
- There is flexibility for changes during the investment phase and project life
- Due to the large scale and possible uncertainties regarding the FinEst Link project, some risks e.g. linked to project size and public decisions and processes could be best managed by the public sector
- There is a possibility to split procurements into smaller lots which could increase cost efficiency
Issues to account for in a possible publicly owned contract model for FinEst Link are:
- Public project owners will need to manage project risks (technical and commercial) internally
- Limited integration of design, build, maintenance leading to several procurement processes could increase internal and external interface risk
- Limited due diligence could result in uncertain cost estimates, insufficient risk management activities or changes in project scope
- Requirements on project owners to organize and staff the project
- Limited long term incentives, risk transfer or certainty about performance
- Maximum project costs are difficult to estimate beforehand and could affect state aid considerations
Privately financed PPPs can be used to ensure life cycle performance of the asset and delivery of the service in accordance with agreed timescales and performance specifications. Some, in particular technical responsibilities of the project are shifted to the private sector service provider.
Benefits of the private (PPP) financing model are:
- Life cycle approach and long term responsibility of constructors and owners with fixed prices and on time delivery
- Private financing can reduce investment phase funding requirements of the public partners
- Risk transfer should result in functionality and savings from the public stakeholder’s viewpoint
- Internal interface risks of the project are efficiently handled
- Project transfers to public ownership after the project agreement has ended, which can be a benefit compared to other private financing models
Issues to account for in a possible PPP contract model for FinEst Link are:
- Higher financing costs compared to public credit risk
- Risks related to political, zoning, interface with other utilities (e.g. Baltic Connector and other networks) and force majeure events cannot be transferred

10
- Technical risks that cannot be fully managed until actual construction works could result in large risk reservations in fixed price agreements
- The public sector needs to carry the demand risk (using a suitable availability based payment or minimum revenue guarantee)
- Contracts are inflexible during the contract term
2.2. Alternative risk allocation models
For the FinEst Link project, risk allocation based on standard models can be challenging due to project characteristics such as:
- The large project size makes it difficult for parties to absorb risks that are realized during the investment (affecting cost and time schedule) and operations phase (affecting operating revenues and costs)
- The funding requirement will require large commitments from public project stakeholders and financial market participants, which will require financing structures that differ from ones commonly used for projects in Finland and Estonia
- Local technical and financial expertise is not familiar with challenges related to the development of this type of project
- Risks regarding permits and licenses can be especially challenging in a cross-border project such as FinEst Link
Below in Figure 8 an illustrative example of a risk- matrix for the project is shown, with preliminary proposals on how risks could be allocated in alternative private financing models to create feasibility and value for money:
Figure 8 An illustrative example of a risk-allocation matrix for the FinEst Link -project
One option to procure a partnering based model could be to use a ‘development phase’ to optimise project scope and structure between the end of the formal procurement procedure and the final investment decision. A development phase could be based on the concept of partnering or ‘alliance’ that has been used in several Finnish projects during the past years.
Item Risk type Can risk be transferred? Public Shared Contractor Public Shared Contractor Public Shared Contractor
Long term need for system/ macro
economic conditionsRevenue, Political Intolerable Public Public Public
Setting of technical and operational
requirements Completion Undesirable Public Shared Shared
Planning and environmental issues,
land acquisitionRevenue, Political Undesirable Public Public Public
Setting of customer payment rates Revenue Intolerable Public Public Public
Design and construction of System,
internal interface riskCompletion Acceptable Shared Contractor Shared
External interface risk Completion, Availability Undesirable Public Public Shared Public Shared
Technical operation and O&M planning
(routine/ life cycle etc.)Availability Acceptable Contractor Contractor Shared
Commercial operation (Marketing to
passangers and freight service clients)Revenue Undesirable Public Shared Shared
End of term condition (handback) Availability Acceptable Public Contractor Shared
Construction phase financing Completion Acceptable Public Contractor Contractor
Long term financing Completion Acceptable Public Contractor Contractor
Force Majeure Revenue, Political Intolerable Public Shared Shared
Government policies, change in lawCompletion, Availability, Revenue,
PoliticalIntolerable Public Public Public
Demand risk and funding of service
(who pays)Revenue Intolerable Public Public Public
Public project PPP Hybrid model
Risk allocation of operations and services (for further discussion)

11
2.3. Issues to consider regarding financial structure
Issues to consider when assessing the most suitable project contract model and risk allocation are:
1. The objective in next phases of the project should be to improve the commercial viability and to maximise funding sources such as EU grants in order to gain a better understanding of financing models that can be employed for the project
2. State contributions and public sector risk exposure should be further studied and acceptable alternatives regarding these should be outlined for the project
3. It is improbable that the FinEst Link project could be carried out while placing demand risk for the
use (passengers, freight) on a private party. Investor and financier interest will depend on credit
and funding support from outside the project, i.e. the project owners Finland and Estonia and
other public stakeholders. Alternative risk allocations such as revenue guarantees or availability
mechanisms should be considered.
4. The project will have an effect on the financing burden of the Estonian and Finnish states. The effect can possibly be mitigated using a PPP financing model combined with EU funds in a “blending” financing model.
5. Financial market capacity will be a factor in the project and the project size will require for different types of financiers to co-operate in organizing the project financing.
6. The model (contracting, financing) for the project should be carefully studied before decision making and in all cases market interest and capacity to carry out the project based to the model should be ensured by entering into sufficient market dialogue (contractors, planners, investors, lenders, etc.). State aid issues should also be addressed by the local ministries in Estonia and Finland.

12
3. Financial modelling
3.1. Financial modelling assumptions
The goal of the Financial Modelling has been is to produce a preliminary business feasibility analysis of the base case and alternative financial and sensitivity scenarios. The model is a high-level model, where different scenarios can be evaluated to develop the project financing structure and to evaluate project risks.
The main drivers of the model are revenues (passenger and cargo volumes and pricing), costs (capital expenditure, operational expenditure, replacement of assets) and financing (interest, amortisation and return requirement):
Figure 9 Summary of project financial model time based assumptions
-
200
400
600
800
1 000
20
17
20
21
20
25
20
29
20
33
20
37
20
41
20
45
20
49
20
53
20
57
20
61
20
65
20
69
20
73
20
77
20
81
20
85
20
89
20
93
20
97
21
01
MEU
R
Year
Revenue
revenues, passenger trips Revenues, passenger car
Revenues, trucks Revenues, cargo trains
-
1 000
2 000
3 000
4 000
5 000
2017
2021
2025
2029
2033
2037
2041
2045
2049
2053
2057
2061
2065
2069
2073
2077
2081
2085
2089
2093
2097
2101
tho
usa
nd
ton
s
Year
Cargo volumes
Truck/shuttle train volume Cargo train volume
- 2 4 6 8
10 12 14 16
2017
2021
2025
2029
2033
2037
2041
2045
2049
2053
2057
2061
2065
2069
2073
2077
2081
2085
2089
2093
2097
2101
M t
rip
s/y
Year
Passenger volumes
Passenger trips Passenger car volumes
020406080
100120140160
2017
2021
2025
2029
2033
2037
2041
2045
2049
2053
2057
2061
2065
2069
2073
2077
2081
2085
2089
2093
2097
2101
EUR
/ t
rip
Year
Average ticket price
Average passenger trip price Average passenger car trip price
0
5 000
10 000
15 000
20 000
-
500
1 000
1 500
2 000
2 500
2017 2019 2021 2023 2025 2027 2029 2031 2033 2035 2037 2039
MEU
R
MEU
R
Year
Capex
Capex Cumulative capex (Right axes)
-
200
400
600
800
1 000
1 200
1 400
2017
2021
2025
2029
2033
2037
2041
2045
2049
2053
2057
2061
2065
2069
2073
2077
2081
2085
2089
2093
2097
2101
MEU
R
Year
Total costs
Trains and operation Infrastructure maintenance Debt Service (DS)
13
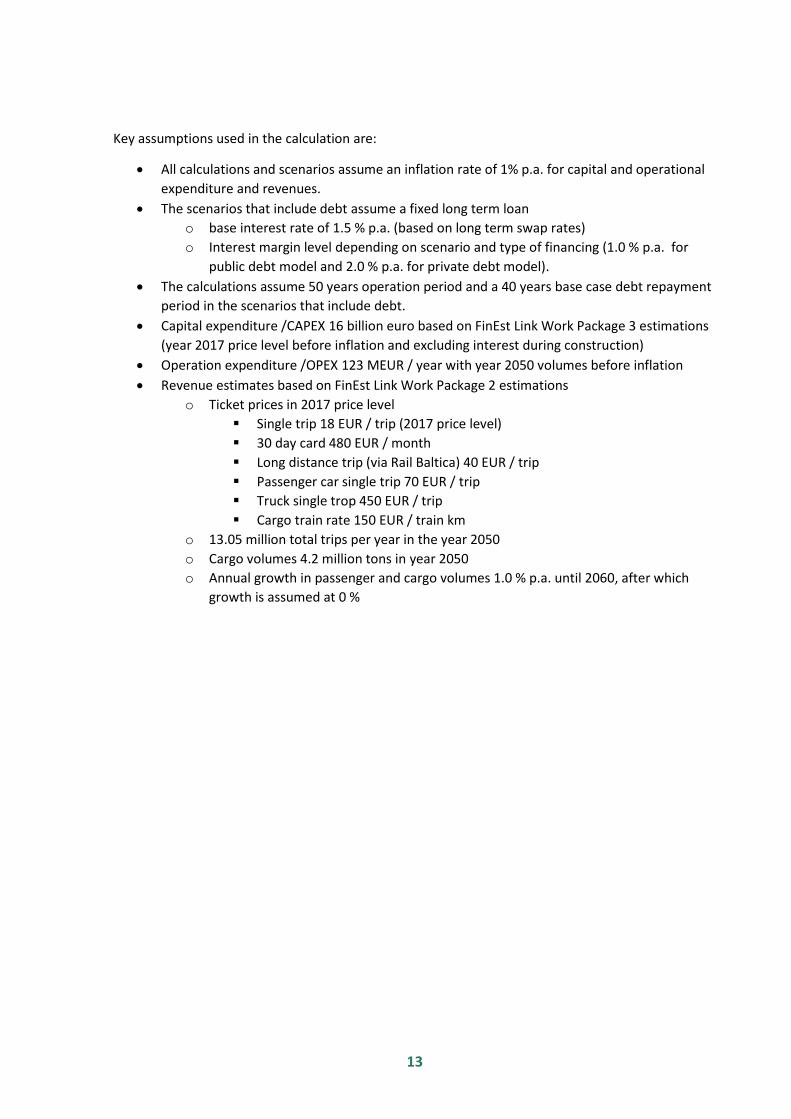
Key assumptions used in the calculation are:
All calculations and scenarios assume an inflation rate of 1% p.a. for capital and operational
expenditure and revenues.
The scenarios that include debt assume a fixed long term loan
o base interest rate of 1.5 % p.a. (based on long term swap rates)
o Interest margin level depending on scenario and type of financing (1.0 % p.a. for
public debt model and 2.0 % p.a. for private debt model).
The calculations assume 50 years operation period and a 40 years base case debt repayment
period in the scenarios that include debt.
Capital expenditure /CAPEX 16 billion euro based on FinEst Link Work Package 3 estimations
(year 2017 price level before inflation and excluding interest during construction)
Operation expenditure /OPEX 123 MEUR / year with year 2050 volumes before inflation
Revenue estimates based on FinEst Link Work Package 2 estimations
o Ticket prices in 2017 price level
Single trip 18 EUR / trip (2017 price level)
30 day card 480 EUR / month
Long distance trip (via Rail Baltica) 40 EUR / trip
Passenger car single trip 70 EUR / trip
Truck single trop 450 EUR / trip
Cargo train rate 150 EUR / train km
o 13.05 million total trips per year in the year 2050
o Cargo volumes 4.2 million tons in year 2050
o Annual growth in passenger and cargo volumes 1.0 % p.a. until 2060, after which
growth is assumed at 0 %

14
3.2. Financial modelling results
Project cash flows based only on estimated project costs and project income without external funding or financing show a project Net present value (NPV, discounted at 3.5%) of € 8.419 bn negative:
Figure 10 Project cash flow for model with no grants or financing structure
If the project would receive 40% EU grants3 (approximately 7.44 bn €) are introduced, with the rest of the project financed with € 11.16 bn of (public) equity capital, the project NPV at 3.5% is still negative (3.048 bn euros).
Figure 11 Project cash flow for model with EU grants and no financing structure
A PPP model based on private financing would facilitate some risk technical transfer (e.g. cost and completion time risk transfer but very low demand risk transfer) without an initial capital outlay from Estonia or Finland with a subsidy/availability payment during the operations phase. Calculations are based on a blending structure with 40 % EU grant (approximately 7.44 bn €) with the rest of the project financed privately with a 20/80 equity /debt ratio (approx. 2.2 bn € equity and 1.,3 bn € debt).
Figure 12 Project cash flow for model with EU grants and PPP financing
3 The level of 40 % is based on the benchmarking study results of other cross –border infrastructure projects. In the calculation, EU grants are estimated to be paid in the same yearly proportions as the investment is made.
Scenario: Project cash flow without grants or financing structure2 025 2 029 2 034 2 039 2 040 2 044 2 049 2 054 2 059 2 064 2 069 2 074 2 079 2 084 2 089
1 5 10 15 16 20 25 30 35 40 45 50 55 60 65 Construction Operation
Investment cost - MEUR 18 602 796 829 2 240 663 - - - - - - - - - - - Grant (EU) - MEUR - - - - - - - - - - - - - - - - Grant (Finland & Estonia) - MEUR - - - - - - - - - - - - - - - - Equity input - MEUR 18 602 796 829 2 240 663 - - - - - - - - - - - Debt withdraw - MEUR - - - - - - - - - - - - - - - - Revenue - MEUR 34 609 - - - - 458 496 548 605 668 702 738 776 815 857 901 Operating costs - MEUR 9 984 - - - - 153 160 168 178 188 197 207 218 229 241 253 Financing costs - MEUR - - - - - - - - - - - - - - - - Taxes - MEUR 2 597 - - - - - - 14 29 45 55 65 74 83 93 102 Total equity cash flow - MEUR 3 426 (796) (829) (2 240) (663) 305 336 365 398 435 450 466 484 503 524 546
WACC 3,5 % Discounted equity cash flow - MEUR (8 419) (769) (698) (1 588) (396) 176 169 155 142 131 114 99 87 76 66 58
FINANCIAL PERFORMANCE INDICATORS
Scenario: EU Grant 40% of investment cost2 025 2 029 2 034 2 039 2 040 2 044 2 049 2 054 2 059 2 064 2 069 2 074 2 079 2 084 2 089
1 5 10 15 16 20 25 30 35 40 45 50 55 60 65 Construction Operation
Investment cost - MEUR 18 602 796 829 2 240 663 - - - - - - - - - - - Grant (EU) - MEUR 7 441 318 331 896 265 - - - - - - - - - - - Grant (Finland & Estonia) - MEUR - - - - - - - - - - - - - - - - Equity input - MEUR 11 161 478 497 1 344 398 - - - - - - - - - - - Debt withdraw - MEUR - - - - - - - - - - - - - - - - Revenue - MEUR 34 609 - - - - 458 496 548 605 668 702 738 776 815 857 901 Operating costs - MEUR 9 984 - - - - 153 160 168 178 188 197 207 218 229 241 253 Financing costs - MEUR - - - - - - - - - - - - - - - - Taxes - MEUR 3 506 - - - - 16 26 39 52 66 74 81 89 97 105 113 Total equity cash flow - MEUR 9 958 (478) (497) (1 344) (398) 288 310 341 375 415 432 450 469 489 511 535
WACC 3,5 % Discounted equity cash flow - MEUR (3 048) (462) (419) (953) (237) 166 156 144 134 124 109 96 84 74 65 57
FINANCIAL PERFORMANCE INDICATORS
Scenario: Private debt model + sculpted repayment2 025 2 029 2 034 2 039 2 040 2 044 2 049 2 054 2 059 2 064 2 069 2 074 2 079 2 084 2 089
1 5 10 15 16 20 25 30 35 40 45 50 55 60 65 Construction Operation
Investment cost - MEUR 21 037 796 886 2 454 1 036 - - - - - - - - - - - Grant (EU) - MEUR 7 441 318 331 896 265 - - - - - - - - - - - Grant (Finland & Estonia) - MEUR - - - - - - - - - - - - - - - - Equity input - MEUR 2 232 96 99 269 80 - - - - - - - - - - - Debt withdraw - MEUR 11 363 382 455 1 289 692 - - - - - - - - - - - Revenue - MEUR 34 609 - - - - 458 496 548 605 668 702 738 776 815 857 901 Operating costs - MEUR 9 984 - - - - 153 160 168 178 188 197 207 218 229 241 253 Financing costs - MEUR 21 961 - - - - 487 495 507 521 538 558 582 611 644 0 0 Taxes - MEUR 1 854 - - - - - - - - - 17 37 61 88 101 109 Total equity cash flow - MEUR (1 423) (96) (99) (269) (80) (182) (159) (128) (94) (58) (71) (89) (114) (146) 515 538
WACC 3,5 % Discounted equity cash flow - MEUR (2 540) (92) (84) (191) (47) (105) (80) (54) (34) (17) (18) (19) (20) (22) 65 58 Supplement payment - MEUR 8 762 - - - - 280 258 230 199 165 182 205 236 275 - -
FRR including supplement payment 4,0 %
FINANCIAL PERFORMANCE INDICATORS

15
The PPP model scenario includes a yearly subsidy payment during the operational phase. A possible
development of this subsidy is presented below in Figure 13:
Figure 13 Finland and Estonia additional funding in a PPP funded model. The subsidy payment ends after the project debt has been fully amortised.
An estimated 280 million euros (nominal value) is the yearly starting cost that Finland and Estonia
would need to contribute for the project to be possible with a PPP model. The need for subsidy
payments ends when the debt has been fully amortised i.e. after 40 years from the start of the
operation period4:
Figure 14 Debt service in PPP scenario. Cash Available for Debt Service i.e. CADS is not sufficient to cover debt is covered by the subsidy payment.
If the project is constructed with a public financing structure (e.g. a publicly owned limited liability
company with public debt or revenue guarantees), where the public sector retains all technical and
demand risks, a yearly payment with a (nominal) starting level of approximately 170 million euros of
4 The need for subsidy payments increase in the end of the observation period due to revenues development
and tax effects in the financial model. Various alternatives exist to smooth out the subsidy payments in
practice.
-
2 000
4 000
6 000
8 000
10 000
-
50
100
150
200
250
3002
01
7
20
21
20
25
20
29
20
33
20
37
20
41
20
45
20
49
20
53
20
57
20
61
20
65
20
69
20
73
20
77
20
81
20
85
20
89
20
93
20
97
21
01
MEU
R
MEU
R
Year
Fin / Est grants & additional funding
Need of additional finance/ Fin + Est payment Grant (Finland & Estonia)
Cumulative Fin / Est support (right axes)
0,00
0,50
1,00
1,50
2,00
-
200
400
600
800
1 000
2017
2021
2025
2029
2033
2037
2041
2045
2049
2053
2057
2061
2065
2069
2073
2077
2081
2085
2089
2093
2097
2101
MEU
R
Year
Debt service
Interest Debt repayment
Cash Available for Debt Service (CADS) Debt Service Coverage Ratio (DSCR)

16
subsidy payments in the first operating year could be a level at which the project could be
constructed.
The effects of various alternative financing models on the estimated subsidy levels are presented in
table below:
Table 3 Summary of subsidy estimates for alternative financing structures
40 years debt period Public subsidy Cumulative subsidy
year 1 of operations (nominal) over 40 years period (nominal)
Public debt scenario 170 M€ 4 750 M€
Public debt, no EU grant 486 M€ 18 898 M€
PPP/Private debt scenario 280 M€ 8 762 M€
PPP/Private debt, no EU grant 669 M€ 25 816 M€
50 years debt period Public subsidy Cumulative subsidy
year 1 of operations (nominal) over 50 years period (nominal)
Public debt scenario 98 M€ 1 994 M€
Public debt, no EU grant 367 M€ 17 776 M€
PPP/Private debt scenario 218 M€ 7 243 M€
PPP/Private debt, no EU grant 566 M€ 26 956 M€
From the perspective of Finland and Estonia, the public subsidy could be justified by presenting
socio-economic and wider benefits that are above that of the subsidy level. A comparison of CBA
benefits and discounted subsidy payments during the operations phase is presented5 in Figure 15
below.
Figure 15: Yearly CBA benefits vs. subsidy payments from Finland and Estonia.
5 The CBA -analysis includes traditional CBA –analysis figures, possible Wider Economic Impacts (WEI) have not been accounted for in the analysis.
0
20
40
60
80
100
120
140
160
180
2034 2037 2040 2043 2046 2049 2052 2055 2058 2061 2064 2067
MEU
R
Comparison of yearly estimated CBA and WEI benefits and subsidy payments by Finland/Estonia during operation phase
CBA benefits (discounted @ 3,5%, excl. passenger train operating costs and rail fare revenue)
Public debt model costs to FIN/EST (grants (investment phase) + supplement (operation phase), discounted @ 3,5%)
Private debt model costs to FIN/EST (grants (investment phase) + supplement (operation phase), discounted @ 3,5%)
17
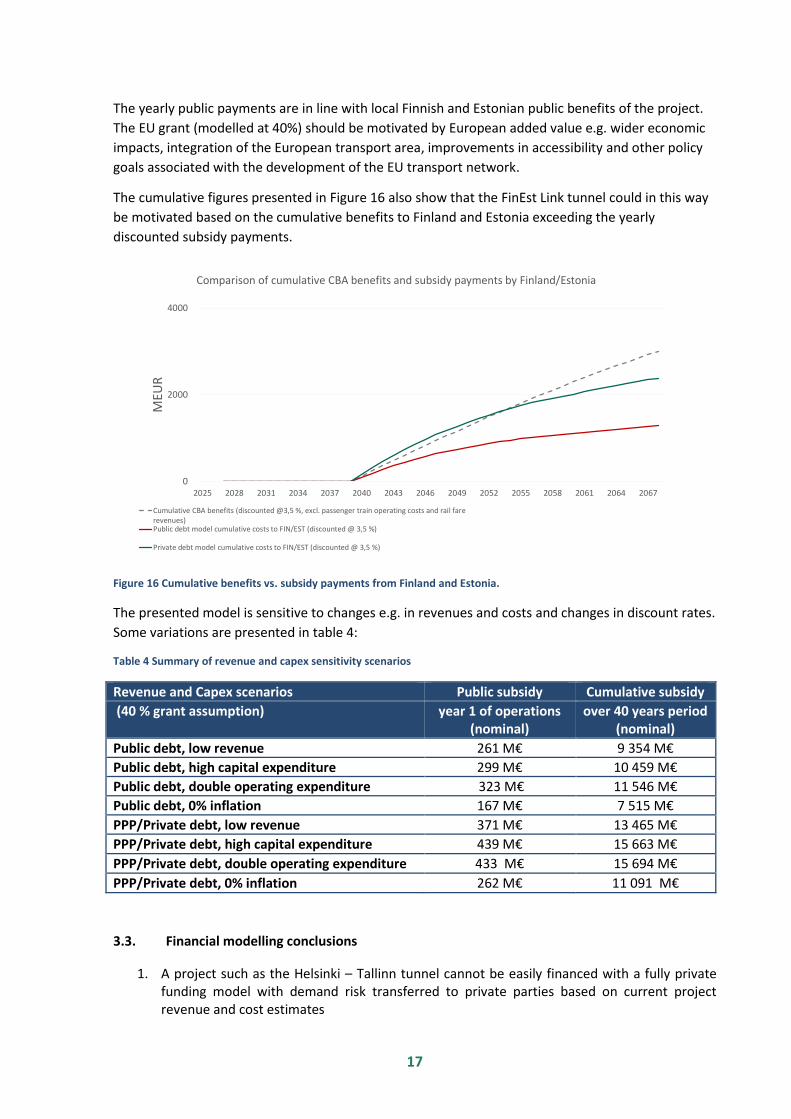
The yearly public payments are in line with local Finnish and Estonian public benefits of the project.
The EU grant (modelled at 40%) should be motivated by European added value e.g. wider economic
impacts, integration of the European transport area, improvements in accessibility and other policy
goals associated with the development of the EU transport network.
The cumulative figures presented in Figure 16 also show that the FinEst Link tunnel could in this way
be motivated based on the cumulative benefits to Finland and Estonia exceeding the yearly
discounted subsidy payments.
Figure 16 Cumulative benefits vs. subsidy payments from Finland and Estonia.
The presented model is sensitive to changes e.g. in revenues and costs and changes in discount rates.
Some variations are presented in table 4:
Table 4 Summary of revenue and capex sensitivity scenarios
Revenue and Capex scenarios Public subsidy Cumulative subsidy
(40 % grant assumption) year 1 of operations (nominal)
over 40 years period (nominal)
Public debt, low revenue 261 M€ 9 354 M€
Public debt, high capital expenditure 299 M€ 10 459 M€
Public debt, double operating expenditure 323 M€ 11 546 M€
Public debt, 0% inflation 167 M€ 7 515 M€
PPP/Private debt, low revenue 371 M€ 13 465 M€
PPP/Private debt, high capital expenditure 439 M€ 15 663 M€
PPP/Private debt, double operating expenditure 433 M€ 15 694 M€
PPP/Private debt, 0% inflation 262 M€ 11 091 M€
3.3. Financial modelling conclusions
1. A project such as the Helsinki – Tallinn tunnel cannot be easily financed with a fully private funding model with demand risk transferred to private parties based on current project revenue and cost estimates
0
2000
4000
2025 2028 2031 2034 2037 2040 2043 2046 2049 2052 2055 2058 2061 2064 2067
MEU
R
Comparison of cumulative CBA benefits and subsidy payments by Finland/Estonia
Cumulative CBA benefits (discounted @3,5 %, excl. passenger train operating costs and rail farerevenues)Public debt model cumulative costs to FIN/EST (discounted @ 3,5 %)
Private debt model cumulative costs to FIN/EST (discounted @ 3,5 %)

18
2. An availability based private financing model (low level of risk transfer, no payments from Finland & Estonia before operational phase) could be feasible with a yearly service payment/ subsidy starting at approximately 280 million euros per year during the operational period.
3. The project could be financed with a publicly supported debt-financing model with subsidy payments of approximately 170 million euros per year from the beginning of the operational period, adding up to 4.8 bn euro subsidy payments.
4. Without the assumed (EU) grants of 40% the payment would be approximately 507 million euros in year 1 of the operating period so the grant would have a material effect on the project feasibility and ratio of costs and benefits to the Finnish and Estonian states
5. Sensitivities show that various risks such as lack of grants or lower than expected revenues and higher than expected capital expenditures will have an effect on the cost to the public project owners and to the comparison of public benefits and costs.
6. Comparing project costs and benefits (socio-economic, wider impacts) on a yearly level could motivate the feasibility of the project and public support to it. Further analysis of risk, benefits and wider economic impacts of the project would make this analysis more dependable for decision making purposes.
Further studies include more detailed analysis of the modelling assumptions and methods used after which the project should enter into market dialogue to fine tune project and financing assumptions.

19
4. Conclusions
The FinEst Link tunnel project is truly a mega-project with an estimated feasibility study phase
investment cost of 16 billion euros (2017 prices). The benchmarking analysis shows that similar
infrastructure projects have been and can be realised from a technical and economical perspective.
However, projects have often been affected by risks resulting in cost overruns, delays and lower than
estimated social or financial returns. Estimated demand levels for the FinEst Link tunnel are lower
than in comparable projects, which should be accounted for in the project technical design and
financing structure.
Various financing alternatives have been compared as part of the study and some general
conclusions can be drawn:
Demand risk will be difficult to absorb by any other party than the public project owners.
Investor and financier interest will depend on credit and funding support from outside the
project, i.e. the project owners Finland and Estonia and other public stakeholders.
A “blending” financing structure, using a combination of EU funds and private and public
long-term financing combined to local public funding support can be achievable and feasible.
The financing and contract structure of the project must be able to account for the large
amounts of financing that have to be mobilised.
The large project size can lead to challenges related to financial market capacity or
restrictions in Finnish and Estonian willingness to accept debt liabilities and exposure to
project risks.
Project financial and social goals and limits should be set in a transparent manner in advance
for the full project and the project should ensure sufficient financial market dialogue during
its various phases of development.
The future sources of finance of the project will depend on the project’s characteristics (to be determined by project owners) and the characteristics of available financing in the market (depending on prevailing market conditions at each time). On a general level, the market for infrastructure financing is currently quite active and a financing arrangement even for a project of this size should be achievable if the contract terms are “bankable”, taking into account e.g. demand risk and uncertainties regarding reaching the final design and target cost of the project.
The project is most financially feasible when financed with a combination of EU grants and long-
term financing backed by a public transportation support payment (subsidy or availability based)
over the long term. A privately financed PPP model could be available with a subsidy payment
starting at 280 M€ per year, and a public model with lower costs but increased risks for the public
sector could be estimated to require a subsidy starting at 170 M€ per year.
With the presented financing structures and an estimated level of 40 % EU grants shows that the
project cost to Finland and Estonia could be motivated with the project’s estimated long term socio-
economic benefits.
A contract model combining elements from partnering/alliancing contracting models and private
financing models could facilitate the management of project costs and incentives. An open-book
development and contracting model with target pricing would also provide a shield against financial
risks to the project sponsors (Finland and Estonia) and future financiers and investors.

20
In practice, the next step could be to form a development vehicle, for example in the form of a
publicly owned limited liability company. This vehicle would be set up to further advance the project
based on the social and financial goals set by the project owners. The work should then proceed to
develop the Helsinki – Tallinn tunnel project within set limits, such as the target price, investment
and operation cost risk, cash flow, credit rating and ratio of project costs to estimated benefits. Over
the long term, this co-operative model should facilitate the joining of additional project partners to
form an overall structure with sufficient information and financial resources to implement the
project when socio-economic and financial boundary values are met with a sufficient level of
confidence.