32nd ewgdanczeegcehgsonicctdcaynefnicasr ... · surface for the assembly of the ae ... type that...
TRANSCRIPT

32nd EWGAE 65
Czech Society for Nondestructive Testing32nd European Conference on Acoustic Emission TestingPrague, Czech Republic, September 07-09, 2016
ADVANCED SIGNAL ANALYSIS APPLIED TO DISCRIMINATE DIFFERENT CORROSION FORMS BY ACOUSTIC EMISSION DATA
Luigi CALABRESE 1, Massimiliano GALEANO 1, Edoardo PROVERBIO 1, Domenico DI PIETRO 2, Angelo DONATO 2, Filippo CAPPUCCINI 2
1 Department of Engineering, University of Messina; Messina, Italy Phone: +39 090 3977544, Fax: +39 090 3977471; e-mail: [email protected],
[email protected], [email protected] 2 GE Oil & Gas; Firenze, Italy; e-mail: [email protected], [email protected],
Abstract The analysis of three corrosion phenomena (uniform corrosion, pitting corrosion and stress corrosion cracking) has been carried out through the use of acoustic emission technique. Corrosion attacks have been obtained on three different types of martensitic stainless steel (X12Cr13, X4CrNiMo16-5-1, 17-4 PH) in a FeCl3 solution, using conditions set by the ASTM G48 standard. These alloys are characterized by different mechanical, microstructural and electrochemical properties, for each which lead to develop specific corrosion forms, albeit subject to the same environmental conditions. A multivariate statistical analysis approach, based on PCA (Principal Component Analysis), has been adopted to evaluate AE data and to have highlight damage-sensitive features. Specific clusters of variables related to specific corrosion phenomena have been identified, promoting this approach as a procedure for discriminating onset of specific corrosion mechanism. Keywords: acoustic emission, uniform corrosion, localized corrosion, stress corrosion cracking, principal component analysis
1. Introduction The health monitoring of components operating in harsh environments is a very sensitive issue in industrial field. A proper monitoring approach is necessary in order to prevent unexpected failure (e.g. due to stress corrosion cracking mechanism) and, at the same time, to draw up a proper maintenance schedule that may limit the inactivity maintaining periods. Considerable efforts have been done in the last decades to identify an affordable technique of health monitoring of components operating in critical environmental conditions [1]. Corrosion prevention should be achieved by a complex system of monitoring, preventative repairs, and careful use of materials. A significant industrial relevance have the use of technologies able to guaranty in situ real time monitoring of component during service. These systems allow continuous monitoring and control of corrosion mechanisms occurring on sensored component [2]. It is difficult however to have and interpret accurate real-time corrosion information in order to clearly identify and to avoid conditions that cause high corrosion rates. Several efforts have been focused on on-line non-destructive technique (NDT) that should be reliable and able to discriminate different corrosion forms simultaneously occurring on the components during their normal use [3] [4] [5]. The acquisition of the AE signals induced by corrosive processes [6] [7], allows to acquire parameters or values which could be related with specific degradation phenomena that take place on the component [8] [9]. Considering that each corrosion phenomenon generates different peculiar AE patterns, the concomitant presence of several corrosion phenomena involves the superposition of acoustic signals making difficult to discriminate each cause that generate them.

66 32nd EWGAE
Aim is to give an approach suitable to distinguish the different forms of corrosion that could occur during the metal degradation, in order to identify dangerous condition during component operation. In particular in this work, the corrosion phenomena in three different types of martensitic stainless steels (17-4PH, X4CrNiMo16-5-1 and X12Cr13), were investigated performing corrosion tests in FeCl3 solution according to ASTM G48 standard. These alloys are characterized by different mechanical, microstructural and electrochemical properties, for each which lead to develop specific corrosion forms, albeit subject to the same environmental conditions. AE data were recorded during corrosion tests to define the peculiar characteristics of the three types of corrosive attacks (generalized corrosion, pitting/crevice and stress corrosion cracking). A multivariate statistical analysis approach, by PCA (Principal Component Analysis), was used to have an integrated statistical approach with damage-sensitive features. Clusters of variables related to specific corrosion phenomena were identified, promoting this approach as a suitable procedure for the discrimination between undamaged and damaged conditions of components.
2. Experimental and laboratory practice
2.1 Materials
Table 1: Mean mechanical properties of stainless steel alloys Stainless Steel
0.2% Yield strength
(MPa) ultimate tensile strength UTS
(MPa)
Elongation at maximum load
ε (%) 17-4 PH 745 1010 24 X12Cr13 618 760 24 X4CrNiMo16-5-1 615 890 16
Table 2: Nominal chemical composition [wt%] of stainless steel alloys
Stainless Steel 17-4 PH X12Cr13 X4CrNiMo16-5-1
Com
posi
tion
[wt%
]
Fe balance Ni 4.43 Cr 15.10 S 0.005 P 0.02 Mn 0.44 Si 0.50 Cu 3.31 Nb 0.22 C 0.042
Fe Balance C 0.13 Mn 0.43 Si 0.29 P 0.020 S 0.001 Cr 12.18 Ni 0.21
Fe balance Ni 4.8 Cr 15.5 S < 0.002 P <0.017 Mn 0.93 Si 0.24 Mo 0.97 C 0.06
Specimens for corrosion tests were made of three different martensitic stainless steel: • 17-4 PH (UNS S17400) stainless steel. 17-4 PH is a precipitated hardening martensitic
stainless steel containing more Cr and Ni than the usual AISI 4xx series, for improved corrosion resistance, and additional alloying elements for precipitation hardening.
• X12Cr13 is a martensitic stainless steel. It is very popular in industrial field since its corrosion resistant and good mechanical properties.
• X4CrNiMo16-5-1 is a martensitic stainless steel with good corrosion and oxidation resistance. This material is tough and strong and it is usually used to produce a variety of structural components for the power generation and heat treating industries.

32nd EWGAE 67
In table 1 and table 2 respectively details of mechanical properties and nominal chemical composition of the alloys are reported. Tensile specimens (whose size and shape are displayed in figure 1), were machined by turning with a final surface roughness of 0.3 µm from a forging disk similar to that commonly used for impeller production for oil & gas industry. In detail, specimens were extracted along the circumferential direction at maximum diameter in order to get higher mechanical properties and toughness.
Figure 1. Dog-bone dimensions for the samples
2.2 Corrosion test set-up To guarantee the same conditions concerning signal attenuation and acoustic wave propagation velocity each corrosion test was performed using the same test set-up. All tests were performed, according to ASTM G48 standard, in an aqueous solution containing 10% by weight of FeCl3. Test was carried out at a room temperature (25°C). Test solution was prepared by adding 50 g of reagent to 450 mL of distilled water, so to obtain about 500 mL of solution. The solution was then added into the test cell at test temperature. For the execution of tests a dead weight type machine was employed. The stress applied to the specimens during SCC test was equal to 90% of the 0.2% yield strength of the material. An appropriate cell was produced by using the well-known design of vessel commonly used for SCC test with tensile shape specimens (i.e. NACE TM0177 method A). The cell was composed of a Pyrex ring and two flanges made of Teflon with a central hole for specimen accommodation. This set-up conditions were suitable to obtain the activation of SCC corrosion on 17-4PH, the arise of localized corrosion just like pitting and crevice on X4CrNiMo16-5-1, and finally to get the uniform corrosion on X12Cr13. For each stainless steel three replicas of the test were carried out.
2.3 AE set-up AE signals were recorded by a 10-channel Vallen AMSY-5 measurement system for the full period of the test. The acquisition was performed by using two sensors placed at the two ends of the sample. However, due to cylindrical shape of the samples a particular solution was implemented to accommodate AE sensors that need a contact flat surface. In detail two suitable grips were designed (and produced in 17-4 PH steel) to connect the specimen to the loading machine. The grips have a threaded hole for entering the tensile sample, a hole in the upper part for the connection to the dead weight machine (through a pin) and a large flat surface for the assembly of the AE sensor. The threaded coupling between specimen and grip allows acoustic wave generated within the sample during test to propagate to the sensor without any significant attenuation or interference. A third sensor has been employed as a guard sensor, connected to an independent block and it was used to acquire all the noise signals that were then removed during the data post processing. AE sensors used were piezoelectric transducers with high sensitivity (suitable for metal integrity testing), VS150-M type that worked in 100-450 kHz frequency range with resonance at 150 kHz. In the experimental set-up, the thresholds of amplitude and rise-time parameters were set

68 32nd EWGAE
respectively at 26.7 dB and 2 µs, the amplification was set at 34 dB with a bandwidth (-3 dB) from 2.5 kHz to 1 MHz.
3. Results and Data analysis
3.1 Corrosion phenomena morphology In figure 2 the corroded surface of each different sample after corrosion test are reported. The specimens showed only one predominant type of corrosion for each one of the three types of investigated steel. In particular, the X12Cr13 specimen evidenced very intense generalized corrosion. X4CrNiMo16-5-1 specimen has suffered exclusively pitting and crevice corrosion. The surface evidenced indeed numerous large pits. At the same time in correspondence of the bottom o-ring of the electrochemical cell extended crevice corrosion was observed. While on 17-4PH specimen the stress corrosion cracking occurred with the formation and propagation of a large amount of cracks.
Figure 2. Micrography of all stainless steel alloys after the corrosion test 3.2 Data Analysis Before to perform the statistical analysis of data the recorded AE signals have been properly treated (filtering operations and pre-processing). In particular a three step de-noising approach was used [10]:
1. Spurious events were accurately removed from the population of data. Each acoustical event identified only by one sensor (and not heard by both sensors) was classified as spurious event, since not attributable to acoustic event due to corrosive phenomena that occur on the specimen, and consequently was removed.
2. Delocalized events were removed from the population of data. At first position identification for all AE events was carried out through a process of localization of events. Some events, identified by both sensors, were localised outside the area of interest (outside the wetted area of stainless steel samples). These events cannot be attributed to corrosion phenomena and were removed during the pre-processing of data.

32nd EWGAE 69
3. Removal of environmental noise. All AE events heard by guard sensor were removed from the population of data because related to events occurring away from the experimental set-up thus amenable to environmental noise.
Thus treated signals were subsequently computed to calculate some derived variables, to get a complete and useful description of the system. In table 3 the direct and derived variables of AE data were reported.
Table 3. Variables Data-set
Variable name Variable description Measurements and value limits
Amplitude Value of the maximum peak of the waveform. Indicates magnitude of the waveform. dB
Duration Time between the first and the last overshot of the predefined threshold µs
Risetime Time between the first overshoot of the defined threshold and the peak in the AE burst. µs
Energy Area under the envelope of the AE burst Eu [10-14 V2s]
Counts Number of threshold crossing counts (for a given AE burst). Absolute number
Average Frequency (AVG) Ratio between Duration and Counts kHz
Event Frequency Number of AE events detected in one second s-1
RA Ratio between Risetime and Amplitude Expressed in ms/V, useful to classify the type of cracks.
Crack Index Ratio between AVG and RA Useful to discriminate through shear and tensile crack. KhzV/ms
Time Duration of corrosion test. Time is normalized from 0 to 100 for each three tests.
Cumulative Cumulative value for hits, counts and energy As is possible to note, a wide variables data-set was defined. These parameters are suitable to describe the characteristics of the waveforms produced during the corrosive phenomena. This data-set identifies a multidimensional system (more than 10 dimensions). So it is nearly impossible to analyse all variables in a comparative way in order to identify a reduced set that could discriminate corrosive phenomena in an easy way. To obtain this issue is necessary to use an advanced data-analysis system that is able to deal with multidimensional data-set in an advantageous way. PCA transform could assist us to operate a feature selection in order to reduce the system dimensionality, and to help us to give a proper significance to the reduced set of variables [11]. Loadings can be computed as coefficients used to obtain the principal components. Each principal component is determined as linear combination of the product of loadings and the respective scaled variables. In Figure 3 the correlation variables matrix is presented. High values (in brown and blue colour) correspond to a significant correlation between the variables, i.e. the two variables are not independent, while values closed to zero indicates that they are mostly independent.

70 32nd EWGAE
Figure 3. Correlation matrix, referred to the whole variable data-set
Two dependent variables are likely to provide the same informational content, therefore they create redundancy, and they even could lead to mistakes in case of advanced elaboration such data-mining and neural networks. It could be observed that three variables groups could be distinguished. A first group includes all the time-dependent variables, just like time and the cumulative variables. A second group consists of the waveform describers parameters, i.e. Amplitude, Duration, Counts, Average Frequency and Energy. A third group includes variables that are not clearly attributable to the other two groups i.e. Event Frequency, RA and Risetime, Crack Index. Pareto graph, showed in Figure 4, represents the variance contribute by each PC in the total variance observed in the dataset by the principal component analysis. Consequently the relative variance magnitude was obtained from the eigenvalues associated to each principal component (autovector). Since the main PCs usually contributes a major portion of the variance in data, we can compute the most important variables that contribute to these PCs (axes of the multidimensional plane in which the dataset is representable.).
Figure 4. Auto-values for every auto-vector. A total of 85% cumulative value is owned by first three auto-vectors
32nd EWGAE 71
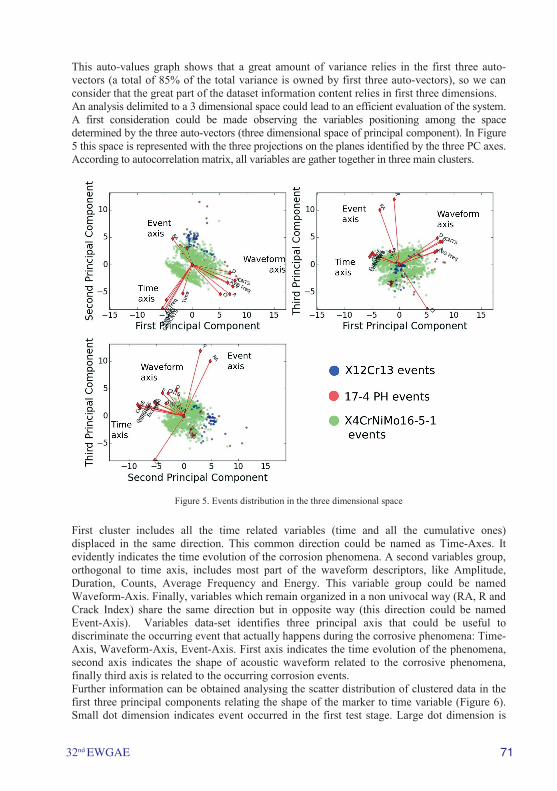
This auto-values graph shows that a great amount of variance relies in the first three auto-vectors (a total of 85% of the total variance is owned by first three auto-vectors), so we can consider that the great part of the dataset information content relies in first three dimensions. An analysis delimited to a 3 dimensional space could lead to an efficient evaluation of the system. A first consideration could be made observing the variables positioning among the space determined by the three auto-vectors (three dimensional space of principal component). In Figure 5 this space is represented with the three projections on the planes identified by the three PC axes. According to autocorrelation matrix, all variables are gather together in three main clusters.
Figure 5. Events distribution in the three dimensional space
First cluster includes all the time related variables (time and all the cumulative ones) displaced in the same direction. This common direction could be named as Time-Axes. It evidently indicates the time evolution of the corrosion phenomena. A second variables group, orthogonal to time axis, includes most part of the waveform descriptors, like Amplitude, Duration, Counts, Average Frequency and Energy. This variable group could be named Waveform-Axis. Finally, variables which remain organized in a non univocal way (RA, R and Crack Index) share the same direction but in opposite way (this direction could be named Event-Axis). Variables data-set identifies three principal axis that could be useful to discriminate the occurring event that actually happens during the corrosive phenomena: Time-Axis, Waveform-Axis, Event-Axis. First axis indicates the time evolution of the phenomena, second axis indicates the shape of acoustic waveform related to the corrosive phenomena, finally third axis is related to the occurring corrosion events. Further information can be obtained analysing the scatter distribution of clustered data in the first three principal components relating the shape of the marker to time variable (Figure 6). Small dot dimension indicates event occurred in the first test stage. Large dot dimension is

72 32nd EWGAE
associated to AE events occurred during the final stage of the corrosion test. Is it possible to note that events are put in an interesting order in the time axis: all three corrosion type start in the same region (the lower left plane region). This region is characterised by very low magnitude of time and waveform axes variables.
Figure 6. Hit distribution among auto-vectors space. Marker dimension is time-dependent
Then the corrosion phenomena evolution leads SCC and crevice to move forward the direction identified as time axis, where the uniform corrosion events are dominant. This region where the large amount of uniform corrosion event persist was coded as “uniform region”. The combined presence of all corrosion forms in this region could indicate that AE events related to corrosion activation are quite similar for all corrosion forms and they can be related mainly to AE events induced by electrochemical activity of stainless steel surface with FeCl3 electrolyte (uniform-like corrosion characteristics). Then, moving on the time axis direction, the combined presence of SCC and pitting/crevice events can be evidenced (this region was coded as SCC region). This behaviour could be related considering that, for 17-4 PH SS sample, corrosion phenomena induced by activation, nucleation and propagation of pits that during time will evolve in crack [12], could have acoustical waveform quite similar to pitting/crevice events [13] observed on X4CrNiMo16-5-1 stainless steel corrosion test. Finally, crevice evolution stimulates a large amount of AE events clustered in the upper side of the plot (crevice region). This region is populated only by crevice events, and it could be identified as the region of hydrogen evolution bubbling, as the value of Risetime (the higher ones) and values of Duration (the lower ones) suggest us [14]. Furthermore Event-axis could be used to extrapolate more information about the discrimination phenomena. In particular on the right side of the plot a cluster of AE events occurring in 17-4PH- SS corrosion tests were identified. These events are characterised by high amplitude and energy and can be related to crack activation and propagation phenomena (this region was coded SCC crack propagation).

32nd EWGAE 73
These considerations could be confirmed through the analysis of bivariate graphs presented in Figure 7.
Figure 7. Bivariate graphs for most representative variables identified by PCA
Waveforms attributable to uniform corrosion (identified on X12Cr13 stainless steel, blue areas) are characterized by low amplitude and medium duration, while show a high RA compared with other corrosion forms. AE waveforms due to crevice and pitting (predominant in X4CrNiMo16-5-1 stainless steel, green areas) are characterized by high amplitude, energy and cover full RA range. Two clusters related to high and low Duration can be identified respectively related to crevice/pitting activation and hydrogen evolution bubbling. The waveforms attributable to the SCC (observed in 17-4PH corrosion test of, red areas) are mainly characterized by low/medium amplitude, energy and RA. This cluster of data is related to pitting activation. Afterwards few AE hits with very high amplitude, energy and duration are induced by energetically significant SCC crack activation and propagation phenomena. Table 4 summarized synthetically the waveform parameters for each corrosion form.
Table 4. Summarized waveform parameters for each corrosion form
Amplitude Duration Energy RA Uniform Low Medium Low High
Crevice/Pitting High High/Low High Full range
SCC Low/medium Very High
Low/medium High
Low/medium Very High
Medium Very Low
4. Conclusions
In this study the issue to discriminate among three different corrosive phenomena was dealt. Through the use of a multidimensional data-analysis such PCA, specific variable clusters related to peculiar corrosion phenomena are detected. These clusters are clearly identifiable and well separated each other in a three-dimensional space, modelled by time-related variables, waveform-descriptor variables, event-descriptor variables. Every corrosion event could be identified and assigned to a specific cluster by a triad of variables. Such information could be in the future used in tests in which these corrosive phenomena occur simultaneously, in order to determine a clear discrimination among each corrosion phenomenon and to analyse the contribution of each of them to the specimen damage evolution.

74 32nd EWGAE
References [1] L. Yang and M. Institute of Materials, Techniques for corrosion monitoring.
Woodhead Pub., 2008. [2] S. Papavinasam and D. Abayarathna, Corrosion control in the oil and gas industry.
Gulf Professional Pub, 2014. [3] M. Ohtsu, Acoustic emission and related non-destructive evaluation techniques in the
fracture mechanics of concrete : fundamentals and applications. Woodhead Publishing, 2015.
[4] G. Moran and P. Labine, Eds., Corrosion Monitoring in Industrial Plants Using Nondestructive Testing and Electrochemical Methods. 100 Barr Harbor Drive, PO Box C700, West Conshohocken, PA 19428-2959: ASTM International, 1986.
[5] L. Yang and K. T. Chiang, “On-line and real-time corrosion monitoring techniques of metals and alloys in nuclear power plants and laboratories,” in Understanding and Mitigating Ageing in Nuclear Power Plants, 2010, pp. 417–455.
[6] C. U. Grosse and M. Ohtsu, Acoustic Emission Testing. Berlin: Springer, 2008. [7] S. Hewardine, Plant Integrity Assessment by Acoustic Emission Testing,. Warickshire, 1993. [8] J. Kovač, A. Legat, B. Zajec, T. Kosec, and E. Govekar, “Detection and
characterization of stainless steel SCC by the analysis of crack related acoustic emission,” Ultrasonics, vol. 62, pp. 312–322, 2015.
[9] L. Calabrese, G. Campanella, and E. Proverbio, “Identification of corrosion mechanisms by univariate and multivariate statistical analysis during long term acoustic emission monitoring on a pre-stressed concrete beam,” Corros. Sci., vol. 73, pp. 161–171, Aug. 2013.
[10] L. Calabrese, G. Campanella, and E. Proverbio, “Noise removal by cluster analysis after long time AE corrosion monitoring of steel reinforcement in concrete,” Constr. Build. Mater., vol. 34, pp. 362–371, Sep. 2012.
[11] F. S. F. Song, Z. G. Z. Guo, and D. M. D. Mei, “Feature Selection Using Principal Component Analysis,” Syst. Sci. Eng. Des. Manuf. Informatiz. ICSEM 2010 Int. Conf., vol. 1, no. 1, p. 301, 2010.
[12] L. Calabrese, L. Bonaccorsi, M. Galeano, E. Proverbio, D. Di Pietro, and F. Cappuccini, “Identification of damage evolution during SCC on 17-4 PH stainless steel by combining electrochemical noise and acoustic emission techniques,” Corros. Sci., vol. 98, pp. 573–584, 2015.
[13] L. Djeddi, R. Khelif, S. Benmedakhene, and J. Favergeon, “Reliability of acoustic emission as a technique to detect corrosion and stress corrosion cracking on prestressing steel strands,” Int. J. Electrochem. Sci., vol. 8, no. 6, pp. 8356–8370, 2013.
[14] L. Calabrese, L. Bonaccorsi, E. Proverbio, D. Di Pietro, and F. Cappuccini, “SCC damage evolution on martensitic stainless steel by using acoustic emission technique,” Corros. Eng. Sci. Technol., vol. 50, no. 5, pp. 364–371, 2015.