3300 whitehaven street, nw, suite 5000 washington, dc...
TRANSCRIPT
3300 Whitehaven Street, NW, Suite 5000
Washington, DC 20007
Mail: Campus Box 571444,
Washington, DC 20057
cew.georgetown.edu
union bug
recovery: job growth and education requirements through 2020 | executive summary 1
table of contents
1. Notwithstanding failure to resolve the federal government’s budgetary challenges, the
U.S. economy will grow from 140 million to 165 million jobs by 2020.
2. By 2020, 65 percent of all jobs in the economy will require postsecondary education
and training beyond high school.
3. There will be 55 million job openings in the economy through 2020: 24 million open-
ings from newly created jobs and 31 million openings due to baby boomer retirements.
4. By educational attainment:
• 35 percent of the job openings will require at least a bachelor’s degree;
• 30 percent of the job openings will require some college or an associate’s degree;
• 36 percent of the job openings will not require education beyond high school.
5. Job openings in healthcare, community services, and STEM will grow the fastest among
occupational clusters.
6. Judgment/decision-making, communications, analysis, and administration will be the
four most in-demand competencies in the labor market.
7. The demand for physical skills has continued to decline over time, except for “near vi-
sion,” which is necessary to read computer screens and other types of documentation.
8. The United States will fall short by 5 million workers with postsecondary education—at
the current production rate—by 2020.
2 recovery: job growth and education requirements through 2020 | executive summary
ob forecast
165 million jobs in the economy by 2020
If Congress can resolve the nation’s budgetary challenges, we will
finally be on the way to a recovery.
Total employment is expected to increase by almost 24 million
over 10 years, from 141 million in 2010 to 165 million by 2020.
J
t the current production rate in higher education,
we will fall 5 million short of the workers with
postsecondary credentials we will need by 2020.
A
recovery: job growth and education requirements through 2020 | executive summary 3
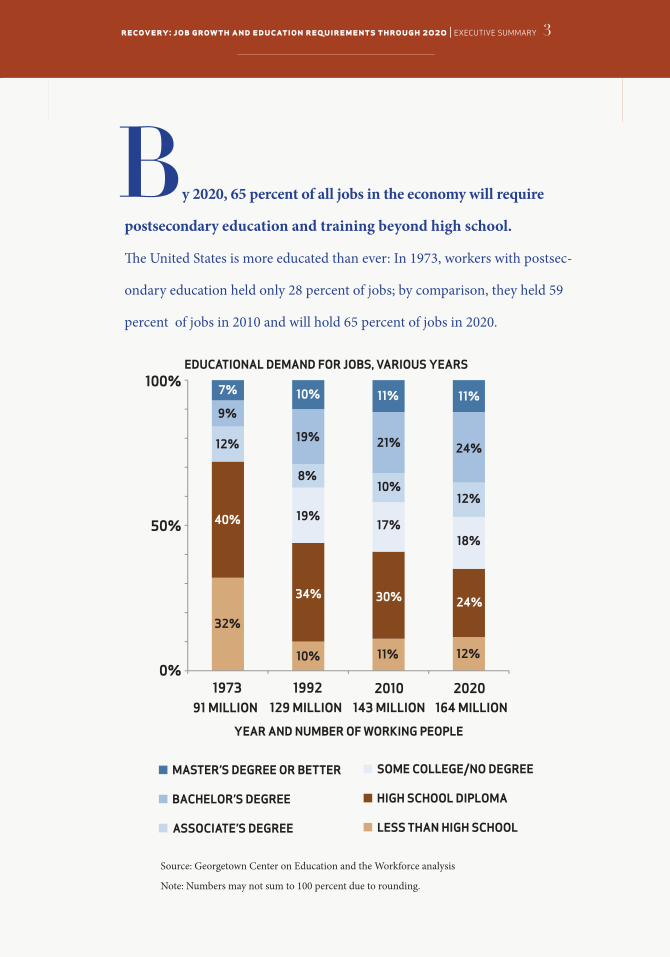
y 2020, 65 percent of all jobs in the economy will require
postsecondary education and training beyond high school.
The United States is more educated than ever: In 1973, workers with postsec-
ondary education held only 28 percent of jobs; by comparison, they held 59
percent of jobs in 2010 and will hold 65 percent of jobs in 2020.
B
Source: Georgetown Center on Education and the Workforce analysis
Note: Numbers may not sum to 100 percent due to rounding.
MASTER’S DEGREE OR BETTER
BACHELOR’S DEGREE
ASSOCIATE’S DEGREE
SOME COLLEGE/NO DEGREE
HIGH SCHOOL DIPLOMA
LESS THAN HIGH SCHOOL
1973 1992 2010 202091 MILLION 129 MILLION 143 MILLION 164 MILLION
YEAR AND NUMBER OF WORKING PEOPLE
7%100%
50%
0%
32%
40%
12%
9%10%
10%
34%
8%
19%
19%
11%
11%
30%
10%
21%
17%
11%
12%
24%
12%
24%
18%
EDUCATIONAL DEMAND FOR JOBS, VARIOUS YEARS
4 recovery: job growth and education requirements through 2020 | executive summary
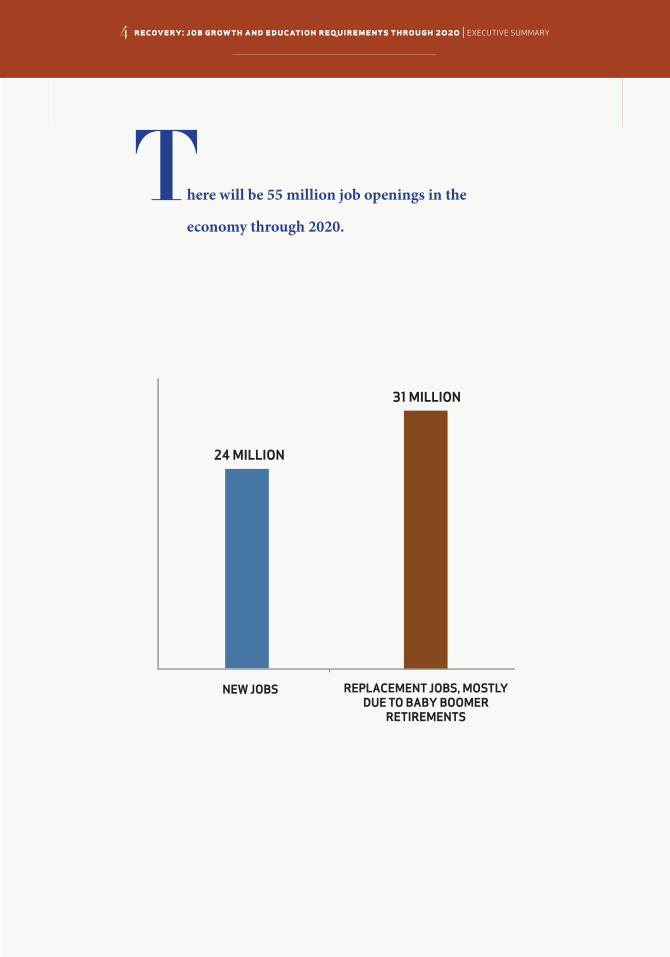
here will be 55 million job openings in the
economy through 2020.
T
24 MILLION
31 MILLION
NEW JOBS REPLACEMENT JOBS, MOSTLY DUE TO BABY BOOMER
RETIREMENTS
recovery: job growth and education requirements through 2020 | executive summary 5
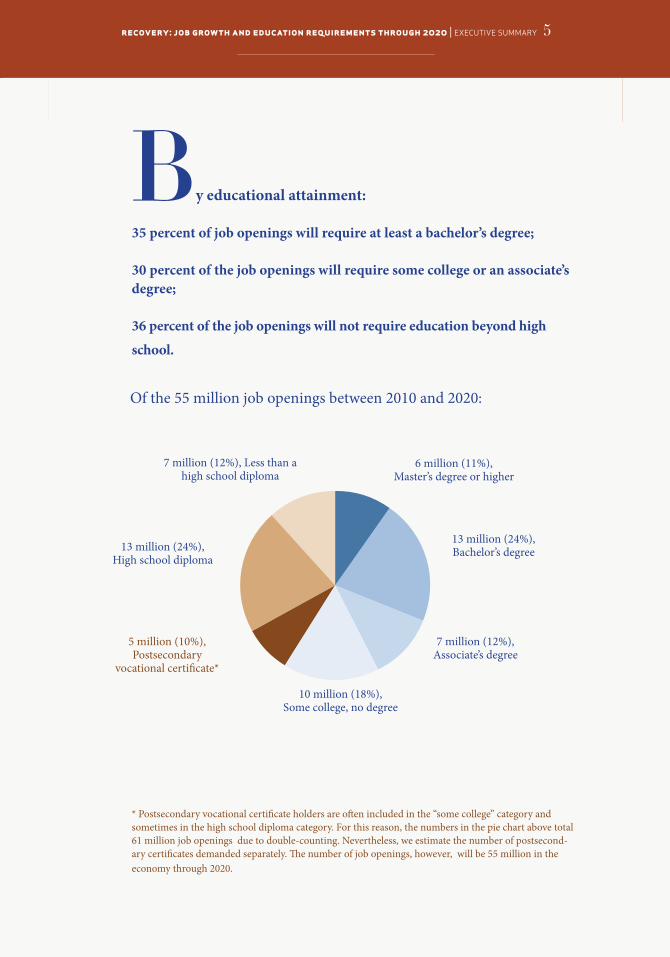
y educational attainment:
35 percent of job openings will require at least a bachelor’s degree;
30 percent of the job openings will require some college or an associate’s degree;
36 percent of the job openings will not require education beyond high
school.
* Postsecondary vocational certificate holders are often included in the “some college” category and sometimes in the high school diploma category. For this reason, the numbers in the pie chart above total 61 million job openings due to double-counting. Nevertheless, we estimate the number of postsecond-ary certificates demanded separately. The number of job openings, however, will be 55 million in the economy through 2020.
B
6 million (11%), Master’s degree or higher
13 million (24%),Bachelor’s degree
7 million (12%),Associate’s degree
10 million (18%),Some college, no degree
5 million (10%),Postsecondary
vocational certificate*
13 million (24%),High school diploma
7 million (12%), Less than a high school diploma
Of the 55 million job openings between 2010 and 2020:
6 recovery: job growth and education requirements through 2020 | executive summary
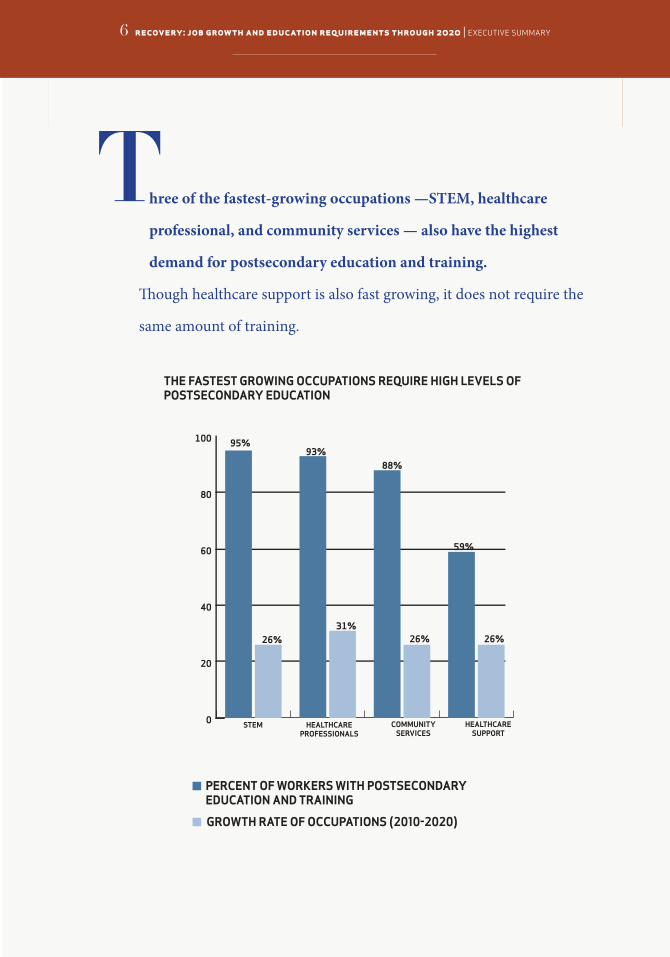
hree of the fastest-growing occupations —STEM, healthcare
professional, and community services — also have the highest
demand for postsecondary education and training.
Though healthcare support is also fast growing, it does not require the
same amount of training.
T
PERCENT OF WORKERS WITH POSTSECONDARY EDUCATION AND TRAINING
GROWTH RATE OF OCCUPATIONS (2010-2020)
0
20
40
60
80
100
STEM HEALTHCARE PROFESSIONALS
COMMUNITY SERVICES
HEALTHCARE SUPPORT
95%
26%
93%
31%
88%
26%
59%
26%
THE FASTEST GROWING OCCUPATIONS REQUIRE HIGH LEVELS OF POSTSECONDARY EDUCATION
recovery: job growth and education requirements through 2020 | executive summary 7
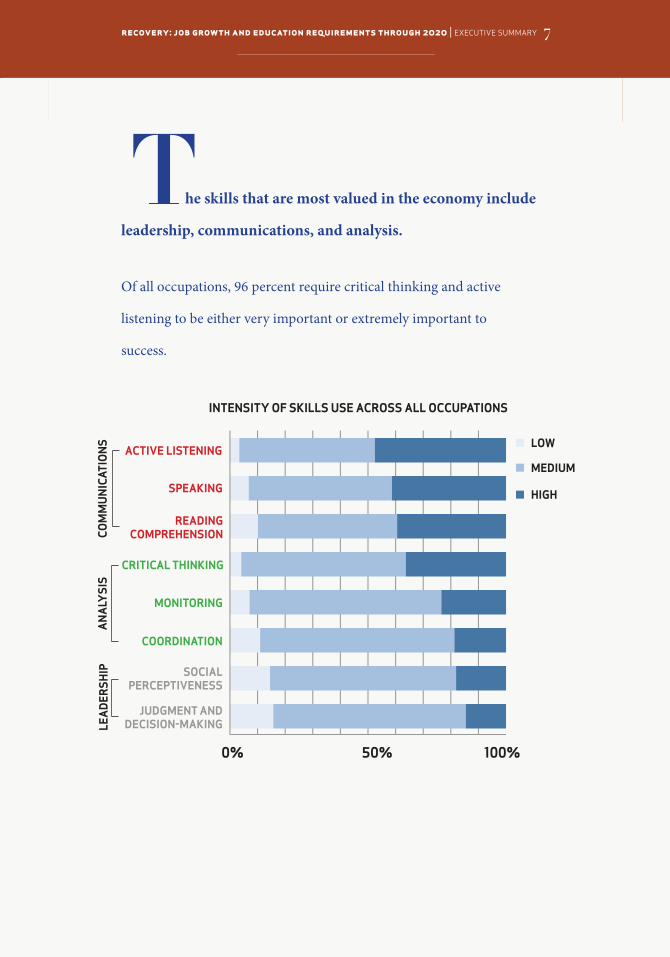
he skills that are most valued in the economy include
leadership, communications, and analysis.
Of all occupations, 96 percent require critical thinking and active
listening to be either very important or extremely important to
success.
T
INTENSITY OF SKILLS USE ACROSS ALL OCCUPATIONS
COM
MU
NIC
ATIO
NS
AN
ALY
SIS
LEA
DER
SHIP
0% 50% 100%
ACTIVE LISTENING
SPEAKING
READINGCOMPREHENSION
CRITICAL THINKING
MONITORING
COORDINATION
SOCIALPERCEPTIVENESS
JUDGMENT ANDDECISION-MAKING
LOW
MEDIUM
HIGH
8 recovery: job growth and education requirements through 2020 | executive summary
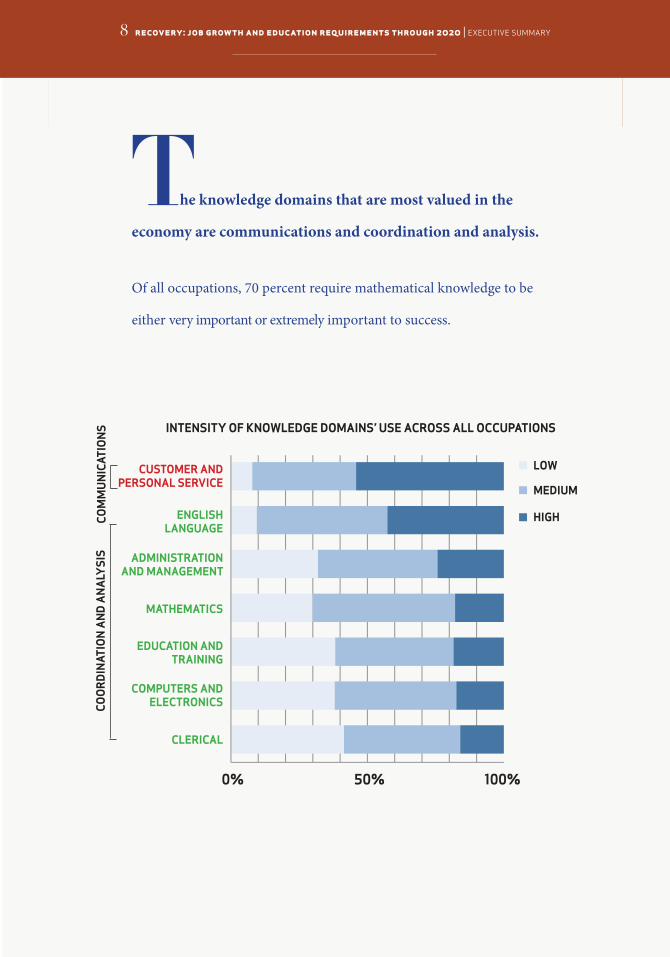
he knowledge domains that are most valued in the
economy are communications and coordination and analysis.
Of all occupations, 70 percent require mathematical knowledge to be
either very important or extremely important to success.
T
INTENSITY OF KNOWLEDGE DOMAINS’ USE ACROSS ALL OCCUPATIONS
COM
MU
NIC
ATIO
NS
CO
OR
DIN
ATIO
N A
ND
AN
ALY
SIS
0% 50% 100%
CUSTOMER ANDPERSONAL SERVICE
ENGLISH LANGUAGE
LOW
MEDIUM
HIGH
ADMINISTRATIONAND MANAGEMENT
MATHEMATICS
EDUCATION ANDTRAINING
COMPUTERS AND ELECTRONICS
CLERICAL
recovery: job growth and education requirements through 2020 | executive summary 9
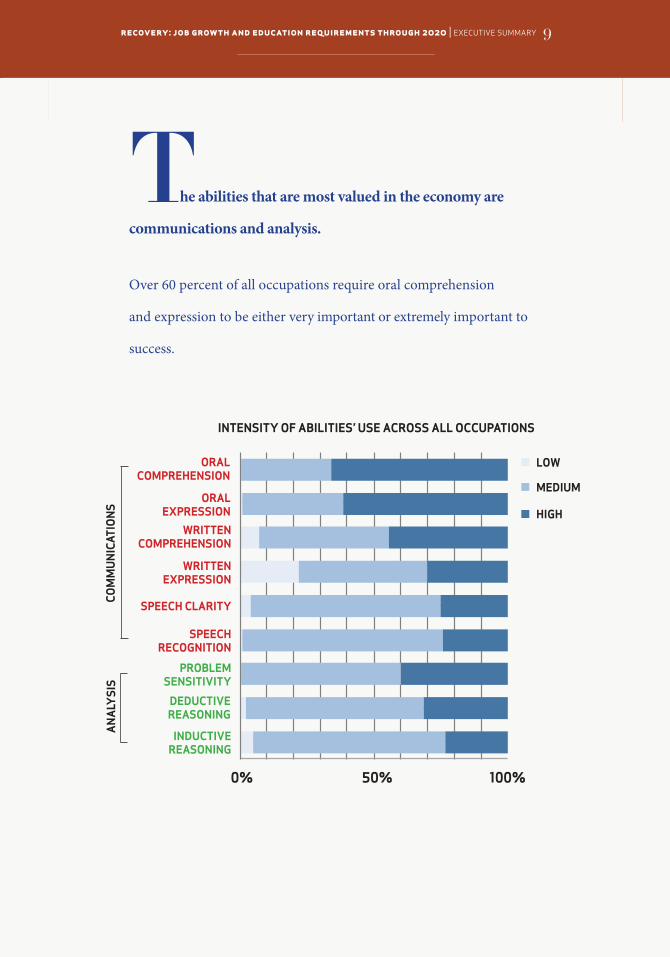
he abilities that are most valued in the economy are
communications and analysis.
Over 60 percent of all occupations require oral comprehension
and expression to be either very important or extremely important to
success.
T
INTENSITY OF ABILITIES’ USE ACROSS ALL OCCUPATIONS
COM
MU
NIC
ATIO
NS
A
NA
LYSI
S
LOW
MEDIUM
HIGH
0% 50% 100%
ORALCOMPREHENSION
ORALEXPRESSION
WRITTENCOMPREHENSION
SPEECH CLARITY
SPEECH RECOGNITION
WRITTENEXPRESSION
PROBLEMSENSITIVITY
DEDUCTIVEREASONING
INDUCTIVEREASONING
10 recovery: job growth and education requirements through 2020 | executive summary
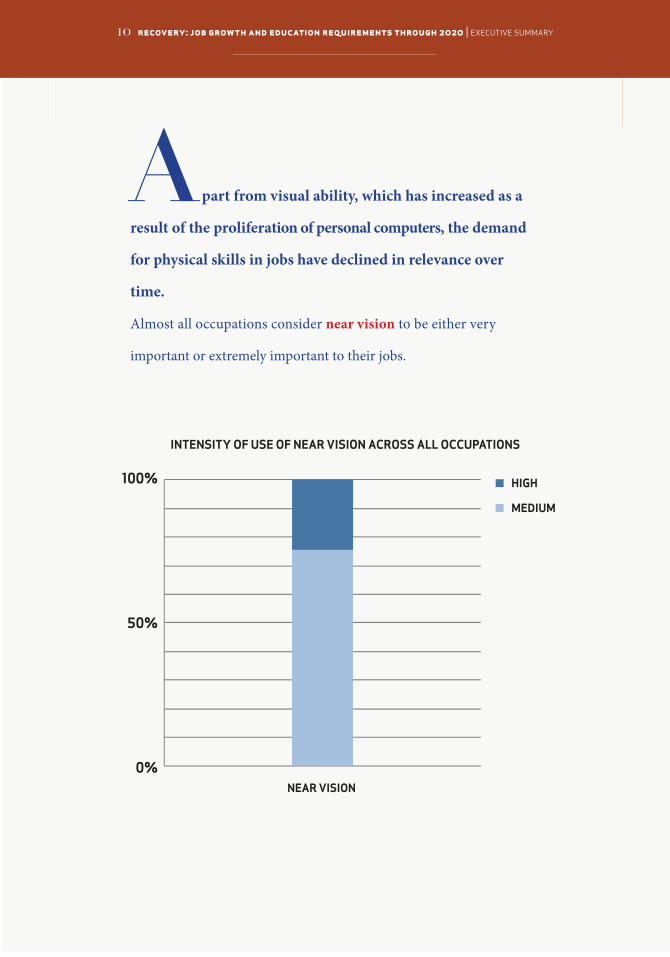
part from visual ability, which has increased as a
result of the proliferation of personal computers, the demand
for physical skills in jobs have declined in relevance over
time.
Almost all occupations consider near vision to be either very
important or extremely important to their jobs.
A
INTENSITY OF USE OF NEAR VISION ACROSS ALL OCCUPATIONS
MEDIUM
HIGH100%
50%
0%NEAR VISION
recovery: job growth and education requirements through 2020 | executive summary 11
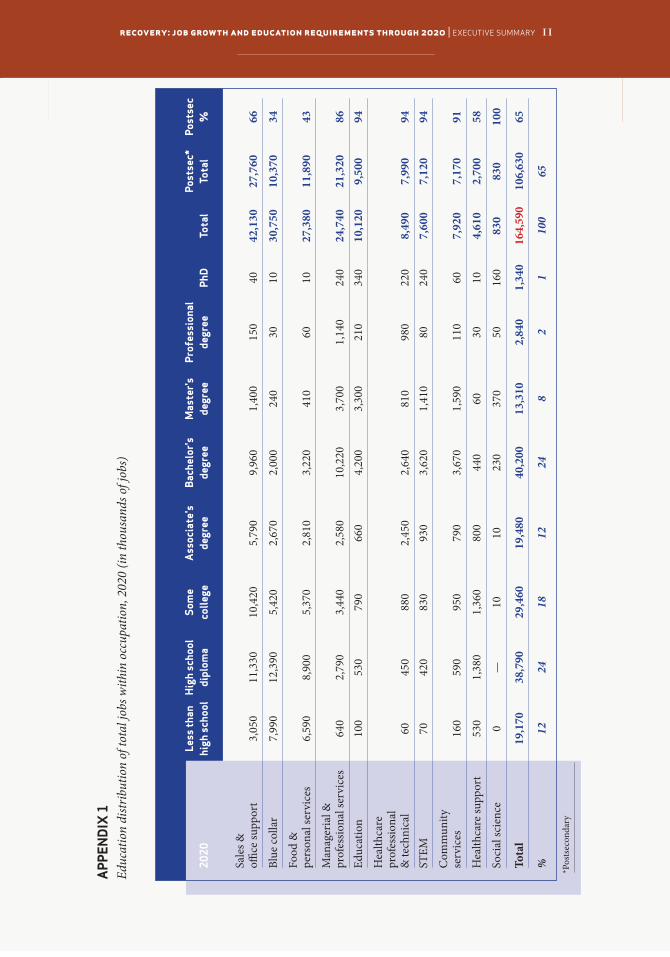
Less
than
H
igh
scho
ol
Som
e
Ass
ocia
te's
Ba
chel
or's
M
aste
r's
Pr
ofes
sion
al
Post
sec*
Po
stse
c20
20
high
sch
ool
dipl
oma
colle
ge
degr
ee
degr
ee
degr
ee
degr
ee
PhD
To
tal
Tota
l%
Sale
s &
office
supp
ort
3,05
0 11
,330
10
,420
5,
790
9,96
0 1,
400
150
40
42,1
30
27,7
60
66
Blue
colla
r 7,
990
12,3
90
5,42
0 2,
670
2,00
0 24
0 30
10
30
,750
10
,370
34
Food
&pe
rson
al se
rvic
es
6,59
0 8,
900
5,37
0 2,
810
3,22
0 41
0 60
10
27
,380
11
,890
43
Man
ager
ial &
pr
ofes
siona
l ser
vice
s 64
0 2,
790
3,44
0 2,
580
10,2
20
3,70
0 1,
140
240
24,7
40
21,3
20
86Ed
ucat
ion
100
530
790
660
4,20
0 3,
300
210
340
10,1
20
9,50
0 94
Hea
lthca
re
prof
essio
nal
& te
chni
cal
60
450
880
2,45
0 2,
640
810
980
220
8,49
0 7,
990
94ST
EM
70
420
830
930
3,62
0 1,
410
80
240
7,60
0 7,
120
94
Com
mun
ity
serv
ices
16
0 59
0 95
0 79
0 3,
670
1,59
0 11
0 60
7,
920
7,17
0 91
Hea
lthca
re su
ppor
t 53
0 1,
380
1,36
0 80
0 44
0 60
30
10
4,
610
2,70
0 58
Soci
al sc
ienc
e 0
—
10
10
23
0 37
0 50
16
0 83
0 83
0 10
0
Tota
l 19
,170
38
,790
29
,460
19
,480
40
,200
13
,310
2,
840
1,34
0 16
4,59
0 10
6,63
0 65
%
12
24
18
12
24
8 2
1 10
0 65
APP
END
IX1
Educ
atio
n di
strib
utio
n of
tota
l job
s with
in o
ccup
atio
n, 2
020
(in th
ousa
nds o
f job
s)
*Pos
tsec
onda
ry
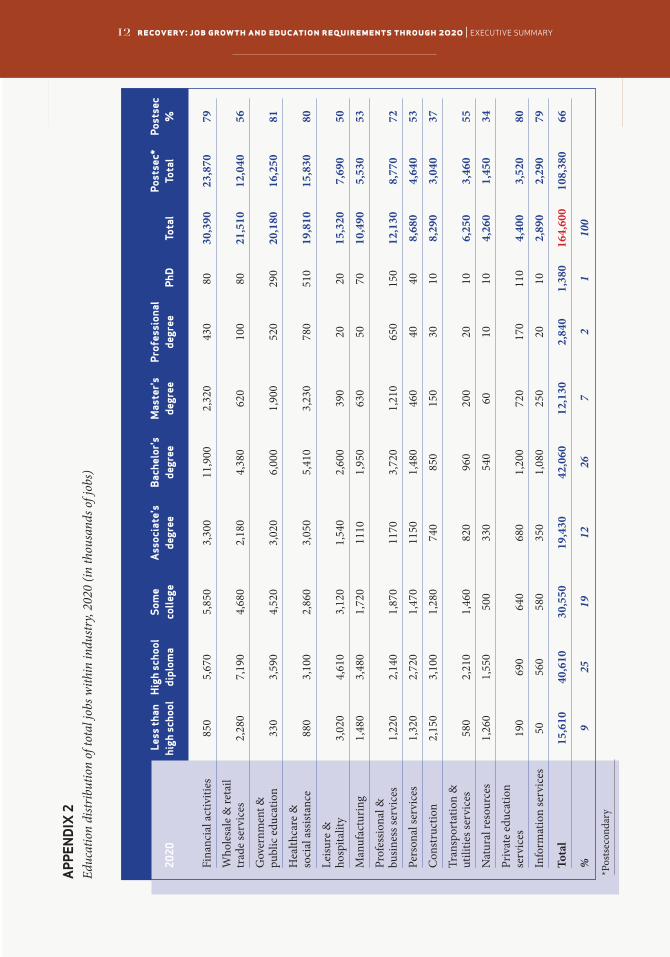
12 recovery: job growth and education requirements through 2020 | executive summary
Les
sth
an
Hig
hsc
hool
So
me
A
ssoc
iate
's
Bach
elor
's
Mas
ter'
s
Prof
essi
onal
Po
stse
c*
Post
sec
2020
hi
ghs
choo
ldi
plom
aco
llege
de
gree
de
gree
de
gree
de
gree
Ph
D
Tota
lTo
tal
%
Fina
ncia
l act
iviti
es
850
5,67
0 5,
850
3,30
0 11
,900
2,
320
430
80
30,3
90
23,8
70
79
Who
lesa
le &
reta
il tr
ade
serv
ices
2,
280
7,19
0 4,
680
2,18
0 4,
380
620
100
80
21,5
10
12,0
40
56
Gov
ernm
ent &
pu
blic
edu
catio
n 33
0 3,
590
4,52
0 3,
020
6,00
0 1,
900
520
290
20,1
80
16,2
50
81
Hea
lthca
re &
soci
al a
ssist
ance
88
0 3,
100
2,86
0 3,
050
5,41
0 3,
230
780
510
19,8
10
15,8
30
80
Leisu
re &
ho
spita
lity
3,
020
4,61
0 3,
120
1,54
0 2,
600
390
20
20
15,3
20
7,69
0 50
Man
ufac
turin
g 1,
480
3,48
0 1,
720
1110
1,
950
630
50
70
10,4
90
5,53
0 53
Prof
essio
nal &
bu
sines
s ser
vice
s 1,
220
2,14
0 1,
870
1170
3,
720
1,21
0 65
0 15
0 12
,130
8,
770
72
Pers
onal
serv
ices
1,
320
2,72
0 1,
470
1150
1,
480
460
40
40
8,68
0 4,
640
53
Con
stru
ctio
n 2,
150
3,10
0 1,
280
740
850
150
30
10
8,29
0 3,
040
37
Tran
spor
tatio
n &
ut
ilitie
s ser
vice
s 58
0 2,
210
1,46
0 82
0 96
0 20
0 20
10
6,
250
3,46
0 55
Nat
ural
reso
urce
s 1,
260
1,55
0 50
0 33
0 54
0 60
10
10
4,
260
1,45
0 34
Priv
ate
educ
atio
n se
rvic
es
190
690
640
680
1,20
0 72
0 17
0 11
0 4,
400
3,52
0 80
Info
rmat
ion
serv
ices
50
56
0 58
0 35
0 1,
080
250
20
10
2,89
0 2,
290
79
Tota
l 15
,610
40
,610
30
,550
19
,430
42
,060
12
,130
2,
840
1,38
0 16
4,60
0 10
8,38
0 66
%
9 25
19
12
26
7
2 1
100
APP
END
IX2
Educ
atio
n di
strib
utio
n of
tota
l job
s with
in in
dustr
y, 20
20 (i
n th
ousa
nds o
f job
s)
*Pos
tsec
onda
ry
3300 Whitehaven Street, NW, Suite 5000
Washington, DC 20007
Mail: Campus Box 571444,
Washington, DC 20057
cew.georgetown.edu
union bug
Recovery: Job Growth and Education Requirements Through 2020 is
composed of a full report, a state report and an executive summary.
All can be accessed at
cew.georgetown.edu/recovery2020