3.4 hydrodynamic modeling of engineered inlet and … · 3.4 hydrodynamic modeling of engineered...
TRANSCRIPT
3.4 HYDRODYNAMIC MODELING OF ENGINEERED INLET AND CANAL EXTENSION
Larry Dell, Philippe E. Tissot, Deidre Williams, Bradley Koskowich, and Niall Durham Conrad Blucher Institute, Texas A&M University-Corpus Christi, Corpus Christi, Texas
1. INTRODUCTION
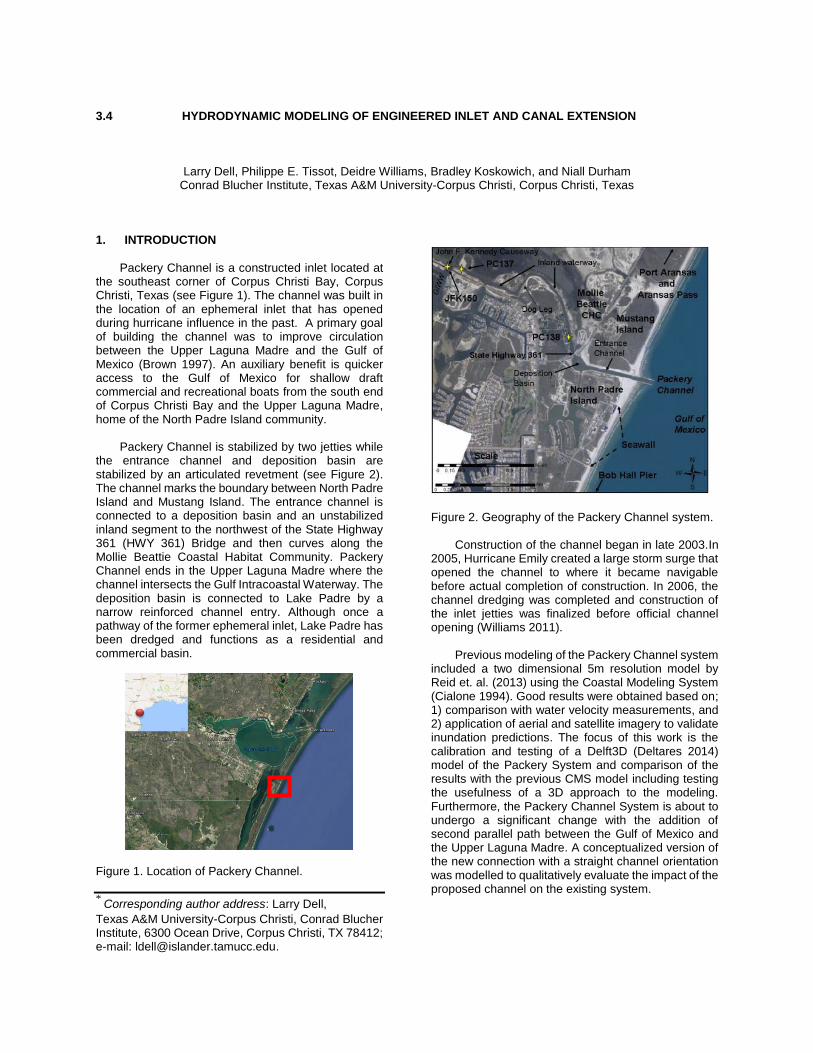
Packery Channel is a constructed inlet located at the southeast corner of Corpus Christi Bay, Corpus Christi, Texas (see Figure 1). The channel was built in the location of an ephemeral inlet that has opened during hurricane influence in the past. A primary goal of building the channel was to improve circulation between the Upper Laguna Madre and the Gulf of Mexico (Brown 1997). An auxiliary benefit is quicker access to the Gulf of Mexico for shallow draft commercial and recreational boats from the south end of Corpus Christi Bay and the Upper Laguna Madre, home of the North Padre Island community.
Packery Channel is stabilized by two jetties while the entrance channel and deposition basin are stabilized by an articulated revetment (see Figure 2). The channel marks the boundary between North Padre Island and Mustang Island. The entrance channel is connected to a deposition basin and an unstabilized inland segment to the northwest of the State Highway 361 (HWY 361) Bridge and then curves along the Mollie Beattie Coastal Habitat Community. Packery Channel ends in the Upper Laguna Madre where the channel intersects the Gulf Intracoastal Waterway. The deposition basin is connected to Lake Padre by a narrow reinforced channel entry. Although once a pathway of the former ephemeral inlet, Lake Padre has been dredged and functions as a residential and commercial basin.
Figure 1. Location of Packery Channel. *
Corresponding author address: Larry Dell,
Texas A&M University-Corpus Christi, Conrad Blucher Institute, 6300 Ocean Drive, Corpus Christi, TX 78412; e-mail: [email protected].
Figure 2. Geography of the Packery Channel system.
Construction of the channel began in late 2003.In 2005, Hurricane Emily created a large storm surge that opened the channel to where it became navigable before actual completion of construction. In 2006, the channel dredging was completed and construction of the inlet jetties was finalized before official channel opening (Williams 2011).
Previous modeling of the Packery Channel system included a two dimensional 5m resolution model by Reid et. al. (2013) using the Coastal Modeling System (Cialone 1994). Good results were obtained based on; 1) comparison with water velocity measurements, and 2) application of aerial and satellite imagery to validate inundation predictions. The focus of this work is the calibration and testing of a Delft3D (Deltares 2014) model of the Packery System and comparison of the results with the previous CMS model including testing the usefulness of a 3D approach to the modeling. Furthermore, the Packery Channel System is about to undergo a significant change with the addition of second parallel path between the Gulf of Mexico and the Upper Laguna Madre. A conceptualized version of the new connection with a straight channel orientation was modelled to qualitatively evaluate the impact of the proposed channel on the existing system.

2. METHODS 2.1 Model Setup
The model chosen was Delft3D, an open source hydrodynamic model developed by Deltares (Deltares 2014). It is a combination of multiple computational engines including the FLOW engine which was selected for this study. The version number of Delft3D used for this work was 4.01.01.rc.03.
The model bathymetry and boundary setup for the study area are presented in Figure 3. The western boundary, labeled WL4, is a water level boundary. Water level data from a nearby TCOON (Rizzo 2014) station shown on the figure is used as a uniform input for this boundary. The eastern boundary labeled WL1 is also a uniform water level boundary with data coming from a nearshore National Water Level Observation Network (NWLON, NOAA 2017) station. The station is a few miles south of the grid, close enough to assume the water levels are the same. The North and South boundaries of the model are defined as Neumann Boundaries with uniform zero values to prevent potential water level gradients across the boundary.
Wind forcing was included in the model using measurements from the nearshore NWLON station. For the model, this data applied a uniform wind profile over the entire grid.
The large black flag in the center of the channel in Figure 3 indicates the location of a current profiler oriented with its x-direction parallel to the channel at this point. The mid depth, mid channel bin of the current profile was used to evaluate the model.
Figure 3: Bathymetry and boundaries of the model with locations of monitoring stations.
Three different grid resolutions were tested to compare accuracy and run times; 60 meters, 20 meters, and 7 meters. The 60 meters model was not functional as it resulted in inadequate representation of modeling of the bathymetry near the HWY 361 Bridge. Packery Channel becomes narrower than 60 meters at this location and it was not possible to satisfactorily model the narrow passage leading to the merging of the two edges of the bridge forming an artificial dam and not allowing flow under regular conditions. The models with resolutions of 20 and 7 meters did not have this issue. Figure 4 shows the 7 meter grid focused around the HWY 361 Bridge.
Figure 4: Illustration of the 7 meter grid around the HWY 361 Bridge.
For bottom roughness, a manning coefficient of 0.02 was selected based on. Reid’s CMS model (Reid et al., 2013) reflecting a smooth, dredged channel as specified by Chow (1959). A very low horizontal eddy viscosity was chosen after significant testing. A value of 0.001 m2/s yielded modeled currents very similar to actual measurements from the validation current profiler. For model initialization, initial water levels were defined as the average measurements at the two boundaries and specified as uniform over the entire grid. The wind drag coefficient was kept as the default value of 0.00063. Data was stored for every 6 minutes of simulation time.
Delft3D was run on two systems during model calibration and testing. One of the systems was a desktop computer with an Intel Core i5-2400, a 3.10 GHz CPU and 8 GB of RAM utilizing the Windows version of Delft3D. The use of the Windows version limited Delft3D to running on a single core processor limiting performance. During testing of the 7 meter resolution, a single week of simulation took 12 calculation days. Delft3D was then migrated to the High Performance Cluster system at Texas A&M University-Corpus Christi. This system has 24 nodes with two Intel Xeon E5-2680v2 and 10 core processors each. Using 20 cores of this system improved calculation time for the same model to 1.5 days.

2.2 Model Validation
Figure 5 shows a comparison of the 20 and 7 meter models for the week of October 21st-29th of 2015. This time period was selected as it included the passage of a cold front and strong current velocity both in the ebb and flow directions. The 7 meter resolution model has a smaller RSME value of 0.17 m/s as compared to an RMSE value of 0.20 m/s for the 20 meter resolution model. Both model predictions match well the phase of the measured signal, however the 20 meter resolution model does not predict well the current magnitude, particularly the large current on October 22nd, 2015. The 20 meter model prediction is
(a)
(b)
Figure 5: Comparisons of modeled and measured along channel currents: October 2015 case. (a) 20 meter resolution model. (b) 7 meter resolution model. about half the measured value at its peak. The performance of the 7 meter model is substantially better with a maximum error of 0.23 m/s. However the 7 meter model under predicts current magnitudes for some of the following days.
Figure 6 compares the same two models for the week of January 10th-17th, 2016, another week with a cold front and strong ebb and flow currents. The comparison yields similar results with the 7 meter outperforming the 20 meter model. Both models perform better than during the October case. This may be related to the fact that the October case was an unusually strong Northern front that generated very
strong currents into Packery Channel, up to 1.15 m/s versus up to 0.87 m/s for the January case.
Due to the better performance of the 7 meter resolution, this model was selected for the next modeling steps. Further statistical comparisons of modeled versus measured currents are shown in Table 1. Three separate cases are shown, each about one week in duration. The second January 2016 case represents the same week but applying a 3 sigma layer model, with the bottom layer being 20% of the water column, the middle layer 60%, and the top layer 20% of the water depth.
(a)
(b)
Figure 6: Comparisons of modeled and measured along channel currents: January 2016 case. (a) 20 meter resolution model. (b) 7 meter resolution model.
For validation, only the middle layer was used as the current profiler in Packery measures about that portion of the water column. As can be seen in Table 1, the three-sigma layer model performance is virtually the same as the one sigma layer model and hence a single sigma layer model was selected for the next modeling steps. 2.3 Model Extension to Lake Padre
The city of Corpus Christi and local developers are in the process of planning the addition of a channel connecting Lake Padre to a series of residential canals to the Southeast of Park Road 22 including a new bridge over the channel. The reported purpose of this

Table 1: Validation and comparison of single and multi-layer 7 meter models (*3 sigma layer model using middle layer)
Case RMSE (m/s)
CF (<0.26 m/s)
Max Diff (m/s)
Bias (m/s)
Oct 2015 0.17 86% 0.23 -0.06
Jan 2016
0.13 92% -0.05 -0.05
Jan 2016*
0.13 92% -0.06 -0.05
Jun 2016
0.16 87% -0.07 -0.04
extension is to further increase water circulation and improve water quality in a series of presently dead-end canals by connecting the Gulf of Mexico to the Upper Laguna Madre via Packery Channel and Lake Padre.
A conceptualized version of this channel was created and added to the 7 meter model to estimate the effects of the new canal on the system. A straight channel with a depth of about 4 meters was added to the model, a depth similar to the main Packery Channel. The geometry of the modified model is presented in Figure 7.
Figure 7: Addition of conceptualized channel to 7 meter model.
Figure 7 also identifies five locations in the model grid where the effects of adding the conceptualized channel are examined. The first being the current profiler in Packery Channel, the only model location where predictions can be compared with measurements. The next cell is under the HWY 361 Bridge over Packery Channel. The section of the channel under the bridge acts a choke point for currents and based on model predictions and visual observations has been observed to have the highest currents in the system. The third location is the Lake Padre entrance, the start of the residential area and an area that should be strongly influenced by the new channel. Fourth is the location of the planned bridge on Park Road 22 (see Figure 8) where the new channel
will begin. When conceptualizing this new channel, a bathymetry similar to that of the Packery Channel Bridge was implemented to simulate the effects of the narrower channel section under the bridge. The last location is near the entrance of Packery Channel mid-way between the jetties to investigate potential changes in the overall flow between the Laguna Madre and the Gulf of Mexico. These locations of interest are illustrated in Figure 8.
Figure 8: Monitoring locations for model comparisons of the impact of the new channel on the Packery Channel System. 3. RESULTS
To assess the impact of the new channel, the updated model was run for the same one-week periods in October 2015 and January 2016. Figure 9 shows a comparison of the modeled current velocity at the current profiler location for the October 2015 case. The measured current velocity is included as further verification (green line). As shown, the model predicts that the addition of the conceptualized channel, could slightly lower ebb currents. Similar results with somewhat lower ebb currents were obtained for the December 2016 case. Such a difference was not observed for the June 2016 case. While a somewhat lower flow could be expected due the new channel splitting the overall flow between the Gulf of Mexico and the Laguna Madre, a more careful study with longer and more diverse test periods would be necessary to confirm this predicted difference and in particular the asymmetry of the impact.
Figure 10 displays a comparison of the predicted
currents at the HWY 361 Bridge. The results are similar to the impact of the new channel at the current profiler location, a small ebb current reduction.
Figure 11 illustrates the effects of the new channel at the Lake Padre entrance. These graphs show a more dramatic change than the previous two. Prior to the new channel, the currents show a noise-like signal. This is due to the fact that the Lake Padre water level signal increases and decreases tracking that observed in the Gulf of Mexico. When the water level in Lake Padre is in agreement with that measured in the Gulf of Mexico, the current stops flowing in or out of Lake Padre until a water level difference resumes. Once the

new conceptualized channel is opened, the currents adopt a pattern similar to that observed for the rest of Packery Channel. There is now a very distinct ebb and flood pattern matching the phase of the rest of the Packery Channel with similar current magnitudes measured at the current profiler location but with a lower current magnitude than at the HWY 361 Bridge. Two peaks in the predicted current time series have been highlighted for further discussion.
(a)
(b)
Figure 9: Comparison of modeled currents with and without conceptualized channel at current profiler location. (a) October 2015 case. (b) January 2016 case.
(a)
(b)
Figure 10: Comparison of modeled currents with and without the conceptualized channel at HWY 361 Bridge. (a) October 2015 case. (b) January 2016 case.
(a)
(b)
Figure 11: Comparison of modeled currents with and without the conceptualized channel at Lake Padre Entrance. (a) October 2015 case. (b) January 2016 case.
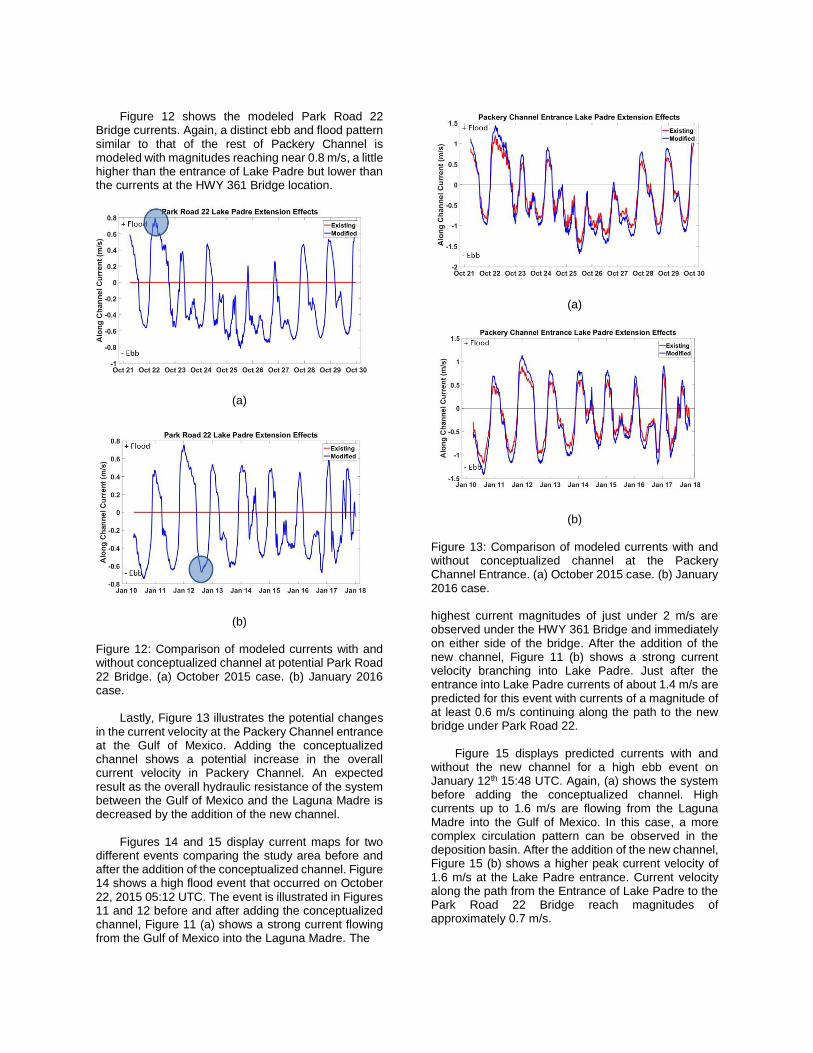
Figure 12 shows the modeled Park Road 22
Bridge currents. Again, a distinct ebb and flood pattern similar to that of the rest of Packery Channel is modeled with magnitudes reaching near 0.8 m/s, a little higher than the entrance of Lake Padre but lower than the currents at the HWY 361 Bridge location.
(a)
(b)
Figure 12: Comparison of modeled currents with and without conceptualized channel at potential Park Road 22 Bridge. (a) October 2015 case. (b) January 2016 case.
Lastly, Figure 13 illustrates the potential changes in the current velocity at the Packery Channel entrance at the Gulf of Mexico. Adding the conceptualized channel shows a potential increase in the overall current velocity in Packery Channel. An expected result as the overall hydraulic resistance of the system between the Gulf of Mexico and the Laguna Madre is decreased by the addition of the new channel.
Figures 14 and 15 display current maps for two different events comparing the study area before and after the addition of the conceptualized channel. Figure 14 shows a high flood event that occurred on October 22, 2015 05:12 UTC. The event is illustrated in Figures 11 and 12 before and after adding the conceptualized channel, Figure 11 (a) shows a strong current flowing from the Gulf of Mexico into the Laguna Madre. The
(a)
(b)
Figure 13: Comparison of modeled currents with and without conceptualized channel at the Packery Channel Entrance. (a) October 2015 case. (b) January 2016 case. highest current magnitudes of just under 2 m/s are observed under the HWY 361 Bridge and immediately on either side of the bridge. After the addition of the new channel, Figure 11 (b) shows a strong current velocity branching into Lake Padre. Just after the entrance into Lake Padre currents of about 1.4 m/s are predicted for this event with currents of a magnitude of at least 0.6 m/s continuing along the path to the new bridge under Park Road 22.
Figure 15 displays predicted currents with and without the new channel for a high ebb event on January 12th 15:48 UTC. Again, (a) shows the system before adding the conceptualized channel. High currents up to 1.6 m/s are flowing from the Laguna Madre into the Gulf of Mexico. In this case, a more complex circulation pattern can be observed in the deposition basin. After the addition of the new channel, Figure 15 (b) shows a higher peak current velocity of 1.6 m/s at the Lake Padre entrance. Current velocity along the path from the Entrance of Lake Padre to the Park Road 22 Bridge reach magnitudes of approximately 0.7 m/s.

(a)
(b)
Figure 14: Modeled currents in Lake Padre area on October 22nd. (a) Present system. (b) Modified system with new channel. 4. DISCUSSION & CONCLUSIONS
The existing Packery Channel system was modeled with Delft3D with validation based on current measurements within the channel. The calibrated model was then applied to estimate the impact of the addition of a new connection between the Gulf of Mexico and the Laguna Madre. The actual new path will include the addition of a bridge and flow through existing residential canals at a more southerly location. A simplified version of the new flow path was modeled as a straight 4 meter deep channel flowing directly from Lake Padre to the Laguna Madre. This study hence provides an estimated upper bound for current velocity in the new system as this idealized model hydraulic resistance will be lower than that of the actual new system. The model is still useful to identify flow patterns and identify the envelope of change including the upper bound of anticipated current velocity and the spatial extent of influence of this new channel addition on the existing Packery Channel.
(a)
(b)
Figure 15: Modeled currents in the Lake Padre area on January 12th. (a) Present system. (b) Modified system with new channel.
Current velocity in the new channel is predicted to be on the same order of magnitude as the current velocity measured at the present Packery Channel current monitoring location. This is both an advantage and a potential concern for the canals in the southeastern portion of the study area. Presently circulation in these canals is poor as they are only connected to the Laguna Madre where the tidal range is substantially smaller than that of the Gulf of Mexico. The stronger current flow predicted by the model would hence help improve water quality in the relatively low flow dead-end canal system.
However, stronger currents could also test the structural integrity of existing bulkheads that were likely not built to withstand strong hydraulic flow in this older network of canals. The banks of the inland channel segment of Packery Channel, north of the HWY 361 Bridge, are not fortified and the channel width has increased substantially (Williams 2011) since opening in 2005. This increase in flow results from periodic water level differences in the Laguna Madre and the Gulf of Mexico that are enhanced at times by the

passage of weather events. The model shows that currents of similar magnitude are to be expected along the new path and in particular under the Park Road 22 bridge. The exact magnitude of these currents will depend on the exact bathymetry of the new connection between the Gulf of Mexico and the Laguna Madre. That said, strong current velocities are to be expected and should be taken into account when considering navigational and recreational safety as well as erosion management especially given that residential and commercial developments exist or are planned.
Ongoing work includes further increasing the model resolution to 2 or 3 meters to compare with the 7 meter resolution described in this study and confirm that the latter model is a good choice based on model accuracy and computational efficiency. The model will also be further validated over a wider range of scenarios. Finally, the model may be updated to include the final channel specifications and most recent bathymetry of the Lake Padre channel and canal extension. 5. ACKNOWLEDGEMENTS
The authors would like to thank Whitney Rutledge and Darek Bogucki for their help with the bathymetry and the set up and physics of the model. 6. REFERENCES
Brown, A.B., and A. Militello, 1997: Packery Channel Feaibility Study: Bay Circulation and Water Level. Blucher Institute Technical Report TAMU-CC-CBI-96-07, Blucher Institute, Division of Coastal and Estuarine Processes, Texas A&M University-Corpus Christi, Corpus Christi, Texas pp. 6.
Chow, V.T. 1959: The Table of Manning’s Roughness
Coefficient. Open-Channel Hydraulics, pp. 110-3.
McGraw-Hill Classic Textbook Reissue, ISBN 07-010776-9
Cialone, M.A. 1994: The Coastal Modeling System
(CMS): A Coastal Process Software Package. Journal of Coastal Research, 10(3), pp. 576-87. Fort Lauderdale, Florida. ISSN 0749-0208.
Deltares Systems, 2014: Delft3D-FLOW, Simulation of
multi-dimensional hydrodynamic flows and transport phenomena, including sediments. User Manual.
NOAA, 2017: The National Water Level Observation
Network (NWLON). Silver Spring, Maryland. [Available online at https://tidesandcurrents.noaa.gov/nwlon.html]
Reid, S., P.E. Tissot, and D. Williams, 2013: Inundation Analysis Using GIS and Hydrodynamic Modeling. Proc. of the 11th Symposium on the Coastal Environment, Austin, Texas, Amer. Meteorological Soc. [Available online at
https://ams.confex.com/ams/93Annual/webprogram/Paper219768.html]
Rizzo, James, Philippe Tissot, and Scott Duff
2014: The Texas coastal ocean observation network. Oceans-St. John's, 2014. pp. 1-10
Williams, D.D. and N.C. Kraus, 2011: Seasonal
Change in Nearshore and Channel Morphology at Packery Channel, A New Inlet Serving Corpus Christi, Texas. In: Roberts, T.M., Rosati, J.D., and Wang, P. (eds.), Proceedings, Symposium to Honor Dr. Nicholas C. Kraus, Journal of Coastal Research, Special Issue, No. 59, pp. 86-97. West Palm Beach, Florida. ISSN 0749-0208.