350-2010: data and text mining in sas® warranty...
TRANSCRIPT

1
Paper 350-2010
Data and Text Mining in SAS® Warranty Analysis 4.2
Ned Maran, SAS Institute Inc., Cary, NC
Wei Huang, SAS Institute Inc., Cary, NC
ABSTRACT
SAS® Warranty Analysis 4.2 includes two analytics, Multivariate Statistical Drivers and Text Analysis, and the functionality Find Similar Comments in the Details Table analysis that use data mining and text mining techniques to analyze warranty data. Multivariate Statistical Drivers uses decision trees to determine which set of reporting variables are statistically significant for explaining variability in warranty claim rates. Text Analysis runs text mining on a text variable, clusters observations, and performs a decision tree analysis to determine which set of reporting variables are best at differentiating each cluster from the overall population. Find Similar Comments finds the requested number of comments that are most similar to a selected comment and outputs a distance metric that provides a relative measure of similarity. These features use data mining and text mining procedures available in SAS® Enterprise Miner™ 6.1 and SAS® Text Miner 4.1. ARBOR, DOCPARSE, TMUTIL, EMCLUS, DMDB, and PMBR are examples of SAS procedures used. In this paper, we illustrate how these procedures are used for analyzing warranty data and show how an interactive graphical, tabular output helps users interpret the results.
INTRODUCTION
SAS Warranty Analysis integrates warranty claims data with key customer, product, manufacturing, and geographic information in a manner that enables organizations to achieve a level of knowledge that can translate into significant value. Among other benefits, this solution enables organizations to automatically detect emerging issues before they make it to the top issues list and helps identify root causes quickly to focus resources on the right issues. The key benefits of SAS Warranty Analysis include reduction in warranty costs, automatic detection of emerging issues sooner, reduction in issue detection to correction time, and more efficient root cause analysis that improves quality and customer satisfaction.
SAS Warranty Analysis 4.2 includes 12 base analyses that are available for selection in the Projects workspace. The analyses are Details Table, Exposure, Forecasting, Geographic, Multivariate Statistical Drivers, Pareto, Reliability, Statistical Drivers, Text Analysis, Time of Claim, Trend/Control, and Trend by Exposure. These analyses help customers identify warranty issues and resolve them. Three of these analyses–Details Table (when a text variable is selected), Multivariate Statistical Drivers, and Text Analysis–use data mining and text mining procedures from SAS Enterprise Miner 6.1 and SAS Text Miner 4.1. In the following sections, we will describe these analyses and show how data mining and text mining procedures are used to analyze warranty data. We will also show examples of outputs from these analyses and show how users interact with the output.
OVERVIEW OF ANALYSIS WORKFLOW IN SAS WARRANTY ANALYSIS
SAS Warranty Analysis is organized into five workspaces–Projects, Data Selections, Reports, Emerging Issues, and Administration. The Projects workspace is used for running the 12 base analyses. It enables users to interact with the analysis output. The Data Selections workspace is used for creating and editing data selection definitions. The Reports workspace is used for interacting with analysis output that has been saved as reports. The Emerging Issues workspace is used for interacting with early warning analysis output. The Administration workspace is used for creating emerging issues analysis definitions and setting default values for objects such as analysis options and data selections.
The analysis workflow (Figure 1) in SAS Warranty Analysis begins with identifying a data selection for the analysis. This might involve creating a new data selection or using an existing data selection. A data selection defines a subset of the SAS Warranty Analysis data mart on which the analysis is executed. Typically, this involves defining product attributes (for example, model, model year, and assembly plant) and/or claim or event attributes (for example, claim amount, failure codes, and keywords in customer or technician comments) that will subset the data mart for analysis. Note that even though analyses can be executed on all the data in the data mart, it might not be useful for issue identification or root cause analysis.
SAS Presents... SolutionsSAS Global Forum 2010

2
After the user identifies a data selection, the next step is to select one or more analyses to run. The user selects analysis options (for example, variables on which to perform the analysis and output display features) for each analysis by either keeping their default values or entering new values. Then the user submits the analysis. Two analysis options are of interest in this paper–the reporting variable and the analysis variable. Reporting variables are analogous to input variables, and analysis variables are analogous to target variables in data mining terminology. When an analysis is submitted, a SAS Stored Process submits SAS jobs on the SAS server to create subset data selections and analysis output. After the analysis finishes running, the results are displayed in the form of tables and graphs. Figure 1 illustrates this workflow.
Data selection
exists?
Create a new data
selection
No
Select data
selectionSelect analysis
Select analysis
options and
submit analysis
View and interact
with output
Start
End
Yes
SAS Stored
Process
Figure 1. Overview of Analysis Workflow
DETAILS TABLE ANALYSIS
In the course of analyzing warranty data, users need to extract detailed data from the warranty data mart and examine the output. This can be accomplished by submitting a Details Table analysis where users select the reporting variables that they want to include in the output. The reporting variables can include one or more text variables. Text variables are often in the form of comments such as customer comments and technician or agent comments. We use the terms text variable and comment variable interchangeably in the following discussion. When the output from the Details Table includes one or more text variables, SAS Warranty Analysis gives users the ability to select a specific comment and to find comments that are similar to the one selected. This functionality helps users to quickly identify and examine rows in the analysis output that might be similar in some respects because the comments in them are similar to the comment of interest.
When the user includes one or more comment variables in the analysis, SAS Warranty Analysis prepares additional output data when the SAS Stored Process runs. This additional output is not surfaced to the user, but it is used behind the scenes when the user invokes the Find Similar Comments functionality while interacting with the analysis output. The additional output consists of a data set that contains Singular Value Decomposition (SVD) dimensions from the TMUTIL procedure and a data mining database catalog on this data set from the DMDB procedure. Further, separate output is created for each comment variable if more than one comment variable has been selected for analysis.
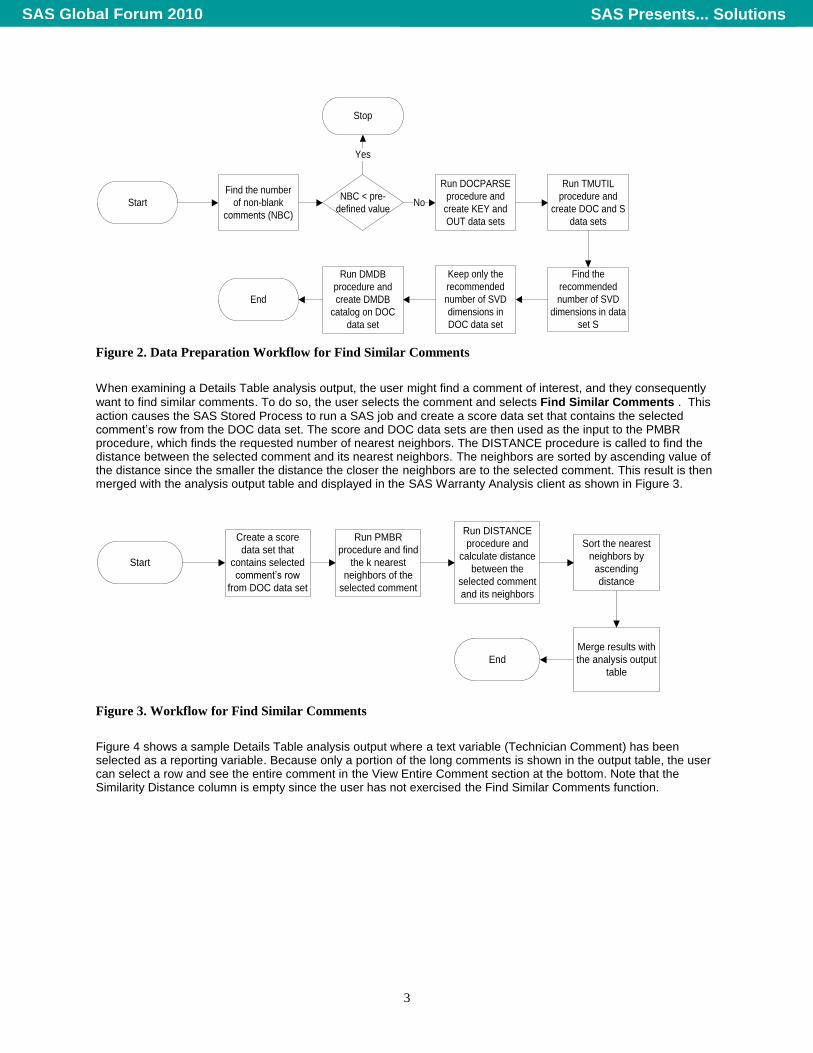
The data preparation workflow, shown in Figure 2, begins with finding the number of non-blank comments in the analysis output data set. If the number of non-blank comments is less than a configurable predefined value, no output is created for the comment variable; and Find Similar Comments functionality will not be available for that comment. This is because the Find Similar Comments function does not make business sense when there are too few comments. If the number of non-blank comments is greater than or equal to the pre-configured value, the DOCPARSE procedure is called to parse the comments and create the term data set (KEY) and the compressed term-document frequency matrix (OUT) data set, which in turn form input to the TMUTIL procedure. The TMUTIL procedure creates a document (DOC) data set that contains potential SVD dimensions and the singular values data set (S). The singular values data set identifies the number of singular values to keep based on the resolution used. The DOC data set is amended so that only the recommended number of SVD dimensions is kept and the rest discarded. The DMDB procedure is then invoked to create a data mining database catalog on the DOC data set. Both the DOC data set and the DMDB catalog are stored in the SAS library that contains analysis output objects.
SAS Presents... SolutionsSAS Global Forum 2010
3
Start
Find the number
of non-blank
comments (NBC)
NBC < pre-
defined value
Stop
Yes
Run DOCPARSE
procedure and
create KEY and
OUT data sets
No
Run TMUTIL
procedure and
create DOC and S
data sets
Find the
recommended
number of SVD
dimensions in data
set S
Keep only the
recommended
number of SVD
dimensions in
DOC data set
Run DMDB
procedure and
create DMDB
catalog on DOC
data set
End
Figure 2. Data Preparation Workflow for Find Similar Comments
When examining a Details Table analysis output, the user might find a comment of interest, and they consequently
want to find similar comments. To do so, the user selects the comment and selects Find Similar Comments . This action causes the SAS Stored Process to run a SAS job and create a score data set that contains the selected comment’s row from the DOC data set. The score and DOC data sets are then used as the input to the PMBR procedure, which finds the requested number of nearest neighbors. The DISTANCE procedure is called to find the distance between the selected comment and its nearest neighbors. The neighbors are sorted by ascending value of the distance since the smaller the distance the closer the neighbors are to the selected comment. This result is then merged with the analysis output table and displayed in the SAS Warranty Analysis client as shown in Figure 3.
Start
Create a score
data set that
contains selected
comment’s row
from DOC data set
Run DISTANCE
procedure and
calculate distance
between the
selected comment
and its neighbors
Sort the nearest
neighbors by
ascending
distance
Merge results with
the analysis output
table
End
Run PMBR
procedure and find
the k nearest
neighbors of the
selected comment
Figure 3. Workflow for Find Similar Comments
Figure 4 shows a sample Details Table analysis output where a text variable (Technician Comment) has been selected as a reporting variable. Because only a portion of the long comments is shown in the output table, the user can select a row and see the entire comment in the View Entire Comment section at the bottom. Note that the Similarity Distance column is empty since the user has not exercised the Find Similar Comments function.
SAS Presents... SolutionsSAS Global Forum 2010

4
Figure 4. Details Table Output
When the user comes across a comment of interest, they select the row for that comment and click Find Similar
Comments. In the Find Similar Comments window (Figure 5), they select the comment variable (if there is more
than one in the report), the number of similar comments wanted, and then click OK.
Figure 5. Find Similar Comments Window
SAS Presents... SolutionsSAS Global Forum 2010
5
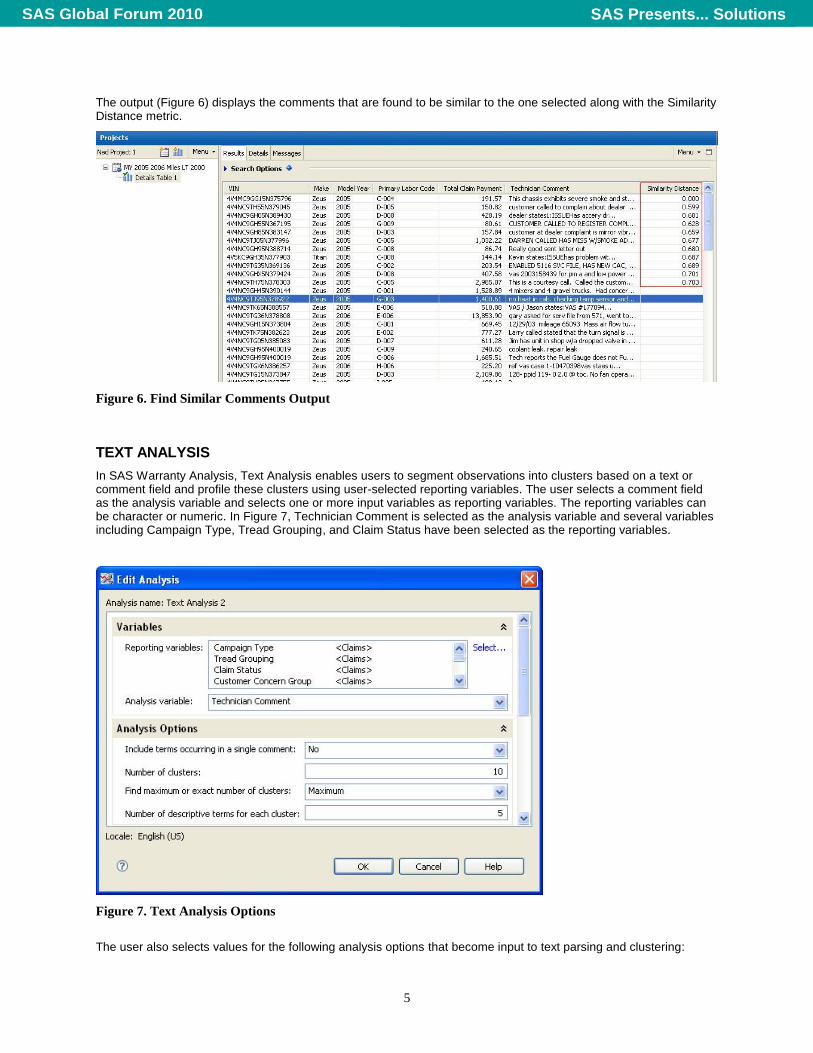
The output (Figure 6) displays the comments that are found to be similar to the one selected along with the Similarity Distance metric.
Figure 6. Find Similar Comments Output
TEXT ANALYSIS
In SAS Warranty Analysis, Text Analysis enables users to segment observations into clusters based on a text or comment field and profile these clusters using user-selected reporting variables. The user selects a comment field as the analysis variable and selects one or more input variables as reporting variables. The reporting variables can be character or numeric. In Figure 7, Technician Comment is selected as the analysis variable and several variables including Campaign Type, Tread Grouping, and Claim Status have been selected as the reporting variables.
Figure 7. Text Analysis Options
The user also selects values for the following analysis options that become input to text parsing and clustering:
SAS Presents... SolutionsSAS Global Forum 2010

6
Include terms occurring in a single comment (Yes/No) – whether to include terms that have occurred in a single comment in the analysis
Number of clusters
Find maximum or exact number of clusters (Maximum/Exact) – Text Analysis will find the optimal number of clusters up to the maximum value when the Maximum option is selected; Text Analysis will produce the exact number of clusters specified in the Number of Clusters option when the Exact option is selected.
Number of descriptive terms for each cluster
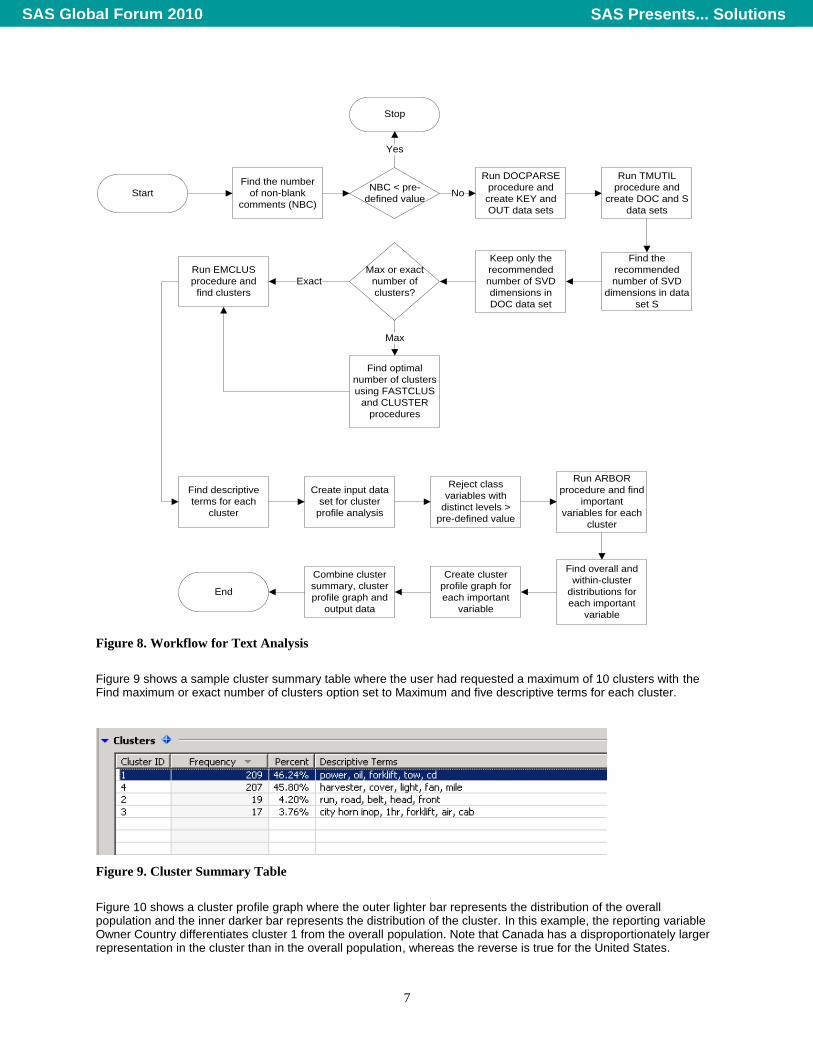
As with Details Table analysis, the analysis workflow, shown in Figure 8, uses DOCPARSE and TMUTIL procedures and creates the final DOC data set that contains the recommended number of SVD dimensions. If the Find maximum or exact number of clusters analysis option is set to Maximum, FASTCLUS and CLUSTER procedures are called with the DOC data set as input to find the optimal number of clusters that is less than or equal to the value entered for the Number of clusters analysis option. The DOC data set is then used by the EMCLUS procedure to find the required number of clusters. The user-requested number of descriptive terms is found for each cluster. SAS Warranty Analysis uses the same technique that Text Miner uses for finding the descriptive terms.
The next step in the analysis workflow is to profile the clusters using the user-selected reporting variables. The objective of cluster profile analysis is to identify variables that differentiate the given cluster from the overall population. This is accomplished by building a decision tree for each cluster separately and finding variables that the tree identifies as important. The input data set for the decision tree analysis consists of all the reporting variables as input variables and a binary target variable that is set to 1 if the observation belongs to the cluster or 0 otherwise. If the number of distinct levels of a class variable is greater than a configurable predefined value, the variable is rejected from the cluster profile analysis. The ARBOR procedure builds a decision tree and calculates variable importance for each cluster. Reporting variables with an importance metric greater than zero for each cluster are selected to profile that particular cluster. Within-cluster distributions and overall population distributions are calculated for each important variable. Cluster profile graphs are constructed by overlaying within-cluster distribution and overall distribution as overlay bar charts. The analysis output consists of the following:
Cluster Summary Table
Cluster Profile Graphs
Claim Details Table
SAS Presents... SolutionsSAS Global Forum 2010
7
Start
Find the number
of non-blank
comments (NBC)
NBC < pre-
defined value
Stop
Yes
Run DOCPARSE
procedure and
create KEY and
OUT data sets
No
Run TMUTIL
procedure and
create DOC and S
data sets
Find the
recommended
number of SVD
dimensions in data
set S
Keep only the
recommended
number of SVD
dimensions in
DOC data set
End
Max or exact
number of
clusters?
Find optimal
number of clusters
using FASTCLUS
and CLUSTER
procedures
Max
Run EMCLUS
procedure and
find clusters
Exact
Find descriptive
terms for each
cluster
Create input data
set for cluster
profile analysis
Run ARBOR
procedure and find
important
variables for each
cluster
Find overall and
within-cluster
distributions for
each important
variable
Combine cluster
summary, cluster
profile graph and
output data
Create cluster
profile graph for
each important
variable
Reject class
variables with
distinct levels >
pre-defined value
Figure 8. Workflow for Text Analysis
Figure 9 shows a sample cluster summary table where the user had requested a maximum of 10 clusters with the Find maximum or exact number of clusters option set to Maximum and five descriptive terms for each cluster.
Figure 9. Cluster Summary Table
Figure 10 shows a cluster profile graph where the outer lighter bar represents the distribution of the overall population and the inner darker bar represents the distribution of the cluster. In this example, the reporting variable Owner Country differentiates cluster 1 from the overall population. Note that Canada has a disproportionately larger representation in the cluster than in the overall population, whereas the reverse is true for the United States.
SAS Presents... SolutionsSAS Global Forum 2010

8
Figure 10. Cluster Profile Graph
Figure 11 shows a sample claim details table where users can see the Cluster ID for each row, all the reporting variables, and the comment variable analyzed. As in the Details Table output, the whole comment can be viewed in the View Entire Comments section at the bottom.
Figure 11. Claim Details Table
SAS Presents... SolutionsSAS Global Forum 2010

9
The three sections of the Text Analysis output are linked. When the user selects a cluster in the Cluster Summary table, the Cluster Profile and the Claim Details sections show graphs and observations that belong to the selected cluster.
MULTIVARIATE STATISTICAL DRIVERS ANALYSIS
Multivariate Statistical Drivers (MSD) analysis enables users to rank reporting variables based on their relative influence on failure rates and to identify the combinations of the reporting variable levels that drive failure rates. The user selects one or more reporting variables for the analysis. The analysis variable is either claim rate or claim count. The MSD analysis finds influential variables by building a decision tree model that recursively partitions the input data so that the child nodes at each partition are more homogeneous than the parent node.
In Figure 12, several reporting variables including Campaign Type, Customer Concern Group, and Repairing Dealer Country have been selected. In addition, the user selects values for the following analysis options that become input to the decision tree model from configurable drop-down lists:
Maximum number of branches – the maximum number of branches from a parent node
Maximum depth of tree
Alpha level – the threshold p-value for the significance level of a candidate split
Figure 12. MSD Analysis Options
The analysis workflow, shown in Figure 13, begins with finding the number of observations in the input data set. If the input number of observations is less than a configurable predefined value, no analysis is conducted. As per business rules, SAS Warranty Analysis selects Claim Rate as the analysis variable when the reporting variables are based on products and Claim Count as the analysis variable when the reporting variables are based on claims. For the Claim Rate analysis variable, the ARBORETUM procedure is executed with Sample Size as the frequency variable. For the Claim Count analysis variable, no frequency variable is used. The ARBORETUM procedure results
SAS Presents... SolutionsSAS Global Forum 2010

10
are post-processed, and, from the post-processed results, SAS Warranty Analysis output tables and graphs are created. The analysis output consists of the following:
Importance List
Leaf Node Chart
Node Details Table
Decision Tree
Start
Find the number
of input
observations
(OBS)
OBS < Pre-
defined value
Yes
Stop
Analysis
Variable
Run
ARBORETUM
procedure with
Sample Size as
Freq Variable
Run
ARBORETUM
procedure without
Freq Variable
Claim Rate
Claim Count
Post process
ARBORETUM
procedure results and
create SWA output
tables and graphs
Stop
No
Figure 13. Workflow for MSD Analysis
Figure 14 shows a sample importance list that lists all the reporting variables used in the analysis in descending order of their relative importance. The relative importance metric indicates a measure of the variable’s potential influence on the analysis variable in terms of explaining its variability. Variables with zero value for relative importance are not considered further in the analysis. As the name implies, relative importance is a relative measure that can be used to compare variable importance within the analysis and not across multiple analyses.
Figure 14. Importance List
The leaf node chart (Figure 15) is a bar chart of average claim rate in all the leaf (terminal) nodes arranged in descending order of the average claim rate. This enables the user to quickly identify the leaf nodes that have the most or least favorable average claim rates and to further investigate their characteristics.
SAS Presents... SolutionsSAS Global Forum 2010

11
Figure 15. Leaf Node Chart
The Node Details table (Figure 16) shows the leaf nodes and their respective average claim rates and the combination of the levels of the reporting variables that constitute the selected leaf. The information in the table to the right is derived from the splitting rules of the decision tree model. In this example, leaf 9 has the highest average claim rate; by studying the leaf details, users can gain insight into the combinations of the levels of the reporting variables that have potential influence on high claim rates.
Figure 16. Node Details Table
The decision tree diagram (Figure 17) shows the decision tree model constructed. It also shows the sample size and average claim rate for the leaf nodes.
SAS Presents... SolutionsSAS Global Forum 2010

12
Figure 17. Decision Tree
The leaf node chart, the node details table, and the decision tree diagram are linked. When the user selects a leaf node in any one of the three, the other two either highlight the node (if it is the leaf node chart or the decision tree) or show the node details (if it is the node details table).
CONCLUSION
In this paper, we illustrated how data mining and text mining procedures available in SAS Enterprise Miner 6.1 and SAS Text Miner 4.1 are used for analyzing warranty data in SAS Warranty Analysis 4.2 and showed how an interactive graphical, tabular output helps users interpret the results. We discussed Text Analysis, Multivariate Statistical Drivers analysis and the Find Similar Comments feature in the Details Table analysis that are available in SAS Warranty Analysis 4.2. Work is currently in progress to include association and sequence analyses in a future release, which will help users understand relationships between failure types such as labor codes and replaced parts.
ACKNOWLEDGMENTS
The authors would like to thanks Julie LaBarr for reviewing the manuscript.
SAS Presents... SolutionsSAS Global Forum 2010

13
CONTACT INFORMATION
Your comments and questions are valued and encouraged. Contact the authors at:
Name: Ned Maran Enterprise: SAS Institute Inc. Address: 100 SAS Campus Drive City, State ZIP: Cary, NC 27513 Work Phone: +1 (919) 531-0082 Fax: +1 (919) 677-4444 E-mail: [email protected] Name: Wei Huang Enterprise: SAS Institute Inc. Address: 100 SAS Campus Drive City, State ZIP: Cary, NC 27513 Work Phone: +1 (919) 531-0497 Fax: +1 (919) 677-4444 E-mail: [email protected]
SAS and all other SAS Institute Inc. product or service names are registered trademarks or trademarks of SAS Institute Inc. in the USA and other countries. ® indicates USA registration.
Other brand and product names are trademarks of their respective companies.
SAS Presents... SolutionsSAS Global Forum 2010