3555542960 toward a basin-wide drought planning tool in ... 8 130... · ben pratt, john balay ......
TRANSCRIPT
Toward a Basin-Wide Drought Planning Tool in the Susquehanna River Basin 2016 AWRA Annual Conference November 13, 2016 Drought planning for water supply and forecasting drought conditions Josh Weiss, PhD, PE, D.WRE [email protected]
http://www.flickr.com/photos/nicholas_t/3555542960

Acknowledgements and Agenda
Co-authors: Kinsey Hoffman (Hazen and Sawyer)
Ben Pratt, John Balay (Susquehanna River Basin Commission)
Richard Palmer, Katie Booras, Alex McIntyre (UMass-Amherst)
Clark Howells (City of Baltimore DPW)
Background How do we deal with drought? NOAA project overview Drought simulation example

Susquehanna River Basin
27,500 sq miles of watershed Three states: NY, PA, MD Varies widely in topography, geology, climate Future climate conditions highly uncertain Wide range of drought responses/approaches

SRBC Drought Coordinating Committee
• Convened by staff as necessary based on hydrologic conditions
• Provides forum for signatories’ technical staff to communicate regarding drought monitoring data & potential response actions
• Intended for making recommendations to commissioners regarding drought declarations & response actions to be taken through resolution


2001-2002 Mid-Atlantic Drought Prettyboy Reservoir, photo by Wendy S. McPherson, U.S. Geological Survey
http://www2.ljworld.com/photos/2002/jan/30/25563/

Drought planning isn’t just for California and Texas!
-6
-5
-4
-3
-2
-1
0
1
2
3
4
Palm
er D
roug
ht S
ever
ity In
dex
Original data from N. Pederson, Lamont Dougherty Earth Observatory - http://www.ldeo.columbia.edu/~adk/data/NYCreconWeb2.csv

Dealing with Drought
How do we identify a drought? Monitor drought indices and triggers
We want to catch possible/probable drought as early as possible
Look at climate, compare to history
Important to consider water demands
How do we respond to drought? Proactive planning and operations
Reactive management (demand cutbacks, use restrictions, etc.)

Drought Indices
Drought indices are used to describe current conditions and trends to support decision-making
• Reservoir elevation or storage • Recent streamflow • Historical streamflow • Forecasts • Groundwater levels • Cumulative inflow • Percent of Normal • Standardized Precipitation Index
(SPI)
• Palmer Drought Severity Index (PDSI)
• Palmer Hydrologic Drought Index (PHDI)
• Soil Moisture Index (SMI) • Crop Moisture Index (CMI) • Surface Water Supply Index
(SWSI)

• HEFS aims to “capture” observed flow consistently • So, must account for total uncertainty & remove bias • Total = forcing uncertainty + hydrologic uncertainty
Goal: quantify total uncertainty in flow
Forecast horizon
Stre
amflo
w
Hydrologic uncertainty
Weather (forcing) uncertainty in flow
Observed streamflow
Total
NWS’ Hydrologic Ensemble Forecast Service (HEFS)
Slide credit: Seann Reed, NOAA NWS MARFC

Drought Triggers
Thresholds or values of indices or forecasts that are used to trigger a response
Near term management • Maximize finished water storage • Source balancing • Modified operations • Bring new source online • Call for use restrictions
• (voluntary, mandatory)
Long term planning • Develop new storage • Seek alternative or emergency
sources • Vulnerability assessment • Climate change analysis • Demand management • Leak reduction
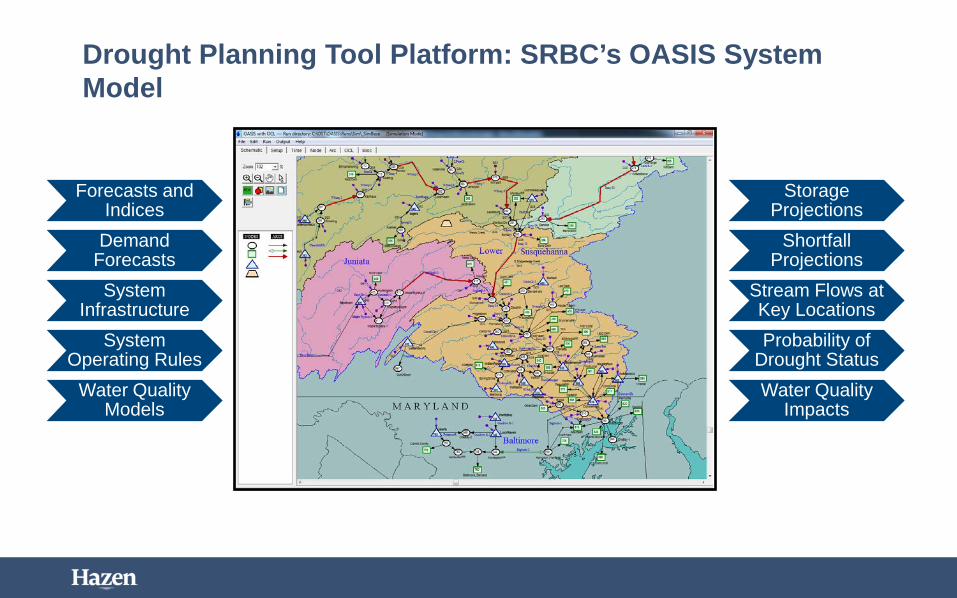
Drought Planning Tool Platform: SRBC’s OASIS System Model
Forecasts and Indices
Demand Forecasts System
Infrastructure System
Operating Rules Water Quality
Models
Storage Projections
Shortfall Projections
Stream Flows at Key Locations Probability of
Drought Status Water Quality
Impacts

NOAA’s Drought Mission
SARP: Sectoral Applications Research Program Currently focused on water resource management initiatives for coping with drought, and extreme event preparedness
NIDIS: National Integrated Drought Information System Objective is an integrated national drought monitoring and forecasting system at federal, state, and local levels
NIDIS implementation plan: https://www.drought.gov/media/imageserver/NIDIS/content/whatisnidis/NIDIS-IPFinal-June07.pdf

Objectives of the Drought Planning Tool
Identify onset
Implement mitigation actions
Identify recovery
• Monitor relevant drought indices and forecasts • Use triggers to initiate mitigation responses • We want to catch possible/probable drought as early as
possible • We want to minimize occurrence of “false positives” • Important to consider water demands

Objectives of the Drought Planning Tool
Identify onset
Implement mitigation actions
Identify recovery
• Emphasize proactive over reactive management • Continue to monitor drought indices/forecasts and re-evaluate
management decisions • Modeling and scenario analysis can help managers evaluate
alternative strategies based on current and projected conditions

Objectives of the Drought Planning Tool
Identify onset
Implement mitigation actions
Identify recovery
• Use drought indices and forecasts to trigger demobilization of mitigation actions
• We want to avoid costly mitigation actions when risk for adverse outcomes is reasonably low


Data and Models
System Simulation Platform
Analysis and Decision Support

OASIS Planning and Operations Support Tool will provide analytical platform for integrated basin planning
Basin stakeholders

Forecasted Croton System Usable Storage
Observed storage
Given today’s conditions, system indices, and forecasted system inflows: • What is the likelihood of entering
drought? • Should we initiate drought mitigation
measures? • What is the likelihood of use restrictions
and can we avoid them?
The objective of the SRB Drought Planning Tool is to enhance and integrate existing tools to improve predictive capabilities

Forecasted Croton System Usable Storage
Observed storage
Supply thresholds of interest (e.g. 25%, 30%, 35% storage)

Forecasted Croton System Usable Storage
Observed storage
Forecasted storage

Forecasted Croton System Usable Storage
Observed storage
Forecasted storage
e.g. Over the next 1-2 months, there is: • 4% chance of dropping below 30%
storage threshold • 20% chance of dropping below 35%
storage threshold

Case Study Example: Baltimore City
Current Operations • Meet demand (~250 mgd) with
storage in Prettyboy, Loch Raven, and Liberty Reservoirs
• Initiate Susquehanna diversions via Deer Creek PS when Prettyboy and Loch Raven are drawn down to 490 ft and 237 ft
• Return to 100% Baltimore reservoir supplies when storage goes back above 490 and 237 ft
Baltimore
PrettyboyReservoir
Liberty Reservoir
Loch Raven Reservoir
ConowingoPond Intake
Pennsylvania
Maryland

Operational Example: Baltimore City (cont’d)
Alternatives for Proactive Drought Management • Initiate diversions before reservoirs are drawn down to 490/237 ft • Maintain full reservoirs at the start of the low-flow season • Avoid Susquehanna diversions during months with the lowest
flows • Tradeoffs:
• Water supply reliability, reservoir storage
• Pumping and treatment costs
• Water quality
• Use restrictions, curtailments
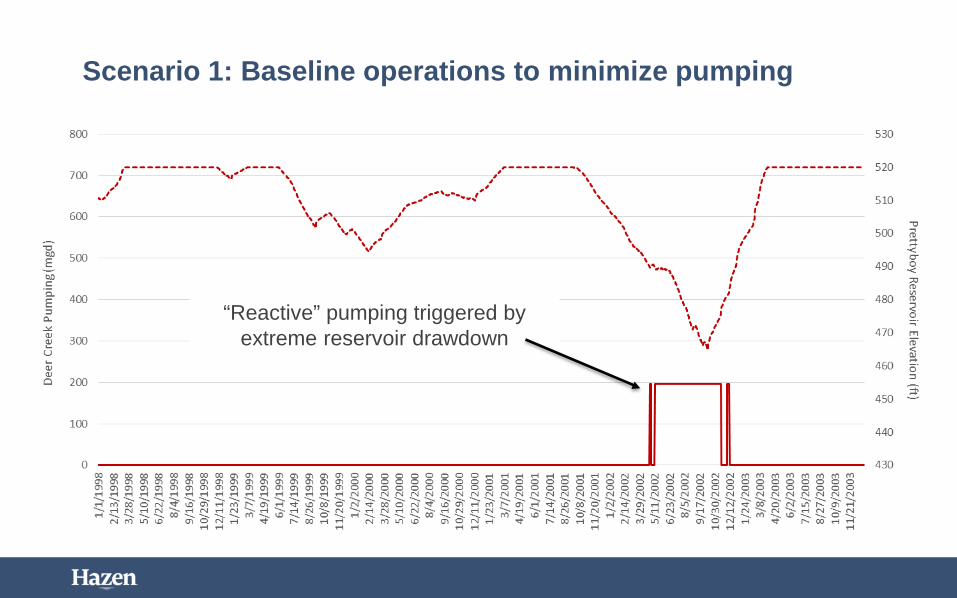
Scenario 1: Baseline operations to minimize pumping
“Reactive” pumping triggered by extreme reservoir drawdown

Example Scenario 2: Proactive pumping based on Palmer Hydrologic Drought Index (PHDI)
Earlier pumping triggered by PHDI
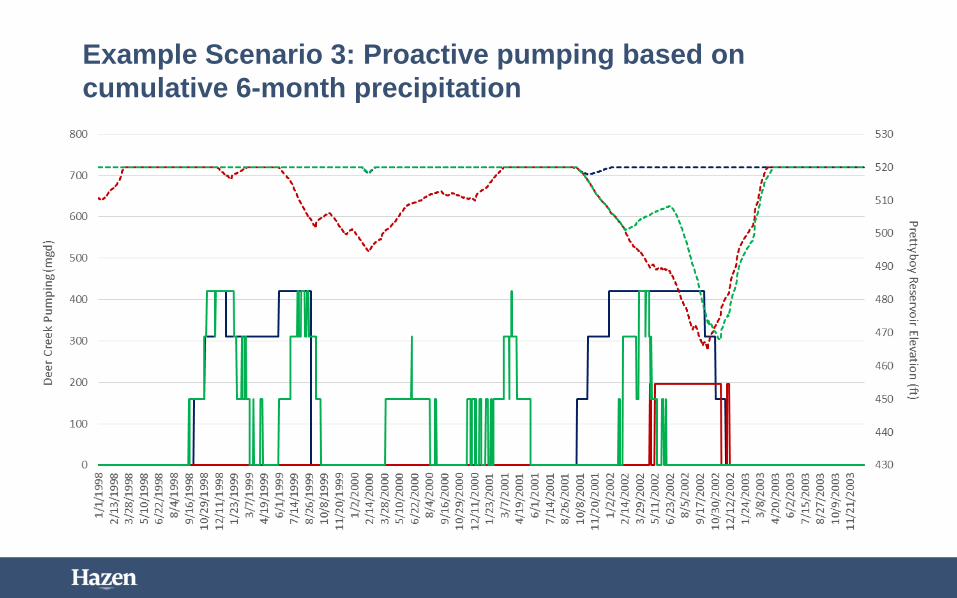
Example Scenario 3: Proactive pumping based on cumulative 6-month precipitation
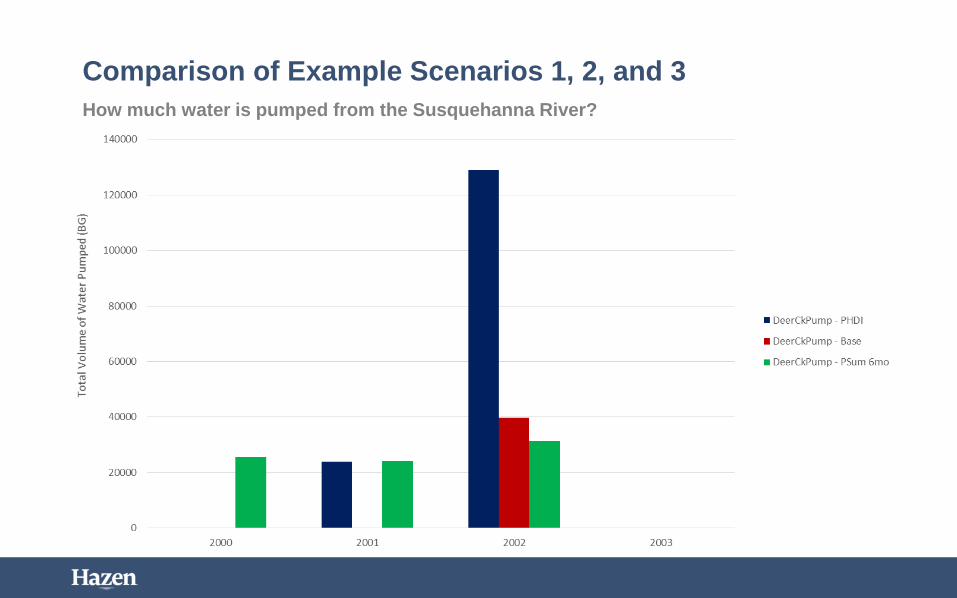
Comparison of Example Scenarios 1, 2, and 3 How much water is pumped from the Susquehanna River?

Comparison of Example Scenarios 1, 2, and 3 How low does storage get during a drought?

Comparison of Example Scenarios 1, 2, and 3 Daily results over entire 1930-2014 simulation period

Are there better water supply-specific indices?
Days of Supply Remaining (DSR):
DSR = Total Storage,t + NWS 3mo Forecast − accum{Demand, 𝑡 + 1, 𝑡 + 90} [mg]
Demand [mgd]
Forecast horizon
Stre
amflo
w
Hydrologic uncertainty
Weather (forcing) uncertainty in flow
Observed streamflow
Total
Next Steps
Case studies – Baltimore, Capital Region Water, York Water • Define key performance indicators • Investigate alternative indices and thresholds • Investigate alternative operating rules
Develop Drought Planning Tool Dashboard Deliver Drought Planning Tool to SRBC Hold stakeholder workshops/training Project end date: August 30, 2017
