3.6 flood hydrology - klamath restorationklamathrestoration.gov/sites/klamathrestoration.gov/files/3...
TRANSCRIPT

Chapter 3 – Affected Environment/Environmental Consequences 3.6 Flood Hydrology
3.6-1 – September 2011
3.6 Flood Hydrology
This section is focused on flooding effects from the Proposed Action and alternatives.
The surface water hydrology within the Klamath Basin has a complicated and complex
history; however, only elements of the hydrology related to the alternatives’ potential
flood impacts are described in this section. Other sections of the Klamath Facilities
Removal Environmental Impact Statement/Environmental Impact Report (EIS/EIR)
discuss groundwater (Section 3.7), water quality (Section 3.2), and water supply/water
rights (Section 3.8).
3.6.1 Area of Analysis
The area of analysis for this section includes the Klamath River and tributaries that define
the Klamath Basin, which lies in portions of three Oregon counties (Klamath, Jackson,
and Curry) and five California counties (Modoc, Siskiyou, Del Norte, Humboldt, and
Trinity). Upper Klamath Lake, formed by the Link River Dam, is in Oregon and releases
water into the Link River. About one mile below the Link River Dam, the river flows
into Keno Impoundment/Lake Ewauna. The Keno Impoundment/Lake Ewauna is
controlled by the Keno Dam in Keno, Oregon. The Klamath River begins at the outlet of
Keno Dam and flows over 250 miles into the Pacific Ocean near Klamath, California (see
Figure 3.6-1).
The Upper Klamath Basin is upstream from Iron Gate Dam and includes Upper Klamath
Lake and its tributaries, Link River, the Keno Impoundment/Lake Ewauna, and the
Hydroelectric Reach (from J.C. Boyle Dam to Iron Gate Dam). Several facilities control
water supply in the Upper Klamath River, the Klamath Hydroelectric Project, and
Reclamation’s Klamath Project via several diversions from the Upper Klamath River
(Federal Energy Regulatory Commission [FERC] 2007).
The Lower Klamath Basin includes the areas of the Klamath Basin downstream of Iron
Gate Dam to the Pacific Ocean. Tributaries to the Lower Klamath Basin include the
Shasta, Scott, Salmon, and Trinity Rivers. The Klamath Estuary, on the northern
California coast, completes the system and eventually outlets to the Pacific Ocean (FERC
2007). Section 3.6.3.2 describes basin hydrology in more detail. The areas downstream
from J.C. Boyle Reservoir are discussed in more detail because they may experience
project-level impacts from the Klamath Hydroelectric Settlement Agreement (KHSA) (or
alternatives). Upstream areas are discussed in less detail because these areas are
upstream of the proposed dam removal activities associated with the KHSA. The
potential Klamath Basin Restoration Agreement (KBRA) impacts are analyzed at a
program level in this EIS/EIR.

Klamath Facilities Removal EIS/EIR Public Draft
3.6-2 – September 2011
Figure 3.6-1. Flood Hydrology Affected Area
Chapter 3 – Affected Environment/Environmental Consequences 3.6 Flood Hydrology
3.6-3 – September 2011
3.6.2 Regulatory Framework
Flood hydrology within the area of analysis is regulated by several federal, state, and
local laws and policies, which are listed below.
3.6.2.1 Federal Authorities and Regulations
National Flood Insurance Program
National Flood Insurance Program
The National Flood Insurance Program (NFIP) is regulated by the Flood Insurance and
Mitigation Administration under the Federal Emergency Management Agency (FEMA).
The program was established as part of the National Flood Insurance Act of 1968 and
includes three components: Flood Insurance, Floodplain Management and Flood Hazard
Mapping (FEMA 2002).
Through the voluntary adoption and enforcement of floodplain management ordinances,
U.S. communities participate in the NFIP. The NFIP makes available federally backed
flood insurance to homeowners, renters and business owners in participating
communities. The NFIP promotes regulations designed to reduce flood risks through
sound floodplain management. NFIP maps identify floodplains and assist communities
when developing floodplain management programs and identifying areas at risk of
flooding.
In 1973, the Flood Disaster Protection Act was passed by Congress. The result of this
was the requirement for community participation in the NFIP to receive federal financial
assistance for acquisition or construction of buildings and disaster assistance in
floodplains. It also “required federal agencies and federally insured or regulated lenders
to require flood insurance on all grants and loans for acquisition or construction of
buildings in designated Special Flood Hazard Areas” within participating communities
(FEMA 2002).
Later, in 1994, the two acts were amended with the National Flood Insurance Reform
Act, which included a requirement for FEMA to assess its flood hazard map inventory at
least once every 5 years. FEMA prepares floodplain maps based on the best available
science and technical information available. However, changes to the watershed or the
availability of new information may cause the need for a map revision. When a revision
is required, the applicable community works with FEMA to develop the map revision
through a Letter of Map Amendment (LOMA) or a Letter of Map Revision (LOMR)
(FEMA 2002).
In order for communities to participate in the NFIP they must adopt and enforce
floodplain management criteria. The local counties in which dam removal would cause
hydrologic effects, Klamath County in Oregon and Siskiyou County in California,
participate in the NFIP (FEMA 2002).
Klamath Facilities Removal EIS/EIR Public Draft
3.6-4 – September 2011
3.6.2.2 Affected County Flood Codes and Ordinances
Klamath County Code (Klamath County Land Development Code Article 59)
(Klamath County)
Siskiyou County Code (Article 54, Chapter 6) (Siskiyou County)
Siskiyou County Code (Policy 27, Chapter 10) (Siskiyou County)
Klamath County, Oregon
Article 59 of the Klamath County Land Development Code includes the Flood Hazard
Overlay in accordance with the NFIP. It includes provisions for development within and
around designated flood hazard areas and defines those areas according to the Flood
Insurance Rate Map prepared by FEMA. It also includes provisions for alterations of
watercourses and waterway development that preclude any diminishment of the flood
carrying capacity of a water course (Klamath County 2010a). The Klamath County
Comprehensive Plan (2010b) establishes goals and policies for areas subject to natural
disasters and hazards; this includes identifying flood prone areas on maps to protect life
and property from natural disasters and hazards. The Comprehensive Plan specifies that
“the County will continue to participate in the FEMA NFIP.”
Siskiyou County, California
Siskiyou County has policies related to flood hazards within its County General Plan
(1997). These policies refer to flood boundaries shown on FEMA flood hazard maps and
regulate development within and near flood hazard areas (Siskiyou County 1997).
Article 54 of the Siskiyou County Zoning Ordinance (Chapter 6) further defines the
regulations within District F (Floodplain Combining Districts) where areas experience
inundation by periodic overflow and backwater (Siskiyou County 1986). Chapter 10 of
Planning and Zoning Code addresses Flood Damage Prevention and provides for
requirements to notify the Federal Insurance Administration of alteration or relocation of
watercourses and also addresses other issues related to Flood Damage Prevention. Land
Use Policy 27 states the following:
“No residential or industrial development shall be allowed on water
bodies. Exceptions may be considered for water supply, hydroelectric
power generation facilities, public works projects necessary to prevent or
stabilize earth movement, erosion, and the enhancement of migratory fish
and other wildlife, light commercial, open space, non-profit and non-
organizational in nature recreational uses, and commercial/recreational
uses.” (Siskiyou County 1990)
3.6.3 Existing Conditions/Affected Environment
This section describes the hydrologic conditions of surface water and wetlands in the
Klamath Basin. Figure 3.6-1 shows the area of analysis. The setting section includes a
description of basin hydrology including precipitation, reservoirs, major rivers and
tributaries; lakes; springs and seeps providing measurable flow; historic stream flows;
and flood hydrology. Available data of existing average daily and monthly river flows

Chapter 3 – Affected Environment/Environmental Consequences 3.6 Flood Hydrology
3.6-5 – September 2011
and their relationship to Reclamation’s Klamath Project and PacifiCorp’s Klamath
Hydroelectric Project are also described throughout this section.
3.6.3.1 Historical Hydrologic Conditions
Pre-Dams and Pre-Klamath Project Hydrology
Several studies have been conducted to determine the natural flow conditions of the
Klamath Basin hydrology (Bureau of Reclamation [Reclamation] 2005); however, these
studies are limited by a lack of data. Prior to development of dams and implementation
of Reclamation’s Klamath Project, the Upper Klamath Basin contained lakes and large
areas of marshes and wetlands. The Upper Klamath Lake was not much larger than its
current size; however, Tule Lake and Lower Klamath Lake were much larger. Springs,
snowmelt, and groundwater dominated rivers carrying water from the Cascades and
other highlands in the Upper Basin contributed greatly to Upper Klamath Lake, the
Klamath River, and the wetlands and marshes in that area (Akins 1970). The elevation of
Upper Klamath Lake was originally controlled by a natural rock reef dam at the outlet of
the lake. Water then flowed 1.3 miles down the Link River to Keno Impoundment/Lake
Ewauna. Within this stretch of river, Keno Impoundment/Lake Ewauna developed
because of a natural rock reef dam near Keno, Oregon. This was and still is the
beginning of the Klamath River.
During high flow events out of Upper Klamath Lake, some water was captured and
would flow down the Lost River Slough and into Tule Lake, another natural sump and
wetland area. Water that flowed into the Klamath River reached another split near Keno
(Akins 1970).
During flood conditions, water would also back up from the Keno Reef (near Keno,
Oregon) and flow into the Klamath Straits and down to Lower Klamath Lake. The Lower
Klamath Lake and Tule Lake areas once contained large areas of wetlands and marshes.
The Lost River flowed from Clear Lake to Tule Lake. Now, a diversion provides water
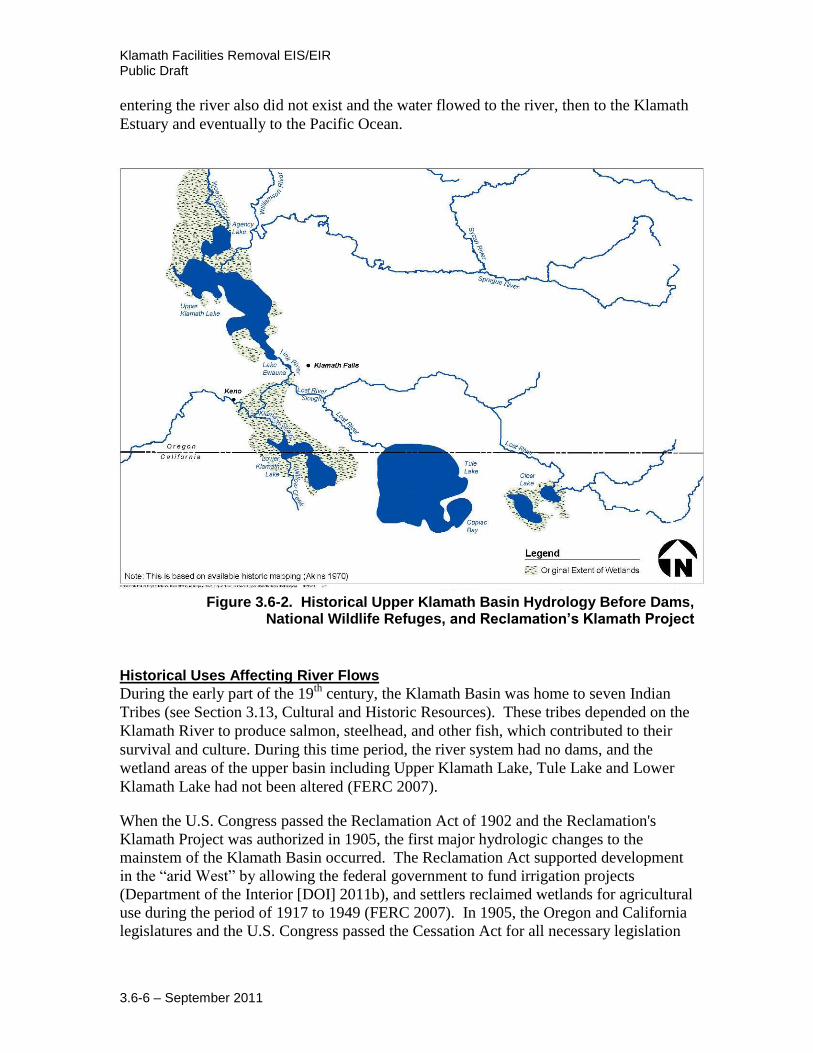
from the Lost River to the Klamath River (Akins 1970). Figure 3.6-2 shows the historic
wetlands and configuration of the Upper Basin.
The presence of both historic Tule and Lower Klamath Lake influenced flows in the
Klamath River. Lower Klamath Lake (approximately 30,000 acres of open water and
55,000 surface acres of marsh) was connected to the Klamath River through the Klamath
Straits. When the river began to rise in the spring during high water flow events, water
overflowed into this lake and marsh and, as the river fell in the fall some of the water
flowed back out of the lake (Weddell et al. Undated). Lower Klamath Lake provided
some short term storage by reducing the total volume of water leaving the upper
watershed as well as delaying the peak flow. Tule Lake received overflow during high
flow periods from the Klamath River near Klamath Falls, Oregon. Tule Lake was a
terminal lake system; the overflow through the Lost River Slough reduced peak flows in
the Klamath River in late winter and spring (Abney 1964).
Below the Keno Reef, the Klamath River flowed freely with no dam controls. The
J.C. Boyle, Copco and Iron Gate Reservoirs did not exist. Dams along major tributaries
Klamath Facilities Removal EIS/EIR Public Draft
3.6-6 – September 2011
entering the river also did not exist and the water flowed to the river, then to the Klamath
Estuary and eventually to the Pacific Ocean.
Figure 3.6-2. Historical Upper Klamath Basin Hydrology Before Dams, National Wildlife Refuges, and Reclamation’s Klamath Project
Historical Uses Affecting River Flows
During the early part of the 19th
century, the Klamath Basin was home to seven Indian
Tribes (see Section 3.13, Cultural and Historic Resources). These tribes depended on the
Klamath River to produce salmon, steelhead, and other fish, which contributed to their
survival and culture. During this time period, the river system had no dams, and the
wetland areas of the upper basin including Upper Klamath Lake, Tule Lake and Lower
Klamath Lake had not been altered (FERC 2007).
When the U.S. Congress passed the Reclamation Act of 1902 and the Reclamation's
Klamath Project was authorized in 1905, the first major hydrologic changes to the
mainstem of the Klamath Basin occurred. The Reclamation Act supported development
in the “arid West” by allowing the federal government to fund irrigation projects
(Department of the Interior [DOI] 2011b), and settlers reclaimed wetlands for agricultural
use during the period of 1917 to 1949 (FERC 2007). In 1905, the Oregon and California
legislatures and the U.S. Congress passed the Cessation Act for all necessary legislation
Chapter 3 – Affected Environment/Environmental Consequences 3.6 Flood Hydrology
3.6-7 – September 2011
to begin Reclamation’s Klamath Project (DOI 2011a). Afterwards, Reclamation began
building its Klamath Project, which led to the construction of the Link River Dam,
several hundreds of miles of irrigation ditches and large canals and pumping plants to
divert water from the Klamath River watershed for agricultural use (FERC 2007).
In 1908, President Roosevelt created the Lower Klamath Lake National Wildlife Refuge
(NWR). Later, in 1928, the Tule Lake and Upper Klamath Lake NWRs were also
created, and a portion of the water from the Upper Klamath Lake was diverted to these
NWRs (FERC 2007). Historic wetland areas were drained to accommodate agricultural
development; however, some of the historic wetland areas around Upper Klamath Lake
have more recently been returned to Upper Klamath Lake.
Development of hydroelectric plants in the Klamath Basin began as early as 1891 in the
Shasta River canyon to provide electricity for the City of Yreka. In 1895, another facility
was constructed on the east side of the Link River supplying power to Klamath Falls,
Oregon. Additional power suppliers developed facilities in the area on Fall Creek and the
West Side plant on the Link River (FERC 2007). Chapter 1 provides additional historical
detail regarding the Klamath Hydroelectric Project.
Concern over the effects of these dams on salmon and suckers grew over the years. The
shortnose and Lost River suckers were listed as endangered under the Endangered
Species Act in 1988 (FERC 2007). The Southern Oregon/Northern California Coast coho
salmon were reviewed in 1996 and listed as threatened in 1997. Oregon Coast coho
salmon were listed in 1998. The listings were reaffirmed and uplisted to endangered in
2005 (National Oceanic and Atmospheric Administration [NOAA] Fisheries Service
2005). Section 3.3, Aquatic Resources, provides background information and an analysis
of effects on these endangered species.
3.6.3.2 Basin Hydrology
This section describes reservoirs, rivers, and creeks in the affected environment and lists
historic average stream flows. Various springs and seeps occur in the vicinity of Iron
Gate, Copco and J.C. Boyle Dams and contribute flows to surface water. Springs around
Upper Klamath Lake provide inflow to many of the streams feeding the lake and also
provide stability for area wetlands (Akins 1970). Section 3.7.3.1, describes the locations
of springs and seeps in more detail. Some measurable inflows from springs and seeps to
various surface waters are described below. Figure 3.6-1 shows the major reservoirs and
rivers in the Klamath Basin.
Precipitation
The Upper Klamath Basin receives rain at all elevations and snow at elevations above 4,000 feet during the late fall, winter, and spring. Snow is the primary form of precipitation in the upper watershed. Depending on the elevation and location, the amount of precipitation ranges from approximately 10 to more than 50 inches per year. From 1907 through 1997 the average annual precipitation at Klamath Falls was 13.4 inches and from 1959 to 2009 it was 20 inches at Copco 1 Dam (DOI 2011b). Peak stream flows generally occur during snowmelt runoff around March through May. After the runoff has stopped, flows drop to low levels in the late summer or early fall. Fall
Klamath Facilities Removal EIS/EIR Public Draft
3.6-8 – September 2011
storms may increase flows compared with the lower summer flows. Generally, conditions in the Upper Klamath Lakes area are drier than the area where the Klamath River reaches the ocean. The reaches downstream of the Klamath River’s confluence with the Shasta River receive higher levels of precipitation than other reaches in the Klamath Basin (FERC 2007). Average annual precipitation is 49 inches at Happy Camp from 1914 to 2010 and 80 inches at Klamath between 1948 and 2006 (Desert Research Institute Website 2011).
Upper Klamath Basin
Upper Klamath Lake and Link River Dam
Link River Dam was constructed by PacifiCorp for Reclamation in 1921 at the natural
outlet of Upper Klamath Lake. This dam is operated by PacifiCorp under an agreement
with Reclamation. Upper Klamath Lake has an active storage capacity ranging from
502,347 acre feet at the existing reservoir to 597,817 acre feet including areas restored by
levee and dike breaches at Agency Lake, Barnes Ranch, Tulana Farms, and Goose Bay
(Greimann 2011). Currently, Reclamation manages Upper Klamath Lake in accordance
with United States Fish and Wildlife Service (USFWS) and NOAA Fisheries Service
biological opinions based on current and expected hydrologic conditions (DOI 2011c).
Outlets from Upper Klamath Lake include the Reclamation A Canal, PacifiCorp’s East
and West Side development canals and the Link River Dam. Water that passes through
the East and West Side development canals re-enters the Link River downstream of the
dam where it eventually enters Keno Impoundment/Lake Ewauna (FERC 2007).
Reclamation’s Klamath Project
Operation of Reclamation’s Klamath Project affects Klamath River flows and Upper
Klamath Lake water surface elevations. Section 3.8, Water Supply/Water Rights,
describes the scope of Reclamation’s Klamath Project in more detail, including the water
supply diversions and amount of water diverted. Reclamation is required to implement a
management plan to address biological opinions and fish concerns. To help accomplish
this, Reclamation issues an annual operations plan describing flow requirements at
various exceedance levels stated in biological opinions (Reclamation 2010). The
biological opinions include requirements for targeted flows for Iron Gate Dam releases
and water surface elevations in Upper Klamath Lake. Annual operations plans for
Reclamation’s Klamath Project must plan for flows and water surface elevations that are
adequate for the continued existence of salmon and suckers. This is accomplished, in
part, by using the fall and winter flow variability program “to enhance flow variability to
mimic the natural hydrologic response that would naturally occur” (NOAA Fisheries
Service 2010) and increased spring discharge in select average and wetter exceedances.
Table 3.6-1 describes flow release requirements in cubic feet per second (cfs) from 2010
to 2018 measured below Iron Gate Dam under the biological opinion (NOAA Fisheries
Service 2010). Each year, under the flow variability program, the hydrology exceedance
is determined based on watershed modeling that considers “hydrologic and climatological
information, including data from tributaries within the PacifiCorp Hydroelectric Project
Reach (Keno Dam to Iron Gate Dam).” A team comprised of representatives from NOAA
Fisheries Service (NMFS), NOAA Weather Service, USFWS, United States Geological
Chapter 3 – Affected Environment/Environmental Consequences 3.6 Flood Hydrology
3.6-9 – September 2011
Survey (USGS), California Department of Fish and Game, the Karuk, Hoopa Valley and
Yurok Tribes, PacifiCorp and Reclamation make this determination. Exceedance level
calculations are affected by many factors including water use upstream of Upper Klamath
Lake and Reclamation's Klamath Project demand when sufficient water supply is
available (NOAA Fisheries Service 2010).
The “Exceedance Level” column represents hydrologic conditions ranging from very dry
to very wet conditions. A 90 percent exceedance level represents a flow that is exceeded
90 percent of the time (dry conditions). A 10 percent exceedance level represents a flow
that is exceeded only 10 percent of the time (wet conditions). Exceedance level
calculations are affected by many factors including water use upstream of Upper Klamath
Lake and Reclamation's Klamath Project demand when sufficient water supply is
available (NOAA Fisheries Service 2010).
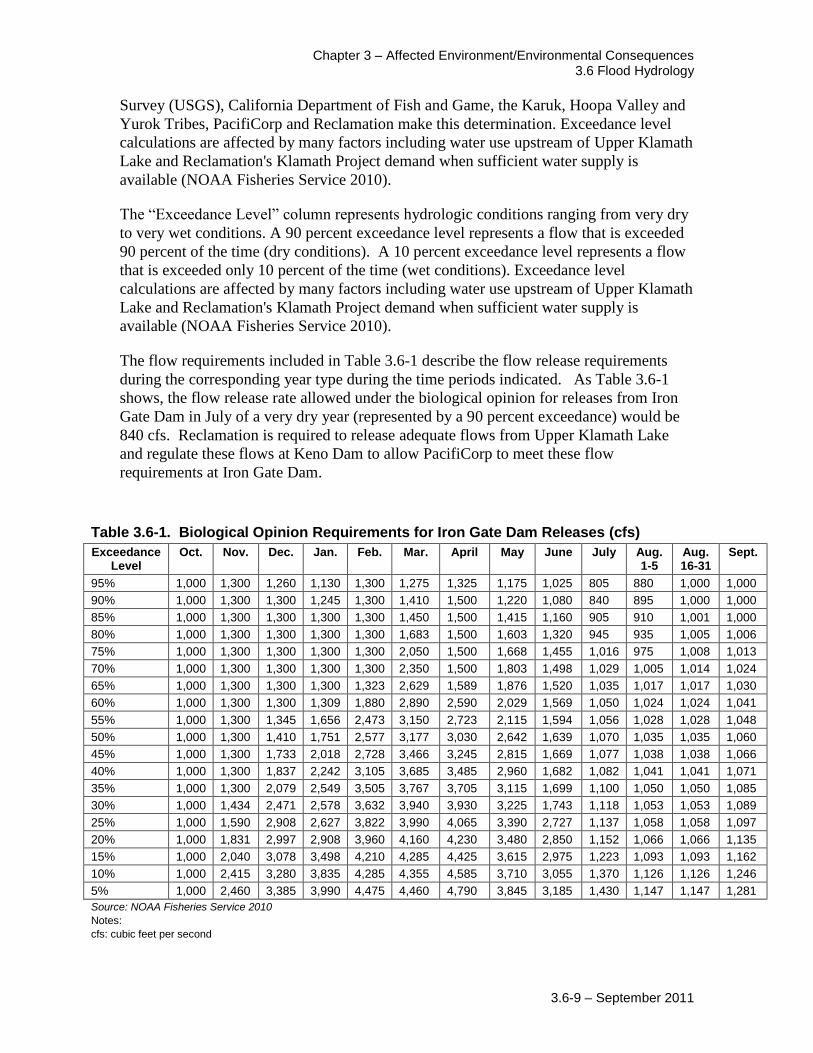
The flow requirements included in Table 3.6-1 describe the flow release requirements
during the corresponding year type during the time periods indicated. As Table 3.6-1
shows, the flow release rate allowed under the biological opinion for releases from Iron
Gate Dam in July of a very dry year (represented by a 90 percent exceedance) would be
840 cfs. Reclamation is required to release adequate flows from Upper Klamath Lake
and regulate these flows at Keno Dam to allow PacifiCorp to meet these flow
requirements at Iron Gate Dam.
Table 3.6-1. Biological Opinion Requirements for Iron Gate Dam Releases (cfs)
Exceedance Level
Oct. Nov. Dec. Jan. Feb. Mar. April May June July Aug. 1-5
Aug. 16-31
Sept.
95% 1,000 1,300 1,260 1,130 1,300 1,275 1,325 1,175 1,025 805 880 1,000 1,000
90% 1,000 1,300 1,300 1,245 1,300 1,410 1,500 1,220 1,080 840 895 1,000 1,000
85% 1,000 1,300 1,300 1,300 1,300 1,450 1,500 1,415 1,160 905 910 1,001 1,000
80% 1,000 1,300 1,300 1,300 1,300 1,683 1,500 1,603 1,320 945 935 1,005 1,006
75% 1,000 1,300 1,300 1,300 1,300 2,050 1,500 1,668 1,455 1,016 975 1,008 1,013
70% 1,000 1,300 1,300 1,300 1,300 2,350 1,500 1,803 1,498 1,029 1,005 1,014 1,024
65% 1,000 1,300 1,300 1,300 1,323 2,629 1,589 1,876 1,520 1,035 1,017 1,017 1,030
60% 1,000 1,300 1,300 1,309 1,880 2,890 2,590 2,029 1,569 1,050 1,024 1,024 1,041
55% 1,000 1,300 1,345 1,656 2,473 3,150 2,723 2,115 1,594 1,056 1,028 1,028 1,048
50% 1,000 1,300 1,410 1,751 2,577 3,177 3,030 2,642 1,639 1,070 1,035 1,035 1,060
45% 1,000 1,300 1,733 2,018 2,728 3,466 3,245 2,815 1,669 1,077 1,038 1,038 1,066
40% 1,000 1,300 1,837 2,242 3,105 3,685 3,485 2,960 1,682 1,082 1,041 1,041 1,071
35% 1,000 1,300 2,079 2,549 3,505 3,767 3,705 3,115 1,699 1,100 1,050 1,050 1,085
30% 1,000 1,434 2,471 2,578 3,632 3,940 3,930 3,225 1,743 1,118 1,053 1,053 1,089
25% 1,000 1,590 2,908 2,627 3,822 3,990 4,065 3,390 2,727 1,137 1,058 1,058 1,097
20% 1,000 1,831 2,997 2,908 3,960 4,160 4,230 3,480 2,850 1,152 1,066 1,066 1,135
15% 1,000 2,040 3,078 3,498 4,210 4,285 4,425 3,615 2,975 1,223 1,093 1,093 1,162
10% 1,000 2,415 3,280 3,835 4,285 4,355 4,585 3,710 3,055 1,370 1,126 1,126 1,246
5% 1,000 2,460 3,385 3,990 4,475 4,460 4,790 3,845 3,185 1,430 1,147 1,147 1,281
Source: NOAA Fisheries Service 2010
Notes:
cfs: cubic feet per second
Klamath Facilities Removal EIS/EIR Public Draft
3.6-10 – September 2011
Keno Impoundment/Lake Ewauna and Keno Reach
Keno Impoundment/Lake Ewauna existed before the construction of Keno Dam due to a
natural blockage (Akins 1970). The Keno Dam is owned and operated by PacifiCorp.
Before the dam, in 1908, water from the Keno Impoundment/Lake Ewauna was reported
to overflow the natural blockage and enter the Lost River Slough when the water surface
elevation was at approximately 4,085 feet (FERC 2007). The currently normal water
surface elevation is 4,085 feet (USGS 2009a) at the Keno Impoundment/Lake Ewauna.
The Keno Impoundment/Lake Ewauna is a long and narrow lake that begins where the
Link River ends, 1.3 miles downstream of the Link River Dam, and ends at Keno Dam.
The majority of the water entering Keno Impoundment/Lake Ewauna comes from Upper
Klamath Lake through the Link River. Several facilities upstream of Keno Dam transport
water to or from the river including: the Lost River Diversion Channel, North Canal,
Klamath Straits Drain, and the Ady Canal. Additional facilities that divert water for
private agricultural lands are also on the reach between Keno Dam and J.C. Boyle
Reservoir (FERC 2007).
J.C. Boyle Reservoir
J.C. Boyle Reservoir is approximately 5 miles downstream of Keno Dam. PacifiCorp
operates J.C. Boyle Reservoir to produce hydroelectric power. Current operations of the
reservoir follow Interim Measures from the Interim Conservation Plan effective as of
February 2010. Water is spilled from the dam during high flow months of January
through May and when inflow “exceeds the capacity of the J.C. Boyle powerhouse and
low flow requirements” (FERC 2007).
J.C. Boyle Bypass Reach
The J.C. Boyle Bypass Reach is a 4.3-mile section of the Klamath River between the
J.C. Boyle Dam and Powerhouse; it flows at a steep grade. At 0.5 miles downstream of
the dam, flows are increased by groundwater entering the bypass reach. The average
accretion due to groundwater inflow/spring inflow is 220 to 250 cfs and varies seasonally
and from year to year (FERC 2007).
J.C. Boyle Peaking Reach
The J.C. Boyle Peaking Reach is downstream of the J.C. Boyle powerplant, so flows vary
based on releases from the plant. Typically, the reach has high flows during the day as a
result of powerhouse flows used to provide peak energy demand. The powerhouse flows
may be reduced to zero at night when J.C. Boyle Reservoir is refilled. The powerhouse
ramps up flow for either a one-unit operation (up to 1,500 cfs) or a two-unit operation (up
to 3,000 cfs). Normal daily average flows in the peaking reach during periods with no
power generation range from 320 to 350 cfs (80 cfs from the fish ladder, 20 cfs from the
juvenile fish bypass system). A minimum monthly flow rate of 302 cfs has been
recorded in the month of August based on data from 1959 to 2010 (USGS 2011).
Additional water enters the reach from springs.
Commercial whitewater rafting and boating occurs during the same months as peak
power demands, May through October. The water supply for this unique rafting

Chapter 3 – Affected Environment/Environmental Consequences 3.6 Flood Hydrology
3.6-11 – September 2011
opportunity during the summer tourist season is from the peaking operations of
J.C. Boyle powerhouse. Under PacifiCorp’s current annual FERC license, upramping
and downramping occur at a rate of 9 inches per hour for both (FERC 2007). PacifiCorp
diverts some water from this reach for irrigation purposes (FERC 2007).
Copco 1 Reservoir
PacifiCorp operates Copco 1 Reservoir for hydroelectric power generation through
Copco 1 Dam. With the most active storage volume of all the project reservoirs of
6,235 acre feet for power production, Copco 1 Reservoir has a total storage capacity of
46,867 acre feet (DOI 2011c). This reservoir is deeper than both Keno
Impoundment/Lake Ewauna and J.C. Boyle Reservoir (FERC 2007).
Copco 2 Reservoir and Bypass Reach
Copco 2 Reservoir, a small impoundment, receives discharge from Copco 1 Reservoir
through Copco 1 Dam and provides flow to Copco 2 Powerhouse through a 1.5-mile
bypass reach. The maximum hydraulic capacity is 3,200 cfs in the powerhouse flowline
controlling flows from Copco 1 Reservoir to Copco 2 Reservoir. Copco 2 Dam controls
the flow from the reservoir, and only spills when inflow from the reservoir exceeds
storage capacity. Spillage from the dam is rare and typically only happens from
November through April. PacifiCorp releases between 5 to 10 cfs at the bypass reach
under normal conditions. Copco 2 Powerhouse discharges water to Iron Gate Reservoir
(FERC 2007).
Iron Gate Reservoir
Iron Gate Reservoir is downstream from the Copco 2 Dam and also receives water from
Jenny and Fall Creeks, which are tributaries to the Klamath River downstream of Copco
2 Dam and Iron Gate Reservoir. PacifiCorp operates Iron Gate Dam and Reservoir as a
re-regulating facility for peaking operations at the other three hydroelectric power dams.
Iron Gate Reservoir is the deepest of the four reservoirs in the Hydroelectric Reach. The
total storage at this reservoir is approximately 58,794 acre feet of which 3,790 acre feet is
available for power production (DOI 2011c). Iron Gate Powerhouse, at the base of the
dam, has a maximum hydraulic capacity of 1,735 cfs. Cool water is diverted from the
reservoir to the Iron Gate Fish Hatchery, downstream of the dam (FERC 2007). USGS
gage station 11516530 on the Klamath River, downstream of Iron Gate Dam, provides
flow monitoring data regarding compliance with NOAA Fisheries Service biological
opinions. Bogus Creek and effluent from the hatchery enter the river upstream of the
gage and downstream of the dam (USGS 2009b). Table 3.6-1 lists the flow requirements
measured downstream of Iron Gate Dam.
Lower River Basin
The Lower Klamath Basin includes the river area downstream from Iron Gate Dam,
which includes 190 miles of river flowing to the Klamath Estuary and then to the Pacific
Ocean. The major tributaries entering the river include the Shasta, Scott, Salmon and
Trinity Rivers. The Klamath Basin is heavily influenced by these four rivers because
44 percent of the average annual runoff is provided by them (FERC 2007). Below are
brief descriptions of these four rivers and other reaches along the Lower Klamath River.

Klamath Facilities Removal EIS/EIR Public Draft
3.6-12 – September 2011
Shasta River
The Klamath River receives water from the Shasta River approximately 13.5 miles
downstream of Iron Gate Dam. The watershed includes high mountain peaks, forested
terrain and agricultural land. Peak flows, near the Shasta River’s confluence with the
Klamath River, are in the winter with minimum flows during July and August. Dwinnel
Dam, approximately 25 miles upstream of its confluence with the Klamath River,
resulted in the creation of Lake Shastina. Additional diversion dams and smaller dams are
located between Dwinnel Dam and the Klamath River (FERC 2007).
Scott River
The Klamath River receives water from the Scott River approximately 33.6 miles
downstream of the Klamath River’s confluence with the Shasta River. The watershed
includes the Salmon Mountains, which are heavily forested creating a rain shadow for the
rest of the watershed. The valley is comprised of land for grazing and agriculture.
Average monthly flows entering the Klamath River from the Scott River are 4 to 5 times
higher in the winter and spring months than from the Shasta River; however, minimum
flows are similar during August and September (FERC 2007).
Klamath River at Seiad Valley
A USGS flow gage is on the Klamath River at Seiad Valley, downstream of its
confluence with the Scott River. During the low flow months of August through
November, approximately 75 percent of the water flowing past this gage is attributed to
Iron Gate Dam releases. During the high flow months of April through June
approximately 50 percent of the water flowing past this gage is attributable to Iron Gate
Dam releases (FERC 2007).
Salmon River
Approximately 77 miles from the Klamath River’s confluence with the Scott River, the
Salmon River enters the Klamath River. The Salmon River flows through the Klamath
National Forest and many designated wilderness areas. The region surrounding the
Salmon River is forested with some agricultural activity. High monthly average flows
(3,375 cfs) occur in January, which is the winter peak for flooding as rain and rain on
snow events occur. In April and May, the Salmon River has a high monthly average flow
(2,660 and 2,630 cfs, respectively) from snowmelt at higher elevations. The Salmon
River has its lowest monthly average flow at about 200 cfs in September, which is later
than for other tributaries upstream including the Shasta River where lowest monthly
average flow occurs in July (FERC 2007).
Klamath River at Orleans
USGS gage no. 11523000 is at Orleans, downstream of the Klamath’s confluence with
the Salmon River and other smaller tributaries within the Lower Klamath watershed.
This area receives a high amount of precipitation compared to other reaches upstream of
the Shasta River; therefore, higher flows than in upstream reaches occur here in the
winter and spring months. Iron Gate Dam releases account for approximately 20 percent
of the flow during these high flow periods and over 50 percent of the flow during the late
summer and fall (FERC 2007).
Chapter 3 – Affected Environment/Environmental Consequences 3.6 Flood Hydrology
3.6-13 – September 2011
Trinity River
The Trinity River is the largest tributary to the Klamath River and is downstream of the
Klamath River’s confluence with the Salmon River and Orleans. It is heavily forested
and receives a heavy amount of precipitation. Peak average monthly flows into the
Klamath River occur in February and March at approximately 11,000 cfs and flows
decrease to a low of 500 cfs in September (FERC 2007).
Klamath River at Klamath
A USGS gage no. 11530500 is at the mouth of the Klamath River where it meets the
estuary within the Lower Klamath watershed. During low flow periods, the releases from
Iron Gate Dam account for approximately 40 percent of flow during September to
October. However, the area surrounding the Klamath River reach downstream of its
confluence with the Trinity River receives a heavy amount of precipitation, and during
the winter months approximately 85 percent of the flow comes from other sources than
Iron Gate Dam releases (FERC 2007).
Klamath River Estuary
The Klamath River estuary is within the Redwood National Park and spans
approximately 4 to 5 miles upstream of the mouth. The tidal influence normally extends
approximately 4 miles upstream from the mouth during high tides greater than 6 feet
upstream of the U.S. Highway 101 bridge. Past studies have observed the formation of a
sill at the river mouth in late summer or early fall causing a standing water backup up to
6 miles upstream. During high tides saltwater was observed in the summer and early fall
from the mouth upstream ranging approximately 2.5 to 4 miles depending on the time
period samples were taken. The saltwater recedes during low tides (Wallace 1998).
3.6.3.3 Historic Stream Flows
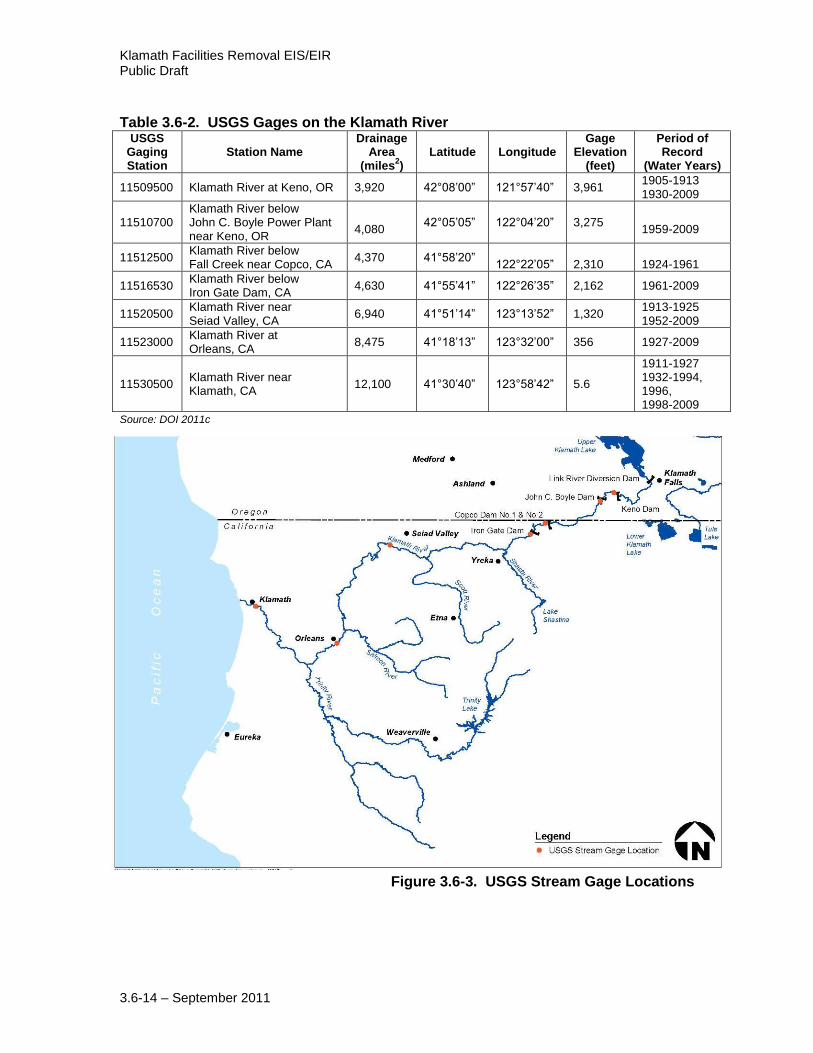
The USGS operates several stream gages on the Klamath River (Table 3.6-2 and Figure
3.6-3). As noted above, summer and early fall periods (July through October) generally
have much lower flows than the months of the spring runoff. Tributaries downstream of
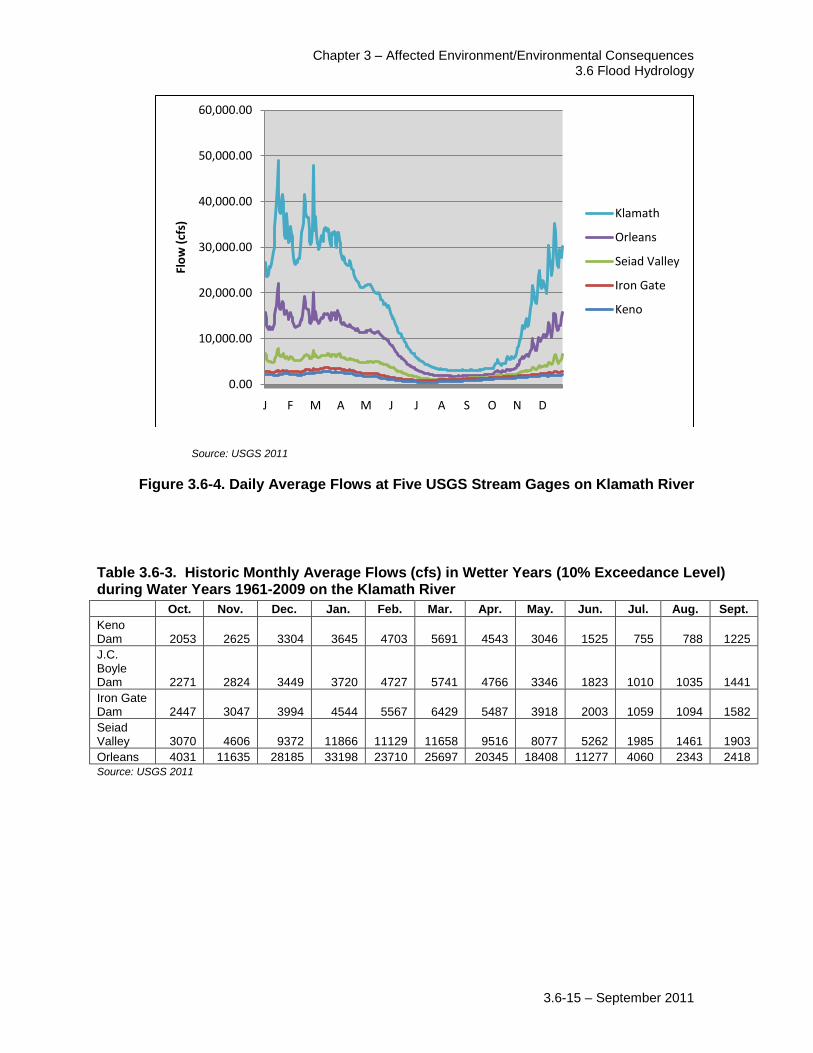
Iron Gate Dam contribute substantial amounts of flow. Figure 3.6-4 shows historical
daily average stream flows at several locations on the river using USGS monitoring data
from 1961-2009 (USGS 2011). Flows are substantially higher during wet years;
Table 3.6-3 shows historic average monthly flows during wetter years (represented by
flows exceeded ten percent of the time) using the same USGS data (USGS 2011).
Klamath Facilities Removal EIS/EIR Public Draft
3.6-14 – September 2011
Table 3.6-2. USGS Gages on the Klamath River
USGS Gaging Station
Station Name Drainage
Area (miles
2)
Latitude Longitude Gage
Elevation (feet)
Period of Record
(Water Years)
11509500 Klamath River at Keno, OR 3,920 42°08’00” 121°57’40” 3,961 1905-1913 1930-2009
11510700 Klamath River below John C. Boyle Power Plant near Keno, OR
4,080
42°05’05” 122°04’20” 3,275 1959-2009
11512500 Klamath River below Fall Creek near Copco, CA
4,370 41°58’20” 122°22’05”
2,310
1924-1961
11516530 Klamath River below Iron Gate Dam, CA
4,630 41°55’41” 122°26’35” 2,162 1961-2009
11520500 Klamath River near Seiad Valley, CA
6,940 41°51’14” 123°13’52” 1,320 1913-1925 1952-2009
11523000 Klamath River at Orleans, CA
8,475 41°18’13” 123°32’00” 356 1927-2009
11530500 Klamath River near Klamath, CA
12,100 41°30’40” 123°58’42” 5.6
1911-1927 1932-1994, 1996, 1998-2009
Source: DOI 2011c
Figure 3.6-3. USGS Stream Gage Locations
Chapter 3 – Affected Environment/Environmental Consequences 3.6 Flood Hydrology
3.6-15 – September 2011
Source: USGS 2011
Figure 3.6-4. Daily Average Flows at Five USGS Stream Gages on Klamath River
Table 3.6-3. Historic Monthly Average Flows (cfs) in Wetter Years (10% Exceedance Level) during Water Years 1961-2009 on the Klamath River
Oct. Nov. Dec. Jan. Feb. Mar. Apr. May. Jun. Jul. Aug. Sept.
Keno Dam 2053 2625 3304 3645 4703 5691 4543 3046 1525 755 788 1225
J.C. Boyle Dam 2271 2824 3449 3720 4727 5741 4766 3346 1823 1010 1035 1441
Iron Gate Dam 2447 3047 3994 4544 5567 6429 5487 3918 2003 1059 1094 1582
Seiad Valley 3070 4606 9372 11866 11129 11658 9516 8077 5262 1985 1461 1903
Orleans 4031 11635 28185 33198 23710 25697 20345 18408 11277 4060 2343 2418
Source: USGS 2011
0.00
10,000.00
20,000.00
30,000.00
40,000.00
50,000.00
60,000.00
J F M A M J J A S O N D
Flo
w (
cfs)
Klamath
Orleans
Seiad Valley
Iron Gate
Keno

Klamath Facilities Removal EIS/EIR Public Draft
3.6-16 – September 2011
Table 3.6-4 shows the daily average flows at the four dams. The column indicating “% of
time equaled or exceeded” indicates the hydrologic conditions, with 99 percent being an
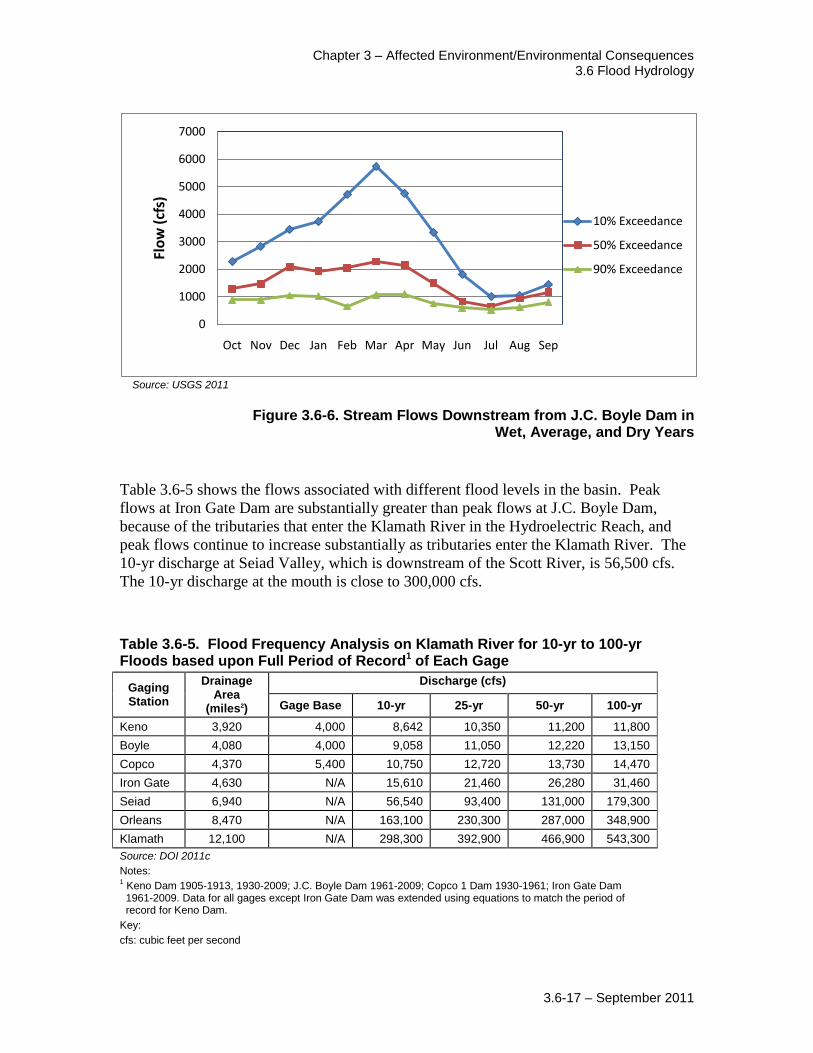
extremely dry year and 1 percent being an extremely wet year. Figures 3.6-5 and 3.6-6
show average daily flows in different year types downstream from Iron Gate and
J.C. Boyle Dams. The gage downstream of J.C. Boyle Dam is also downstream of the
return of flow from the J.C. Boyle power plant.
Table 3.6-4. Annual and Seasonal Daily Flows
% of time equaled or exceeded
Discharge (cfs)
Annual Seasonal (July 1 – Nov 31)
Keno Boyle Copco Iron Gate
Keno Boyle Copco Iron Gate
99 152 331 290 528 147 325 294 441
95 297 522 529 716 292 473 524 701
90 431 635 643 741 417 592 604 725
80 645 802 882 955 621 725 823 846
70 821 962 1,088 1,040 737 856 973 1,000
60 990 1,130 1,269 1,320 901 960 1,150 1,030
50 1,180 1,260 1,483 1,360 1,020 1,060 1,273 1,130
40 1,440 1,480 1,730 1,700 1,180 1,180 1,470 1,320
30 1,800 1,810 2,104 1,977 1,390 1,280 1,670 1,350
20 2,390 2,660 2,640 2,980 1,580 1,490 1,905 1,510
10 3,120 3,200 3,350 3,870 1,960 1,890 2,300 1,840
5 4,320 4,530 4,486 5,500 2,450 2,710 2,720 2,920
1 6,875 7,660 7,295 9,167 3,300 3,970 3,536 4,350
Source: DOI 2011c
Source: USGS 2011
Figure 3.6-5. Stream Flows Downstream from Iron Gate Dam in Wet, Average, and Dry Years
0
1000
2000
3000
4000
5000
6000
7000
Oct Nov Dec Jan Feb Mar Apr May Jun Jul Aug Sep
Flo
w (
cfs) 10% Exceedance
50% Exceedance
90% Exceedance
Chapter 3 – Affected Environment/Environmental Consequences 3.6 Flood Hydrology
3.6-17 – September 2011
Source: USGS 2011
Figure 3.6-6. Stream Flows Downstream from J.C. Boyle Dam in Wet, Average, and Dry Years
Table 3.6-5 shows the flows associated with different flood levels in the basin. Peak
flows at Iron Gate Dam are substantially greater than peak flows at J.C. Boyle Dam,
because of the tributaries that enter the Klamath River in the Hydroelectric Reach, and
peak flows continue to increase substantially as tributaries enter the Klamath River. The
10-yr discharge at Seiad Valley, which is downstream of the Scott River, is 56,500 cfs.
The 10-yr discharge at the mouth is close to 300,000 cfs.
Table 3.6-5. Flood Frequency Analysis on Klamath River for 10-yr to 100-yr Floods based upon Full Period of Record1 of Each Gage
Gaging Station
Drainage Area
(miles2)
Discharge (cfs)
Gage Base 10-yr 25-yr 50-yr 100-yr
Keno 3,920 4,000 8,642 10,350 11,200 11,800
Boyle 4,080 4,000 9,058 11,050 12,220 13,150
Copco 4,370 5,400 10,750 12,720 13,730 14,470
Iron Gate 4,630 N/A 15,610 21,460 26,280 31,460
Seiad 6,940 N/A 56,540 93,400 131,000 179,300
Orleans 8,470 N/A 163,100 230,300 287,000 348,900
Klamath 12,100 N/A 298,300 392,900 466,900 543,300
Source: DOI 2011c
Notes: 1 Keno Dam 1905-1913, 1930-2009; J.C. Boyle Dam 1961-2009; Copco 1 Dam 1930-1961; Iron Gate Dam 1961-2009. Data for all gages except Iron Gate Dam was extended using equations to match the period of record for Keno Dam.
Key:
cfs: cubic feet per second
0
1000
2000
3000
4000
5000
6000
7000
Oct Nov Dec Jan Feb Mar Apr May Jun Jul Aug Sep
Flo
w (
cfs)
10% Exceedance
50% Exceedance
90% Exceedance
Klamath Facilities Removal EIS/EIR Public Draft
3.6-18 – September 2011
3.6.3.4 Flood Hydrology and River Flood Plain
The active storage capacity at Upper Klamath Lake is approximately 597,817 acre-feet
and includes areas restored by levee and dike breaches at Agency Lake, Barnes Ranch,
Tulana Farms, and Goose Bay (Greimann 2011). Active storage at Keno, J.C. Boyle,
Copco 1, Copco 2 and Iron Gate reservoirs totals approximately 12,244 acre-feet (FERC
2007). Approximately 98 percent of the active surface water storage along the Klamath
River is provided by Upper Klamath Lake behind Link River Dam. Keno, J.C. Boyle,
Copco 1, Copco 2 and Iron Gate Dams provide approximately 2 percent of the active
storage on the river.
During extremely wet years, increased flows occur in the Klamath River and its
tributaries, and surface water elevations rise in Upper Klamath Lake. Agency Lake,
Barnes Ranch, and the Nature Conservancy-owned lands provide over 108,000 acre feet
of storage area due to breaching of dikes and levees. During these periods, there is little
surplus storage at the four dams to help control flooding. Decreased irrigation demands
may allow for more water in Upper Klamath Lake to be stored for future use depending
on the decisions to balance spring flushing flows with fall migration flows. The
biological opinions included provisions for average and wet years that increase minimum
flow requirements at Iron Gate Dam and surface water elevations at Upper Klamath Lake
and Agency Lake/Barnes Ranch to reflect the natural flow conditions during wetter years
and provide storage for surplus water. The Klamath River overtops its banks during
flood years and inundates the floodplain. Additional descriptions of area geomorphology
are in Section 3.11, Geology, Soils and Geologic Hazards.
FEMA has prepared flood risk mapping for portions of the Klamath River in Siskiyou,
Del Norte and Humboldt Counties and provides access to these maps via their web
mapping service or can be downloaded from their website. The revised Flood Insurance
Rate Map (FIRM) and Flood Insurance Study for Siskiyou County was released on
January 19, 2011, however, this update did not include new flood analysis along the
Klamath River. FEMA flood analysis for the river is based on studies and cross sections
developed prior to 1985 and later revised in 1987.
3.6.3.5 Risks of Dam Failure
Dams are manmade structures and do exhibit some risks of failure that could result in
flooding downstream. According to the Association of State Dam Safety Officials
(ASDSO), dams fail due to one of five reasons (ASDSO 2011).
Overtopping caused by water spilling over the top of dam;
Structure failure of materials used in dam construction;
Cracking caused by movements like the natural settling of dam;
Inadequate maintenance and upkeep; or
Piping – when seepage through a dam is not properly filtered and soil particles
continue to progress and form sink holes in the dam.

Chapter 3 – Affected Environment/Environmental Consequences 3.6 Flood Hydrology
3.6-19 – September 2011
In California, weighted point systems are used during inspections to classify both the
hazard or damage potential and condition of the dam. Once classified, the frequency of
inspection and return period for hydrology studies is selected. The classifications used for
damage potential are extreme, high, moderate and low and refer to the possibility of loss
of life and property downstream of the dam if it were to fail. The classifications of the
condition of the dam are poor, fair, good, and excellent and are determined based on the
age, general condition, geologic and seismic setting. Dams may be reclassified after
improvements or other changes have occurred (ASDSO 2000).
Siskiyou County is in the process of developing a Multi-Jurisdictional Hazard Mitigation
Plan which will address, among other issues, flood and dam failure hazards. Maps are
currently available which describe dam inundation areas at J.C. Boyle and Iron Gate
dams as well as a domino effect, depicting the inundation area if multiple dams were to
fail at the same time (Siskiyou County Website 2011). The FERC staff have conducted
safety inspections of the dam structures as part of the licensing program over the past
50 years. Every five years J.C. Boyle, Copco 1 and Iron Gate dams are inspected and
evaluated by an independent consultant and reports documenting the evaluation are
submitted to the FERC for review (FERC 2007).
3.6.4 Environmental Consequences
The flood hydrology section of the EIS/EIR will discuss the changes to river flows that
would occur during implementation of the alternatives, including the Proposed Action.
3.6.4.1 Environmental Effects Determination Methods
The No Action/No Project Alternative would include operations similar to current
operations. PacifiCorp would operate the Klamath Hydroelectric Project as it did before
the Secretarial Determination process began, under the operational requirements of the
March 2010 biological opinion. The action alternatives would vary operations by
removing facilities or installing fish ladders to provide fish passage.
The assessment of the environmental impacts on flood hydrology that would result from
implementation of the alternatives determines whether changes in stream flows could
cause flooding or inundation areas in the watershed. The impact assessment is based on
the hydrologic modeling completed by the Lead Agencies. The modeling covered the No
Action/No Project Alternative and the Proposed Action. The Lead Agencies used a
one-dimensional HEC-RAS model that assessed hydrologic conditions for these two
alternatives. The Lead Agencies also analyzed modeling output to determine how
frequently the current FEMA floodplain is inundated and how the floodplain could
change under the Proposed Action. This information was included within the Draft
Hydrology, Hydraulics and Sediment Transport Studies for the Secretary’s
Determination on Klamath River Dam Removal and Basin Restoration (DOI 2011c).
The model results under the No Action/No Project Alternative and the Proposed Action
provide adequate information to estimate the relative effects of the other alternatives not
modeled.
Klamath Facilities Removal EIS/EIR Public Draft
3.6-20 – September 2011
The model results included predictions of the river flows that would occur if the Four
Facilities were removed. The river flows would be the same for long-term future
conditions for the Partial Facilities Removal of Four Dams Alternative as those modeled
for the Proposed Action. The Fish Passage at Four Dams Alternative, however, would
leave the dams in, but would include fish passage at each facility. Flows downstream of
Iron Gate Dam would be the same under the Fish Passage at Four Dams Alternative as
the No Action/No Project Alternative; however, flows within the hydroelectric reach
would change to account for flows through fish ladders and flows in the bypass reaches.
The predicted flows under the Fish Passage at J.C. Boyle and Copco 2, Remove Copco 1
and Iron Gate Alternative would be similar to the No Action/No Project Alternative at the
two remaining dams and less than modeled flows under the Proposed Action at the
removed dams. The flows within the hydroelectric reach for the Fish Passage at Four
Dams and the Fish Passage at J.C. Boyle and Copco 2, Remove Copco 1 and Iron Gate
Dam alternatives are addressed qualitatively because the model does not simulate these
flows. The modeling effort provided useful information for assessing the impacts on
flood hydrology in the long-term, but provides limited information about the construction
period. Flood risks associated with dam removal activities are described qualitatively
and quantitatively using the SRH-1D modeling results completed by DOI, and the
analysis includes the measures incorporated to reduce these risks.
3.6.4.2 Significance Criteria
For the purposes of this EIS/EIR, impacts would be significant if they would substantially
increase the risks of exposing people or structures to loss, injury or death involving
flooding as measured by changes in the FEMA 100-year floodplain.
3.6.4.3 Effects Determinations
Alternative 1: No Action/No Project
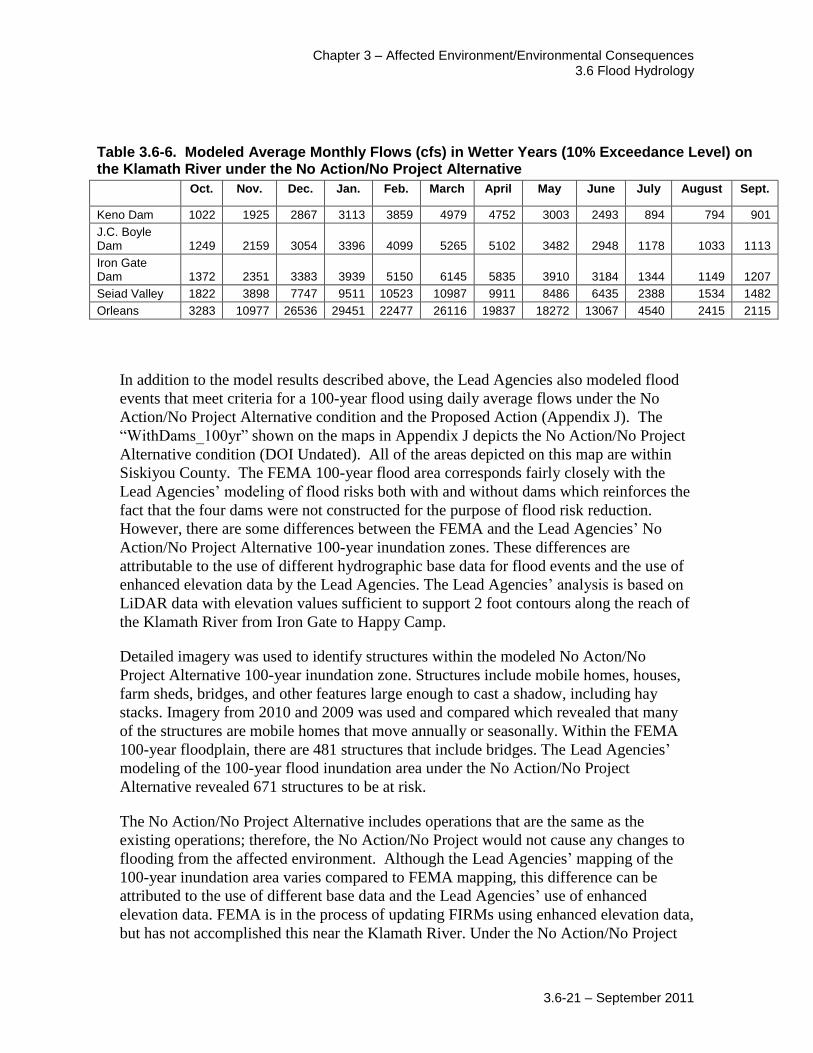
The No Action/No Project Alternative could alter river flows and result in changes to flood risks. Under the No Action/No Project Alternative (a Negative Determination), the Four Facilities would remain in place and operations similar to the current operations would be in effect. The PacifiCorp Klamath Hydroelectric Project and Reclamation’s Klamath Project would be operated as they were before the Secretarial Determination process began, including operation requirements under the March 2010 biological opinion. PacifiCorp would operate indefinitely under annual FERC licenses. For the purpose of this EIS/EIR, however, the No Action/No Project Alternative includes operations that would be similar to current operations. Table 3.6-6 shows modeled average monthly wet year flows at multiple points along the river under the No Action/No Project Alternative. Wet year flows are represented by the modeled 10 percent exceedance (flows are exceeded only ten percent of the time). The No Action/No Project Alternative flows are based on model results and the affected environment flows (Table 3.6-3) are based on historic monitoring data. The monthly flows described in the two tables (Tables 3.6-6 and 3.6-3) vary because the sources used to develop the data are different, but the flows are generally similar. Peak flows would likely exceed the average monthly flows in Table 3.6-6; however, the peak flows would be similar to those currently experienced because the No Action/No Project Alternative would not change operations.
Chapter 3 – Affected Environment/Environmental Consequences 3.6 Flood Hydrology
3.6-21 – September 2011
Table 3.6-6. Modeled Average Monthly Flows (cfs) in Wetter Years (10% Exceedance Level) on the Klamath River under the No Action/No Project Alternative
Oct. Nov. Dec. Jan. Feb. March April May June July August Sept.
Keno Dam 1022 1925 2867 3113 3859 4979 4752 3003 2493 894 794 901
J.C. Boyle Dam 1249 2159 3054 3396 4099 5265 5102 3482 2948 1178 1033 1113
Iron Gate Dam 1372 2351 3383 3939 5150 6145 5835 3910 3184 1344 1149 1207
Seiad Valley 1822 3898 7747 9511 10523 10987 9911 8486 6435 2388 1534 1482
Orleans 3283 10977 26536 29451 22477 26116 19837 18272 13067 4540 2415 2115
In addition to the model results described above, the Lead Agencies also modeled flood
events that meet criteria for a 100-year flood using daily average flows under the No
Action/No Project Alternative condition and the Proposed Action (Appendix J). The
“WithDams_100yr” shown on the maps in Appendix J depicts the No Action/No Project
Alternative condition (DOI Undated). All of the areas depicted on this map are within
Siskiyou County. The FEMA 100-year flood area corresponds fairly closely with the
Lead Agencies’ modeling of flood risks both with and without dams which reinforces the
fact that the four dams were not constructed for the purpose of flood risk reduction.
However, there are some differences between the FEMA and the Lead Agencies’ No
Action/No Project Alternative 100-year inundation zones. These differences are
attributable to the use of different hydrographic base data for flood events and the use of
enhanced elevation data by the Lead Agencies. The Lead Agencies’ analysis is based on
LiDAR data with elevation values sufficient to support 2 foot contours along the reach of
the Klamath River from Iron Gate to Happy Camp.
Detailed imagery was used to identify structures within the modeled No Acton/No
Project Alternative 100-year inundation zone. Structures include mobile homes, houses,
farm sheds, bridges, and other features large enough to cast a shadow, including hay
stacks. Imagery from 2010 and 2009 was used and compared which revealed that many
of the structures are mobile homes that move annually or seasonally. Within the FEMA
100-year floodplain, there are 481 structures that include bridges. The Lead Agencies’
modeling of the 100-year flood inundation area under the No Action/No Project
Alternative revealed 671 structures to be at risk.
The No Action/No Project Alternative includes operations that are the same as the
existing operations; therefore, the No Action/No Project would not cause any changes to
flooding from the affected environment. Although the Lead Agencies’ mapping of the
100-year inundation area varies compared to FEMA mapping, this difference can be
attributed to the use of different base data and the Lead Agencies’ use of enhanced
elevation data. FEMA is in the process of updating FIRMs using enhanced elevation data,
but has not accomplished this near the Klamath River. Under the No Action/No Project
Klamath Facilities Removal EIS/EIR Public Draft
3.6-22 – September 2011
Alternative, the Four Facilities would not be removed and the actual 100-year flood
inundation area would not change. The risks of dam failure would be same under the No
Action/No Project alternative as under the existing conditions. There would be no
change from existing conditions from flood risk.
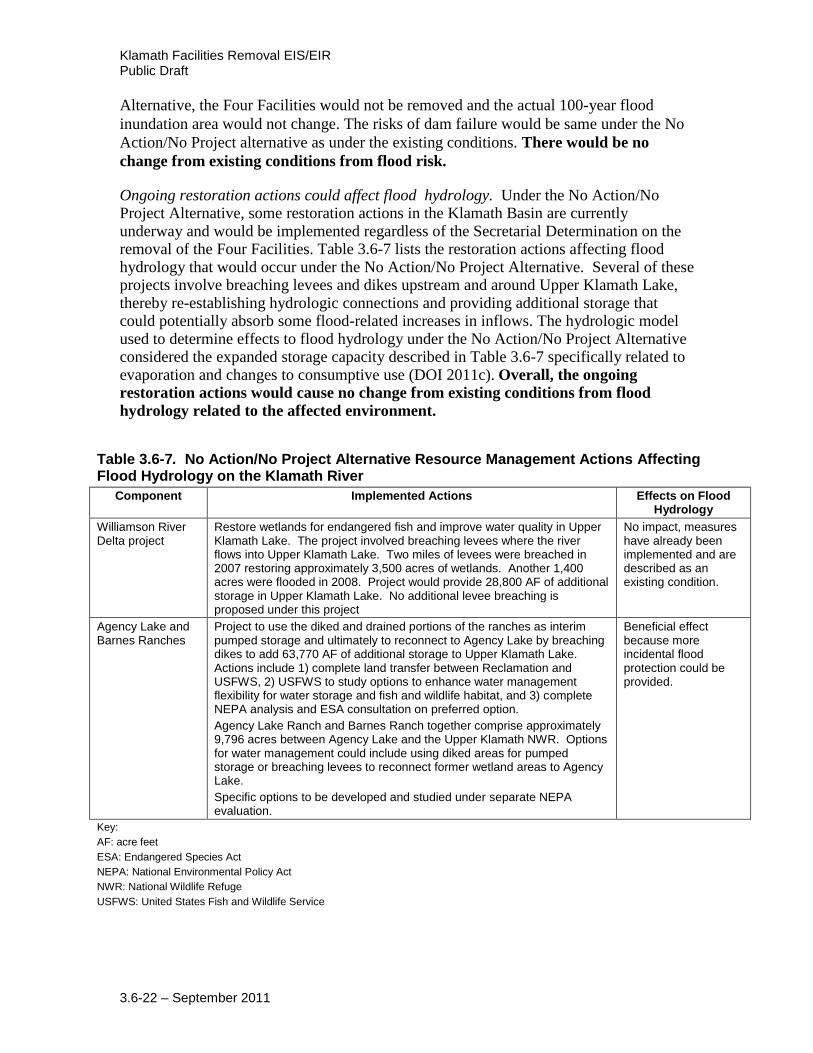
Ongoing restoration actions could affect flood hydrology. Under the No Action/No Project Alternative, some restoration actions in the Klamath Basin are currently underway and would be implemented regardless of the Secretarial Determination on the removal of the Four Facilities. Table 3.6-7 lists the restoration actions affecting flood hydrology that would occur under the No Action/No Project Alternative. Several of these projects involve breaching levees and dikes upstream and around Upper Klamath Lake, thereby re-establishing hydrologic connections and providing additional storage that could potentially absorb some flood-related increases in inflows. The hydrologic model used to determine effects to flood hydrology under the No Action/No Project Alternative considered the expanded storage capacity described in Table 3.6-7 specifically related to evaporation and changes to consumptive use (DOI 2011c). Overall, the ongoing
restoration actions would cause no change from existing conditions from flood
hydrology related to the affected environment.
Table 3.6-7. No Action/No Project Alternative Resource Management Actions Affecting Flood Hydrology on the Klamath River
Component Implemented Actions Effects on Flood Hydrology
Williamson River Delta project
Restore wetlands for endangered fish and improve water quality in Upper Klamath Lake. The project involved breaching levees where the river flows into Upper Klamath Lake. Two miles of levees were breached in 2007 restoring approximately 3,500 acres of wetlands. Another 1,400 acres were flooded in 2008. Project would provide 28,800 AF of additional storage in Upper Klamath Lake. No additional levee breaching is proposed under this project
No impact, measures have already been implemented and are described as an existing condition.
Agency Lake and Barnes Ranches
Project to use the diked and drained portions of the ranches as interim pumped storage and ultimately to reconnect to Agency Lake by breaching dikes to add 63,770 AF of additional storage to Upper Klamath Lake. Actions include 1) complete land transfer between Reclamation and USFWS, 2) USFWS to study options to enhance water management flexibility for water storage and fish and wildlife habitat, and 3) complete NEPA analysis and ESA consultation on preferred option.
Agency Lake Ranch and Barnes Ranch together comprise approximately 9,796 acres between Agency Lake and the Upper Klamath NWR. Options for water management could include using diked areas for pumped storage or breaching levees to reconnect former wetland areas to Agency Lake.
Specific options to be developed and studied under separate NEPA evaluation.
Beneficial effect because more incidental flood protection could be provided.
Key:
AF: acre feet
ESA: Endangered Species Act
NEPA: National Environmental Policy Act
NWR: National Wildlife Refuge
USFWS: United States Fish and Wildlife Service

Chapter 3 – Affected Environment/Environmental Consequences 3.6 Flood Hydrology
3.6-23 – September 2011
Alternative 2: Full Facilities Removal of Four Dams (Proposed Action)
Drawdown of reservoirs could result in short-term increases in downstream surface
water flows and result in changes to flood risks. Reservoir drawdown activities would
begin on November 1, 2019 at Copco 1 Dam, and on January 1, 2020 at J.C. Boyle and
Iron Gate Dams, at which times hydroelectric power generation would cease. At Copco 2
Dam, reservoir drawdown activities would begin on June 1, 2020 to allow for continued
hydroelectric power generation at this site until dam removal must begin. Releases at all
of the dams during reservoir drawdown periods would be in accordance with Dam
Removal Plans developed by the Lead Agencies and with applicable biological opinions
and operation plans. The Dam Removal Entity (DRE) would control the releases that
would vary by reservoir depending on the type of dam, discharge capacity, water year
type, and the volume of water and sediment within the reservoir. The resultant reservoir
water surface elevation after the initial drawdown would be generally higher in a wetter
year than in a drier year at all the dams.
The reservoir drawdown plans were made with consideration for minimizing flood risks
downstream. The DRE would carefully control drawdown to maintain flows that would
not cause flood risks. Drawing down the reservoirs would increase storage availability in
J.C. Boyle, Copco 1, and Iron Gate Reservoirs. If a flood event occurred during
drawdown, the DRE would retain flood flows using the newly available storage capacity
and continue drawdown after flood risks have ended. Existing conditions do not allow
these reservoirs to assist in flood prevention in this manner.
At J.C. Boyle Dam, the DRE would begin reservoir drawdown activities in January while
streamflows were still high. Controlled releases would initially be through the gated
spillway and power penstock at normal release rates, depending on year type, plus
additional flow of up to 100 cfs for reservoir drawdown. These releases would continue
until the reservoir water surface elevation decreased to the lowest level possible for the
streamflow occurring at that time. The DRE would then remove the stoplogs from one of
two low-level culverts beneath the spillway, temporarily releasing additional water
downstream at flows between approximately 1,900 and 2,700 cfs depending upon
reservoir level. Penstock releases could be reduced if necessary to limit the total sudden
increase in streamflow to between approximately 500 and 1,000 cfs. Once the reservoir
water surface is stabilized at a lower level, the DRE would remove the stoplogs from the
second low-level culvert, temporarily releasing additional water downstream at flows
between approximately 1,000 and 1,900 cfs than the current flows at the time. After this,
the reservoir would reach the lowest water surface elevation possible prior to removal of
the dam embankment.
While the controlled releases during reservoir drawdown would be higher than simulated
No Action/No Project Alternative releases during the same time period, they would not
be likely to increase flood risks because they would be within the range of historic flows.
A 10-year storm at J.C. Boyle results in an estimated flow of 9,058 cfs (see Table 3.6-5),
and the maximum daily winter flow (January through March) is in excess of 8,000 cfs
(USGS 2011). The average monthly flow below J.C. Boyle Dam from 1961-2009 was
about 2,380 cfs in January, 2,450 cfs in February, and 2,890 cfs in March. Increasing the

Klamath Facilities Removal EIS/EIR Public Draft
3.6-24 – September 2011
flow temporarily during reservoir drawdown by up to an additional 1,900 cfs over the No
Action/No Project Alternative by removal of the stoplogs from the diversion culverts
would not cause flood damage downstream. The concrete spillway crest structure would
be removed once the reservoir water surface elevation was drawn down sufficiently, to
provide additional flood release capacity and avoid reservoir refill. The embankment
dam crest and left abutment wall would be retained for flood protection until removal.
Removal of the J.C. Boyle Dam embankment would begin at the end of May 2020. By
then, the minimum reservoir drawdown level would have been achieved and inflow
would have decreased to summer levels averaging less than 1,000 cfs. Within four to six
weeks, the majority of the embankment would be removed except for a portion of the
upstream toe which would serve as an upstream cofferdam. The upstream cofferdam
would be armored with rockfill to allow a controlled breach between about water surface
elevation 3758 and the channel bottom at elevation 3740, to fully drain the reservoir by
July 2020. Reservoir releases would temporarily exceed inflow by up to approximately
5,000 cfs, depending upon the rate of breach development, but would remain below the
downstream channel capacity. Although the breach flow would quickly attenuate as it
moved downstream due to the very small reservoir volume, the Iron Gate cofferdam
would be breached before breaching J.C. Boyle as a precaution.
Although limited drawdown of Copco 1 Reservoir would begin in November 2019 to
permit early removal of the spillway gates and crest structure, the primary drawdown and
sediment release of Copco 1 Reservoir would begin at the same time as the J.C. Boyle
Dam reservoir drawdown in January 2020 and would be affected by the additional
upstream releases. Average inflow to Copco 1 Reservoir would be no more than 100 cfs
greater than normal streamflow for drawdown between reservoir water surface elevations
2590 feet and 2529 feet over a five to six week period, resulting in a total reservoir
release from the diversion tunnel averaging up to 400 cfs above streamflow. A 10-year
storm is estimated to result in flows of approximately 10,750 cfs (see Table 3.6-5), and
the average daily flow has exceeded 9,000 cfs (USGS 2011).
The concrete dam would be removed in 8-foot lifts while the reservoir was being drawn
down, removing concrete in the dry by blasting as the water surface elevation lowered.
The diversion tunnel would pass the entire streamflow for as long as possible, but its
discharge capacity would continue to decrease as the reservoir head is reduced. When
additional discharge capacity is required, notches would be blasted in the concrete dam
near the left abutment to allow for overtopping flows. The extent of notching would be
affected by the water year type: wet years would require more notching than normal or
dry years. The sudden increase in reservoir releases during notching may be controlled
by reducing the diversion tunnel discharge if necessary. Drawdown between reservoir
water surface elevations 2529 and 2484 would occur within 30 days. By March 12, 2020
the reservoir would be drained to the normal level of Copco 2 Reservoir (elevation 2484)
and a large portion of the concrete dam would have been removed. The final portion of
the concrete dam would be removed following drawdown of Copco 2 Reservoir and
during the summer low flow period.
Chapter 3 – Affected Environment/Environmental Consequences 3.6 Flood Hydrology
3.6-25 – September 2011
Copco 2 Dam does not provide any meaningful storage and the reservoir is very small
compared to the other reservoirs, with little or no impounded sediment. Normal
streamflow would be diverted downstream from Copco 2 Dam to the bypassed river
reach beginning in mid-May 2020 when dam removal would begin. No additional
releases would be made from the upstream reservoirs during this time as they would have
already been mostly drained. The DRE would use cofferdams to isolate areas of the
small concrete dam during demolition and would remove them once they were no longer
needed.
Reservoir drawdown at Iron Gate Dam would occur simultaneously with reservoir
drawdown at J.C. Boyle and Copco 1 Dams. Normal inflows to the reservoir in January
and February 2020 would be increased by up to an estimated 500 cfs due to upstream
reservoir drawdown releases. Reservoir drawdown between water surface elevations
2328 and 2202 would occur within a 10½-week period by controlled releases through the
modified diversion tunnel, at an average drawdown rate of 3 feet per day. The maximum
downstream flow during drawdown of Iron Gate Reservoir could exceed normal
streamflow at the site by up to 1,800 cfs. The average monthly flow below Iron Gate
Dam from 1961-2009 was about 2,830 cfs in January, 2,940 cfs in February, and 3,430
cfs in March (USGS 2011). A 10-year storm is estimated to discharge approximately
15,610 cfs (see Table 3.6-5), and average daily winter flows have exceeded 10,000 cfs
(USGS 2011). Increasing the flow during reservoir drawdown by up to an additional
1,800 cfs would not cause flood damage downstream. The modified diversion tunnel
discharge capacity would range between approximately 3,200 and 8,500 cfs during
reservoir drawdown. Should a large flood event occur during drawdown, the outlet
capacity would be exceeded and the reservoir could partially refill. This would be similar
to existing operations during a flood event.
The Dam Removal Plan requires that sufficient freeboard be maintained for the dam
embankment at all times to prevent potential flood overtopping and embankment failure.
The amount of freeboard would be determined according to water year type and surface
water elevation during removal operations. Excavation of the dam embankment would
begin in June 2020, during a period of reducing streamflow and with a minimum
reservoir release capacity of approximately 7,500 cfs. During this time, the embankment
dam crest would be lowered 55 feet from elevation 2348 to elevation 2293. In July,
excavation of the dam embankment would continue at an average rate of between 14,000
and 18,000 cubic yards per day, lowering the dam crest from elevation 2293 to elevation
2250, with a minimum reservoir release capacity of approximately 5,800 cfs. The
majority of the dam embankment volume would be excavated during the following 8
weeks, while maintaining a portion of the upstream toe at elevation 2205 to serve as an
upstream cofferdam. This would provide a minimum flood release capacity in excess of
3,000 cfs in both August and September, which is greater than the maximum historical
streamflow during this period and far exceeds the average monthly flow rates for August
and September of 980 cfs and 1,250 cfs, respectively (USGS 2011). By late September,
the reservoir would be drawn down to the maximum possible extent, minimal streamflow
would be occurring, and drawdown releases from upstream reservoirs would have ended.
The upstream cofferdam would be armored with rockfill to allow a controlled breach
Klamath Facilities Removal EIS/EIR Public Draft
3.6-26 – September 2011
between about water surface elevation 2189 and the channel bottom at elevation 2165, to
fully drain the reservoir by September 2020. Reservoir releases would temporarily
exceed inflow by up to approximately 5,000 cfs, depending upon the rate of breach
development, but would remain below the downstream channel capacity. The breach
flow would quickly attenuate as it moved downstream due to the very small reservoir
volume. The upstream cofferdam at J.C. Boyle would not be breached until the natural
river channel has been restored at the Iron Gate site.
This analysis uses the reservoir drawdown release rates at Iron Gate Dam to determine
the level of significance of adverse impacts downstream because Iron Gate Dam has the
largest reservoir, provides the highest amount of discharge, and is the most downstream
of all of the dams that would be removed. The release rates that would occur during
drawdown of the reservoir would be in accordance with the historical flow during an
extremely wet year (1 percent exceedance capacity). Figure 3.6-5 shows historic and
maximum flows at Iron Gate Dam under wet year, average year and dry year types.
While the release rates that would occur during reservoir drawdown would be greater
than the flows at the same time under the No Action/No Project Alternative, and in some
months, above the historic monthly maximum flow (September), they would be lower
than the overall peak flows in each reach. Because the flows would stay below historic
peak flows, they would not change the floodplain or flood risks in comparison to the No
Action/No Project Alternative. Therefore, the impact from drawing down the
reservoirs on flood risk would be less than significant.
The release of sediment stored behind the dams and resulting downstream sediment
deposition under the Proposed Action could result in changes to flood risks.
Approximately 41 to 65 percent of sediment behind J.C. Boyle Dam, 46 to 81 percent of
sediment behind Copco 1 Dam, and 25 to 38 percent of sediment behind Iron Gate Dam
would be eroded and flushed down the river during removal activities (DOI 2011c). The
remaining sediment would be left in place after dam removal above the active channel.
The Lead Agencies conducted an analysis of future geomorphology and sediment
transport during and after dam removal for dry, median and wet start year scenarios. Most
of the erosion would occur during the drawdown period from January 1, 2020 to March
2020 and afterwards the river bed in the reservoir reaches is expected to stabilize. Minor
deposition would occur in some of the reaches downstream of dam removal activities,
however none is expected downstream of Shasta River (DOI 2011c). The Geology and
Soils analysis considers the effects of sediment deposition in more detail (see Section
3.11.4.3). Sedimentation would occur downstream from the Four Facilities, but the
quantity would vary depending on year type. The magnitude of sediment deposition is
relatively small compared to sediment loading from other existing sources along the
Klamath River. Additionally, the sedimentation would be short-term following dam
removal. Because the sediment deposition would be short-term and small in comparison
with the No Action/No Project Alternative, it would not affect stream characteristics in a
way that would substantively affect flood inundation or flood risks. Therefore,
sediment deposition would have a less than significant effect on flood risk.

Chapter 3 – Affected Environment/Environmental Consequences 3.6 Flood Hydrology
3.6-27 – September 2011
Under the Proposed Action, the 100-year floodplain inundation area downstream of Iron
Gate Dam could change between River Mile 190 and 171. Table 3.6-8 describes
modeled flows on the Klamath River under the Proposed Action in wet water years
(10 percent exceedance level) at multiple points on the river. These flows include all
aspects of the Proposed Action, and the primary difference from the No Action/No
Project Alternative is related to implementation of the KBRA. The bold numbers
represent flows higher than the wet year flows under the No Action/No Project
Alternative described in Table 3.6-6. Flows during wet years would be higher under the
Proposed Action when compared to the No Action/No Project Alternative at all of these
sites during the months of January and February and July to September. The Figures
3.6-7 to 3.6-11 graphically describe the comparisons in flows at 10, 50 and 90 percent
flow exceedances between the No Action/No Project Alternative and the Proposed
Action.
Table 3.6-8. Flood Flow Exceedance: Modeled Wet Water Year Flows on the Klamath River under the Proposed Action
Oct. Nov. Dec. Jan. Feb. March April May June July August Sept.
Keno Dam 923 929 2,259 3,258 4,349 4,809 4,845 2,917 2,191 1,465 920 1,067
J.C. Boyle Dam 1,160 1,117 2,508 3,481 4,562 5,189 5,233 3,399 2,544 1,780 1,155 1,320
Iron Gate Dam 1,304 1,305 2,908 4,192 5,219 5,957 5,960 3,966 2,806 1,939 1,292 1,449
Seiad Valley 1,770 3,196 8,319 11,090 10,803 11,025 9,904 8,509 6,124 3,018 1,695 1,724
Orleans 3,195 10,153 27,098 30,998 22,727 26,485 19,973 18,614 12,629 4,993 2,574 2,306
Notes:
Bold numbers represent flows that are greater than the No Action/No Project Alternative.

Klamath Facilities Removal EIS/EIR Public Draft
3.6-28 – September 2011
Figure 3.6-7. Modeled Flow Exceedances under the No Action/No Project Alternative and Proposed Action Near Keno Dam
Figure 3.6-8. Modeled Flow Exceedances under the No Action/No Project Alternative and Proposed Action Below J.C. Boyle Dam
0
1000
2000
3000
4000
5000
6000
Oct Nov Dec Jan Feb Mar Apr May Jun Jul Aug Sep
Flo
ws
(cfs
)
Klamath Near Keno
Full Removal 10% Full Removal 50% Full Removal 90%No Action 10% No Action 50% No Action 90%
10, 50 and 90% Flow Exceedances
0
1000
2000
3000
4000
5000
6000
Oct Nov Dec Jan Feb Mar Apr May Jun Jul Aug Sep
Flo
w (
cfs)
Klamath Below JC Boyle Dam
Full Removal 10% Full Removal 50% Full Removal 90%No Action 10% No Action 50% No Action 90%
10, 50 and 90% Flow Exceedances

Chapter 3 – Affected Environment/Environmental Consequences 3.6 Flood Hydrology
3.6-29 – September 2011
Figure 3.6-9. Modeled Flow Exceedances under the No Action/No Project Alternative and Proposed Action Below Iron Gate Dam
Figure 3.6-10. Modeled Flow Exceedances under the No Action/No Project Alternative and Proposed Action Near Seiad Valley
0
2000
4000
6000
8000
10000
12000
Oct Nov Dec Jan Feb Mar Apr May Jun Jul Aug Sep
Flo
w (
cfs)
Klamath Near Seiad Valley
Full Removal 10% Full Removal 50% Full Removal 90%No Action 10% No Action 50% No Action 90%
10, 50 and 90% Flow Exceedances
0
2000
4000
6000
8000
10000
12000
Oct Nov Dec Jan Feb Mar Apr May Jun Jul Aug Sep
Flo
w (
cfs)
Klamath Near Seiad Valley
Full Removal 10% Full Removal 50% Full Removal 90%No Action 10% No Action 50% No Action 90%
10, 50 and 90% Flow Exceedances

Klamath Facilities Removal EIS/EIR Public Draft
3.6-30 – September 2011
Figure 3.6-11. Modeled Flow Exceedances under the No Action/No Project Alternative and Proposed Action at Orleans
J.C. Boyle, Copco 1, Copco 2, and Iron Gate Dams provide only incidental flood protection during flood events. Table 3.6-9 shows peak flood flows and shows flood attenuation of less than 5 percent would have been provided by Iron Gate and Copco 1 Dams under the No Action/No Project Alternative. (J.C. Boyle and Copco 2 Dams have negligible capacity for flood attenuation.) Under the Proposed Action, the facilities would not be in place to provide this temporary reduction in flow.
Table 3.6-9. Flood Attenuation of Iron Gate and Copco 1 Reservoirs
Flood Peak Flow
No Action
Peak Flow Under the Proposed
Action
% Reduction With Dams In
Synthetic 100-yr flood 31,460 33,800 6.9
1989 10,200 10,300 1.2
1993 11,100 11,400 2.7
1996 11,200 11,300 1.1
1997 20,500 21,400 4.0
2005 12,400 12,800 3.0
Source: DOI 2011c
0
5000
10000
15000
20000
25000
30000
35000
Oct Nov Dec Jan Feb Mar Apr May Jun Jul Aug Sep
Flo
w (
cfs)
Klamath At Orleans
Full Removal 10% Full Removal 50% Full Removal 90%No Action 10% No Action 50% No Action 90%
10, 50 and 90% Flow Exceedances

Chapter 3 – Affected Environment/Environmental Consequences 3.6 Flood Hydrology
3.6-31 – September 2011
Appendix J includes model results that show flood maps for the river reaches below Iron Gate Dam to Happy Camp. The series of figures show the 100-year floodplain under the No Action/No Project Alternative and the Proposed Action; the differences between the two floodplains are very minor. As described under No Action/No Project Alternative analysis, there are some differences in the current 100-year flood inundation areas between FEMA and the model. These differences are attributable to the use of different base data and the use of enhanced elevation data by the Lead Agencies. FEMA is in the process of updating FIRMs using enhanced elevation data but has not accomplished this near the Klamath River. DOI determined the existing floodplain by computing the 100 year flood and then mapping the extent of that floodplain on the existing topography. The existing floodplain may be different than that proposed by FEMA because it is based upon more current information. DOI also determined the 100-yr floodplain after dam removal. Based upon the most current inventory of structures downstream of Iron Gate Dam to Humbug Creek over 24 residences are within the existing 100 year flood plain. Less than 6 residences and other structures such as garages are outside of this flood plain, but may be put into the 100 year floodplain after removal of the dams. However, the final determination of the future 100-yr floodplain after dam removal will be made by FEMA. The purpose of the analysis was to estimate the costs to mitigate the increase in flood risk. The existing bridges are within the 100-year floodplain; however, these structures would need to be evaluated to determine if they would still maintain enough clearance to not be inundated by flooding. Not all of the structures that could be exposed to increased flooding risks are permanent. However, an increase in risk to one habitable structure or bridge is considered to be significant according to the significance criteria. Mitigation measures H-1 and H-2 are described below. Modeled flows represent average monthly conditions, but peak flows for fisheries and storms could result in greater flows for a short duration. Table 3.6-9 shows the flood attenuation during a 100-year storm, and the dams provide an even smaller percent attenuation during a peak flow event. During high flow periods, the existing flood control capacity with the four dams would do little to reduce flood damage. Therefore, there would be little change to flood control capacity after the four dams are removed. When a large flood event is predicted, the National Weather Service provides river stage forecasts for the Klamath River for the USGS gages at Seiad Valley, Orleans and Klamath. They currently do not publish a forecast for river stage at Iron Gate gage. However, they work with PacifiCorp to issue flood warnings to Siskiyou County. After removal of Copco and Iron Gate Dams, it is likely that National Weather Service will publish a forecast at the Iron Gate gage location (DOI 2011c). Both Klamath County (Klamath County 2010b) and Siskiyou County participate in the NFIP and rely on existing 100-year flood maps prepared by FEMA to plan for future development or management near flood prone areas. Regulations under the NFIP require participating communities to “inform FEMA of any physical changes that affect 100-year flood elevations…within 6 months of the date that such data are available.” This information is submitted in the form of a LOMA-F or LOMR by the community. FEMA
Klamath Facilities Removal EIS/EIR Public Draft
3.6-32 – September 2011
will review the submitted data and determine if a map revision is warranted and proceed accordingly (FEMA 2002). Removal of the four dams would change the 100-year flood inundation zone when compared to the current FEMA map. This would require either a LOMA-F or LOMR to be prepared by Klamath and Siskiyou Counties for areas within their jurisdictions. Both counties might require the DRE or other responsible agency to work with them to prepare the application. In Klamath County, the FEMA 100-year flood inundation area would change due to removal of J.C. Boyle Reservoir.
The change to the 100-year floodplain inundation area downstream from Iron Gate
Dam would increase the risks of flooding structures; therefore, the impact on flood
hydrology would be significant. Mitigation Measures H-1 and H-2 would reduce the
impact to flood hydrology to less than significant.
Removing the Four Facilities could reduce the risks associated with a dam failure. The Four Facilities, collectively, store over 169,000 acre-feet of water when they are full. The dams are inspected regularly, and the probability for failure has been found to be low. However, if a dam failed, it could inundate a portion of the downstream watershed (Siskiyou County website 2011). Removing the Four Facilities would eliminate the potential for dam failure and subsequent flood damages. Therefore, eliminating the
dam failure risk associated with the Four Facilities would have a beneficial effect on
flood hydrology. The relocation of the Yreka water supply pipeline could affect river flows and result in changes to flood risks. The existing water supply pipeline for the City of Yreka passes under the Iron Gate Reservoir and would have to be relocated prior to the decommissioning of the reservoir to prevent damage from deconstruction activities or increased water velocities once the reservoir has been drawn down. The pipeline could either be suspended from a pipe bridge across the river near its current location, or rerouted along the underside of the Lakeview Bridge just downstream of Iron Gate Dam. The pipe bridge would be located above the 100 year flood line as the intention is to prevent the pipeline from being exposed to high velocity flows. Thus, the pipe bridge would not affect flood hydrology. If the pipeline was placed on the Lakeview Bridge, there would be no effect to flood hydrology from the placement of the pipeline that would be directly caused by the pipeline separate from the bridge. Therefore, there
would be no change from existing conditions from flood risk from the relocation of
the Yreka water supply pipeline. Under the Proposed Action, recreational facilities currently located on the banks of the existing reservoirs would be removed following drawdown and could change flood hydrology. The existing recreational facilities provide camping and boating access for recreational users of the reservoirs. Once the reservoirs are drawn down, these facilities would be removed. These facilities would be well above the new river channel, and deconstruction would not place anything in the channel or otherwise impeded low or high flows in the Klamath River. Therefore, there would be no change from existing
conditions from flood hydrology from the removal of the recreational facilities.

Chapter 3 – Affected Environment/Environmental Consequences 3.6 Flood Hydrology
3.6-33 – September 2011
Keno Transfer
Implementation of the Keno Transfer could cause changes to operations affecting flows downstream of Keno Dam, which could cause changes to flood risks. The Keno Transfer is a transfer of title for the Keno Facility from PacifiCorp to the DOI. This transfer would not result in the generation of new impacts on flood hydrology compared with existing facility operations. Following transfer of title, DOI would operate Keno in compliance with applicable law and would provide water levels upstream of Keno Dam for diversion and canal maintenance consistent with agreements and historic practice. Implementation
of the Keno Transfer would have no change from existing conditions from flood
risks.
East and West Side Facilities
Decommissioning the East and West Side Facilities could cause changes in flood risk
downstream of the facilities. Decommissioning of the East and West Side canals and
hydropower facilities of the Link River Dam by PacifiCorp as a part of the KHSA will
redirect water flows currently diverted at Link River Dam into the two canals, back in to
Link River. Following decommissioning of the facilities there will be no change in
outflow from Upper Klamath Lake or inflow into Lake Ewauna. Therefore,
implementation of the East and West Side Facility Decommissioning action would
result in no change from existing conditions.
KBRA
The KBRA, which is a component of the Proposed Action, encompasses several
programs that could affect flood hydrology, including:
Phases I and 2 Fisheries Restoration Plan Wood River Wetland Restoration Future Storage Opportunities On-Project Plan Water Use Retirement Program Emergency Response Plan Water Diversion Limitations Climate Change Assessment and Adaptive Management Interim Flow and Lake Level Program
Phases 1 and 2 Fisheries Restoration Plans
Implementation of the Fisheries Restoration Plans could change flows downstream of Upper Klamath Lake, which could result in changes to flood risks. Actions within the floodplain and river channel including: floodplain rehabilitation, large woody debris replacement, fish passage correction, cattle exclusion fencing, riparian vegetation planting, and treatment of fine sediment sources could alter river hydraulics. The restoration actions are designed to improve aquatic and riparian habitat and the potential changes in river hydraulics are intended to improve the habitats’ ability to support river fisheries. Changes in river hydraulics could generate minor changes in flood risks in and around the specific restoration locations. The timing of and specific locations where these resource management actions could be undertaken is not certain but it assumed that some

Klamath Facilities Removal EIS/EIR Public Draft
3.6-34 – September 2011
of these actions could occur at the same time and in the vicinity of the hydroelectric facility removal actions analyzed above. However, potential changes in river
hydraulics are likely to generate a less than significant impact to flood risks.
Implementation of specific plans and projects outlined in the Fisheries Restoration
Plans will require the analysis of changes to flood risks in future environmental
compliance investigations as appropriate.
Wood River Wetland Restoration
Implementation of Wood River Wetland Restoration may change flows upstream and downstream of Upper Klamath Lake, which could result in changes to flood risks. A study of future Wood River Wetland area management options would be conducted to provide additional water storage for a total of 16,000 acre-feet of storage capacity in or adjacent to Agency Lake. This additional storage upstream of Upper Klamath Lake is likely to decrease potential flood risks downstream of Upper Klamath Lake by potentially storing excess flows. The improvements in flood risk generated by implementation of the Wood River Wetland Restoration Project would not be expected to contribute to the effects of hydroelectric facility removal analyzed above. Implementation of the Wood
River Wetland Restoration Project is anticipated to have a beneficial effect on flood
risks. Implementing Wood River Wetland Restoration will require the analysis of
changes to flood risks in future environmental compliance investigations as
appropriate.
Future Storage Opportunities
Implementation of Future Storage Opportunities by Reclamation may cause changes to
flows upstream and down downstream of Upper Klamath Lake, which could result in
changes to flood risks. Reclamation plans to identify and study additional off-stream
storage opportunities with a 10,000 acre-feet of storage milestone in implementation of
KBRA. Offstream storage is likely to decrease potential flood risks by potentially storing
excess flows. The improvements in flood risk generated by development of off-stream
storage would not be expected to contribute to the effects of hydroelectric facility
removal analyzed above. Implementation of Future Storage Opportunities is
anticipated to have a beneficial effect on flood risks. Implementing Future Storage
Opportunities will require the analysis of changes to flood risks in future
environmental compliance investigations as appropriate.
On-Project Plan
Implementation of the On-Project Plan may change flows downstream of Upper Klamath Lake during dry years, which could result in changes to flood risks. The On-Project Plan supports full implementation of Water Diversion Limitations by taking actions to reduce water use for irrigation. These actions include: land fallowing and shifting to dryland crop alternatives, changes in land use and forage availability/types for terrestrial species, efficiency and conservation measures (i.e. drip irrigation), development of groundwater sources, or creation of additional storage. Reductions in water use under the On-Project Plan would not be expected to contribute to any changes in flood risk generated by the hydroelectric facility removal action. Implementation of the On-Project Plan is likely
to generate no change in flood risk when compared to existing conditions as it would
be implemented during dry years during the irrigation season when flood risks are
Chapter 3 – Affected Environment/Environmental Consequences 3.6 Flood Hydrology
3.6-35 – September 2011
low. Implementing the On-Project Plan will require the analysis of changes to flood
risks in future environmental compliance investigations as appropriate.
Water Use Retirement Program (WURP)
Implementation of the WURP would change flows upstream of Upper Klamath Lake, which could result in changes to flood risks. The WURP is a voluntary program for the purpose of supporting fish populations restoration by permanently increasing inflow to Upper Klamath Lake by 30,000 acre-feet per year. A variety of management measures and irrigation water use changes would help to accomplish an inflow increase and are described in Section 2.4.3.9. Upper Klamath Lake storage has already increased after breaching of levees and dikes by the Williamson River Delta project which would be large enough to accommodate the inflow increase. Other KBRA measures described below would manage outflow to the Klamath River. Reductions in water use under the WURP would not be expected to contribute to any changes in flood risk generated by the hydroelectric facility removal action. Implementation of the WURP is expected to
generate no change in flood risks when compared to existing conditions because flow
changes would be implemented during the irrigation season and not the flood
season. Implementing the WURP will likely require the analysis of changes to flood
risks in future environmental compliance investigations as appropriate.
Emergency Response Plan
Implementation of an Emergency Response Plan could result in changes to flood risks in the event of failure to a Klamath Reclamation Project facility or dike on Upper Klamath Lake or Lake Ewauna. The purpose of the plan is to prepare water managers for an emergency affecting the storage and delivery of water needed for KBRA implementation. The components of the Emergency Response Plan are described in Section 2.4.3.9 and include potential emergency response measures and processes to implement emergency responses. While use of an Emergency Response Plan could potentially reduce damage to property or loss of life due to a facility or dike failure, the intent of this plan is to allow for continued storage and delivery of water according to KBRA commitments and would not affect the probability of experiencing a flood. Additionally the Emergency Response Plan would not be expected to contribute to any changes in flood risk generated by the hydroelectric facility removal action. Therefore, it is anticipated that implementation
of the Emergency Response Plan would generate no change in flood risk when
compared to existing conditions, although it would likely help to reduce damage to
property or loss of life due to a flood event which would be a beneficial effect to
flood risks. Implementing the Emergency Response Plan will likely require the
analysis of changes to flood risks in future environmental compliance investigations
as appropriate.
Climate Change Assessment and Adaptive Management
Implementation of Climate Change Assessment and Adaptive Management may change
flows upstream and downstream of Upper Klamath Lake, which could result in changes
to flood risks. One of the main purposes of Climate Change Assessment and Adaptive
Management is to respond to and protect basin interests from the adverse affects of
climate change. Flood risks could be adversely impacted due to climate changes which
increase river flows and/or flooding frequency. Klamath Basin Parties including

Klamath Facilities Removal EIS/EIR Public Draft
3.6-36 – September 2011
technical experts would be involved in the development of assessment and adaptive
management strategies. Assessments and development of adaptive management strategies
would be implemented continuously to respond to predicted climate changes. The
improvements in flood risk generated by the Climate Change Assessment and Adaptive
Management Program would be expected improve the effects of hydroelectric facility
removal analyzed above. While flood risks could be adversely impacted by climate
change in general, implementation of Climate Change Assessment and Adaptive
Management would help to reduce flood risks in the event of climate changes and be
beneficial to flood risks. Implementing Climate Change Assessment and Adaptive
Management will likely require the analysis of changes to flood risks in future
environmental compliance investigations as appropriate.
Interim Flow and Lake Level Program
Implementation of Interim Flow and Lake Program during the interim period would
change river flows, which could result in changes to flood risks. The goal of the Interim
Flow and Lake Level Program is to “further the goals of the Fisheries Program” during
the interim period. This would require changes in flows to accommodate fish needs
during the irrigation season. These flow changes would be similar to what is currently
recommended under biological opinions. Changes in water flows under the Interim Flow
and Lake Level Program would not be expected to contribute to any changes in flood risk
generated by the hydroelectric facility removal action. Therefore, implementation of
the Interim Flow and Lake Level Program would cause no change in flood risk from
existing conditions because flow changes would not be implemented during the flood
season.
Alternative 3: Partial Facilities Removal of Four Dams
Under the Partial Facilities of Four Dams Alternative, impacts would be the same as for the Proposed Action. The increased flood risks would be less than significant. The
change in the 100-year floodplain downstream from Iron Gate Dam would increase
the risks of flooding structures and would be significant. Mitigation measures H-1
and H-2 would reduce this impact to less than significant. Eliminating the dam
failure risk would have a beneficial effect.
Keno Transfer
The flood hydrology impacts of the Keno Transfer under the Partial Facilities Removal of Four Dams Alternative would be the same as for the Proposed Action.
East and West Side Facilities
The surface water and hydrology impacts of the decommissioning the East and West Side
canals under the Partial Facilities Removal of Four Dams Alternative would be the same
as for the Proposed Action.
Chapter 3 – Affected Environment/Environmental Consequences 3.6 Flood Hydrology
3.6-37 – September 2011
KBRA
Under this alternative, the KBRA would be fully implemented and the potential effects would be the same as described for the Proposed Action. Implementation of the KBRA
would result in a less than significant impact to flood hydrology. Alternative 4: Fish Passage at Four Dams
Under the Fish Passage at Four Dams Alternative, flows downstream of Iron Gate Dam would remain the same as for the No Action/No Project Alternative. The risk of dam failure and downstream flooding would be the same as under the No Action/No Project Alternative and existing condition. Within the Hydroelectric Reach, however, flows would change to accommodate the new fish ladders and requirements within the bypass reaches. Flows within the J.C. Boyle Bypass Reach would increase to meet fish needs in this area. Although the flows would increase compared to the No Action/No Project Alternative, the existing channel capacity is adequate to accommodate these increases. Flows downstream of Iron Gate Dam would not change. Therefore, the effects from
Fish Passage at Four Dams Alternative on flood hydrology would be less than
significant because the river channel capacity can support flow increases and there
would be no increased risks of flooding.
Alternative 5: Fish Passage at J.C. Boyle and Copco 2, Remove Copco 1 and Iron Gate
Drawdown of reservoirs could result in short-term increases in downstream surface water flows and result in changes to flood risks. Under the Fish Passage at J.C. Boyle and Copco 2, Remove Copco 1 and Iron Gate Alternative, short-term drawdown of reservoirs would occur at Copco 1 and Iron Gate dams, with the same effects as for the Proposed Action. No drawdown would occur in Klamath County because J.C. Boyle Reservoir would remain in place. As described in the Proposed Action, drawdown-
related impacts to flood risks for the Fish Passage at J.C. Boyle and Copco 2,
Remove Copco 1 and Iron Gate Alternative would be less than significant because
flow changes would be within the historic range.
The release of sediment stored behind Copco 1 and Iron Gate dams and resulting
downstream sediment deposition could result in changes to flood risks. Approximately
46 to 81 percent of sediment behind Copco 1 Dam, and 25 to 38 percent of sediment
behind Iron Gate Dam would be eroded and flushed down the river during removal
activities (DOI 2011c). As was described and analyzed above for the Proposed Action,
the magnitude of sediment deposition is relatively small compared to sediment loading
from other existing sources along the Klamath River. Additionally, the sedimentation
would be short-term following dam removal. Because the sediment deposition would be
short-term and small in comparison with the No Action/No Project Alternative, it would
not affect stream characteristics in a way that would substantively affect flood inundation
or flood risks. Therefore, sediment deposition would have a less than significant
effect on flood risks.
The 100-year floodplain inundation area downstream of Iron Gate Dam could change between River Mile 190 and 105 (study area). Removing Copco 1 and Iron Gate would result in a change in flows downstream of Iron Gate Dam. These changes would be less

Klamath Facilities Removal EIS/EIR Public Draft
3.6-38 – September 2011
than the Proposed Action, but could result in flooding to some structures in the 100-year floodplain. Additionally, flow requirements in the J.C. Boyle Bypass Reach would increase flows, but similar to the Fish Passage at Four Dams Alternative, these changes would be within the historic range of flows in this reach. The change to the 100-year
floodplain inundation area downstream from Iron Gate Dam would increase the
risks of flooding structures; therefore, the impact on flood hydrology would be
significant. Mitigation measures H-1 and H-2 would reduce the impact to flood
hydrology to less than significant.
Removing Copco 1 and Iron Gate Dams could reduce the risks associated with a dam failure. Copco 1 and Iron Gate Dams together store over 90,000 acre-feet of water when they are full. The dams are inspected regularly, and the probability for failure has been found to be low. However, if a dam failed, it could inundate a portion of the downstream watershed (Siskiyou County website 2011). Removing the dams would eliminate the potential for dam failure and subsequent flood damages. J.C. Boyle Dam would still be in place, and the potential for dam failure would be the same as in the No Action/No Project. The inundation area, however, could change because removal of the downstream facilities would affect flow patterns. Overall, eliminating the dam failure risk
associated with Copco 1 and Iron Gate Dams would have a beneficial effect on flood
hydrology.
The relocation of the Yreka water supply pipeline could affect river flows and result in changes to flood risks. Under the Fish Passage at J.C. Boyle and Copco 2, Remove Copco 1 and Iron Gate Alternative, relocation of the Yreka water supply pipeline would occur at Iron Gate dam, with the same effects as for the Proposed Action. As described in the Proposed Action, there would be no change from existing conditions from flood
risks from the relocation of the Yreka water supply pipeline. Recreational facilities currently located on the banks of Iron Gate and Copco reservoirs would be removed following drawdown and could change flood hydrology. Under the Fish Passage at J.C. Boyle and Copco 2, Remove Copco 1 and Iron Gate Alternative, recreation facilities would be removed at Iron Gate and Copco reservoirs, with the same effects as for the Proposed Action. Therefore, there would be no change from existing
conditions flood hydrology from the removal of the recreational facilities.
Construction of a new gage within the 100-year floodplain at Copco 2 Dam or J.C. Boyle Dam to measure flows could affect flood hydrology. Under the Fish Passage at J.C. Boyle and Copco 2, Remove Copco 1 and Iron Gate Alternative a new gage would need to be developed at Copco 2 Dam or J.C. Boyle Dam to measure flows required to protect fish habitat downstream. Incorporation of environmental measures in the project would avoid construction-related impacts from construction in the floodplain. The
construction of a new gage would be a less than significant impact.
Changes in flows in the Hydroelectric Reach including the J.C. Boyle and Copco 2 bypass Reaches could affect flood hydrology. Similar to the analysis stated under the Fish Passage at Four Dams Alternative, flows would change to accommodate the new fish ladders and requirements within the bypass reaches. As stated under the Fish Passage at
Chapter 3 – Affected Environment/Environmental Consequences 3.6 Flood Hydrology
3.6-39 – September 2011
Four Dams Alternative, the effects on flood hydrology would be less than significant
because the river channel capacity can support flow increases and there would be no
increased risks of flooding.
3.6.4.4 Mitigation Measures
Mitigation Measure by Consequence Summary
Mitigation Measure H-1: Prior to dam removal, the DRE will inform the National
Weather Service, River Forecast Center, of a planned major hydraulic change (removal of
four dams) to the Klamath River that could potentially affect the timing and magnitude of
flooding below Iron Gate. The River Forecast Center is the federal agency that provides
official public warning of floods. As needed, the River Forecast Center would update
their hydrologic model of the Klamath River to incorporate these hydraulic changes so
that changes to the timing and magnitude of flood peaks would be included in their
forecasts. As currently occurs, flood forecasts and flood warnings would be publicly
posted by the River Forecast Center for use by federal, state, county, tribal, and local
agencies, as well as the public, so timely decisions regarding evacuation or emergency
response could be made.
Prior to dam removal, the DRE will inform FEMA of a planned major hydraulic change
to the Klamath River that could affect the 100-year flood plain. The DRE will ensure
recent hydrologic/hydraulic modeling, and updates to the land elevation mapping, will be
provided to FEMA so they can update their 100-year flood plain maps downstream of
Iron Gate Dam (as needed), so flood risks (real-time and long-term) can be evaluated and
responded to by agencies, the private sector, and the public.
Mitigation Measure H-2: The DRE will work with willing landowners to move or
relocate permanent, legally established, permitted, habitable structures in place before
dam removal. The DRE will move or elevate structures where feasible that could be
affected by changes to the 100-year flood inundation area as a result of the removal of the
Four Facilities.
Effectiveness of Mitigation in Reducing Consequence
These mitigation measures will be effective as they will identify the extent of the
increased flood risks and take measures which will reduce the risks for loss, injury or
death from flooding.
Agency Responsible for Mitigation Implementation
The DRE would be responsible for implementing mitigation measures H-1 and H-2.
Mitigation Measures Associated with Other Resource Areas
Implementation of Mitigation REC-1 would create a plan to develop recreational
facilities and access points along the newly formed river channel between J.C. Boyle
Reservoir and Iron Gate Dam. Recreation facilities, such as campgrounds and boat
ramps, currently located on the edge of the reservoir would need to be replaced in
appropriate areas near the new river channel once the reservoir is removed. These
facilities will not contribute to channelization of the river and thus increase flood risks, or
Klamath Facilities Removal EIS/EIR Public Draft
3.6-40 – September 2011
create infrastructure in the flood plain that would be at risk of damage during inundation.
Therefore, there would be no change from existing conditions to Flood Hydrology
from the implementation of REC-1.
3.6.5 References
Abney, R.M. 1964. A Comparative Study of the Past and Present Condition of Tule Lake.
October 30, 1964. p. 3.
Akins, G.J. 1970. The Effects of Land Use and Land Management on the Wetlands of the
Upper Klamath Basin. March 1970. pp. 34-36; pp. 43-50; and Figures 7-10.
Association of State Dam Safety Officials (ASDSO). 2000. California’s Dam Safety
Laws and Regulations Summary. July 2000. Accessed on: 7-11-2011. Available at:
http://www.damsafety.org/media/Documents/PDF/CA.pdf
ASDSO. 2011. Top Issues Facing the Dam Community. Accessed on: 7-11-2011.
Available at: http://www.damsafety.org/news/?p=c0fdade4-ab98-4679-be22-
e3d7f14e124f.
Bureau of Reclamation (Reclamation). 2005. Natural Flow of the Upper Klamath River
– Phase I. November 2005.
Reclamation. 2010. Klamath Project 2010 Operations Plan. p. 1. Accessed on: 11-08-
2010. Available at: http://www.usbr.gov/mp/kbao/operations/2010/2010_OPS_PLAN.pdf
Department of the Interior (DOI), Reclamation. 2011a. Website – Klamath Project
Information. Accessed on: 2-8-2011. Available at:
http://www.usbr.gov/projects/Project.jsp?proj_Name=Klamath+Project
DOI, Reclamation. 2011b. Klamath Project 1010 Operations Plan. April 6. 2011.
DOI, Reclamation. 2011c. Technical Report No. SRH-2011-02, DRAFT Hydrology,
Hydraulics and Sediment Transport Studies for the Secretary’s Determination on
Klamath River Dam Removal and Basin Restoration. March 2011. p. 2-1; pp. 2-20 to 2-
41; Section 6; Section 8; and Appendix A.
DOI. Undated. Secretary’s Determination on Klamath River Dam Removal and Basin
Restoration 100-year Flood Draft Inundation Mapping Map. Undated.
Desert Research Institute Website. 2011. Western U.S. Climate Historical Summaries.
Accessed on: 5-6-2011. Available at: http://www.wrcc.dri.edu/Climsum.html.
Federal Energy Regulatory Commission (FERC). 2007. Final Environmental Impact
Statement for Hydropower License, Klamath Hydroelectric Project FERC Project No.
2082-027. November 2007. pp. 2-14; 3-62 thru 3-94; and 3-539 thru 3-543.

Chapter 3 – Affected Environment/Environmental Consequences 3.6 Flood Hydrology
3.6-41 – September 2011
Federal Emergency Management Act Federal Insurance and Mitigation Administration.
2002. National Flood Insurance Program, Program Description. August 1, 2002. pp. 3-13.
Greimann, Blair P. 16 March 2011. (Hydraulic Engineer, Bureau of Reclamation, Denver
Federal Center). Email correspondence with Chris Park of CDM, Sacramento, California.
Klamath Hydroelectric Settlement Agreement (KHSA) 2010. February 18. 2010.
Klamath County. 2010a. Land Development Code, Article 59 Flood Hazard Zones.
Klamath County. 2010b. Comprehensive Plan for Klamath County, Oregon. January
2010 Audit. Goal 7 pp. Goal 7-1 thru Goal 7-4.
National Oceanic and Atmospheric Administration Fisheries Service (NOAA Fisheries
Service). 2005. NOAA Technical Memorandum NMFS-NWFSC-66, Updated Status of
Federally Listed ESUs of West Coast Salmon and Steelhead, June 2005. Pp. 311-312.
NOAA Fisheries Service, Southwest Region. 2010. Biological Opinion, Operation of the
Klamath Project Between 2010 and 2018. March 15, 2010. pp. 167 and 177.
U.S. Geological Survey (USGS) 2009a. Klamath River Water Quality Data from Link
river Dam to Keno Dam, Oregon, 2008. Accessed on May 9, 2011. Available at:
http://pubs.usgs.gov/of/2009/1105/pdf/ofr20091105.pdf. P. 2.
U.S. Geological Survey. 2009b. Water-Data Report 2009, 11516530 Klamath River
below Iron Gate Dam, CA, Klamath River Basin.
U.S. Geological Survey Website. 2011. Water Quality Data. Accessed on: February 14,
2011. Available at: http://waterdata.usgs.gov/ca/nwis/dv/?referred_module=sw
Siskiyou County. 1986. Siskiyou County, California Code, Title 10 Planning and Zoning,
Chapter 6 Zoning, Article 54 Floodplain Combining Districts (F). February 27, 1986.
Siskiyou County, 1990. Siskiyou County, California Code, Title 10 Planning and Zoning,
Chapter 10 Flood Damage Prevention. December 13, 1990. Section 10-10.07.6.
Siskiyou County. 1997. Siskiyou County General Plan Land Use Policies. October 9,
1997. Policies 21 thru 27.
Siskiyou County Website. 2011. Siskiyou County Multi-Jurisdictional Hazard Mitigation
Plan. 2011. Accessed on June 29, 2011. Available at:
http://www.co.siskiyou.ca.us/PHS/emerg/hazard_mitigation.aspx.
Wallace, M. 1998. Seasonal Water Quality Monitoring in the Klamath River Estuary,
1991-1994 for the California Department of Fish and Game. Inland Fisheries
Administrative Report No. 98-9.
Klamath Facilities Removal EIS/EIR Public Draft
3.6-42 – September 2011
Weddell, B.J., K.L. Gray, and J.D. Foster. Undated. History and Ecology of Lower
Klamath, Tule Lake, Upper Klamath, and Klamath Forest National Wildlife Refuges,
Oregon and California. Undated. p. 3.