360 report - iigcc · 360 report $com panysectorname$ $storyname$$reportt ype$ important. please...
TRANSCRIPT

360 Report $Com panySectorName$ $StoryName$$R eportT ype$
IMPORTANT. Please refer to the last page of this report for “Important disclosures” and analyst certification(s).
keplercheuvreux.com
Carbon Compass
23 November 2015
Investor guide to carbon footprinting
In partnership with
What’s it all about? Within the landscape of carbon metrics, it is sometimes difficult to find the right direction. We built this compass to guide you through current and developing carbon assessment tools: What can they tell you? What do they not tell you? What are the main methodological choices and how do they affect the end results? We explore and answer these questions in a simple and user-friendly way by looking at three types of metrics: carbon footprints, alternative and complementary measures (including green-brown share and ‘avoided emissions’) and static/forward-looking benchmarks. We also review the methodology of the main data providers on the market and detail the results of a series of workshops organised by the Institutional Investor Group on Climate Change (IIGCC).
Julie Raynaud Main author
+44 (0) 207 621 5186 Transition research team
Biographies at the end of the report
Energy Transition & Climate Change
2 keplercheuvreux.com
360
in 1 minute
Trending now As more investors carry out a carbon footprint of their investments, encouraged by
initiatives such as the Montreal Pledge and the Portfolio Decarbonisation Coalition, as
well as growing regulatory pressure in certain countries like France, there are still a
number of unresolved questions (see our ten burning questions).
Multiple metrics There is growing consensus that carbon footprints are not enough and need to be
complemented by other metrics that better reflect the forward-looking and multi-faceted
nature of the climate change challenge. Carbon footprinting may be adequate to
understand and communicate the contribution of investments to climate change, but other
metrics are needed to: 1) understand the positive contribution of certain investments to
the climate and energy transition as well as 2) the risk associated with certain investments
in the medium to long run.
Focus on the use case In turn, we explore carbon footprints, alternative and complementary metrics such as
‘green-brown’ share and ‘avoided emissions’, and benchmarks, both static and forward-
looking. Which metric is the most appropriate? We argue that each has pros and cons and
ultimately it depends on the aim of the analysis.

Energy Transition & Climate Change
3 keplercheuvreux.com
P.20
P.24
P.31
P.47
P.62
P.72
P.76
P.86
P.32
P.36
Ten burning questions In this guide, we answer the main questions that our clients have been asking us on the topic of carbon and climate change metrics. Follow the link to access the answer directly!
? What scope should I include and what is the problem with double counting?
? How do I aggregate the results at portfolio level, and what metric should I use to
normalise?
? What about other asset classes?
? What is the best technique to estimate data?
? How can I assess data quality and how can verification and assurance help?
? What approach for green-brown share?
? What about calculating avoided emissions?
? Benchmarks: what do they tell me?
? What alternative benchmarks are emerging?
? What are the main differences between data providers?

Energy Transition & Climate Change
4 keplercheuvreux.com
Forewords
Eric Borremans, Vice Chair of IIGCC and Sustainability Expert at Pictet Asset Management
Investors have more reasons than ever to analyse their exposure to greenhouse gas emissions to gauge the
likely impact of rising carbon prices, to identify the potential for stranded assets and to address growing demand
for financing the transition to a low carbon economy. Consequently, for many investors a first step often
involves portfolio carbon footprinting. For this reason, the IIGCC has worked closely with Kepler Cheuvreux to
produce this excellent and timely report, published on the eve of the 2015 Paris Climate Summit.
Investors need robust and consistent metrics to mitigate the risks and seize the opportunities associated with
climate change. It was this demand that inspired the series of carbon footprinting workshops organised over the
past twelve months by the IIGCC across seven European cities. These workshops brought together leading
service providers and hundreds of investors to test and debate the ways in which different methodologies can
be used for communication, engagement and decision-making, but also to examine their strengths and
limitations.
A summary of what was learned through this process forms a key case study at the heart of this report. It
highlights how there is no such thing as a single aggregate carbon metric to capture the different aspects and
impacts of climate risks. But what carbon footprinting can do is start a discussion between investors to inform
the exposure of different investment strategies to the stock and the flow of greenhouse gas emissions.
Carbon metrics are no silver bullet. Investors also need sector and company-specific data to guide top-down and
bottom-up investment decisions and to engage with companies which are laggards in their industry. ‘Green’
metrics are also required to measure how well a portfolio is exposed to the ‘opportunity set’ arising from the
low-carbon economy. This report provides a solid foundation for investors to understand many different metrics
and to assess their added value and limitations. Finally, this report also looks at the thorny question of data
quality - still a key issue for companies which report incomplete or inaccurate data, and for investors who
collectively need to exert pressure for better disclosure.
Carbon footprinting remains a work in progress, but we are confident that the emergence of a new set of metrics
and calculation methodologies is a vital step for the implementation and credibility of climate change
investment solutions.
The Institutional Investors Group on Climate Change is a European forum with over 115 members - including
some of the largest pension funds and investment managers in Europe - who together represent over EUR12trn
in assets. IIGCC provides investors with a common voice to encourage public policies that prevent dangerous
climate change and enable the transition to a low carbon economy. IIGCC members also collaborate to develop
better investment practices and to encourage corporate behaviour to address long-term risks and opportunities
associated with climate change.
Two years ago, the Global Investor Coalition – of which IIGCC is a founding partner – produced Climate Change
Investment Solutions – A guide for Asset Owners outlining a range of strategies investors can use to embed the
impact of climate change in their investment policies and ownership practices, including low-carbon
investments, reducing carbon exposure and increasing exposure to climate resilient assets.
Energy Transition & Climate Change
5 keplercheuvreux.com
Stan Dupre, Founder and Director 2° Investing Initiative
Recent momentum has shown that investors are increasingly concerned about climate change. Such concern
stems from two distinct objectives: managing exposure to climate-related risks (physical, legal, and “carbon” or
transition risk) and fulfilling their role as a capital provider in the transition to the low-carbon economy.
As explored in the Portfolio Carbon Initiative’s recent report Climate Strategies and Metrics, the metrics
investors should use to inform such objectives, and the specific approaches and communication strategies
associated, should be as distinct as the objectives themselves. To date, portfolio carbon footprinting, reviewed in
detail in this report, has been a great tool for educating the finance sector about its exposure to GHG emissions
and raising general awareness. At the same time, as voluntary and mandatory disclosure regimes for both
companies and investors move forward, it is becoming increasingly clear that footprinting alone will not fulfil
investors’ needs. More sophisticated metrics and methodologies are needed, specific to the use case of risk or
contribution.
Crucially, this report moves the dialogue forward by reviewing not just the metrics that exist today, but looking
forward at where investors may be tomorrow, coupling carbon metrics with exposure to green technologies and
alignment with decarbonisation scenarios. It is refreshing to see a market leader like Kepler Cheuvreux involved
in both areas—seizing the momentum and reviewing today’s metrics while playing an integral part in the needed
research to advance the state of the art.
Two European Commission projects coordinated by 2° Investing Initiative, the SEI Metrics consortium—
studying alignment of investor portfolios to the energy transition--and the ET Risk consortium—studying the
financial risks associated with the transition—will help move the ball forward. For example, as described in this
report the SEI metrics project will deliver insight into how investor’s portfolios are aligned or misaligned with
the energy transition, and we encourage investors to contact us for a free and confidential 2° alignment check of
any equity portfolio.
The 2° Investing Initiative is a multi-stakeholder think tank working to align the financial sector with 2°C climate
goals. Our research and advocacy work seeks to:
• Align the investment processes of financial institutions with 2°C climate scenarios.
• Develop the metrics and tools to measure the climate performance of financial institutions.
• Mobilise regulatory and policy incentives to shift capital to energy transition financing.
The association was founded in 2012 in Paris and now has offices in New York, London, and Paris and research
projects in Europe, China and the United States. Our work is global, both in terms of geography and engaging
key players. We bring together financial institutions, issuers, policy makers, research institutes, experts, and
NGOs to achieve our mission, and representatives from each stakeholder group sponsor our research.

Energy Transition & Climate Change
6 keplercheuvreux.com
Florence Didier-Noaro and Julien Rivals, partners at Deloitte France
Despite the incredible progress made by companies and the development of reporting tools and standards in
recent years, the challenge remains to get all major companies to report on their energy consumption and
carbon emissions using similar standards and perimeters. Stakeholders acknowledge that an external assurance
provides relevant evidence of the level of reliability of reported information.
Delivering assurance to GHG emissions according to international standards means that:
the quantification methods and reporting policies selected and applied are consistent with the applicable criteria and are appropriate;
estimates made in preparing the GHG statement are reasonable;
the information presented in the GHG statement is relevant, reliable, complete, comparable and understandable;
the GHG statement provides adequate disclosure of the applicable criteria, and other matters, including uncertainties, such that intended users can understand the important judgments made in its preparation; and
the terminology used in the GHG statement is appropriate.
Basically, the concrete tasks to be performed by the auditor are the following:
1. assessing the suitability of the criteria, testing the consistency with the five principles: relevance, completeness, reliability, neutrality, understandability;
2. assessing the risks that the subject matter information may be materially misstated, by understanding the organisation, the process and the internal control;
3. performing further procedures clearly linked to the identified risks, using a combination of inspection, observation, confirmation, recalculation, reperformance, analytical procedures and inquiry.
Even if providing assurance to a portfolio carbon footprint might not be expected yet in all jurisdictions, applying
assurance principles may lead asset managers and investors to implement more appropriate methodologies and
tools. Audit culture and principles may help.
The contribution of Deloitte Conseil (“Deloitte”) is solely limited to section “the perspective of the verifier” – pages
38 to 43 as Deloitte was requested by Kepler Cheuvreux to present the key concepts regarding assurance
engagements and the main tasks performed by the verifier in that context.
Deloitte refers to one or more of Deloitte Touche Tohmatsu Limited, a UK private company limited by
guarantee, and its network of member firms, each of which is a legally separate and independent entity. Please
see www.deloitte.com/about for a detailed description of the legal structure of Deloitte Touche Tohmatsu
Limited and its member firms. In France, Deloitte SAS is the member firm of Deloitte Touche Tohmatsu Limited,
and professional services are provided by its subsidiaries and affiliates.
Deloitte provides audit, tax, consulting, and financial advisory services to public and private clients spanning
multiple industries. With a globally connected network of member firms in more than 150 countries, Deloitte
brings world-class capabilities and deep local expertise to help clients succeed wherever they operate. Deloitte's
approximately 225,000 professionals are committed to becoming the standard of excellence.
In France, Deloitte calls on diversified expertise to meet the challenges of its clients of all sizes from all
industries - major multinationals, local micro-companies and medium-sized enterprises. With the expertise of its
9,400 professionals and partners, Deloitte is a leading player in audit and risk services, consulting, financial
advisory services, tax & legal and accounting, based on a multidisciplinary offering and a set of action principles
attuned to the requirements of our environment.
Energy Transition & Climate Change
7 keplercheuvreux.com
Contents
Ten burning questions 3
Forewords 4
Eric Borremans, Vice Chair of IIGCC and Sustainability Expert at Pictet Asset
Management 4
Stan Dupre, Founder and Director 2° Investing Initiative 5
Florence Didier-Noaro and Julien Rivals, partners at Deloitte France 6
Carbon metrics: key dynamics 9
Key dynamics no. 1: family portrait 10
Key dynamics no. 2: increased focus on the objective 12
Key dynamics no. 3: the route to standardisation 15
Reader’s guide 16
Carbon footprint: the beginning of a journey 17
If you only have five minutes 17
What can you use it for? 18
Fasten your seatbelt 19
Alternative and complementary metrics 47
If you only have five minutes 47
What can you use it for? 48
Fasten your seatbelt 49
Comparing performance: benchmarks 72
If you only have five minutes 72
What can you use it for? 73
Fasten your seatbelt 74
Data providers: reality check 86
If you only have five minutes 86
Confront theory with practice: the IIGCC workshops 87
Bloomberg 91
Carbone 4 92
ET Index 93
Grizzly 94
Inrate 95
MSCI 96

Energy Transition & Climate Change
8 keplercheuvreux.com
South Pole Group 97
Sustainalytics 98
Trucost 99
Vigeo 100
Research ratings and important disclosures 101
Legal and disclosure information 104

Energy Transition & Climate Change
9 keplercheuvreux.com
Carbon metrics: key dynamics A growing number of investors are calculating and disclosing the carbon footprint
of their portfolios, with a greater level of transparency on methodology
shortcomings, data providers, and more interestingly, evolution over time.
According to a 2015 Novethic survey, 94 investors have done a carbon footprint,
and the number is increasing (+68% February - July 2015) (link).
What is driving these figures? This happens in a context where regulatory and
stakeholder pressures are increasing, through initiatives like the Portfolio
Decarbonisation Coalition, the Montreal Protocol, and the French law on Energy
Transition driving action. The Investor Platform for Climate Action provides details
on 17 initiatives undertaken by over 400 investors in 30 countries (link).
We are observing three main dynamics in this field:
1. There is a growing recognition that additional metrics need to complement
carbon footprints in order to help understand what is driving results, assess
the positive contribution and alignment with transition scenarios, and in that
perspective add a forward-looking element to the analysis.
2. The use case is an important determinant in choosing what metric is
appropriate – ‘climate-friendliness’ and ‘climate risks’ are two separate
objectives and different metrics are more suited for one or the other.
3. Carbon footprint results, as well as other carbon metrics, are not yet fully
comparable due to different methodologies. This raises the question of
standardisation.
In turn, we explore these in the introduction of this report.
Chart 1: An increasing number of investors have done a carbon footprint, alongside climate-related investment strategies
Source: Based on Novethic (2015)
-
5,000
10,000
15,000
20,000
25,000
0
50
100
150
200
250
300
350
400
Carbon footprint Low-carbon index Engagement Disinvesment Investments
AU
M (m
E)
Nu
mb
er
of
inv
est
ors
Feb-15 May-15 Jul-15 AUM (€m)
+68% between Feb and July 15
Three main dynamics….

Energy Transition & Climate Change
10 keplercheuvreux.com
Key dynamics no. 1: family portrait
New metrics and approaches are being developed by data providers, investors and
other stakeholders to refine existing ones and shed light on new aspects of the
climate change challenge. We attempt to map these methods on Chart 2, to show
how they fit, or could theoretically fit together. We then detail each one in the next
chapters, and focus on answering frequently-raised questions.
Portfolio carbon footprinting is usually the entry point of most investors in the world of carbon metrics. It either relies on data disclosed by the investee or on estimated data. Core methodological questions cover the inclusion of value chain data (beyond the operational or financial control of the investee) and double-counting. We explore these later. Most carbon footprints have been done on listed equity portfolios, but methodologies are now available for other asset classes, such as private equity, fixed income, real estate and even derivatives.
Metrics calculating the proportion of the portfolio invested in ‘green’ and ‘brown’ sectors, companies, assets, products, activities or technologies are maturing. These metrics are often used to complement or replace carbon footprints and get a sense of the dispersion of the climate challenge and opportunities within a portfolio. It is worth noting that green-brown metrics can be used to estimate the carbon footprint of a portfolio or investee, even though this is not the traditional analysis pathway.
‘Avoided emissions’, or emissions that were avoided outside of the scope of the investee due to its products or services, can be quantified using green-brown metrics at a product-level as a starting point (amongst other methodologies). These methods are mostly used in project finance, increasingly in the green bonds space, but no consensus exists yet on how to apply these to equity portfolios.
Green-brown metrics may also be forward-looking, covering aspects such as fossil fuel reserves, planned capacity additions and retirements, and research & development in green products. This requires an all-new set of data in a context of increasing demand for this type of analysis, in particular supported by risk analysis such as the stream of work around stranded assets and the carbon bubble.
Finally, some investors are interested in comparing the results with a benchmark to understand how their portfolios perform in relative terms. We highlight three sets of benchmarks. The most widely used ones are market benchmarks, applying indexes such as MSCI ACWI. The comparison with these benchmarks can inform on the performance versus the status quo, but not a dynamic goal and pathway. A new set of benchmarks are being developed at company and portfolio level, which assess the alignment of a company and/or portfolio with a 2˚C world.
Portfolio carbon footprinting is usually the entry point of most investors in the world of carbon metrics…
... sometimes complemented by green-brown metrics and measures of avoided emissions…
… which deliver their full meaning when compared to a relevant benchmark

En
erg
y T
ran
sition
& C
lima
te C
ha
ng
e
11
k
ep
lerch
eu
vre
ux
.com
Chart 2: Our carbon metrics map
Source: Kepler Cheuvreux
Portfolio
Investee
Asset/ product/ activity/ technology
Carbon footprint
Portfolio carbon
footprint
Green-brown share per
asset/activity/technology
Green-brown share
(% of sales/% total
activity)
Green-brown share
Carbon footprint may be calculated based on the green-
brown share
Carbon footprint
Benchmark
Indices (incl. low-carbon
indices)
Aggregated and allocated to portfolio
Aggregated and allocated to portfolio
Carbon footprint may be calculated based on the green-
brown share
Depending on the taxonomy used/ data availability, possible to drill
down at this level
Carbon footprint usually calculated at company level. Analysis also common at the
product and project level
Avoided emissions
Avoided emissions
Avoided emissions
Best calculated at this level as different products/ technology/
assets will have replaced a specific alternative
May be aggregated at investee level. No overarching, cross-sector
standards exist at this point in time
May be aggregated at portfolio level. No standard exists.
May be calculated based on sector-
split, using averages (uncertain)
Science-based
targets
Portfolio level comparison - static
2 degree Benchmark
Portfolio benchmark. Data is also available at investee and
asset level.
More common at project level
Not a benchmark in its original form but may be used as one.
Targets at company-level based on its sector allocation. Can be
extrapolated to portfolio-levels but harder.

Energy Transition & Climate Change
12 keplercheuvreux.com
Aren’t we just overcomplicating everything? This question often arises in conversations. Why not only include direct emissions,
i.e. emissions generated directly by the activities of the investee versus indirect or
supply chain emissions, as a carbon tax or emission trading scheme will most likely
apply to these emissions? Similarly, can’t an understanding of a portfolio’s
investment in ‘green’ and ‘brown’ technology indirectly inform on the exposure to
climate change risks and opportunities?
In answer to the first question, risk may be passed through the supply chain,
depending on the pricing power of suppliers, hence creating a market risk in itself. In
answer to the second, carbon footprint may be understood as a measure of the
average climate responsibility of a portfolio where green-brown metrics may inform
on the dispersion of potential risk and opportunities.
Just as there are several metrics used to assess the financial performance of an
investment, the multifaceted nature of carbon and climate change should be
captured through multiple metrics, each shedding light on a different aspect of the
contribution and exposure to climate change.
Key dynamics no. 2: increased focus on the objective
Investors should first define their investment belief and strategy and select
appropriate metrics in that perspective, while ensuring that the methodological
foundations are suitable to what they are trying to measure and accomplish. In
short, the choice of metrics depends on what you are trying to achieve and how
you will use them!
The Institutional Investors Group on Climate Change (IIGCC)
published a ‘Guide for Asset Owners’ (Climate Change Investment
Solutions, link), which stresses the importance of conducting a
‘strategic review’ as a first step, in order to ‘enable asset owners to
better manage the risks and opportunities associated with climate
change in a way that is consistent with the fiduciary duty to
exercise due care, skill and diligence in the pursuit of the best
interests of fund beneficiaries’.
2˚Investing Initiative, UNEP-FI and the Greenhouse Gas Protocol
make the case for setting the objective of the analysis in order to
choose the right metric (link): ‘Investors should be clear about
whether and how they are following a risk-driven strategy, a
friendliness-driven strategy, or both’.
Would you assess financial risk and performance with a single metric?
It depends on what you are trying to achieve!

Energy Transition & Climate Change
13 keplercheuvreux.com
Negative versus positive contribution to climate change Linking a portfolio with climate change may imply a wide range of investment
strategies, spanning different combinations of sustainability impact and exposure to
financial objectives, underpinned by a belief of how the world may look in the future.
We distinguish between strategies primarily focused on decreasing exposure
through a minimised negative contribution to climate change, and others trying to
leverage opportunities by investing in solution-oriented assets.
Chart 3: Alignment between responsible investment strategies and reporting on climate change
Source: Kepler Cheuvreux (adapted from Bridges Ventures, Sonen Capital & KL Felicitas)
Note that in practice, this distinction between the search for risks, mitigation and
opportunities on the one hand, and the right metrics on the other hand can be
blurred in practice. For example:
Rather than risk-reduction, a low-carbon investment approach may explicitly target opportunities for greater financial returns at companies that lead their peer group in terms of environmental performance management (e.g. across carbon-intensive sectors) or have a lower emissions profile than the index benchmark; these companies do not, however, necessarily have meaningful exposure to low-carbon solutions.
Likewise, an investor focused on risk mitigation may seek an aggregated metric at portfolio level that is consequently the percentage of exposure to ‘brown’/high-carbon intensity industries (e.g. coal). To give a full picture, reporting may in practice cover all these metrics, depending on the individual use and circumstances.

Energy Transition & Climate Change
14 keplercheuvreux.com
Throughout this guide, we assess each metric and approach based on what it can be
used for, keeping the distinction between ‘minimising negative contribution’ versus
‘maximising positive impact’ in mind.
‘Climate-friendliness’ and risk The two main investor initiatives that aim to take carbon foot printing to the next
level (UNEP-FI and CDP “Portfolio Decarbonisation Coalition” (PDC) and the PRI
“Montréal Carbon Pledge” (MCP)) entail a dual vision of “carbon footprinting”: the
PDC endorses an outcome-oriented approach targeting a critical mass of investors
to incentivise global GHG emission reductions and investing in the green space,
while the MCP’s priority in our view appears to be more about understanding
climate-related risk at investor level (with the aim of using this information to
develop an engagement strategy and/or identify and set carbon footprint reduction
targets) rather than proactively driving a climate impact.
The French government’s ‘energy transition for green growth’ bill adopted this
summer makes France the first country requiring asset owners and managers to
measure their carbon footprint. It also embeds a mixed approach combining the
“impact investing” mode with a fiduciary approach focused on climate risk “impact
on investment”. This dual approach highlights a fundamental difference: “investment
impact” versus “impact on investment” and implies significant differences in metrics
and reporting options.
We argue that even if carbon metrics can be used, under certain conditions, as a first
(imperfect) step to analyse risk, they are primarily measures of ‘climate-friendliness’.
We detail under what circumstances carbon metrics can be used as a first step
towards the analysis of risk in selected sections of this report.
Table 1: The four types of information investors must disclose under the French law – between risk and impact
Type of information Law text Qualitative or quantitative Description and context
Investment policies "Information on how their investment decision-making process takes social, environmental and governance criteria into consideration"
Qualitative A description of the integration of climate (and other ESG) issues into investment decisions.
Financial risk exposure "The exposure to climate-related risks" Unclear Exposure to financial risks associated with climate change, either physical or carbon asset risk
Associated GHG emissions
"Including the GHG emissions associated with assets owned"
Quantitative Carbon footprint of the investor's portfolio or a relevant portion of the portfolio
Contribution to the energy transition (ET)
"The contribution to the international goal of limiting climate change and the contribution to the realisation of the energy and ecological transition. That contribution will be assessed with regards to indicative targets set by institutional investors taking into account the nature of their activities and investments, in a way that is consistent with the national low-carbon strategy”
Unclear Degree to which investor's portfolio is aligned with both international (i.e. a 2° warming target) and French climate change policies
Source: 2° Investing Initiative (link)
“Investment impact” versus “impact on investment” in the context of carbon footprinting
Energy Transition & Climate Change
15 keplercheuvreux.com
Key dynamics no. 3: the route to standardisation
Compared to other Environmental, Social and Environmental indicators,
Greenhouse gas (GHG) emissions is one of the most used and standardised. But it is
not enough.
A better standardisation of metrics and reporting practices is highly desirable, and is
associated with two main benefits:
It allows for a comparison of investors on content – not only on their reporting practices – in order to facilitate the development of ratings, discrimination between financial products, and the introduction of public policy incentives.
It lowers the cost of implementation. The capacity to innovate lies mostly with data providers. In the absence of a standard, asset managers have to evaluate each method requested by clients and buy the corresponding data as well as consolidate the metrics of each of their funds when asset management is delegated, leading to higher implementation costs.
We believe there are three potential layers of standardisation going forward:
Commodity data, such as fossil fuel reserves and car production by type of technology, are already standardised to a certain extent, as covered by non-environmental standards.
Data on what constitute a ‘green’ or high-carbon investment is more difficult to standardise. It may be driven by initiatives such as the Climate Bonds Initiative and index providers, but its application remains difficult in an equity context. There is no shared vision on the market at the moment.
Carbon data at the investee level is already covered by the GHG Protocol, and notwithstanding some key limitations, can be considered quite comparable. It is more difficult when it comes to estimation techniques, where proprietary models from providers constitute a fundamental barrier to standardisation.
The GHG Protocol, UNEP-FI and 2° Investing Initiative are collaborating as part of
the Portfolio Carbon Initiative in order to create a standard of reporting for asset
owners on their GHG emissions and their contribution to the energy transition.
Target publication is scheduled for end-2016.
Already standardised... but it is not enough!

Energy Transition & Climate Change
16 keplercheuvreux.com
Reader’s guide
We first introduce our ten burning (and methodological) questions on the next page,
to help access answers directly and easily.
The guide is segmented into three main parts, corresponding to the metrics on our
‘carbon map’:
Chapter 1: Carbon footprint
Chapter 2: Complementary and alternative metrics
Chapter 3: Benchmarking performance
We also include a fourth chapter that reviews the current market and methodology
of data providers.
Chapter 4: Data providers - reality check
Each part is split into two sections: ‘If you only have five minutes’ provides a
summary of the section alongside more contextual information and a review of what
the metric can be used for, and perhaps more importantly, what it cannot be used
for. ‘Fasten your seat belt’ answers specific methodological questions that often
come back on the subject.
Chart 4: Report structure
Source: Kepler Cheuvreux
Portfolio
Investee
Asset/ product/ activity/ technology
Green-brown share
Benchmark
Green-brown share
Green-brown share
Carbon footprint
Carbon footprint
Carbon footprint
IndicesScience-
based targets
2˚ benchmark
Avoided emissions
Avoided emissions
Avoided emissions
Ch
ap
ter 1
Chapter 2
Chapter 3

Energy Transition & Climate Change
17 keplercheuvreux.com
Carbon footprint: the beginning of a journey Efforts on reporting at portfolio level have overwhelmingly revolved around
carbon footprinting on listed equity, as they benefit from:
1. The broadest coverage among reporting companies, fuelled by progress made through several initiatives such as the CDP or the GHG Protocol.
2. The fact that it can be leveraged across responsible investment strategies, and for instance be perceived as an (imperfect) proxy to broader environmental risk management and the assessment of a portfolio contribution to climate change.
If you only have five minutes
Mainly a measure of responsibility… Carbon footprint is arguably the most widely-used, simple and high-level metric in
this field. It can be understood as a measure of “climate-friendliness”, or
contribution to climate change, still recognising a number of caveats that we
explore in the following sections (e.g. inclusion of products and service emissions).
…that might be used as a starting point to assess exposure to low-carbon transition risk... Carbon intensity may be a starting point to assess exposure, in particular exposure
to carbon risks (e.g. regulatory risks) through investments in carbon-intensive
assets, depending on the choice of metric and if embedded into broader risk
assessment frameworks that take other factors into account. Its relevance to inform
exposure to climate risk (e.g. physical risks from extreme weather events) is
however completely different as a carbon-intensive asset is not necessarily exposed
to climate-related events such as drought or floods compared to a low-carbon one.
… and soon to become mandatory reporting It is interesting to note the wording of the French Law. Point 2 requires investors to
provide information on “Climate-related financial risks” (here understood as both
carbon and climate risk) and point 3 calls for disclosing “Associated greenhouse gas
emissions”, thus leading to believe that carbon footprint is an integral component of
risk assessment. The Montreal Pledge also takes this view.
While simpler metrics may “do the job”… Carbon footprinting may not be necessary for a high-level, broad-based
understanding of contribution and/or exposure. An assessment of the proportion
invested in ‘brown’, or high-carbon sectors, could be sufficient for a simple
estimation of the overall negative portfolio contribution to climate change.
… carbon footprinting is a widely-used measure at company level… Companies have been reporting on their carbon footprint for a few years now,
fuelled by reporting initiatives such as the CDP and the GHG Protocol. The next step
is to transpose this concept at portfolio level by using the ownership logic. This
transposition is relatively recent, with several still-unresolved technical questions.
Efforts on reporting at portfolio level have overwhelmingly revolved around carbon footprinting

Energy Transition & Climate Change
18 keplercheuvreux.com
… with many unresolved methodological questions Questions include: should I include Scope 3? Should I care about double counting?
What are the methods to estimate carbon data in the absence of reporting? How
should I aggregate the data at portfolio level and what metrics should I use? What
about the weighted average carbon intensity metric? We argue that there are no yes
or no answers to these questions, as it depends on the use case, i.e. how the results
will be used. We detail this in the next section.
It’s just a start! While imperfect, the results are useful to get a point-in-time picture of the portfolio
contribution to climate change. A consensus is emerging on the fact that this metric
needs to be used together with other methodologies, in order to develop a more
holistic understanding of the underlying contribution but also exposure to risk. In
particular, carbon footprint only measures the negative contribution of a portfolio to
climate change, and ignores the potential positive contribution to the energy and
climate change transition. Carbon footprints are also backward-looking.
What can you use it for?
Good for:
Understanding and measuring the extent to which your portfolio contributes to climate change, at a high-level, at time t.
Deep diving into the results to understand what sectors and investees contribute most to the footprint.
Potentially communicating and complying with the French Law, depending on the application decree.
Not so good for:
Managing climate change contribution and exposure: better used in conjunction with other metrics that take contextual information, trends and other dimensions into account.
Improvements needed:
Better reporting, especially for private equity, small and medium companies and state-owned enterprises, to allow for a better understanding of the contribution to climate change.
More systematic measures of uncertainty.
Need for an accounting standard at portfolio level (it already exists at company level and is being developed at portfolio level by the GHG Protocol, UNEP-FI and 2° Investing Initiative).
A consensus is emerging on the fact that this metric needs to be used together with other methodologies, in order to develop a more holistic understanding of the underlying impact but also exposure to risk
Energy Transition & Climate Change
19 keplercheuvreux.com
P.20
P.21
P.32
P.31
P.44
P.36
P.24
P.38
P.25
P.28
Fasten your seatbelt
In this section, we answer the following questions:
What scope should I include?
What about double counting?
How do I aggregate the results at portfolio level?
What normalising metric?
What about the weighted average carbon intensity?
What about other asset classes?
What method to estimate data gaps?
What about data quality?
What is the perspective of the verifier?
A proxy for risk?

Energy Transition & Climate Change
20 keplercheuvreux.com
What scope should I include? The GHG Protocol ‘Corporate Accounting and Reporting Standard’ (link) has
developed a standard to measure the GHG emissions of companies using three
‘scopes’.
Scope 1 emissions are the direct emissions of a company, notably from company vehicles and energy use in facilities.
Scope 2 emissions are indirect upstream emissions that come from the purchase of electricity, heating and cooling.
Scope 3 emissions are also indirect and refer to both upstream supply-chain emissions such as upstream logistics and purchased goods and services, as well as downstream activities, notably emissions from the use and disposal of sold products, as well as emissions from franchises. The GHG emissions from investments (‘financed emissions’) also fall into this category.
One could argue that a company has more influence on its Scope 1 and 2 emissions
compared to its Scope 3 emissions. Note that this varies across Scope 3 categories
(e.g. an automobile company has a large influence on the emissions of its cars).
Chart 5: Scope 3 – it matters!
Source: Based on Inrate data
Yet, most companies do not disclose Scope 3 emissions, beyond categories such as
‘business travel’. Only approximately 10 out of the world’s 800 largest publicly-
listed companies provide information on each of the 15 Scope 3 categories on a basis
of ‘comply-or-explain’ (i.e. explanation is given as to why a Scope 3 category is not
reported, usually because it is not relevant to the sector or business model) (link).
0
10
20
30
40
50
60
70
80
90
100
Pe
rce
nta
ge
of e
mis
sio
ns
Scope 2 and 3 Upstream (supply chain) Scope 1 Scope 3 downstream (Product Use)
Energy Transition & Climate Change
21 keplercheuvreux.com
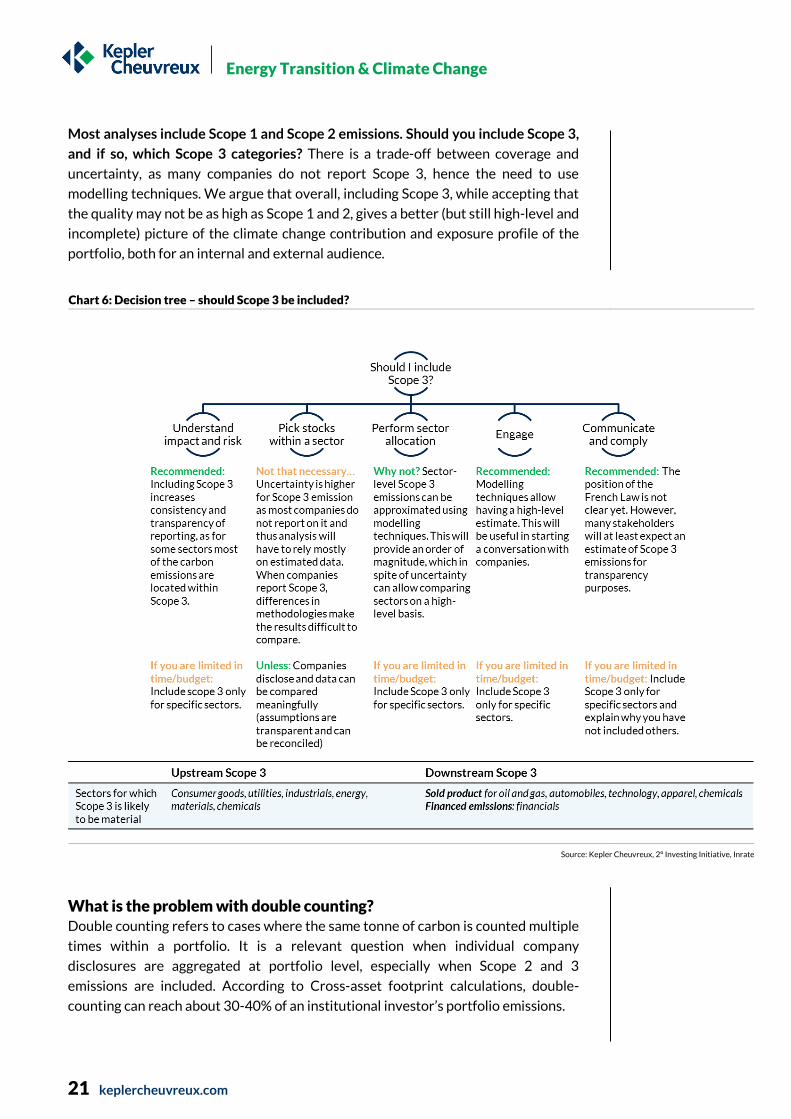
Most analyses include Scope 1 and Scope 2 emissions. Should you include Scope 3,
and if so, which Scope 3 categories? There is a trade-off between coverage and
uncertainty, as many companies do not report Scope 3, hence the need to use
modelling techniques. We argue that overall, including Scope 3, while accepting that
the quality may not be as high as Scope 1 and 2, gives a better (but still high-level and
incomplete) picture of the climate change contribution and exposure profile of the
portfolio, both for an internal and external audience.
Chart 6: Decision tree – should Scope 3 be included?
Source: Kepler Cheuvreux, 2° Investing Initiative, Inrate
What is the problem with double counting? Double counting refers to cases where the same tonne of carbon is counted multiple
times within a portfolio. It is a relevant question when individual company
disclosures are aggregated at portfolio level, especially when Scope 2 and 3
emissions are included. According to Cross-asset footprint calculations, double-
counting can reach about 30-40% of an institutional investor’s portfolio emissions.

Energy Transition & Climate Change
22 keplercheuvreux.com
Expert track: when does double-counting occur?
There are several types of double-counting which occur as soon as Scope 2, and
Scope 3 emissions are introduced. The variety of types and magnitude of emissions
double counted increase with the comprehensiveness of approach in terms of
Scopes and types of assets accounted. It can reach about 30-40% at the level of an
institutional investors’ portfolio, according to Cross-asset footprint calculations.
Chart 7: How can double counting occur?
Source: 2° Investing Initiative
Is there a high risk of double counting occurring in your portfolio? Large and
diversified portfolios, invested in companies at different levels of the value chain and
in industries with a high concentration ratio, are more prone to double counting
when including Scope 2 and 3 emissions.
In practice it is very hard to identify specific supplier-customer relationships for
each company in a portfolio. Eliminating double counting may lead to an over or
underestimation of the footprint, as its premise is based on the fact that the
portfolio is invested in both the buyer and supplier company.
For this reason, we believe it may not be that important depending on what you are
trying to achieve with your assessment, as shown in Chart 8.
For this reason, we believe double counting may not be that important, depending on what you are trying to achieve with your assessment
Double counting is a relevant question when individual company disclosures are aggregated at portfolio level, especially when Scope 2 and 3 emissions are included

Energy Transition & Climate Change
23 keplercheuvreux.com
Chart 8: Decision tree – is double counting really a problem?
Source: Kepler Cheuvreux
We thus believe that in most cases, it is not necessary to avoid double-counting. If
you still want to avoid double-counting, what are your options?
Limit your analysis to Scopes 1 and 2 and report each scope separately: This minimises double counting in relation to Scope 3 but will not get rid of double counting between the company and its electricity provider. Most data providers and investors have chosen this approach so far.
Several data providers have developed methodologies to avoid double counting, including - but not limited to - South Pole Group, Inrate, and Carbone 4. Bear in mind that this introduces distortion and increases uncertainty.
o On upstream Scope 3: Carbone 4 and Mirova, in their Carbon Impact Analytics methodology, divide total carbon figures by three at a portfolio level, in order to eliminate double counting related to energy suppliers, energy and carbon-intensive companies and companies providing equipment and solutions. In practice, this is a simple but uncertain method, as the choice to divide by three has several limitations (e.g. it assumes that the emissions for each of the double counted companies are the same and that all three of the potentially double-counted companies are both listed companies and within the portfolio being analysed).
Limit your analysis to Scopes 1 and 2
Most data providers and investors have chosen this approach

Energy Transition & Climate Change
24 keplercheuvreux.com
o On product-product, product-component: We believe that the Carbone 4 and Mirova methodology is particularly interesting on the issue of double-counting between product/component: it uses value-add in order to allocate induced and avoided emissions between multiple components and an end-product. Value addition can be calculated at company or at a sector level.
o On upstream Scope 3: Methods developed by Inrate and South Pole Group involve identifying, within a given portfolio, all mutual exchanges between industries represented in the portfolio and the related double-counted emissions. This can only be done using an input-output model that tracks these exchanges on average (i.e. no specific supplier-purchaser relationships are utilized). Once the double-counted emissions are identified and quantified, they can be discounted from total gross emissions.
How do I aggregate the results at portfolio level? The simplest carbon footprint measure is total carbon emissions, expressed in
tonnes of carbon dioxide equivalent. It attributes the carbon emissions of the issuer
to each equity investor based on its ownership, for example USD invested/market
capitalisation or USD invested/debt outstanding.
Equation (1) ∑𝑈𝑆𝐷 𝑖𝑛𝑣𝑒𝑠𝑡𝑒𝑑
𝑂𝑤𝑛𝑒𝑟𝑠ℎ𝑖𝑝 𝑚𝑒𝑡𝑟𝑖𝑐𝑖𝑛 ∗ 𝐼𝑠𝑠𝑢𝑒𝑟′𝑠 𝑒𝑚𝑖𝑠𝑠𝑖𝑜𝑛𝑠
This equation calculates the overall footprint of each portfolio and is useful to:
Compare with other absolute numbers, for example to calculate the percentage contribution to the overall finance sector footprint.
Get a sense of the total contribution to climate change that can be used for transparency purposes in communication or for mitigation strategies such as offsetting.
Understand sector and stock allocation effects: Which sector or security contributes the most to the overall footprint?
The figure is absolute and not normalised, and will thus be reflective of the portfolio
size rather than performance. It does not allow for comparison with different
portfolios, a pre-determined benchmark, and/or through time, on a fair basis.
In our opinion, it is useful to decompose the formula between ownership of the company’s sales and the carbon intensity per sales of the issuer to understand underlying differences in company efficiency
The simplest carbon footprint measure is total carbon emissions, expressed in tonnes of carbon dioxide equivalent

Energy Transition & Climate Change
25 keplercheuvreux.com
Expert track: a simple measure?
In our opinion, it is useful to decompose the formula between ownership of the
investee’s sales and the carbon intensity per sales of the investee to understand
underlying differences in company efficiency.
Note that it will yield the same result as equation (1) but will allow for a better
interpretation of the results. The formula could be modified as follow:
Equation (2) ∑USD invested
𝑂𝑤𝑛𝑒𝑟𝑠ℎ𝑖𝑝 𝑚𝑒𝑡𝑟𝑖𝑐∗ sales of issuer ∗
Issuer′s carbon emissions
sales of issuerin
Table 2: What can disaggregating sales tell you? An example with public equity
USDm invested
Market capitalisation
(USDm)
Carbon emissions
(t C02e)
Sales (USDm))
Company efficiency (t/USDm)
Ownership Carbon emissions attributed to the
portfolio
Year 1 Company A 10 30 10,000 10 1,000 0.33 3,333 Company B 1 15 30,000 3 10,000 0.07 2,000 Total 5,333 Year 2 Company A 10 30 10,000 15 667 0.33 3,333 Company B 1 15 30,000 4 7,500 0.07 2,000 Total 5,333
Source: Kepler Cheuvreux
In this example, every variable is held constant. If sales figure were not
disaggregated, one could think that nothing material happened between year 1
and year 2. When disaggregating for sales, the results are the same, but the
improvement in both companies’ carbon performance is clear – the carbon
intensity, or t per USDm revenue, has decreased, showing a positive improvement
in efficiency.
What metric should I use to normalise? Normalising is essential to compare portfolios of different size and through time as
it controls, to a certain extent, variations in other underlying metrics. Absolute
carbon footprint can be normalised by the amount invested using the portfolio value
or the portfolio claim on sales, for example. MSCI recently reviewed the existing
methods – including the pros and cons of each of them (link).
Using the portfolio value as the normalising metric is easier to understand and more
intuitive, and it’s the metric that appears to be preferred by the industry. This shows
the carbon footprint of your money.
However, its simplicity may mask important differences at company level. Using
portfolio claim on sales to normalise adds an additional layer of information that we
recommend analysing.
It maintains the ownership logic (through the concept of claim) but takes into account the carbon efficiency of the company. In particular, it corrects for the biases introduced by market cap and price-to-sales ratio.
It corrects for the company’s size. For example, a larger company tends to have a larger carbon footprint in total; so the same ownership percentage as in a smaller company with a lower footprint will yield a higher carbon metric when normalising by USD invested rather than claims on sales.
Using the portfolio market value as the normalising metric is easier to understand and more intuitive and it’s the metric that appears to be preferred by the industry
This shows the carbon footprint of your money
Energy Transition & Climate Change
26 keplercheuvreux.com
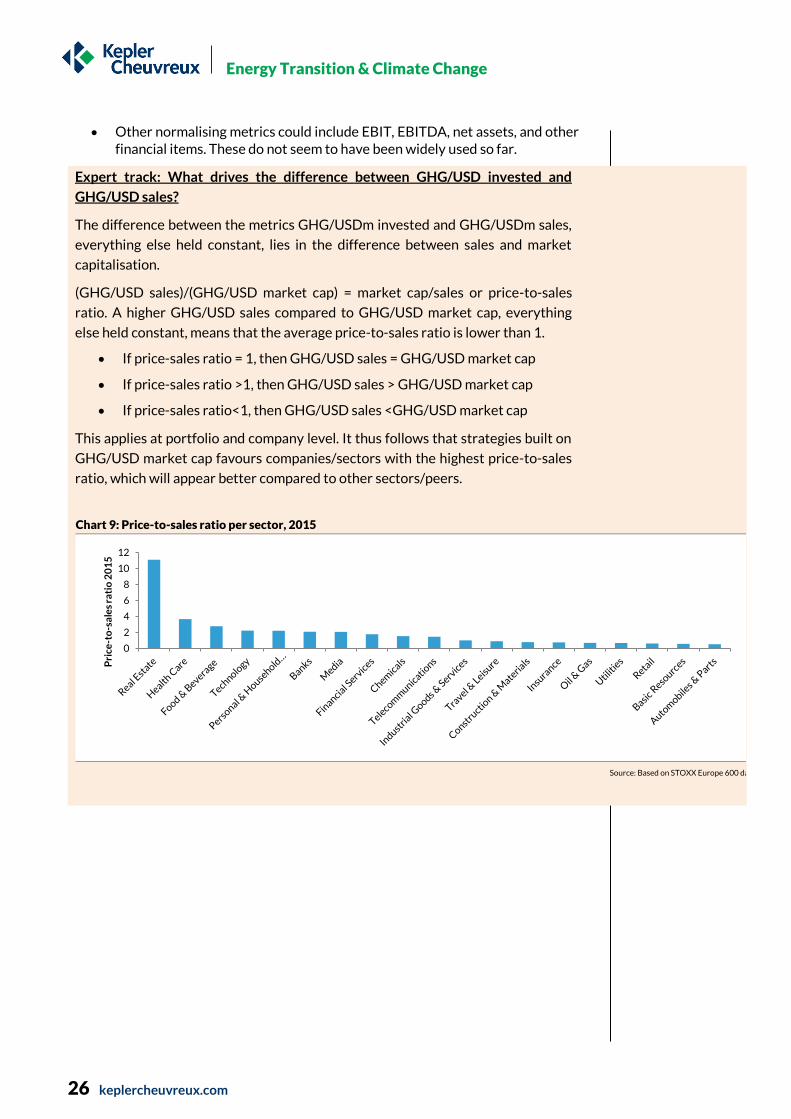
Other normalising metrics could include EBIT, EBITDA, net assets, and other financial items. These do not seem to have been widely used so far.
Expert track: What drives the difference between GHG/USD invested and
GHG/USD sales?
The difference between the metrics GHG/USDm invested and GHG/USDm sales,
everything else held constant, lies in the difference between sales and market
capitalisation.
(GHG/USD sales)/(GHG/USD market cap) = market cap/sales or price-to-sales
ratio. A higher GHG/USD sales compared to GHG/USD market cap, everything
else held constant, means that the average price-to-sales ratio is lower than 1.
If price-sales ratio = 1, then GHG/USD sales = GHG/USD market cap
If price-sales ratio >1, then GHG/USD sales > GHG/USD market cap
If price-sales ratio<1, then GHG/USD sales <GHG/USD market cap
This applies at portfolio and company level. It thus follows that strategies built on
GHG/USD market cap favours companies/sectors with the highest price-to-sales
ratio, which will appear better compared to other sectors/peers.
Chart 9: Price-to-sales ratio per sector, 2015
Source: Based on STOXX Europe 600 data
0
2
4
6
8
10
12
Pri
ce-t
o-s
ale
s ra
tio
20
15

Energy Transition & Climate Change
27 keplercheuvreux.com
Claim on sales is also an imperfect metric. Revenue may vary due to different
pricing policies, either strategy (e.g. luxury industry), regulations (e.g. energy
company in different markets) or simply exchange rates. Using sales data instead of
physical metrics favours companies with a higher pricing level than their peers,
leading to lower carbon intensity (per USDm sales). For example, a luxury car
company may have a lower carbon intensity per USDm sales compared to a peer
with lower prices, even if the carbon intensity per production unit is the same. By
extension, this is true at a portfolio level.
This question mirrors the debate between the use of life-cycle analysis metrics or
environmentally-extended environmental input-output data in order to model data
gaps at company level.
Sales metrics are only a proxy for performance and more sophisticated analysis
may want to incorporate physical production data. This is not always possible.
Few companies report physical production metrics that can be used. This is limited to certain sectors such as Tobacco, Beverages, Utilities, Construction, Telecommunications and Aviation. Even when reported, the metrics may not be homogeneous – for example, in the beverage industry, the metric ‘litres of beer’ is very different from that of ‘litres of distilled product’.
In addition, it is harder to apply for large, diversified companies that operate across sectors (e.g. Siemens).
Expert track: Illustrative example
Chart 10: What’s going on?
Source: Kepler Cheuvreux worked example
In the example above:
Telco 2 has a higher GHG intensity per USDm sales However, it uses 63% less energy per customer Lower average revenue per customer (larger effect) Lower energy efficiency (0.31 vs. 0.23 kg per Kwh) (smaller effect)
Why is that? Telco 1 is mainly based in North America while Telco 2 operates in
different regions with a dirtier energy mix.
0
10
20
30
40
50
60
70
80
Scope 1 + 2 intensity (t/m$) Energy use per customer (kwH) Kg C02 per customer
Telco 1 Telco 2
Using sales data instead of physical metrics favours companies with higher pricing level/margins than their peers By extension, this is true at portfolio level
Telco 2 has a higher intensity than Telco 1...
... but uses less energy
per customer...
... and emits less C02e per
customer

Energy Transition & Climate Change
28 keplercheuvreux.com
Table 3: Example of production metrics reported by companies
Sector Production metric
Tobacco mt tobacco product, cigarettes Beverages million litres of beer, distiller product Automobile manufacturing million cars Utilities kwh, m3 wastewater treated, tonnes of waste treated Real estate m2 floor space Retail m2 floor space Office m2 floor space, per employees Telecommunication gigabytes, customer, kwh Aviation passenger.km
Source: Kepler Cheuvreux
Ownership-based versus exposure metrics The metrics discussed above are vulnerable to noise introduced by the ownership
metric used in the calculation (e.g. for listed equity, USD invested per market
capitalisation). In addition, one may argue that climate-related risk is greater for
companies with higher carbon intensity, regardless of its market capitalisation. For
these reasons, some investors have started advocating for the use of another metric,
the ‘weighted average carbon intensity’.
Equation (3) ∑ 𝑃𝑜𝑟𝑡𝑓𝑜𝑙𝑖𝑜 𝑤𝑒𝑖𝑔ℎ𝑡 ∗ 𝐼𝑠𝑠𝑢𝑒𝑟′𝑠 𝑒𝑚𝑖𝑠𝑠𝑖𝑜𝑛𝑠
𝐼𝑠𝑠𝑢𝑒𝑟′𝑠 𝑠𝑎𝑙𝑒𝑠𝑖𝑛
This metric is disconnected from ownership and thus does not capture the investor’s
contribution to climate change, but rather measures the portfolio’s exposure to
carbon-intensive companies.
Chart 11: What does the comparison between metrics tell us?
Source: Kepler Cheuvreux
0
50
100
150
200
250
300
350
400
450
500
0 1 2 3
tC0
2e
$ m invested $ m sales Weighted average carbon intensity
- Higher share of portfolio 1 is invested in carbon-intensive companies compared to portfolios 2 and 3 (orange triangle), indicating a potentially higher risk.
- Portfolio 1 has a larger share of ownership in relatively more efficient companies in terms of carbon intensity (per USDm sales) (blue rectangle). Price-sales ratio <1 so footprint/USDm sales is lower than footprint/USDmarket cap.
Portfolio number:
Some investors have started advocating for the use of another metric, the ‘weighted average carbon intensity’
Energy Transition & Climate Change
29 keplercheuvreux.com
Our suggested approach A survey conducted by MSCI found that out of the 16 asset owners and managers
interviewed in May 2015, 31% found that carbon emissions per USDm invested was
the most important metric, 25% carbon emissions per USD sales, 25% weighted
average carbon intensity and 19% total carbon emissions. In practice, we argue that
these metrics may be used together for a better understanding of the results.
As a first step, we suggest calculating the absolute and relative footprint of the portfolio, normalised by USD invested and claims on sales, as well as the weighted average carbon intensity. This can inform comparisons with another portfolio or benchmark.
As a next step, the sector allocation and stock selection effect may be investigated to understand what sector or stock (recognising that some may be modelled in the absence of data disclosure) is driving the results. Finally, for selected homogeneous stocks and sectors, the carbon intensity per unit of output is recommended to control for price effects.
When using the data for stock picking or engagement, we argue that more information on the company needs to be collected, such as information on its business model (is the company vertically integrated or does it outsource all of its production?), in order to understand what drives the carbon footprint at company level.

Energy Transition & Climate Change
30 keplercheuvreux.com
Table 4: Each metric highlights an important aspect of the footprint
1. Absolute 2. Normalised by portfolio market
value
3. Normalised by portfolio claim
on sales
4. Weighted average carbon intensity
What does it tell you? Question answered What is my portfolio's
absolute carbon footprint? What is my normalised carbon footprint per USDm invested?
How efficient is my portfolio in terms of carbon emissions per unit of output?
What is my portfolio’s exposure to carbon-intensive companies?
Metrics
t C02e t C02e/USDm invested t C02e/USDm sales t C02e/USDm sales
What can you use it for? Comparison across portfolios/against a benchmark
No: does not take size into account
Yes, adjusts for portfolio size Yes, adjusts for portfolio and investees' size
Yes
Comparison through time
No Yes Yes Yes
Portfolio decomposition and attribution analysis
Yes Yes Yes Yes
Communication Easier Average Harder Easier What are the methodological considerations? Data needs
Medium: capital invested, market capitalisation, carbon emissions of the issuer.
Medium: capital invested, market capitalisation, carbon emissions of the issuer.
Higher: capital invested, market capitalisation, carbon emissions of the issuer, sales of the issuer.
Lower: carbon emissions of the issuer, sales of the issuer, portfolio weights
Sensitivity Sensitive to changes in market capitalisation. Can be controlled by keeping ownership metric constant (if the fluctuation in market capitalisation is only due to price changes). Sensitive to currency fluctuations.
Sensitive to changes in market capitalisation. Can be controlled by keeping ownership metric constant (if the fluctuation in market capitalisation is only due to price changes). Sensitive to currency fluctuations.
Sensitive to changes in market capitalisation. Can be controlled by keeping ownership metric constant (if the fluctuation in market capitalisation is only due to price changes). Sensitive to changes in the ratio sales to market capitalisation. Sensitive to currency fluctuations. Sensitive to changes in sales.
Sensitive to outliers. Not sensitive to changes in market capitalisation.
Linked to investment strategy
Yes, through the concept of ownership but less explicit.
Yes, through the concept of ownership.
Yes, through the concept of ownership but less explicit.
No
Sector allocation contribution
Stock selection contribution 1. Carbon intensity per unit of output
2. Business model of the company
Source: Based on MSCI
Refine the analysis and investigate:

Energy Transition & Climate Change
31 keplercheuvreux.com
What about other asset classes? While the overwhelming majority of carbon footprint analysis has been done on
publicly-listed equity portfolio so far, asset owners and data providers are
investigating methodologies that could be applied to other asset classes, such as
fixed income, private equity and sovereign bonds.
When calculating the footprint of a multi-asset portfolio, questions arise around
double counting. Our recommendations around double counting between Scopes 1,
2, and 3 apply in this case as well (Chart 8).
Table 5: Extending the analysis to other asset classes
Data availability
Fixed income Use the same carbon data as public equity. Allocating carbon emissions to fixed income requires additional data on the liabilities of the investee and the market price of its shares and bonds.
Private equity Lower availability of environmental data. Estimation techniques based on sectors can be used. An alternative consists in contacting the company to run a corporate carbon footprint.
Sovereign bond For Scopes 1 and 2, emission data of the government organisation, allocated based on the % financed out of the total financial balance of the country (or national debt). For Scope 3, country level emissions can be used. The question revolves around the choice between emissions produced on the territory or emissions due to the consumption of goods and services within a country but potentially emitted outside of the national territory.
Project finance, infrastructure Methodologies exist to assess the carbon footprint of such projects throughout their lifetime, usually developed and used by Development Banks.
Real estate Methodologies are moving quickly towards unified metrics (C02e/m2, CO2e/kWh). Initiatives such as GRESB is a potential data source.
Double counting
Option 1 Accept double counting: for example, 100% of the investees’ carbon footprint is allocated to equity, and another 100% is allocated to debt holders.
Option 2 For double counting between fixed income and equity, an alternative method is the “Share of investment approach”. The carbon footprint is allocated between equity and debt-holders based on enterprise value. Note that no method has been developed to avoid double counting between other asset classes to our knowledge, apart from restricting the analysis’ perimeter to Scopes 1 and 2.
Source: Kepler Cheuvreux
Treshold Group and Trucost released a whitepaper recently for consultation on the
carbon footprint of derivatives of listed equities, corporate bonds and indexes (link).
Expert track: let’s deep-dive into enterprise value! Enterprise value has been suggested as an alternative allocation metric to avoid
double counting between equity and fixed income. As highlighted before, we note
that the only use case for allocating emissions between equity and fixed income is
to disclose climate change contribution at portfolio level.
Enterprise value is an imperfect metric.
In the enterprise value calculation, “cash” is subtracted from debt. This creates a bias in the calculation, as the enterprise value may be negative in certain cases.
Two companies may have the same carbon intensity but may be leveraged in different ways, thus leading to different intensities when calculated from the equity or the bond perspective. This creates an artificial difference, solely due to leverage and not to real-world use of funds.
Enterprise value has been suggested as an alternative allocation metric to avoid double counting between equity and fixed income
When calculating the footprint of a multi-asset portfolio, questions arise around double counting Our recommendations around double counting between Scopes 1, 2, and 3 apply in this case as well
Energy Transition & Climate Change
32 keplercheuvreux.com
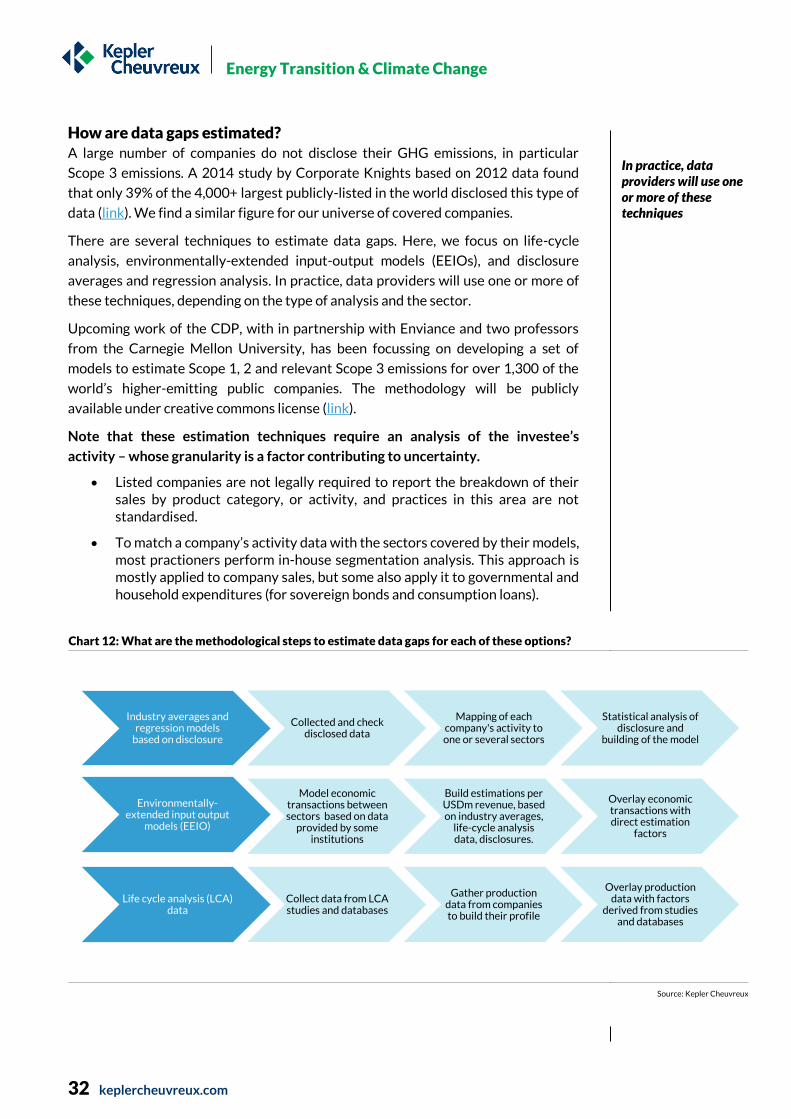
How are data gaps estimated? A large number of companies do not disclose their GHG emissions, in particular
Scope 3 emissions. A 2014 study by Corporate Knights based on 2012 data found
that only 39% of the 4,000+ largest publicly-listed in the world disclosed this type of
data (link). We find a similar figure for our universe of covered companies.
There are several techniques to estimate data gaps. Here, we focus on life-cycle
analysis, environmentally-extended input-output models (EEIOs), and disclosure
averages and regression analysis. In practice, data providers will use one or more of
these techniques, depending on the type of analysis and the sector.
Upcoming work of the CDP, with in partnership with Enviance and two professors
from the Carnegie Mellon University, has been focussing on developing a set of
models to estimate Scope 1, 2 and relevant Scope 3 emissions for over 1,300 of the
world’s higher-emitting public companies. The methodology will be publicly
available under creative commons license (link).
Note that these estimation techniques require an analysis of the investee’s
activity – whose granularity is a factor contributing to uncertainty.
Listed companies are not legally required to report the breakdown of their sales by product category, or activity, and practices in this area are not standardised.
To match a company’s activity data with the sectors covered by their models, most practioners perform in-house segmentation analysis. This approach is mostly applied to company sales, but some also apply it to governmental and household expenditures (for sovereign bonds and consumption loans).
Chart 12: What are the methodological steps to estimate data gaps for each of these options?
Source: Kepler Cheuvreux
Industry averages and regression models
based on disclosure
Collected and check disclosed data
Mapping of each company's activity to one or several sectors
Statistical analysis of disclosure and
building of the model
Environmentally-extended input output
models (EEIO)
Model economic transactions between sectors based on data
provided by some institutions
Build estimations per USDm revenue, based on industry averages,
life-cycle analysis data, disclosures.
Overlay economic transactions with direct estimation
factors
Life cycle analysis (LCA) data
Collect data from LCA studies and databases
Gather production data from companies to build their profile
Overlay production data with factors
derived from studies and databases
In practice, data providers will use one or more of these techniques
Energy Transition & Climate Change
33 keplercheuvreux.com
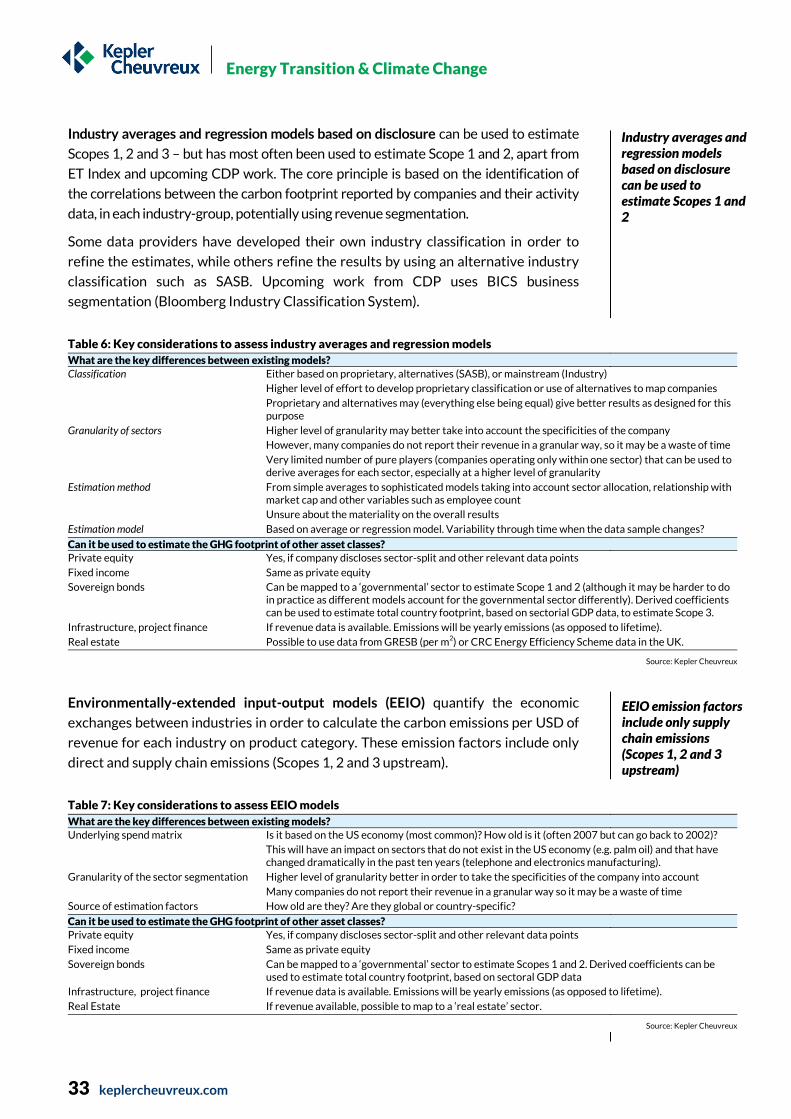
Industry averages and regression models based on disclosure can be used to estimate
Scopes 1, 2 and 3 – but has most often been used to estimate Scope 1 and 2, apart from
ET Index and upcoming CDP work. The core principle is based on the identification of
the correlations between the carbon footprint reported by companies and their activity
data, in each industry-group, potentially using revenue segmentation.
Some data providers have developed their own industry classification in order to
refine the estimates, while others refine the results by using an alternative industry
classification such as SASB. Upcoming work from CDP uses BICS business
segmentation (Bloomberg Industry Classification System).
Table 6: Key considerations to assess industry averages and regression models
What are the key differences between existing models?
Classification Either based on proprietary, alternatives (SASB), or mainstream (Industry)
Higher level of effort to develop proprietary classification or use of alternatives to map companies
Proprietary and alternatives may (everything else being equal) give better results as designed for this purpose
Granularity of sectors Higher level of granularity may better take into account the specificities of the company
However, many companies do not report their revenue in a granular way, so it may be a waste of time
Very limited number of pure players (companies operating only within one sector) that can be used to derive averages for each sector, especially at a higher level of granularity
Estimation method From simple averages to sophisticated models taking into account sector allocation, relationship with market cap and other variables such as employee count
Unsure about the materiality on the overall results
Estimation model Based on average or regression model. Variability through time when the data sample changes?
Can it be used to estimate the GHG footprint of other asset classes?
Private equity Yes, if company discloses sector-split and other relevant data points
Fixed income Same as private equity
Sovereign bonds Can be mapped to a ‘governmental’ sector to estimate Scope 1 and 2 (although it may be harder to do in practice as different models account for the governmental sector differently). Derived coefficients can be used to estimate total country footprint, based on sectorial GDP data, to estimate Scope 3.
Infrastructure, project finance If revenue data is available. Emissions will be yearly emissions (as opposed to lifetime).
Real estate Possible to use data from GRESB (per m2) or CRC Energy Efficiency Scheme data in the UK.
Source: Kepler Cheuvreux
Environmentally-extended input-output models (EEIO) quantify the economic
exchanges between industries in order to calculate the carbon emissions per USD of
revenue for each industry on product category. These emission factors include only
direct and supply chain emissions (Scopes 1, 2 and 3 upstream).
Table 7: Key considerations to assess EEIO models
What are the key differences between existing models?
Underlying spend matrix Is it based on the US economy (most common)? How old is it (often 2007 but can go back to 2002)?
This will have an impact on sectors that do not exist in the US economy (e.g. palm oil) and that have changed dramatically in the past ten years (telephone and electronics manufacturing).
Granularity of the sector segmentation Higher level of granularity better in order to take the specificities of the company into account
Many companies do not report their revenue in a granular way so it may be a waste of time
Source of estimation factors How old are they? Are they global or country-specific?
Can it be used to estimate the GHG footprint of other asset classes?
Private equity Yes, if company discloses sector-split and other relevant data points
Fixed income Same as private equity
Sovereign bonds Can be mapped to a ‘governmental’ sector to estimate Scopes 1 and 2. Derived coefficients can be used to estimate total country footprint, based on sectoral GDP data
Infrastructure, project finance If revenue data is available. Emissions will be yearly emissions (as opposed to lifetime).
Real Estate If revenue available, possible to map to a ‘real estate’ sector.
Source: Kepler Cheuvreux
Industry averages and regression models based on disclosure can be used to estimate Scopes 1 and 2
EEIO emission factors include only supply chain emissions (Scopes 1, 2 and 3 upstream)

Energy Transition & Climate Change
34 keplercheuvreux.com
Expert track: are there any publicly-available models I can use?
Most EEIO models are proprietary. The Carnegie Mellon University model is free
to use directly on their website, although for non-commercial use (link). The model
covers 428 sectors and estimates the full upstream (supply chain) emissions. The
main caveats of this model are:
The economic exchange data that underpins the model are based on the US economy. It can be used as a proxy for other countries but this will introduce errors when modelling Scope 2 emissions (due to different country electricity mix, if not adjusted) and sectors that do not exist in the US (e.g. palm oil).
The model is based on 2002 data and does not take inflation into account. This may not be a problem if the user inputs deflated revenue data. Some sectors have dramatically changed since then (e.g. telephone apparatus manufacturing).
All Scope 3 upstream and Scope 2 emissions are aggregated. The model can be used for Scope 2 and upstream Scope 3 emissions only.
Life-cycle analysis (LCA) provides emission factors per unit of output for each stage
of the life-cycle and can therefore be used to estimate each scope (Scopes 1, 2, and 3,
both upstream and downstream). Carbon data exist for most types of raw material
(e.g. barrels of oil, tonnes of cement) and manufactured product (e.g. car, appliances).
Analysts need to be careful when processing the data to make sure it is comparable
– even though the LCA route may not make sense for investors trying to do their
portfolio carbon footprint due to the difficulties and time involved. LCA-based
analysis may be more useful for other asset classes (e.g. project finance).
Expert track: Where can I find life-cycle analysis data?
Potential sources of life-cycle analysis emission factors include:
A list of life-cycle databases that can be found on the GHG Protocol website (link).
The GHG Protocol, which also provides excel-based tools to calculate emissions in the following sectors: Adipic Acid, Nitric Acid, Aluminum, Pulp and Paper, Ammonia, Refrigeration and Air-conditioning equipment, cement, semi-conductors, HCFC-22, Iron and Steel, lime and wood products.
A well know database, Ecoinvent (not free, can be accessed online or through life-cycle analysis softwares such as Gabi or Simapro).
Defra, which provides emission factors for some Scope 3 categories, including purchased goods and services and waste generation (link).
The GHG Protocol, in partnership with Quantis, offers a free, web-based tool to calculate Scope 3 emissions at investee-level (link).
Life-cycle emission factors provide emission factors per unit of output for each stage of the life-cycle and therefore each scope
Most EEIO models are proprietary

Energy Transition & Climate Change
35 keplercheuvreux.com
Chart 13: Pros and cons of each estimation method
Source: Kepler Cheuvreux, 2° Investing Initiative
There is a trade-off between granularity and level of effort in the choice of
estimation methods. What can be done? These techniques differ in complexity and
coverage and we believe they are best used in combination.
In the choice between disclosure averages and more sophisticated methods such as EEIO models and life-cycle analysis data, it depends on how diversified the company is, how granular the industry classification is, and how many disclosures were used when deriving the industry averages. We would argue that disclosure averages are good as a first ‘screen’ for Scope 1 and Scope 2 emissions. It may be harder to apply these averages to Scope 3 emissions due to a lack of disclosures, although some providers have developed methodologies along these lines.
EEIO models are a more sophisticated way to estimate gaps, based on industry averages. They offer a good alternative to industry averages for Scope 3 emissions in particular. However, compared to LCA, the use of monetary metrics (revenue/price) as an input in the model may distort the results, due to different pricing strategies.
As a conclusion, we would recommend starting with estimates derived from EEIO
models or averages, as a first screen. The second step is to overwrite high-footprint
sectors with production-based data for Scope 1, 2 and upstream Scope 3 emissions,
where possible. LCAs can also be used to estimate downstream Scope 3 emissions.
Tradeoff between granularity and level of effort in the choice of methods
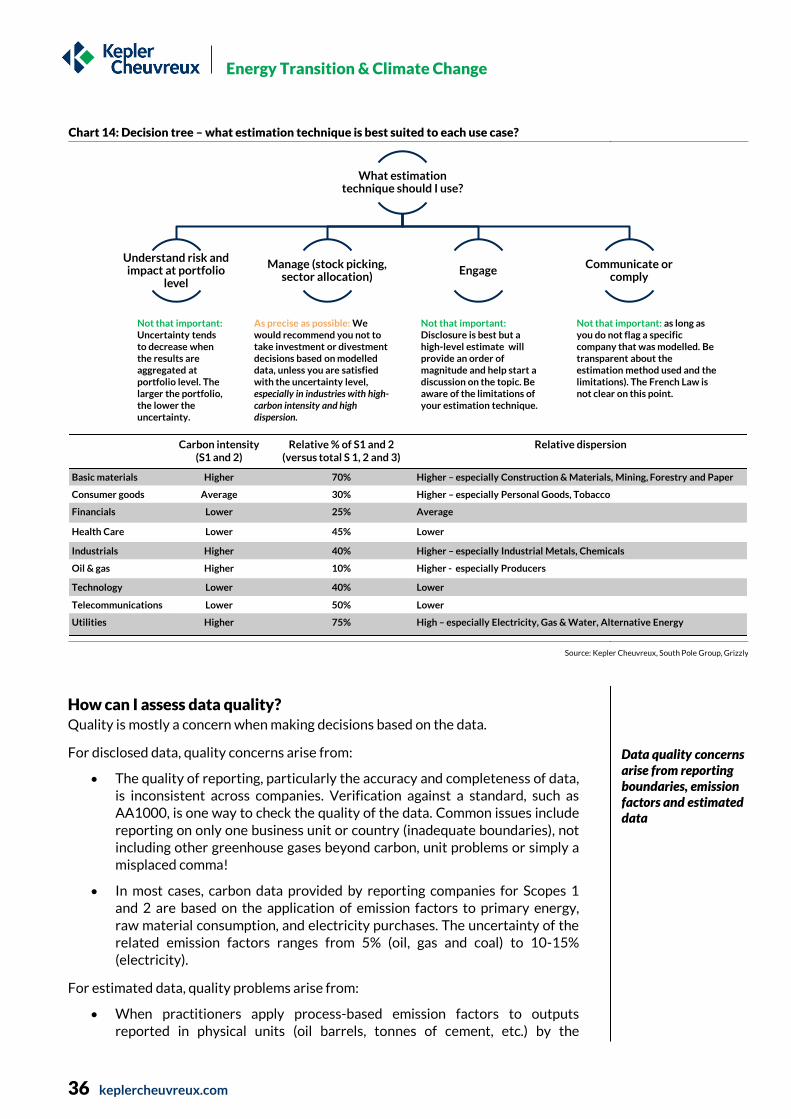
Energy Transition & Climate Change
36 keplercheuvreux.com
Chart 14: Decision tree – what estimation technique is best suited to each use case?
Source: Kepler Cheuvreux, South Pole Group, Grizzly
How can I assess data quality? Quality is mostly a concern when making decisions based on the data.
For disclosed data, quality concerns arise from:
The quality of reporting, particularly the accuracy and completeness of data, is inconsistent across companies. Verification against a standard, such as AA1000, is one way to check the quality of the data. Common issues include reporting on only one business unit or country (inadequate boundaries), not including other greenhouse gases beyond carbon, unit problems or simply a misplaced comma!
In most cases, carbon data provided by reporting companies for Scopes 1 and 2 are based on the application of emission factors to primary energy, raw material consumption, and electricity purchases. The uncertainty of the related emission factors ranges from 5% (oil, gas and coal) to 10-15% (electricity).
For estimated data, quality problems arise from:
When practitioners apply process-based emission factors to outputs reported in physical units (oil barrels, tonnes of cement, etc.) by the
What estimation technique should I use?
Understand risk and impact at portfolio
level
Manage (stock picking, sector allocation)
EngageCommunicate or
comply
Not that important: Uncertainty tends to decrease when the results are aggregated at portfolio level. The larger the portfolio, the lower the uncertainty.
Not that important: Disclosure is best but a high-level estimate will provide an order of magnitude and help start a discussion on the topic. Be aware of the limitations of your estimation technique.
Not that important: as long as you do not flag a specific company that was modelled. Be transparent about the estimation method used and the limitations). The French Law is not clear on this point.
As precise as possible: We would recommend you not to take investment or divestment decisions based on modelled data, unless you are satisfied with the uncertainty level, especially in industries with high-carbon intensity and high dispersion.
Carbon intensity (S1 and 2)
Relative % of S1 and 2 (versus total S 1, 2 and 3)
Relative dispersion
Basic materials Higher 70% Higher – especially Construction & Materials, Mining, Forestry and Paper
Consumer goods Average 30% Higher – especially Personal Goods, Tobacco
Financials Lower 25% Average
Health Care Lower 45% Lower
Industrials Higher 40% Higher – especially Industrial Metals, Chemicals
Oil & gas Higher 10% Higher - especially Producers
Technology Lower 40% Lower
Telecommunications Lower 50% Lower
Utilities Higher 75% High – especially Electricity, Gas & Water, Alternative Energy
Data quality concerns arise from reporting boundaries, emission factors and estimated data

Energy Transition & Climate Change
37 keplercheuvreux.com
companies, the level of uncertainty varies greatly between types of products and industries. In many cases, the precision of activity data reported necessitates the use of industry averages rather than process-specific factors, which in turn leads to additional uncertainty (in some industries differences between old/innovative processes can be as high as 100% compared to the benchmark).
EEIO and regression-models are top-down and bottom-up approaches used to derive averages, which can lead to significant over or under-estimations.
Does it still make sense for investors to implement a best-in-class methodology
given the level of uncertainties? We believe that it does, as long as there is an
understanding of how uncertain the results are. There are several methods to limit
the risk of error, assess and quantify uncertainty, including data checks, back-testing
estimated data against disclosure, outlier analysis, uncertainty analysis and
sensitivity analysis.
Chart 15: Sources of uncertainty and methods to estimate it
Source: Kepler Cheuvreux
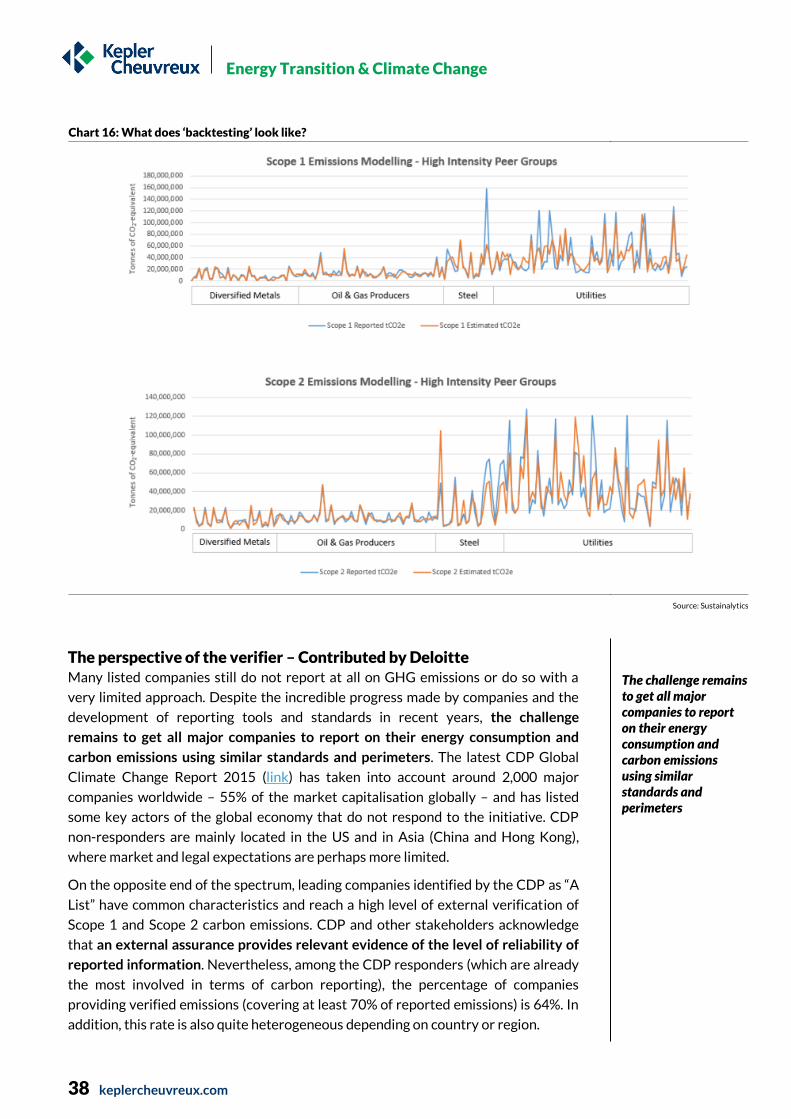
Energy Transition & Climate Change
38 keplercheuvreux.com
Chart 16: What does ‘backtesting’ look like?
Source: Sustainalytics
The perspective of the verifier – Contributed by Deloitte Many listed companies still do not report at all on GHG emissions or do so with a
very limited approach. Despite the incredible progress made by companies and the
development of reporting tools and standards in recent years, the challenge
remains to get all major companies to report on their energy consumption and
carbon emissions using similar standards and perimeters. The latest CDP Global
Climate Change Report 2015 (link) has taken into account around 2,000 major
companies worldwide – 55% of the market capitalisation globally – and has listed
some key actors of the global economy that do not respond to the initiative. CDP
non-responders are mainly located in the US and in Asia (China and Hong Kong),
where market and legal expectations are perhaps more limited.
On the opposite end of the spectrum, leading companies identified by the CDP as “A
List” have common characteristics and reach a high level of external verification of
Scope 1 and Scope 2 carbon emissions. CDP and other stakeholders acknowledge
that an external assurance provides relevant evidence of the level of reliability of
reported information. Nevertheless, among the CDP responders (which are already
the most involved in terms of carbon reporting), the percentage of companies
providing verified emissions (covering at least 70% of reported emissions) is 64%. In
addition, this rate is also quite heterogeneous depending on country or region.
The challenge remains to get all major companies to report on their energy consumption and carbon emissions using similar standards and perimeters

Energy Transition & Climate Change
39 keplercheuvreux.com
Table 8:External verification rates vary by country
Country/Region Number of CDP responders % of external verification of scopes 1 & 2 disclosed carbon
emissions
France 95 88% Korea 74 86% Spain 42 86% Ireland 11 82% Portugal 11 82% Italy 47 81% South Africa 74 77% Hong Kong & South East Asia 42 71% Benelux 47 70% India 49 67% UK 232 66% USA 334 65% Latin America 25 64% Japan 230 63% Nordics 147 59% Austria, Germany & Switzerland 155 58% Australia / NZ 97 57% Brazil 55 49% Canada 100 49% Turkey 30 47% Central & Eastern Europe 7 22%
Source: CDP Global Climate Change Report
A relevant and reliable GHG emission reporting requires transparency on
assumptions and methodologies used, especially regarding the following key
aspects:
Reporting boundaries and periods and gaps with financial information should be disclosed and explained.
Reporting criteria or guidelines have to be available to stakeholders and key characteristics may be part of the disclosed information.
Compliance with an external guidance or protocol (such as GHG Protocol) is a sign of quality, particularly if an external assurance is provided.
Estimates and avoided emissions are very sensitive to hypotheses and reference data. The use of such information must be done in a particularly precautious manner.
Expert track: Key concepts regarding assurance
According to the International Framework for Assurance Engagements proposed by
the IAASB (International Auditing and Assurance Standards Board), an
“Assurance engagement” means “an engagement in which a practitioner (e.g. an
auditor) expresses a conclusion (within an assurance report) designed to enhance
the degree of confidence of the intended users (e.g. the shareholders) other than the
responsible party (e.g. the reporting company) about the outcome of the evaluation
or measurement of a subject matter (e.g. GHG emissions) against criteria (e.g.
guidelines to establish GHG emissions)”.
The practitioner is required to observe the fundamental ethical principles of the
professional Ethics Codes, including: Integrity; Objectivity; Professional
competence and due care; Confidentiality; and Professional behavior. The
practitioner gathers sufficient appropriate evidence to provide a reasonable
Energy Transition & Climate Change
40 keplercheuvreux.com
basis for expressing a conclusion in an assurance report.
Two types of assurance engagement can be performed: a reasonable assurance
engagement and a limited assurance engagement.
The objective of a reasonable assurance engagement is a reduction in assurance engagement risk to an acceptably low level in the circumstances of the engagement as the basis for a positive form of expression of the practitioner’s conclusion. For example: “In our opinion internal control is effective, in all material respects, based on XYZ criteria.”
The objective of a limited assurance engagement is a reduction in assurance engagement risk to a level that is acceptable in the circumstances of the engagement, but where that risk is greater than for a reasonable assurance engagement, as the basis for a negative form of expression of the practitioner’s conclusion. For example, “Based on our work described in this report, nothing has come to our attention that causes us to believe that internal control is not effective, in all material respects, based on XYZ criteria.”
The level of assurance is not an evaluation or a result of the degree of compliance
of the subject matter with the criteria but rather a level of confidence depending
on the diligence performed by the auditor (and decided at the beginning of the
assignment).
The subject matter must be appropriate, which means:
Identifiable, and capable of consistent evaluation or measurement against the identified criteria; and
Such that the information about it can be subjected to procedures for gathering sufficient appropriate evidence to support a reasonable assurance or limited assurance conclusion, as appropriate.
The criteria must be suitable, which means it must exhibit the following
characteristics:
Relevance: relevant criteria contribute to conclusions that assist decision-making by the intended users.
Completeness: criteria are sufficiently complete when relevant factors that could affect the conclusions in the context of the engagement circumstances are not omitted. Complete criteria include, where relevant, benchmarks for presentation and disclosure.
Reliability: reliable criteria allow reasonably consistent evaluation or measurement of the subject matter including, where relevant, presentation and disclosure, when used in similar circumstances by similarly qualified practitioners.
Neutrality: neutral criteria contribute to conclusions that are free from bias.
Understandability: understandable criteria contribute to conclusions that are clear, comprehensive, and not subject to significantly different interpretations.

Energy Transition & Climate Change
41 keplercheuvreux.com
The evaluation or measurement of a subject matter on the basis of the
practitioner’s own expectations, judgments and individual experience would not
constitute suitable criteria.
Within the International Framework of Assurance Engagements, two specific
assurance standards developed by the IAASB are used for non-financial information:
ISAE3000: Assurance engagements other than audits or reviews of historical financial information – used to provide assurance on ESG information;
ISAE3410: Assurance engagements on GHG statements – dedicated to carbon emissions and used jointly with ISAE3000.

En
erg
y T
ran
sition
& C
lima
te C
ha
ng
e
42
k
ep
lerch
eu
vre
ux
.com
Chart 17: Tasks performed by the auditor
Source: Deloitte, based on ISAE 3000 & 3410
Assessing the suitability of the criteria, testing the
consistency with the five principles: Relevance,
Completeness, Reliability, Neutrality, Understandability.
• Based on ISAE 3000 & 3410, when assessing the suitability of the applicable criteria, the practitioner shall determine whether the criteria encompass at a minimum: The method for determining the entity's organizational boundary; The GHGs to be accounted for; Acceptable quantification methods, including methods for making adjustments to the base year (if applicable); and Adequate disclosures such that intended users can understand the significant judgments made in preparing the GHG statement.
• Definitions, perimeters, periods, scopes, hypotheses and methodologies have to be specified and formalised in a dedicated documentation. This documentation may be publicly available and key characteristics may be part of the disclosed information. Without pressure from an external audit, many reporting companies do not develop formal procedures and report their GHG emissions without disclosing their reporting perimeter, period or emission factors.
Assessing the risks that the subject matter information
may be materially misstated, by understanding the
organisation, the process and the internal control.
• According to ISAE3410, the practitioner shall consider at least the following factors: the likelihood of intentional misstatement in the GHG statement; the likelihood of non-compliance with the provisions of those laws and regulations generally recognised to have a direct effect on the content of the GHG statement; the likelihood of omission of a potentially significant emission; significant economic or regulatory changes; the nature of operations; the nature of quantification methods; the degree of complexity in determining the organizational boundary and whether related parties are involved; whether there are significant emissions that are outside the normal course of business for the entity, or that otherwise appear to be unusual; the degree of subjectivity in the quantification of emissions; whether Scope 3 emissions are included in the GHG statement; and how the entity makes significant estimates and the data on which they are based.
• For GHG emissions, major risks may concern the design efficiency of the reporting tools and the effectiveness of internal control at each step of the reporting process. Mistakes often come from incorrect use of units or emission factors. Risks of misstated information are higher for sensitive information such as avoided emissions or estimates for which specific testing may be necessary (e.g. challenging the neutrality of reference data or hypothesis).
Performing further procedures clearly linked to
the identified risks using a combination of inspection,
observation, confirmation, re-calculation, re-performance,
analytical procedures and inquiry.
• The operating effectiveness of the reporting process can be tested at different levels from the data source (confirmation through energy invoice testing) to the consolidated data (re-calculation, gap analysis, ratios etc.). ISAE3410 lists the type of tests to be perform depending on the assurance engagement (limited or reasonable), covering analytical procedures and procedures regarding estimates to be performed by the practitioner.

Energy Transition & Climate Change
43 keplercheuvreux.com
Overall, delivering assurance to GHG emissions according to international
standards means that:
The quantification methods and reporting policies selected and applied are consistent with the applicable criteria and are appropriate.
Estimates made in preparing the GHG statement are reasonable.
The information presented in the GHG statement is relevant, reliable, complete, comparable and understandable.
The GHG statement provides adequate disclosure of the applicable criteria, and other matters, including uncertainties, such that intended users can understand the important judgments made in its preparation.
The terminology used in the GHG statement is appropriate.
The assurance report discloses key information for users on: the level of the
assurance (limited or reasonable); the scope of the assurance (the assurance may not
cover all the reported emissions); the type of works that have been performed and
their coverage (sites concerned, percentage of data tested, etc.); the conclusion of
the assurance, which may be a qualified opinion (that is to say a limitation of the
assurance).
Expert track: Designing “assurable” portfolio carbon footprinting
Even if providing assurance to a portfolio carbon footprint might not be expected
yet in all jurisdictions, applying assurance principles may lead asset managers and
investors to implement more appropriate methodologies and tools. Audit culture
and principles may help.
Here are some key recommendations while designing or implementing a portfolio
carbon footprint:
Formalise the process in a dedicated written protocol (i.e. a formal “criteria”) which shall include: a description of the process, the definitions of notions and indicators, the sources and methodologies used, the hypotheses and calculations made, the estimate rules, the internal organisation, roles, responsibilities and controls, the expected documentation, etc.
Check the approach regarding the principles for “suitable criteria”: relevance, completeness, reliability, neutrality, understandability.
Avoid “black box” solutions: main characteristics or hypotheses may be documented and available to users.
Take into account the different levels of reliability of GHG emissions reported by companies (perimeter, emission factors, estimations, scopes and level of assurance etc.) – do not take reported data for granted.
Disclose material assumptions used to assess carbon footprint of portfolio.

Energy Transition & Climate Change
44 keplercheuvreux.com
Carbon footprint: an appropriate measure of risk? Carbon footprint is a static measure: it gives a snapshot in time of what the
emissions are for a given asset or portfolio. It is simple, easy to understand and
compare, but it captures only one aspect of the story.
Carbon intensity is an incomplete measure of risk: a forthcoming report from
Grizzly and 2˚ Investing Initiative highlights the weak correlation (circa. 0.2)
between the assessment of the carbon risk exposure of companies and their carbon
intensity.
Additional internal and external factors need to be taken into account:
Internal factors include, among others, past emissions (litigation risk), and locked-in emissions (impairment risk), exposure metrics (e.g. geographical breakdown of sales, supply-chain) and resilience metrics (e.g. cash available, ability to relocate, pricing power).
External factors include policies and regulations, client’s and customers’ sensitivity to climate factors, and vulnerability to extreme climate events.
Not does only carbon footprint need to be overlaid with other information but new
metrics also need to be used to get a better understanding of risk. Here, we explore
methodologies that use carbon footprint as an input into the risk analysis. In later
parts, we study technology/asset-based metrics and benchmarks.
Shadow pricing: multiple applications from price to external cost
Some providers offer to overlay the portfolio footprint results with monetised
values. Two types may be distinguished:
Approximation of what a carbon price may look like.
Simple analysis may just apply a price for carbon to the Scope 1 emissions of a
portfolio, while a more sophisticated one could apply it to multiple scopes and take
into account multiple scenarios, the type of sector, timing and how this additional
cost may be passed through the supply chain based on pricing power and other
fundamental analysis metrics.
Social cost of carbon, reflecting the damage caused to society, or the cost of the carbon externality. This is a measure of value destruction to external stakeholders, which may be compared to financial metrics such as market value of a portfolio or yearly returns.
The best-known study of the social cost of carbon is the Stern Report (link),
published in 2006, which estimated the social cost of climate change to be as large as
5-20% of global GDP. The analysis was updated recently and found to be higher, at
USD32-103 per tonne, likely to rise to USD82-260 in 2035 (link). The US EPA
estimates the cost to be USD40, using a 3% discount rate. If the risk of catastrophic
events is taken into account, a value of USD120 is recommended. These costs also
increase through time (link). Note that another way to estimate the social cost of
carbon is to consider the price needed to reach a pre-set objective (cost-efficiency vs
cost-damage approach).
We explore alternatives and/or complementary metrics in the next chapters
Carbon footprint is an incomplete measure of risk

Energy Transition & Climate Change
45 keplercheuvreux.com
While this metric is a measure of social cost, it can also be used to estimate risk.
Recently, the Economist Intelligence Unit (link) translated what this means to the
asset management industry and estimates the average value at risk to 2100 in
discounted, present value terms, to be at USD4.2trn per year. When tail risks are
taken into account, the authors find that 6˚C of warming represents present value
losses of USD43trn, or 30% of the entire stock of world’s manageable assets.
Increasing momentum at company level: an increasing number of companies are
disclosing their use of internal carbon pricing (link), ranging from USD1 to USD357,
calculated using different methodologies and assumptions, based either on potential
market price, the social cost of carbon or another consideration such as the cost
needed to reach pre-set objectives.
The ‘Microsoft Playbook’ is an example of the latter: based on the organisational
carbon policy and the investment needed to achieve the carbon reduction target, an
internal price is set annually (USD4.4/t in 2015). The fee is charged to each
department based on its energy consumption, consolidated in a fund and reinvested
into energy efficiency, green energy and carbon offset projects.
Table 9: Selected companies that use internal carbon pricing in our universe
Company Sector USD per tonne (2015)
Enagas Utilities 7.86-22.45 EDP Utilities 5.61-67.35 E.ON Utilities 22.45-44.90 Iberdrola Utilities 34 Centrica Utilities 20 ENEL Utilities 12 Statoil Oil & gas 50 ENI Oil & gas 40 Royal Dutch Shell Oil & gas 40 Total Oil & gas 28 WPP Media 45 Sky Media 24 Kering Luxury goods & cosmetics 70 Bic Home & apparel 11;20 Inditex General retail 30 Jeronimo Martins Food retail 6 Holcim Construction & materials 32 AkzoNobel Chemicals 122 Solvay Chemicals 84 Danieli Capital goods 8 CaixaBank Banks 11
Source: CDP (2015)

Energy Transition & Climate Change
46 keplercheuvreux.com
Chart 18: The Microsoft Playbook – an example of integrated shadow pricing
Source: Microsoft Playbook (link)
The return of scoring?
Recently, we have witnessed the return of scoring methodologies that take into
account a wider range of quantitative and qualitative indicators to build a more
complete assessment. These metrics are useful from the perspective of engagement
with companies. For investors interested in climate issues, climate-related
indicators used as inputs in the broader scoring can be isolated to find the climate-
related qualitative score for a company.
Climate scores usually focus on scoring a company’s public climate-related targets
and strategies, together with their actual climate friendliness, assessed on the basis
of carbon and/or green-brown exposure metrics. While climate scores are usually
limited to companies, the Asset Owner Disclosure Project has started adopting this
approach to score institutional investors and publish an annual ranking.
Climate scoring is an effective summary indicator and is likely to offer a more comprehensive overview of the indicators it considers compared to isolated carbon exposure metrics. By extension, a climate rating together with the underlying analysis can potentially provide a more comprehensive picture of a company’s climate performance, and hence potential risk.
Climate-related scoring also faces a number of limitations. First, they are usually subsumed in a broader ESG score. Second, they usually adopt a best-in-class logic within sectors, allowing for example a high score for certain oil and gas companies relating to their peers, even if their business model is fundamentally misaligned with climate goals. Third, the weighting is often subjective, presenting a ‘black-box’ risk.

Energy Transition & Climate Change
47 keplercheuvreux.com
Alternative and complementary metrics Carbon footprinting might be a starting point, under certain conditions and
complementary to other metrics, to inform divestment strategies (at stock or sector
level) but not reinvestments, hence the necessity to derive an understanding of the
positive side of the story.
Beyond divestment, an increasing objective is to reallocate capital to green assets.
For example, a coalition of foundations recently launched a “Divest-Invest”
initiative. This illustrates the growing focus on reporting the positive contribution to
climate performance (+26% between February and July 2015, representing a
EUR19,338 investment by 336 investors, according to Novethic).
If you only have five minutes
Another requirement of the French Law? Point 4 of the decree requires disclosure on the ‘contribution to the energy
transition’. One potential option is to express portfolio performance as a ratio
between measures of ‘friendliness’ in the numerator and some measure of company
or portfolio size, notwithstanding methodological limitations (explored in the next
section). More ambitious metrics would benchmark this against a 2˚ trajectory.
Green-brown share: a maturing family of metrics At the simplest level, recent efforts have focused on deriving ‘green’ and ‘brown’
exposure metrics. These are segmentation indicators that distinguish between
climate solutions and climate risks at technology, company or sector level.
This family of metrics is simple to understand and only requires financial metrics,
such as the percentage of a portfolio invested in ‘green’ technologies, companies, or
sectors. The challenges arise when trying to first ‘qualify’ and second ‘quantify’ what
‘green’ means.
In search of a standard… In our view, conventional industry classifications are not adapted and may only be
used as a high-level screen, to identify brown and grey sectors, at best. Taxonomies
are still poorly developed but new approaches are emerging, led by several
commercial providers such as FTSE and MSCI.
Open-source projects in the field of green bonds are building activity and
technology-specific taxonomies. We believe that one of the most ambitious efforts
in this space is led by the Climate Bonds Initiative.
While these classifications may not be easily applicable to companies due to the lack
of granular reporting, we believe they pave the way for further research in this field
and their findings can be used to derive bespoke taxonomies.
... and supported by a range of metrics After building a green-brown taxonomy, the next step is to derive appropriate
metrics. We argue that these can be classified across two dimensions: point-in-time/
forward-looking and financial/production-based.
At the simplest level, recent efforts have focused on deriving ‘green’ and ‘brown’ exposure metrics These are segmentation indicators that distinguish between climate solutions and climate problems at technology, company or sector level

Energy Transition & Climate Change
48 keplercheuvreux.com
Point-in-time metrics, such as current percentage of EBIT from renewable energy,
provide information on the current investee’s exposure to green-brown themes,
while forward-looking metrics, such as future percentage of EBIT, capex or share of
research & development invested in renewable energy technology, can be
understood as a proxy for future exposure.
Metrics expressed in financial terms (such as sales, EBIT, R&D) are easier to
aggregate at portfolio level, but where possible, for specific sectors, production
metrics may be more appropriate when comparing performance within one sector.
Our experience As part of our previous research (“Reporting on Impact” by Samuel Mary) designed
to identify ‘impact’ stocks within our universe, we built our own taxonomy of green
activities and applied it at company level. We share our thought processes as well as
the challenges we encountered along the way and how we dealt with them.
Can you tell me more about ‘avoided emissions’? The ‘green’ share is a segmentation indicator by itself, but it does not indicate the
magnitude of emissions saved. Some data providers, asset managers and banks have
attempted to quantify avoided emissions attributable to ‘green’ products and
services. While standardised methodologies exist at a project level, this field of
research suffers from a lack of standards at product, company and portfolio level.
The Greenhouse Gas Protocol is working on a research paper that will assess
whether a credible avoided emissions accounting method can be developed and
drive low-carbon product innovation. The first draft is planned for spring 2016.
What can you use it for?
Good for:
Negative/positive screening for project finance and corporate bonds.
Portfolio construction for listed equities together with carbon metrics.
Engagement on different technologies.
‘Avoided emissions’: understanding the magnitude of the positive contribution.
Not so good for:
Systematically comparing companies and sectors, due to a lack of green-brown taxonomy applicable across asset classes and standard for calculating avoided emissions.
Understanding the connection with a scenario shown to feasibly transition to the low-carbon economy.
Improvements needed:
Better, more granular and standardised reporting from investees on green-brown activities (both point-in-time and forward-looking).
Clearer taxonomy of green and brown sectors, activities or technologies.
Standards to calculate avoided emissions at corporate and portfolio level.
As part of our previous research designed to identify ‘impact’ stocks within our universe, we built our own taxonomy of green activities and applied it at company level We share our thought processes as well as the challenges we encountered along the way and how we dealt with them

Energy Transition & Climate Change
49 keplercheuvreux.com
P.50
P.51
P.52
P.54
P.56
P.62
P.66
P.63
P.68
Fasten your seatbelt
In this section, we answer the following questions:
What more can these metrics tell me?
Can I use industry classifications?
What other taxonomies exist?
What are the potential traps to avoid?
Have you ever done this type of analysis?
What about avoided emissions?
Is the data standardised?
How do others use this concept of avoided emissions?
An additional step towards the evaluation of risk?

Energy Transition & Climate Change
50 keplercheuvreux.com
What else can green-brown metrics tell me? At portfolio level, carbon footprint metrics cannot distinguish between a low-carbon
portfolio built with non-industrial assets (software, service) that does not
significantly contribute – in positive or negative - to the energy transition, and
another portfolio composed of low-carbon part-of-the-solution industries, such as
renewables or green housing. In addition, making decisions solely based on carbon
intensity may lead to the exclusion of certain companies with high carbon footprints,
which are nevertheless contributing to the climate and energy transition.
Green-brown metrics attempt to focus on this side of the story.
Chart 19: Carbon footprint is an incomplete metric…
Source: Kepler Cheuvreux
Expert track: example at portfolio and investee-level
For example, the carbon intensity (t C02/USDm) of the MSCI ACWI ex Coal
index is only 4% lower than MSCI ACWI’s (and 13% lower for the MSCI ACWI
ex Fossil Fuels Index). At the same time, the reduction in carbon reserves
normalised by market cap is larger: -44% for the ex-Coal Index and -100% for
the ex-Fossil Fuels index. At investee-level, we investigated the carbon
intensity (C02e/USDm) of a few of the energy utilities companies that we cover.
Within the sample we chose, Verbund and Iberdrola have the highest footprint.
Yet, both invest in renewable energies (94% of electricity generation for
Verbund and 13% of EBIT for Iberdrola). This shows that carbon footprint
metrics hide substantial differences in terms of green-brown exposure, and by
extension associated risks.

Energy Transition & Climate Change
51 keplercheuvreux.com
Standard industry classifications: useful or not? At the highest level, industry classification may be used to segment between green
(solution-oriented) and brown sectors (risk-oriented). Major types include the
Global Industry Classification Standard (GICS), the Industry Classification
Benchmark (ICD) and the Bloomberg Industry Classification System (BICS) built in
the listed space, and the North American Industry Classification System (NAICS) and
the UN International Standard Industrial Classification of All Economic Activities
(ISCI) that cover all economic activities, including outside the listed space.
While this may be a useful screening step, it is an imperfect solution as this method
suffers from several practical limitations, given that traditional classification
systems are usually based on revenues rather than on non-financial performance.
Expert track: main limitations of standard industry classifications
These classifications are backward-looking and thus not adequate to capture
the contribution to climate change and energy transition.
Limitation 1: this leads to inadequate level of granularity, particularly for emerging sectors such as energy technologies.
These classifications may be better suited for analysing ‘brown’ and ‘grey’
sectors, rather than ‘green’ ones. Indeed, they may disaggregate ‘green’ sectors
from others in certain cases, while not catering for others. For example, ICB has
categories for Alternative Energy, Renewable Energy Equipment, Alternative Fuels
and Alternative Electricity, but not for green buildings.
Limitation 2: these classifications rely on one-to-one mapping.
The often-used one-to-one company-sector mapping means that a company
needs to have at least 50% of its activities in a ‘green’ activity to be mapped to a
‘green’ sector. It is thus likely that ‘green’ activities of large caps are not
captured.
Limitation 3: additional, more granular information is needed for ‘grey’ sectors: depending on their specific activity, technology or product they may be classified as ‘brown’ or ‘green’.
It may be necessary in certain cases (‘grey’ sectors) to drill down to specific
activities, products and technologies. This is the case for the food, real-estate,
forestry, transport and information technology sectors.
The SASB Industry Classification System (SICS) could be considered as an
alternative, as it categorises industries based on resource intensity and
sustainability innovation potential. However, beyond the disaggregation of certain
sectors such as ‘alternative energy’ and ‘organic and natural foods’, we believe that
the use of this classification in the context of green-brown metrics is limited.
At the highest level, industry classification may be used to segment between green and brown sectors
It may be necessary in certain cases (‘grey’ sectors) to drill down to specific activities, products and technologies
These classifications may be better suited for analysing ‘brown’ and ‘grey’ sectors, rather than ‘green’ ones

Energy Transition & Climate Change
52 keplercheuvreux.com
Table 10: Contentious, grey, brown and green sectors
Contentious Grey Brown Green
Gas-fired power, bioenergy, hydropower, nuclear power
Fossil fuels Solar, wind
Energy efficiency without credentials/standards or from the perspective of fossil fuels or at risk of "rebound effect"
Energy efficiency
Agri-food Real estate Forestry Waste management Recycling, composting Transport Electric and
alternative mobility ICT
Source: Kepler Cheuvreux, CBI, FTSE, MSCI
What about alternative classification systems? Very few companies are pure-play players in ‘green sectors’ – this diversification of
businesses alongside the lack of segmented data on sales, earning, capex and R&D
makes it very difficult to derive appropriate metrics, apart for a few selected sectors
and KPIs. Alternative systems are being developed by data and index providers
that allow for a better understanding of the specific activity, technology or
product in relation to non-financial performance and more specifically carbon.
A key question to answer is: how do you define green?
The Climate Bond Initiative (CBI) is working on activity-based industry
taxonomies aligned with climate change scenarios for bonds, and is arguably the
most ambitious and multi-stakeholder task, using the latest scientific and academic
research, to define eligibility criteria for ‘green investments’ in fixed income under
the Climate Bonds Standard.
Test of greenness: “The Climate Bonds Scientific Framework anchors the Climate
Bonds Taxonomy and standards for certification. The framework gives the latest
view of the climate science community, providing analysis on emission mitigation
pathways and technology options. The taxonomy has been designed to be
consistent with the Intergovernmental Panel on Climate Change (IPCC) AR5 report
for both the emissions signature of low-carbon economy required to avoid
dangerous climate change and the selection of technologies and practices consistent
with that signature.” Note that in addition to mitigation technologies and
practices, some adaptation activities are also included, such as water
treatment and low-carbon infrastructure.
A useful and open taxonomy: The CBI details a very specific, activity-based
taxonomy, freely available on its website (link). For ‘grey’ sectors, it provides
detailed guidance to determine eligibility under certain conditions. The
framework was adapted by the Investors Coalition on Climate Change, which
provides a database of low-carbon investments across asset classes: the Low-
Carbon Investment Registry Taxonomy (link).
How do you define green?

Energy Transition & Climate Change
53 keplercheuvreux.com
With some limitations when applied directly to equity: The CBI taxonomy is
built to fit a ‘project’ framework and necessitates a high level of data
granularity in terms of exposure to certain activities or technologies, which
while feasible in the context of green bonds, is harder to achieve for other
asset classes. In addition, there may be a need to broaden the scope to take
into account diversification, liquidity and business models constraints.
FTSE has also developed a Low Carbon Economy Industry Classification System
that maps companies to 7 high-level sectors and 29 sub-sectors. MSCI also has its
own classification, across 5 themes and 37 technologies. Both the FTSE and MSCI
classifications include themes we would classify as ‘contentious’ or ‘grey’ (e.g.
biofuels and general waste management). Other data providers have developed
their own taxonomy. This is the case for South Pole Group, for example, which mixes
sectors of publicly-available taxonomies.
These classifications have their own criteria to differentiate what is ‘green’ from
what is not and are better-suited to company-level analysis. Transparency is key in
this potential contentious area, so that users can make their own judgment on the
outcome, not the process itself. For example, the FTSE classification (soon to be
launched) is based on an ‘industrial test of utility’, which looks at how the investee is
economically involved in the solution – including both mitigation and adaptation
activities.
Chart 20: FTSE environmental sectors and sub-sectors
Source: FTSE

Energy Transition & Climate Change
54 keplercheuvreux.com
Avoid the traps We believe that several traps should be avoided in this type of analysis:
1. Complementary products/activities: Green products/activities with ‘brown’ complementary products/activities. This is the reason why energy efficiency in the oil sector is classified as ‘contentious’ in our typology (Table 10).
2. Scope myopia: Products/activities relying on the production of ‘brown’ raw materials, energy-intensive during the use phase or necessitating complex, polluting end-of-life treatment.
3. Product/service use: should oil used as a feedstock for plastic be considered ‘brown’?
4. Business-as-usual versus marginal focus: should legal requirements or business-as-usual activities be classified as ‘green’?
5. Static view: what happens if a company has a large amount of green and brown? The share of ‘green’ and ‘brown’ activities may fluctuate through time. Other factors are needed to assess whether the company is on the right trajectory (Chart 21).
Chart 21: Investigating trends…
Company name Bituminous coal and lignite surface
mining
Bituminous coal underground
mining
Coal power generation
Total revenues from coal activities latest
reporting year
3-year trend
A2a SpA 0.00% 0.00% 1.47% 1.47%
Abotiz Equity Ventures inc. 0.00% 0.00% 28.54% 28.54%
Aboitiz Power Corp. 0.00% 0.00% 27.99% 27.99%
BHP Biliton Ltd. 13.37% 0.00% 0.00% 13.37%
Adani Power Ltd. 0.00% 0.00% 97.98% 97.98%
AES Gener SA 0.00% 0.00% 32.53% 32.53%
China Shenhua Energy Co. Ltd. 0.00% 67.89% 27.71% 95.59%
Source: Trucost
What metrics? Data providers have been working on creating databases with relevant metrics,
without going necessarily as far as building an entire taxonomy (link). While still in
their infancy, and arguably high-level/uncertain, these datasets aggregate disparate
reporting and may help save time.
It is possible to distinguish between two broad types of metrics:
Point-in-time metrics, such as the percentage of revenue, earnings or profit derived from ‘green’ and ‘brown’ products or services, are a snapshot of the current performance.
Forward-looking metrics (e.g. R&D, reserves, useful life of assets, capex) are used as a proxy for future green-brown exposure. Combined with other metrics, they represent one step further towards an analysis of negative contributions to climate change and/or risk exposure.
Two types of green/ brown metrics: point-in-time and forward-looking metrics…
There is thus a trade-off between using more granular, activity-based metrics and sector-level mapping

Energy Transition & Climate Change
55 keplercheuvreux.com
These metrics can be split between cross-sector, higher-level metrics, such as the
share of ‘brown’ and ‘green’ in sales/revenue, and sector-specific, more targeted
metrics. More broadly, the ‘green’/’brown’ share can be expressed as a percentage
of:
Financial metrics (revenue, spending, capex, opex, EBIT, etc.).
Physical, sector-specific metrics (% floor space, % of planned capacity).
Using a financial metric is better from an aggregation perspective. On the other
hand, as seen in our discussion of normalising metrics used in carbon footprinting,
the general rule is that the more the indicator moves away from ‘physical reality’,
the more uncertainty is created, particularly as a result of price effects. It is
therefore preferable when feasible (information available at issuer level and
consistent with the scenarios) to take a physical unit, when comparing companies
within the same sector.
Table 11: Example of metrics
Sector Point-in-time Forward-looking
Oil, gas & consumable fuels Volume of oil and gas produced each year Volume of proved and probable reserves (coal, oil, gas, shale gas, oil sands, etc.), reserve replacement ratio, R&D spending, average reserve life
Industry % of revenue from energy efficiency (insulation, battery, smart grids, hybrid/electric vehicles, industrial automation, etc.)
Climate-related R&D and/or number of patents
Real estate % of revenue from green certified property, % of floor space covered by properties certified to a sustainable/green building standard
Life time, planned refurbishments and acquisitions
Utilities % of revenue from alternative energy (wind, solar, biogas, biomass, waste, etc.), % of kWh from alternative energy, current capacity
Planned additional capacity, average lifetime of assets
Transportation and logistics % of vehicles powered by renewable/ alternative fuels in the fleet
RD spending
Source: Kepler Cheuvreux, 2° Investing Initiative, data providers
Expert track: Locked-in emissions
Emissions accounting is currently performed on an ex-post annual basis using past
estimates of emissions. However, as investors seek to transition to more climate-
friendly and less risky pathways, it is also important for them to factor in the
cumulative future impacts of companies’ existing capital stocks and the
consequences of their planned infrastructure investments. Given the long life
spans of infrastructure assets, investment decisions made in the present will
potentially have binding impacts over the long term and can lock an asset onto a
defined emissions pathway for several decades.
There are three ways to conceptualise locked-in GHG-emissions by sector or
industry:
Locked-in emissions of reserves relate to the GHG-emissions of fossil fuel reserves. They are not technically locked-in with regard to infrastructure
… expressed as a percentage of a financial or physical metric

Energy Transition & Climate Change
56 keplercheuvreux.com
but, as they are booked as reserves on a company’s balance sheet, they can be considered locked-in with regard to the associated corporate business plan.
Locked-in emissions of production capacity relate to all the GHG-emissions associated with the production process of a company planned on its current landscape of assets.
Locked-in GHG-emissions of the products associated with the production capacity relate to all future GHG-emissions of the products associated with the current and future production capacity of a company. These can for example be the locked-in emissions of airplanes sold by airplane manufacturers.
Chart 22: Point-in-time metrics may hide a large part of the story…
Source: MSCI ESG Research, MSCI ACWI, May 2015
Green share – we did our own: what did we learn? In this example, we provide an example on the ‘green share’, based on our
experience and our previous report Reporting on impact. In order to define our green
impact universe, focused on positive environmental outcomes, we had to go through
the process of deriving our own taxonomy, mapping companies and assessing the
share of their revenue that we consider to be ‘green’ (Reporting on impact by Samuel
Mary).
Developing a green exposure taxonomy, measurement and monitoring on product-
based opportunities remains challenging without a framework offering a targeted
set of actionable metrics to address practical challenges.
We defined seven environmental clusters associated specifically with climate
change mitigation and the transition to a low-carbon economy. To do so, we built
In order to define our green impact universe, focused on positive environmental outcomes, we had to go through the process of deriving our own taxonomy, mapping companies and assessing the share of their revenue that we consider to be ‘green’

Energy Transition & Climate Change
57 keplercheuvreux.com
upon the Climate Bonds Initiative (CBI) taxonomy for low-carbon investments (link),
itself adapted by the Investors Coalition on Climate Change.
However, despite greater scientific consensus on some of these technological and
taxonomical clarifications, our taxonomy remains broader than the CBI taxonomy.
As explained before, this taxonomy can more easily be applied to the bond market
than to equities, due to its focus on activity rather than companies, given the
differences between the two asset classes, namely:
The diversification of businesses of these listed companies alongside their lack of visibility on sales, earnings, capex and R&D.
Liquidity, performance and volatility issues.
A lack of standards in listed companies’ reporting on their products’ environmental impacts (reference to independently verifiable indicators).
The importance of stringent standards for the green bond market, where issuers and investors have a particular strong commitment to the green credentials of the activities to which the proceeds are “ring-fenced”.
Our vision is the broad green economy: i.e. it incorporates companies that play a
leading role in providing solutions to environmental challenges and enabling
humanity to live within the limits offered by the planet. We thus distinguish three
types of activities, across the energy and non-energy sectors. The first two are
relevant to climate change specifically:
Core low-carbon energy technologies: low-carbon and energy efficiency with strong evidence supporting the positive environmental exposure e.g. wind, solar (energy solutions in the Low Carbon Investment Registry).
Broad low-carbon energy technologies: all low-carbon technologies, including the contentious ones, i.e. for which the positive environmental exposure is difficult to estimate and/or implies significant negative externalities/uncertainties and ultimately interpretations (e.g. CCS, nuclear, large hydro in non-temperate zones). In our view, these technologies need to be factored in as they will make various contributions to progress in the context of the colossal energy sector decarbonisation challenge (energy production and use make up two-thirds of total GHG emissions globally).
Broad green economy: including a heterogeneous list of businesses not necessarily directly related to the energy sector, and once more, for which the environmental credentials are hard to prove e.g. support services, waste & water. Climate change adaptation solutions would fall within this category.
Our vision is the broad green economy: i.e. it incorporates companies that play a leading role in providing solutions to environmental challenges and enabling humanity to live within the limits offered by the planet

Th
em
atic &
Imp
act In
ve
sting
58
k
ep
lerch
eu
vre
ux
.com
Chart 23: Matrix of possible “green” classifications for technologies, industries and products
Sector/Business IEA 2DS
LCI Registry Taxonomy (adapted from CBI) KECH Green/Ambivalent/Brown
classification
KECH Core/Broad green impact universes
Green Ambivalent Brown KECH Core Green Impact universe
KECH Broad Green Impact universe
Agriculture & Forestry Forestry activities X Specified forestry activities, timber harvesting
excluded X Pulp & Paper owning certified forestry
assets Sustainable agriculture X Specified agriculture activities, peat land excluded X Organic food Chemicals fertilisers, environmentally-
friendly businesses (e.g. bioagriculture, precision agriculture)
Buildings Building energy efficiency X Green buildings X Building materials energy
efficiency solutions REITs green buildings
Appliances, lighting and equipment energy efficiency
X Energy efficiency technology/products needed to ensure buildings meet industry performance
standards
X X X
Energy Renewable power Solar X X X X X Wind X X X X X Large hydro in tropical regions X More work required X X X Bioenergy X X X X X Nuclear power X X Gas-fired power X X X Coal-fired power X Carbon capture and storage X More work required X X X Smart grids X X X X X ICT ICT solutions X Broadband, smart grid, low carbon ICT infrastructure X M2M, Datacentres using renewable
energy, semis Industry Co-generation and DHC X Co/Tri generation & heating management X X X Energy storage X X Energy efficiency X X X X Fossil fuel efficiency Transport Fuel economy X Fuel efficient vehicles & alternative fuel vehicles X Hydrogen, biofuels, bioenergy,
fuel cells Auto suppliers fuel efficiency solutions
Electric vehicles X X Railway X All but fossil fuel transport X X X Waste & Water Recycling X Circular economy activities X X X Waste management NA X X X Water management NA X X X Waste to energy NA Waste energy capture, more work required X Share classified as renewables
(biodegradable part) X
Source: Kepler Cheuvreux, IEA, LCI Registry Taxonomy

Energy Transition & Climate Change
59 keplercheuvreux.com
Beyond pure plays and questions related to the inclusion of the themes per se, two
types of situation may arise when assessing companies’ exposure to the theme:
Transformation stories. Energy transition among utilities is, for example, an attractive, dynamic growth story between old and new technologies and business models, and many companies may have two businesses in each, with one projected to overtake the other, e.g. Italian utility ERG has been transforming from an oil & gas company into a pure wind player, but still has limited exposure to fossil fuels (natural gas). The most proactive utilities e.g. E.ON via spin-off or ENEL via its 2050 decarbonisation plan, seem to be on the way to becoming eligible. In fact, over the long run most industries are becoming increasingly difficult to distinguish due to an underlying “greening” of business models in many ways.
Ambivalence. As much as the divest-reinvest thesis (from fossil fuels to low-carbon energy solutions) does not rigorously apply, the green-brown frontier is not strictly workable as such in practice. Andritz, for instance, may be seen as a problematic company in terms of classification within the green impact universe due to its somewhat conflicting business impacts and related social concerns (e.g. exposure to controversial dam projects in emerging markets). Besides, while the IPCC expressed support for hydropower to mitigate climate change, there is no consensus on lifecycle GHG emissions from the various types of dams‚ especially in tropical regions (due to the decomposition of organic carbon in the reservoir). Andritz claims to produce 45% of sales from renewable energy, mainly hydro. The criterion considered by the Low Carbon Investment Taxonomy (LCIT) is nevertheless “revenues from or to hydro projects in temperate zones”. It has been around 20% on average in the last three years. However, in 2014 it was only 15%.

En
erg
y T
ran
sition
& C
lima
te C
ha
ng
e
60
k
ep
lerch
eu
vre
ux
.com
Table 12: The result: Kepler Cheuvreux core green impact universe
Company Sector Country Analyst Main activities Unit
Alternative Energy & Transport Alstom Capital goods France William Mackie Rail transport products, systems and services. 100 % Sales Ansaldo STS Capital goods Italy Enrico Coco Rail and mass transport systems 100 % Sales CAF Capital goods Spain Inigo Egusquiza Design, production, maintenance and supply of equipment for the
railway industry 100 % Sales
Groupe Eurotunnel S.A. Transport France David Cerdan Operates fixed link between Great Britain and Europe. 100 % Sales Talgo Capital goods Spain Javier Campos Clavero Pure-play and leader in the VHS (very high speed) and HS (high
speed) train industry 100 % Sales
Vossloh Capital goods Germany Craig Abbott 1) Rail infrastructure 2) motive power & components 100 % Sales Biomass Resources Ence Paper Spain Javier Campos Clavero Production of renewable energy using forest biomass. 25% Sales Novozymes Pharma & biotech Denmark Richard Koch Industrial enzymes. primarily the bioenergy enzymes business 67% Sales Eco-Products & Services Air Liquide Chemicals France Martin Roediger Hydrogen to produce sulphur-free fuels, oxygen injection in blast
furnaces, oxygen in electric arc furnace (EAF), cogeneration, industrial gas for photovoltaic sales, production of biogas, CCS.
28% Sales
Arcadis Capital goods Netherlands Andre Mulder 1) Water protection; 2) efficient systems for heating, cooling, air-conditioning, storage of heat; 3) environmental services
43% Sales
Bureau Veritas S.A. Support services France Patrick Jnglin, CFA In-service inspection & verification certification 30% Sales Eurofins Scientific SE Support services France David Cerdan Environmental testing: testing of water, air, soil, waste and other
products to assess their quality and impact on health and the environment. Eurofins is also exposed to Food & feed testing and testing for pharma/biotech
20% Sales
Imtech Capital goods Netherlands Andre Mulder Technical services provider in the fields of electrical engineering, ICT and mechanical engineering.
55% Sales
Intertek Group PLC Support services United Kingdom Patrick Jnglin, CFA Related sustainability services include: 1) Health and sustainability services for Consumer Goods; 2) Environmental Sustainability Solutions; 3) Environmental and Sustainability Report Verification; 4) Biofuels Sustainability Auditing Services; 5) BIFMA level™ Sustainability Certification for Commercial Furniture; 6) Health and Environmental Sustainability Benchmark Profile; environmental certification
25% Sales
Linde Chemicals Germany Martin Roediger 1) Gas-to-liquid. 2) Enhanced oil recovery (EOR) & enhanced gas recovery (EGR): energy efficiency 3) Cleaner fuels & clean coal & clean gas
45% Sales
SGS S.A. Support services Switzerland Patrick Jnglin, CFA Offers a range of inspection, testing, audit and verification services 20% Sales Umicore Chemicals Belgium Peter Olofsen 1) Recycling treats complex waste streams containing precious and
other non-ferrous metals. 2) Automotive catalysts 57% Sales
Energy efficiency ABB Capital goods Switzerland William Mackie 1) Plant process selection; 2) Optimised process control; 3) More
efficient equipment; and 4) Loss recovery and/or loss reductions 50% Sales
Aixtron Semis Germany Bernd Laux Development and production of equipment for the production of compound semiconductors (mainly LEDs)
80% Sales
Blue Solutions Capital goods France Pierre Boucheny Provider of lithium-metal polymer batteries dedicated to energy storage applications
100 % Sales
Legrand Capital goods France William Mackie 1) Lighting, heating and plant managements. 2) Analysis, measurement and monitoring of electrical equipment
54% Sales
Continued on next page…

En
erg
y T
ran
sition
& C
lima
te C
ha
ng
e
61
k
ep
lerch
eu
vre
ux
.com
The result: Kepler Cheuvreux core green impact universe …continued
Company Sector Country Analyst Main activities Unit
Oerlikon Capital goods Switzerland Hans-Joachim Heimbuerger
1) Automotive sector (fuel efficiency), increased lifespan of materials; 2) improved energy efficiency in textiles machines; 3) wind turbines as part of Drive Systems
50% Sales
Osram Light Capital goods Germany Peter Olofsen Products, systems, solutions and services with the greatest potential for energy savings. Mainly LED
70% Sales
Pfeiffer Vacuum Technology Capital goods Germany Craig Abbott Develop, manufacture and market components and systems for vacuum generation, measurement and analysis
100 % Sales
Philips Capital goods Netherlands Peter Olofsen Lamps with lower energy consumption including LED, compact fluorescent
25% Sales
S&T Capital goods Germany Baptiste de Leudeville IT solutions in the smart-grid market 20% Sales Saint-Gobain Construction &
materials France Josep Pujal In building insulation the main products are glass wool and flat
glass. To a small extent: distribution and exterior solutions. 20% Sales
Schneider Electric Capital goods France William Mackie The largest contributors to energy efficiency sales are, in decreasing order, services, critical power, building automation systems and variable speed drives. Power equipment for wind & solar projects. Charging stations for electric vehicles
46% Sales
Siemens AG Capital goods Germany William Mackie Energy efficiency as part of Infrastructure & cities BU. Rail solutions as part of its Infrastructure & cities BU. Wind equipment.
43% Sales
Wienerberger AG Construction & materials
Austria Stephan Trubrich, CFA Wienerberger’s innovative products and system solutions for bricks (clay blocks, roof tiles, facing bricks) help reduce energy costs and CO2 emissions
25% Sales
Zehnder Group Switzerland Martin Flueckiger Energy-efficient products and system solutions for a comfortable and healthy indoor climate.
95% Sales
Zumtobel Construction & materials
Austria Stephan Trubrich, CFA Professional lighting solutions, luminaires, lighting management and lighting components for indoor and outdoor application
50% Sales
Renewable Energy Acciona Utilities Spain Jose Porta Water (designs, builds and operates plants for drinking water and
wastewater treatment, desalination and water reuse), Renewable energy generation and energy efficiency in buildings and construction
87% EBITDA
Alerion Utilities Italy Claudia Introvigne Wind energy production 100 % Sales Andritz Capital goods Austria Thomas Neuhold, CFA Electromechanical equipment for hydropower stations
(particularly turbines and generators); plants for generating energy from biomass, e.g. biomass boilers for the pulp and paper industry or plants for drying and pelleting biomass; plants for production of liquid biofuel, such as biodiesel or bioethanol (second generation); plants for converting waste products into energy sources (waste-to-power)
45% Sales
EDP Renovaveis Utilities Portugal Jose Porta Wind energy generation 100% EBITDA ENEL Green Power Utilities Italy Claudia Introvigne Wind, hydroelectric, geothermal, solar, biomass 100 % Sales ERG Utilities Italy Claudia Introvigne Wind generation 90% EBIT Falck Renewables Utilities Italy Claudia Introvigne Wind energy production, waste/biomass 100 % Sales Iberdrola Utilities Spain Jose Porta Wind energy equipment, Wind energy generation, Hydro
generation 13% EBIT
IREN Hydro Italy Claudia Introvigne Water, waste and renewables 40% EBIT Nordex Capital goods Germany Douglas Lindahl Wind turbines equipment 100 % Sales Saeta Yield Utilities Spain Jose Porta Wind generation 100 % Sales Verbund Utilities Austria Ingo Becker, CFA Hydropower generator 94% electricity
generation
Source: Kepler Cheuvreux
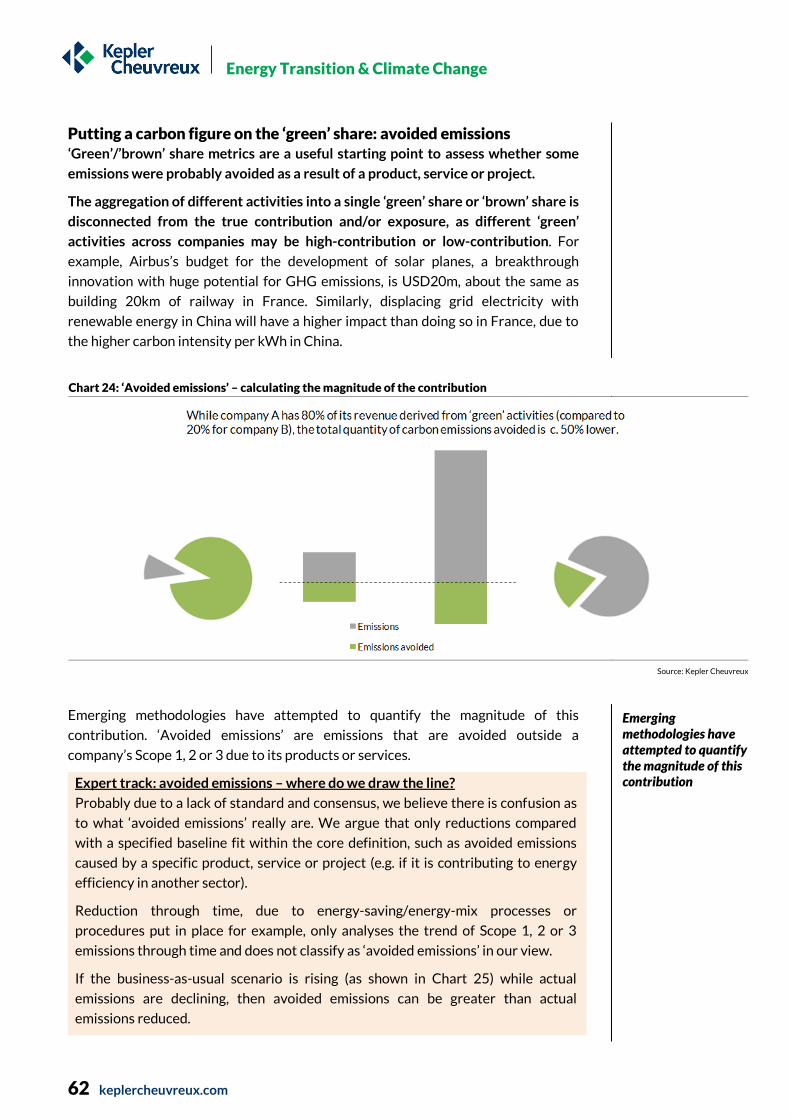
Energy Transition & Climate Change
62 keplercheuvreux.com
Putting a carbon figure on the ‘green’ share: avoided emissions ‘Green’/’brown’ share metrics are a useful starting point to assess whether some
emissions were probably avoided as a result of a product, service or project.
The aggregation of different activities into a single ‘green’ share or ‘brown’ share is
disconnected from the true contribution and/or exposure, as different ‘green’
activities across companies may be high-contribution or low-contribution. For
example, Airbus’s budget for the development of solar planes, a breakthrough
innovation with huge potential for GHG emissions, is USD20m, about the same as
building 20km of railway in France. Similarly, displacing grid electricity with
renewable energy in China will have a higher impact than doing so in France, due to
the higher carbon intensity per kWh in China.
Chart 24: ‘Avoided emissions’ – calculating the magnitude of the contribution
Source: Kepler Cheuvreux
Emerging methodologies have attempted to quantify the magnitude of this
contribution. ‘Avoided emissions’ are emissions that are avoided outside a
company’s Scope 1, 2 or 3 due to its products or services.
Expert track: avoided emissions – where do we draw the line?
Probably due to a lack of standard and consensus, we believe there is confusion as
to what ‘avoided emissions’ really are. We argue that only reductions compared
with a specified baseline fit within the core definition, such as avoided emissions
caused by a specific product, service or project (e.g. if it is contributing to energy
efficiency in another sector).
Reduction through time, due to energy-saving/energy-mix processes or
procedures put in place for example, only analyses the trend of Scope 1, 2 or 3
emissions through time and does not classify as ‘avoided emissions’ in our view.
If the business-as-usual scenario is rising (as shown in Chart 25) while actual
emissions are declining, then avoided emissions can be greater than actual
emissions reduced.
Emerging methodologies have attempted to quantify the magnitude of this contribution

Energy Transition & Climate Change
63 keplercheuvreux.com
Chart 25: Illustration of avoided and reduced emissions concepts using 2015 baseline year
Source: 2˚ Investing Initiative
In search of a standard At the moment, standards only exist at the project level, for example the GHG
Protocol and the Clean Development mechanism methodology. In fact, many of the
largest global International Financial Institutions and development banks are in a
process of harmonising the way in which they estimate such avoided emissions (link)
for three common project types – renewable energy, energy efficiency and
transportation.
These developments do not address avoided emissions at the corporate level but
contain important insights that can help us start understanding the issues at stake.
Industry organisations have also developed their own guidelines, in particular in the
cement, information and telecommunication, power generation and asset
management sectors. Corporates, such as BASF, have also started devising
methodologies, based on these sector-specific standards, to calculate emissions
avoided at company level.
The World Resource Institute is currently investigating the feasibility of accounting
and reporting product level avoided emissions by companies and whether this can
be used to drive low-carbon product innovation. The completion of the project is
planned for 2017.
What are the main methodological considerations? Emissions are usually calculated directly at corporate level, without taking into
account sectors or products, but rather metrics such as fuel use and electricity
consumption, except in some specific estimation methodologies. Most categories of
avoided emissions require an understanding of the product/sector breakdown, a
calculation at this level and aggregation at corporate level.
Data sources. Two potential data sources to calculate avoided emissions include estimates based on activity/product/sector data and life-cycle analysis coefficients and/or averages based on disclosure.
Methodological choices include data sources, lifetime versus annualised emissions, the choice of baseline and double counting

Energy Transition & Climate Change
64 keplercheuvreux.com
In the context of equity or fixed income, we believe that using company disclosure is
a good option for screening purposes, but may not be sufficient to inform selection
or allocation decisions as few investees report avoided emissions, and when they do,
the results are hardly comparable due to a lack of standards in this field.
Lifetime versus annualised reductions. Lifetime emissions may be better suited in the context of illiquid investments, such as project finance or infrastructure. Annualised emissions are preferred for equity and fixed income. Regardless of the timeframe chosen, consistency is key. Challenges include the allocation over a lifetime to certain assets (motorways), the possibility of retrofitting and a lack of data.
Baseline. The GHG Project Protocol defines the baseline candidate as “alternative technologies or practices, within a specified geographic area and temporal range, which could provide the same product or service as a project activity”. This document then discusses the choice of baseline at project level (link).
Taking the current split of technologies or products available on the market is the
easiest option. However, it is based on a static view that may not be an accurate
representation of reality.
When accounting for avoided emissions over multiple years, what constitutes
business-as-usual may change throughout the lifetime of the product/service/
project. One may want to consider a dynamic baseline, for example in the context of
project finance or green bonds.
Emission reduction at the margin may differ from industry averages and
methodologies that take this into account may be an interesting option, depending
on the aim of the analysis and required level of sophistication. It may not be needed
for the high-level screening of an equity portfolio but it may be useful in accounting
for the avoided emissions for a specific project, especially for activities in energy
efficiency and renewables. Certain life-cycle analysis databases, such as EcoInvent
(link), have an average marginal coefficient.
Double counting. When the savings are aggregated at portfolio level, the question of double counting the benefits may arise. The Carbone 4 and Mirova methodology uses value-add in order to allocate induced and avoided emissions between multiple components and an end-product, whose use avoids emissions. Value-add can be calculated at company or sector level.
Emission reduction at the margin may differ from industry averages and methodologies that take this into account may be an interesting option

Energy Transition & Climate Change
65 keplercheuvreux.com
Expert track: dynamic baselines
Let’s consider a new energy-efficient heating, ventilating and air-conditioning
(HVAC) system. Assuming that:
The new equipment has a carbon intensity of 1kg per year.
The old equipment’s carbon intensity is 1.5kg per year with a lifetime of 15 years.
A static baseline will calculate the avoided emissions as follows: New equipment lifetime * (old equipment efficiency – new equipment efficiency) = 15 * (1.5-1) = 7.5kg per product over the full lifetime.
However, it is likely that the old equipment will be replaced by more energy-
efficient equipment (as business-as-usual baseline) sometimes during the life time
of the new equipment. In reality, the old equipment has five years of useful life
remaining at which point it would have been replaced by new equipment with a
carbon intensity of 1.2kg per year.
A dynamic baseline calculates the avoided emissions as follows: Useful remaining life of the old equipment * (old equipment efficiency – new equipment efficiency) + remaining useful life of the new equipment * (new business-as-usual equipment – new equipment efficiency) = 5 * (1.5 – 1) + 10 (1.5 – 1.2) = 5.5kg per product over full life time or 2.5kg less than the static baseline.
Chart 26: Dynamic baselines visualised
Source: Kepler Cheuvreux, 2° Investing Initiative
In practice… Avoided emissions are a concept mostly used in project finance, mainly by
development banks. Very few data providers or asset managers have attempted to
use this method systematically at portfolio level (but the majority of data providers
are able to provide this type of metric on demand, at stock level). When they do, it is
usually part of other assessment metrics.
0.8
0.9
1
1.1
1.2
1.3
1.4
1.5
1.6
1 2 3 4 5 6 7 8 9 10 11 12 13 14 15
Car
bo
n in
ten
sity
Useful life (years)
Carbon intensity old - static baseline Carbon intensity old - dynamic baseline Carbon intensity new
In practice, very few data providers or asset managers have attempted to use this method systematically at portfolio level
Overestimated avoided emissions when using a static baseline

En
erg
y T
ran
sition
& C
lima
te C
ha
ng
e
66
k
ep
lerch
eu
vre
ux
.com
Table 13: Use of the avoided emissions concept in methodologies (not exhaustive)
Investor Carbon footprint Avoided emissions Other metrics Output Comment
Mirova/ Carbone 4 (link)
Scope 1, 2, and 3 where relevant. Methodology to avoid double counting. Estimates data gaps based on sector intensity. Normalises by enterprise value to avoid double counting between debt and equity
Different methodology for each high-stake sector, based on the specific challenge in the context of the energy and climate transition. - Energy sectors (production,
processing, transport and distribution of fossil fuels, electricity production, electricity transport and distribution): comparison of the carbon intensity of electricity produced with a reference scenario (world electricity mix in IEA 2DS scenario at 2025).
- Suppliers of equipment with a low carbon potential (aimed at energy, transport, building, industry and IT sectors): emissions avoided thanks to efficient products sold during the year, taking into account the lifetime of products and compared with the products that will be replaced.
- Carbon-intensive sectors (heavy industry, real estate, transport operators and transport infrastructure, forest and paper, agriculture and agribusiness): decrease in the GHG-intensity of the company for the past five years and in some cases comparison with a reference scenario.
Additional qualitative indicators include the company's tendency to contribute to the energy transition (based on capex and R&D) and transparency/reporting quality
At company level: - Induced and avoided carbon emissions - Carbon impact ratio (avoided/induced) - Forward-looking qualitative rating - Transparency and quality of reporting - Global assessment of the contribution to climate change At equity portfolio level: - Charts of sector distribution of induced and avoided emissions - Total induced and avoided emissions at portfolio level - Distribution of qualitative ratings in each sector and in the portfolio
One of the few methods that includes ‘avoided emissions’ across a large universe of listed companies. Includes more qualitative, forward-looking elements in the scoring methodology. Main limitation is the use of different baselines which decreases cross-sector comparability and different timeline (product lifecycle avoided emissions vs. annual corporate emissions). Overall, it is important to note that the end result is a score, not a net footprint. In that perspective, companies within a sector may be compared based on their ratio of induced/avoided emissions but it is best to compare companies within different sectors using the total score.
ImpaxAM (link)
Disclosure where available and engagement with companies. Includes Scope 1 and 2. Where available (six companies), other indirect Scope 3 emissions were included. When no data, estimates based on relevant peer groups of disclosing companies, taking into account geographical mix where possible. Conservative: highest intensity of the peer group assigned.
If the company discloses data, include it. If not, where possible, estimate the number of units sold (based on revenue per product category and average price per unit of product) and environmental benefit per unit of product using best available industry estimates. If revenue per product category not available, do not assign any avoided emissions.
Metrics include: - Net impact from GHG emitted minus GHG avoided - Renewable energy: positive impact from renewable energy generated (MWh) - Water: positive impact from water treated/ water saved/ clean water provided (litres) - Materials: positive impact from materials recovered/ waste treated (tonnes)
Quantitative results for the four metrics identified. Heat map at company level identifying negative, positive and secondary positive impact
Innovative approach which goes beyond traditional footprint by including Scope 3 and avoided emissions. Process, methodology and data assured by EY. Good for a secondary layer of screening (leading to engagement) and communication purposes. Results may need to be refined for further use. One of the main hurdles is the potential lack of comparability, especially in reported Scope 3 and avoided emissions.
Continued on next page…

En
erg
y T
ran
sition
& C
lima
te C
ha
ng
e
67
k
ep
lerch
eu
vre
ux
.com
Use of the avoided emissions concept in methodologies (not exhaustive)…continued
Investor Carbon footprint Avoided emissions Other metrics Output Comment
Sycomore AM (link)
Where relevant, based on life-cycle analysis studies. Looks at the most impacting life cycle stage and how a product/service may help to reduce the footprint.
Based on life-cycle analysis studies, using the average performance of market solutions as a baseline using the same functional unit. Dynamic baseline.
Analyses two to three environmental impacts specific to each sector, including climate change.
Used to pick stocks for the Sycomore Eco Solutions fund. Includes exclusionary filters for certain sectors. Results are expressed as a % difference with average market solution.
Innovative approach which appears to rely on strong methodological grounds. Used to calculate the magnitude of the contribution to the energy and ecological transition, as a % of turnover, in order to screen in companies that contribute directly and more meaningfully (vs. indirectly and partially) to address environmental issues and therefore demonstrate a higher degree of alignment with the transition.”
ASN BANK/ Ecofys (Link)
Disclosure where available, Scope 1, 2, and first tier-indirect for certain asset classes (listed equity). When no data, estimated. Includes ASN Bank footprint, and footprint of investments in equity and debt investments.
Avoided emissions from investments in Green Bonds and project investments in emission reductions (renewable energy or energy saving measures). Yearly avoided emissions, calculated by taking the proportional share of the total project value financed by ASN Bank. Uses business-as-usual baseline scenario (based on current electricity mix), not marginal.
Profit and Loss over Scope 1, 2, and 3 of the bank, including avoided emissions, on an annual basis. Aims to become carbon neutral by 2030 (i.e. emissions induced = emissions avoided).
One innovative way to use the avoided emissions metric. Avoided emissions only apply to project finance and green bonds (not listed equity). Looks at annual emissions.
Source: Mirova/ Carbone 4, Impax AM, Sycomore AM, ASN Bank, Kepler Cheuvreux

Energy Transition & Climate Change
68 keplercheuvreux.com
A step closer to the assessment of exposure and risk? Information on green-brown current and future exposure is a useful starting point
in the systematic and bottom-up evaluation of carbon risk. These methods go
further than shadow pricing or scoring (as discussed in the previous section) as
they build on traditional financial risk analysis to include the carbon component.
One can distinguish between carbon (linked to the energy and carbon intensity of
assets) and climate risk (linked to physical risks, e.g. extreme weather events). Most
studies analyse the carbon and climate risk separately, with climate risk being picked
up primarily by insurance companies. Here, we focus primarily on carbon risk as it is
linked to the carbon intensity of assets, but later in this report we discuss the Mercer
methodology, which looks at both carbon and climate risk.
Asset-level risk: an active field of research
The concept and body of work around stranded assets is a well-known concept and
body-of-work at asset level, focusing on the ‘brown’ share that may no longer be
viable in the future due to economic or regulatory stranding. The Carbon Tracker
Initiative has been very active in this area, with a specific focus on energy sectors,
with many organisations applying the concept in different ways, including in other
sectors such as agriculture.
Green-brown metrics need to be analysed together with other metrics. For example,
risks are particularly material for assets with long time horizons. A production/
innovation cycle of three years (e.g. in the telecommunications sector related to cell
phones) allows for a relatively flexible and rapid adaptation. Disruption is
particularly damaging to long-term assets that cannot adapt. Unfortunately, climate-
related infrastructure generally has a lifetime of 10, 20, 30, 40 years or more.

Energy Transition & Climate Change
69 keplercheuvreux.com
Chart 27: Example of carbon, financial and asset data overlaid to get a sense of carbon risk
Source: WRI & UNEP FI (link)
At asset level, risk management and investment decisions may come first in the
form of impairment tests for the most exposed assets and sectors: for example, the
impact of climate policies on energy-intensive assets, via scenarios around energy
demand, price and carbon price allow for a definition of carbon supply cost curves, as
developed by the Carbon Tracker Initiative (link).
Investee-level risk: building on asset-risk
The work of UNEP-FI and WRI distinguishes between ‘carbon asset risk’ and
‘operator carbon risk’. Economic impairment of physical assets is likely to impact the
valuation of investees that own or operate these assets. The risk at asset level may
be passed on to the ‘operator’ of the asset and either be reinforced or mitigated by
the ‘operator’s’ policies and business models. Additional risks may also directly
impact investees through regulatory, reputational or market drivers. Examples of
research include:
Equity: the impact of carbon risks can be assessed through a number of different indicators. For example, Kepler Cheuvreux used the IEA 2˚scenario to estimate the potential lost revenues of oil and gas companies. Bloomberg offers an online valuation tool for fossil fuel companies.

Energy Transition & Climate Change
70 keplercheuvreux.com
Credit: Credit ratings agencies such as S&P and Moody’s have also published a first series of papers on the potential implications of carbon risks on corporate credit ratings. The Global Footprint Network has started to work on stranded asset risk at national level, via a set of macro indicators that include physical climate risk. Beyond Ratings is also developing models to look at energy risk in sovereign ratings.
Chart 28: Changes of current share price as a result of stranded assets scenario
Source: 2° Investing Initiative, BNEF 2014, Bloomberg
Kepler Cheuvreux will be launching an interactive platform soon that will allow
investors to understand ESG risk at investee level, including risk on climate change
factors. Information on how risk is managed and/or potentially passed through to
investors will be captured through questions focusing on the company’s strategy
and business model, as well as commentaries on external risk factors.
Portfolio-level risk: a research field in its infancy
Unmanaged residual risk may further build up at portfolio level. The type of
investment relationship (or location in the ‘capital stack’ in UNEP-FI and WRI’s
framework) may enhance or mitigate the risk. Financial institutions also face
regulatory constraints targeting them directly. Methodologies include balance sheet
stress tests and analysis of the impact of carbon risk on strategic asset allocation.

Energy Transition & Climate Change
71 keplercheuvreux.com
Chart 29: Assessing risk at multiple levels
Source: Based on WRI/UNEP FI
- Policy and legal- Market and economic- Technology- Reputational and social risk
- Resource availability- Physical impacts
Carbon risk Interconnection Climate risk
Qualify
Asset Investee Investors
Classify
Evaluate
Location, sector, timeframe, radical versus incremental: scenario analysis
Stranded assets from policy and legal, market and economic, technology and reputational constraints (carbon risk)
Impact assets from climate risk (resource availability and physical impacts)
- Asset profile, reliance on resources and vulnerability to climate change (Climate risk)
- Carbon intensity, Physical assets lifespan, EBIT margin (Carbon risk)
Tests for physical assets:- Asset impairment tests- Shadow pricing
Through the impairment of physical assets
+ Direct constraints placed on companies through regulatory, legal, or reputational action (carbon risk)
- Asset risk profile
+ Business model and sustainability risk management
+ Evolution through time
Valuation/ risk models:- Revenues/ margins- Valuation models- Corporate ratings- Sovereign debt ratings
Risk of investee
+ Regulatory constraints directly targeting financial institutions
- Risk profile of stocks
+ Exposure to risks (will vary based on the financing instrument)
+ Exposure to direct factors
Risk models and stress tests:- Balance sheet stress
tests- Strategic allocation
Assess
Bottom-up Top-down
Energy Transition & Climate Change
72 keplercheuvreux.com
Comparing performance: benchmarks While carbon footprint, green-brown and avoided emissions metrics can, to a
certain extent, indirectly provide information on the contribution to the transition
to a 2° world, they lack benchmarks directly reflecting the end goal.
If you only have five minutes
Using existing indexes as benchmarks, a useful start but… The climate contribution of the majority of carbon footprints is measured relative to
existing indexes using benchmarks at portfolio level (comparing with indexes such as
MSCI ACWI, FTSE 500, etc.). This is useful to get an understanding of contribution
or exposure compared with the ‘status quo’ but may not be a good indicator, as
existing indexes are biased towards energy-intensive industries.
... there is a need for metrics that relate to the end goal A new set of metrics is being developed to tackle these limitations – 2° technology
benchmarks and science-based targets. Their starting point is the need to limit the
temperature rise to 2°C. These methods then suggest trajectories and compare
them with business-as-usual pathways.
Deriving appropriate benchmarks is likely to take centre stage as some investors’
mandates involve contributing to public goals, including climate mitigation (2°
Investing Initiative/UNEP/WRI 2015). The new French regulation has introduced an
innovative reporting approach that essentially requires investors to disclose (on a
“comply or explain” basis) how their portfolio selection meets a 2° pathway.
At company level: science-based targets Science-based target methodologies have been developed by a coalition of
academics and NGOs in an attempt to quantify the “fair share” of emissions that can
theoretically be allowed at company level in order to comply with the global goal of a
2°C temperature increase.
While this type of analysis is primarily used to set or assess targets at investee level,
it can in theory be aggregated at portfolio level and used to assess alignment with
the 2° goal. One limitation is the lack of forward-looking greenhouse gas emissions
data reported by companies; this makes interpretation difficult and this type of
analysis is best used together with other metrics, such as forward-looking ‘green’
metrics.
2˚ benchmark at portfolio level 2° benchmarks are also being developed at portfolio level by a consortium led by the
2° Investing Initiative and funded by the European Commission. The underlying idea
is the same as the one behind the science-based targets, but 1) the analysis is done at
portfolio-level and 2) it relies on green-brown exposure data rather than
greenhouse gas data to assess the alignment or misalignment of a portfolio with the
2˚ trajectory. While this method is meant to be applied at portfolio level, it relies on
asset and investee-level data.
While carbon footprint, green-brown and avoided emissions metrics can, to a certain extent, indirectly provide information on the contribution to the transition to a 2° world, they lack benchmarks directly reflecting the end goal
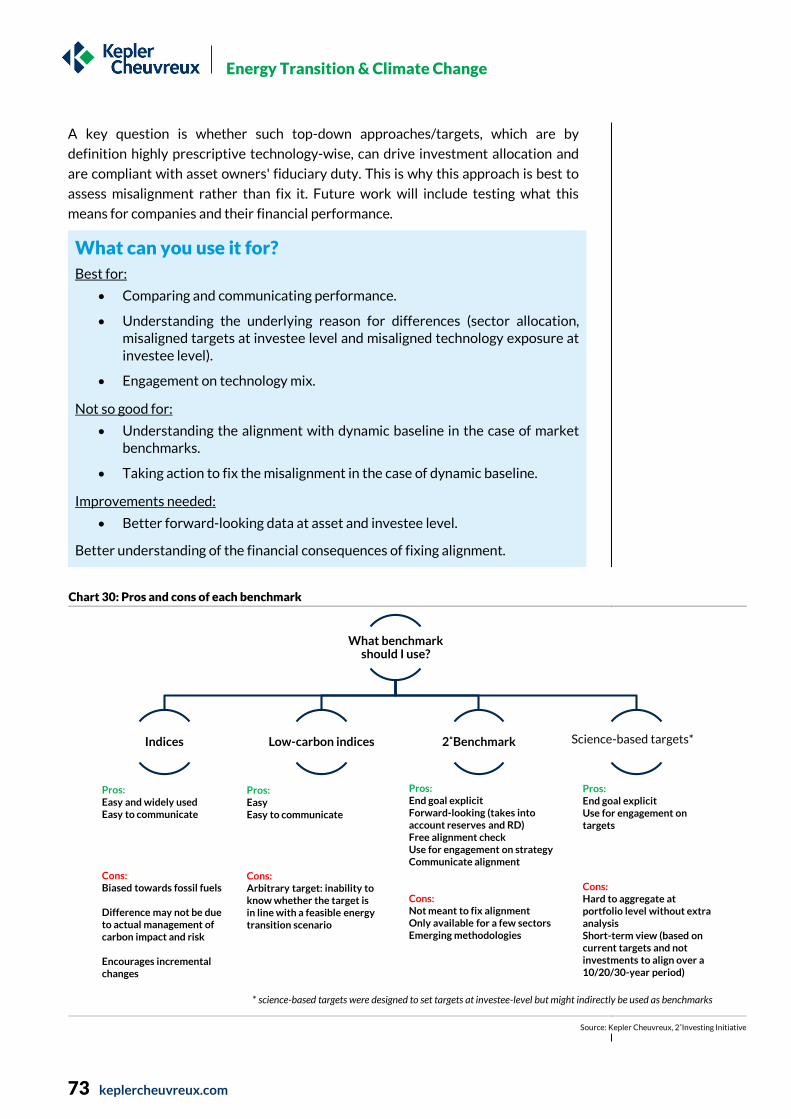
Energy Transition & Climate Change
73 keplercheuvreux.com
A key question is whether such top-down approaches/targets, which are by
definition highly prescriptive technology-wise, can drive investment allocation and
are compliant with asset owners' fiduciary duty. This is why this approach is best to
assess misalignment rather than fix it. Future work will include testing what this
means for companies and their financial performance.
What can you use it for?
Best for:
Comparing and communicating performance.
Understanding the underlying reason for differences (sector allocation, misaligned targets at investee level and misaligned technology exposure at investee level).
Engagement on technology mix.
Not so good for:
Understanding the alignment with dynamic baseline in the case of market benchmarks.
Taking action to fix the misalignment in the case of dynamic baseline.
Improvements needed:
Better forward-looking data at asset and investee level.
Better understanding of the financial consequences of fixing alignment.
Chart 30: Pros and cons of each benchmark
Source: Kepler Cheuvreux, 2˚Investing Initiative
What benchmark should I use?
Indices Low-carbon indices 2˚Benchmark
Pros: Easy and widely usedEasy to communicate
Cons:Biased towards fossil fuels
Difference may not be due to actual management of carbon impact and risk
Encourages incremental changes
Pros: EasyEasy to communicate
Cons:Arbitrary target: inability to know whether the target is in line with a feasible energy transition scenario
Pros: End goal explicitForward-looking (takes into account reserves and RD)Free alignment checkUse for engagement on strategyCommunicate alignment
Cons:Not meant to fix alignmentOnly available for a few sectorsEmerging methodologies
Science-based targets*
Pros: End goal explicitUse for engagement on targets
Cons:Hard to aggregate at portfolio level without extra analysisShort-term view (based on current targets and not investments to align over a 10/20/30-year period)
* science-based targets were designed to set targets at investee-level but might indirectly be used as benchmarks
Energy Transition & Climate Change
74 keplercheuvreux.com
P.75
P.76
P.77
P.78
P.82
P.84
Fasten your seatbelt In this section, we answer the following questions:
What do existing benchmarks really measure?
What are ‘science-based’ targets?
Can I use ‘science-based’ targets at portfolio level?
What about the 2° benchmark?
What are the pros and cons of each type of benchmark?
Are they useful for risk evaluation?

Energy Transition & Climate Change
75 keplercheuvreux.com
Index-based benchmarks: what do they really measure? Most managers benchmark their fund against a stock index to assess the relative
climate change performance of their portfolio compared to a diversified benchmark.
In so doing, they use the index as a ‘baseline’ scenario. These indexes are widely
used, but represent a static view of the world and as such can be useful to measure
incremental change.
2° Investing Initiative analysis shows that this approach may be limited, for two
reasons:
1. The sector exposure of most stock indices used as benchmarks (MSCI World, FTSE, DJ, Stoxx, S&P, etc.) is biased towards fossil fuels compared with the real economy.
2. The restriction of the investment universe to large caps and the reproduction of the benchmark’s industry exposure may skew the comparison when expressed in USDm invested.
Most investors publish carbon footprints that are lower, sometimes significantly so,
than their benchmarks, with relatively higher holdings in less carbon-intensive
sectors and/or stocks logically cited as the main reason. This raises questions about
the actual relative importance of sector bias versus stock selection (picking lower-
carbon stocks within specific sectors or peer groups).
We believe that a better variable consists in calculating the trend through time,
when care is taken to hold constant certain variables that may create noise.
Expert track: keeping the ownership metric constant
Comparison may be skewed due to the formula used to calculate ownership of
emissions (e.g. USD investment/ issuer’s full market cap in the case of equity): while
the amount invested may not change, the overall market capitalisation and value of
investment will vary. In order to control for market capitalisation fluctuation and
allow for time comparison, we recommend keeping the ownership metric constant
through time.
Table 14:The effect of market capitalisation
USDm invested
Market capitalisation
(USDm)
Carbon emissions
(t C02e)
Ownership Carbon emissions
attributed to the portfolio
Year 1 Company A 10 30 10,000 0.33 3,333 Company B 1 15 30,000 0.07 2,000 Total Year 1 5,333 Year 2 Company A 10 33 10,000 0.30 3,030 Company B 1 16 30,000 0.06 1,875 Total Year 2 4,905
Source: Kepler Cheuvreux
In this example, the market capitalisation of both companies increased between
year 1 and year 2, leading to a decrease in the ownership metric, calculated as
USDm invested/ market capitalisation (USDm). This leads to a decrease in carbon
emissions attributed to the portfolio, even though the actual carbon emissions did
not decrease, hence the need to keep the ownership metric constant.
While this represents a more ‘aspirational’ benchmark compared with the status quo, a big disadvantage of these approaches is the inability to know whether the target is in line with a feasible energy transition scenario

Energy Transition & Climate Change
76 keplercheuvreux.com
Another option consists in using a low carbon index as the benchmark: the Climate
Policy Initiative distinguishes between three main types: exclusionary, non-
exclusionary and thematic (link). While this represents a more ‘aspirational’
benchmark compared with the status quo, a big disadvantage of these approaches is
the inability to know whether the target is in line with a feasible energy transition
scenario.
Table 15: ESG Index type
ESG Index Type Description Examples
Exclusionary Excludes fossil fuel companies, or particular subsectors like coal or tar sands, from index holdings; often referred to as divestment indexes
Fossil Free Indexes US; MSCI Global Fossil Fuels Exclusion Indexes; FTSE Group, Blackrock, and NRDC ex-fossil fuels index series
Non-Exclusionary Does not exclude fossil fuels, but often overweights high-ESG performers and underweights low-ESG performers
MSCI ACWI Low Carbon Target Index; STOXX Global ESG Leaders; SXI Switzerland Sustainability 25 Index; iShares MSCI ACWI Low Carbon Target ETF
Thematic Emphasises economic, social, environmental, and other trends to inform investment strategies. Often emphasises investment in companies focused on climate change mitigation and adaptation
MSCI Global Climate Index; S&P/TSX Energy and Clen Technology Index; MSCI Global Environment Index
Source: Climate Policy Initiative
Science-based targets: an approach at investee level… Science-based target methodologies have been developed by a coalition of
academics and NGOs in an attempt to quantify the “fair share” of emissions that can
theoretically be allowed at company level in order to comply with the global goal of a
2°C temperature increase.
The science-based metrics approach comes with various methodological options
(link) whose main benefit, in our view, is to drive a new dynamic in climate
performance measurement by linking it to tangible macroeconomic challenges,
thereby creating a holistic low-carbon eco-system. For example:
The Sectoral Decarbonisation Approach (SDA) initiative by Ecofys for CDP, WWF and the GHG Protocol, aims at informing the setting of carbon-reduction targets in line with climate science at company level. Indirectly, it can be used to assess whether already set and disclosed targets are in line with the 2° trajectory.
As part of the recent Business Action for low Carbon Transition Initiative, CDP and ADEME are collaborating to develop a rating based on verified information and using a sector-specific methodology, which assesses to what degree companies are taking steps towards a low-carbon economy. This will cover three sectors - power, auto-manufacturers and retail – which represent different sets of issues pertaining to: complex supply chains, complex value chains, mitigation issues, agricultural emissions, complex regulatory environment. The project is to start in December 2015 and is planned to be completed by December 2016; it is open to other participants, including partners, companies, investors and other stakeholders.
While this represents a more ‘aspirational’ benchmark compared with the status quo, a big disadvantage of these approaches is the inability to know whether the target is in line with a feasible energy transition scenario

Energy Transition & Climate Change
77 keplercheuvreux.com
Not all science-based metric methodologies use climate scenarios. When they do
(such as the Sectoral Decarbonisation Approach), typical analysis steps include:
From the IEA pathway (or other available pathways), derive the rate of decarbonisation needed at sector level in order to achieve the 2˚ target.
Apply it at company level to derive appropriate targets or check whether the disclosed targets are in line with the 2˚ trajectory.
… that might be applicable at portfolio level… Existing research provides us with an annual rate of improvement in absolute
emissions of approximately 1.5% globally and across sectors (IEA 2015, absolute
emissions needed for a 2˚ Scenario), still well above the average rate of
decarbonisation of 0.8% a year since 2000, in order to avoid any emissions gap with
the 2°C target.
Such a decarbonisation rate should also take geographical exposure into account
since the IPCC recommends a global effort for the period 2012-50 of 75% for OECD
countries and only 48% for non-OECD countries, reflecting the logic of
differentiated responsibility.
Table 16:Absolute emissions reduction rates for a world at 2˚
Direct CO2 emissions (Mt
CO2)
Industry Buildings, agriculture,
fishing, non-specified other
Transport Power Other transformation
Total
World Compounded -21% -34% -43% -89% -94% -58% Annual -0.5% -0.9% -1.1% -2.3% -2.5% -1.5% OECD Compounded -52% -50% -67% -96% -100% -75% Annual -1% -1% -2% -3% -3% -2% Non-OECD Compounded -11% -18% -14% -84% -92% -48% Annual 0% 0% 0% -2% -2% -1% Asean Compounded 6% 15% -26% -30% -100% -23% Annual 0% 0% -1% -1% -3% -1% Brazil Compounded 16% -8% -47% -96% -100% -34% Annual 0% 0% -1% -3% -3% -1% China Compounded -28% -41% 2% -89% -100% -58% Annual -1% -1% 0% -2% -3% -2% EU Compounded -52% -54% -62% -95% -100% -72% Annual -1% -1% -2% -2% -3% -2% India Compounded 64% 7% 110% -85% -100% -14% Annual 2% 0% 3% -2% -3% 0% Mexico Compounded 9% -37% -46% -99% -100% -59% Annual 0% -1% -1% -3% -3% -2% Russia Compounded -40% -37% -52% -95% -100% -77% Annual -1% -1% -1% -2% -3% -2% South Africa Compounded -28% -45% -39% -96% -100% -76% Annual -1% -1% -1% -3% -3% -2% North America Compounded -56% -45% -73% -96% -100% -80% Annual -1% -1% -2% -3% -3% -2%
Source: IEA 2015
Thus, this approach obviously requires the international footprint of companies to
be identified: the good news is that most listed companies report on their exposure
in both developed and developing countries. However, the implementation of
country-by-country GHG reporting (as would be required to match companies to
global decarbonisation scenarios) remains well below investor expectations, as seen
previously in the report.
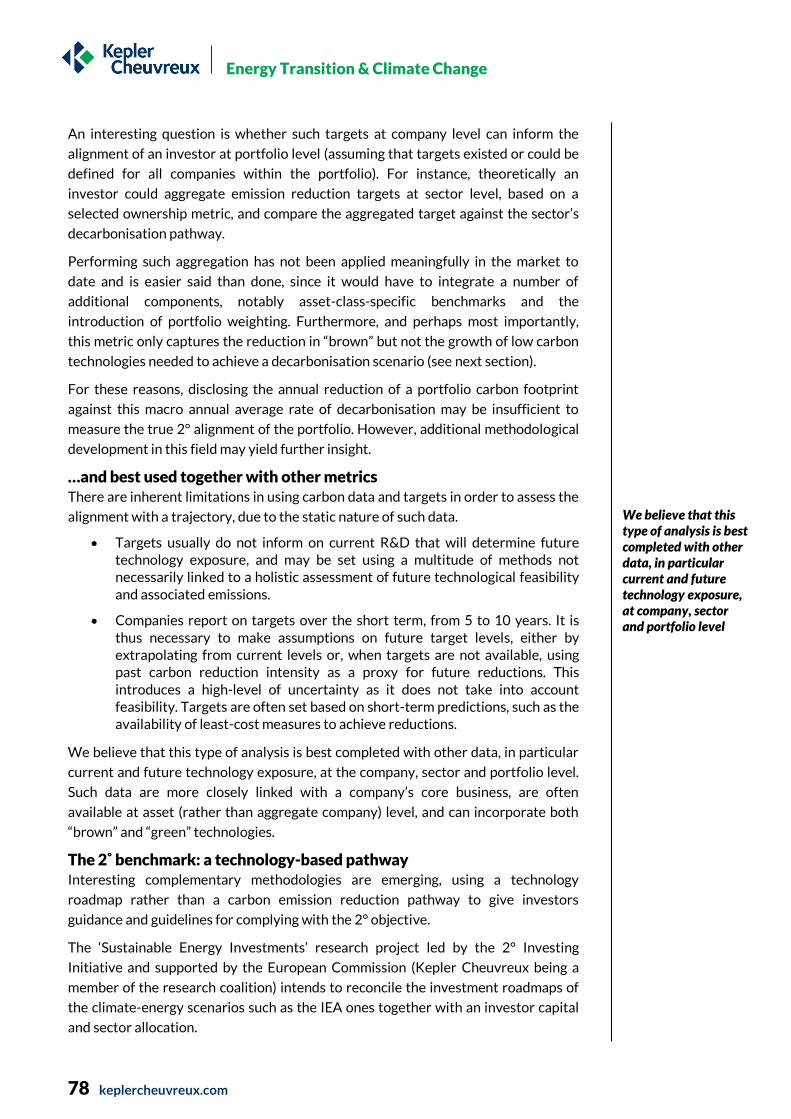
Energy Transition & Climate Change
78 keplercheuvreux.com
An interesting question is whether such targets at company level can inform the
alignment of an investor at portfolio level (assuming that targets existed or could be
defined for all companies within the portfolio). For instance, theoretically an
investor could aggregate emission reduction targets at sector level, based on a
selected ownership metric, and compare the aggregated target against the sector’s
decarbonisation pathway.
Performing such aggregation has not been applied meaningfully in the market to
date and is easier said than done, since it would have to integrate a number of
additional components, notably asset-class-specific benchmarks and the
introduction of portfolio weighting. Furthermore, and perhaps most importantly,
this metric only captures the reduction in “brown” but not the growth of low carbon
technologies needed to achieve a decarbonisation scenario (see next section).
For these reasons, disclosing the annual reduction of a portfolio carbon footprint
against this macro annual average rate of decarbonisation may be insufficient to
measure the true 2° alignment of the portfolio. However, additional methodological
development in this field may yield further insight.
…and best used together with other metrics There are inherent limitations in using carbon data and targets in order to assess the
alignment with a trajectory, due to the static nature of such data.
Targets usually do not inform on current R&D that will determine future technology exposure, and may be set using a multitude of methods not necessarily linked to a holistic assessment of future technological feasibility and associated emissions.
Companies report on targets over the short term, from 5 to 10 years. It is thus necessary to make assumptions on future target levels, either by extrapolating from current levels or, when targets are not available, using past carbon reduction intensity as a proxy for future reductions. This introduces a high-level of uncertainty as it does not take into account feasibility. Targets are often set based on short-term predictions, such as the availability of least-cost measures to achieve reductions.
We believe that this type of analysis is best completed with other data, in particular
current and future technology exposure, at the company, sector and portfolio level.
Such data are more closely linked with a company’s core business, are often
available at asset (rather than aggregate company) level, and can incorporate both
“brown” and “green” technologies.
The 2˚ benchmark: a technology-based pathway Interesting complementary methodologies are emerging, using a technology
roadmap rather than a carbon emission reduction pathway to give investors
guidance and guidelines for complying with the 2° objective.
The ‘Sustainable Energy Investments’ research project led by the 2° Investing
Initiative and supported by the European Commission (Kepler Cheuvreux being a
member of the research coalition) intends to reconcile the investment roadmaps of
the climate-energy scenarios such as the IEA ones together with an investor capital
and sector allocation.
We believe that this type of analysis is best completed with other data, in particular current and future technology exposure, at company, sector and portfolio level

Energy Transition & Climate Change
79 keplercheuvreux.com
Such an approach could potentially avoid the use of any GHG emissions metrics
since it directly maps the technology roadmap of the macro scenario with the
investor’s medium-term exposure, embedding both existing and future capex.
The research defines exposure targets to both solutions and climate problems at the
technology level, aligned with a 2° degree world. The ‘actual’ portfolio exposure is
then compared with the ‘2° portfolio’ (a representative diversified equity portfolio in
a market aligned with a feasible decarbonisation pathway) in order to identify over-
and underexposure gaps at sector level.
Chart 31: Methodological steps
Source: 2° Investing Initiative
Decarboni-sation
pathway
• How will the 2˚ world be achieved?
•Use the IEA 450 scenario, which provides information both in terms of production profile (measured in physical units) and decarbonisation profile (measured in emissions generated and avoided).
•Other scenarios will be included in future iterations of the research.
Translation to stock markets
• How to reflect the role of listed equities in the deployment of technologies and the production of energy in different geographies?
• Assign ‘fair share’ exposure to allocate future responsibility for production: normative approach.
Translation to sector and
geography
•Define the 2˚ profile at sector and geography levels: how to derive appropriate metrics to operationalise the 2˚scenario
•First define the benchmark and forecast year, based on data availability, then define exposure targets in physical metrics.
Business-as-usual profile
• What is the future production profile, if nothing is done?
• Using granular (plant by plant, car production by model and country), forward-looking (capacity addition plans, production forecast, etc.) data from industry-specific databases, assess the future exposure of listed companies to energy technologies.
The research defines exposure targets to both solutions and climate problems at the technology level, aligned with a 2° world
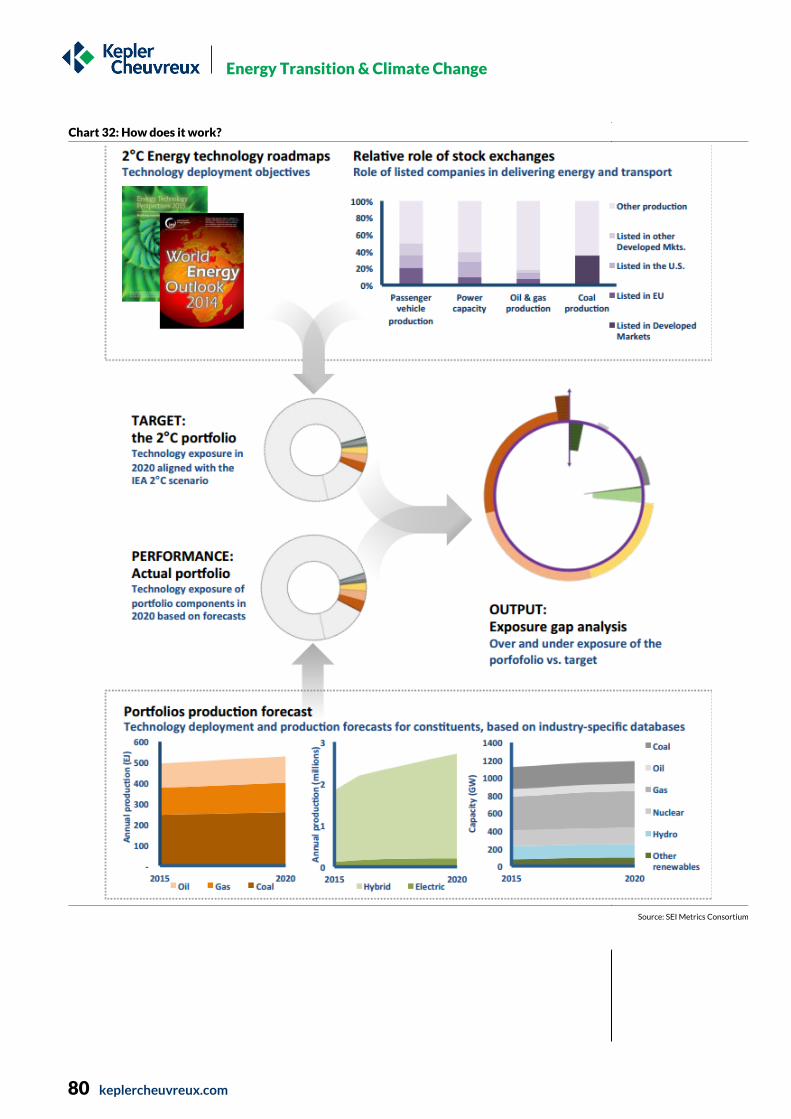
Energy Transition & Climate Change
80 keplercheuvreux.com
Chart 32: How does it work?
Source: SEI Metrics Consortium

Energy Transition & Climate Change
81 keplercheuvreux.com
Main limitations Availability only for key technologies. Climate scenarios (e.g. IEA Energy
Technology Perspectives, World Energy Outlook) set targets (production, investments, carbon intensity) for only about a dozen technologies and activities, which cover only about a third to a quarter of the listed equity universe, representing 70-80% of global GHG emissions.
Difficulty of isolating the specific contribution of an asset class. Climate scenarios describe the breakdown of technologies at regional or global scale. To translate that into asset classes, the relative roles of both economic actors (listed and non-listed companies, governments) and the role of financing channels (equity, debt, self-financing) have to be assessed. While a technical challenge, simple averaging models can be used to ‘translate’ economic indicators into indictors by asset class.
The question of picking winners. By default, a climate scenario associated with specific GHG emissions pathways reflects one vision of the future, similar to the argument against ‘picking winners’ in innovation and industrial policies. Any single scenario is not necessarily aligned with all stakeholders and policy goals. Two options to deal with this issue are conceivable: using several scenarios and letting investors choose, or creating a system of equivalence (e.g. exposure to low-carbon technologies A and B can be deemed equivalent since they deliver similar emission reductions).
Note that the two last limitations also apply to science-based targets: 1) if science-
based metrics were aggregated at portfolio level, asset allocation would have to be
performed, with the difficulties noted above; and 2) science-based metrics also rely
on climate scenarios.
Limitations include data availability, allocation to asset classes, mapping and multiple visions of the future

En
erg
y T
ran
sition
& C
lima
te C
ha
ng
e
82
k
ep
lerch
eu
vre
ux
.com
Table 17: Pros and cons of each methods
2 ˚ Benchmark Science-based targets
Main research question and level of analysis
What is the technology exposure gap at sector-level to be aligned with a 2 degree world?
What should companies’ emissions target be to be aligned with a 2 degree world?
Con: Inherently prescribes exposure to certain categories of technologies (technology exposure targets) and certain burden sharing between sectors’ and geographies’ carbon budget, as well as asset classes. Testing for different technology mix is a potential solution.
Pro: A carbon metrics indicator is less prescriptive than an energy and technology indicator. It allows for a diversity of approaches to achieve to 2 goal. Note that the emission scenarios are themselves built on the same source as the 2˚ benchmark (IEA 450 trajectory) which takes into account technology availability for example.
Pro: preserves diversification principle – not all companies have to be
aligned.
Con: difficult to aggregate at a portfolio level. Would have to integrate a number of additional components to operate at portfolio level, notably asset class specific benchmarks and the introduction of portfolio weighting.
Choice of pathway Based on IEA 450 scenarios which imply a number of technological options that can require a degree of cautiousness (e.g. CCS representing half of the emissions reductions expected through energy efficiency creates a significant risk to the whole model, in our view).
Con: Forecast year is contingent on data availability (for business-as-usual
growth in technology). Use 2020 for utilities and automotive and 2040 for fossil fuels. While short term data is more certain, most scenarios slow decarbonisation at first while increasing speed over the 20-40 year timeframe. Shorter term analysis may miss this aspect of the pathway.
Pro: pathways available until 2050. Careful: translating the 100 or 40 year 2°C pathway into a reasonable medium-term operational view of 3 to 5 years may lead to a risk of delaying action on the reductions, since the alignment may imply a very modest effort for a number of sectors (e.g. O&G efforts being delayed to post 2020).
Pro: at the moment, only applies to homogeneous sectors. Focus on the
convergence between business-as-usual scenarios with 2 degree technology pathway: it thus takes into account previous efforts at a company and sector-level and favours leaders.
Con: In heterogeneous sectors, introducing a baseline year (2010 in most cases) creates discrimination, similar to that observed in grandfathering bias of the EU- ETS. This is due to the use of the compression method, where every company is to decrease its emissions intensity regardless of previous efforts (thus favouring laggards). This criticism does not apply to homogenous sectors where ‘convergence’ method is used (thus favouring leaders).
Metrics Technology exposure metrics based on data availability (do not yet take all aspects into account).
GHGs metrics. By production in most scenarios (e.g. iron and steel, tons of cement) and $ value-add (e.g. chemicals and petrochemicals). Market share.
Pro: A common unit allows for a system of equivalence between sectors, creating
comparability between activities and production in different units. Pro: Easier to gather emissions data, both in terms of intensity and targets. However, with
a few exceptions, companies are not disclosing their emission targets in a framework that can easily be translated into an alignment metric to the 2ds pathway.
Con: Low level of reporting, sometimes justified by the ‘strategic’ nature of the
data needed to perform such analysis. Assumptions needed to develop the production profile forecasts of companies.
Con: Annual GHG emissions reduction may hide longer trends as efficiency gain may hit an eventual glass ceiling, in a context where long-term decarbonisation require a shift to zero carbon technologies. This problem is compounded by the fact that targets reported by companies are often on the short term (2020) – and often extrapolated to longer period of time.
Pro: Forward looking exposures from industry-specific databases take into
account not only investees’ exposures today but their expected change over the near term.
Source: Kepler Cheuvreux, 2°Investing Initiative, Sectoral Decarbonization Approach

Energy Transition & Climate Change
83 keplercheuvreux.com
Best used to assess the alignment, not to fix the misalignment A key question is whether such a top-down approach/target, which by definition is
highly prescriptive technology-wise, can drive investment allocation and is
compliant with investors' fiduciary duty.
In practice, should investors be required to invest in highly risky EVs, Solar, CCS and
other emerging technologies to the detriment of their fiduciary duties diligence?
This question illustrates why the 2˚ benchmark is best used as a guidance and
analytical framework rather than to build a portfolio, in our view. Indeed, we see a
vast number of ways for an investor to comply with the macro 2° pathway, allowing
for an almost infinite combination of options.
2˚ Investing Initiative is offering a free portfolio alignment check to interested
investors and index providers, in partnership with data providers. Kepler
Cheuvreux will investigate what these targets mean at stock level and what the
implications are for companies. Stay tuned.
How does it fit with green-brown metrics? No systematic method exists to connect any definition of ‘green’ or ‘brown’ with a
scenario shown to facilitate a feasible transition to the low-carbon economy – but
the 2° Benchmark builds upon ‘green-brown’ metrics. The 2˚ benchmark builds on
data at the asset or investee level that is used as a proxy for their future ‘green’
share.
Chart 33: The link between green-brown metrics at the asset and portfolio level with the 2˚Benchmark
Source: 2˚ Investing Initiative based on IEA, WEO 2014 and Global Data
0%
10%
20%
30%
40%
50%
60%
70%
80%
90%
100%
E.ON +pipeline additions (2020)
STOXX 600 +pipeline additions (2020)
IEA Total EU market(450 Scenario, 2020)
Coal Oil Gas Nuclear Hydro Other renewables
For this reason, the 2˚ benchmark can only serve as a guidance and analytical framework but can hardly be used to build a portfolio, in our view
EON + other Investee analysis feeds into the portfolio analysis (here STOXX600), compared with the 2˚Portfolio.

Energy Transition & Climate Change
84 keplercheuvreux.com
Expert track: Using the 2˚ Benchmark: The Euronext Low-Carbon Index
The Low Carbon 100 Europe Index, initially launched in 2008, has developed an
innovative approach ahead of COP21, supported by an expert committee. The first
step is to use Carbone 4 methodology to identify sectors that are important to
consider when addressing the issue of climate change and transition to a low-
carbon economy; it includes upstream and downstream Scope 3 for relevant
categories and sectors and also 'avoided emissions', i.e. ‘emissions savings’ where
relevant, based on sector-specific methodologies. The allocation ratio between
high-carbon and low-carbon pure players is based on the alignment with a 2°
trajectory which comes with a green pure player’s inclusion process to improve the
index exposure to low-carbon transition players as well as to the climate target
pathway alignment. Non-carbon intensive players are selected based on their CDP
performance and disclosure scores.
A proxy for risk? Beyond measuring the contribution to the energy and climate transition, the
misalignment with a 2˚ trajectory can be thought of as a proxy for the probability of
risk, as it is based on a potential scenario of the future macro environment.
One should remember, however, that these benchmarks are based on one vision of the world, which may not be what happens in reality. Indeed, there is significant uncertainty around the exact decarbonisation trajectory of the global economy and the associated technologies driving this trajectory, coupled with high uncertainty over climate policies. Note that work is underway to incorporate additional scenarios in the 2° Benchmark to deal with differences in investors’ perceptions of the future.
An assessment of climate roadmaps suggests the distribution of risks may be skewed and involve ‘fat tails’ and ‘black swans’. These are not necessarily captured in standard valuation models and risk assessment frameworks.
In addition, this type of analysis gives the degree of exposure to risk rather than the magnitude of the actual risk. For example, imagine a portfolio that is overexposed to conventional automobiles (vs. hybrid or electric) by 50% and to coal by 10%. The actual risk may come from coal rather than the auto sector, in absolute terms.
This type of benchmark is primarily useful to evaluate exposure to carbon risk, but not to climate risk, i.e. extreme weather events.
Mercer recently performed a top-down analysis of how the strategic asset allocation
of a long-term investor can be affected by different climate scenarios and pathways
(link) across asset classes and sectors-subsectors and different scenarios.
The original analysis looks at four scenarios, from ‘Transformation’ (“More ambitious climate change mitigation action that puts us on a path to limiting global warming to 2˚C above pre-industrial era temperatures this century, with fossil fuels representing half of the mix at 2050) to ‘Fragmentation’ (“Limited climate action and lack of coordination result in warming rising to
Methodologies developed either adopt a ‘trajectory’ approach (based on a 2˚ benchmark) or other point-in-time testing
The misalignment with a 2˚ trajectory can be thought of as a proxy for the probability of risk, as it is based on a potential scenario for the future macro-environment

Energy Transition & Climate Change
85 keplercheuvreux.com
4˚C or above from pre-industrial era temperatures this century”, with fossil fuels representing 85% of the energy mix at 2050).
The analysis includes both carbon and climate risks (the exact typology is technology, resource availability, impact and policy) which, depending on the scenario, will play out in different ways, and sometimes in different directions, leading to a different distribution of players and losers. Mercer, in collaboration with Marsh, is launching a new risk assessment service (“Real assets, Real Investment Risks”), which looks in more detail at the real estate, infrastructure and natural resources sectors’ vulnerability to physical risks.
A recent study by the University of Cambridge Institute on Sustainability Leadership
(CISL) (link) modelled three scenarios on different portfolio structures and finds that
the value of equity portfolio could decrease by up to 45% as a consequence of short-
term changes in climate change sentiment. Interestingly, “in a worst-case no
mitigation scenario, 53% of the negative impacts of climate change across industry
sectors can be hedged through industrial sector diversification and investment in
industries that exhibit few climate-related risks”.
Top-down approaches that assess risk at portfolio level have yet to be linked and
integrated with bottom-up analysis at the asset and investee level. This field of
research is likely to be active in the coming months, in particular promoted by a
project commissioned by the European Commission and led by a consortium of
organisations including 2˚Investing Initiative and Kepler Cheuvreux.
In addition, most risk assessment approaches focus on one type of risk – in particular
carbon risk (due to regulations and technological changes). The Mercer approach is
one of the few that integrates both climate-related, physical and carbon risk. The
FTSE’s green-brown classification also has one category for adaptation, as well as
the CBI taxonomy, although rather in its infancy. This leads to the question of
adaptation. The IIGCC stressed the importance of incorporating the issue of
‘adaptation’ in its latest report (link) and more work is needed on this.
The next step is to integrate both top-down and bottom-up approaches to risk
assessment, together with measures of climate-friendliness in order to be able to
answer the question: how do I invest for a world at 2˚ while protecting myself from
a world at 4˚?

Energy Transition & Climate Change
86 keplercheuvreux.com
Data providers: reality check While investors could directly do the research themselves, implementation
costs are likely to be higher than implementation by ESG data providers
given the lack of economies of scale. We argue that each has strengths and
weaknesses, and that the choice depends on what you are trying to achieve
and what you think is more important. If you only have five minutes
A booming market… We are witnessing a boom in the market of data providers, with new actors such as
Bloomberg, ET Index, and Grizzly entering the scene. Providers traditionally focused
on quantitative carbon metrics are diversifying to providing green-brown metrics
and more contextual information, while providers that have historically been
offering scoring methodologies are developing specific carbon footprinting services.
… in constant evolution Broadly speaking, providers can be distinguished based on accessibility/costs and
level of sophistication/breath of services. With increased competition and
standardisation, costs are likely to decrease for ‘classic’ metrics (i.e. Scope 1 and 2
portfolio carbon footprint). For example, Bloomberg offers this service at no extra
cost and CDP is developing a free methodology together with experts from the
Carnegie Mellon University.
Differentiating factors In this context, while methodologies often differ, we argue that this will not be the
main differentiating factor going forward, but that rather the breadth of services (i.e.
additional metrics such as green-brown or risk analysis), coverage in terms of stocks
and asset classes, and ‘insights’/’interpretation’ of the results will be. We witness the
development of innovative methodologies that seek to capture dynamic versus
static elements, to include additional asset classes, that involve more consultative
and/or web-based delivery mechanism. We also stress the importance of
incorporating Scope 3 emissions in the analysis and the ability to offer uncertainty
analysis.
Overview of providers We provide an overview of data providers’ services in the next section but note that
providers are constantly innovating in this space and methodologies can
change/developed quickly.
Coverage varies from 600 to 50,000 investees, but in practice most providers are able to model any company using their proprietary methodology.
All providers cover listed equity and fixed income to a certain extent. A few are developing methods for other asset classes (private equity, infrastructure, real estate, sovereign bonds, and derivatives).

Energy Transition & Climate Change
87 keplercheuvreux.com
Approximately half of the data providers interviewed have Scope 3 data. A few have developed estimation methodologies for Scope 3 upstream and downstream.
Methodologies vary, depending on whether the investee’s activities are mapped to one or multiple sectors, the granularity of the estimation model, and disclosure-based versus industry or life-cycle analysis-based estimates.
Only three providers, at this stage, are able to offer uncertainty metrics as part of the main deliverable. Others may be able to offer this on demand.
Time-series are available as far as 2004. Most data providers have data starting from 2009-13.
Confront theory with practice: the IIGCC workshops
We review the results of a series of workshops organised by the Institutional
Investor Group on Climate Change (IIGCC) during 2015 and show that the results
on the Scope 1 and 2 carbon footprints are not fundamentally different from one
data provider to the other. The results also demonstrate the importance of including
Scope 3 and having an understanding of uncertainty levels due to large variability in
the results when value chain emissions are included.
A series of carbon footprinting workshops on sample portfolios, organised by the
Institutional Investor Group on Climate Change (IIGCC) in 2015 demonstrate that,
using the same overarching framework, results from the included data providers
differ marginally for Scope 1 and 2. Differences are larger when including Scope 3
emissions.
The setting - The IIGCC asked three, then four data providers (MSCI, South Pole
Group, Trucost and Inrate) to calculate the footprint of a global equity portfolio (100
stocks, representative of a diversified portfolio), benchmarked against MSCI ACWI.
Each data provider was asked to answer the following questions in a series of
workshops:
How do you measure carbon footprint/ intensity?
Is the portfolio more or less carbon-intensive than the benchmark?
How do you explain the differences?
What is your view on the choice of metrics; Scope 3 product-in-use emissions; measurements versus estimates; performance attribution; and application to other asset classes.

Energy Transition & Climate Change
88 keplercheuvreux.com
Chart 34: IIGCC and MSCI AWCI portfolio sector’s allocation
Source: IIGCC
Results - When comparing total Scope 1 + 2 results, the IIGCC portfolio is 12-24%
more carbon-intensive than the benchmark, calculated using the metrics ‘total carbon
emissions’ and ‘carbon intensity per USDm invested’. When comparing the results in
terms of ‘carbon intensity per USDm sales’, the IIGCC portfolio is 29-40% more
carbon-intensive. Finally, the IIGCC portfolio also has a higher ‘weighted average
carbon intensity’ (14-85%).
The largest share of the difference is attributable to the estimation methodologies. Note that a majority of companies disclose in both the IIGCC and benchmark portfolios (60%+).
It is unclear why the difference is largest when using the metric ‘weighted average carbon intensity’. The carbon intensity per sales of companies with the largest overweight (but not the largest share of ownership) may be estimated, with differences between providers. This theory could not be tested on the actual results, but could explain the large difference in results.
This also illustrates that, when using ownership-based metrics (total carbon footprint, carbon intensity/USD invested, carbon intensity/USD sales), data disclosure and quality is important for companies in carbon-intensive sectors AND in which the portfolio has a large share of ownership. When using the weighted average carbon intensity, data disclosure and quality matters for companies in carbon-intensive sectors AND overweighed in the portfolio.
Beyond these differences, the overall direction of the results is the same regardless
of the methodology/data provider. When adding Scope 3, differences become more
dramatic and results sometimes contradictory:
There is a large difference in the overall results (approximately 100% compared to c. 10% when comparing Scope 1+2 results), illustrating a lower rate of disclosure and higher uncertainty levels.
0%
2%
4%
6%
8%
10%
12%
14%
16%
18%
IIGCC Portfolio
MSCI ACWI
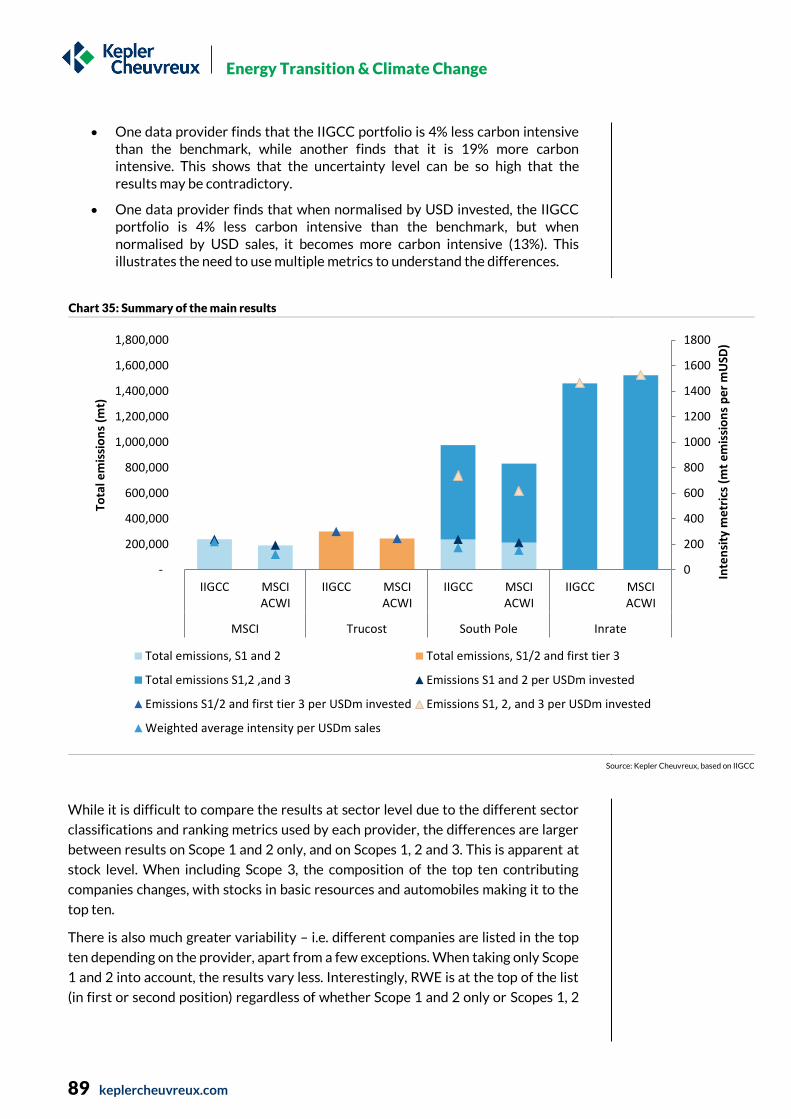
Energy Transition & Climate Change
89 keplercheuvreux.com
One data provider finds that the IIGCC portfolio is 4% less carbon intensive than the benchmark, while another finds that it is 19% more carbon intensive. This shows that the uncertainty level can be so high that the results may be contradictory.
One data provider finds that when normalised by USD invested, the IIGCC portfolio is 4% less carbon intensive than the benchmark, but when normalised by USD sales, it becomes more carbon intensive (13%). This illustrates the need to use multiple metrics to understand the differences.
Chart 35: Summary of the main results
Source: Kepler Cheuvreux, based on IIGCC
While it is difficult to compare the results at sector level due to the different sector
classifications and ranking metrics used by each provider, the differences are larger
between results on Scope 1 and 2 only, and on Scopes 1, 2 and 3. This is apparent at
stock level. When including Scope 3, the composition of the top ten contributing
companies changes, with stocks in basic resources and automobiles making it to the
top ten.
There is also much greater variability – i.e. different companies are listed in the top
ten depending on the provider, apart from a few exceptions. When taking only Scope
1 and 2 into account, the results vary less. Interestingly, RWE is at the top of the list
(in first or second position) regardless of whether Scope 1 and 2 only or Scopes 1, 2
0
200
400
600
800
1000
1200
1400
1600
1800
-
200,000
400,000
600,000
800,000
1,000,000
1,200,000
1,400,000
1,600,000
1,800,000
IIGCC MSCIACWI
IIGCC MSCIACWI
IIGCC MSCIACWI
IIGCC MSCIACWI
MSCI Trucost South Pole Inrate
Inte
nsi
ty m
etr
ics
(mt
em
issi
on
s p
er
mU
SD)
Tota
l em
issi
on
s (m
t)
Total emissions, S1 and 2 Total emissions, S1/2 and first tier 3
Total emissions S1,2 ,and 3 Emissions S1 and 2 per USDm invested
Emissions S1/2 and first tier 3 per USDm invested Emissions S1, 2, and 3 per USDm invested
Weighted average intensity per USDm sales

Energy Transition & Climate Change
90 keplercheuvreux.com
and 3 are included, probably due to its high carbon emissions and large percentage
of ownership of the portfolio in the company (28%).
The remainder of the discussions revolved around additional analysis and metrics –
to assess company strategy on climate change, to incorporate proven reserves and
locked-in carbon emissions, to expand the analysis to other asset classes and to
quantify the positive contribution of ‘green bonds’.

Energy Transition & Climate Change
91 keplercheuvreux.com
Bloomberg
{XLTP XPCF <GO>}
Coverage
Includes Scope 1 and 2 on 11,000 companies. No upstream or downstream Scope 3 data (but available through the terminal) No data on avoided emissions.
Covers listed equities but is expanding to other asset classes, such as fixed income.
Methodology
Data pyramid: GHGs disclosed, carbon disclosed, estimated based on previous disclosures, estimated based on averages. Means that there can be partial disclosure on carbon (vs. GHGs). No methodology to avoid double-counting between Scope 1 and 2. Estimation method: average based on intensity at GICS level 1,2 3 (choice left to the user) - not sector-specific One-to-one company-sector mapping No regionalisation of data estimates
Data quality procedure
No uncertainty analysis, no backtesting
Trends and benchmarks
Time-series data available since 2010 No forward-looking data/benchmark available
Availability of other data
Other data available through Bloomberg, but cannot be aggregated as part of the tool.
Accessibility
No additional costs with a Bloomberg license Data available at the click of a button in a spreadsheet format
Three things we particularly like
Other environmental and ESG data available; no additional cost and accessible at the click of a button.
Useful to know
No scope 3 emissions in the model but available on the terminal; only equity covered (but looking to expand to other asset classes); and no uncertainty analysis; no regionalisation for estimated data; no data on avoided emissions; no forward-looking benchmark available.

Energy Transition & Climate Change
92 keplercheuvreux.com
Carbone 4
http://www.carbone4.com
Coverage
Includes Scope 1 and 2 for 600 companies. Upstream and downstream Scope 3 for relevant categories and sectors (300 companies). Includes 'avoided emissions' where relevant, based on sector-specific methodologies. Listed issuing companies (equity and fixed income). To be extended to other assets, most probably sovereign bonds and infrastructure portfolios.
Methodology
Methodology to avoid double-counting Estimation model based on LCA for high stakes sectors and industry averages when operational data or reported emissions not available for Scope 1, 2 and upstream Scope 3, and LCA data for downstream Scope 3. One-to-many mapping - eleven proprietary sectors (40 sub-sectors) Regionalisation of estimated data on demand.
Data quality procedure
Consistency check of disclosure against averages. Qualitative uncertainty assessment (limits of the analysis in terms of methodology, perimeter and data availability are indicated in a qualitative comment). Backtesting of estimates versus disclosures.
Trends and benchmarks
Available for one year (based on 2014 reports). No forward-looking benchmark available (qualitative assessment).
Availability of other data
All "physical" activity data useful for the analysis of Scope 1+2+3 emissions is collected (turnover per type of product line), kWh produced/transmitted/supplied, tons of products by category, etc.). The objective is not to sell a database detailing those data. Key results: Induced emissions and emissions savings, Carbon impact ratio, Qualitative rating (alignment of strategy, R&D expenditures and CAPEX with climate transition), Transparency of disclosure rating, Global rating. No other environmental data.
Accessibility
Available beginning of 2016: Excel spreadsheet with CIA results by company + one key facts sheet per company + aggregation of results at portfolio level upon request. Available mid-2016: Online tool including all of the above.
Three things we particularly like
Scope 3 data available where relevant for all companies covered; LCA-based data where possible; forward-looking scoring methodology.
Useful to know
Lower coverage in terms of number of stocks and asset classes (to be extended in the future); available for one year only; no other ESG data available; no forward-looking benchmark available (but qualitative scoring on this aspect available).

Energy Transition & Climate Change
93 keplercheuvreux.com
ET Index
http://etindex.com/
Coverage
Includes Scope 1, 2 and 3 (upstream and downstream) on 5,000 companies, with possibility to model 1,000s. Emission reduction from the purchase of renewable energy. This is counted to calculate a net Scope 2 figure. No other avoided emissions data available. Listed equity, fixed income, sovereign bonds.
Methodology
No methodology to avoid double-counting between scope 1 and 2. Estimate method based on the ET Inference algorithm. Default approach is to infer the highest reported emissions intensity figure from any company within the same sector. ET Index gives clients the choice between: sector average, sector average plus one standard deviation, sector maximum, sector maximum plus one standard deviation – not sector-specific. One-to-one company-sector mapping to SASB - 10 Sectors, 35 sub-sectors and 89 industries. Regionalisation for Scope 2 data estimates on demand.
Data quality procedure
Three-step internal checking process and internal analysis for outliers as well as contacting companies to validate data; independent ET Quality Assurance Panel to validate changes to methodology over time. Uncertainty analysis and backtesting available on demand.
Trends and benchmarks
Time-series data available for five years. No forward-looking data/benchmark available. Possible to benchmark against the ET index series.
Availability of other data
No other data collected so far.
Accessibility
Delivery mechanisms through spreadsheet and online tool.
Three things we particularly like
Scope 3 data available for all companies covered; flexibility in estimation method (user’s choice); quantitative uncertainty assessment.
Useful to know
No other carbon, environmental or ESG metrics available; no regionalisation for estimated data; no data on avoided emissions; no forward-looking benchmark available.

Energy Transition & Climate Change
94 keplercheuvreux.com
Grizzly
www.grizzly-ri.com
Coverage
Includes Scope 1 and 2 on 10,000 companies. No upstream or downstream data on Scope 3 data - apart from Scope 3 'Product-in-use' for car manufacturers. No data on avoided emissions. Listed issuing companies (equity).
Methodology
No methodology to avoid double-counting. Estimation method: based on an interpolation model, using disclosure as an input - not sector-specific. One-to-one company-sector mapping to SIC (NAICS) level 4 - 983 sectors Regionalisation for Scope 2 data estimates.
Data quality procedure
Uncertainty analysis (based on analysis of variance) and backtesting of estimated data against disclosure. Data quality checks through outliers. Disclosure rejected if misleading magnitude.
Trends and benchmarks
Time-series data available since 2009. No forward-looking data/benchmark available. Emission forecasts available for N+1 and N+2 based on average trend.
Availability of other data
Other data can be available on demand.
Accessibility
Delivery mechanisms through spreadsheet.
Three things we particularly like
Quantitative uncertainty assessment; regionalisation of Scope 2 emissions when estimated; time-series data available and forecasted N+1 and N+2.
Useful to know
No scope 3 emissions (apart for downstream automobiles manufacturers); no data on other asset classes; no other environmental or ESG data available; no data on avoided emissions; no forward-looking benchmark available.

Energy Transition & Climate Change
95 keplercheuvreux.com
Inrate
www.inrate.com
Coverage
Includes Scope 1, 2, and 3 (both upstream and downstream) for 2,800 companies. No data on avoided emissions. Cover equity and bonds for the Swiss SPI (160 listed titles), MSCI Developed Markets and MSCI Emerging Markets plus we have an additional 160 non-listed corporates with listed bonds.
Methodology
Methodology to avoid double-counting based on intersector dependency data. Environmentally-extended input-output modelling for Scope 1, 2, 3 upstream and life-cycle analysis data for Scope 3 downstream (splitting company turnover into standard product categories with specific carbon intensities). Reported data are used to calibrate the calculation model. For specific sectors like utilities, Inrate uses special overlays to calculate GHG emissions. One-to-many company-sector mapping - 330 proprietary sectors. No regionalisation for estimated data.
Data quality procedure
Systematic backtesting. No uncertainty data available.
Trends and benchmarks
Time series available since 2011. No forward-looking benchmark available.
Availability of other data
Production data available for specific sectors. No green-brown metrics per se but proprietary ESG rating, ESG data, including controversy reporting.
Accessibility
Delivery typically in electronic form.
Three things we particularly like
Scope 3 data available for all companies covered; other environmental and ESG data available; reported data are used to calibrate the calculation model.
Useful to know
No regionalisation for estimated data; no data on avoided emissions; no forward-looking benchmark available; no uncertainty data available (but backtesting is systematically performed).

Energy Transition & Climate Change
96 keplercheuvreux.com
MSCI
https://www.msci.com/carbon-solutions
Coverage
Includes scope 1 and 2 for 8,500 companies. Scope 3 upstream and downstream available when reported only (approx. 1,300 companies) - as a single figure (i.e. not split between individual Scope 3 categories). No data on avoided emissions. Listed companies (equity and fixed income).
Methodology
No methodology to avoid double-counting. Estimation model: average based on disclosures, at the GICS sub-industry level. For power generation utilities, the fuel mix is used to estimate the emissions. One-to-one company-sector mapping to GICS - 156 sectors. No regionalisation for estimated data.
Data quality procedure
Provides confidence level based on coefficient of variance. Data quality checks through peer review, industry leads review (data reviewed by senior analysts covering Utilities, Energy and Materials), engagement, year-on-year change verification, comparison with industry averages.
Trends and benchmarks
Time-series data available for five years. No forward-looking benchmark available. Benchmark can be the MSCI low-carbon index and MSCI ex fossil fuels index.
Availability of other data
Production metrics available on demand for electric utilities. Green-brown metrics such as fossil Fuel Reserves (potential emissions), % revenues generated in Alternative energy/ Energy efficiency/ Sustainable water/ Green building/ Pollution prevention. Scoring on Carbon Emissions, Carbon risk management, Carbon risk exposure. Other environmental indicators such as water, toxic gases, waste etc. for selected industries as part of the corporate ratings.
Accessibility
Direct access to database, or production of Carbon Portfolio Analytics report.
Three things we particularly like
Scope 3 data available (when reported only); quantitative uncertainty assessment; and other environmental and ESG data available.
Useful to know
No data on other asset classes (beyond equity and fixed income); no data on avoided emissions; no regionalisation for estimated data; no forward-looking benchmark available; no data on avoided emissions.
Energy Transition & Climate Change
97 keplercheuvreux.com
South Pole Group
http://www.thesouthpolegroup.com/sectors/financial-industry
Coverage
Includes scope 1, 2, and 3 (upstream and product-use downstream, other downstream categories on demand) for 50,000 companies. Avoided emissions data, using bottom-up approaches, on-demand. Listed issuing companies (fixed income and equity), Real Estate, Private Equity, Sovereign Bonds, unlisted fixed income issuers, Infrastructure, Forestry, Agriculture, Green Bonds, direct assets.
Methodology
Methodology to avoid double counting based on sector dependency data and life-cycle analysis principles. Estimation based on bottom-up sector-based modelling for Scope 1 and 2, environmentally extended input-output (EEIO) modelling for Scope 3 upstream and life-cycle analysis data for Scope 3 downstream. One-to-one company-sector mapping to proprietary classification system (800 sectors). Regionalisation on demand.
Data quality procedure
Collected from all available sources, validated and corrected (25% disregarded). All reported data point receives a "trust" value based on a range of parameters. All approximated data point receives a model quality rating.
Trends and benchmarks
Time-series data available since 2005 on demand, 2010 on the shelf. Forward-looking benchmark available
Availability of other data
Forward-looking analysis on trends, Climate Scoring for company trend analysis on cross-sectorial and sector-specific parameters. Reserve analysis, Carbon Underground 200 ™ Screenings, Power production analysis, sector deep-dives. Production and green-brown metrics available for a range of industries with 'homogenous' product portfolio Scoring across industries as well as industry specific and aggregated - in partnership with OEKOM. Other environmental indicators (water, biodiversity, forestry/deforestation).
Accessibility
1) Online (yourSRI.com, bloomberg tool APPS CARBON, Cleancapitalist.com ) with up/ download functions; 2) Via spreadsheet, data report (overview), full climate impact report, studies and case studies, capacity building and training workshops, direct data feed via API and as 360 climate change consultant; 3) Through partnerships (Ethifinance, CAER, CDP, Oekom Research, Bloomberg, Corporate Knights etc); 4) As service including labelling (Climate Transparent Investment, Climate Impact Reducing Investment, Climate Neutral Investment).
Three things we particularly like
Scope 3 data available for all companies covered, quantitative uncertainty assessment, other environmental data available and partnership with OEKOM.
Useful to know
No other ESG data available (beyond environmental data).
Energy Transition & Climate Change
98 keplercheuvreux.com
Sustainalytics
http://www.sustainalytics.com/carbon-solution-suite
Coverage
Includes scope 1 and 2 for 14,000 companies. No scope 3 data available (upstream or downstream). No data on avoided emissions. Listed companies (equity), private companies from 2016.
Methodology
No methodology to avoid double-counting. Sector-specific regression model based on disclosures (84, polynomial and non-linear) and other features including revenue, market capitalisation, environmental management data and total employees. One-to-one company-sector mapping to42 peer-groups. Next step for some sectors: sub-industry level. No regionalization for estimated data.
Data quality procedure
Estimated emissions models are tested with existing emissions (maximum tolerated average error = 20%). Data scrubbing for reported data (consider only 50% or more confidence in the reported data). For estimations: check for outliers.
Trends and benchmarks
Time-series data available since 2009. No forward-looking benchmark available.
Availability of other data
Green-brown metrics such as fossil Fuel Reserves (potential emissions), renewable energy and others. Scoring on exposure and management in relation to stranded assets, assessment preparedness, etc. Other environmental indicators available.
Accessibility
Email, FTP, online platform.
Three things we particularly like
Quantitative uncertainty assessment; other environmental data available; other ESG data available.
Useful to know
No scope 3 emissions; no other asset classes yet; no forward-looking benchmark available; no regionalisation for estimated data.
Energy Transition & Climate Change
99 keplercheuvreux.com
Trucost
www.trucost.com
Coverage
Includes scope 1, 2, and 3 upstream (5,600 companies, with ability to model 1,000s). Scope 3 downstream data on demand (based on life-cycle-analysis (LCA)). Avoided emissions data, using bottom-up approaches, on-demand. Listed equity, fixed income, infrastructure, real estate and methodology for sovereign bonds under development. Methodology for derivatives available for public consultation.
Methodology
No methodology to avoid double-counting between Scope 1 and 2 but can be done on demand based on electricity production data (or Scope 1 and 2) and on intersector dependency data for Scope 1,2, and 3). Estimation model: environmentally-extended input/output (EEIO) model for Scope 1, 2 and 3. Can be refined for some sectors with production data (electricity production, minerals extracted). One-to-many company-sector mapping to NAICS - 531 sectors. Regionalisation on demand for Scope 2 - Chinese specific emission factors soon to be available.
Data quality procedure
No uncertainty analysis. Data quality checks through internal checks, year-on-year changes, comparison with industry averages, engagement.
Trends and benchmarks
Time-series data available since 2004. Forward-looking benchmark available - partnership with 2° Investing Initiative to do the 2° Portfolio Benchmark analysis.
Availability of other data
Production metrics available on demand. Green-brown metrics such as share of renewables, revenue from green sectors. Scoring on carbon tax exposure in development. Other environmental indicators (waste, water, air/land/water pollution, land use) - both reported and estimated, all sectors.
Accessibility
Delivery online (e-board), spreadsheet, report, FTP.
Three things we particularly like
Upstream Scope 3 available and downstream Scope 3 data on demand for all companies covered; other environmental data available; time-series data since 2004.
Useful to know
No quantitative uncertainty analysis, no other ESG data (beyond environmental data).

Energy Transition & Climate Change
100keplercheuvreux.com
Vigeo
http://www.vigeo.com/csr-rating-agency/
Coverage
Includes Scope 1 and 2 for 2,000 companies and progressively increasing. No data on Scope 3 (upstream and downstream). Avoided emissions are evaluated in our sector-specific risk analysis to derive an Energy Transtion Score. Listed companies (equity and fixed income).
Methodology
No methodology to avoid double-counting. Estimates based on the nature of company's activities and size, on a sector-basis. Two methods: a linear regression based on revenue, market cap, and employees; and a sector average calculated for revenue, market cap and employees ratios. In addition, in specific cases where it is detected that neither the sector ratios, nor the correlation are strong enough, it is backed by a direct comparison of companies with the closest peers in terms of activity and size with reported data. One-to-many company-sector mapping to BICS - 38 sectors. Adapted for customisation purposes. No regionalisation for estimated data.
Data quality procedure
Reporting boundaries, scopes and coherence of data are checked for disclosed emissions. Highest and lowest values on each sector are revised. Standard deviations are calculated for all our ratios for each sector. In addition, the highest and lowest ratios for each sector are revised. Backtesting.
Trends and benchmarks
Time-series data available since 2013 for carbon footprint, ten years for energy transition score. No forward-looking benchmark available.
Availability of other data
Green-brown metrics are integrated in the sector-specific risk analysis to derive an Energy Transition Score. Emissions are categorised into four grades. Sector-specific risk analysis on several criteria (policies, development, results) is used to calculate an Energy Transition Score. The Energy Transition score covers a wide range of sector-specific risks and opportunities tied to climate change which are selected and weighted resulting in a consolidated Energy Transition Strategy score for each issuer. These specific criteria include, to name but a few, development of renewable energy, management of energy consumption and GHG emissions, management of impacts from the use and disposal of products, management of impacts from transportation, and development of green products and services among others. Other ESG data available.
Accessibility
Delivery via Vigeo's Extranet in the sections "Deliveries" or "Data Table", as well as via e-mail.
Three things we particularly like
Quantitative uncertainty assessment; other environmental and ESG data available; Energy-Transition Score.
Useful to know
No estimates for Scope 3; no data on other asset classes (beyond public equity and fixed income); no forward-looking benchmark available; no regionalisation for estimated data.
Energy Transition & Climate Change
101keplercheuvreux.com
Research ratings and important disclosures Disclosure checklist - Potential conflict of interests
Stock ISIN Disclosure (See Below) Currency Price
A2A IT0001233417 nothing to disclose EUR 1.28 ABB CH0012221716 nothing to disclose CHF 18.96
ABOITIZ EQUITY VENT. PHY0001Z1040 nothing to disclose PHP 55.7 Acciona ES0125220311 nothing to disclose EUR 77.20
ADANI POWER INE814H01011 nothing to disclose INR 28.6 Air Liquide FR0000120073 nothing to disclose EUR 123.65 Aixtron DE000A0WMPJ6 nothing to disclose EUR 7.32 AkzoNobel NL0000009132 nothing to disclose EUR 65.40
Alerion IT0004720733 nothing to disclose EUR 2.52 Alstom FR0010220475 nothing to disclose EUR 29.41 Andritz AT0000730007 nothing to disclose EUR 49.19 Ansaldo STS IT0003977540 nothing to disclose EUR 9.80 Arcadis NL0006237562 nothing to disclose EUR 23.05 BASF DE000BASF111 nothing to disclose EUR 76.35 BHP Billiton GB0000566504 nothing to disclose GBP 1,825.00 Bic FR0000120966 nothing to disclose EUR 150.75 Blue Solutions FR0011592104 15, 17, 19 EUR 22.50 BNP Paribas FR0000131104 nothing to disclose EUR 56.51 Bureau Veritas FR0006174348 nothing to disclose EUR 19.43 CAF ES0121975017 nothing to disclose EUR 256.10
CaixaBank ES0140609019 nothing to disclose EUR 3.48 Centrica GB00B033F229 nothing to disclose GBP 212.20
CHINA SHENHUA EN.'A' CNE100000767 nothing to disclose CNY 15.68 DANIELI IT0000076502 nothing to disclose EUR 18.83 E.ON DE000ENAG999 nothing to disclose EUR 8.89 EDP PTEDP0AM0009 nothing to disclose EUR 3.21 Enagas ES0130960018 nothing to disclose EUR 27.77 Ence ES0130625512 nothing to disclose EUR 3.64 ENEL IT0003128367 nothing to disclose EUR 4.21 ENI IT0003132476 14, 16, 18 EUR 14.86 ERG IT0001157020 nothing to disclose EUR 12.10 Eurofins FR0000038259 nothing to disclose EUR 318.10
Falck Renewables IT0003198790 nothing to disclose EUR 1.10 Iberdrola ES0144580Y14 nothing to disclose EUR 6.55 Imtech NL0010886891 nothing to disclose EUR 0.03 Inditex ES0148396007 nothing to disclose EUR 33.35 Intertek GB0031638363 nothing to disclose GBP 2,646.00 IREN IT0003027817 nothing to disclose EUR 1.47 Jeronimo Martins PTJMT0AE0001 nothing to disclose EUR 13.33 Kering FR0000121485 9 EUR 167.20 LafargeHolcim CH0012214059 nothing to disclose CHF 55.75 Legrand FR0010307819 6, 14, 16, 18 EUR 53.83 Linde DE0006483001 nothing to disclose EUR 165.75
MICROSOFT US5949181045 nothing to disclose USD 52.97 Nordex DE000A0D6554 nothing to disclose EUR 30.57 Novozymes DK0060336014 nothing to disclose DKK 328.00 Oerlikon CH0000816824 nothing to disclose CHF 9.76 Osram Licht DE000LED4000 nothing to disclose EUR 38.80 Pfeiffer Vacuum Technology DE0006916604 nothing to disclose EUR 108.85 Philips NL0000009538 nothing to disclose EUR 25.15 Royal Dutch Shell Plc nothing to disclose GBP 2,141.00 RWE DE0007037129 nothing to disclose EUR 11.40 S&T AT0000A0E9W5 8 EUR 5.05 Saeta Yield ES0105058004 nothing to disclose EUR 8.81 Saint-Gobain FR0000125007 nothing to disclose EUR 40.35 Schneider Electric FR0000121972 nothing to disclose EUR 57.91
SGS CH0002497458 nothing to disclose CHF 1,917.00 Siemens DE0007236101 nothing to disclose EUR 94.77 Sky GB0001411924 nothing to disclose GBP 1,091.00 Solvay BE0003470755 6 EUR 103.50 Statoil NO0010096985 nothing to disclose NOK 132.80 Talgo ES0105065009 15, 17, 19 EUR 5.82 Total FR0000120271 nothing to disclose EUR 46.46 Umicore BE0003884047 nothing to disclose EUR 38.94 Verbund AT0000746409 nothing to disclose EUR 13.61 Vossloh DE0007667107 nothing to disclose EUR 62.74 Wienerberger AT0000831706 6, 9 EUR 15.61 WPP JE00B8KF9B49 nothing to disclose GBP 1,514.00
Zehnder Group CH0276534614 nothing to disclose CHF 33.55 Zumtobel AT0000837307 nothing to disclose EUR 19.83
Source: Factset closing prices of 17/11/2015 Stock prices: Prices are taken as of the previous day’s close (to the date of this report) on the home market unless otherwise stated.
Energy Transition & Climate Change
102keplercheuvreux.com
Key:
Kepler Capital Markets SA (KCM) holds or owns or controls 100% of the issued shares of Crédit Agricole Cheuvreux SA (CA Cheuvreux), collectively hereafter KEPLER CHEUVREUX .
1. KEPLER CHEUVREUX holds or owns or controls 5% or more of the issued share capital of this company; 2. The company, or its major shareholder, directly or indirectly, holds or owns or controls 5% or more of the issued share capital of KEPLER CHEUVREUX; 3. KEPLER CHEUVREUX is or may be regularly carrying out proprietary trading in equity securities of this company; 4. KEPLER CHEUVREUX has been lead manager or co-lead manager in a public offering of the issuer’s financial instruments during the last twelve months; 5. KEPLER CHEUVREUX is a market maker in the issuer’s financial instruments; 6. KEPLER CHEUVREUX is a liquidity provider in relation to price stabilisation activities for the issuer to provide liquidity in such instruments; 7. KEPLER CHEUVREUX acts as a corporate broker or a sponsor or a sponsor specialist (in accordance with the local regulations) to this company; 8. KEPLER CHEUVREUX and the issuer have agreed that KEPLER CHEUVREUX will produce and disseminate investment research on the said issuer as a service to the issuer; 9. KEPLER CHEUVREUX has received compensation from this company for the provision of investment banking or financial advisory services within the previous twelve months; 10. KEPLER CHEUVREUX may expect to receive or intend to seek compensation for investment banking services from this company in the next three months; 11. The author of, or an individual who assisted in the preparation of, this report (or a member of his/her household), or a person who although not involved in the preparation of the report had or could reasonably be expected to have access to the substance of the report prior to its dissemination has a direct ownership position in securities issued by this company; 12. An employee of KEPLER CHEUVREUX serves on the board of directors of this company; 13. As at the end of the month immediately preceding the date of publication of the research report Kepler Capital Markets, Inc. beneficially owned 1% or more of a class of common equity securities of the subject company; 14. KEPLER CHEUVREUX and UniCredit Bank AG have entered into a Co-operation Agreement to form a strategic alliance in connection with certain services including services connected to investment banking transactions. UniCredit Bank AG provides investment banking services to this issuer in return for which UniCredit Bank AG has received a consideration or a promise of consideration. Separately, through the Co-operation Agreement with UniCredit Bank AG for services provided by KEPLER CHEUVREUX in connection with such activities, KEPLER CHEUVREUX has also a received consideration or a promise of a consideration in accordance with the general terms of the Co-operation Agreement; 15. KEPLER CHEUVREUX and Crédit Agricole Corporate & Investment Bank (“CACIB”) have entered into a Co-operation Agreement to form a strategic alliance in connection with certain services including services connected to investment banking transactions. CACIB provides investment banking services to this issuer in return for which CACIB has received a consideration or a promise of consideration. Separately, through the Co-operation Agreement with CACIB for services provided by KEPLER CHEUVREUX in connection with such activities, KEPLER CHEUVREUX has also received a consideration or a promise of a consideration in accordance with the general terms of the Co-operation Agreement; 16. UniCredit Bank AG holds or owns or controls 5% or more of the issued share capital of KEPLER CHEUVREUX. UniCredit Bank AG provides investment banking services to this issuer in return for which UniCredit Bank AG has received a consideration or a promise of consideration; 17. CACIB holds or owns or controls 15% of more of the issued share capital of KEPLER CHEUVREUX. CACIB provides investment banking services to this issuer in return for which CACIB has received a consideration or a promise of consideration; 18. An employee of UniCredit Bank AG serves on the board of directors of KEPLER CHEUVREUX; 19. Two employees of CACIB serve on the board of directors of KEPLER CHEUVREUX. CACIB provides investment banking services to this issuer in return for which CACIB has received a consideration or a promise of consideration.
We did not disclose the rating to the issuer before publication and dissemination of this document.
Rating ratio Kepler Cheuvreux Q3 2015 Rating breakdown A B Buy 45.8% 0.0% Hold 37.4% 0.0% Reduce 16.4% 0.0% Not Rated/Under Review/Accept Offer 0.4% 0.0% Total 100.0% 0.0% Source: Kepler Cheuvreux A: % of all research recommendations B: % of issuers to which Investment Banking Services are supplied
From 9 May 2006, KEPLER CHEUVREUX’s rating system consists of three ratings: Buy, Hold and Reduce. For a Buy rating, the minimum expected upside is 10% in absolute terms over 12 months. For a Hold rating the expected upside is below 10% in absolute terms. A Reduce rating is applied when there is expected downside on the stock. Target prices are set on all stocks under coverage, based on a 12-month view. Equity ratings and valuations are issued in absolute terms, not relative to any given benchmark.
Analyst disclosures
The functional job title of the person(s) responsible for the recommendations contained in this report is ESG Research Analyst unless otherwise stated on the cover.
Name of the ESG Research Analyst(s): Julie Raynaud
Regulation AC - Analyst Certification: Each ESG Research Analyst(s) listed on the front-page of this report, principally responsible for the preparation and content of all or any identified portion of this research report hereby certifies that, with respect to each issuer or security or any identified portion of the report with respect to an issuer or security that the ESG Research Analyst covers in this research report, all of the views expressed in this research report accurately reflect their personal views about those issuer(s) or securities. Each ESG Research Analyst(s) also certifies that no part of their compensation was, is, or will be, directly or indirectly, related to the specific recommendation(s) or view(s) expressed by that ESG Research Analyst in this research report.
Each ESG Research Analyst certifies that he is acting independently and impartially from KEPLER CHEUVREUX shareholders, directors and is not affected by any current or potential conflict of interest that may arise from any KEPLER CHEUVREUX activities.
Analyst Compensation: The research analyst(s) primarily responsible for the preparation of the content of the research report attest that no part of the analyst’s(s’) compensation was, is or will be, directly or indirectly, related to the specific recommendations expressed by the research analyst(s) in the research report. The research analyst’s(s’) compensation is, however, determined by the overall economic performance of KEPLER CHEUVREUX.
Registration of non-US Analysts: Unless otherwise noted, the non-US analysts listed on the front of this report are employees of KEPLER CHEUVREUX, which is a non-US affiliate and parent company of Kepler Capital Markets, Inc. a SEC registered and FINRA member broker-dealer. ESG Research Analysts employed by KEPLER CHEUVREUX, are not registered/qualified as research analysts under FINRA/NYSE rules, may not be associated persons of Kepler Capital Markets, Inc. and may not be subject to NASD Rule 2711 and NYSE Rule 472 restrictions on communications with covered companies, public appearances, and trading securities held by a research analyst account.
Please refer to www.keplercheuvreux.com for further information relating to research and conflict of interest management.

Energy Transition & Climate Change
103keplercheuvreux.com
Regulators Location Regulator Abbreviation
Kepler Capital Markets S.A - France Autorité des Marchés Financiers AMF
Kepler Capital Markets, Sucursal en España Comisión Nacional del Mercado de Valores CNMV
Kepler Capital Markets, Frankfurt branch Bundesanstalt für Finanzdienstleistungsaufsicht BaFin
Kepler Capital Markets, Milan branch Commissione Nazionale per le Società e la Borsa CONSOB
Kepler Capital Markets, Amsterdam branch Autoriteit Financiële Markten AFM
Kepler Capital Markets, Zurich branch Swiss Financial Market Supervisory Authority FINMA
Kepler Capital Markets, Inc. Financial Industry Regulatory Authority FINRA
Kepler Capital Markets, London branch Financial Conduct Authority FCA
Kepler Capital Markets, Vienna branch Austrian Financial Services Authority FMA
Crédit Agricole Cheuvreux, SA - France Autorité des Marchés Financiers AMF
Crédit Agricole Cheuvreux España S.V Comisión Nacional del Mercado de Valores CNMV
Crédit Agricole Cheuvreux Niederlassung Deutschland Bundesanstalt für Finanzdienstleistungsaufsicht BaFin
Crédit Agricole Cheuvreux S.A., branch di Milano Commissione Nazionale per le Società e la Borsa CONSOB
Crédit Agricole Cheuvreux Amsterdam Autoriteit Financiële Markten AFM
Crédit Agricole Cheuvreux Zurich Branch Swiss Financial Market Supervisory Authority FINMA
Crédit Agricole Cheuvreux North America, Inc. Financial Industry Regulatory Authority FINRA
Crédit Agricole Cheuvreux International Limited Financial Conduct Authority FCA
Crédit Agricole Cheuvreux Nordic AB Finansinspektionen FI
Kepler Capital Markets S.A and Crédit Agricole Cheuvreux SA, are authorised and regulated by both Autorité de Contrôle Prudentiel and Autorité des Marchés Financiers.
For further information relating to research recommendations and conflict of interest management please refer to www.keplercheuvreux.com..

Energy Transition & Climate Change
104keplercheuvreux.com
Legal and disclosure information Other disclosures
This product is not for retail clients or private individuals.
The information contained in this publication was obtained from various publicly available sources believed to be reliable, but has not been independently verified by KEPLER CHEUVREUX. KEPLER CHEUVREUX does not warrant the completeness or accuracy of such information and does not accept any liability with respect to the accuracy or completeness of such information, except to the extent required by applicable law.
This publication is a brief summary and does not purport to contain all available information on the subjects covered. Further information may be available on request. This report may not be reproduced for further publication unless the source is quoted.
This publication is for information purposes only and shall not be construed as an offer or solicitation for the subscription or purchase or sale of any securities, or as an invitation, inducement or intermediation for the sale, subscription or purchase of any securities, or for engaging in any other transaction. This publication is not for private individuals.
Any opinions, projections, forecasts or estimates in this report are those of the author only, who has acted with a high degree of expertise. They reflect only the current views of the author at the date of this report and are subject to change without notice. KEPLER CHEUVREUX has no obligation to update, modify or amend this publication or to otherwise notify a reader or recipient of this publication in the event that any matter, opinion, projection, forecast or estimate contained herein, changes or subsequently becomes inaccurate, or if research on the subject company is withdrawn. The analysis, opinions, projections, forecasts and estimates expressed in this report were in no way affected or influenced by the issuer. The author of this publication benefits financially from the overall success of KEPLER CHEUVREUX.
The investments referred to in this publication may not be suitable for all recipients. Recipients are urged to base their investment decisions upon their own appropriate investigations that they deem necessary. Any loss or other consequence arising from the use of the material contained in this publication shall be the sole and exclusive responsibility of the investor and KEPLER CHEUVREUX accepts no liability for any such loss or consequence. In the event of any doubt about any investment, recipients should contact their own investment, legal and/or tax advisers to seek advice regarding the appropriateness of investing. Some of the investments mentioned in this publication may not be readily liquid investments. Consequently it may be difficult to sell or realise such investments. The past is not necessarily a guide to future performance of an investment. The value of investments and the income derived from them may fall as well as rise and investors may not get back the amount invested. Some investments discussed in this publication may have a high level of volatility. High volatility investments may experience sudden and large falls in their value which may cause losses. International investing includes risks related to political and economic uncertainties of foreign countries, as well as currency risk.
To the extent permitted by applicable law, no liability whatsoever is accepted for any direct or consequential loss, damages, costs or prejudices whatsoever arising from the use of this publication or its contents.
KEPLER CHEUVREUX (and its affiliates) have implemented written procedures designed to identify and manage potential conflicts of interest that arise in connection with its research business, which are available upon request. The KEPLER CHEUVREUX research analysts and other staff involved in issuing and disseminating research reports operate independently of KEPLER CHEUVREUX Investment Banking business. Information barriers and procedures are in place between the research analysts and staff involved in securities trading for the account of KEPLER CHEUVREUX or clients to ensure that price sensitive information is handled according to applicable laws and regulations.
Country and region disclosures
United Kingdom: This document is for persons who are Eligible Counterparties or Professional Clients only and is exempt from the general restriction in section 21 of the Financial Services and Markets Act 2000 on the communication of invitations or inducements to engage in investment activity on the grounds that it is being distributed in the United Kingdom only to persons of a kind described in Articles 19(5) (Investment professionals) and 49(2) (High net worth companies, unincorporated associations, etc.) of the Financial Services and Markets Act 2000 (Financial Promotion) Order 2005 (as amended). It is not intended to be distributed or passed on, directly or indirectly, to any other class of persons. Any investment to which this document relates is available only to such persons, and other classes of person should not rely on this document.
United States: This communication is only intended for, and will only be distributed to, persons residing in any jurisdictions where such distribution or availability would not be contrary to local law or regulation. This communication must not be acted upon or relied on by persons in any jurisdiction other than in accordance with local law or regulation and where such person is an investment professional with the requisite sophistication to understand an investment in such securities of the type communicated and assume the risks associated therewith.
This communication is confidential and is intended solely for the addressee. It is not to be forwarded to any other person or copied without the permission of the sender. This communication is provided for information only. It is not a personal recommendation or an offer to sell or a solicitation to buy the securities mentioned. Investors should obtain independent professional advice before making an investment.
Notice to U.S. Investors: This material is not for distribution in the United States, except to “major US institutional investors” as defined in SEC Rule 15a-6 ("Rule 15a-6"). Kepler Cheuvreux refers to Kepler Capital Markets, Société anonyme (S.A.) (“Kepler Capital Markets SA”) and its affiliates, including CA Cheuvreux, Société Anonyme (S.A.). Kepler Capital Markets SA has entered into a 15a-6 Agreement with Kepler Capital Markets, Inc. ("KCM, Inc.”) which enables this report to be furnished to certain U.S. recipients in reliance on Rule 15a-6 through KCM, Inc.
Each U.S. recipient of this report represents and agrees, by virtue of its acceptance thereof, that it is a "major U.S. institutional investor" (as such term is defined in Rule 15a-6) and that it understands the risks involved in executing transactions in such securities. Any U.S. recipient of this report that wishes to discuss or receive additional information regarding any security or issuer mentioned herein, or engage in any transaction to purchase or sell or solicit or offer the purchase or sale of such securities, should contact a registered representative of KCM, Inc.
KCM, Inc. is a broker-dealer registered with the Securities and Exchange Commission (“SEC”) under the U.S. Securities Exchange Act of 1934, as amended, Member of the Financial Industry Regulatory Authority (“FINRA”) and Member of the Securities Investor Protection Corporation (“SIPC”). Pursuant to SEC Rule 15a-6, you must contact a Registered Representative of KCM, Inc. if you are seeking to execute a transaction in the securities discussed in this report. You can reach KCM, Inc. at 600 Lexington Avenue, New York, NY 10022, Compliance Department (212) 710-7625; Operations Department (212) 710-7606; Trading Desk (212) 710-7602. Further information is also available at www.keplercapitalmarkets.com. You may obtain information about SIPC, including the SIPC brochure, by contacting SIPC directly at 202-371-8300; website: http://www.sipc.org/
KCM, Inc. is a wholly owned subsidiary of Kepler Capital Markets SA. Kepler Capital Markets SA, registered on the Paris Register of Companies with the number 413 064 841 (1997 B 10253), whose registered office is located at 112 avenue Kléber, 75016 Paris, is authorised and regulated by both Autorité de Contrôle Prudentiel (ACP) and Autorité des Marchés Financiers (AMF).
Nothing herein excludes or restricts any duty or liability to a customer that KCM, Inc. may have under applicable law. Investment products provided by or through KCM, Inc. are not insured by the Federal Deposit Insurance Corporation and are not deposits or other obligations of any insured depository institution, may lose value and are not guaranteed by the entity that published the research as disclosed on the front page and are not guaranteed by KCM, Inc.
Investing in non-U.S. Securities may entail certain risks. The securities referred to in this report and non-U.S. issuers may not be registered under the U.S. Securities Act of 1933, as amended, and the issuer of such securities may not be subject to U.S. reporting and/or other requirements. Rule 144A securities may be offered or sold only to persons in the U.S. who are Qualified Institutional Buyers within the meaning of Rule 144A under the Securities Act. The information available about non-U.S. companies may be limited, and non-U.S. companies are generally not subject to the same uniform auditing and reporting standards as U.S. companies. Securities of some non-U.S. companies may not be as liquid as securities of comparable U.S. companies. Securities discussed herein may be rated below investment grade and should therefore only be considered for inclusion in accounts qualified for speculative investment.

Energy Transition & Climate Change
105keplercheuvreux.com
Analysts employed by Kepler Capital Markets SA, a non-U.S. broker-dealer, are not required to take the FINRA analyst exam. The information contained in this report is intended solely for certain "major U.S. institutional investors" and may not be used or relied upon by any other person for any purpose. Such information is provided for informational purposes only and does not constitute a solicitation to buy or an offer to sell any securities under the Securities Act of 1933, as amended, or under any other U.S. federal or state securities laws, rules or regulations. The investment opportunities discussed in this report may be unsuitable for certain investors depending on their specific investment objectives, risk tolerance and financial position.
In jurisdictions where KCM, Inc. is not registered or licensed to trade in securities, or other financial products, transactions may be executed only in accordance with applicable law and legislation, which may vary from jurisdiction to jurisdiction and which may require that a transaction be made in accordance with applicable exemptions from registration or licensing requirements.
The information in this publication is based on sources believed to be reliable, but KCM, Inc. does not make any representation with respect to its completeness or accuracy. All opinions expressed herein reflect the author's judgment at the original time of publication, without regard to the date on which you may receive such information, and are subject to change without notice.
KCM, Inc. and/or its affiliates may have issued other reports that are inconsistent with, and reach different conclusions from, the information presented in this report. These publications reflect the different assumptions, views and analytical methods of the analysts who prepared them. Past performance should not be taken as an indication or guarantee of future performance, and no representation or warranty, express or implied, is provided in relation to future performance.
KCM, Inc. and any company affiliated with it may, with respect to any securities discussed herein: (a) take a long or short position and buy or sell such securities; (b) act as investment and/or commercial bankers for issuers of such securities; (c) act as market makers for such securities; (d) serve on the board of any issuer of such securities; and (e) act as paid consultant or advisor to any issuer. The information contained herein may include forward-looking statements within the meaning of U.S. federal securities laws that are subject to risks and uncertainties. Factors that could cause a company's actual results and financial condition to differ from expectations include, without limitation: political uncertainty, changes in general economic conditions that adversely affect the level of demand for the company's products or services, changes in foreign exchange markets, changes in international and domestic financial markets and in the competitive environment, and other factors relating to the foregoing. All forward-looking statements contained in this report are qualified in their entirety by this cautionary statement.
France: This publication is issued and distributed in accordance with Articles L.544-1 and seq and R. 621-30-1 of the Code Monétaire et Financier and with Articles 313-25 to 313-27 and 315-1 and seq of the General Regulation of the Autorité des Marchés Financiers (AMF).
Germany: This report must not be distributed to persons who are retail clients in the meaning of Sec. 31a para. 3 of the German Securities Trading Act (Wertpapierhandelsgesetz – “WpHG”). This report may be amended, supplemented or updated in such manner and as frequently as the author deems.
Italy: This document is issued by Kepler Capital Markets, Milan branch and Crédit Agricole Cheuvreux S.A., branch di Milano, authorised in France by the Autorité des Marchés Financiers (AMF) and the Autorité de Contrôle Prudentiel (ACP) and registered in Italy by the Commissione Nazionale per le Società e la Borsa (CONSOB) and is distributed by Kepler Capital Markets S.A and Crédit Agricole Cheuvreux, Société Anonyme (S.A.), authorised in France by the AMF and the ACP and registered in Italy by CONSOB. This document is for Eligible Counterparties or Professional Clients only as defined by the CONSOB Regulation 16190/2007 (art. 26 and art. 58).Other classes of persons should not rely on this document. Reports on issuers of financial instruments listed by Article 180, paragraph 1, letter a) of the Italian Consolidated Act on Financial Services (Legislative Decree No. 58 of 24/2/1998, as amended from time to time) must comply with the requirements envisaged by articles 69 to 69-novies of CONSOB Regulation 11971/1999. According to these provisions Kepler Capital Markets S.A and Crédit Agricole Cheuvreux, Société Anonyme (S.A.)warns on the significant interests of Kepler Capital Markets S.A and Crédit Agricole Cheuvreux, Société Anonyme (S.A.)indicated in Annex 1 hereof, confirms that there are not significant financial interests of Kepler Capital Markets S.A and Crédit Agricole Cheuvreux, Soci été Anonyme (S.A.)in relation to the securities object of this report as well as other circumstance or relationship with the issuer of the securities object of this report (including but not limited to conflict of interest, significant shareholdings held in or by the issuer and other significant interests held by Kepler Capital Markets S.A and Crédit Agricole Cheuvreux, Société Anonyme (S.A.)or other entities controlling or subject to control by Kepler Capital Markets S.A and Crédit Agricole Cheuvreux, Société Anonyme (S.A.)in relation to the issuer which may affect the impartiality of this document]. Equities discussed herein are covered on a continuous basis with regular reports at results release. Reports are released on the date shown on cover and distributed via print and email. Kepler Capital Markets, Milan branch and Crédit Agricole Cheuvreux S.A., branch di Milano analysts are not affiliated with any professional groups or organisations. All estimates are by Kepler Capital Markets S.A and Crédit Agricole Cheuvreux, Société Anonyme (S.A.) unless otherwise stated.
Spain: This document is only intended for persons who are Eligible Counterparties or Professional Clients within the meaning of Article 78bis and Article 78ter of the Spanish Securities Market Act. It is not intended to be distributed or passed on, directly or indirectly, to any other class of persons. This report has been issued by Kepler Capital Markets, Sucursal en España and Crédit Agricole Cheuvreux España S.V, registered in Spain by the Comisión Nacional del Mercado de Valores (CNMV) in the foreign investments firms registry and it has been distributed in Spain by it or by Kepler Capital Markets S.A and Crédit Agricole Cheuvreux, Société Anonyme (S.A.) authorised and regulated by both Autorité de Contrôle Prudentiel and Autorité des Marchés Financiers. There is no obligation to either register or file any report or any supplemental documentation or information with the CNMV. In accordance with the Spanish Securities Market Law (Ley del Mercado de Valores), there is no need for the CNMV to verify, authorise or carry out a compliance review of this document or related documentation, and no information needs to be provided.
Switzerland: This publication is intended to be distributed to professional investors in circumstances such that there is no public offer. This publication does not constitute a prospectus within the meaning of Articles 652a and 1156 of the Swiss Code of Obligations.
Canada: The information provided in this publication is not intended to be distributed or circulated in any manner in Canada and therefore should not be construed as any kind of financial recommendation or advice provided within the meaning of Canadian securities laws.
Other countries: Laws and regulations of other countries may also restrict the distribution of this report. Persons in possession of this document should inform themselves about possible legal restrictions and observe them accordingly.

Local insight, European scale
keplercheuvreux.com
ESG research team
Julie Raynaud Main Author
+44 207 621 5190
Samuel Mary [email protected]
+44 207 621 5190
Sudip Hazra [email protected]
+33 1 7081 5761
Julie Raynaud is a Senior Sustainability Analyst in Kepler Cheuvreux’s ESG team, specialising in environmental research.
Prior to joining Kepler Cheuvreux in September 2015, Julie worked for nearly four years in the corporate research team at Trucost, an ESG data and insight provider specialising in natural capital risks, ecosystem services and monetary valuations.
In particular, she led public reports such as the UNEP-funded Valuing Plastics report and participated in private research for clients such as General Mills, Carlsberg, LVMH and Novo Nordisk. She was also part of the Puma product-level Environmental Profit and Loss account team.
She graduated first in her class with an MSc in Management from Imperial College London Business School and has a BA 1:1 Honours in International Development Studies from McGill University in Montreal.
Stéphane Voisin Head of ESG
+33 1 7081 5762
Europe
Amsterdam +31 20 573 06 66 Frankfurt +49 69 756 960 Geneva +41 22 361 5151 London +44 20 7621 5100 Madrid +34 914365100 Milan +39 02 85507 1 Paris +33 1 53 65 35 00 Stockholm +46 8 723 51 00 Vienna +43 1 537 124 147 Zurich +41 43 333 66 66
America & Asia
Boston +1 617 295 0100 New York +1 212 710 7600 San Francisco +1 415 255 9802