37? - digital library/67531/metadc277971/m2/1/high... · 37? at 6> i svo, ~70tf conditional...
TRANSCRIPT
37? At 6> I
SVO, ~70tf
CONDITIONAL DISCRIMINATIONS AND DERIVED RELATIONS
PINPOINTING THE MOMENT OF EMERGENCE
THESIS
Presented to the Graduate Council of the
University of North Texas in Partial
Fulfillment of the Requirements
For the Degree of
MASTER OF SCIENCE
By
Manish Vaidya, B.A.A.S
Denton, Texas
August, 1994

<1
Vaidya, Manish, Conditional Discriminations and Derived
Relations: Pinpointing the Moment of Emergence. Master of
Science (Behavior Analysis), August, 1994, 108 pp., 32
illustrations, bibliography, 19 titles.
Four subjects were exposed to the four trial types that
define stimulus equivalence from the beginning of the
experiment. Procedures were designed to identify
acquisition dynamics and relate these observations to
responding indicative of equivalence class formation. The
data show that, for all subjects, the acquisition of
training conditional discriminations was correlated with
systematic changes in the subjects' selection responses.
The results also indicate that the traditional percent
correct measures obscure some important information about
the subjects' behavior. The data are discussed in the
context of the following statements. 1) Subjects'
performances on derived trials are not indicative of
relations among stimuli at some other level of analysis but
are instances of "equivalencing". 2) "Equivalencing" itself
can be characterized as changes in the conditional and
conditionally discriminative functions of stimuli involved
in the experiment. The potential benefits of this
preparation are discussed.

TABLE OF CONTENTS
Page
LIST OF ILLUSTRATIONS iv
Chapter
I. INTRODUCTION 1
II. METHOD 13
Subjects Apparatus
Procedure
III. RESULTS 19
IV. DISCUSSION 98
REFERENCES 106

LIST OF ILLUSTRATIONS
Page
Figure 1. Schematic representation of the stimuli and trial types involved in a 3-choice match-to-sample task 3
Figure 2. Arrangement of sample and comparison stimuli on the monitor 16
Figure 3. List of all trial types in a 3-choice conditional discrimination task 17
Figure 4. Percent of correct trials per session for all configurations of stimuli for four subjects . 23
Figure 5. Trial by trial data for all trial types involving stimuli Al, B1 and CI for SI . . . 25
Figure 6. Trial by trial data for all trial types involving stimuli A2, B2 and C2 for SI . . . 27
Figure 7. Trial by trial data for all trial types involving stimuli A3, B3 and C3 for SI . . . 29
Figure 8. Cumulative frequencies of selection for all A-B (trained) and all B-A (symmetry) configurations for SI 32
Figure 9. Cumulative frequencies of selection for all B-C (trained) and all C-B (symmetry) configurations for SI 34
Figure 10. Cumulative frequencies of selection for all A-C (transitive) and C-A (symmetrically transitive) configurations for SI 36
Figure 11. Trial by trial data for all trial types involving stimuli Al, B1 and CI for S2 . . . 40
Figure 12. Trial by trial data for all trial types involving stimuli A2, B2 and C2 for S2 . . . 42
Figure 13. Trial by trial data for all trial types involving stimuli A3, B3 and C3 for S2 . . . 44

Figure 14. Cumulative frequencies of selection for all A-B (trained) and all B-A (symmetry) configurations forS2 47
Figure 15. Cumulative frequencies of selection for all B-C (trained) and all C-B (symmetry) configurations for S2 49
Figure 16. Cumulative frequencies of selection for all A-C (transitive) and C-A (symmetrically transitive) configurations for S2 51
Figure 17. Trial by trial data for all trial types involving stimuli Al, B1 and CI for S3 . . . 58
Figure 18. Trial by trial data for all trial types involving stimuli A2, B2 and C2 for S3 . . . 60
Figure 19. Trial by trial data for all trial types involving stimuli A3, B3 and C3 for S3 . . . 62
Figure 20. Cumulative frequencies of selection for all A-B (trained) and all B-A (symmetry) configurations for S3 65
Figure 21. Cumulative frequencies of selection for all B-C (trained) and all C-B (symmetry) configurations for S3 67
Figure 22. Cumulative frequencies of selection for all A-C (transitive) and C-A (symmetrically transitive) configurations for S3 69
Figure 23. Trial by trial data for all trial types involving stimuli Al, B1 and CI for S3 . . . 73
Figure 24. Trial by trial data for all trial types involving stimuli A2, B2 and C2 for S3 . . . 75
Figure 25. Trial by trial data for all trial types involving stimuli A3, B3 and C3 for S3 . . . 77
Figure 26. Cumulative frequencies of selection for all A-B (trained) and all B-A (symmetry) configurations for S3 80
Figure 27. Cumulative frequencies of selection for all B-C (trained) and all C-B (symmetry) configurations for S3 82

VI
Figure 28. Cumulative frequencies of selection for all A-C (transitive) and C-A (symmetrically transitive) configurations for S3 84
Figure 29. Cumulative frequencies of selection of the experimenter designated "correct" stimulus given novel configurations for SI 89
Figure 30. Cumulative frequencies of selection of the experimenter designated "correct" stimulus given novel configurations forS2 91
Figure 31. Cumulative frequencies of selection of the experimenter designated "correct" stimulus given novel configurations for S3 93
Figure 32. Cumulative frequencies of selection of the experimenter designated "correct" stimulus given novel configurations for S4 95

CHAPTER 1
INTRODUCTION TO THE STUDY
Stimulus equivalence is demonstrated when, after
training a series of conditional discriminations among sets
of arbitrary stimuli (given A pick B, given B pick C),
untrained conditional discriminations are observed with
subjects in the same experimental setting. If, for example,
in the presence of the spoken word "cat" (A) human subjects
who have no English language history are trained to select
the written word CAT (B) and in the presence of the written
word CAT (B) subjects are trained to select a picture of a
cat (C), they will, without further training, respond
relationally in several other ways. In the presence of the
written word CAT (B) they will select the spoken word "cat"
(A) and in the presence of a picture of a cat (C) they will
select the written word CAT (B). Additionally, in the
presence of the spoken word "cat" (A) subjects will pick the
picture of a cat (C) and in the presence of a picture of a
cat subjects will pick the spoken word "cat" (A). The
subjects' untrained conditional discriminations are said to
exemplify reflexive, symmetric and transitive relations
among stimuli involved in the originally trained conditional
discriminations (Sidman, 1990; Sidman & Tailbv, 1982) .
Reflexive relations among stimuli are said to exist
when subjects select comparison stimuli that are physically
identical to the sample stimuli (Fig. 1). Symmetrical
relations are said to exist when subjects respond in
predictable ways to sanqple and comparison stimuli when their
roles are reversed relative to the originally trained
conditional discriminations (i.e., subject picks Al given B1
when explicitly trained to pick B1 given Al during original
conditional discrimination training). Transitive relations
among the originally trained stimuli are said to exist when
the selection of comparisons from one of the originally
trained conditional discriminations occurs reliably under
control of sample stimuli from other originally trained
conditional discriminations (i.e., trained to pick B1 given
Al and to pick CI given Bl, the subject picks CI given Al).
Symmetrically transitive relations are said to exist when
selections are under combined control of symmetric and
transitive relations among stimuli involved in the original
conditional discrimination training (Sidman, 1986, 1992;
Sidman & Tailby, 1982; cf. Saunders & Green, 1992 for an
alternative discussion of these definitions).
The formation of equivalence classes has traditionally
been investigated using a train-and-test preparation. The
typical stimulus equivalence experiment involves training
the original relations to some degree of accuracy (defined
arbitrarily by the experimenter) and testing for the
6 S to
6 6 w
A1 A2 A3 (
1 ' t 1
B1 B2 B3
> f y t > >
CI C2
< C3
P 3 w
W VJ 3 - 3 "S P> 3 w
Fig. 1: Schemat ic represen ta t ion of the condit ional discr iminat ions involved in a 3 choice m a t c h - t o - s a m p l e task. The double lines indicate t ra ined condit ional discr iminat ions and the single lines indicate novel, un t ra ined conditional discriminations. For all re la t ions indicated, t he arrows point to the comparison stimuli. The st imuli in the horizontal rows were always p resen ted toge ther in the comparison array.

emergence of relations that indicate the existence of
equivalence classes. Notice, however, that the terms used
to describe subjects' behavior in equivalence tasks imply-
more than what is directly observable. That is, in terms of
specifiable behavior-environment interactions, the training
and testing can be said to consist of nothing more than
conditional discriminations. From this perspective,
original relations training can be said to be complete when
particular sample stimuli exert reliable conditional control
over the discriminative functions of particular cotrqparison
stimuli. In a similar sense, equivalence relations can be
said to have formed when we see that the conditional and
discriminative functions of the stimuli involved in the
training have become interchangeable. The identification of
stimulus function interchangeability as the dependent
variable of interest allows us to talk about stimulus
equivalence in purely procedural terms. Terms that imply
the formation of relations among stimuli are then reserved
until we have some evidence to invoke them.
From this perspective, there are some issues that have
not been completely resolved. What, for example, are the
conditions under which stimulus function interchangeability
will reliably occur? Under what conditions will it not
occur? How is the acquisition of conditional and
discriminative functions by stimuli during training related
to the "emergent" interchangeability of those functions
during test trials? How do the training and testing trial
configurations affect conditional and discriminative
function interchangeability?
There has been some interest in these issues.
Researchers at the City University of New York (CUNY), for
example, have investigated at least one such necessary
condition by examining nodes (Fields & Verhave, 1987;
Fields, Verhave & Fath, 1984). A node is any stimulus which
serves either as a sample or comparison or both in two or
more originally trained conditional discriminations.
According to Fields and Verhave (1987), "N stimuli can
become a class if (N-l) two-term relations are established
by training and if each of the stimuli in the class is used
in at least one of the two-term training relations" (p.
317). Similarly, Sidman and his colleagues have commented
at length (e.g., Carrigan & Sidman, 1992; Johnson & Sidman,
1993; Sidman, 1980; 1987; 1992; Stikeleather & Sidman, 1990)
on the different kinds of stimulus control relations that
can emerge during an experiment. They have also identified
some procedures to allow better specification of the nature
of the stimulus control relation that obtains between
stimuli within the context of the experiment (Johnson &
Sidman, 1993; Sidman, 1987; 1992). Sidman (1987), for
example, points out that the use of only two choices in the
comparison array does not allow a precise specification of
the kind of stimulus control (S+/S-) responsible for the

selection response. For example, we may train a subject to
select Bl and not B2 in the presence of Al. The source of
control for the selection of B2 and not Bl in the presence
of A2, however, might be the conditionally discriminative
function of B2 in the presence of A2 or simply the rejection
of Bl given A2. The use of at least three stimuli in a
comparison array obviates this problem. These kinds of
suggestions have allowed a greater specification of the
procedural requirements for occasioning and measuring the
interchangeability of stimulus functions.
The role of reinforcement in the acquisition of the
original conditional discriminations has also been evaluated
(e.g., Harrison & Green, 1990/ Saunders, Saunders, Kirby &
Spradlin, 1988). Saunders et al. (1988) presented subjects
with conditional discrimination trials in which the samples
were selected from one pre-existing equivalence class and
the comparisons from another equivalence class. No
differential consequences were programmed for any responses.
The researchers reported that the subjects reliably picked a
particular comparison in the presence of a particular
sample. They further reported that "[s]ubsequent tests
showed the emergence of equivalence relations between
stimuli from classes linked by the unreinforced conditional
selections" (Saunders et al., 1988, p.145).
Harrison and Green (1990), in a similar vein, were able
to establish original conditional discriminations without
reinforcement. The original conditional discriminations
were trained by presenting the desired sample-comparison
pairs together while varying the other comparison stimulus
in a two-choice match-to-sample preparation. No
differential consequences were programmed for any responses.
In Experiment 1, the researchers trained original
conditional discriminations with three adult subjects using
the method just described. Subsequent tests for
transitivity, according to the authors, were equivocal. In
a second experiment, the researchers trained original
conditional discriminations with four children in a similar
manner. Subsequent tests, according to the authors,
demonstrated the emergence of equivalence classes with one
subject and the emergence of symmetry without equivalence
for another. Of the two remaining subjects, one failed to
acquire the original conditional discriminations at all, and
another failed to demonstrate the emergence of derived
relations after acquiring the original conditional
discriminations (Harrison & Green, 1990).
It is important to note that in terms of specifiable
behavior-environment interactions the failure to demonstrate
the emergence of equivalence relations is not equivalent to
the absence of responding. Rather, it is the non-occurrence
of predicted conditional discriminations. Any conditional
discriminations that may be occurring are obscured by the
use of percent correct as the dependent measure. The

8
combined use of train-and-test methods and percent correct
as the dependent measure have given equivalence a somewhat
static characteristic. Equivalence classes seem to lose the
dynamic feature typical of behavior-environment
interactions.
A common finding reported in the equivalence literature
is the emergence of derived relations during repeated
exposure to testing trials. This has given rise to
questions involving the role of testing conditions in the
formation of equivalence classes and, relatedly, the
existence of such classes prior to testing (Saunders,
Spradlin & Saunders, 1989). Saunders et al. (1989), for
example, trained conditional discriminations and reported
the emergence of responding indicative of four 3-member
equivalence classes (A1-B1-C1, A2-B2-C2, E1-F1-G1 and E2-F2-
G2) during phase 1. The first two classes of stimuli (A#-
B#-C#) were functionally distinct from the last two classes
(E#-F#-G#). In phase 2, they arranged for unreinforced
conditional discriminations in which the samples were drawn
from the first two classes and the comparisons from the last
two classes. Previous research on the expansion of
equivalence classes suggested that the conditional
discriminations occurring during phase 2 would have resulted
in a merger of previously independent equivalence classes.
Rather than presenting the tests at this point, however, the
experimenters reversed the conditional discriminations that

were observed during phase 2 via differential reinforcement
(phase 3). The presentation of probe trials, following the
reversal, occasioned responding that was indicative of
equivalence relations consistent with the conditional
discriminations observed during phase 2. The authors
concluded that equivalence classes had formed following the
conditional discrimination history of phase 2 even though
they were not tested for until the end of phase 3. In other
words, the authors concluded that equivalence class
formation had occurred prior to testing for the emergence of
the equivalence classes.
Mcllvane and Dube (1990) suggest that "questions such
as 'do stimulus classes exist before they are tested' are
not good ones to ask" (p. 7). Indeed, whether or not
stimulus classes exist before they are tested is not an
answerable question in that the tests are required to
document the existence of equivalence classes. These kinds
of questions "create conceptual problems that behavior
analysis usually helps us to avoid" (Mcllvane & Dube, 1990,
p. 13). This is not to say that the question, per se, is
not worth asking. Rather, the form of the question and the
inadequacy of the standard experimental preparation to
provide an unequivocal answer are problematic.
The present study sought an alternative approach to
addressing these problems. Specifically of interest were
the changes in behavior that occurred during training of the

10
original conditional discriminations, and related changes
indicative of untrained relational responding. There were
two important requirements that had to be met in order to
pursue such an approach. First, I had to be able to measure
more precisely the acquisition of the original conditional
discriminations. Second, I had to be able to observe the
"path" by which stimulus functions became interchangeable.
The first of these requirements was met with a slight
modification of Touchette's (1971) procedure for measuring
the moment of transfer of a discriminative stimulus
function. The second requirement was met by replacing the
traditional train-and-test preparation with an alternative
procedure.
Touchette (1971) trained simple form discriminations
using a delayed prompting procedure. The subjects' pressing
responses were brought under discriminative control of a red
key (Sd) as opposed to a simultaneously present white key.
A black figure (target stimulus) was then superimposed on
the red key. Any response to the compound stimulus (black
figure - red key) resulted in a change in presentation
conditions of the following trial: the onset of the red
background was delayed by 500 milliseconds. Pressing
responses occurring under control of the black figures prior
to the onset of the red background in any trial were said to
be indicative of the transfer (or extension) of the
discriminative function of the red background to the

11
previously neutral black figures. Measurement of the point,
during the experiment, at which the black figures were
consistently selected before onset of the red background
allowed a specification of the "moment of stimulus control
transfer" (Touchette, 1971). In the present study, the
moment of acquisition of the original conditional
discrimination was pinpointed in the same way with a slight
modification of Touchette's (1971) procedure.
The second requirement was to ascertain when stimulus
functions become interchangeable. There is evidence that
conditional discriminations indicative of derived relations
emerge during the post-training probe trials (e.g.,
Saunders, Spradlin & Saunders, 1989; Stikeleather & Sidman,
1990). This suggests that the configuration of stimuli
during probe trials plays an important role in the
occurrence of the novel conditional discriminations during
probe trials. Tracking the emergence of novel conditional
responding has not been possible, however, because of the
train-and-test preparation and the use of percent correct as
the dependent measure during the probe trials. An
alternative was to pinpoint the emergence of novel
conditional discriminations relative to the acquisition of
the original conditional discriminations by presenting all
configurations (training and testing) from the beginning of
the experiment. The purpose of such an approach was to
specify more precisely the relationship between the

12
acquisition of the original conditional discriminations and
the "emergent" stimulus function interchangeability.
To restate, the questions of interest in this
experiment were: 1) How is the acquisition of conditional
and discriminative functions by stimuli during training
related to the "emergent" interchangeability of those
functions during test trials? 2) What is the role of the
training and testing trial configurations on conditional and
discriminative function interchangeability? This experiment
attempted to shed some light on these questions.

CHAPTER II
METHOD
Subjects
Four students at the University of North Texas served
as subjects during the experiment. The subjects were
recruited through an advertisement placed in the classified
section of the city newspaper. The criteria for inclusion
included no exposure to behavior analysis or psychology
classes. Subjects were not allowed to take any materials
(including watches, purses, etc.) into the lab.
getting
All sessions were conducted in one of the human
behavior laboratories at the Center for Behavior Analysis.
Apparatus
Throughout the experiment subjects interacted with an
IBM-compatible 80386 PC and a 640 x 480 resolution VGA
monitor. All selection responses (defined below) were made
using a Logitech mouse. The custom-written software
presented randomized trials, collected latency and selection
data and delivered points according to the experimenter's
specifications.

14
Stimuli
Nine 2-dimensional figures were used as stimuli during
the entire experiment. Each figure was enclosed in a 120 x
120 pixel frame. The geometric dimensions of the figures
were arbitrary to preclude the possibility that the stimulus
dimensions might have a pre-existing function in the
subjects' repertoires.
The selection response
The "selection response", in the context of this
experiment, was defined as the placement of a cursor within
the 120 X 120 pixel frame containing a figure followed by a
press of the left-most button on the mouse.
iiiswctj-gns
Subjects were given an instruction sheet immediately
prior to the first session. The experimenter read aloud
from the instruction sheet while the subject read along on
his/her copy. The subjects were told only that 1) the mouse
and its left-most button would be used exclusively during
the entire experiment and that 2) their task was to try to
earn as much money as possible. Any other interactions were
kept to a minimum and no further instructions were given for
the remainder of the experiment.
Procedure
Structural specifications of the trials: When a
subject entered the lab he/she saw the words "Press spacebar
to begin" on the monitor. A press on the spacebar initiated
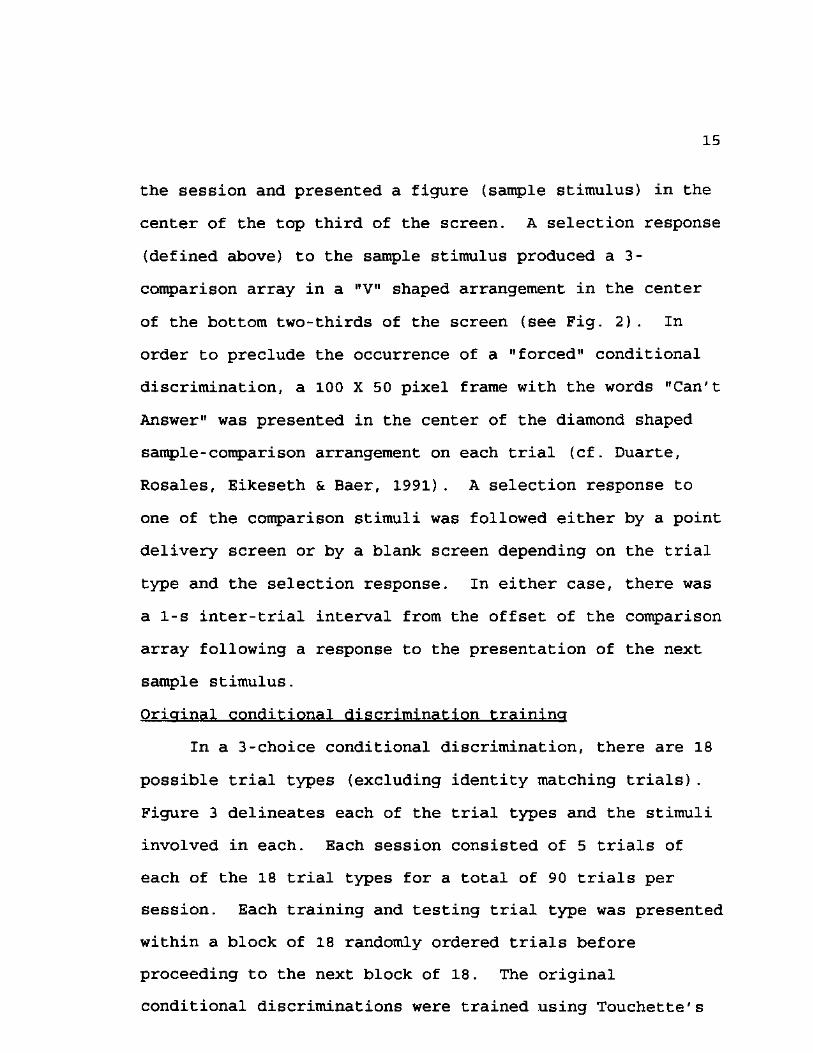
15
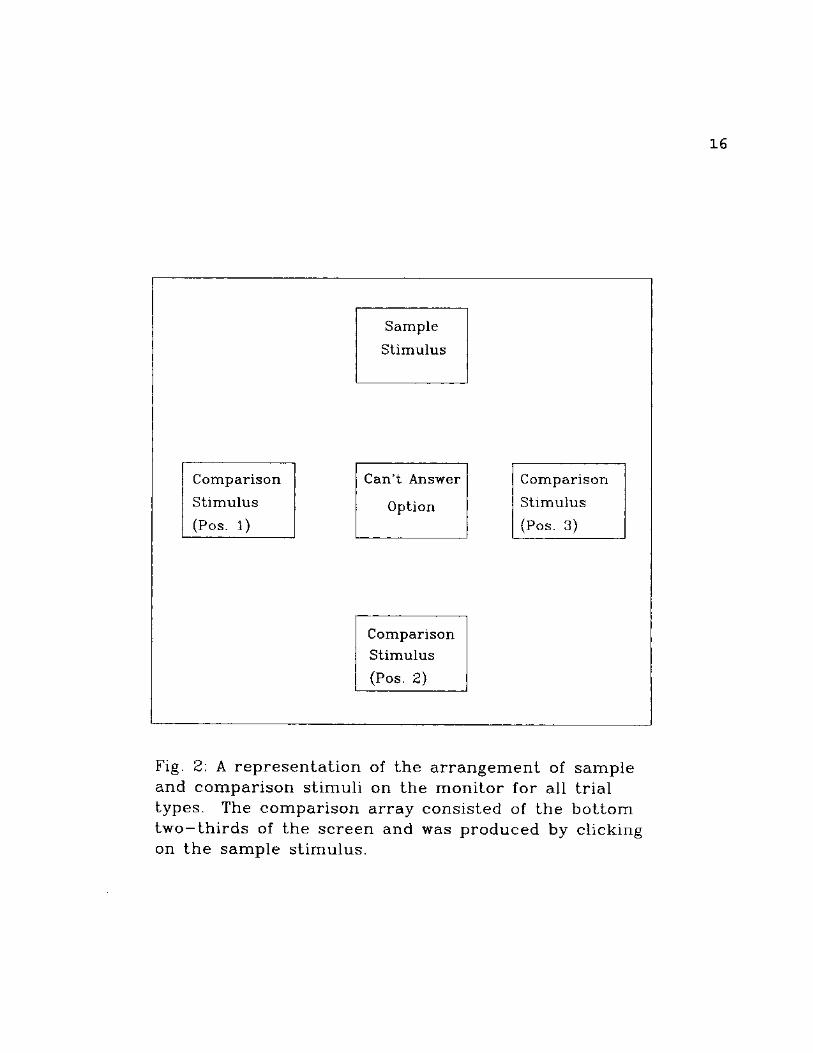
the session and presented a figure (sample stimulus) in the
center of the top third of the screen. A selection response
(defined above) to the sample stimulus produced a 3-
comparison array in a "V" shaped arrangement in the center
of the bottom two-thirds of the screen (see Fig. 2). In
order to preclude the occurrence of a "forced" conditional
discrimination, a 100 X 50 pixel frame with the words "Can't
Answer" was presented in the center of the diamond shaped
sample-comparison arrangement on each trial (cf. Duarte,
Rosales, Eikeseth & Baer, 1991). A selection response to
one of the comparison stimuli was followed either by a point
delivery screen or by a blank screen depending on the trial
type and the selection response. In either case, there was
a l-s inter-trial interval from the offset of the comparison
array following a response to the presentation of the next
sample stimulus.
Original conditional discrimination training
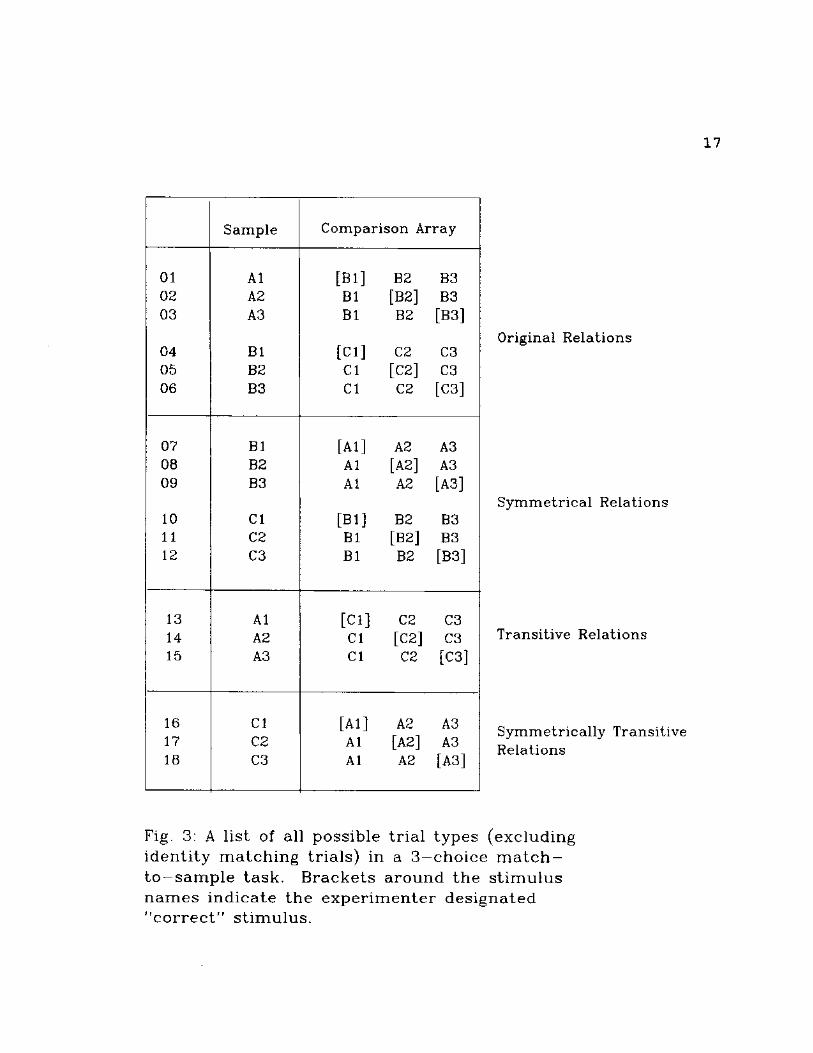
In a 3-choice conditional discrimination, there are 18
possible trial types (excluding identity matching trials).
Figure 3 delineates each of the trial types and the stimuli
involved in each. Each session consisted of 5 trials of
each of the 18 trial types for a total of 90 trials per
session. Each training and testing trial type was presented
within a block of 18 randomly ordered trials before
proceeding to the next block of 18. The original
conditional discriminations were trained using Touchette's
16
Sample
Stimulus
Comparison
Stimulus
(Pos. 1)
Can't Answer
Option
Comparison
Stimulus
(Pos. 3)
Comparison
Stimulus
(Pos. 2)
Fig. 2: A r e p r e s e n t a t i o n of t h e a r r a n g e m e n t of s amp le and c o m p a r i s o n s t imul i on t h e m o n i t o r fo r all t r i a l types . The c o m p a r i s o n a r r a y cons i s ted of t h e b o t t o m two—thirds of t h e s c r een and was p r o d u c e d by clicking on t h e s amp le s t imulus .
17
Sample Comparison Array
01 A1 [Bl] B2 B3 02 A2 B1 [B2] B3 03 A3 Bl B2 [B3]
04 B1 [CI] C2 C3 05 B2 CI [C2] C3 06 B3 CI C2 [C3]
07 B1 [Al] A2 A3 08 B2 A1 [A2] A3 09 B3 Al A2 [A3]
10 CI [Bl] B2 B3 11 C2 Bl [B2] B3 12 C3 Bl B2 [B3]
13 A1 [CI] C2 C3 14 A2 CI [C2] C3 15 A3 CI C2 [C3]
16 CI [Al] A2 A3 17 C2 Al [A2] A3 18 C3 Al A2 [A3]
Original Relations
Symmetrical Relations
Transitive Relations
Symmetrically Transitive Relations
Fig. 3: A list of all possible trial types (excluding identity matching trials) in a 3 - c h o i c e m a t c h -to—sample task. Brackets around the st imulus names indicate the experimenter designated "correct" stimulus.

18
(1971) delayed prompting procedure in the following manner.
An observing response to a sample stimulus (e.g., Al)
produced a 3-comparison array (Bl, B2, B3). Five hundred
milliseconds (.5 second) after the presentation of the
comparison array, the S+ (in this case, Bl) turned blue.
The blue color and geometric dimensions of the comparison
stimulus, then, were a compound stimulus analogous to
Touchette's black figure-red key compound stimulus.
Selection of the compound stimulus designated correct
delayed the change in color by 500 milliseconds (.5 second)
following each successful trial. The consistent selection
of Bl in the presence of Al prior to the change in color
indicated the acquisition of a conditionally discriminative
function by Bl in the presence of Al.
Tests for stimulus function interchanqeabilitv
Testing trials (bottom 3 panels in Fig. 3) were
presented randomly among the training trials in each block
of 18 trials. The delayed prompting procedure was specific
to the training trials and was not used with testing trials.
Stimulus-function interchangeability was defined in terms of
the conditional discriminations described in Chapter 1
(Introduction to the Study).

CHAPTER III
RESULTS
The program recorded the following aspects of the
subjects' conditional discriminations: the comparison
stimulus selected, the latency from comparison array onset
to selection response, the programmed delay to the change in
color (prompt) for original conditional discriminations, and
the position of the comparison stimulus in the array at the
time of selection.
A brief overview of graphed data is provided below to
familiarize the reader with graphs. Following the overview,
detailed analyses of the data are provided. Figure 4 shows
the percent of trials correct per session for all trial
types (see Fig. 3) for each of four subjects (S1-S4). The
percent correct measure is obtained by dividing the number
of times a particular stimulus was selected (per session) by
the number of times that same stimulus was designated
correct by the experimenter (per session) and multiplying
that value by 100.
Figures 5-7, 11-13, 17-19, and 23-25 show which
stimulus was selected and the latency to that selection
response for every trial in the experiment for all subjects.
The top two graphs on each figure show selection latencies

20
(represented by dots) and delay to prompt onset (represented
by solid line) for all trained conditional discriminations.
The middle two graphs on each page present data for trials
where the configuration of stimuli is exactly reversed with
respect to the trained conditional discriminations (i.e.,
symmetry trials). The bottom left set of graphs on each
page present data for trials where the current sample
stimulus has been a sample stimulus in one of two
consequated conditional discriminations and the current
"correct" comparison has been a "correct" comparison in the
other consequated conditional discrimination (i.e.,
transitivity trials). The bottom right set of graphs
present data for trials where current samples have been
"correct" comparisons in one of two consequated conditional
discriminations and the current comparisons have been
samples in the other consequated conditional discriminations
(i.e., symmetrical transitivity or equivalence trials). On
the bottom four graphs in each of these figures, the top
panels always present data with respect to the experimenter-
designated correct stimulus. The bottom panels always
present data with respect to the "Can't Answer" (CA) option.
On all graphs, bars that touch the top of the graphs
indicate that the selection latency was greater than the
maximum range of the axis.
Figures 8-10, 14-16, 20-22, and 26-28 present
cumulative frequencies of selection for all stimuli for all

21
trial types. On each graph, the solid line represents the
cumulative frequency of selection of the experimenter
designated "correct" stimulus, the dotted line represents
the cumulative frequency of selection of the CA option and
the other two lines represent cumulative frequencies of
selection for the other stimuli in the comparison array.
The top right graph in Fig. 8, for example, shows the
cumulative frequencies of selection of Al, A2, A3 and CA in
the presence of B1 as sample stimulus. The slope of the
lines indicate the rate at which a particular comparison
stimulus was being selected across trials. A horizontal
line, then, indicates that a stimulus was not selected at
all. Figures 8, 9, 14, 15, 20, 21, 26, and 27 present
cumulative frequencies of selection for the trained
conditional discriminations (left columns) and related
symmetry trials (right columns). Figures 10, 16, 22, and 28
present cumulative frequencies of selection for transitivity
(left columns) and equivalence trials (right columns).
Figures 29, 30, 31, and 32 present cumulative
frequencies of selection of the experimenter designated
correct stimulus on testing trials for each of three
experimenter designated classes. The top graph on Fig. 29,
for example, presents cumulative frequencies of selection of
Al given B1 (symmetry), B1 given CI (symmetry), CI given Al
(transitivity), and Al given CI (equivalence) for SI.

22
Returning to Figure 4 for more details, the top graph
shows percent of correct trials for all trial types across
all sessions of the experiment for SI. Notice that accurate
responses on original relation trials (reinforced
conditional discriminations) occurred at or near 100% for
the duration of the experiment. Selection of the
experimenter designated "correct" stimuli on derived trials
was approximately 20% initially, increased to a somewhat
higher percent and then decreased to between 0-10% correct.
While this pattern was observed for accurate responses on
all derived trial types, it was most pronounced on symmetry
configurations in the presence of which the "correct"
stimulus was selected around 60% of all symmetry trails for
4 sessions before it decreased to 0% correct.
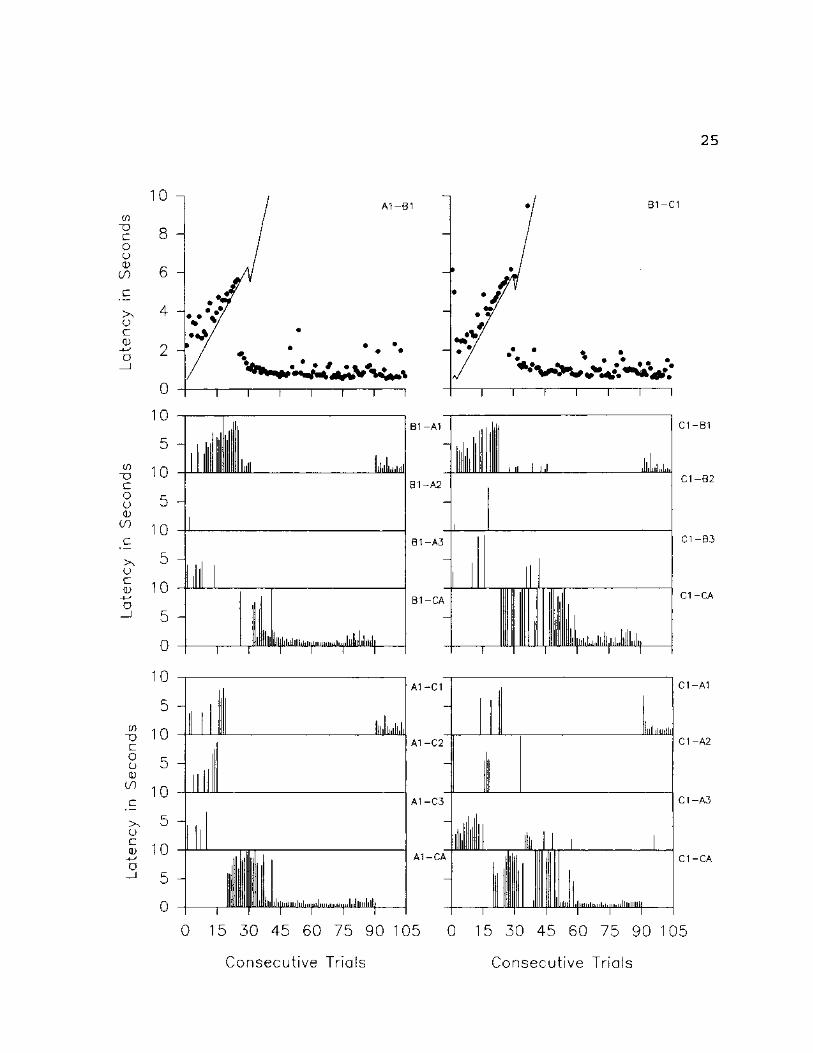
Figures 5-7, which track subject l's responding trial
by trial, show that the decrease in accuracy on derived
trial types seen in Figure 4 was a function of the exclusive
selection of the CA option on 10 of the 12 derived trial
types presented. Figures 6 & 7 further show that, for the
two remaining derived trial types (A3-C3 (transitivity) and
C2-A2 (equivalence)), the drop in accuracy was a function of
the selection of C2 given A3 as the sample (A3-C2, bottom
left set of graphs, Fig. 7) and the selection of A3 given C2
as the sample (C2-A3, bottom right set of graphs, Fig. 6),
respectively. Figures 5-7 also show that the beginning of
the almost exclusive selection of CA on all derived trial

23
1 0 0 - i 0 G C x x > C K X ) n m 0 X D D 0 0 0 0 ^ e
80
60
40 H
20
0
A B
T~T • • • f
0 6 12 8 24 30 36
^ . O o O o o o O O O O O O o O O O O O O O O O ^ # #
/°^ ooA f A B
Z 100 ~ <5 80 -O a> 6 0 - |
40 -
2 0 -
0
S1
en 6 0 -
m *r\\ * * f S « X » s
0°o°\ °0U / 0
1 • • • A * \ooOO° Aji—m ,*--•** o
A / * - • * V M . ^ w A\ A
/ -" # • Zi V H y ^ * 1LL-L m k - A n r ^ t V A V * \ " /
' j rA A •
S3
0
~T~
6 12 18 24 30 36
A: Mouse pos.
randomized.
B CA option
removed
C Additional
instruct ions
given (S2)
o Original
• Symmetry
• Transitivity
A Equivalence
1 0 0
80 H 60
40 H
20
0
Q f ° o o o / b 0 0
0 ^ \ d \ ? v f a /
A T r-- J T * * i A T • * / AA
p 0 0 ' ° 0 ^ ° 0 0
•
& A-l •at w m
A * # / A ' \VVA-*AA~, A
k ' T f A S4
T T T
0 6 12 18 24 30 36
Consecutive Sessions
24
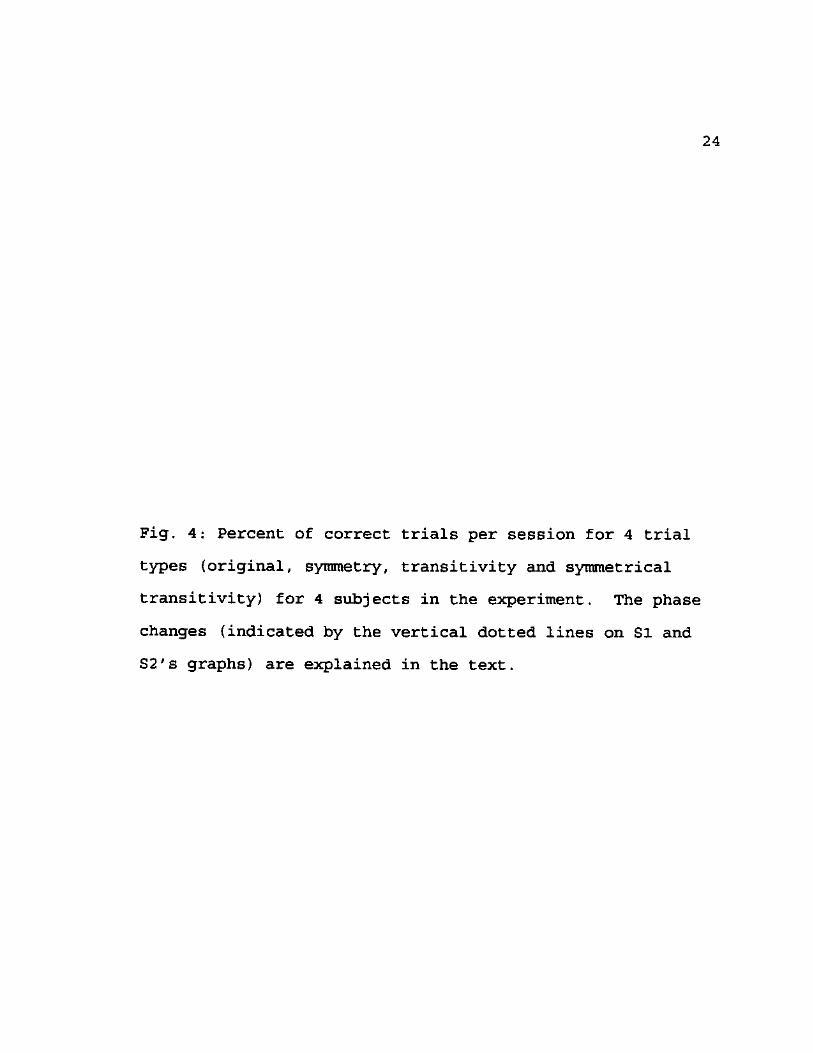
Fig. 4: Percent of correct trials per session for 4 trial
types (original, symmetry, transitivity and symmetrical
transitivity) for 4 subjects in the experiment. The phase
changes (indicated by the vertical dotted lines on SI and
S2's graphs) are explained in the text.
25
0) T5 C o o <D
00
>N o c <D
0) "O C O a <D
00
10 n
8
6
4
2
0
10
A1-B1
5 -
10
5 -
10
>> ^ o
o5 10
0
10
IU
Jj
(I)
X> c o u 0) c/)
5 -|
10
5 H
10
>, 5 o S 10
5 -I
0
i 1 1
kL
1 I ilitliiliiiii|iiiiiiniiiiiiiiliiiililii
B1-C1
7 B1-A1
B1-A2
B1-A3
B1-CA
HllllllliliH|nliiiiiiiniiiiiliJHlll
A1-C1
A1-C2
A1-C3
A1-CA
] r i 1 1
mi i i .1
iitiniii
C1-B1
C1-B2
C1-B3
C1-CA
i lliltil tiiiln.
C1-A1
C1-A2
C1-A3
C1-CA
j 111. ilIn1111 i j
0 15 30 45 60 75 90 105 0 15 30 45 60 75 90 105
Consecutive Trials Consecutive Trials

26
Fig. 5: Trial by trial data for SI on A1-B1-C1 set of
stimuli. The top two graphs represent all original relation
trials presented throughout the experiment. The solid
diagonal line represents the delay to prompt onset; the dots
represent the latency to selection. The remaining graphs
present trial by trial data for all related derived
relations. The graphs indicate the specific stimulus
selected, the vertical lines represent latencies to
selection.
27
CO
~o c o o <U
00
o c <D
A 2 - B 2 B 2 - C 2
CO
"O C
O O 0
C O
o c CD
o
(0 X5 c o o CD
C O
>N o c CD
0
10
5
10
5
10
5
10
5
0
10
5
10
5
10
5
10
5
0
t i r
ILLJ
||j I lllihjllnl.iiiiniljlinJlllllllij
B 2 - A 2
B 2 - A 1
B 2 - A 3
B 2 - C A
- ,
1 1 lilllllll
II h
1 hliii ii|iiiiiiiii,i|iiiiih.i...,i|....jiiiiiiiii
A 2 - C 2
A 2 - C 1
H in II1IH1II.HI
A 2 - C 3
A 2 - C A
11 111 tlillniliiiiiiiiJlilllill
C 2 - B 2
C 2 - B 1
C 2 - B 3
C 2 - C A
C 2 - A 2
C 2 - A 1
C 2 - A 3
C 2 - C A
0 15 30 45 60 75 90 105 0 15 30 45 60 75 90 105
Consecutive Trials Consecutive Trials

28
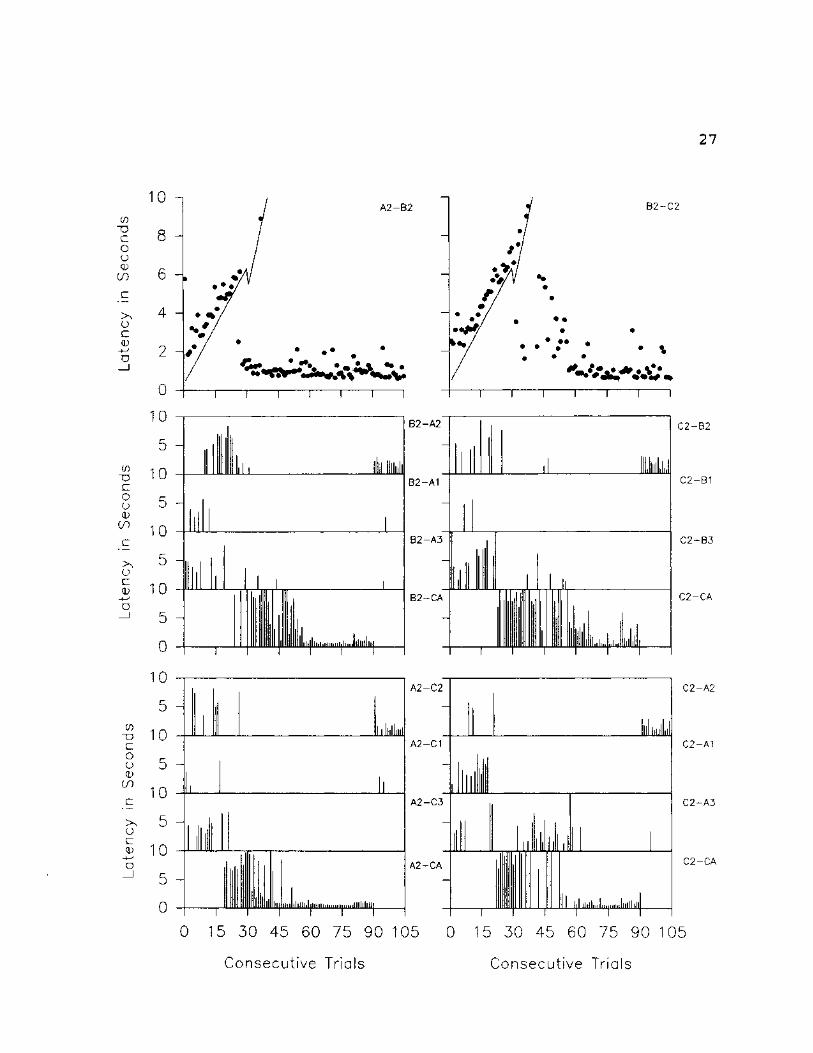
Fig. 6: Trial by trial data for SI on A2-B2-C2 set of
stimuli. The top two graphs represent all original relation
trials presented throughout the experiment. The solid
diagonal line represents the delay to prompt onset; the dots
represent the latency to selection. The remaining graphs
present trial by trial data for all related derived
relations. The graphs indicate the specific stimulus
selected, the vertical lines represent latencies to
selection.

29
in ~o c o o CD
00
>N o c 0)
if) ~o c o o <D
00
o c 0) o
if) ~u c o o <D
00
o c 0
-f—' o
10
8
6
4
2
0
10
5
10
5
10
5
10
5
0
10
5
10
5
10
5
10
5
0
A 3 - B 3
V •
i r 1 1 1 1
B 3 - C 3
ll 1 I iililii liiiJ
-
i
1 ll ill ,li|iiiittt]jiiiii|liiiliiittiiii|iitlJlitIlliiii
Mil
IIIIIHIIIIIHIIH iHlmllliiH
B 3 - A 3
B 3 - A 1
B 3 - A 2
B 3 - C A
A 3 - C 3
A 3 - C 1
A 3 - C 2
A 3 - C A
} 1 1 1 1 1
llllinllllilfllllllll
I lni l i l i i i i i i . i l . . t l l l l l l l l l l
C 3 - B 3
C 3 - B 1
C 3 - B 2
C 3 - C A
C 3 - A 3
C 3 - A 1
C 3 - A 2
C 3 - C A
0 15 30 45 60 75 90 105 0 15 30 45 60 75 90 105
Consecutive Trials Consecutive Trials
30
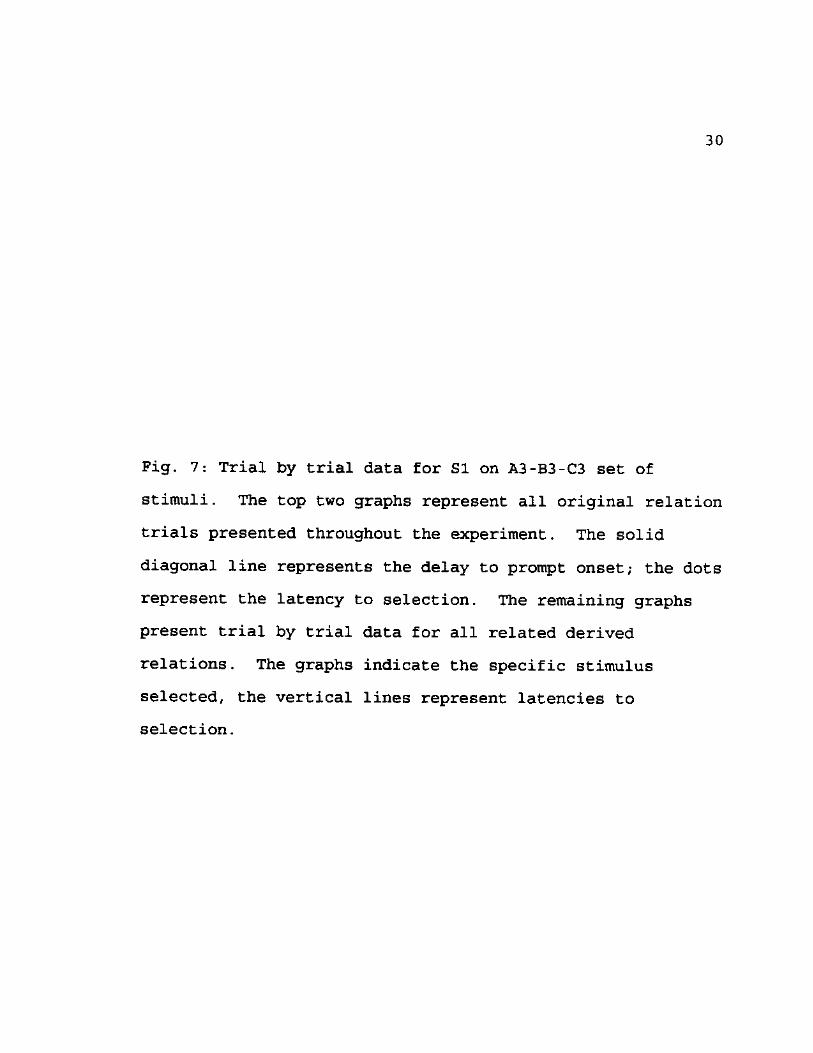
Fig. 7: Trial by trial data for SI on A3-B3-C3 set of
stimuli. The top two graphs represent all original relation
trials presented throughout the experiment. The solid
diagonal line represents the delay to prompt onset; the dots
represent the latency to selection. The remaining graphs
present trial by trial data for all related derived
relations. The graphs indicate the specific stimulus
selected, the vertical lines represent latencies to
selection.

31
types coincided closely with the acquisition of the original
conditional discriminations (the point at which SI stopped
waiting for prompt onset to make a selection response).
Notice that prior to the "discovery" of the CA option, SI
selected all of the other stimuli in the array to some
extent or another. This pattern is discussed in more detail
next.
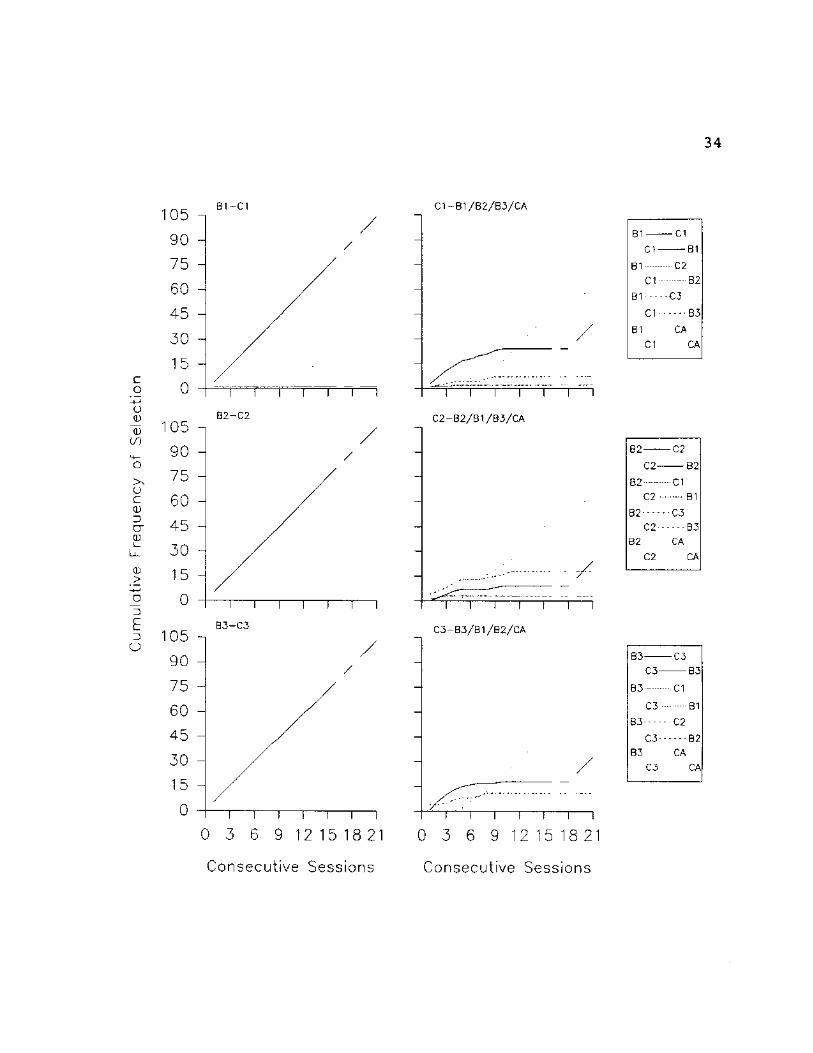
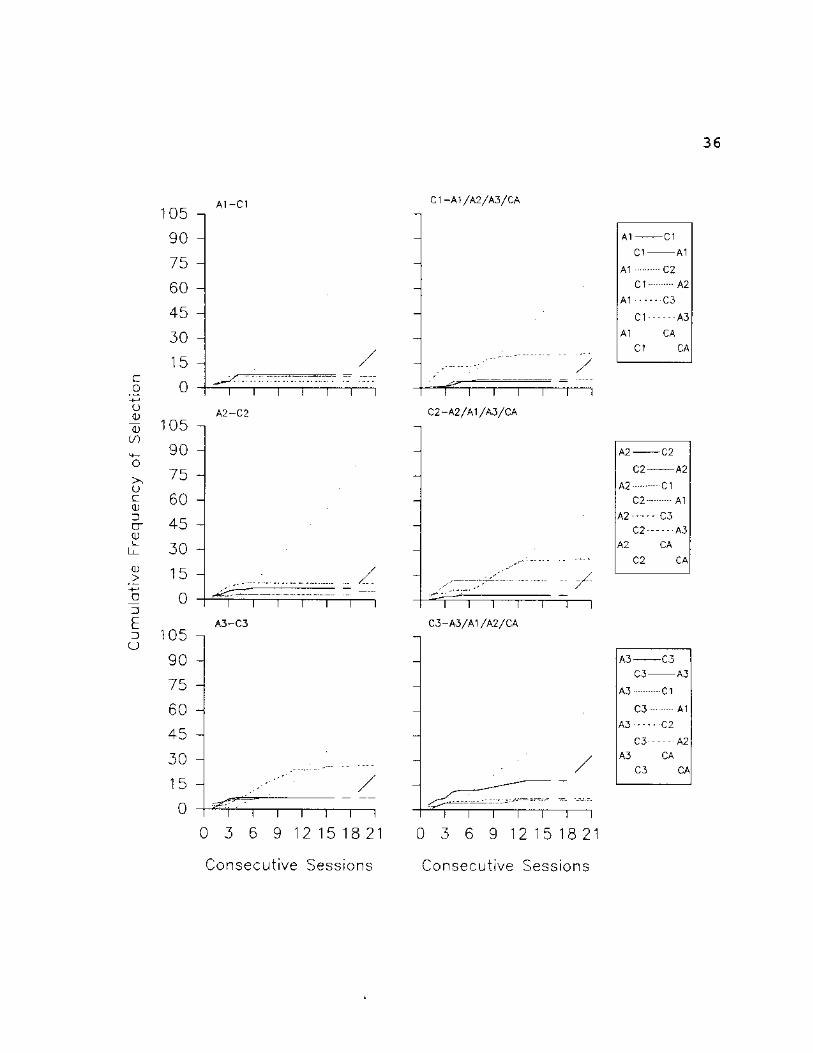
Figures 8-10 present cumulative selection frequencies
for SI for all stimuli in the experiment in terms of the
configuration in which they appeared. Figures 8 & 9 show
that, prior to exclusive selection of the CA option (dotted
lines on all graphs), SI selected the experimenter
designated "correct" stimulus (solid lines on all graphs)
more often than any other stimulus on 5 of the 6 symmetry
configurations (right columns, Figures 8 & 9). Figure 10
(left column) shows that the same was not true for
transitivity configurations. In fact, given transitivity
configurations with A1 and A2 as samples (top two graphs in
left column, Fig. 10), SI selected the experimenter
designated "correct" stimulus about as often as the other
stimuli in the comparison array before switching to the CA
option. Notice that for transitivity configurations with A3
as the sample, however, (bottom graph in left column, Fig.
10) SI selected C2 more often than any other stimulus and
about as often as the CA option until session 10. Figure 10
(right column) shows that given equivalence configurations,

32
c o
-+->
o Q) CD 00
O >N o c 0) D G~ CD L—
Li_
0 >
-4—'
_o
D
D O
105
90
75
60
45
30
15
0
A 1 - B 1 B 1 - A 1 / A 2 / A 3 / C A
A 2 - B 2
i — T
A3—B3
1 I I I T
0 3 6 9 12 15 18 21
i i i \ r
B 2 - A 2 / A 1 / A 3 / C A
i i — i — T
B 3 — A 3 / A 1 / A 2 / C A
A1 B1 B1 A1
A1 B2
B1 A2
A1 B3
B1 A3
A1 CA
B1 CA
I I
"1 1 1
I I I I ^ ^ I
0 3 6 9 12 15 18 21
Consecutive Sessions Consecutive Sessions

33
Fig. 8: SI - Cumulative selections are plotted for each
comparison stimulus in the array (including the Can't Answer
option) given a particular sample stimulus. From the top,
the graphs in the left column present cumulative selections
of all B stimuli given Al, A2 and A3 as samples,
respectively. The graphs in the right column present
cumulative selections of all A stimuli given Bl, B2 and B3
as samples, respectively. In the legend, identifiers
flushed left apply to the graphs in the left column,
identifiers flushed right apply to graphs in the right
column. Phase changes (indicated by vertical dotted lines)
are explained in the text.
34
B1-C1
c o o Q) (D
00
(J c CD D O"
0 LL_
0 > H—'
_G
D
£ D o
B 2 - C 2
B 3 - C 3
C1-B1/B2/B3/CA
n — ^ ^ — i — T
C2—B2/B1/B3/CA
I ^ 1 1 1 1 1
C3-B3/B1/B2/CA
n — ^ — i — r
0 3 6 9 12 15 18 21
B1 C1
C 1 B1
B1 C2
C1 B2
B1 € 3
C1 B3
B1 CA
C1 CA
B3 C3
C3 B3
B3 C1
C3 B1
B3 C2
C3 B2
B3 CA
C3 CA
n I I I I I 1 0 3 6 9 12 15 18 21
Consecutive Sessions Consecutive Sessions

35
Fig. 9: SI - Cumulative selections are plotted for each
comparison stimulus in the array (including the Can't Answer
option) given a particular sample stimulus. From the top,
the graphs in the left column present cumulative selections
of all C stimuli given Bl, B2 and B3 as samples,
respectively. The graphs in the right column present
cumulative selections of all B stimuli given CI, C2 and C3
as samples, respectively. In the legend, identifiers
flushed left apply to the graphs in the left column,
identifiers flushed right apply to graphs in the right
column. Phase changes (indicated by vertical dotted lines)
are explained in the text.
36
c .2 -4—'
o _CD
<D 00
o c CD
D CT CD
CD >
'-+-J _o 3
£ 3 o
105
90
75
60
45
30
15
0
105
90
75
60
45
30
15
0
105
90
75
60
45
30
15
0
A 1 - C 1 C 1 - A 1 / A 2 / A 3 / C A
— i — i — i — r A 2 - C 2
— r — i — i — i — i — i — i A 3 - C 3
1 I I I I I I 0 3 6 9 12 15 18 21
i i i r C 2 - A 2 / A 1 / A 3 / C A
1 I
— i — i — i — r C 3 - A 3 / A 1 / A 2 / C A
"l 1
1 1 1 1 1 1 1 0 3 6 9 12 15 18 21
A1 C1
C1 A1
A1 C2
C1 A2
A1 C3
C1 A3
A1 CA
C1 CA
Consecutive Sessions Consecutive Sessions

37
Fig. 10: SI - Cumulative selections are plotted for each
comparison stimulus in the array (including the Can't Answer
option) given a particular sample stimulus. From the top,
the graphs in the left column present cumulative selections
of all C stimuli given Al, A2 and A3 as samples,
respectively. The graphs in the right column present
cumulative selections of all A stimuli given CI, C2 and C3
as samples, respectively. In the legend, identifiers
flushed left apply to the graphs in the left column,
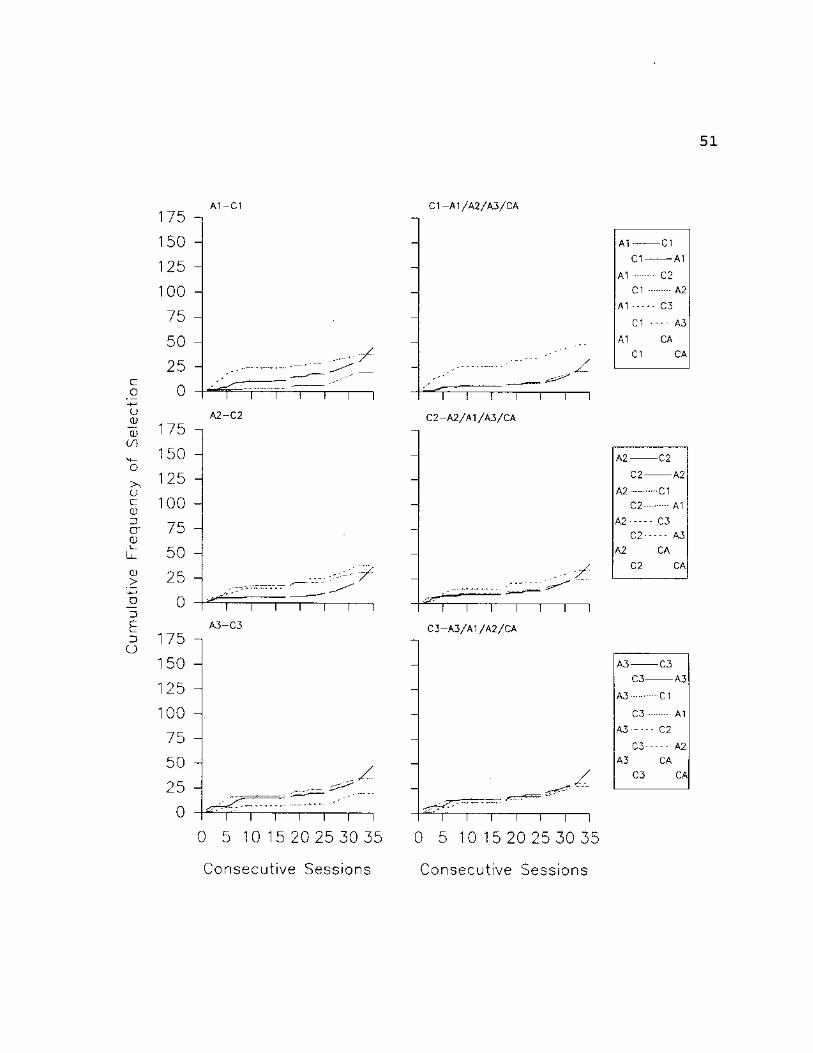
identifiers flushed right apply to graphs in the right
column. Phase changes (indicated by vertical dotted lines)
are explained in the text.

38
Si selected the experimenter designated "correct" stimulus
(A3) most often when C3 was the sample (bottom graph in
right column, Fig. 10). Notice, however, that SI also
selected A3 more often than any other stimulus given CI and
C2 (before switching to the CA option). Thus the apparent
conditionally discriminative function of C3 given A3 was an
artifact produced by a bias with respect to the selection of
C3 given transitivity configurations.
Finally, Figures 5-7 show that, by session 12, the
latencies to selection of CA option for SI had dropped
considerably for all derived trial types. The short
latencies to selection and the fact that CA was selected
only on novel configurations (un-consequated) suggested that
the selection of CA represented maximization. That is, SI
was able to earn all possible points while at the same time
minimizing overall session time by selecting CA. Selecting
CA was the most efficient choice because the customized
software program always presented the cursor on the CA
option when the comparison array was presented. To check
for the possibility that SI was maximizing, the mouse cursor
position was altered to occur randomly on one of the 3
comparison stimuli (and not on the CA option). Fig. 5-7
show that aside from slight increases in the latencies
(presumably the time required to reposition the mouse
cursor), SI continued selecting CA. For the last 3 sessions
of the experiment, the CA option was removed from the

39
comparison array. Figures 5-7 show that SI immediately
began to select the experimenter designated "correct"
stimuli on all trial types.
Subject 2's performance resembled Si's in several
respects. Like SI, S2 selected the correct stimulus on
greater than 90% of the training trials for the duration of
the experiment (see Fig. 4). Additionally, S2's selection
of the "correct" stimulus on symmetry trials, like SI,
started out at 20% correct, increased to approximately 80%
correct and decreased to 0% correct by session 11. S2's
accuracy on transitivity and equivalence trials fluctuated
around chance levels until session 11 before dropping to 0%
correct.
Detailed inspection of S2's performance shows that
accurate responses on training configurations occurred at or
near 100% for all sessions except sessions 6-8,
where they occurred around 80% correct. Figures 11-13 show
that the "inaccurate" responses were occurring for only 3 of
the 6 trained conditional discriminations (Al-Bl, B2-C2 and
B3-C3 trials). An analysis of the individual selection
responses (see Figs. 14-16) on each of these trials revealed
that the drops in accuracy were a function of the selection
of B2 on the Al-Bl trials (Fig. 14) and CI on the B3-C3
trials (Fig. 15). There was no discernible pattern of
errors for the B2-C2 trials.

40
A 1 - B 1 V)
~o C O o <D
CO
o c (D -+->
D
CO "O c o o 0
00
o c 0
cn ~u c o o 0 00
o c 0
-4—̂ o
I lilt Nil
I 111 ii hi iilliill
B 1 - C 1
B 1 - A 1
B 1 - A 2
B 1 - A 3
B 1 - C A
A 1 - C 1
A 1 - C 2
A 1 - C 3
A 1 - C A
lb ll IB nil i ll III 1 lll!ifllll!l
I ll 1 1 1 Ml! 1 ill
lllk 1 li [in H 111
llU-
C 1 - B 1
C 1 - B 2
C 1 - B 3
C 1 - C A
- I I ii , . i».hiiiHj
- 1 i l rt 1 ill 1 II i it
M i 1 till i h. II ii ..11 \
1
C 1 - A 1
C 1 - A 2
C 1 - A 3
C 1 - C A
0 25 50 75 1 0 0 1 2 5 1 5 0 1 7 5 0 25 50 75 1 0 0 1 2 5 1 5 0 1 7 5
Consecut ive Trials Consecut ive Trials

41
Fig. li: Trial by trial data for S2 on A1-B1-C1 set of
stimuli. The top two graphs represent all original relation
trials presented throughout the experiment. The solid
diagonal line represents the delay to prompt onset; the dots
represent the latency to selection. The remaining graphs
present trial by trial data for all related derived
relations. The graphs indicate the specific stimulus
selected, the vertical lines represent the latency to
selection.

42
CO ~o c o o CD
i f )
>s o c CD
2 5 1
2 0 -
15
10
5
CO ~o c o o CD
i f )
>x o c CD
CO
~o c o o CD
i f )
o c CD
-4—1
D
0
10
5
10
5
10
5
10
5
0
10
5
10
5
10
5
10
5
0
A 2 - B 2 B 2 - C 2
t 1 n — i f r — i
l U i i tii, ii
. i 8 mi l l i til
" n i II i il 11 111 1 ill b
l i l ^ L L p J i l u i a j
B 2 - A 2
B 2 - A 1
B 2 - A 3
B 2 - C A
_1 I I llllllhll Jii
_ L l l l n i ' l i i
11
i_y_
A 2 - C 2
A 2 - C 1
A 2 - C 3
A 2 - C A
. i i
u faihli • lit
Li i in il ii mi
C 2 - B 2
C 2 - B 1
C 2 - B 3
C 2 - C A
C 2 - A 2
C 2 - A 1
C 2 - A 3
C 2 - C A
0 25 50 75 100125150175
Consecutive Trials
0 25 50 75 1 0 0 1 2 5 1 5 0 1 7 5
Consecutive Trials
43
Fig. 12: Trial by trial data for S2 on A2-B2-C2 set of
stimuli. The top two graphs represent all original relation
trials presented throughout the experiment. The solid
diagonal line represents the delay to prompt onset; the dots
represent the latency to selection. The remaining graphs
present trial by trial data for all related derived
relations. The graphs indicate the specific stimulus
selected, the vertical lines represent the latency to
selection.
44
A 3 - B 3
CO TD C o o 0) (/)
o c 0
(0 ~G c o o d) </)
u c CD
CO ~O c o o <D
00
o c <L>
ill 1 ill Hi llml
B 3 - C 3
tn #v«. •
B 3 - A 3
B 3 - A 1
B 3 - A 2
A 3 - C 3
A 3 - C 1
A 3 - C 2
A 3 - C A
I I i
Hm In li .inn isIrihtm
j Hili ifa»
B 3 - C A Y ^
_ J i IUII tat
C 3 - B 3
C 3 - B 1
C 3 - B 2
C 3 - C A
li lllli ii
L u In I I I I INH.I I n
C 3 - A 3
C 3 - A 1
C 3 - A 2
C 3 - C A
0 35 70 105 140 175 0 35 70 105 140 175
Consecut ive Trials Consecut ive Trials

45
Fig. 13: Trial by trial data for S2 on A3-B3-C3 set of
stimuli. The top two graphs represent all original relation
trials presented throughout the experiment. The solid
diagonal line represents the delay to prompt onset; the dots
represent the latency to selection. The remaining graphs
present trial by trial data for all related derived
relations. The graphs indicate the specific stimulus
selected, the vertical lines represent the latency to
selection.

46
Selection of the experimenter designated "correct"
stimulus on derived trial types started out low and
increased, with symmetrical responding hovering around 75%
during sessions 2-7 (see Fig. 4). "Correct" responding on
all derived trial types dropped to 0% correct by session 11.
Figures 11-13 show that the drop in accuracy on derived
trials seen in Figure 4 was a function of the almost
exclusive selection of CA option, given novel
configurations, beginning around session 10 (trials 45-50).
Notice also that this exclusive shift to CA coincided with
acquisition of the original conditional discriminations as
it did in the case of SI. By the end of session 9, S2 had
stopped waiting for prompt onset for all original relations
trials. S2's responses on derived trials during session 9
were particularly interesting. On the five presentations of
each derived trial type, S2 selected each of the comparison
stimuli once and the CA option twice. As stated earlier,
beginning with session 10, S2 began to select the CA option
exclusively on all derived trials.
Figures 14 and 15 show that prior to the exclusive
selection of CA, S2 selected, for all 6 of the symmetry
trial types, the experimenter-designated "correct" stimuli
more often than any others. Figure 16 shows that, as with
SI, the same was not true for S2's selections given
transitivity and equivalence configurations. Two
particularly interesting patterns can be seen in Figure 16.

47
A 1 - B 1
C o H—' u _CL) 0
i f ) M— o >> o c CD D cr CD L_
L l_
CD >
_ D
D
D CJ
B 1 — A 1 / A 2 / A 3 / C A
A 2 - B 2
175 -i
150 -
125
100 -
75 -
50 -
25 -
0 r A 3 - B 3
t — r ~ T
150 -
\ i I r B 2 - A 2 / A 1 / A 3 / C A
i i ^—T B 3 - A 3 / A 1 / A 2 / C A
0 1 1
5 10 15 20 25 30 35
"l—i
Consecutive Sessions
i \ i ^ i ^ i 0 5 10 15 20 25 30 35
Consecutive Sessions
A 1 B 1
B 1 A 1
A 1 B 2
B 1 A 2
A 1 B 3
B 1 A 3
A 1 C A
B 1 C A

48
Fig. 14: S2 - Cumulative selections are plotted for each
comparison stimulus in the array (including the Can't Answer
option) given a particular sample stimulus. From the top,
the graphs in the left column present cumulative selections
of all B stimuli given Al, A2 and A3 as samples,
respectively. The graphs in the right column present
cumulative selections of all A stimuli given Bl, B2 and B3
as samples, respectively. In the legend, identifiers
flushed left apply to the graphs in the left column,
identifiers flushed right apply to graphs in the right
column. Phase changes (indicated by vertical dotted lines)
are explained in the text.

49
c o u Q) CD
( / )
>N o c CD D O" CD
CD >
-4—'
_o D
E Z5
o
175
150 -
125 -
100 -
75 -
50 -
25 -
0 -
B1-C1 C 1 - B 1 / B 2 / B 3 / C A
B 2 - C 2
150 -
B 3 - C 3
1 0 0 -
0 5 10 15 20 25 30 35
Consecutive Sessions
— i — r C2—B2/B1 / B 3 / C A
1 1
i — i — i — T C3—B3/B1/B2/CA
"1 I
1 1 1 1 1 1 0 5 10 15 20 25 30 35
Consecutive Sessions
B2 C2
C2 B2
B2 C1
C2 B1
B2 C3
C2 B3
B2 CA
C2 CA
B3 C3
C3 B3
B3 C1
C3 B1
B3 C2
C3 B2
B3 CA
C3 CA

50
Fig. 15: S2 - Cumulative selections are plotted for each
comparison stimulus in the array (including the Can't Answer
option) given a particular sample stimulus. From the top,
the graphs in the left column present cumulative selections
of all C stimuli given Bl, B2 and B3 as samples,
respectively. The graphs in the right column present
cumulative selections of all B stimuli given CI, C2 and C3
as samples, respectively. In the legend, identifiers
flushed left apply to the graphs in the left column,
identifiers flushed right apply to graphs in the right
column. Phase changes (indicated by vertical dotted lines)
are explained in the text.
51
c o o _0) CD 00
o c CD D cr (D L_
Ll-
CD >
'-4-J
JO
D E D o
175
150 -
125 -
100
75
50
25
0
A 1 - C 1 C 1 - A 1 / A 2 / A 3 / C A
A 2 - C 2
175
150 -
125 -
100 -
75 -
50 -
25 -
0 -
1 — i — i — i
r — r A 3 - C 3
" i — r
175
150 -
125 -
100 -
75 -
50 -
25 -
0 -
. . .Z
^ i i i i i i
0 5 10 15 20 25 30 35
i—i—i—i C 2 — A 2 / A 1 / A 3 / C A
— i — i — i — i — i — i C 3 — A 3 / A 1 / A 2 / C A
A1 C1
C1 A1
A1 C2
C1 A2
A1 C3
C1 A3
A1 CA
C1 CA
• n " — i — i — i — i — i — i
0 5 10 15 20 25 30 35
Consecutive Sessions Consecutive Sessions

52
Fig. 16: S2 - Cumulative selections are plotted for each
comparison stimulus in the array (including the Can't Answer
option) given a particular sample stimulus. From the top,
the graphs in the left column present cumulative selections
of all C stimuli given Al, A2 and A3 as samples,
respectively. The graphs in the right column present
cumulative selections of all A stimuli given CI, C2 and C3
as samples, respectively. In the legend, identifiers
flushed left apply to the graphs in the left column,
identifiers flushed right apply to graphs in the right
column. Phase changes (indicated by vertical dotted lines)
are explained in the text.
53
Notice that when A3 was the sample, S2 selected CI slightly
more often than the experimenter designated "correct"
stimulus (bottom graph in left column, Fig. 16). At the
same time, given CI as sample (top graph in right column,
Fig. 16), S2 selected A3 more often than the "correct"
stimulus. Similarly, notice that when A1 was the sample, S2
selected C3 more often than any other stimulus (top graph in
left column, Fig. 16) and when C3 was the sample, S2
selected A1 more often than any other stimulus (bottom graph
in right column, Fig. 16) before switching to the CA option.
These patterns, in traditional tems, would be said to be
indicative of relations among the stimuli involved in the
conditional discriminations. Notice also, however, that the
typical percent correct measures would be unable to detect
these kinds of patterns.
Figures 11-13 show that by the end of session 12
(trials 55-60), the latencies to CA selection on derived
trials had dropped considerably. As with SI, the pattern of
responding raised the possibility that the selection of CA
represented maximization for S2. To check for this
possibility, the position of the mouse cursor was changed as
described for SI starting with session 18 (phase A, Fig. 4).
Figures 11-13 show that S2 stopped selecting the CA option
for two sessions, returned to exclusive CA selection for 2
sessions, stopped selecting CA for 1 session and then
reverted to exclusive CA selection. Figures 11-13 further

54
show that during the sessions when the CA option was not
selected, other stimuli were selected approximately equally
as often as each other. A closer look at the raw data
revealed that this approximately equal selection of all
stimuli given derived configurations was a function of S2's
selection of the stimulus upon which the cursor appeared on
derived trials. This pattern further suggests that the
exclusive CA selection (and the subsequent selection of any
stimulus upon which the cursor appeared) was a part of
maximization for S2. S2's selection of the "correct"
stimuli on trained conditional discriminations was
unaffected.
S2's eventual return to exclusive CA selection
(beginning with session 23) led to experimental removal of
the CA option as with SI (phase B, Fig. 4). The mouse
cursor was reprogrammed to appear in the center of the
sample - comparison configuration. Figures 11-13 show that
unlike SI, S2 began selecting all of the stimuli about
equally as often as each other. Analyses of the position of
the stimuli selected on each trial revealed that the
apparently equal selection of all stimuli was an artifact
produced by the exclusive selection of Position 1. Again
this pattern of responding was the most efficient as it
required no observing responses with respect to the
positions in which particular stimuli appeared. S2 simply
selected the stimulus that appeared in position 1 on all

55
derived trial types. After 6 sessions with no change in
S2's performance, the subject was given the following
instruction: "If you get all trials correct, you will
receive a total of $2.50 for the session" (cf. Sidman et
al., 1992). This amount was greater than twice the amount
usually earned. Figures 11-13 show that there was no change
in S2's responses for the first session following
instruction delivery. The instruction was repeated in
exactly the same way for every session for the remainder of
the experiment. Figures 4 and 11-13 show that starting with
the second instructed session, S2 began to select the
"correct" stimulus on all original and derived trial types.
S3's performance differed from SI and S2 in a number of
ways. Figure 4 shows that, unlike SI and S2, S3's accuracy
on training trials fluctuated until session 23, at which
point S3 began to select the correct stimulus on greater
than 90% of all training trials for the remainder of the
experiment. More specifically, Figures 20 and 21 show that
the initial drop in accuracy was a function of S3's
responses on 3 of the 6 training trial types - the selection
of B3 given A2 as the sample (middle graph in left column,
Fig. 20), C3 given B2 as the sample (middle graph in left
column, Fig. 21) and CI given B3 as the sample (bottom graph
in left column, Fig. 21).
Returning to Figure 4, notice that, during sessions 5-
9, the "correct" stimulus was selected on 90-100% of all

56
training trials presented before dropping to 65% for session
10. Once again, Figs. 20 & 21 show that this decrease was a
function of S3's selections on only 3 of the 6 training
trial types - the exclusive selection of B2 given A3 (bottom
graph in left column, Fig. 20), C3 given B2 (middle graph in
left column, Fig. 21) and CI and C2 given B3 (bottom graph
in left column, Fig. 21) during sessions 10-15. Following
that, Figure 4 shows that the percent of "correct" training
trials increased steadily until session 19. Figures 20 & 21
show that the slight decreases in percent of correct
training trials seen during sessions 20 and 21 (Fig. 4) was
almost exclusively a function of the selection of B3 given
A2 as sample (middle graph in left column, Fig. 20).
Finally, Figure 4 shows that the percent of correct training
trials increased to and remained at 100% for the remainder
of the experiment.
With respect to the derived trial types, S3's
performance differed from SI and S2 in that S3 rarely
selected the CA option and never demonstrated equivalence.
Figure 4 shows that on transitivity and equivalence probe
trials, S3 selected the "correct" stimulus on 25 - 60% of
trials presented per session throughout the experiment.
With respect to transitivity, Figure 22 shows that the
experimenter designated "correct" stimulus was selected more
often than any other stimulus on only one of the three
transitivity configurations presented (A3-C3, bottom graph

57
in left column, Fig. 22). Interestingly, the stimulus
selected most often, given A1 & A2 as samples in
transitivity configurations, was also C3. It is possible
that the increasing "accuracy" observed on A3-C3 trials was
partly a function of a bias toward the selection of C3 on
transitivity probes.
With respect to equivalence trials, Fig. 22 (right
column) shows that the "correct" stimulus was selected more
often than any other stimulus on only one of the three
equivalence configurations presented (C3-A3, bottom graph in
right column, Fig. 22). Given CI and C2 as samples in
equivalence probes, A3 was selected more often than any
other stimulus in the comparison array.
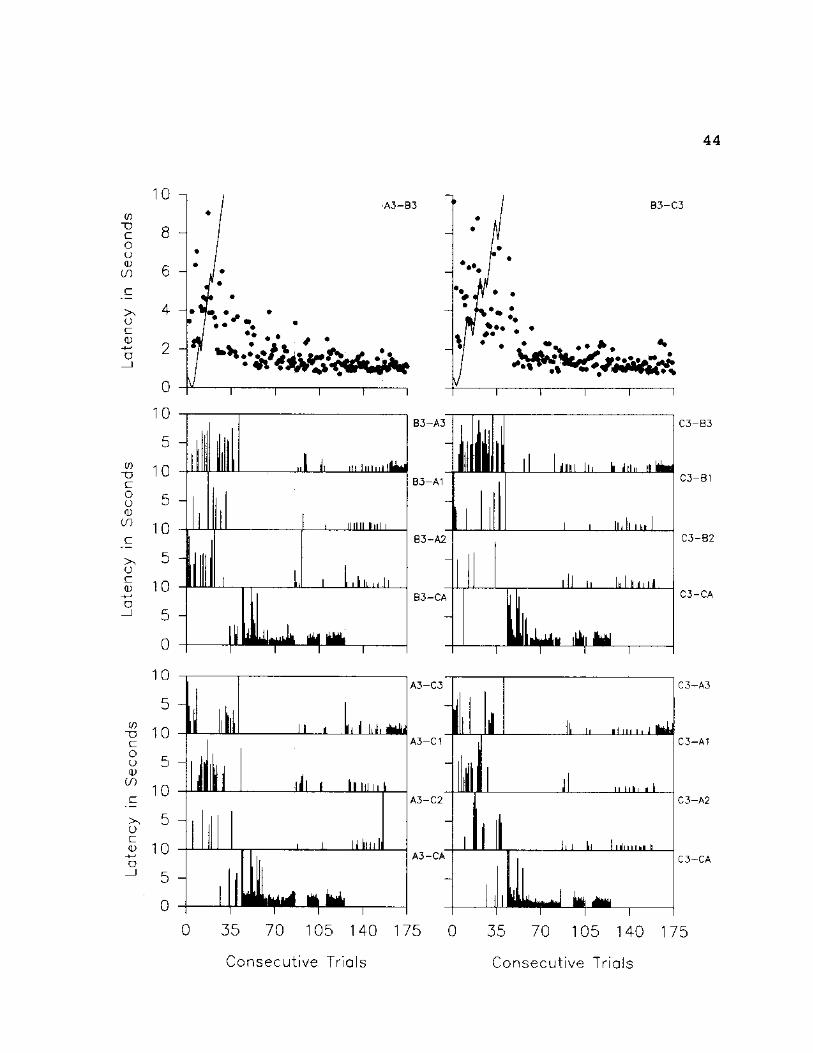
Figures 17-19 show that, in general, latencies to
selection given transitivity and equivalence configurations
had decreased considerably by the end of session 11. A
close analysis of the bottom two sets of graphs on these
figures reveals that the decreases in latencies for all
three of the equivalence configurations were approximately
correlated with original conditional discrimination
acquisition. The same kinds of correlations are apparent
with two of the three transitivity configurations (A2-C2,
A3-C3).
S3's responses on symmetry trials were particularly
interesting. Figure 4 shows that given symmetry
configurations, the "correct" stimulus was selected on 25-

58
A 1 - B 1
CO I 5
B 1 - C 1
10
-o 1 0 c O f -
o b 0
00 10 c >> 5 o « 10
-4—'
o ^ 5
0
JUL
JliL
B 1 - A 1
B 1 - A 2
B 1 - A 3
B 1 - C A
i Ml » i
I I I I 111 i
lillll 11 ll l l l l l l l l l l lUl^l iitihi
Jh
A 1 - C 1
A 1 - C 2
A 1 - C 3
A 1 - C A
II u Id i
llllih il ill ilill
C 1 - B 1
C 1 - B 2
C 1 - B 3
C 1 - C A
C 1 - A 1
C 1 - A 2
C 1 - A 3
C 1 - C A
0 45 90 135 180 0 45 90 135 180
Consecutive Trials Consecutive Trials

59
Fig. 17: Trial by trial data for S3 on A1-B1-C1 set of
stimuli. The top two graphs represent all original relation
trials presented throughout the experiment. The solid
diagonal line represents the delay to prompt onset; the dots
represent the latency to selection. The remaining graphs
present trial by trial data for all related derived
relations. The graphs indicate the specific stimulus
selected, the vertical lines represent the latency to
selection.
60
in ~o c o G <D
(J)
O c CD
A 2 - B 2
CO ~o C O O CD
00
O c CD
00 ~o c o o CD
( / )
>N o c 0
0
10
5
10
5
10
5
10
5
0
10
5
10
5
10
5
10
5
0
m *%3ki
h
\k
B 2 - A 2
B 2 - A 1
B 2 - A 3
B 2 - C A
i , i ili il lil
< HI 11 iJ 11» iti
T
A 2 - C 2
A 2 - C 1
A 2 - C 3
A 2 - C A
LL
[II J
JI
B 2 - C 2
J U
C 2 - B 2
C 2 - B 1
C 2 - B 3
C 2 - C A
ItllllllllllllHllilllttNlilll ll lit Ji
lu ll I IILL
111 i l l il iImi
T
C 2 - A 2
C 2 - A 1
C 2 - A 3
C 2 - C A
0 45 90 135 180 0 45 90 135 180
Consecutive Trials Consecutive Trials

61
Fig. 18: Trial by trial data for S3 on A2-B2-C2 set of
stimuli. The top two graphs represent all original relation
trials presented throughout the experiment. The solid
diagonal line represents the delay to prompt onset; the dots
represent the latency to selection. The remaining graphs
present trial by trial data for all related derived
relations. The graphs indicate the specific stimulus
selected, the vertical lines represent the latency to
selection.

62
A 3 - B 3 CO
T 3 C O O CD 00
>s o c CD
O
V) X 5 C o o CD
CO
o c CD
cn TD c o o CD
00
>N u c CD
B 3 - C 3
B 3 - A 3
B 3 - A 1
B 3 - A 2
B 3 - C A
A3—C3
A 3 - C 1
A 3 - C 2
A 3 - C A
l i i ! 111
I 1 1
J i l l l h J L i i i l l i l i 1 1 1 .11 I I I
1
C 3 - B 3
C 3 - B 1
C 3 - B 2
C 3 - C A
i l l L d i l L t Jill 1 In Hill liiiblU i aI,,
1 1 . . illi J I II ill, l l In 1
1.1 111 L i 1 1 1 1 11 ll 1 1 ll I i ilil 1
ll
C 3 - A 3
C 3 - A 1
C 3 - A 2
C 3 - C A
0 45 90 135 180 0 45 90 135 180
C o n s e c u t i v e T r i a l s C o n s e c u t i v e T r i a l s

63
Fig. 19: Trial by trial data for S3 on A3-B3-C3 set of
stimuli. The top two graphs represent all original relation
trials presented throughout the experiment. The solid
diagonal line represents the delay to prompt onset; the dots
represent the latency to selection. The remaining graphs
present trial by trial data for all related derived
relations. The graphs indicate the specific stimulus
selected, the vertical lines represent the latency to
selection.

64
60% of all trials presented for the first 12 sessions. The
percent of "correct" symmetry trials increased
systematically over sessions 13-25 and remained stable at
over 90% through session 30. Correct responding on symmetry
trials then declined and became more variable, hovering
around 80% across sessions 31-38.
Figures 20 and 21 show that the low accuracy scores
seen in Figure 4 during the first 12 sessions were a
function of S3's responses on 4 of the 6 symmetry trial
types. Figure 20 shows that given B3-A3 trials (bottom
graph in right column, Fig. 20), S3 selected all of the
comparison stimuli (excluding the CA option) in the
comparison array about equally as often for the first 12
sessions. Figure 21 shows that given CI or C2 as samples,
S3 selected B3 more often than any other stimulus in the
comparison array during the first 12 sessions. Finally, the
bottom graph in Figure 21 shows that given C3 as the sample,
S3 selected B2 more often than any other stimulus.
Nevertheless, Figures 20 & 21 show that, by session 20, the
experimenter designated "correct" stimulus was selected more
often than any other stimulus in the comparison array for 5
of the 6 symmetry configurations presented in the
experiment. Figures 17-19 show that decreases in latencies
to selection on symmetry trials followed closely behind
acquisition of the original conditional discrimination for
all 6 training trial configurations. These figures further

65
A 1 - B 1 B 1 - A 1 / A 2 / A 3 / C A
C
o u Q) CD
00 M—
o
o c CD D Cr <D
CD >
'-4-» _o
D
E D
o
180 160 140 120 100
8 0 60 4 0 2 0
0 i — i — i — i — I — I — r A 2 - B 2
180 H 160 140 120 H 100
8 0 H 60 4 0 2 0
0 ~ i—i—r i r A 3 - B 3
180 160 140 120 H 100
8 0 -60 -4 0 2 0
0 i r — i — r
0 5 10 1 5 2 0 2 5 3 0 3 5
i — i — r
B 2 - A 2 / A 1 / A 3 / C A
I I I I I I T
B 3 — A 3 / A 1 / A 2 / C A
i — i — i — i — i — i — T
0 5 10 1 5 2 0 25 30 3 5
A1 B1
B1 A1
A1 B2
B1 A2
A1 B3
B1 A3
A1 CA
B1 CA
A2 B2
B2 A2
A2 B1
B2 A1
A2 B3
B2 A3
A2 CA
B2 CA
A3 B3
B3 A3
A3 B1
B3 A1
A3 B2
B3 A2
A3 CA
B3 CA
Consecutive Sessions Consecutive Sessions

66
Fig. 20: S3 - Cumulative selections are plotted for each
comparison stimulus in the array (including the Can't Answer
option) given a particular sample stimulus. From the top,
the graphs in the left column present cumulative selections
of all B stimuli given Al, A2 and A3 as samples,
respectively. The graphs in the right column present
cumulative selections of all A stimuli given Bl, B2 and B3
as samples, respectively. In the legend, identifiers
flushed left apply to the graphs in the left column,
identifiers flushed right apply to graphs in the right
column. Phase changes (indicated by vertical dotted lines)
are explained in the text.

67
B 1 - C 1 C 1 - B 1 / B 2 / B 3 / C A
C
.2 I*-* o JD CD (/)
O c <D 3 CT CD
CD >
_o D
E D o
180 160 140 120 100
80 60 40 20
0
B 2 - C 2
180 160 140 120 100 H
80 60 -40 -20
0
T""T V 1—1—1—1—1—1—r C 2 - B 2 / B 1 / B 3 / C A
1 — r ~ r B 3 - C 3
1 1 1 1 1 1 r C 3 - B 3 / B 1 / B 2 / C A
1 2 0 -
1 0 0 -8 0 -
T i i i i—i—r
0 5 10 1520 2 5 3 0 3 5
Consecutive Sessions
i i r " T " i T
0 5 10 1520 2 5 3 0 3 5
Consecutive Sessions
B1 01
C1 B1
B1 C2
C1 B2
B1 C3
C1 - B3
B1 CA
C1 CA

68
Fig. 21: S3 - Cumulative selections are plotted for each
comparison stimulus in the array (including the Can't Answer
option) given a particular sample stimulus. From the top,
the graphs in the left column present cumulative selections
of all C stimuli given Bl, B2 and B3 as samples,
respectively. The graphs in the right column present
cumulative selections of all B stimuli given CI, C2 and C3
as samples, respectively. In the legend, identifiers
flushed left apply to the graphs in the left column,
identifiers flushed right apply to graphs in the right
column. Phase changes (indicated by vertical dotted lines)
are explained in the text.

69
A 1 - C 1 C 1 - A 1 / A 2 / A 3 / C A
C G
(J _cd a) (/) M— o >> o c CD D CT CD
CD >
_o
D
E rs O
180 160 140 120 100
80 60 40 20
0
180 160 140 120 100
80 60 40 20
0
A 2 - C 2
i r A 3 - C 3
0 t i — i — i — r
5 10 1 5 2 0 2 5 3 0 3 5
i i i' i ' i i r
C 2 - A 2 / A 1 / A 3 / C A
i — i — i — i — i — i — r C 3 - A 3 / A 1 / A 2 / C A
Consecutive Sessions
i i i i r
0 5 1 0 1 5 2 0 2 5 3 0 3 5
Consecutive Sessions
70
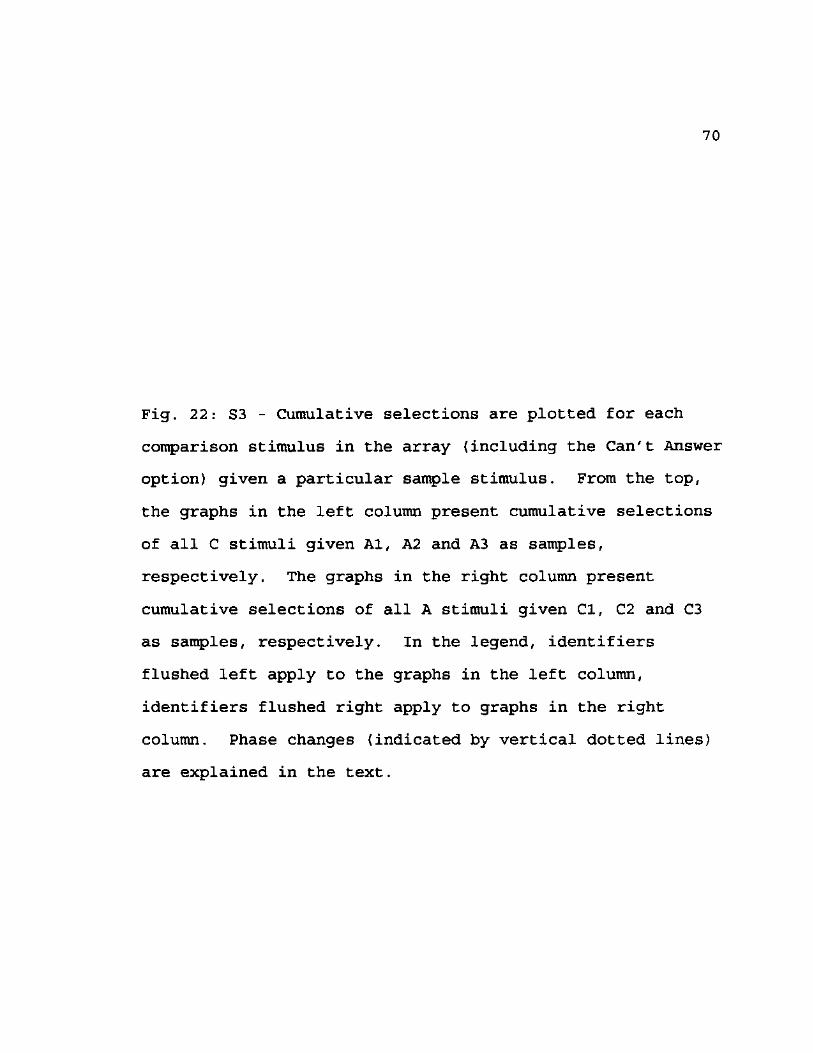
Fig. 22: S3 - Cumulative selections are plotted for each
comparison stimulus in the array (including the Can't Answer
option) given a particular sample stimulus. From the top,
the graphs in the left column present cumulative selections
of all C stimuli given Al, A2 and A3 as samples,
respectively. The graphs in the right column present
cumulative selections of all A stimuli given CI, C2 and C3
as samples, respectively. In the legend, identifiers
flushed left apply to the graphs in the left column,
identifiers flushed right apply to graphs in the right
column. Phase changes (indicated by vertical dotted lines)
are explained in the text.
71
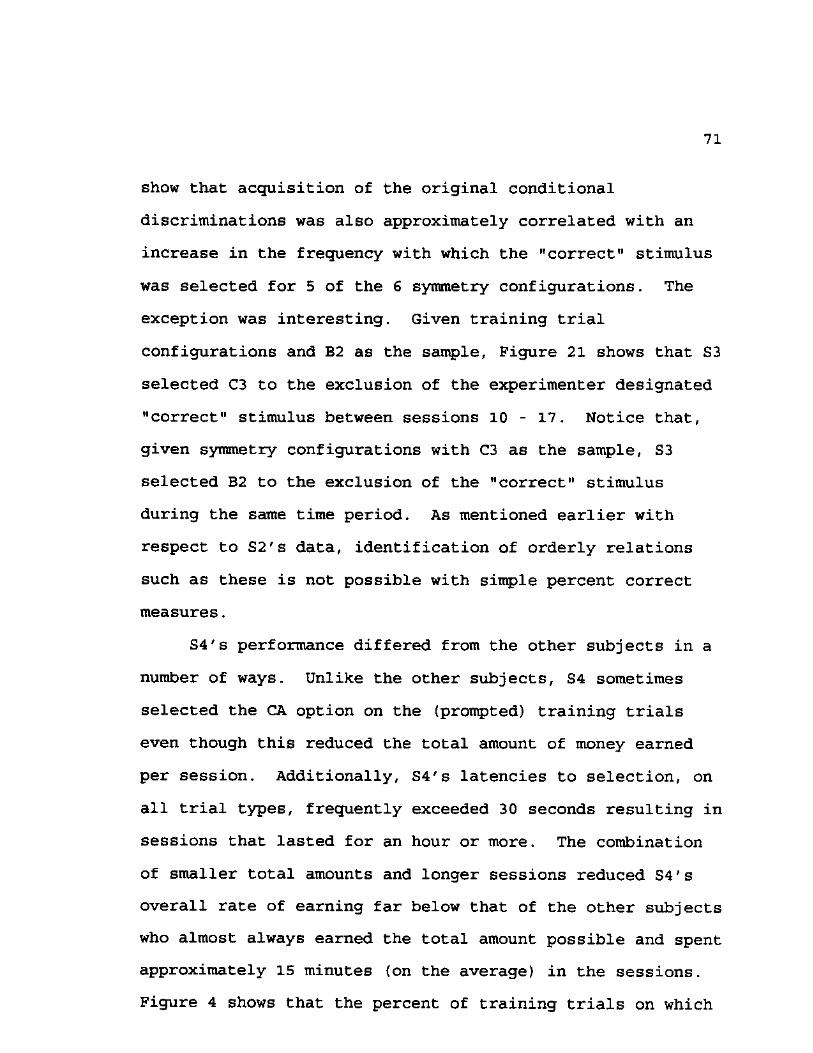
show that acquisition of the original conditional
discriminations was also approximately correlated with an
increase in the frequency with which the "correct" stimulus
was selected for 5 of the 6 symmetry configurations. The
exception was interesting. Given training trial
configurations and B2 as the sample, Figure 21 shows that S3
selected C3 to the exclusion of the experimenter designated
"correct" stimulus between sessions 10 - 17. Notice that,
given symmetry configurations with C3 as the sample, S3
selected B2 to the exclusion of the "correct" stimulus
during the same time period. As mentioned earlier with
respect to S2's data, identification of orderly relations
such as these is not possible with simple percent correct
measures.
S4's performance differed from the other subjects in a
number of ways. Unlike the other subjects, S4 sometimes
selected the CA option on the (prompted) training trials
even though this reduced the total amount of money earned
per session. Additionally, S4's latencies to selection, on
all trial types, frequently exceeded 30 seconds resulting in
sessions that lasted for an hour or more. The combination
of smaller total amounts and longer sessions reduced S4's
overall rate of earning far below that of the other subjects
who almost always earned the total amount possible and spent
approximately 15 minutes (on the average) in the sessions.
Figure 4 shows that the percent of training trials on which

72
S4 selected the "correct" stimulus was variable until the
last 6 sessions of the experiment. Figures 26 and 27 show
that there was no clear pattern of selection of the other
stimuli in the comparison array.
With respect to the derived trial types, Figure 4 shows
that S4 selected the "correct" stimulus on 10 - 40% of all
trials until session 17. Figures 23-25 show that on probe
trials, there was approximately even selection of all
stimuli in the comparison array excepting for the CA option.
Until session 17, the CA option was selected more often than
any other stimulus in the comparison arrays (see Fig. 26-
28). Figures 23-25 also show that the acquisition of
original conditional discriminations was very closely
followed by a general drop in selection latencies for some
trial types. Notice also that the selection of the CA
option ceased immediately although it continued to be
available for the duration of the experiment.
With respect to symmetry configurations, specifically,
Figures 23-25 show that acquisition of
related conditional discriminations closely coincided with
general decreases in selection latencies for all symmetry
trial types. Notice that for 3 of the 6 symmetry
configurations (Bl-Al, Cl-Bl, and C2-B2), acquisition of
related conditional discriminations was also closely
followed by an increase in the frequency with which the
"correct"stimulus was selected. Figures 26 & 27 show that

73
A 1 - B 1
3 0
15
cn ~o 3 0 c o o 15 <L>
if) 3 0 c
>> 15 o c a> 3 0 o
15
V) ~o c o o 0
if)
>N o c 0
3 0
15
3 0
15
0
i i
B 1 - C 1
• • • • • •
m m -*mr n L • fiiiiiHf1 •k-L— J
B 1 - A 1
B 1 - A 2
B 1 - A 3
B 1 - C A
1 L
11 111 In,II Lu l l
nil I I • • •
ll li I y«kiiii ili.
A 1 - C 1
A 1 - C 2
A 1 - C 3
A 1 - C A Li] Ll
I
L lllliillllli lllil hImiIiiJ iLnUuLmtl
ill L
C 1 - B 1
C 1 - B 2
C 1 - B 3
C 1 - C A
L I
i in Ii i I ,, i l
* hlil lull JJxu
ll 1111 I 11 ll I
C 1 - A 1
C 1 - A 2
C 1 - A 3
C 1 - C A
0 4 0 8 0 1 2 0 1 6 0
Consecutive Trials
i i i r 0 4 0 8 0 1 2 0 1 6 0
Consecutive Trials

74
Fig. 23: Trial by trial data for S4 on A1-B1-C1 set of
stimuli. The top two graphs represent all original relation
trials presented throughout the experiment. The solid
diagonal line represents the delay to prompt onset; the dots
represent the latency to selection. The remaining graphs
present trial by trial data for all related derived
relations. The graphs indicate the specific stimulus
selected, the vertical lines represent the latency to
selection.

75
B 2 - C 2 A 2 - B 2
O 10
B 2 - A 2
I hi ih B 2 - A 1
B 2 - A 3
B 2 - C A
A 2 - C 2
I nil
A 2 - C 1
A 2 - C 3
I f I ' I
A 2 - C A QJ 30
C 2 - B 2
C 2 - B 1
C 2 - B 3
C 2 - C A
C 2 - A 2
C 2 - A 1
C 2 - A 3
C 2 - C A
0 40 80 120 160 o 40 80 120 160
Consecut ive Trials Consecut ive Trials

76
Fig. 24: Trial by trial data for S4 on A2-B2-C2 set of
stimuli. The top two graphs represent all original relation
trials presented throughout the experiment. The solid
diagonal line represents the delay to prompt onset; the dots
represent the latency to selection. The remaining graphs
present trial by trial data for all related derived
relations. The graphs indicate the specific stimulus
selected, the vertical lines represent the latency to
selection.

77
CO ~o c o o <D
00
>N o c <D
A 3 - B 3
# • • - • • • • • ;
B 3 - C 3
...
(0 TD C O O CD
00
>s O c CD
CO ~D C o o <D
00
>N o c CD
UllLlal i»L
II I ll I bnl.l
I—il—III! ill I hli H
1 i mil lull
B3-A3
B3-A1
B3-A2
B3-CA
Lk.
A3-C3
A3-C1
A3 -C2
A3-CA j_Li_
UJ
111 III
iliilulm
11 11 i lU
C3-B3
C3-B1
C3 -B2
C3-CA
k I I hi II i Hi i J hi 11 li i,
• tin III i
C3-A3
C3-A1
C3-A2
C3-CA
i i r n i 1 r 0 40 80 120 160 0 40 80 120 160
Consecutive Trials Consecutive Trials
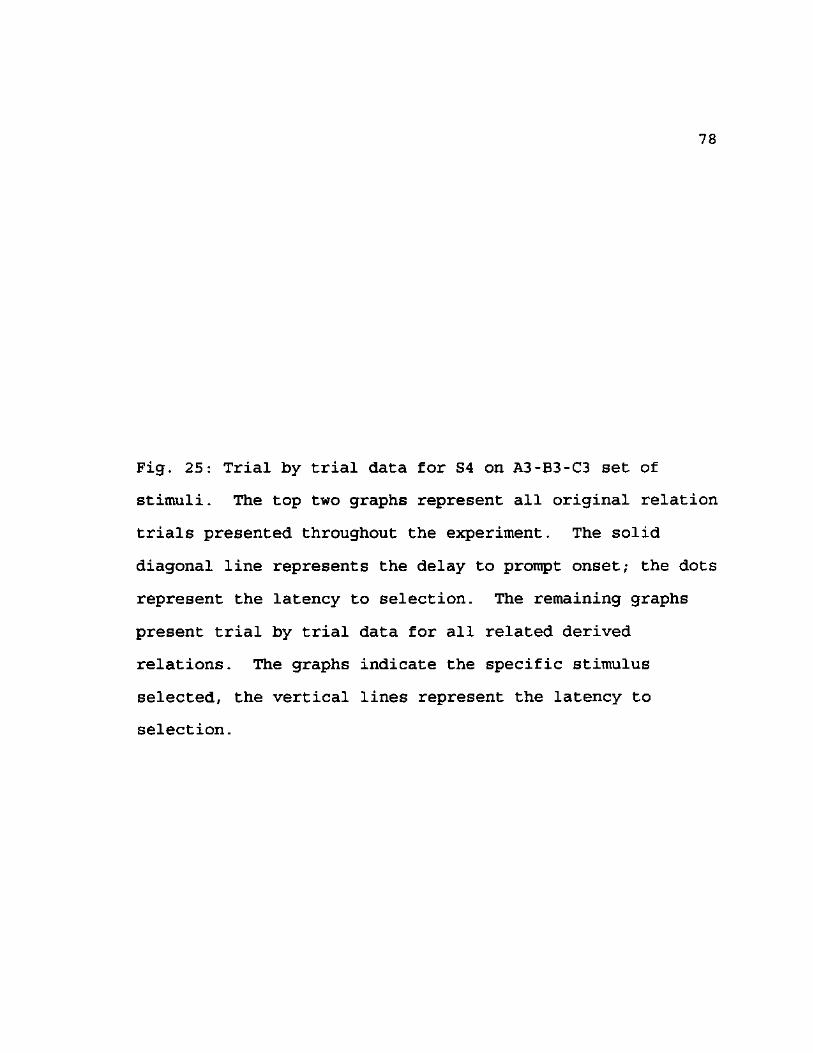
78
Fig. 25: Trial by trial data for S4 on A3-B3-C3 set of
stimuli. The top two graphs represent all original relation
trials presented throughout the experiment. The solid
diagonal line represents the delay to prompt onset; the dots
represent the latency to selection. The remaining graphs
present trial by trial data for all related derived
relations. The graphs indicate the specific stimulus
selected, the vertical lines represent the latency to
selection.

79
S4 began selecting the "correct" stimulus to the exclusion
of all other stimuli given symmetry configurations with B1
(top right graph, Fig. 26), CI (top right graph, Fig. 27)
and C2 (middle right graph, Fig. 27) as samples. Figures 26
& 27 also show that, given the other three symmetry
configurations (with B2, B3, and C3 as samples), S4
continued to select the "correct" stimulus about as often as
other stimuli in the comparison array. The CA option,
however, was no longer selected.
With respect to transitivity and equivalence
configurations, Figures 23-25 (bottom set of graphs) show
that there were general decreases in selection latencies
loosely correlated with acquisition of related conditional
discriminations for all of the transitivity and equivalence
trial types. Notice, however, that there were almost no
changes with respect to the specific stimuli selected.
There were two exceptions - 1) S4 abruptly stopped selecting
the CA option on all derived trial types and 2) she began
selecting C2 when A2 was the sample to the exclusion of all
other stimuli (including the CA option) in the comparison
array (see middle left graph in Fig. 28).
One particularly interesting difference between S4 and
the other subjects' performance was the abrupt appearance of
the original conditional discriminations and the abrupt
cessation of CA selection for all trial types during one

80
A 1 - B 1 B 1 - A 1 / A 2 / A 3 / C A
C o
-4—1
o Q) CD
i f )
O >> u c 0 D cr CD
CD >
'-4-J _o
3 £ D O
150 -
120
90
6 0 -
30 -
0
A 2 - B 2
A 3 - B 3
150 -
1 2 0 -
90 -
0 6 12 18 24 30
Consecutive Sessions
i i i 1 r B 2 - A 2 / A 1 / A 3 / C A
! j , , p
B 3 - A 3 / A 1 / A 2 / C A
0 6 12 18 24 30
Consecutive Sessions
A1 B1
B1 A1
A1 B2
B1 A2
A1 B3
B1 A3
A1 CA
B1 CA
A2 — B2
B 2 - A2
A2 - B 1
B2 - A1
A2 - -B3
B2- A3
A2 CA
B2 CA
A3 B3
B3 A3
A3 B1
B3 A1
A3 B2
B3 A2
A3 CA
B3 CA

81
Fig. 26: S4 - Cumulative selections are plotted for each
comparison stimulus in the array (including the Can't Answer
option) given a particular sample stimulus. From the top,
the graphs in the left column present cumulative selections
of all B stimuli given Al, A2 and A3 as samples,
respectively. The graphs in the right column present
cumulative selections of all A stimuli given Bl, B2 and B3
as samples, respectively. In the legend, identifiers
flushed left apply to the graphs in the left column,
identifiers flushed right apply to graphs in the right
column. Phase changes (indicated by vertical dotted lines)
are explained in the text.

82
B1-C1 C1 —B1/B2 /B3 /CA
C O
-i—1
U Q) (D
<f)
O C CD D cr <D
CD >
'-f-J _o
D £ D o
180 160 140 120 100
80 60 40 20
0
B 2 - C 2
B 3 - C 3
i \ r C2—B2/B1/B3/CA
i i i i r C 3 - B 3 / B 1 / B 2 / C A
Consecutive Sessions
i i i i r
0 6 12 18 24 30
Consecutive Sessions
B1 C1
C1 B1
B1 C2
C1 B2
B1 €3
C1 B3
B1 CA
C1 CA
B2- -C2
C2 B2
B2 C1
C2 B1
B2 C3
C2 B3
B2 CA
C2 CA
B3 C3
C3 B3
B3 C1
C3 B1
B3 C2
C3 B2
B3 CA
C3 CA

83
Fig. 27: S4 - Cumulative selections are plotted for each
comparison stimulus in the array (including the Can't Answer
option) given a particular sample stimulus. From the top,
the graphs in the left column present cumulative selections
of all C stimuli given Bl, B2 and B3 as samples,
respectively. The graphs in the right column present
cumulative selections of all B stimuli given CI, C2 and C3
as samples, respectively. In the legend, identifiers
flushed left apply to the graphs in the left column,
identifiers flushed right apply to graphs in the right
column. Phase changes (indicated by vertical dotted lines)
are explained in the text.

84
A 1 - C 1 C1 — A 1 / A 2 / A 3 / C A
C o V-' u
_CD
0 00
o c CD D cr (D
CD >
'-+-J a D E D o
150 -
120 -
90 -
6 0 -
30 -
0
A 2 - C 2
A 3 - C 3
150 -|
120
90
60
30
0
0 _I ! ! ! r _
6 12 18 24 30
i i r C 2 - A 2 / A 1 / A 3 / C A
i 1 r C 3 — A 3 / A 1 / A 2 / C A
1 I T 0 6 12 18 24 30
A1 C1
C1 A1
A1 C2
C1 A2
A1 C3
C1 -A3
A1 CA
C1 CA
Consecutive Sessions Consecutive Sessions
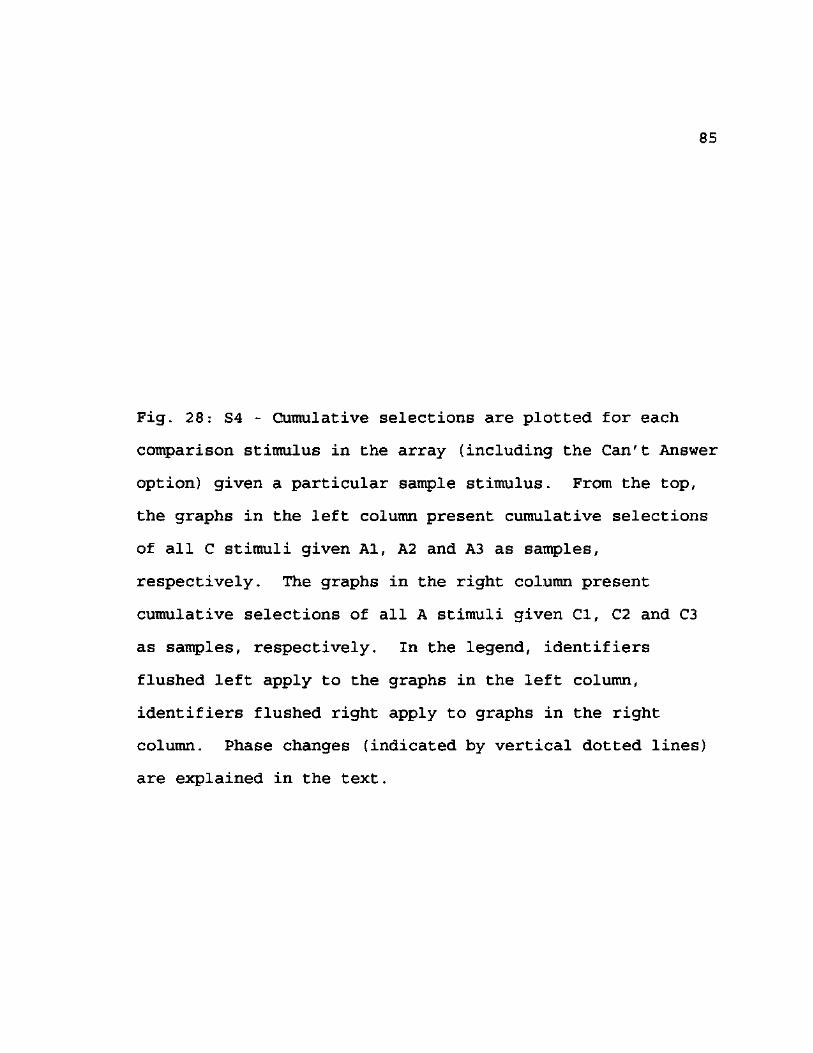
85
Fig. 28: S4 - Cumulative selections are plotted for each
comparison stimulus in the array (including the Can't Answer
option) given a particular sample stimulus. From the top,
the graphs in the left column present cumulative selections
of all C stimuli given Al, A2 and A3 as samples,
respectively. The graphs in the right column present
cumulative selections of all A stimuli given CI, C2 and C3
as samples, respectively. In the legend, identifiers
flushed left apply to the graphs in the left column,
identifiers flushed right apply to graphs in the right
column. Phase changes (indicated by vertical dotted lines)
are explained in the text.

86
session (session 17). Prior to the beginning of session 17,
S4 informed the experimenter that she no longer had access
to personal transportation and that she would be relying on
her family members to bring her to the sessions. She also
asked if her "ride" could wait in the lobby while she
participated in the experiment. It is quite likely that
this situation exerted some control over the latencies to
selection with respect to all trial types. Particularly, it
appears to have resulted in S4's not waiting for the prompt
before selecting a conparison stimulus on the training
trials and not selecting the CA option on the derived
trials.
The preceding section described each subject's
performance in some detail. The following section will
compare subjects' performances and identify some patterns.
First, only 2 of the 4 subjects' (SI & S2) performance could
be said to be indicative of equivalence class formation.
Performances of SI & S2 were comparable in several respects.
Notice that, for both subjects, accuracy of responses on the
derived trial types started out low, soon increased to above
60% correct, and then gradually decreased to between 0 - 10%
correct by the 10th session. Also notice that for both
subjects, this decrease in accuracy was a function of the
exclusive selection of the CA option given derived trial-
type configurations of stimuli. Note additionally, the
increase and then decrease in "correct" responding on probe

87
trial types was most pronounced for symmetry trials for both
subjects. It is apparent, however, with respect to the
accuracy of responses on all derived relations for SI. It
is also apparent for 2 of the 3 derived relations for S2.
Another interesting similarity between SI and S2 was
the transition to exclusive CA selection following original
conditional discrimination acquisition. Notice that, for
both subjects, derived trial configurations reliably
occasioned the selection of the CA option. Notice
additionally that for both subjects, responding indicative
of equivalence class formation began occurring abruptly.
For SI, the abrupt change in the stimuli selected beginning
with the first session in which the CA option was no longer
available. For S2, the abrupt change was observed during
the second instructed session (the CA option was not
available).
S3 & S4's performances were also similar to each
others'. Notice that these two subjects' selections of the
"correct" stimulus on the training trials were considerably
more variable than SI or S2. Notice also that both
subjects' performances on derived trial types fluctuated
around chance levels of accuracy for the first 5 - 6
sessions. S3's accuracy on transitive and equivalence trial
types increased slightly over the next 5-6 sessions and
began fluctuating around 40 - 50% correct. S4's accuracy on
transitive and equivalence trials remained at around chance
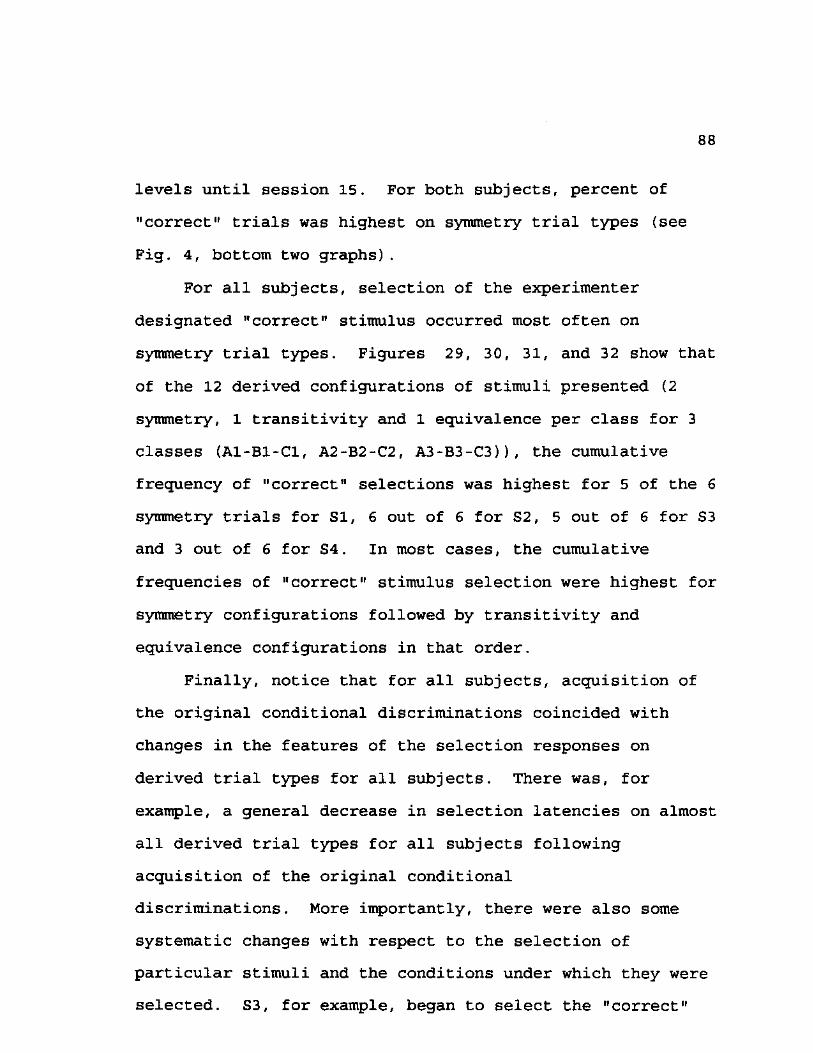
88
levels until session 15. For both subjects, percent of
"correct" trials was highest on symmetry trial types (see
Fig. 4, bottom two graphs).
For all subjects, selection of the experimenter
designated "correct" stimulus occurred most often on
symmetry trial types. Figures 29, 30, 31, and 32 show that
of the 12 derived configurations of stimuli presented (2
symmetry, 1 transitivity and 1 equivalence per class for 3
classes (A1-B1-C1, A2-B2-C2, A3-B3-C3)), the cumulative
frequency of "correct" selections was highest for 5 of the 6
symmetry trials for SI, 6 out of 6 for S2, 5 out of 6 for S3
and 3 out of 6 for S4. In most cases, the cumulative
frequencies of "correct" stimulus selection were highest for
symmetry configurations followed by transitivity and
equivalence configurations in that order.
Finally, notice that for all subjects, acquisition of
the original conditional discriminations coincided with
changes in the features of the selection responses on
derived trial types for all subjects. There was, for
example, a general decrease in selection latencies on almost
all derived trial types for all subjects following
acquisition of the original conditional
discriminations. More importantly, there were also some
systematic changes with respect to the selection of
particular stimuli and the conditions under which they were
selected. S3, for example, began to select the "correct"
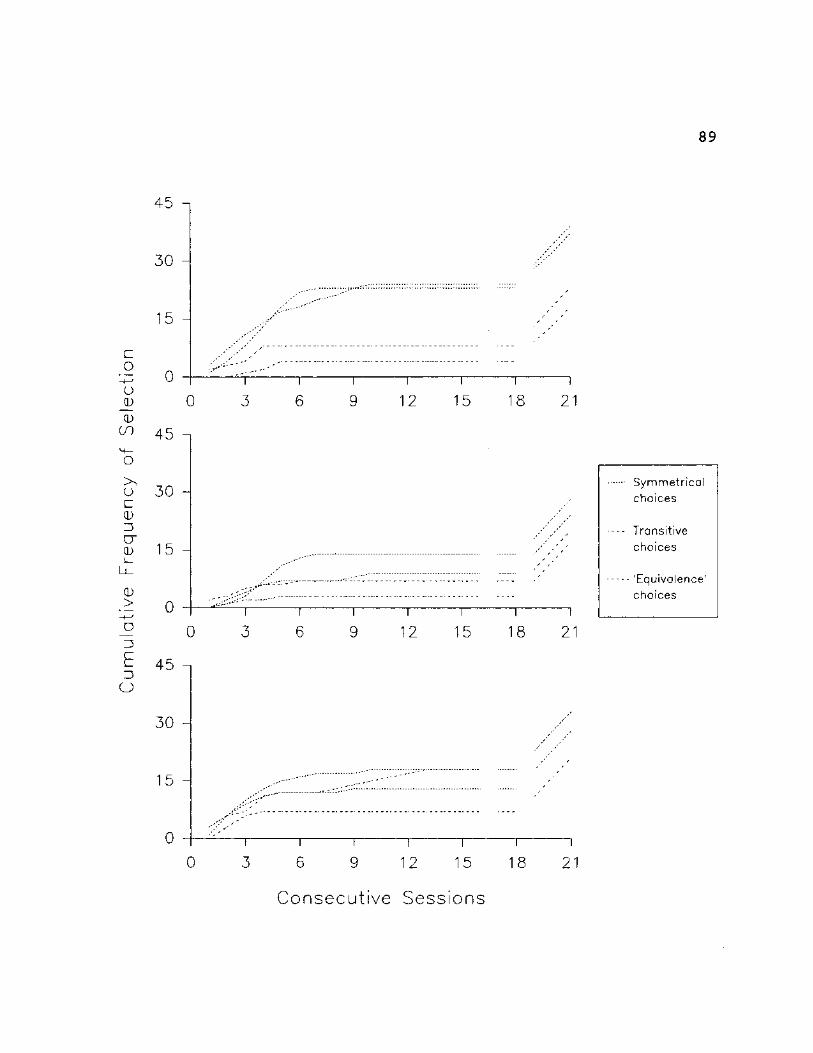
45
30
89
15
c _o o
_0 0
ID M— o >N u c 0 Z5 cr 0
0 >
_o
D
E ZS
o
0
0
45
30
15 -
0
0
45
30 -
"T~
3
3
~r
6 ~T~
9 12 15 18 21
12 15 18 21
Symmetrical choices
Transitive choices
• 'Equivalence' choices
15 -
0 I i I i i i i
0 3 6 9 12 15 18 21
Consecut ive Sessions

90
Fig. 29: SI - Cumulative frequencies of selection of the
designated "correct" stimuli for each of the three
arbitrarily arranged classes: A1-B1-C1 (top graph), A2-B2-C2
(middle graph) and A3-B3-C3 (bottom graph) are presented.
The phase change lines are explained in the text.

91
75
60
45
30
15 H c
•$ 0 o
_a> 0
0 ^ 7 5 - i
° 6 0 ->s o c 45 0
cr 30 0
0 >
H—' _o Z5
E 3
o
15
0
0
75
60
45 H
30
15 H
0
~r
5 10
10
15 20 25
15 20 25
30
30
i i i i i r~ 0 5 10 15 20 25 30
Consecutive Sessions
35
35
35
Symmetr ica l
choices
Transit ive
choices
• 'Equivalence'
. choices

92
Fig. 30: S2 - Cumulative frequencies of selection of the
designated "correct" stimuli for each of the three
arbitrarily arranged classes: A1-B1-C1 (top graph), A2-B2-C2
(middle graph) and A3-B3-C3 (bottom graph) are presented.
The phase change lines are explained in the text.

93
c #o H—' o Q)
<D 00
O
X o c <L) Z5 cr 0)
LL_
(D >
H—'
_D
3
£
o
150
125 -
100 -
75 -
50 -
25 -
0
0
150
125 -
100 -
75
50
25
0
0
150
125 -
100 -
75
50
25 H
0
10 15 20 25 30 35
-M : ^ -
10 15 20 25 i
30 35
10 15 20 25 30
Consecutive Sessions
Symmetrical choices
Transitive choices
'Equivalence' choices
94
Fig. 31: S3 - Cumulative frequencies of selection of the
designated "correct" stimuli for each of the three
arbitrarily arranged classes: A1-B1-C1 (top graph), A2-B2-C2
(middle graph) and A3-B3-C3 (bottom graph) are presented.
The phase change lines are explained in the text.
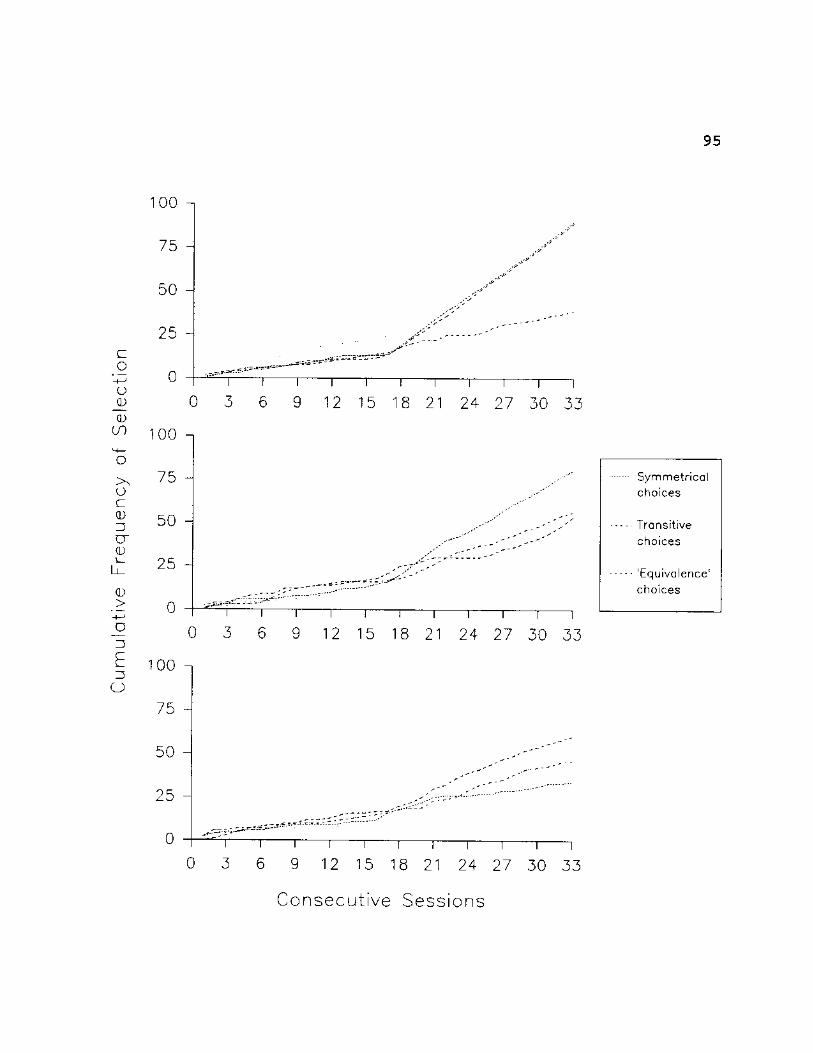
95
c o
H—' o Q) CD
( / )
M— o >N o c 0 D c r 0
d) >
H—' _o 13
E D
o
1 0 0 n
75 -
50
25 -]
0
1 0 0
75
50
25
0
1 0 0 -
75 i
50 -
25
0
i r 0 3
0 3
~i i i i i i i i i
9 12 15 18 21 24 27 30 33
\ i i i i i \ 1 1
9 12 15 18 21 24 27 30 33
0
~r 3
T n i i i 1 1 1 1 12 15 18 21 24 27 30 33 6 9
C o n s e c u t i v e Sess ions
Symmetrica! choices
Transitive choices
'Equivalence' choices

96
Fig. 32: S4 - Cumulative frequencies of selection of the
designated "correct" stimuli for each of the three
arbitrarily arranged classes: A1-B1-C1 (top graph), A2-B2-C2
(middle graph) and A3-B3-C3 (bottom graph) are presented.
The phase change lines are explained in the text.

97
stimulus more often than any other stimulus in the
comparison array following original conditional
discrimination acquisition (see Figs. 17-19) on 5 of the 6
symmetry trial types (Bl-Al, Cl-Bl, B2-A2, C2-B2 and B3-A3).
SI and S2 began to select the CA option exclusively on all
derived trial types after original conditional
discrimination acquisition. Figures 5-7 (SI) and 11-13 (S2)
further show that the latencies to selection of CA on
derived trial types were quite low. Finally, recall that SI
and S2 selected the "correct" stimulus on all training trial
types during the same time period. The combination of
exclusive CA selection on derived trial types, the low
latencies to selection and the consistent selection of the
experimenter designated "correct" stimuli on all training
trial types during the same time period suggests that SI and
S2's selection responses had come under control of the
entire configuration of stimuli on the screen rather than
particular relations (or the lack thereof) between
particular sample and comparison stimuli. In other words,
derived trial types, regardless of the particular trial,
reliably occasioned CA selection while training trial types,
regardless of the particular trial, reliably occasioned the
selection of the "correct" stimuli.

CHAPTER IV
DISCUSSION
This section will address some of the implications of
the data described in the results section. Following that,
some broader issues will be discussed which do not derive
directly from the data but are appropriately discussed in
their context. To restate, the questions of interest in
this experiment were: 1) What is the effect of original
conditional discrimination acquisition on the occurrence of
untrained conditional discriminations? and 2) What is the
role of the training and testing configurations on the
occurrence of these conditional discriminations?
With respect to the first question, the data presented
above show that original conditional discrimination
acquisition, for all subjects, was coincident with changes
in the particular stimuli selected on derived trials and the
latency to the occurrence of those selections. Si and S2,
for example, reliably began selecting the CA option on
derived trial types while selecting the experimenter
designated "correct" stimulus on all training trial types.
S3 began to select the "correct" stimulus more often than
any other on 5 of the 6 symmetry trial types presented. For
all subjects, a general decrease in latency was observed on

99
derived trial types coincident with original conditional
discrimination acquisition.
Notice, however, that original conditional
discrimination acquisition was not coincident with
"equivalence class formation" for any of the four subjects.
Subjects 1 and 2 began to respond in ways consistent with
the predictions made by the experimenter on the basis of the
trained conditional discriminations only after the CA option
was removed (SI) or after additional instructions were given
(S2). The ease with which derived relational responding is
observed with adult human repertoires (see any sample of
existing stimulus equivalence literature) and the fact that
it was not observed with any of the subjects in the current
experiment is interesting. It is possible that the
availability of all trial types from the beginning of the
experiment and/or the availability of the Can't Answer
option played a critical role. Some implications of these
possibilities will be discussed later.
With respect to the second question, recall that SI
and S2 began selecting the CA option exclusively on all
derived trial types while selecting the experimenter
designated "correct" stimulus on all training trial types.
The combination of exclusive CA selection on all derived
configurations, the low latencies to selection, and
selection of the "correct" stimuli on training trials
suggests that SI and S2's selections had come under control
100
of the entire configuration of stimuli rather than the lack
of specific stimulus-stimulus relations. This point is
further supported by the fact that selections indicative of
equivalence relations among stimuli began occurring
immediately after the removal of the CA option for SI. S2's
performance was similarly relevant in this regard in terms
of the abrupt appearance of responding indicative of
equivalence relations. The reader should recall that the
change in S2's performance was not seen following the
removal of CA but after instructions with respect to his
performance in the task were given.
It would appear that the current preparation is not
very effective in terms of arranging conditions which
occasion conditional discriminations that are said to be
indicative of equivalence class formation. As mentioned
earlier, it is quite possible that the availability of the
CA option arranged conditions under which the most efficient
response was to select CA. Presenting all trial types from
the beginning of the experiment might also have exerted some
control over the functions of the stimuli involved in the
trials which accounted for the occurrence of un-predicted
conditional discriminations.
Notice that the above statements describe (as opposed
to explain) the observed patterns of responding. It is
suggested that the determination of 1) whether the
conditions described immediately above were responsible for

101
the non-occurrence of derived conditional discriminations
and if they were, 2) what it was about the presentations
that accounts for the non-occurrence would help our
understanding of the processes involved in stimulus
equivalence. In other words, determining the exact nature
of the (possibly) limiting conditions described above would
enhance our understanding of stimulus equivalence. Notice,
finally, that the above questions are empirical in nature.
There are several important aspects of this preparation
that need to understood in more detail. The CA option, for
example, was observed to be critical with at least 2 of the
4 subjects used in this experiment. For SI and S2, the CA
option appeared to provide an opportunity to maximize
overall rate of reinforcement. This opportunity could be
directly manipulated by changing the response
Although the preceding section has identified some
important weaknesses with the current preparation, there are
some important benefits. These will be discussed next. A
possible implication of these findings is that the current
concerns with identifying S+ or S- control (exerted by the
comparison stimuli) might be slightly misplaced. It is
quite possible that the selection responses of interest are
not under exclusive S+ gr S- control but under multiple (S+
and S-) control. That is, it is possible that the selection
of B1 is not only under control of the discriminative (S+)
function of B1 in the presence of A1 but also under S-
102
control of the other stimuli in the comparison array. This,
it seems, is consistent with the way we identify sources of
control in any complex environment. Notice that whether or
not this suggestion has any merit is, ultimately, an
empirical question. It is suggested, however, that the
preparation employed here may be more useful than
traditional preparations in terms of our abilities to ask
and answer such questions.
One of the reasons for the concern with identifying the
nature of the control as S+ or S- may derive from the use of
percent of correct trials as the dependent measure. Notice
that "percent correct" is a measure of the subject's
performance in terms of the conditional discriminations
predicted by or of interest to the experimenter. Another
way of saying this is that percent correct, as it is
typically defined, is a measure of S+ control only. From
this perspective, orderly patterns in the data are
identified only in terms of the accuracy of the responses as
defined by the experimenter. Any other orderly relations
are obscured. The alternative in this experiment was to
measure every selection response regardless of whether or
not it would be predicted by the experimenter. This
strategy allows the identification of orderly relations in
the data that are obscured by the percent correct measure.
In other words, orderly relations can be measured not only
in terms of accuracy of responses but also in terms of the

103
subject's interactions with all trial types. There are some
important benefits to be gained from this alternative.
Recall, for example, that S3's increasing accuracy on A3-C3
(transitivity) trials was actually found to be a function of
a bias with respect to the selection of C3 given
transitivity configurations. The same pattern is apparent
with respect to S3's performance on C3-A3 (equivalence)
trials (i.e., a bias toward the selection of A3 given
equivalence configurations). Recall that this pattern is
also evident with respect to SI and S2's performance on
equivalence trial types. The percent correct measure does
not allow for the identification of these kinds of orderly
relations.
Another methodological benefit of this preparation
derives from the ability to relate subjects' performances on
derived trial types with their performances on training
trial types. The presentation of derived trial types from
the beginning allows us, in effect, to obtain baseline
measures of the responses of interest. Consideration of the
presentation of all derived trial types from the beginning
as baseline measures can be clarified in the following way.
Suppose that we presented the subjects with a series of
derived trial types before any training was conducted, then
presented training trials (consequated) for 5 sessions, re-
presented the derived trial types for 1 session and so on
until responses indicative of equivalence class formation

104
were observed. We would have no problem, in this context,
characterizing the first presentation (and possibly
subsequent presentations) of derived trial types as measures
of baseline performance. The continuous presentation of
derived trial types, then, is simply one end of a continuum
upon which this sort of strategy lies.
At a more general level, there are some important
problems that need to be addressed with respect to stimulus
equivalence. Pilgrim (1993) observed that "[i]n numerous
demonstration studies, no true independent variable is
manipulated and tests of untrained stimulus relations may
seem to be designed more to reveal underlying processes then
to evaluate functional relations responsible for the
observed structure " (p. 478). It is possible that the
methodological features of current stimulus equivalence
research have led to conceptual problems upon which Pilgrim
(1993) comments. Whether or not that is true, there are
some important problems with the way we have traditionally
talked and continue to talk about stimulus equivalence.
The problem, in general, is the working assumption that
particular combinations of experimental and pre-experimental
histories cause stimuli to become related in a class and
post-hoc tests can then document the existence of such
classes. More consistent with a behavior analytic
perspective is to say that the subjects' performance in
match-to-sample tasks are instantiations of the relations

105
and not indications of the existence of those relations.
This is analogous to the way we talk about operant classes.
The occurrence of a response does not indicate the existence
of an operant class, rather it is an instance of the
operant. It is suggested that, in precisely the same way,
equivalence classes do not exist independently of the
conditional discriminations said to indicate their
existence. Accurate conditional discriminations on probe
trials do not document the (presumably previous) existence
of "stimulus-stimulus relations" - called equivalence
classes -- rather they are instances of "equivalencing".
From this perspective, attempts to identify the
variables that control the occurrence of the "instance" are
the only relevant concerns for a behavioral analysis.
Traditional preparations, especially the use of percent
correct measures, explicitly ignore the local variables that
may effect the occurrence of these instances of
"equivalencing". It is suggested that this preparation
allows a more dynamic approach to the understanding of
what we call stimulus equivalence and is consistent with our
fundamentally unique approach to our subject matter.

REFERENCES
Carrigan, P. F. Jr. & Sidman, M. (1992). Conditional
discrimination and equivalence relations: A theoretical
analysis of control by negative stimuli. Journal of
the Experimental Analysis of Behavior. 58. 183-204.
Duarte, A. M., Rosales, J., Eikeseth, S. & Baer, D. M.
(1991). The effects of a CAN'T ANSWER response option
and instructions on stimulus equivalence. Unpublished
doctoral dissertation, University of Kansas, Kansas.
Fields, L. & Verhave, T. (1987). The structure of
equivalence classes. Journal of the Experimental
Analysis of Behavior. 48. 317-332.
Fields, L., Verhave, T. & Fath, S. (1984). Stimulus
equivalence and transitive associations: A
methodological analysis. Journal of the Experimental
Analysis of Behavior. 42. 143-157.
Harrison, R. J. & Green, G. (1990). Development of
conditional and equivalence relations without
differential consequences. Journal of the Experimental
Analysis of Behavior. 54. 225-237.
Johnson, C. & Sidman, M. (1993). Conditional
discriminations and equivalence relations: Control by
negative stimuli. Journal of the Experimental Analysis
of Behavior. 59. 333-348.

107
Mcllvane, W. J. & Dube, W.V. (1990). Do stimulus classes
exist before they are tested? Analysis of Verbal
Behavior. 8. 13-18.
Pilgrim, C. (1993). On the ratification of states: A
response to Staddon. Journal of the Experimental
Analysis of Behavior. 60. 477-480.
Saunders, R. R. & Green, G. (1992). The nonequivalence
of behavioral and mathematical equivalence. Journal of
the Experimental Analysis of Behavior. 57. 227-241.
Saunders, R. R., Saunders, K. J., Kirby, K. C., & Spradlin,
J. E. (1988). The merger and development of
equivalence classes by unreinforced conditional
selection of comparison stimuli. Journal of the
Experimental Analysis of Behavior. 50. 145-162.
Saunders, K. J., Spradlin, J. E. & Saunders, R. R. (1989).
Detecting equivalence relations that develop prior to
testing. Proceedings of the 22nd Annual Gatlinburg
Conference on Research and Theory in Mental Retardation
and Developmental Disabilities, 32.
Sidman, M. (1980). A note on the measurement of
conditional discrimination. Journal of the
Experimental Analysis of Behavior. 33. 285-289.
Sidman, M. (1986). Functional analysis of emergent verbal
classes. In T. Thompson & M.D. Zeiler (Eds.), Analysis
and integration of behavioral units (pp. 213-245).
Hillsdale, NJ: Erlbaum.

108
Sidman, M. (1987). Two choices are not enough. Behavior
Analysis. 22. 11-18.
Sidman, M. (1990). Equivalence relations: Where do they
come from? In D.E. Blackman & H. Lejeune (Eds.),
Behaviour analysis in theory and practice:
Contributions and controversies (pp. 93-114).
Hillsdale, NJ: Erlbaum.
Sidman, M. (1992). Equivalence relations: Some basic
considerations. In S.C. Hayes and L.J. Hayes (Eds.),
Understanding Verbal Relations (pp. 15-28). Reno, NV:
Context Press.
Sidman, M. & Tailby, W. (1982) . Conditional discriminations
vs. matching-to-sample: An expansion of the testing
paradigm. Journal of the Experimental Analysis of
Behavior. 37. 5-22.
Stikeleather, G. & Sidman, M. (1990). An instance of
spurious equivalence relations. The Analysis of Verbal
Behavior. 8. l-ll.
Touchette, P.E. (1971). Transfer of stimulus control:
Measuring the moment of transfer. Journal of the
Experimental Analysis of Behavior. 15. 347-354.