3800141 a
DESCRIPTION
w454545TRANSCRIPT

Flow cytometric analysis of normal andreactive spleen
Adriana I Colovai1, Christina Giatzikis1, Eric K Ho1, Mushahid Farooqi1,Nicole Suciu-Foca1, Giorgio Cattoretti1 and Attilio Orazi2
1Department of Pathology, Columbia University, New York, NY, USA and 2Department of Pathology andLaboratory Medicine, School of Medicine, Indiana University, Indianapolis, IN, USA
Spleen is surgically removed for both non-neoplastic and neoplastic pathologies. A significant proportion ofsplenectomy specimens require distinguishing between reactive and neoplastic conditions (eg lymphoma). Toestablish a ‘normal’ reference range for the spleen lymphocyte subsets, fresh samples of benign, reactivespleens obtained from adult patients (N¼ 12) and samples of normal spleen obtained from cadaveric transplantdonors (N¼ 14) were analyzed using three- and four-color flow cytometry. Study of pan-B, -T, and -NK markerexpression revealed that the frequency of T cells is higher and that of B cells is lower in reactive (non-neoplastic) compared to normal (cadaveric) spleen. Furthermore, our study established a frame of reference forcell markers commonly used for immunophenotyping of lymphoma, and identified discrete lymphocytesubsets, such as early plasma cells and T cells carrying the phenotype of the NK/T subset. These results willfacilitate an accurate interpretation of the flow cytometric analysis of human spleen lymphocytes.Modern Pathology (2004) 17, 918–927, advance online publication, 23 April 2004; doi:10.1038/modpathol.3800141
Keywords: spleen; flow cytometry; reference range
Flow cytometry is a sensitive technique currentlyemployed by pathologists for quantitative andqualitative evaluation of hematopoietic cells.1–5 Ina clinical setting, the main purpose of flow cyto-metric analysis is to identify abnormal cells bydefining their immunophenotypic characteristics.To accomplish this task, multiparameter analysisrepresents a reliable approach that integrates theinformation provided by forward scatter (FSC) andside scatter (SSC) with multiple fluorescence para-meters. Thus, the cell size and internal complexityas well as the simultaneous expression of 3–4different cell antigens are evaluated and used tooutline distinct cell populations. Importantly, themultiparameter analysis permits the detection ofabnormal cells that occur at very low frequency inthe context of normal populations, such as in thecase of minimal residual disease.6,7
Three-color flow cytometry is currently used bymany laboratories for the analysis of leukemia andlymphoma, although technology is moving rapidlytowards more complex types of analysis, employing
six or more fluorescence parameters.8 In three-coloranalysis, a widely used strategy for the gating oflymphocytes is based on CD45 expression and SSCcharacteristics.9,10 This approach permits the analy-sis of aged samples with a better lymphocyterecovery compared to FCS vs SSC gating. Therefore,gating by CD45/SSC represents the strategy of choicefor immunophenotyping blood lymphocyte subsets,for example, monitoring CD4 counts in AIDSpatients.9 This strategy is also successfully appliedfor the analysis of many lymphoid malignanciesdetected in blood, bone marrow, and lymphnodes.1,9
Specific immunophenotypic profiles have beenestablished for several lymphoid neoplasms.1–4 Theabnormal profiles are compared to the pattern of cellmarker expression normally seen in the organ/tissuebeing examined, and a diagnostic interpretation ismade. While the normal reference ranges fordifferentiation antigens expressed by lymphoid cellsfrom peripheral blood, bone marrow, and lymphnodes are well established,11–15 there is littleinformation concerning the immunophenotypicprofile of lymphocytes found in normal or reactivespleen. The aim of our study was to provide adetailed immunophenotypic characterization ofhuman spleen lymphocytes using three- and four-colorflow cytometry. Our analysis established referencevalues for commonly used lymphoid markers and
Received 22 October 2003; revised 24 February 2004; accepted 25February 2004; published online 23 April 2004
Correspondence: Dr AI Colovai, PhD, College of Physicians andSurgeons of Columbia University, 630 W168 Street, P&S 14-402,New York, NY 10032, USA.E-mail: [email protected]
Modern Pathology (2004) 17, 918–927& 2004 USCAP, Inc All rights reserved 0893-3952/04 $30.00
www.modernpathology.org

defined discrete lymphocyte subsets in normal(cadaveric) and reactive (non-neoplastic) spleen.
Material and methods
Human spleen specimens were obtained from 11males and 15 females, with an age range of 17–79years (mean age 42). The specimens included 14normal spleens obtained from cadaveric organdonors and 12 spleens obtained from patients withnon-neoplastic conditions, such as idiopathicthrombocytopenic purpura (ITP) (six cases), splenicinfarct (three cases), benign vascular malformations(two cases), and pancreatic fistula (one case). Thediagnosis of reactive spleen was established by twoexperienced pathologists (AO and GC) based onmorphology findings. All spleen samples wereprocessed for flow cytometric analysis within 8 hfrom harvesting, using a simple and rapid proce-dure. The tissue was first teased with forceps intoRPMI 1640 cell culture medium (MediaTech,Herndon, VA, USA), allowed to settle, and largedebris was removed. The cell suspension was thenwashed and resuspended in phosphate-buffered saline(PBS) supplemented with 2% fetal calf serum(FCS) and 0.1% sodium azide. Cell viability wasassessed using Trypan Blue. All specimens includedin the study showed lymphocyte viability higherthan 80%.
To compare the frequency of B-cell subsetsidentified in the spleen and that found in peripheralblood or lymph nodes, 11 samples of blood and 8lymph nodes obtained from cadaveric organ donorswere included in this study. Lymph nodes were firstchopped into small pieces and the resulting cellsuspension was washed and resuspended in PBSsupplemented with 2% FCS and 0.1% sodiumazide. Lymph nodes with viability higher than80% were included in the study.
Flow Cytometry
For three-color flow cytometric analysis, aliquotsof 5� 105 cells/tube were stained with saturatingamounts of fluorescein isoththiocyanate (FITC)-,phycoerythrin (PE)-, and peridinin chlorophyllprotein (PerCP)-conjugated antibodies, accordingto the manufacturer’s instructions. As shown inTable 1, the antibody panel included monoclonaland polyclonal antibodies. CD45 antibody labeledwith the PerCP fluorochrome was added to eachtube for lymphocyte gating. To minimize the level ofnonspecific binding of antibodies used for thedetection of immunoglobulin (Ig) light and heavychains, cells were washed three times in PBSsupplemented with 10% FCS and 0.1% sodiumazide prior to staining.16 For intracellular staining,cells were fixed and permeabilized using Fix and
Table 1 Antibody panel
CD marker (FITC/PE/PerCP) Clone (FITC/PE/PerCP) Source (FITC/PE/PerCP)
CD2/CD19/CD45 39C1.5/J4119/2D1 Beckman Coultera/Beckman Coulter/BDb
CD3/CD19/CD45 SK7/4G7/2D1 BD/BD/BDCD4/CD8/CD45 SK3/SK1/2D1 BD/BD/BDCD20/CD5/CD45 L27/L17F12/2D1 BD/BD/BDCD7/CD13/CD45 4H9/L138/2D1 BD/BD/BDCD10/CD20/CD45 W8E7/L27/2D1 BD/BD/BDCD3/CD16+56/CD45 SK7/B73.1/2D1 BD/BD/BDKappa/Lambda/CD45 TB28-2/1-155-2/2D1 BD/BD/BDcy Kappa/cy Lambda/CD45 TB28-2/1-155-2/2D1 BD/BD/BDTCR alpha/beta/TCR gamma/delta/CD45 WT31/11F2/2D1 BD/BD/BDIgM/-/CD45 Polyclonal/-/2D1 BioSource Internationalc/-/BDIgG/-/CD45 Polyclonal/-/2D1 BioSource International/-/BDIgA/-/CD45 Polyclonal/-/2D1 BioSource International/-/BDIgD/-/CD45 Polyclonal/-/2D1 BioSource International/-/BDCD103/-/CD45 2G5/-/2D1 Beckman Coulter/-/BDFMC7/-/CD45 FMC7/-/2D1 Beckman Coulter/-/BDcy TdT/-/CD45 Polyclonal/-/2D1 Beckman Coulter/-/BD-/CD11c/CD45 -/S-HCL-3/D1 -/BD/BD-/CD23/CD45 -/EBVSC-5/2D1 -/BD/BD-/CD30/CD45 -/Ber-H83/2D1 -/BD/BD-/CD34/CD45 -/8G12/2D1 -/BD/BD-/CD38/CD45 -/HB7/2D1 -/BD/BD-/HLA-DR/CD45 -/L243/2D1 -/BD/BD-/cy CD79a/CD45 -/HM47/2D1 -/BD/BD
aBeckman Coulter, Miami, FL, USA.
bBD BioSciences, San Jose, CA, USA.
cBioSource International, Inc., Camarillo, CA, USA.
cy, cytoplasmic.
Flow cytometric analysis of human spleenAI Colovai et al
919
Modern Pathology (2004) 17, 918–927
Perm reagents (Caltag Laboratories, Burlingame, CA,USA), and then incubated with specific antibodies,as indicated in Table 1. Following staining, allaliquots were subjected to red cell lysis usingFACSLyse solution (BD Biosciences, San Jose, CA,USA). The presence of at least 90% CD45-positivecells within all acquired events was consideredindicative of efficient red blood cell lysis.
To study the immunoprofile of splenic B cells,four-color flow cytometry was performed. Spleno-cytes were stained with the following antibodycombinations: CD20 FITC/Kappa PE/CD45 PerCP/CD19 APC (APC: allophycocyanine), CD20 FITC/Lambda PE/CD45 PerCP/CD19 or isotype matchedcontrol antibodies (BD Biosciences). To test theexpression of CD38 and CD138 markers, typicallyexpressed by plasma cells, splenocytes were stainedwith CD20 FITC/CD38 PE/CD45 PerCP/CD19 APC(BD Biosciences) and CD20 FITC (BD Biosciences)/CD138 PE (Serotec Inc., Raleigh, NC, USA)/CD45PerCP/CD19 APC (BD Biosciences).
To compare B-cell populations found in spleen,whole blood and lymph nodes, splenocytes, wholeblood and lymphocytes isolated from lymph nodeswere stained with CD20 FITC/CD45 PerCP/CD19APC or isotype matched control antibodies (BDBiosciences). For this, 50 ml of whole blood or5� 105 lymphocytes isolated from lymph nodeswere incubated with each of the indicated antibodymix, then lysed and washed.
Samples were run and analyzed on a FACSCaliburinstrument (BD Biosciences). The sensitivity of thefluorescence detectors was set daily using Calibritebeads (BD Biosciences). FSC and SSC measurementswere made using linear amplifiers, whereas fluores-
cence measurements were made with logarithmicamplifiers. Flow cytometric two-parameter dot plotsand quadrant statistics were generated using Cell-quest software (BD Biosciences).
Statistical Analysis
The mean and standard deviation (s.d.) values forpercent positive cells were calculated as de-scribed.11 Student’s t-test was used to compare thefrequency of lymphocyte subpopulations in normal(cadaveric) vs reactive (non-neoplastic) spleens.Matched t-test was used to assess the differencesbetween paired results obtained for B-cell subsets.The correlation between age progression and thefrequency of lymphocyte subpopulations was deter-mined by simple linear equation using BMPDstatistical software.17
Results
The immunophenotypic profile of human spleenlymphocytes was studied using three- and four-color flow cytometry. The spleen specimens wereobtained from organ cadaveric donors (normalgroup) and from patients with nonmalignant condi-tions that required splenectomy and showed mini-mal involvement of the spleen (reactive group). Theantibodies used in this study recognize pan-T, -B,-natural killer (NK), and myeloid/monocytic anti-gens, covering markers that are essential for evalua-tion of lymphoma (Table 1).18 In addition, theantibody panel included markers that allow a
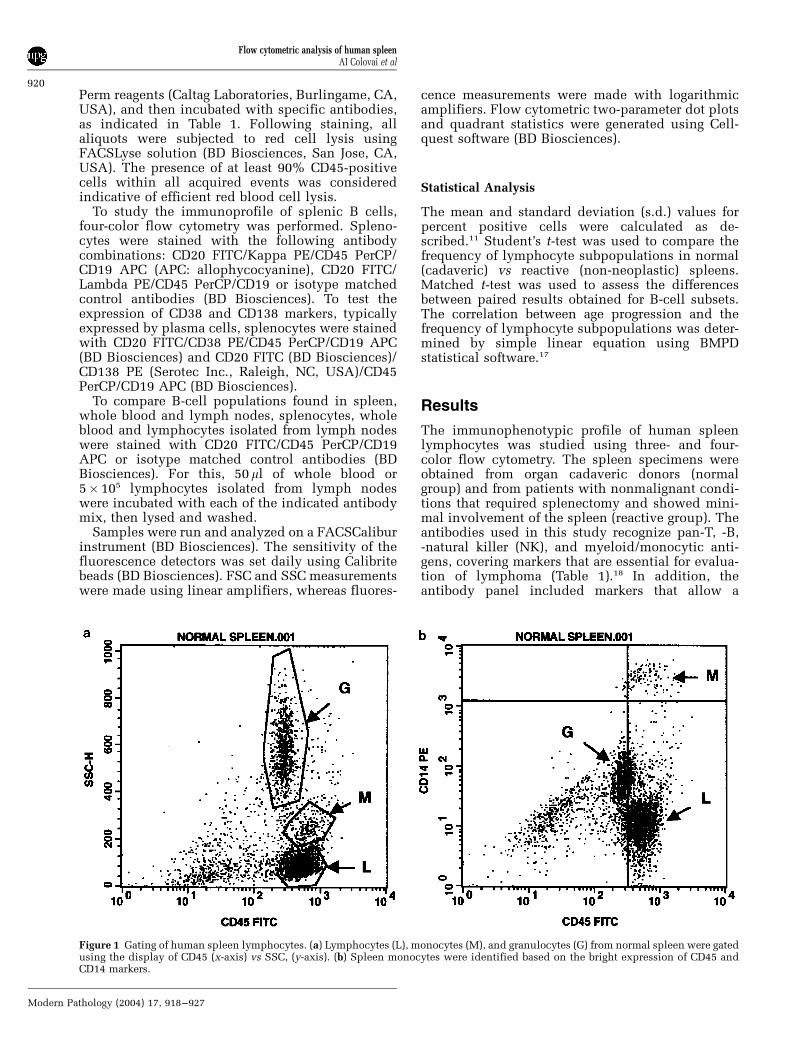
Figure 1 Gating of human spleen lymphocytes. (a) Lymphocytes (L), monocytes (M), and granulocytes (G) from normal spleen were gatedusing the display of CD45 (x-axis) vs SSC, (y-axis). (b) Spleen monocytes were identified based on the bright expression of CD45 andCD14 markers.
Flow cytometric analysis of human spleenAI Colovai et al
920
Modern Pathology (2004) 17, 918–927

detailed analysis of abnormal cells, beyond theinitial evaluation of the case.
As indicated in Figure 1, spleen lymphocyteswere gated based on bright expression of the CD45marker and low SSC. Among the nucleated cells,lymphocytes accounted in average for 82% of thecells. Monocytes were identified in each sampleusing the CD14 antibody, and were found torepresent about 2% of all nucleated cells. The meanpercentage and s.d. values for each marker orcombination of markers analyzed within the lympho-cyte gate are indicated in Table 2.
The comparison between normal and reactivespleen using the Student’s t-test of significanceindicated that, for several T- and B-cell markers,the differences between cell frequencies found inthe two groups of specimens were statisticallysignificant. Thus, the frequency of lymphocytesexpressing CD2, CD3, CD5, or CD8 was significantlyhigher in reactive compared to normal spleen, while
the frequency of CD19-positive cells was lower inreactive vs normal spleen (Table 2). The meanpercentages of cells expressing other T-cell markers,such as CD4 or T-cell receptor (TCR), were alsohigher in reactive vs reactive spleen, although thedifferences did not reach statistical significance.Likewise, the mean percentages of lymphocytesexpressing pan-B-cell markers, such as CD20,FMC7, CD79a, heavy and light Ig chains, were lowerin reactive compared to normal spleen. The fre-quency of NK cells appeared only slightly increasedin normal vs reactive spleen.
B-cell Profile
A typical immunoprofile of spleen B lymphocytesobtained by three-color analysis is indicated inFigure 2. The lymphocytes were gated using theCD45/SSC display (Figure 1) and analyzed for theexpression of the following markers: CD19, CD20,FMC7, cytoplasmic CD79a, surface and cytoplasmicKappa and Lambda Ig chains, surface IgA, IgD, IgGand IgM chains, HLA-DR, CD10, and CD23. Asshown in Table 2, the frequency of CD19 andcytoplasmic CD79a-positive cells had mean valuesof 55 and 52%, respectively, in normal spleens, and45 and 44%, respectively, in reactive spleen.Student’s t-test of significance indicated that therewere no statistical differences between the fre-quency of CD19 and cytoplasmic CD79a-positivecells within each group (P40.05). However, astatistically significant difference was found whenthe frequency of cells expressing CD19 was com-pared with the frequency of CD20 or FMC7 expres-sing cells in paired samples of normal (cadaveric)spleen. Thus, CD20 was found on 49% (P¼ 0.01),while FMC7 was present on 38% (Po0.001) of thelymphocytes in normal spleen. In reactive spleen,the difference between the frequencies of cellsexpressing CD19 and CD20 did not reach statisticalsignificance, yet the difference between CD19 andFMC7 expressing cells was significant (Po0.001).
The percentage of the lymphocytes expressingKappa and Lambda Ig light chains was 49% innormal spleen, being significantly lower than thepercentage of CD19 positive cells (Po0.01) andmatching the frequency of CD20-positive cells(P40.05). In reactive spleen, the frequency of thelymphocytes expressing Ig light chains was alsolower than that of the cells expressing the CD19marker, although the difference was not statisticallysignificant. Notably, the frequency of lymphocytesdisplaying both surface and cytoplasmic expressionof Kappa and Lambda chains matched closely thepercentage of CD19-positive cells in normal (53%)and reactive (45%) spleen, respectively (P40.05).
To further define the phenotypic profile of splenicB cells, four-color flow cytometric analysis wasperformed. As shown in Figure 3, nearly allCD19þCD20þ cells were positive for either surface
Table 2 Expression of surface and intracellular markers byhuman spleen lymphocytes
Cell marker Normal(cadaveric)
spleen
Reactive(non-malignant)
spleen
P-value
N Mean7s.d.(%)
N Mean7s.d.(%)
CD2 14 38710 12 50714 0.015CD3 3179 43714 0.009CD4 1778 2377 NSCD5 3278 42713 0.028CD7 37711 44712 NSCD8 1475 1977 0.028CD4/CD8 ratio 1.273 1.270.2 NSCD10 171 171 NSCD11c 28710 25710 NSCD13 171 171 NSCD16/56+CD3� 1577 1275 NSCD16/56+CD3+ 572 574 NSCD19 55711 45714 0.04CD20 4979 42712 NSCD20+CD5+ 876 1177 NSCD23 34713 35712 NSCD30 171 171 NSCD34 272 271 NSCD38 79713 83712 NSCD103 271 271 NScy CD79a 52712 44710 NSHLA-DR 71711 71712 NSIgM 42714 40717 NSIgG 575 372 NSIgA 977 672 NSIgD 36712 35712 NSFMC7 38713 30710 NSKappa 2875 2578 NSLambda 2175 1776 NSKappa/Lambda 1.370.2 1.470.2 NScy Kappa 3176 2978 NScy Lambda 2275 1676 NScy TdT o1 o1 NSTCR alpha/beta 2979 37712 NSTCR gamma/delta 272 571 NS
aNS, not significant (P40.05).
Flow cytometric analysis of human spleenAI Colovai et al
921
Modern Pathology (2004) 17, 918–927

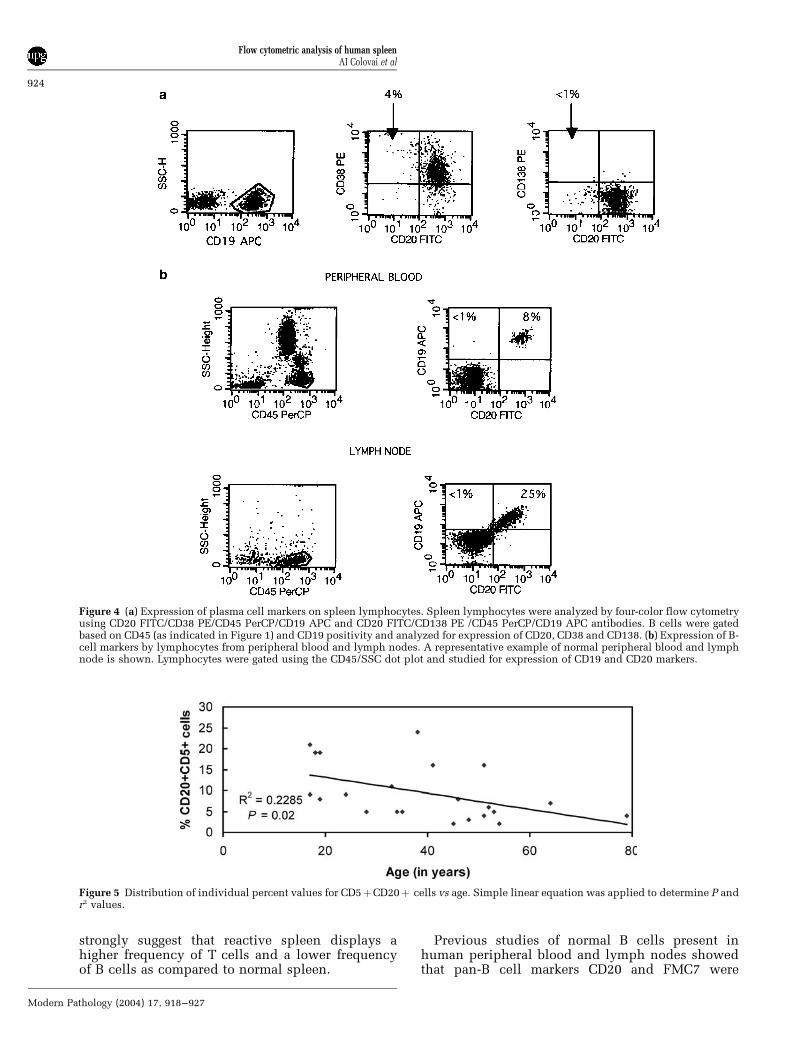
Kappa or Lambda light chain. However, a distinctpopulation carrying the CD19þCD20� phenotypeand accounting for 6 and 3% of all CD19-positivecells in normal and reactive spleen, respectively,showed very dim or no expression of Kappa andLambda Ig light chains. To determine whether theseB cells represent plasma cells, expression of CD38and CD138 was analyzed by four-color flow cyto-metry. As illustrated in Figure 4a, CD19þCD20� Bcells showed expression of high levels of CD38 yetwere negative for CD138. These results are consis-tent with the phenotype of early plasma cells.19–21
To compare the frequency of CD19þCD20� Bcells from human spleen and that from normalperipheral blood or lymph nodes, 11 samples ofblood and 8 lymph nodes were analyzed by three-color flow cytometry for expression of CD45, CD20,and CD19. The frequency of CD19þCD20� B cellswas lower than 1% in peripheral blood and reacheda mean of 1% in lymph nodes (Figure 4b). Thus,CD19þCD20� B cells appear to be more abundantin spleen as compared to peripheral blood or lymphnodes.
A significant subset of splenic B cells, represent-ing 8 and 11% of the lymphocytes (16 and 26% ofCD20-positive cells) in normal and reactive spleen,respectively, was found to coexpress the CD20 andCD5 markers (Figure 2, Table 2). As illustrated inFigure 2, the level of CD5 expression on B cells wastypically one log less compared to the level seen onT cells (CD5þCD20�) in any of the spleen samples.CD5þ B cells have been previously identified as theB-1a subset and shown to represent a major subsetduring fetal life and childhood.22 To determinewhether age-related changes in the frequency ofCD5þCD20þ cells occur in the spleen, the dis-tribution of cell frequency values vs donor’s age wasstudied using simple linear equation. As shown inFigure 5, there was a statistically significantdecrease in the percent of CD5þCD20þ B cellswith age (Po0.02). The relationship between thefrequency of other lymphocyte subsets, as definedby the expression of CD3, CD19, CD20, CD16/56, orCD23 marker, and donor’s age was also studied. Nosignificant correlation was found for any of thesecell subsets (data not shown).
Figure 2 Immunophenotypic profile of splenic B cells. Human spleen lymphocytes were gated as indicated in Figure 1 and studied forexpression of pan-B-cell markers by three-color flow cytometry. The oval highlights the population of CD20-positive B cells coexpressingthe CD5 marker.
Flow cytometric analysis of human spleenAI Colovai et al
922
Modern Pathology (2004) 17, 918–927

CD10 (CALLA), a characteristic marker of germ-inal center B cells and a hallmark of follicularlymphoma,5,23 was expressed on a small number ofcells from normal (mean 1%) and reactive (mean2%) spleens. CD103, a useful marker for thediagnosis of hairy cell leukemia,7 was expressed atsimilarly low frequency. Markers that are frequentlyexpressed by immature cells, such as CD34 or TdT,were found on 2% or less of the spleen lymphocytes(Table 2).
T and NK Cell Profile
A typical T-cell profile of spleen lymphocytes isdepicted in Figure 6. Pan-T cell markers CD2 andCD3 were expressed on 38 and 31%, respectively, ofnormal spleen lymphocytes, and on 47 and 40%,respectively, of reactive spleen cells. Staining withantibodies specific for TCR a/b and g/d chainsindicated that the a/b heterodimer was expressedon 29% of lymphocytes from normal spleen and34% of lymphocytes isolated from reactive spleen,while the g/d chains were present on only 2% oflymphocytes from normal spleen and on 4% oflymphocytes from reactive spleen. The NK-specific
markers CD16/CD56 were expressed in the absenceof CD3 on 15 and 12% of the lymphocytes fromnormal and reactive spleen, respectively, and co-expressed with CD3 on 5% of lymphocytes inboth groups (Figure 6, Table 2). CD30, a usefulmarker for the diagnosis of anaplastic large celllymphoma,24 was virtually absent on normal spleniclymphocytes.
Discussion
The spleen is the largest lymphoid tissue of thehuman body, accounting for approximately 25% ofthe total number of lymphocytes. To establish theimmunophenotypic profile of lymphocyte subsetsfound in human spleen, we performed three- andfour-color flow cytometric analysis of the cellsisolated from fresh spleen tissue obtained fromcadaveric donors and patients with nonmalignantconditions. The extensive antibody panel used inthis study allowed a detailed characterization of thelymphocyte subsets found in normal and reactivespleen. The two groups of specimens showedsignificantly different frequencies of CD2, CD3,CD5, CD8, and CD19 expressing cells. These results
Figure 3 Expression of Kappa and Lambda Ig light chains by splenic B-cell subsets. Spleen lymphocytes were gated as indicated inFigure 1 and analyzed by four-color flow cytometry using CD20/Kappa/CD45/CD19 and CD20/Lambda/CD45/CD19 antibody cocktails.CD19þCD20þ (gate R2) and CD19þCD20� (gate R3) B-cell subsets were studied for expression of Kappa and Lambda Ig light chains, asillustrated by the histograms. Dotted lines indicate staining with isotype matched antibody used as negative control.
Flow cytometric analysis of human spleenAI Colovai et al
923
Modern Pathology (2004) 17, 918–927
strongly suggest that reactive spleen displays ahigher frequency of T cells and a lower frequencyof B cells as compared to normal spleen.
Previous studies of normal B cells present inhuman peripheral blood and lymph nodes showedthat pan-B cell markers CD20 and FMC7 were
Figure 4 (a) Expression of plasma cell markers on spleen lymphocytes. Spleen lymphocytes were analyzed by four-color flow cytometryusing CD20 FITC/CD38 PE/CD45 PerCP/CD19 APC and CD20 FITC/CD138 PE /CD45 PerCP/CD19 APC antibodies. B cells were gatedbased on CD45 (as indicated in Figure 1) and CD19 positivity and analyzed for expression of CD20, CD38 and CD138. (b) Expression of B-cell markers by lymphocytes from peripheral blood and lymph nodes. A representative example of normal peripheral blood and lymphnode is shown. Lymphocytes were gated using the CD45/SSC dot plot and studied for expression of CD19 and CD20 markers.
Figure 5 Distribution of individual percent values for CD5þCD20þ cells vs age. Simple linear equation was applied to determine P andr2 values.
Flow cytometric analysis of human spleenAI Colovai et al
924
Modern Pathology (2004) 17, 918–927

coexpressed by nearly all CD19-positive B cells.11,15
In contrast, we found that the expression of CD20and FMC7 did not parallel that of CD19 and CD79aon splenic B cells. To exclude the possibility that thedifferences between the results of our study andthose of previous reports are due to the use ofdifferent flow cytometry protocols, lymphocytesfrom normal peripheral blood and lymph nodeswere analyzed using the same method and reagentsas used for spleen cells. Our data indicate that thefrequency of CD19þCD20- B cells is, indeed, higherin spleen as compared to peripheral blood or lymphnodes.
The study of Ig light chain expression on splenicB lymphocytes showed that surface Kappa andLambda chains were expressed by CD19þCD20þB cells yet were absent or expressed at very lowlevels by CD19þCD20� B cells. However, cytoplas-mic expression of Kappa and Lambda was found onvirtually all CD19-positive cells. Furthermore,CD19þCD20� cells expressed high levels of CD38,and were negative for CD138. These results areconsistent with the presence in the spleen of asizable population of early plasma cells,19–21 carry-ing the CD45þCD19þCD38 bright, Kappa dim/negative, Lambda dim/negative, CD20-CD138- pheno-type, and accounting for about 6 and 3% of B cells innormal and reactive spleen, respectively.
FMC7 antibody has been shown to recognize aCD20-related epitope, presumably derived from amultimeric CD20 complex.25,26 However, in someneoplastic lymphoproliferative disorders, the levelsof FMC7 and CD20 expression show no correlationand, in fact, the pattern of FMC7 and CD23coexpression has been found to be valuable for the
accurate and reproducible classification of B-celllymphomas.27 The results reported here regardingthe expression of FMC7 on normal splenocytesprovide a useful reference for the interpretation ofan abnormal B-cell immunophenotype. The fre-quency of splenic FMC7-positive lymphocytes wasfound to be significantly lower than the frequency ofCD19þ cells, and also lower than that of CD20-positive cells. Therefore, the absence of FMC7 onsubpopulations of splenic B cells should not beinterpreted as an aberrant phenotype in the absenceof other abnormal phenotypic features.
A significant population of CD20-positive B cellsfrom the spleen was found to express CD5, namely 8and 11% of the lymphocytes in normal and reactivespleen, respectively. Previous studies have identi-fied the B-cell population coexpressing CD5 andCD20 antigens as the B-1a subset, and found that 2–3% of the lymphocytes from normal adult tonsilsand lymph nodes display this phenotype.28 Duringfetal life and childhood, however, CD5þ B cellswere shown to represent a major B-cell subset,accounting for 40–60% of fetal splenic B cells.29,30
Although the ontogeny and function of these cellsare not well understood, it is assumed that theyprovide an innate immune defense early in life byproducing antibodies against ubiquitous bacteria.31
Our present study indicates that the frequency ofsplenic CD20þCD5þ cells decreases with age. Thisfinding is in accordance with previous data showingthe same type of correlation between the frequencyof CD5þ B cells from peripheral blood and age.32
The level of expression of the CD5 markerobserved on normal splenic B cells is lower thanthat seen on T cells. Thus, in most cases flow
Figure 6 Immunophenotypic profile of splenic T and NK cells. Spleen lymphocytes were gated as indicated in Figure 1 and analyzed forexpression of pan-T and NK markers by three-color flow cytometry. The oval highlights the NK/T cell subset (CD3þCD16/56þ ).
Flow cytometric analysis of human spleenAI Colovai et al
925
Modern Pathology (2004) 17, 918–927

cytometry permits the distinction between normal Bcells, which show dim expression of CD5, andleukemic B cells (eg chronic lymphocytic leukemia(CLL) and mantle cell lymphoma),4,15 which typi-cally appear as a well-defined cluster of CD20/CD5double-positive cells, expressing CD5 at levels closeto those found on T cells.
Similar to the CD5 marker, CD23 is a criticalmarker for the diagnosis of B-cell disorders, allow-ing the distinction between CLL and mantle celllymphoma.4 In contrast to CD5 pattern of expres-sion, CD23 shows increased expression with age,from 35% in cord blood to over 60% of B cells inadult blood.15 We found that a relatively large cellpopulation expressed CD23, representing 34 and43% of the lymphocytes from normal and reactivespleen, respectively. However, no significant corre-lation between expression of the CD23 marker andage could be established for spleen lymphocytes.
The study of T-cell populations present in thehuman spleen revealed that the CD4/CD8 ratio is onthe average 1.2:1, similar to the ratio found in lymphnodes and bone marrow yet lower than in peripheralblood, where it usually exceeds 2:1.11 The frequencyof g/d TCR-positive cells was 6% and 11% of all CD3positive T cells in normal and reactive spleen,respectively. These values may appear much lowerthan those previously reported by studies whichshowed that g/d TCR-positive cells represent about17% of all CD3 positive cells in the red pulp of thespleen.33–35 However, the same studies reported that,in periarteriolar sheaths, g/d TCR expressing cellswere rare. Thus, the apparent discrepancy betweenour results and previously reported data is causedby the different approaches used to analyze andreport the frequency of g/d TCR-positive cells. Whileprevious studies used immunohistochemistry andreported a relatively high frequency of g/d TCR-positive cells within the red pulp area of the spleen,our study used flow cytometry and reported thefrequency of this subset within whole spleen.
A sizable proportion of splenic T cells exhibitdual expression of T and NK cell markers, aphenotypic signature of NK/T cells.36 This T-cellsubset has been intensively studied as a possiblebridge between innate and adaptive immunity. Theproposed role of NK/T cells in immune responsesranges from suppression of autoimmunity to tumorrejection.36,37 While in peripheral blood NK/T cellsaccount for less than 6% of CD3-positive lympho-cytes, our study shows that about 16% of the CD3-positive cells present in the spleen express CD16/56antigen(s). A relatively high frequency of these cellshas been also reported in the liver, where up to 55%(mean 27%) of CD3-positive lymphocytes expressNK markers.37 These findings support the conceptthat spleen and liver lymphocytes have importantimmunoregulatory function.
Using a clear description of biological andtechnical aspects of sample analysis by flow cyto-metry, our study provides a frame of reference for B,
T, and NK subsets present in normal and reactivespleen. These results will be useful for flowcytometry assessment of spleen specimens obtainedfollowing fine-needle aspiration or splenectomy,facilitating an accurate diagnosis of lymphoidmalignancies of the spleen.
Acknowledgement
This work was supported by NIH grant RO1-AI25210-16.
References
1 Borowitz MJ, Bray R, Gascoyne R, et al. US–Canadianconsensus recommendations on the immunopheno-typic analysis of hematologic neoplasia by flow cyto-metry: data analysis and interpretation. Cytometry1997;30:236–244.
2 Dunphy CH. Contribution of flow cytometry immuno-phenotyping to the evaluation of tissues with sus-pected lymphoma. Cytometry 2000;42:296–306.
3 D’Arena G, Musto P, Cascavilla N, et al. Quantitativeflow cytometry for the differential diagnosis of leuke-mic B cell chronic lymphoproliferative disorders. Am JHematol 2000;64:275–281.
4 DiGiuseppe JA, Borowitz MJ. Clinical utility of flowcytometry in the chronic lymphoid leukemias. SeminOncol 1998;25:6–10.
5 Imashuku S, Obayashi M, Hosoi G, et al. Splenectomyin haemophagocytic lymphohistiocytosis: report ofhistopathological changes with CD19+ B-cell depletionand therapeutic results. Br J Haematol 2000;108:505–510.
6 Lucio P, Parreira A, van den Beemd MW, et al. Flowcytometric analysis of normal B cell differentiation: aframe of reference for the detection of minimal residualdisease in precursor B-ALL. Leukemia 1999;13:419–427.
7 Cornfield DB, Mitchell Nelson DM, Rimsza LM, et al.The diagnosis of hairy cell leukemia can be establishedby flow cytometric analysis of peripheral blood, evenin patients with low levels of circulating malignantcells. Am J Hematol 2001;67:223–226.
8 Herzenberg LA, Parks D, Sahaf B, et al. The history andfuture of the fluorescence activated cell sorter and flowcytometry: a view from Stanford. Clin Chem 2002;48:1819–1827.
9 Schnizlein-Bick CT, Mandy FF, O’Gorman RG, et al.Use of CD45 gating in three and four-color flowcytometric immunophenotyping. Cytometry 2002;50:46–52.
10 Bergeron M, Nicholson JK, Phaneuf S, et al. Selectionof lymphocyte gating protocol has an impact on thelevel of reliability of T-cell subsets in aging specimens.Cytometry 2002;50:53–61.
11 McCoy Jr JP, Overton WR. Quality control in flowcytometry for diagnostic pathology: II. A conspectus ofreference ranges for lymphocyte immunophenotyping.Cytometry 1994;18:129–139.
12 Kotylo P, Fineberg NS, Freeman KS, et al. Referenceranges for lymphocyte subsets in pediatric patients.Am J Clin Pathol 1993;100:111–115.
Flow cytometric analysis of human spleenAI Colovai et al
926
Modern Pathology (2004) 17, 918–927
13 Bryan CF, Eastman PJ, Conner JB, et al. Clinical utilityof a lymph node normal range obtained by flowcytometry. Ann NY Acad Sci 1993;677:404–406.
14 Ginaldi L, DeMartinis M, D’Ostilio A, et al. Changesin the expression of surface receptors on lymphocytesubsets in the elderly: quantitative flow cytometricanalysis. Am J Hematol 2001;67:63–72.
15 Deneys V, Mazzon AM, Marques JL, et al. Referencevalues for peripheral blood B lymphocyte subpopula-tions: a basis for multiparametric immunophenotypingof abnormal lymphocytes. J Immunol Meth 2001;253:23–36.
16 Fukushima PI, Nguyen PK, O’Grady P, et al. Flowcytometric analysis of kappa and lambda light chainexpression in evaluation of specimens for B-cellneoplasia. Cytometry 1996;26:243–252.
17 Dixon WJ. BMDP Statistical Software New System 2.0Professional. University of California Press: Berkeley,1992.
18 Braylan RC, Orfao A, Borowitz MJ, et al. Optimalnumber of reagents required to evaluate hematolym-phoid neoplasias: results of an international consensusmeeting. Cytometry 2001;15:23–27.
19 Harada Y, Kawano MM, Huang N, et al. Identificationof early plasma cells in peripheral blood and theirclinical significance. Br J Haematol 1996;92:184–191.
20 Tarte K, Zhan F, De Vos J, et al. Gene expressionprofiling of plasma cells and plasmablasts: towards abetter understanding of the late stages of B-celldifferentiation. Blood 2003;102:592–600.
21 Medina F, Segundo C, Campos-Caro A, et al. Theheterogeneity shown by human plasma cells fromtonsil, blood, and bone marrow reveals graded stagesof increasing maturity, but local profiles of adhesionmolecule expression. Blood 2002;99:2154–2161.
22 Hayakawa K, Hardy RR. Development and function ofB-1 cells. Curr Opin Immunol 2000;12:346–353.
23 deLeon ED, Alkan S, Huang JC, et al. Usefulness of animmunohistochemical panel in paraffin-embeddedtissues for the differentiation of B-cell non-Hodgkin’slymphomas of small lymphocytes. Mod Pathol1998;11:1046–1051.
24 Stein H, Foss HD, Durkop H, et al. CD30(+) anaplasticlarge cell lymphoma: a review of its histopatho-logic, genetic and clinical features. Blood 2000;96:3681–3695.
25 Serke S, Schwaner I, Yordanova M, Szczepek A, HuhnD. Monoclonal FMC7 detects a conformational epitopeon the CD20 molecule: evidence from phenotyping
after rituxan therapy and transfectant cell analyses.Cytometry 2001;46:98–104.
26 Hubl W, Iturraspe J, Braylan RC. FMC7 antigen expres-sion on normal and malignant B-cells can be predictedby expression of CD20. Cytometry 1998;15:71–74.
27 Ahmad E, Garcia D, Davis BH. Clinical utility ofCD23 and FMC7 antigen coexistent expression inB-cell lymphoproliferative disorder subclassification.Cytometry 2002;50:1–7.
28 Caligaris-Cappio F, Gobbi M, Bofill M, et al. Infre-quent normal B lymphocytes express features ofB-chronic lymphocytic leukemia. J Exp Med 1982;155:623–628.
29 Matsumura T, Kametani Y, Ando K, et al. FunctionalCD5+ B cells develop predominantly in the spleen ofNOD/SCID/gcnull (NOG) mice transplanted either withhuman umbilical cord blood, bone marrow or mobi-lized peripheral blood CD34+ cells. Exp Hematol2003;31:789–797.
30 Antin JH, Emerson SG, Martin P, et al. Leu-1+ (CD5+) Bcells. A major lymphoid subpopulation in human fetalspleen: phenotypic and functional studies. J Immunol1986;136:505–510.
31 Stall AM, Wells SM, Lam K-P. B-1 cells: unique originsand functions. Semin Immunol 1996;8:45–59.
32 Hoffkes HG, Schmidtke G, Uppenkamp M, et al.Multiparametric immunophenotyping of B cells inperipheral blood of healthy adults by flow cytometry.Clin Diagn Lab Immunol 1996;3:30–36.
33 Bordessoule D, Gaulard P, Mason DY. Preferentiallocalization of human lymphocytes bearing gammadelta T cell receptors to the red pulp of the spleen.J Clin Pathol 1990;43:461–464.
34 Falini B, Flenghi L, Pileri S, et al. Distribution of Tcells bearing different forms of the T cell receptor g/d innormal and pathological human tissues. J Immunol1989;143:2480–2488.
35 Kabelitz D, Wesch D, Hinz T. Gamma delta T cells,their T cell receptor usage and role in human diseases.Springer Semin Immunopathol 1999;21:55–75.
36 Godfrey DI, Hammond KJ, Poulton LD, et al. NKT cells:facts, functions and fallacies. Immunol Today 2000;21:573–583.
37 Norris S, Doherty DG, Collins C, et al. Natural T cells inthe human liver: cytotoxic lymphocytes with dual Tcell and natural killer cell phenotype and function arephenotypically heterogeneous and include Valpha24-JalphaQ and gamma delta T cell receptor bearing cells.Hum Immunol 1999;60:20–31.
Flow cytometric analysis of human spleenAI Colovai et al
927
Modern Pathology (2004) 17, 918–927