3d at the touch of a button - sciencesoft datasheet.pdf · enables 3d visualisation and analysis of...
TRANSCRIPT
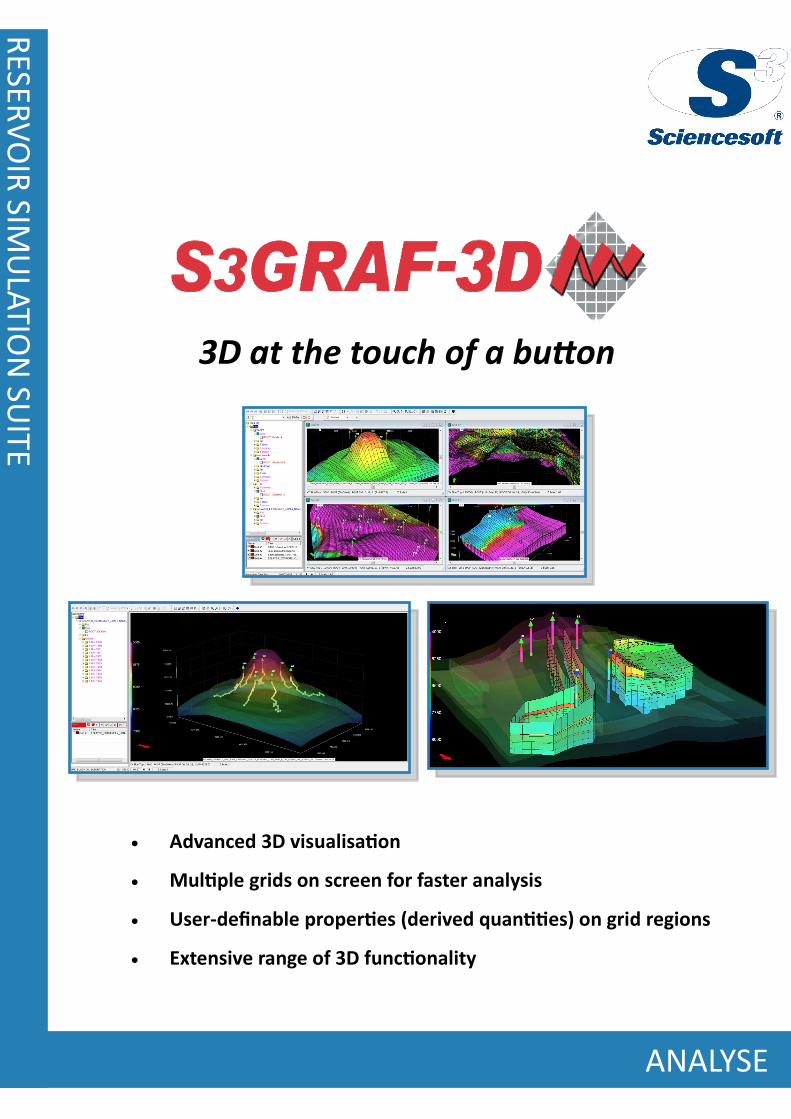
Advanced 3D visualisation
Multiple grids on screen for faster analysis
User-definable properties (derived quantities) on grid regions
Extensive range of 3D functionality
RESER
VO
IR SIM
ULA
TION
SUITE
ANALYSE
3D at the touch of a button

3D at the touch of a button
S3GRAF-3D is the powerful 3D component of S3GRAF which
enables 3D visualisation and analysis of reservoir simulation
models.
It is both easy-to-use and flexible in that it supports the
widest range of simulators in the market including Eclipse,
CMG, VIP, Nexus, Streamline (FrontSim and 3DSL) and
UTCHEM.
Within S3GRAF-3D there are many advanced features and
functions, enabling the reservoir engineer to quickly define
and focus on regions of interest. Multiple views can be
displayed on-screen simultaneously, from multiple
simulators, for rapid analysis and decision making.
Benefits Advanced 3D visualisation enables faster access to the
model
Multiple grids on-screen for faster analysis
Enhances productivity
Multiple simulator support, allowing standardisation
Fast data loading and plotting
Calculations capabilities on user-defined grid regions
Key Features
ANALYSE R
ESERV
OIR
SIMU
LATIO
N SU
ITE
Multiple simulator support
Multiple grids on-screen together
Batch processing via GRF scripts
Seamless integration with S3GRAF-HPG add-on module
User-definable regions:
Polylines
Polygons (Arbitrary, Rectangular, Radial)
Thresholds
Grid Clips (Fence Plots)
Volumetric calculations on field and regions
User-functions on regions including region combinations
Automatic reporting to MS Office applications
Wide array of 3D visualisation functionality:
Rotate, pan , zoom.
View grid properties through time
Grid linking with copy and paste options
Streamlines
Cut Plane
Well Tracks
Explode view
Isosurfaces
Simple movie recording
Integration with the workflow manager for 3D analysis in
workflows
Exporting of properties for reintroduction as include files
to the simulator model
Statistics of displayed grid cells
Multiple linked grids
Well tracks view
Polyline and Polygon
Sciencesoft Ltd tel. +44 (0)141 445 0330
Moorpark House fax. +44 (0)141 445 2041
11 Orton Place e-mail. [email protected]
Glasgow website. www.sciencesoft.com
G51 2HF © 2016 Sciencesoft Ltd. All rights reserved. All trademarks are recognised.