3d eddy current testing – a method for fiber angle ... · 3d eddy current testing – a method...
TRANSCRIPT
3D EDDY CURRENT TESTING – A method for fiber
angle analysis of carbon fiber preforms
Dipl.-Ing. Christian Bülow
German Aerospace Center (DLR)

Overview of the DLR DLR – German Aerospace Center
• 8000 employees
• 32 institutes or facilities
• 16 sites
> ACM 2017 > Christian Buelow • 20-04-2017 DLR.de • Chart 2
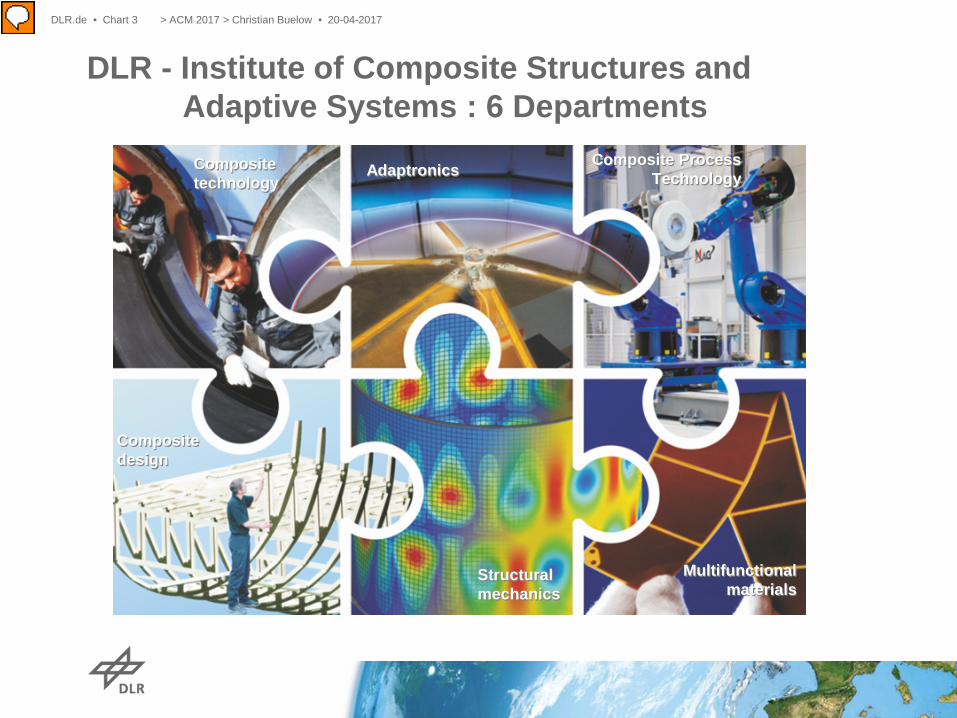
DLR - Institute of Composite Structures and Adaptive Systems : 6 Departments
Composite technology
Adaptronics Composite Process Technology
Composite design
Structural mechanics
Multifunctional materials
> ACM 2017 > Christian Buelow • 20-04-2017 DLR.de • Chart 3
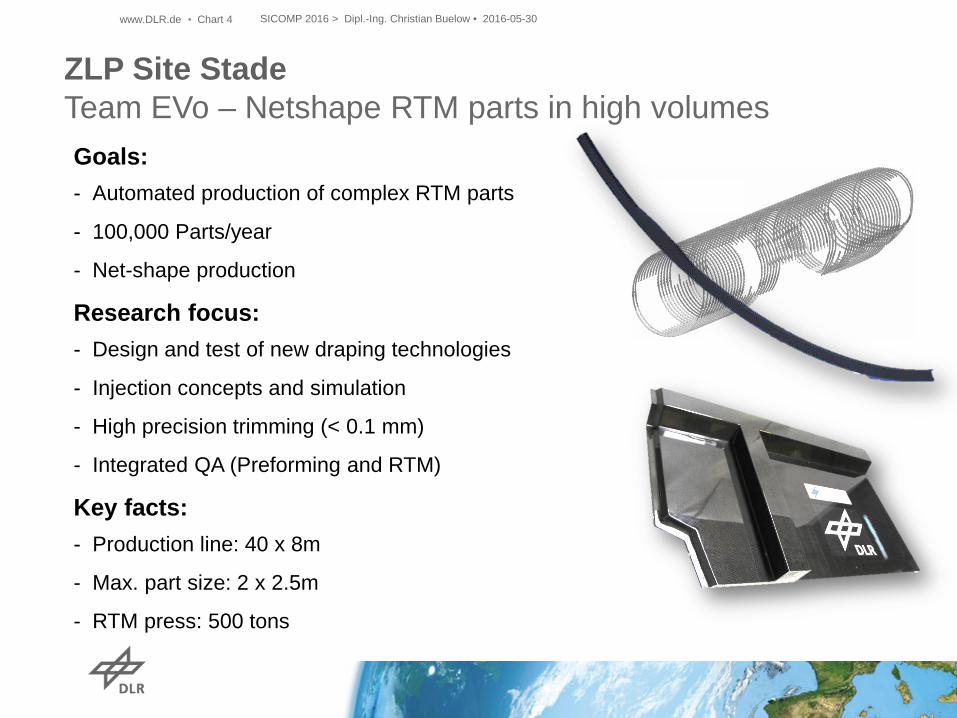
Goals: - Automated production of complex RTM parts
- 100,000 Parts/year
- Net-shape production
Research focus: - Design and test of new draping technologies
- Injection concepts and simulation
- High precision trimming (< 0.1 mm)
- Integrated QA (Preforming and RTM)
Key facts: - Production line: 40 x 8m
- Max. part size: 2 x 2.5m
- RTM press: 500 tons
ZLP Site Stade Team EVo – Netshape RTM parts in high volumes
www.DLR.de • Chart 4 SICOMP 2016 > Dipl.-Ing. Christian Buelow • 2016-05-30

EVo - Research Production Line
Netshape-Preforming - Draping-Robot - Consolidation-Press - Handling-Robot - Finetrimming-Robot
Ply-Preparation - Textile-Storage - Cutter - Ply-Storage - Portal-Vacuum-Gripper
RTM-Line - Movable Core-Mold - 500t-Press - 2 Component-Injection-Unit - Curing-Oven
> ACM 2017 > Christian Buelow • 20-04-2017 DLR.de • Chart 5
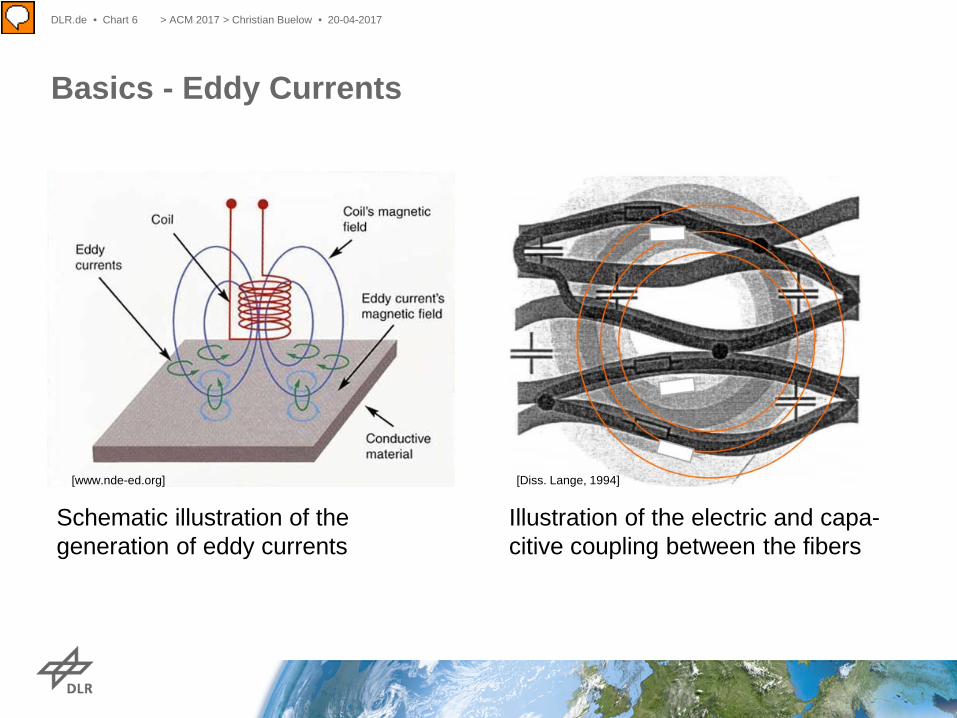
Basics - Eddy Currents
[www.nde-ed.org] [Diss. Lange, 1994]
Schematic illustration of the generation of eddy currents
Illustration of the electric and capa-citive coupling between the fibers
> ACM 2017 > Christian Buelow • 20-04-2017 DLR.de • Chart 6

Basics – Eddy current pictures
• Illustration of the conductivity of the material • Up to 8 layers in depth demonstrated • Detection of defects, like missing rovings, gaps, fuzz balls, insertions,
undulations and the fiber angle
Toho Tenax UD: (0/45/90/-45)s Hexcel G1157 UD: (45/-45/0/90)
> ACM 2017 > Christian Buelow • 20-04-2017 DLR.de • Chart 7
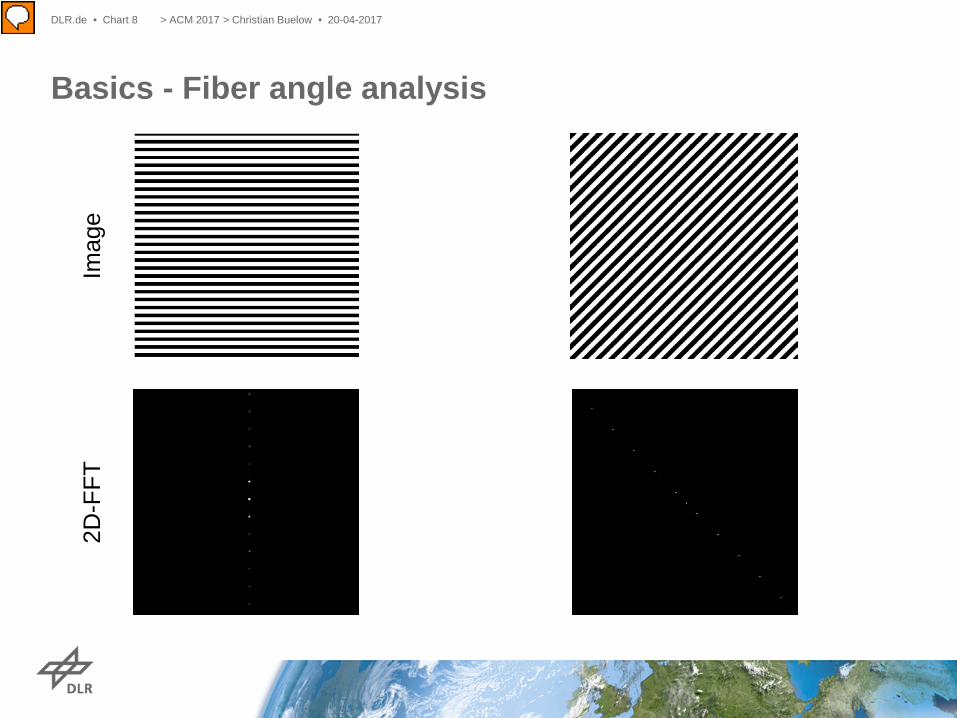
Basics - Fiber angle analysis Im
age
2D-F
FT
> ACM 2017 > Christian Buelow • 20-04-2017 DLR.de • Chart 8
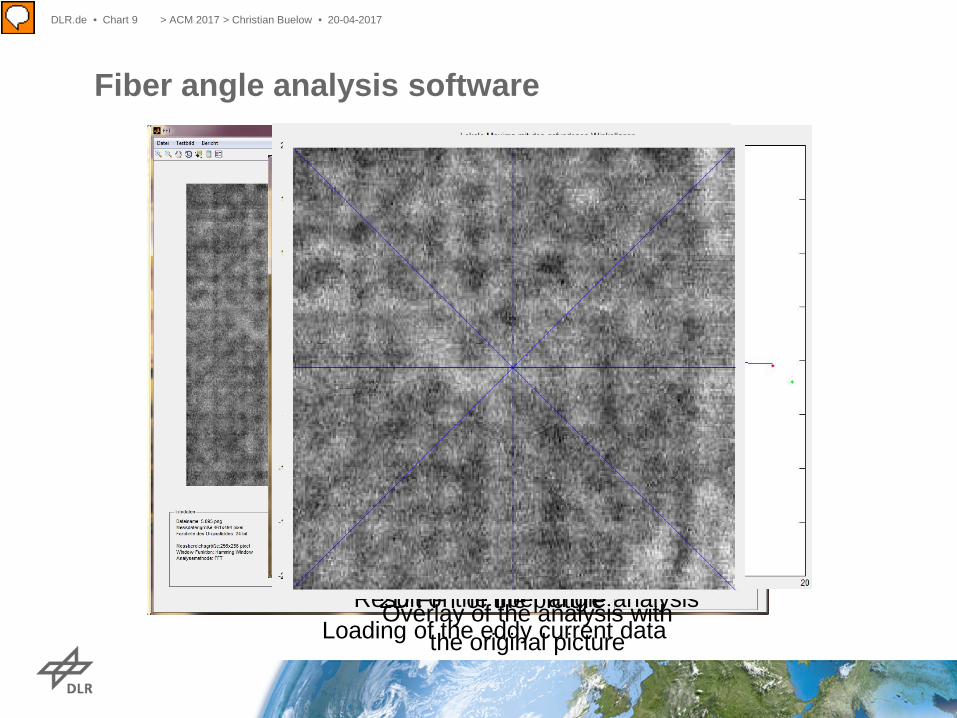
Fiber angle analysis software
Loading of the eddy current data
Selection of the measurement area
2D FFT of the picture Result of the fiber angle analysis Overlay of the analysis with the original picture
> ACM 2017 > Christian Buelow • 20-04-2017 DLR.de • Chart 9

Mounting at the Robot
[Reis Robotics]
Drawing of the linear robot Robot on the way to a measurement
> ACM 2017 > Christian Buelow • 20-04-2017 DLR.de • Chart 10
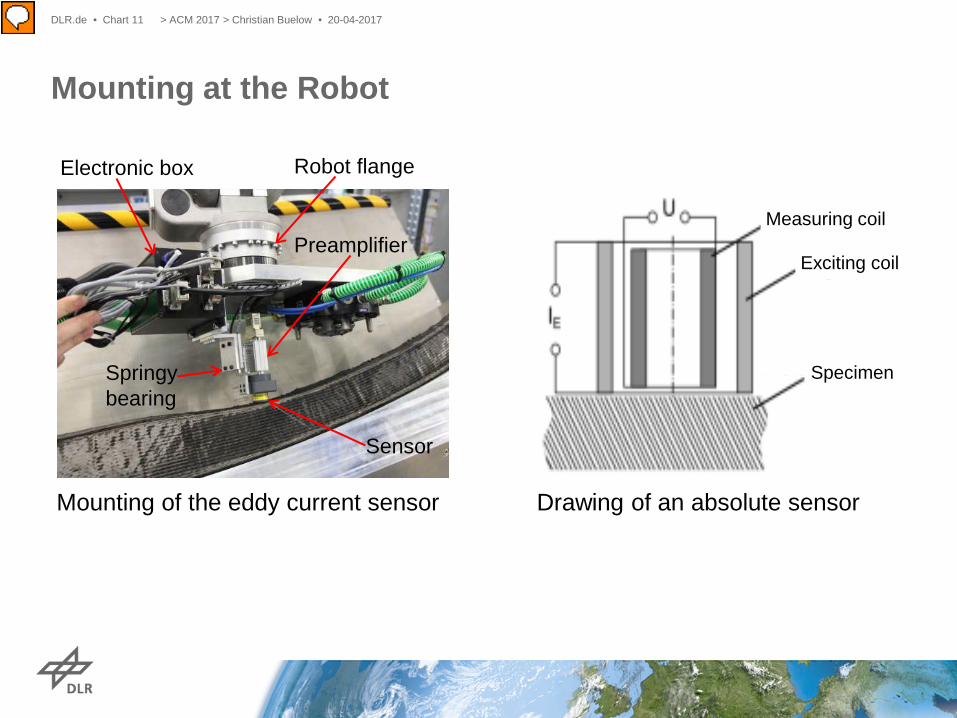
Mounting at the Robot
Measuring coil
Exciting coil
Specimen
Sensor
Springy bearing
Preamplifier
Robot flange Electronic box
Mounting of the eddy current sensor Drawing of an absolute sensor
> ACM 2017 > Christian Buelow • 20-04-2017 DLR.de • Chart 11

3D-Measurement
Offline programming of the robot path 3D Eddy current data
> ACM 2017 > Christian Buelow • 20-04-2017 DLR.de • Chart 12
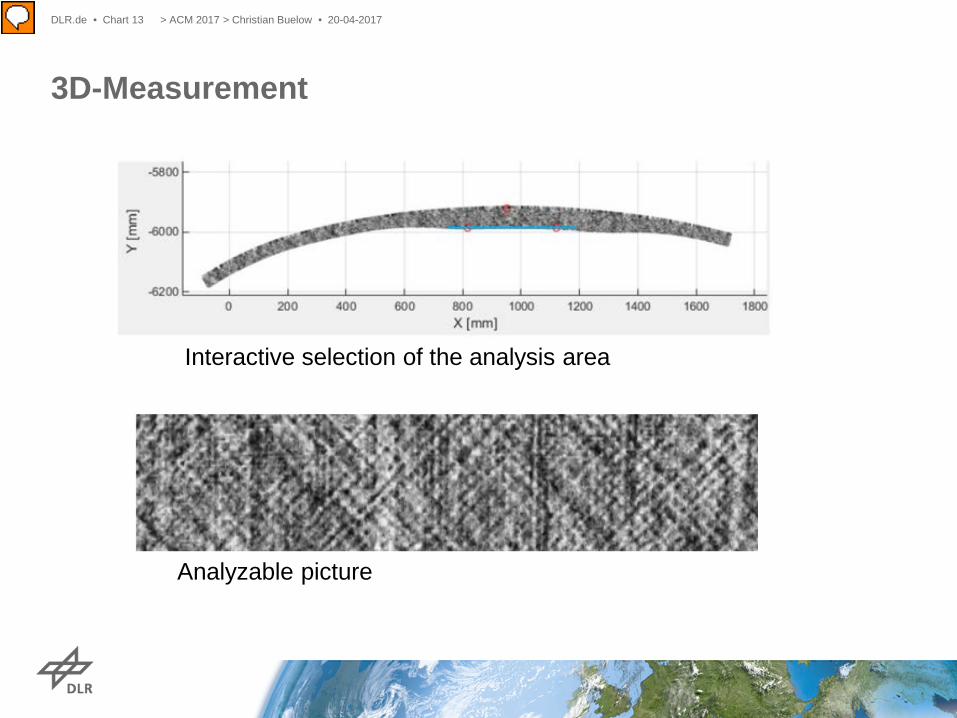
3D-Measurement
Interactive selection of the analysis area
Analyzable picture
> ACM 2017 > Christian Buelow • 20-04-2017 DLR.de • Chart 13

• Detection of different kind of defects up to 8 layers in depth
• Fiber angle analysis based on FFT
• Measurement of 3D objects guided by a robot
Conclusion
> ACM 2017 > Christian Buelow • 20-04-2017 DLR.de • Chart 14
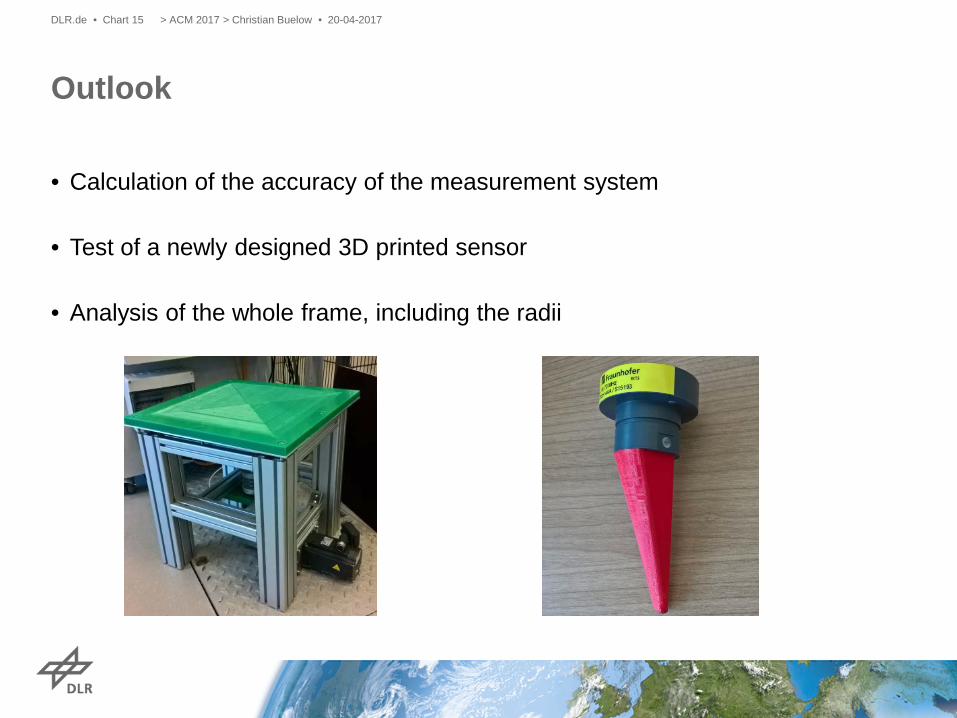
• Calculation of the accuracy of the measurement system
• Test of a newly designed 3D printed sensor
• Analysis of the whole frame, including the radii
Outlook
> ACM 2017 > Christian Buelow • 20-04-2017 DLR.de • Chart 15