3d mapping system scoping study - hul ballarat of ballarat 3d scoping study... · 3d mapping system...
TRANSCRIPT
3D Mapping System – Scoping Study
Date: 15 August 2014
Report prepared by:
For:
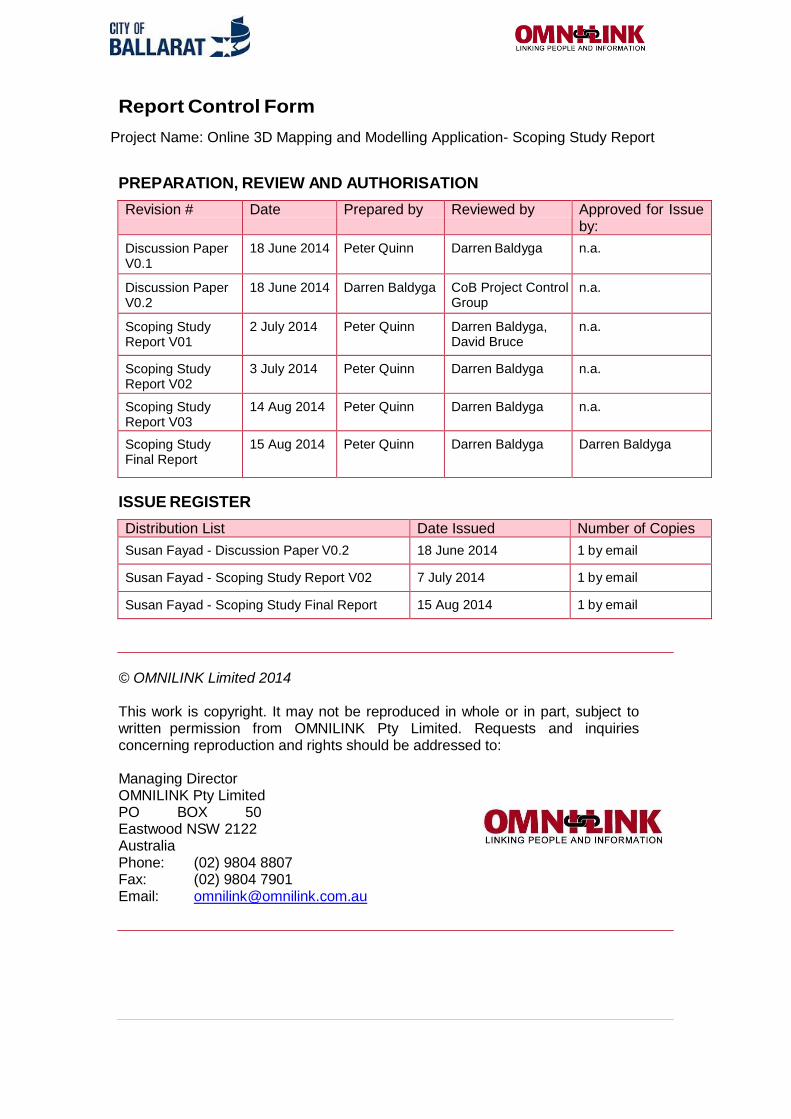
Report Control Form
Project Name: Online 3D Mapping and Modelling Application- Scoping Study Report
PREPARATION, REVIEW AND AUTHORISATION
Revision # Date Prepared by Reviewed by Approved for Issue by:
Discussion Paper V0.1
18 June 2014 Peter Quinn Darren Baldyga n.a.
Discussion Paper V0.2
18 June 2014 Darren Baldyga CoB Project Control Group
n.a.
Scoping Study Report V01
2 July 2014 Peter Quinn Darren Baldyga, David Bruce
n.a.
Scoping Study Report V02
3 July 2014 Peter Quinn Darren Baldyga n.a.
Scoping Study Report V03
14 Aug 2014
Peter Quinn
Darren Baldyga n.a.
Scoping Study Final Report
15 Aug 2014
Peter Quinn
Darren Baldyga Darren Baldyga
ISSUE REGISTER
Distribution List Date Issued Number of Copies
Susan Fayad - Discussion Paper V0.2 18 June 2014 1 by email
Susan Fayad - Scoping Study Report V02
7 July 2014 1 by email
Susan Fayad - Scoping Study Final Report
15 Aug 2014 1 by email
© OMNILINK Limited 2014 This work is copyright. It may not be reproduced in whole or in part, subject to written permission from OMNILINK Pty Limited. Requests and inquiries concerning reproduction and rights should be addressed to:
Managing Director OMNILINK Pty Limited PO BOX 50 Eastwood NSW 2122 Australia Phone: (02) 9804 8807 Fax: (02) 9804 7901 Email: [email protected]
Table of Contents 1 EXECUTIVE SUMMARY .................................................................................................... 7
2 INTRODUCTION .............................................................................................................. 8 2.1 BACKGROUND ....................................................................................................................... 8 2.2 EXISTING SYSTEMS ENVIRONMENT ............................................................................................ 9
3 SUMMARY OF BENEFITS AND REQUIREMENTS ............................................................... 10 3.1 PERCEIVED BENEFITS OF PROPOSED 3D MAPPING SYSTEM ............................................................ 10
3.1.1 Benefits for Managing Ballarat’s Historic Urban Landscape .................................. 10 3.1.2 Benefits for Managing Other Council Responsibilities ............................................ 11 3.1.3 Benefits to Council Citizens ..................................................................................... 13 3.1.4 Other Potential Benefits .......................................................................................... 13
3.2 REQUIRED FEATURES OF 3D MAPPING SYSTEM ........................................................................ 14
4 OVERVIEW OF 3D VISUALISATION TECHNOLOGIES ......................................................... 16 4.1 SPATIAL (MAPPING) SECTOR ................................................................................................. 16 4.2 CAD AND BUILDING INFORMATION MODELING (BIM) SECTOR ................................................... 16 4.3 GAMING BASED TECHNOLOGIES SECTOR ................................................................................. 17 4.4 OTHER 3D VISUALISATION TECHNOLOGIES .............................................................................. 18
4.4.1 Hub for Immersive Visualisation (HIVE) - Curtin University .................................... 18 4.4.2 The Cube – Queensland University of Technology .................................................. 18 4.4.3 Video Projection Mapping ....................................................................................... 19
4.5 DISCUSSION OUTCOMES ....................................................................................................... 19
5 DATA FORMATS, STANDARDS AND INTEROPERABILITY .................................................. 20 5.1.1 Standards and Interoperability ............................................................................... 20 5.1.2 CityGML and Levels of Detail................................................................................... 21 5.1.3 An Industry Survey - Commonly Used Standards .................................................... 22 5.1.4 File Format Conversion ............................................................................................ 23
5.2 DISCUSSION OUTCOMES ....................................................................................................... 24
6 3D MAPPING DATA COLLECTION TECHNOLOGIES ........................................................... 24 6.1 TECHNOLOGY OVERVIEW ...................................................................................................... 24
6.1.1 Pictometry ............................................................................................................... 24 6.1.2 Orthophotography .................................................................................................. 25 6.1.3 LiDAR ....................................................................................................................... 25
6.2 DATA COLLECTION COSTS...................................................................................................... 27 6.2.1 Introduction ............................................................................................................. 27 6.2.2 Cost Estimates ......................................................................................................... 27
7 3D MAPPING DELIVERY APPLICATIONS ........................................................................... 27 7.1 INTRODUCTION .................................................................................................................... 27 7.2 SKYLINEGLOBE ..................................................................................................................... 28 7.3 GOOGLE ............................................................................................................................. 28 7.4 CITYSERVER3D - GERMAN FRAUNHOFER INSTITUTE ................................................................... 29 7.5 AAM GROUP (AAM) ........................................................................................................... 31 7.6 AEROMETREX ..................................................................................................................... 32 7.7 OPEN SOURCE 3D APPLICATIONS ........................................................................................... 33 7.8 FEDERATION UNIVERSITY AUSTRALIA ...................................................................................... 33 7.9 OTHER VENDORS ................................................................................................................. 35 7.10 SUPPLEMENTARY TOOLS ....................................................................................................... 35
7.10.1 Feature Manipulation Engine.................................................................................. 35 7.10.2 Euclidean Ltd Geoverse Cloud Tools ........................................................................ 35 7.10.3 EarthMine................................................................................................................ 36 7.10.4 CSIRO Zebedee ........................................................................................................ 36 7.10.5 ESRI ArcGIS Online ................................................................................................... 37
7.11 DISCUSSION OUTCOMES ....................................................................................................... 38
8 APPLICATION ARCHITECTURE ........................................................................................ 39 8.1 INTRODUCTION .................................................................................................................... 39 8.2 CLASSIFICATION OF USERS ..................................................................................................... 39 8.3 GENERAL COMPONENTS AND STRUCTURE OF 3D MAPPING SYSTEM ................................................. 40 8.4 DISCUSSION OUTCOMES ....................................................................................................... 42
9 PROPOSED ROADMAP AND RECOMMENDATIONS ......................................................... 42 9.1 INTRODUCTION ................................................................................................................... 42 9.2 OPTION 1 - AAM ................................................................................................................ 43 9.3 OPTION 2 - AEROMETREX .................................................................................................... 43 9.4 OPTION 3 - CITYSERVER3D .................................................................................................... 44 9.5 COSTING SUMMARY ............................................................................................................. 44
9.5.1 Data Capture Extent ................................................................................................ 44 9.5.2 K2Vi Hosted Solution – AAM ................................................................................... 45 9.5.3 AEROmetrex ............................................................................................................ 45 9.5.4 Ongoing Support Resources .................................................................................... 45
9.6 PROJECT IMPLEMENTATION PLAN ........................................................................................... 46
10 APPENDIX 1 – FORMATS AND STANDARDS ................................................................ 47 10.1 3D STANDARDS ................................................................................................................... 47
10.1.1 CityGML ................................................................................................................... 47 10.1.2 IFC - Industry Foundation Classes ............................................................................ 47 10.1.3 COLLADA ................................................................................................................. 48 10.1.4 Related OGC Standards ........................................................................................... 48
10.2 COMMON 3D FORMAT DESCRIPTIONS .................................................................................... 49
11 APPENDIX 2 - ONLINE SURVEY RESULTS ..................................................................... 52 11.1 PARTICIPANTS ..................................................................................................................... 52 11.2 PERCEIVED BENEFITS OF 3D MAPPING SYSTEMS ....................................................................... 52 11.3 IDENTIFIED REQUIREMENT PRIORITIES ..................................................................................... 53 11.4 3D DATA COVERAGE PRIORITIES ............................................................................................ 54
12 APPENDIX 3 – POTENTIAL FUTURE ENHANCEMENT – AUGMENTED REALITY ............... 55
List of Figures
Figure 1 - LOD example levels ......................................................................................................... 22 Figure 2 - 3D Mapping System Components .................................................................................. 40 Figure 3 - K2Vi Solution - AAM Costs ................................................. Error! Bookmark not defined. Figure 4 - Data capture costs of AEROmetrex.................................... Error! Bookmark not defined. Figure 5 - Project Implementation Plan .......................................................................................... 46 Figure 6 - - Relationship between clients/servers and OGC protocols ........................................... 49 Figure 7 - Online survey rating of perceived benefits to participants work areas.......................... 52 Figure 8 - Online survey rating of requirements of a 3D system .................................................... 54 Figure 9 - Online Survey response to question: What 3D data is required over the City of Ballarat local government area to meet your work needs?......................................................................... 54 Figure 10- Examples of Augmented Reality Images ........................................................................ 56
No table of figures entr ies found .
Glossary 3D Having three dimensions, characterized by Cartesian (x,y,z) coordinates
Cadastre A public record, survey, or map of the value, extent, and ownership of land as a basis of taxation; also known as DCDB (digital cadastral database).
Corporate GIS An interface to the GIS and other corporate systems that displays information to all users via different levels of access or functionality depending on user privileges.
DTM Digital Terrain Model is a digital representation of ground surface topography or terrain.
GIS Geographic Information System. A computer system for capturing, storing, checking, integrating, manipulating, analysing and displaying data related to positions on any part of the Earth's surface. Typically used for handling digital layers which contain points, lines and polygons that are used to represent features on the Earth's surface.
HUL Historic Urban Landscape
LiDAR A remote sensing technology that measures distance by illuminating a target with a laser and analysing the reflected light. It can be used to generate detailed digital terrain maps of the land surface and its structures.
Metadata Information about data. Metadata describes how, when, why and who created a set of data and how the data was formatted.
Orthophoto A photographic map. Conventional aerial photography images cannot be used to accurately measure distances because the images do not account for the effect of the camera position and altitude, camera lens distortion, image scale variations and displacement caused by topography. An orthophoto is orthorectified to create a uniform scale so that it is possible to use it for accurate measurement and overlay GIS data to create a comprehensive image database.
Pictometry A patented aerial image capture process that produces imagery showing the fronts and sides of buildings and locations on the ground.
Photogrammetry The science of taking stereoscopic aerial images and using geometry, mathematics and physics, to enable accurate measurements of the earth's surface.
PCB The City of Ballarat’s Project Control Group for this project
UNESCO United Nations Educational, Scientific and Cultural Organisation
WHITRAP World Heritage Institute of Training and Research for the Asia and Pacific Region
XML
The Extensible Mark-up Language. A general purpose mark-up language.
15 August 2014 City of Ballarat 3D Mapping – Discussion Paper 7
1 Executive Summary
This discussion paper has been prepared to assist the City of Bal larat in its decision making process on identifying an appropriate path for acquiring 3D technology.
The City of Ballarat has a dual purpose for implementing a 3D capability. The first purpose - common to many other cities - is to support public interest in, and decision making about, the built and natural environment in the area administered by the Council. This interest extends to understanding the existing landscape and also the proposed developments and how they will impact the individual constituent. A 3D capability will provide an excellent and easily understood mechanism for achieving a greater public awareness of development activities and ensure greater engagement with this process. Secondly, there is a need for support of Council’s Historic Urban Landscape program, which is intended to help Ballarat grow without compromising its heritage. This requires the capture and analysis of community values.
As part of a scoping study conducted by OMNILINK input was sought from key stakeholders across Council business departments, as well as relevant external partners. A list of perceived benefits and the requirements of a 3D capability have been compiled from a workshop involving key stakeholders. Others provided input through personal interviews and an online survey. The scoping study includes an overview of 3D visualisation technologies and 3 different data collection technologies – Pictometry, Orthophotography and LiDAR. The complexities of Data Formats, Standards and Interoperability are also covered. Possible mapping delivery applications from various technology providers are considered. Three of these – AAM, AEROmetrex and CityServer3D - are recommended as options for further consideration by the project control group. These options are ranked in the most likely order of suitability based on OMNILINK’s initial scan of the current 3D market place. Costs for the implementation of these proprietary systems are of the order of (pricing removed) for the local government area coverage; over 80% of this is associated with the initial capture of 3D models. Selecting any of these options would require further examination to achieve the appropriate due diligence, for example using a request for tender process. An alternative approach to implementing proprietary solutions is to pursue the research and development opportunity offered by the Federation University Australia. This initially involves developing a portal for federating HUL information and databases; but could be subsequently directed to build a 3D Mapping capability built on open source software and the acquisition of fully textured 3D models in an interoperable format such as CItyGML.

15 August 2014 Online 3D Mapping - Discussion Paper Page | 8
2 Introduction
2.1 Background
The City of Ballarat (the “Council”) provides key Council and non-Council Community Services across the municipal district. The district comprises Ballarat, which is one of Australia's largest inland cities and the third largest city in Victoria, and the townships of Learmonth, Buninyong, Miners Rest and Cardigan Village.
The City of Ballarat has commissioned this study in order to understand the effectiveness of 3D solutions as part of the UNESCO Historic Urban Landscape (HUL) pilot program currently underway in Ballarat. According to UNESCO:
The historic urban landscape is the urban area understood as the result of a historic layering of cultural and natural values and attributes, extending beyond the notion of “historic centre” or “ensemble” to include the broader urban context and its geographical setting.
This wider context includes notably the site’s topography, geomorphology, hydrology and natural features, its built environment, both historic and contemporary, its infrastructures above and below ground, its open spaces and gardens, its land use patterns and spatial organization, perceptions and visual relationships, as well as all other elements of the urban structure. It also includes social and cultural practices and values, economic processes and the intangible dimensions of heritage as related to diversity and identity.
This definition provides the basis for a comprehensive and integrated approach for the identification, assessment, conservation and management of historic urban landscapes within an overall sustainable development framework.
1
At their HUL+2 Expert Session in December 2013 UNESCO highlighted the need to develop and utilise tools, such as 3D mapping, to manage change in historic urban areas. Given the potential of 3D solutions for managing change the City would like to use this technology as a visualisation and community engagement tool to support the HUL approach. The Council is aiming to implement a 3D mapping capability to improve its decision making, manage change effectively and to provide an additional channel of engagement with its citizens. This engagement relates to activities concerning the natural, built and cultural environment with a particular focus on development activities. All Councils face a problem of effectively informing their citizens of development proposals and the current approach of using 2D maps has been in place for many years. The issue with using a 2D mapping method is that it is very difficult for the average person to fully understand the impact of a new development proposal when shown in 2D. A 3D representation of the proposed development together with associated 3D context information of the neighbouring buildings provides a much more easily understood method of communication for new proposals. Additionally, 3D representations can facilitate a greater understanding of the impact of development by triggering previously unforseen impacts. These can include impacts on elements such as views, sightlines, silhouettes and neighbourhood character. 3D
1 http://portal.unesco.org/en/ev.php-URL_ID=48857&URL_DO=DO_TOPIC&URL_SECTION=201.html

15 August 2014 Online 3D Mapping - Discussion Paper Page | 9
systems can be manipulated to facilitate clear consideration of the impact of a proposed development from multiple viewpoints, as well as its impact in varying seasonal and time of day conditions.
To ensure maximum return from any investment in 3D mapping, the Council engaged OMNILINNK to prepare a discussion paper and scoping study report. As part of this work input was sought from key stakeholders across Council business departments, as well as relevant external partners. The study was also broadened to identify Council needs outside of the scope of the HUL. This approach ensures that 3D current and future 3D requirements are catered for whilst maintaining the priority on the HUL projects.
2.2 Existing Systems Environment
The Council has existing desktop licences of MapInfo Professional and a corporate licence of Exponare which is soon to be replaced. A tender process has been finalised and it is expected that a new Digital Mapping Solutions IntraMaps based GIS system will be operational by October 2014.
Council has a number of other core systems in place to meet the business needs of the various business units:
1. Pathway – a core council system which caters for customer, property and Corporate Management business processes.
2. Confirm – the asset management system.
3. TRIM – Electronic Records Management System.
4. People and Community Systems – the systems used to support Home Care Services (CareLink), Child care services (QikKids, Harmony and Xpedite) and Maternal and Child Health (McCHS).
5. Crisisworks – emergency management tools.
6. Computron – the finance solution for invoice processing.
7. Intellitrac –GPS Tracking System (Garbage Trucks).
8. Customer Relationship Management System – Council RM.
15 August 2014 3D Mapping System -Discussion Paper Page | 10
3 Summary of Benefits and Requirements
To determine the perceived benefits and requirements of a 3D Mapping System for the HUL program, OMNILINK met with the Project Control Group (PCG), the Coordinator Heritage Strategy and Federation University Australia’s Centre for eResearch and Digital Innovation (CeRDI). OMINILINK also conducted a phone interview with HIVE at Curtin University in Western Australia.
To assess both HUL and broader Council needs, OMNILINK conducted a workshop with 15 council stakeholders in the Town Hall on June 6 2014. In cases where key staff that would benefit from the proposal could not attend the workshop, separate interviews were conducted where these could be arranged. Additionally a survey was available for those not able to attend the workshop or partake in an interview.
3.1 Perceived benefits of proposed 3D Mapping System
A broad range of benefits which would arise from implementing a 3D capability for both the Council itself and Council’s citizens were identified. These are listed below. 3.1.1 Benefits for Managing Ballarat’s Historic Urban Landscape
The City of Ballarat is a global pilot city for UNESCO’s HUL approach to managing change in historic cities. For historic cities around the world development has been occurring at a greater rate than ever before. The current global trend of rapid urbanisation is unprecedented. Many modern challenges are interrelated and include private wealth generation, national economic development, globalisation, uncontrolled growth, unrestricted commercial development pressures, unsustainable energy consumption, pollution, short-term planning, iconic architecture, skyscrapers, city branding, gentrification, global tourism, loss of rural areas and homogenisation. Dr Ron van Oers, Vice Director of WHITRAP2 believes that the pressures being placed on historic cities make ‘historic urban landscape conservation one of the most daunting tasks of our time’.
The HUL approach was recommended by UNESCO in 2011 and includes using traditional tools and developing a range of ‘innovative tools adapted to local contexts’.3 These tools include civic engagement tools and knowledge and planning tools, among others. Technological visualisation tools, including 2D GIS and 3D Mapping, are a key part of the approach.
Key benefits of a 3D mapping system that will support the approach have been identified below.
Aid in impact assessment. For example the effects of : Allowing tall building development in CBD. Climate change (e.g. storm impact on heritage buildings). Neighbourhood character change, including horizon view and line of
2 World Heritage Institute of Training and Research for the Asia and Pacific Region 3 http://portal.unesco.org/en/ev.php-URL_ID=48857&URL_DO=DO_TOPIC&URL_SECTION=201.html

15 August 2014 3D Mapping System -Discussion Paper Page | 11
sight impact. Additional floors on single buildings.
Enable cultural mapping – this method can involve a community mapping its cultural, resources such as galleries, craft industries, distinctive landmarks, local events and industries. It can also involve mapping intangibles such as memories, personal histories, attitudes and values.
Enable cognitive mapping – for example capturing layers that map use patterns of various stakeholder groups (e.g. farmers, tourists, and business all using one area). This mapping can enable authorities to avoid prioritising one stakeholder group at the detriment of others that may not have formerly been identified.
Provide functionality to capture stakeholders values and attributes – for example the use of regular walking routes (e.g. “goat tracks”), aesthetic appeal of an area (e.g. “rural feel” in urban environment) and attachment to place.
Display critical areas of interests as “hotspots”.
Provide functionality for historical layering (4D).
Provide functionality to enable participatory decision making. For example, residents are able to view proposed development, comment on what they value, highlight any issues, vote on desirability, and if required capture suggested alterations. Methods of capture to include:
Record and annotate snapshot of particular 3D view, Sketch up proposed changes in 3D system.
Provide a 3D capability that can be extended by Victorian and other academic institutional research.
Enabling view line and shadow analysis.
Enable complex historic urban landscapes to be viewed and change managed holistically
3.1.2 Benefits for Managing Other Council Responsibilities Strategic Planning
Support Strategic Planning and improved understanding of Council planning decisions.
Improve the understanding of changes to planning regulations.
Better public awareness of planning regulations (e.g. building envelopes), reducing unnecessary complaints to Council.
Improving strategic planning for projects of Council significance including visualisation of alternative scenarios.
Better assessment of proposals such as green field development or increased housing density in heritage areas.
Support open space planning.
Assist in determining built form envelopes for key sites and precincts.
Representing planning and regulatory zones and overlays in 3D.
Ability to assess policy impact on view lines/sightlines/silhouettes.
Facilitate holistic integrated planning.
Shade analysis and shadow impact in different seasons.
Display a more realistic view of vegetation (c.f. stylised models).
Statutory Planning
Reducing development risk.
Statutory Planning Decisions can be more effectively communicated.

15 August 2014 3D Mapping System -Discussion Paper Page | 12
Assisting the Council to promote the area to the public and business
community through accurate 3D representation of the built and natural
environment.
Upload proposals into 3D models for assessment transaction.
Ability to automatically send letters to residents affected by a proposal (mail
merge).
Significant reduction in the number of VCAT appeal cases, and better
resolution of those cases that are appealed
Marketing and Research Opportunities
Providing opportunities for the Council to engage in partnerships with the
commercial sector to leverage their 3D capabilities for business purposes
such as stimulating innovative uses of 3D capabilities by local entrepreneurs.
Providing a framework to enable new and useful additional data to be added
to the 3D models over time – such as socio-economic data describing the
demographic and economic makeup of the Council’s areas.
Information Technology
Determine line of sight between council and other buildings.
3D data could be stored locally or in the cloud.
Consider the use of UAV for site specific updates.
Advocates 3D system is established for internal use initially; access to public provided after assessing confidentiality and security of 3D data and any 2D overlays.
Engineering Design and Service management
3D view of proposals would benefit design and assessments.
Design of roads and street – identify and measure cross and longitudinal falls.
Use grid analytics to measure volumes.
View of roundabout design and traffic treatment with ability to turn layers on/off (e.g. trees).
Viewing and analysis of ground water.
Drape cad drawings over 3D model to show extent and nature of works to council contractors.
A 3D view is preferred to a stylised view developed by consultants.
Simulation of night time lighting would be valuable in the assessment pedestrian safety.
Viewing steep road inclines.
Arts and Culture
Ability to consider internal 3D architectural mapping for buildings, to provide opportunities for fly throughs for scenario planning e.g. Events, performances and exhibitions.
Ability to produce to scale 3D architectural mapping that enables both the

15 August 2014 3D Mapping System -Discussion Paper Page | 13
opportunity to perform render experiments with different facades for buildings and structures, which can then be utilised as a platform for projections. A focus would begin with the City of Ballarat Town Hall and then branch out to other sites identified.
Other
New building completion stage assessment (require twice yearly update).
Property valuation analysis.
Local laws enforcement (e.g. assessment of encroachments).
Assisting in the collection of Asset Information for Council’s business
databases.
Asset Management – view assets in 3D and aid identification of asset and its attributes; ideally would like a link from the asset in Confirm to a 3D view.
Ability to generate walk throughs, drive throughs and fly throughs.
Power line and vegetation management.
Tree risk analysis.
Tree canopy cover and health analysis.
3.1.3 Benefits to Council Citizens
Better informing citizens of development proposals, through the use of a
more easily understood capability that 3D provides a richer set of information
more easily understood by the public.
Improving the interaction with citizens in relation to building proposals and
planning related matters.
Improving the public consultation process through the provision of more
detailed and useful information to those potentially impacted by any
development activity.
Improved understanding and awareness of the Council’s built form and
historic urban landscape for all citizens.
More effectively demonstrating planning rules and regulations by displaying
statutory planning overlays (building envelopes, height limits, set-backs, etc.).
Providing an authoritative baseline of 3D buildings (actual and proposed) to
improve the context information available for the construction sector and
architectural communities design activities leading to a more integrated built
environment.
Providing an authoritative 3D ‘view’ of the Council area (without interpretation
by contractors/developers).
Providing a future opportunity to integrate social networking capabilities to
support public comment on development proposals.
3.1.4 Other Potential Benefits
In addition to the benefits identified and listed above, OMNILINK’s industry research and experience suggests other benefits could accrue from a 3D implementation, such as:
15 August 2014 3D Mapping System -Discussion Paper Page | 14
Establishing a framework to support future use of Building Information
Modelling (BIM –see section 4 for definition) activities to improve construction
efficiencies for both the construction sector and Council.
o BIM is being increasingly used in the construction sector and a 3D
capability will leverage the benefits of this new construction and
property management technology.
o The ability to link with BIM related developments in the future to
provide additional capabilities and business and constituent benefits.
o Improved support for Emergency services through an improved
understanding of the internals of local buildings (through BIM data).
o See reference articles and examples:
http://goo.gl/z5e5K3
http://goo.gl/tpPsLH
http://goo.gl/351aMx
Establishing a platform to support 3D cadastre and 3D addressing capabilities
as current research moves towards implementation of this land and title
administration approach.
Leveraging the public’s use of social networking to improve constituent
engagement relating to Council planning proposals and development
activities.
3.2 Required features of 3D Mapping System
The following is a general l ist of requirements of a 3D mapping System. (It is expected that a Requirements Specification will be prepared to detail a full list of prioritised requirements as part of a Council tender process.)
Collect new sets of fully textured/rendered 3D data for council areas at
specified resolutions.
Provide a high-end viewing and analysis tool for specialist use (e.g. shade
analysis, view sheds, fly throughs)
Provide internal council access to view 3D models via a standard web
browser, preferably without additional downloads or application installation:
o Intuitive and easy to use interface.
o Access to a number of ‘layers’, with layers comprising different types
of information ranging from 3D relevant building codes or regulations
to socio- economic and cultural information. Layers can also be used
to provide views of different time periods helping to visualize ‘future’
development concepts or past building features.
Provide public access to view 3D models using a standard web browser with functionality similar to the council internal version but with restricted access to sensitive council layers.
Storage of data in an independent data store (ideally cloud based storage).
Ability to ingest data in different formats from multiple ‘authorised’
contributors such as architects for individual building proposals and commercial
3D data collectors to provide large area coverage.
15 August 2014 3D Mapping System -Discussion Paper Page | 15
Leveraging spatial web services to bring in other externally sourced data such as socio-economic data, other management authorities data, meteorological data and other environmental data.
Establishment of formal governance and technical administration
mechanisms for managing the development project and supporting the
operations of the capability once implemented.
Assist council to solve other issues such as:
o Improve asset management and assist in collecting asset data.
o Improve citizen engagement through 3D based services such as “fix
my street”.
o Move distribution of spatial data to users.
Provide the ability to interact more effectively with citizens either directly
through the 3D application or through social networking technologies to
capture comments and views on development proposals and other planning
activities.
Display of 2D GIS layers in 3D Mapping System.
Allow data to be downloaded by authorised external users/consultants.
Accept crowd sourced updates.
Allow for future integration with Building Information Models (BIM).
15 August 2014 3D Mapping System -Discussion Paper Page | 16
4 Overview of 3D Visualisation Technologies The traditional path to establishing 3D city capabilities has come through the spatial communities’ evolution of technologies. Many of the main GIS vendors have 3D offerings at various levels of capability However, to establish a ‘virtual world” view of a city also ideally requires linkages with other communities who are developing their own 3D capabilities. 3D technologies are being developed by several industry sectors. The sectors involved are:
Spatial sector – traditional 3D modelling – LiDAR, photogrammetry etc. provides mostly a generally ‘external’ view of the built environment and details of the natural environment.
Building and construction sector that have used Computer Aided Design (CAD) for many years and more recently are moving towards a comprehensive 3D representation of all aspects of a building under the umbrella of the Building Information Modelling (BIM). BIM is described by Wikipedia4 as:
“Building information modelling (BIM) is a process involving the
generation and management of digital representations of physical and functional characteristics of a facility. The resulting building information models become shared knowledge resources to support decision-making about a facility from earliest conceptual stages, through design and construction, through its operational life and eventual demolition.”
Gaming based technologies that have created a range of visualisation engines to support both console and web based interactions with virtual world scenarios. Some companies have evolved to leverage this gaming technology to meet business 3D needs such as augmented reality.
Other sectors including Geological, Energy and Medical industries have also been pioneers in 3D modelling and visualisation.
4.1 Spatial (Mapping) Sector
Typically 3D modelling as developed by the spatial sector provides an external view of buildings and the physical features of the built and natural environment. Data is captured from airborne, satellite or terrestrial devices using technologies such as photography, LiDAR, RADAR, multi-spectral or hyper-spectral imaging. Data has unique coordinates recorded in either geographic latitudes or longitudes or as map grid coordinates.
4.2 CAD and Building Information Modeling (BIM) Sector
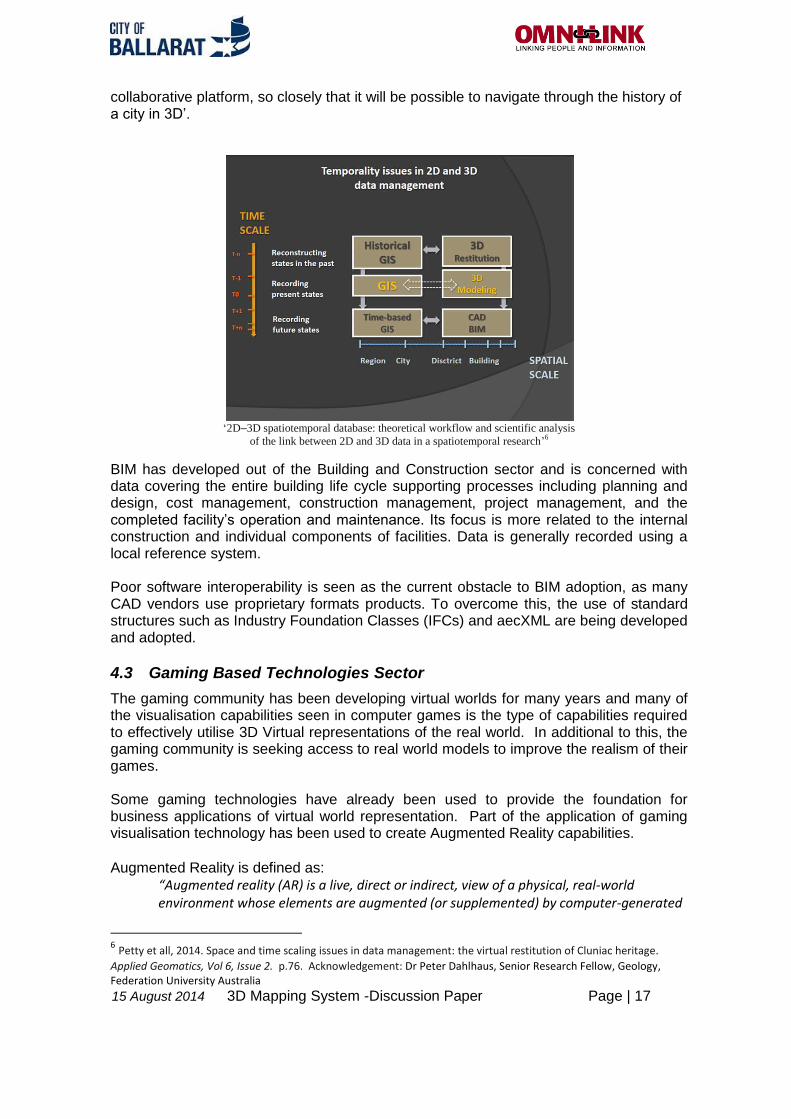
As mentioned, there are a number of CAD based technologies working towards federated 3D visualisation and incorporating the traditionally attributed GIS technologies. These include popular formats like CAD, Sketchup and AutoCAD, and increasingly common BIM formats. According to Petty et al (2012)5, the scientific community have been moving towards tying together ‘CAD and GIS models with temporality on a single geo-referenced
4 http://en.wikipedia.org/wiki/Building_information_modeling
5 Petty et all, 2014. Space and time scaling issues in data management: the virtual restitution of Cluniac heritage.
Applied Geomatics, Vol 6, Issue 2. p.71. Acknowledgement: Dr Peter Dahlhaus, Senior Research Fellow, Geology, Federation University Australia
15 August 2014 3D Mapping System -Discussion Paper Page | 17
collaborative platform, so closely that it will be possible to navigate through the history of a city in 3D’.
‘2D–3D spatiotemporal database: theoretical workflow and scientific analysis
of the link between 2D and 3D data in a spatiotemporal research’6
BIM has developed out of the Building and Construction sector and is concerned with data covering the entire building life cycle supporting processes including planning and design, cost management, construction management, project management, and the completed facility’s operation and maintenance. Its focus is more related to the internal construction and individual components of facilities. Data is generally recorded using a local reference system. Poor software interoperability is seen as the current obstacle to BIM adoption, as many CAD vendors use proprietary formats products. To overcome this, the use of standard structures such as Industry Foundation Classes (IFCs) and aecXML are being developed and adopted.
4.3 Gaming Based Technologies Sector
The gaming community has been developing virtual worlds for many years and many of the visualisation capabilities seen in computer games is the type of capabilities required to effectively utilise 3D Virtual representations of the real world. In additional to this, the gaming community is seeking access to real world models to improve the realism of their games. Some gaming technologies have already been used to provide the foundation for business applications of virtual world representation. Part of the application of gaming visualisation technology has been used to create Augmented Reality capabilities. Augmented Reality is defined as:
“Augmented reality (AR) is a live, direct or indirect, view of a physical, real-world environment whose elements are augmented (or supplemented) by computer-generated
6 Petty et all, 2014. Space and time scaling issues in data management: the virtual restitution of Cluniac heritage.
Applied Geomatics, Vol 6, Issue 2. p.76. Acknowledgement: Dr Peter Dahlhaus, Senior Research Fellow, Geology, Federation University Australia
15 August 2014 3D Mapping System -Discussion Paper Page | 18
sensory input such as sound, video, graphics or GPS data.”7 See Appendix 3 for further background information on Augmented Reality. A wide range of both proprietary and open source augmented reality software is available. For example, Blender8 is a free open source 3D animation suite. It supports the modelling, rigging, animation, simulation, rendering, compositing, motion tracking and even video editing and game creation. COLLADA has established an approved ISO standard (ISO/PAS 17506:2012) for use in 3D visualization.
4.4 Other 3D Visualisation Technologies
Other non-mapping visualisation technologies have potential importance as support tools for the Historic Urban Landscape approach to managing change. Many examples exist including 3D TV, portable virtual reality devices (e.g Oculus Rift) and 3D projection theatres. A discussion of some of these technologies is included below.
4.4.1 Hub for Immersive Visualisation (HIVE) - Curtin University HIVE is a $2 million physical facility built at Curtin University’s campus in Bentley W.A. It has four large-scale visualization screens – “The Tiled Display”, “The Cylinder”, “The Wedge” and “The Dome” - with supporting hardware, software and technical staff. The facility is available for interdisciplinary research, teaching and learning as well as commercial training opportunities for industry. There have been some discussions about replicating the facility at an international academic institution, and Curtin University 9has indicated a willingness to share high level knowledge with others wishing to build similar facilities. If adequate resources are available, there is a possible opportunity for the Council and/or its partner Federation University Australia, to develop a similar facility at Ballarat. Such a facility may provide a unique means of displaying Ballarat’s Heritage Landscape. “The Cylinder” is the most suitable facility for displaying 3D terrain models. HIVE utilise gaming software Unity3D as its underlying technology. HIVE staff advise that while they believe importing proprietary 3D terrain model formats into Unity 3D is possible via a standard or specification such as CityGML, “Proof of Concept” tests would need to be undertaken. 4.4.2 The Cube – Queensland University of Technology
7 Wikipedia definition - http://en.wikipedia.org/wiki/Augmented_reality
8 http://www.blender.org/about/
9 Erik Champion, Professor of Cultural Visualisation, School of Media Culture and Creative Arts, Faculty of Humanities,
Curtin University, Western Australia

15 August 2014 3D Mapping System -Discussion Paper Page | 19
The Cube is a large digital interactive learning and display facility which provides a participatory 3D experience of QUT's Science and Engineering research in a new centre in Brisbane. It is similar to the Curtin’s “Wedge“ facility described above. It is available for use by the wider education sector and the general public. Federation University Australia have an existing relationship with this facility. 4.4.3 Video Projection Mapping Video Projection mapping, also known as 3D video mapping and spatial augmented reality, is a projection technology used to turn objects, often irregularly shaped, into a display surface for video projection. Common examples include those on public buildings as shown in the examples below. A ‘to scale' 3D architectural model of the building combined with specialist software is used to spatially map the display surface, and render the architectural elements to suit the desired effects such as, optical illusions, and notions of movement onto the static building façade. The use of this could create the opportunity to showcase Ballarat’s built heritage through innovative and creative means. Such projects would engage and socialize the Ballarat community and beyond. Examples of projections and basic process.
https://www.youtube.com/watch?v=LwDThTaW1QA&list=PL4C6DE7AACCE6C841&index=1
https://www.youtube.com/watch?v=FgV2Sllft6Q&index=13&list=PL4C6DE7AACCE6C841
https://www.youtube.com/watch?v=gy_jyxoWj5c&index=15&list=PL4C6DE7AACCE6C841
http://blog.antivj.com/2008/nuit-blanche-bruxelles/
http://vvvv.org/documentation/how-to-project-on-3d-geometry
4.5 Discussion Outcomes
Currently, the Spatial Sector provides the most suitable 3D mapping technology, as it can provide a homogenous, spatially accurate and (potentially) complete 3D model of Ballarat’s built and historic environment.
The use of Video Projection Mapping technology could create the opportunity to
showcase Ballarat’s built heritage through innovative and creative means. Such projects would engage and socialize the Ballarat community and beyond.
There is a possible opportunity for the Council and/or its partner Federation University Australia, to develop a similar facility to Curtin University’s HIVE. This could provide a unique means of displaying Ballarat’s Heritage Landscape.
15 August 2014 3D Mapping System -Discussion Paper Page | 20
5 Data Formats, Standards and Interoperability The issue of formats, standards and interoperability are complex yet significant to the development of the City of Ballarat 3D project. This section provides an overview of some of these issues. A summary of the formats and standards in common use is provided in Appendix 1. 5.1.1 Standards and Interoperability
In the emerging 3D Visualisation technology field, developing and complying with standards to facilitate interoperability between the different technologies and systems is important. In this mix of standards is the issue of common data formats and interoperability achieved in proprietary environments. Many product developers support commonly used formats regardless of whether they are accepted international standards. The industry takes a pragmatic view of standards, and builds capabilities to meet the majority of user needs. Most 2D CAD packages can accept and export a number of formats, and most GIS vendors can take in data coming from other vendors systems. It is important to appreciate that standards provide a ‘double edged sword’. The positives within the standards debate are the ability of standards to bring a range of data and processes together in a seamless manner. The negatives arise from the non-compliance or partial compliance of some vendors to standards, through to the reactions of stakeholders being ‘dictated to’ in the context of the need to comply with specified standards. In practice, data users often find that there is a loss of usefulness or manipulation capability when data is transferred from a proprietary format to a standard format. For example, GIS data held in an ESRI proprietary geodatabase can be made to adhere to topological rules such as ‘polygon boundaries must not overlap’. However when the geodatabase is transferred to a different format such capability is lost. There are many standards relating to 3D interoperability; some of these are listed in Appendix 1 – Formats and Standards. Each of the three sectors (spatial, building and gaming) that potentially could provide capability to establish the City of Ballarat 3D project have their own specific standards and these are at various levels of maturity. However, the capability to effectively link across the sector boundaries and between some of these standards at the current time is considered problematic.
The CSIRO has developed the Spatial Information Services Stack (SISS), which is an
end-to-end suite of open source products supporting 2D needs. SISS has been
implemented in a number of government agencies. However, only some elements of this
stack are 3D capable and cost estimates of approximately $2m have been given in
relation to providing a full 3D capability.
5.1.1.1 Interoperability Example - Spatial and BIM
15 August 2014 3D Mapping System -Discussion Paper Page | 21
Ideally users should be able to navigate to a facility or building in 3D space, then pass into the building and view its internal components. To achieve this interoperability between the technologies of both spatial and BIM communities is required. However, it is important to note that BIM provides a comprehensive data set of all aspects of the building. Not all the BIM data will be suitable for re-use. Identifying what BIM data can be used for other purposes and how this is extracted is an area requiring work. In relation to this, there are issues of IP, confidentiality and privacy in relation to BIM data identified for re-use that will need to be addressed. The following text taken from an OGC publication in relation to BIM interoperability demonstrates some of the issues that are being addressed.
“The OGC CityGML Encoding Standard for 3D modelling provides an important foundational part of the solution. The Netherlands – a flat country in which small elevation differences are very important – has made CityGML-encoded 3D data a key part of their National Spatial Data Infrastructure. In an OGC 3D Portrayal Interoperability Experiment, members of the Web3D Consortium worked to identify technological issues and develop common integration strategies using web approaches for non-geospatial 3D modelling. However, much work remains. One major BIM standards effort is the conversion of buildingSMART International's Industry Foundation Classes to service interfaces and encodings. This innovation will make these building data models consistent with CityGML and with service-oriented computing in general.”10.
Current BIM related research has focused on the integration of the two sectors technologies covering importing BIM data into GIS applications and vice versa. Ruben de Laat and Leon van Berlo11 have developed a CityGML extension that gets semantic IFC data into a GIS context using the open source Building Information Model server. This extension is modelled on combining the strong parts of both technologies. 5.1.2 CityGML and Levels of Detail
While CityGML is strictly not a standard, it can be considered to be a common and increasingly adopted specification. Within this specification is a well understood concept of the Level of Detail (LoD). CityGML uses four LoD, as follows12 :
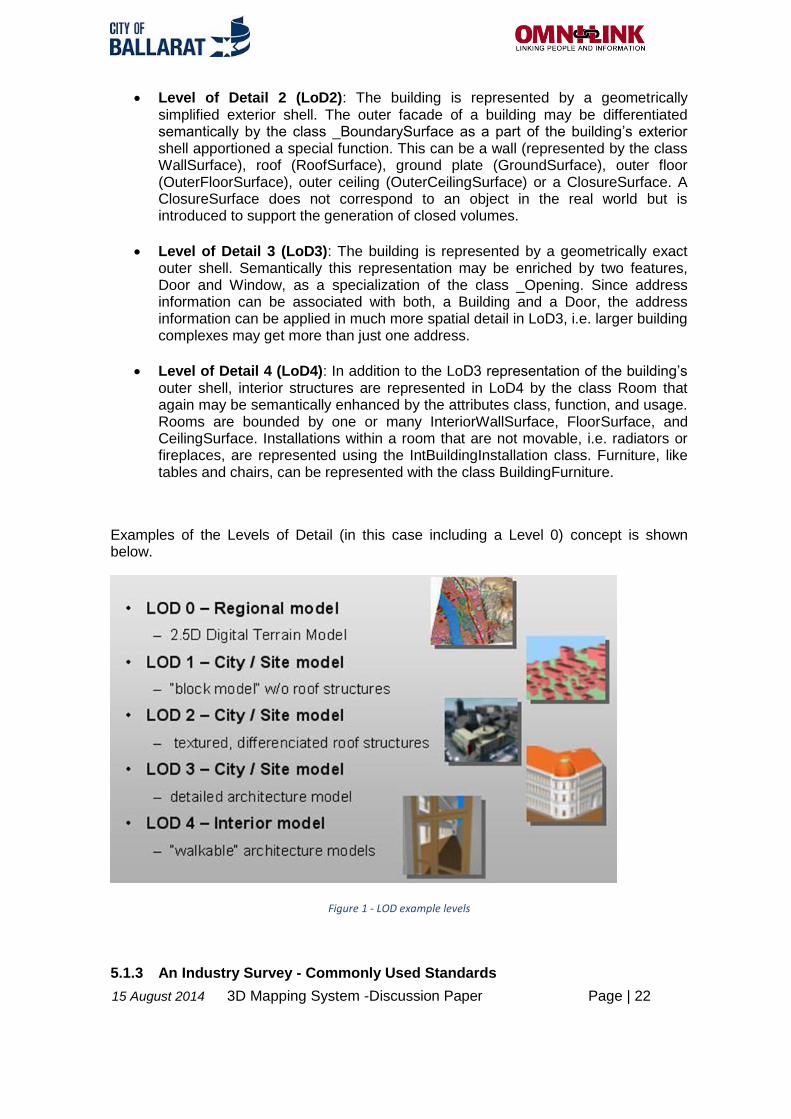
Level of Detail 1 (LoD1): The building is represented by a block model, i.e. a vertical extrusion solid without any semantic structuring. The geometric representation is realized by a gml:Solid or a gml:MultiSurface.
10
George Percivall - Smart Cities Depend on Smart Location , OGC Publication, 2013-09-11 11
Ruben de Laat and Leon van Berlo - Integration of BIM and GIS : The Development of the CityGML GeoBIM Extension, April 2011 12 Löwner, M.-O., Benner, J., Gröger, G. & Häfele, K.-H. (2013): New Concepts for Structuring 3D City Models - an Extended Level of Detail Concept for CityGML Buildings. In: B. Murgante et al. (Eds.): ICCSA 2013, Part III, LNCS 7973, Springer, Heidelberg, 466-480.
15 August 2014 3D Mapping System -Discussion Paper Page | 22
Level of Detail 2 (LoD2): The building is represented by a geometrically simplified exterior shell. The outer facade of a building may be differentiated semantically by the class _BoundarySurface as a part of the building’s exterior shell apportioned a special function. This can be a wall (represented by the class WallSurface), roof (RoofSurface), ground plate (GroundSurface), outer floor (OuterFloorSurface), outer ceiling (OuterCeilingSurface) or a ClosureSurface. A ClosureSurface does not correspond to an object in the real world but is introduced to support the generation of closed volumes.
Level of Detail 3 (LoD3): The building is represented by a geometrically exact outer shell. Semantically this representation may be enriched by two features, Door and Window, as a specialization of the class _Opening. Since address information can be associated with both, a Building and a Door, the address information can be applied in much more spatial detail in LoD3, i.e. larger building complexes may get more than just one address.
Level of Detail 4 (LoD4): In addition to the LoD3 representation of the building’s outer shell, interior structures are represented in LoD4 by the class Room that again may be semantically enhanced by the attributes class, function, and usage. Rooms are bounded by one or many InteriorWallSurface, FloorSurface, and CeilingSurface. Installations within a room that are not movable, i.e. radiators or fireplaces, are represented using the IntBuildingInstallation class. Furniture, like tables and chairs, can be represented with the class BuildingFurniture.
Examples of the Levels of Detail (in this case including a Level 0) concept is shown below.
Figure 1 - LOD example levels
5.1.3 An Industry Survey - Commonly Used Standards
15 August 2014 3D Mapping System -Discussion Paper Page | 23
Using the results of a recent EuroSDR survey of European national mapping agencies which focused on 3D data management, Volker Walter13 has identified that lack of or inconsistent standards is a major problem with 3D data handling.
The leading standards used by participants were:
3D-Shapefile 23
(3D) DXF 22
CityGML 19
KML/KMZ 14
3D PDF 10
3DS (3D Studio) 9
GML3 8
VRML 8
Other standards participants reported to use to a lesser extent include DGN, ASCII (XYZ), GeoVRML, X3D, GDB, Las, 1Spatial GFO, XML, MaagisXL, fbi (Terrasolid), CityGrid XML, RVT, DWG, OBJ, EsriGrid, ESRI Multipatch, skp, and C4D. 5.1.4 File Format Conversion There are many different file formats available and many of these are proprietary. The workflow of both accepting new data for the baseline 3D model database and providing data to external sources (contractors, clients) means there is a requirement for a data conversion application. Such an application should be configured to support the formats used by the main 3D related products. A data conversion environment used by many organisations is the Feature Manipulation Engine (FME) from Safe Software. FME is discussed in more detail in a later section on Additional Tools.
13
Volker Walter - Results of the EuroSDR Survey: 3D Data Management in European National Mapping and Cadastral Agencies, INSPIRE conference , Florence (23-27 June, 2013)
The 32 agencies surveyed used 27 different standards, leading the author to conclude that 3D GIS is a “young” technology.
15 August 2014 3D Mapping System -Discussion Paper Page | 24
5.2 Discussion Outcomes
6 3D Mapping Data Collection Technologies 6.1 Technology Overview
6.1.1 Pictometry
Definition
Pictometry14 is a patented aerial image capture process that produces imagery showing the fronts and sides of buildings and locations on the ground. Images are captured by low-flying airplanes, depicting up to 12 oblique perspectives (shot from a 40 degree angle) as well as an orthogonal (overhead) view of every location flown. These perspectives are then stitched together to create composite aerial maps that seamlessly span many miles of terrain. Because they are taken from an angle, the pixels associated with Pictometry images are trapezoidal, rather than rectangular. This necessitates special software and algorithms to accurately determine objects’ size and position on the maps. Capabilities Pictometry provides useful building textures. Additionally, individual buildings or other features can usually be separated from the model. However, when buildings are physically touching or linked it may not be easily possible to separate individual structures. Pictometry models are geometrically accurate and consequently direct measurements can be made from the data. Pictometry derived models can also be used for undertaking things such as calculating shadow cast and for other analysis activities. The accuracy of Pictometry for this purpose has been successfully tested in court (Melbourne) and it is understood that Melbourne City Council have documented the accuracy of Pictometry. Pictometry data can be loaded into a range of applications including Autodesk, SketchUp (formerly Google SketchUp) and various GIS systems for further enhancement of the models. This may include appending additional details of
14 http://en.wikipedia.org/wiki/Pictometry
There are many proprietary 3D formats in use.
Interoperability is facilitated by standards, however at this stage proprietary formats facilitate the most functionality.
Standards are being developed for the Spatial (CityGML), BIM (IFC) and Gaming (COLLADA) sectors.
Interoperability between Spatial and BIM – which would facilitate a viewer moving from outside to inside a building - is developing but not yet mature.
The use of a data conversion engine can facilitate conversions between 3D
proprietary formats.
15 August 2014 3D Mapping System -Discussion Paper Page | 25
buildings etc., such as the structures that may exist under awnings that have not been captured by the Pictometry process. Street level data may need to be captured by other techniques such as EarthMine (described later). The enhanced models can be ‘returned’ to the original model. Limitations and Issues In terms of cost, there appears to be a linear relationship between size of coverage and cost: with costs increasing with increased areas. Some building features - such as facades under verandas - are not captured. This is a problem common with most aerial data capture methods, but less significant with Pictometry given the multiple views collected from angled cameras. This missing detail (if required) will need to be ‘added’ from other sources such as ground data collection processes (EarthMine) and added via tools such as SketchUp. Also, SketchUp can be used to enhance building representation by adding ‘virtual’ features such as signs, and other views (e.g. internal views as seen through windows). 6.1.2 Orthophotography
Definition15
An orthophoto, orthophotograph or orthoimage is an aerial photograph geometrically corrected ("orthorectified") such that the scale is uniform: the photo has the same lack of distortion as a map. Unlike an uncorrected aerial photograph, an orthophotograph can be used to measure true distances, because it is an accurate representation of the Earth's surface, having been adjusted for topographic relief, lens distortion, and camera tilt. Capabilities Orthophotography is an excellent approach to creating accurate 2D representations of surface features and can be used effectively for capturing building footprints. Orthophotography is considered to be a cost effective method for 2D data collection, with less utility in the 3D domain (on its own, although improvements can be made through adding other data such as LiDAR). Additionally, new capabilities such as those used by AEROmetrex where multiple 2D images are collected provide a Pictometry style data set that has good 3D capabilities. Limitations and Issues 3D from Orthophotography is limited to basic wire frame outputs and lacks building texture information – but as above, newer approaches to using Orthophotography can provide excellent texture details. Other (street level) imagery data can be applied to supplement the Orthophotography to achieve photo realistic 3D views.
6.1.3 LiDAR Definition16
15 http://en.wikipedia.org/wiki/Orthophoto
15 August 2014 3D Mapping System -Discussion Paper Page | 26
LiDAR (also written LIDAR) is a remote sensing technology that measures distance by illuminating a target with a laser and analysing the reflected light. The term "LiDAR" comes from combining the words light and radar. LiDAR is popularly used as a technology to make high resolution maps with applications in geomatics, archaeology, geography, geology, geomorphology, seismology, forestry, remote sensing, atmospheric physics, airborne laser swath mapping (ALSM), laser altimetry and contour mapping.
Capabilities
Laser based technologies collect very large quantities of data. The data is generally described as a point cloud. The application of LiDAR based point clouds is through creating a mesh of data points and then representing this information. On its own, LiDAR has a generally ‘coarse’ building texture but when combined with relevant imagery can provide very useful building surface models. LiDAR is a good technology for collecting data over large areas (several hundred square kilometres) since as a rule the cost per square kilometre reduces as the area of coverage gets larger. LiDAR is also useful for collecting building footprints and also heights and shapes of rooflines. When LiDAR is collected from the air, the building vertical surfaces and textures are lacking. However, terrestrial based LiDAR data collection (vehicle mounted) can provide the building facade details as can ground level collected imagery.
LiDAR technology is increasingly being used by ground based systems. This includes hand-held devices (see Section 7.10.4 'CSIRO Zebedee') and LiDAR surveying tools which are deployed to scan and create 'as-built' models of complex buildings and industrial installations (e.g. oil refineries). Vehicle mounted LiDAR and unmanned aerial vehicles (UAV) mounted LiDAR are increasingly being used to scan and create models of urban landscapes, including the interior of buildings (with UAVs).
Limitations and Issues LiDAR data has limited attribution (intelligence) and consequently its applications are reduced if it hasn’t been processed to identify individual features such as buildings. Given the point cloud outputs, data for individual features cannot be easily identified. As a consequence, removing and replacing buildings is difficult. Also, not all of the horizontal features of a building are captured. A tree or some other structure may block a part of a roofline from the airborne base instrument, reducing the accuracy of the structure. When LiDAR data is used in isolation some uses become difficult, such as analysis of sun and shade. The use of just LiDAR data for building modelling purposes has some applications but is unlikely to meet the user requirements for a number of stakeholders. Some architects have indicated that the representation of buildings using LiDAR data is not adequate for providing the level of ‘context’ the architect requires for the surrounding buildings to support their design and consultation related activities. This concern relates to ‘visual’ accuracy, and the need to provide a ‘realistic’ view of a built structure (and surrounding buildings) in a form easily identified by the public. Lack of accuracy of a model in relation to what actually exists was
16 http://en.wikipedia.org/wiki/Lidar
15 August 2014 3D Mapping System -Discussion Paper Page | 27
seen as a significant issue from a number of key stakeholders in the context of ensuring public ‘belief’ in what is being shown.
6.2 Data Collection Costs
6.2.1 Introduction
Data will need to be acquired or collected through two separate processes. Commercial data collection companies – who utilise one or more of the technologies described above - will need to be contracted to provide an initial baseline data set over a large area of the Council. Additionally, in the future small areas may need to be updated as development occurs to keep the baseline data set current.
Other data, specifically covering individual development activities may come from the developers and associated architects. The ’proposed’ or ‘as built’ 3D model may form part of a future Council development proposal requirement and would enable accurate 3D representations of new developments to be added to the 3D baseline dataset.
6.2.2 Cost Estimates
LiDAR is considered to be a cost effective approach for covering large areas of tens of square kilometres. Economies of scale mean that in general terms the larger the area flown, the lower the cost per square kilometre becomes. Pictometry and Orthophotography data collection techniques have a more linear relationship between area covered and costs. Very generalised cost estimates for Pictometry are of the order of (cost removed) to (cost removed) per square kilometre. However, data collection costs will vary according to a number of variables. The three technologies described above when used in isolation have various strengths and weaknesses. However, many user needs will require the addition of supplementary data to meet their needs. This may include additional ground level LiDAR or photography collection. The additional costs of collecting this data and the processing required to create a useful 3D output have many variables; cost estimates can only be established on a case by case basis.
7 3D Mapping Delivery Applications
7.1 Introduction
There are ranges of 3D Mapping applications with varying levels of capabilities available in the market. Many of these applications could provide some or all of the capabilities required by the Council. Below is a summary of some of these applications, along with a high level evaluation of their suitability to meet the needs of the Council. A basic description of each technology is included, along with OMNILINK’s initial assessment of their features and possible issues. Note that this information is provided in response to a current review of available technologies; pursuing any of the recommendations should be subject to an appropriate level of due diligence.
15 August 2014 3D Mapping System -Discussion Paper Page | 28
7.2 SkylineGlobe
Description
Skyline is a U.S. based company with an Australian Office in Adelaide. SkylineGlobe comprises a suite of enterprise level 3D products that allow the capture, processing, publishing and viewing of 3D models. The product provides a sophisticated and capable tool for meeting many of the functions the Council i s seeking. Skyline applications support access to a ‘cloud’ based data store and meet many of the Council’s internal needs for applying a 3D capability. Only some components of the full Skyline application suite would be required. Features
Links dynamically to various GIS databases and includes the capability to manage data, database connection etc.
Is customisable and allows user profiles to be established.
Contains advanced API for additional capability development / integration of third party applications.
TerraExplorer has 3 versions that provide a hierarchy of capability through the Viewer, PLUS and Pro versions.
Supports Mobile applications.
SkylineGlobe also outputs WMS and WFS which may have benefits in the longer term.
Can incorporate, optimise and deliver Point Cloud data.
Can create, and/or edit GIS data from within the web application as well as perform advanced Spatial Queries.
A tool called TerraBuilder PhotoMesh allows the creation of 3D City models
from oblique imagery.
The tool is in use in some Melbourne area councils who have endorsed the
product as being reliable and easy for both viewing and higher end users.
Issues and Concerns To make use of this application the user will need to initially download and install it (a similar process to that of accessing Google Earth). Some training will be required by the user to leverage its capabilities effectively.
The technology is considered more a ‘back-end’ tool to support internal staff for both
undertaking complex analysis and also developing appropriately structured 3D data
to be added to the 3D database.
7.3 Google
Description
Google Earth and Google Maps are probably the most well-known mapping and 3D spatial applications available. A number of organisations use the Enterprise version to support their business needs. In Australia, some state governments are also using Google Enterprise software internally, but rather than use Google’s data they
15 August 2014 3D Mapping System -Discussion Paper Page | 29
generally use their own within the Google application to ensure currency, coverage and accuracy. Features
These tools have the ability to both easily view and add data; this is a major driver for its adoption by various organisations. The applications support a range of commonly used data formats including:
• Standard vector data formats including shape files, tab files, GML, KML, and
CSVs.
• Standard imagery formats including GeoTiff, IMG, JP2 and MrSID.
• Standard terrain formats including DTED, SDTS DEM, ASCII DEM, IMG,
and GeoTiff. Google Earth Pro is another Google supplied technology and comprises a 3D interactive globe that can be used to aid planning, analysis and decision-making. Businesses, governments and professionals use Google Earth Pro data visualization, site planning and information sharing tools to determine the height of a building, measure view sheds from a new residential high-rise to the nearest park, or line-of- sight to the ocean. Issues and Concerns
There are issues with the accuracy and quality of t h e data used by Google. Up until recently, it was possible for individuals or organisations to add their own data to Google Earth. However, recently Google has stopped this process and is sourcing its own data. Google is predominantly a marketing enterprise rather than a spatial technology company and its primary objectives are to increase traffic to its site through the use of applications that are widely used.
However, making data available in KML and KMZ would potentially enable Google mapping applications to access the 3D data collected for the Council (assuming permissions and access were given).
7.4 CityServer3D - German Fraunhofer Institute17
Description
The CityServer3D is a client-server system for the storage, visualisation, and processing of spatial data. Geo-information from different sources is integrated into an object-relational database (CityServer3D supports a wide range of data bases – including open source and cloud based products and also SQL and non SQL databases). Its outputs are accessible via the web. In addition to 2D and 3D geometries in different levels of detail the CityServer3D can also store and process technical data and metadata. The technology of the CityServer3D consists of a geo-database, a server with numerous interfaces for the import and export of the data and applications for the development of landscape models. An administration module processes the data and the web viewer provides user access.
17 Fraunhofer Institute - https://www.igd.fraunhofer.de/en
15 August 2014 3D Mapping System -Discussion Paper Page | 30
The CityServer3D application has been developed by one of the world’s leading technology innovation organisations. The Fraunhofer Institute is Europe’s largest application-oriented research organization and has been selected as one of the Top 100 Global Innovators in 2013 by the Thomson Reuters media group. The Institute is a leader in the spatial standards community within the Open Geospatial Consortium and ISO Technical Committee 211.
The Fraunhofer Institute for Computer Graphics Research IGD4 manages the development of CityServer3D. Development has now reached Version 6 of the application. The Institute’s Computer Graphics area has also developed a number of other 3D capabilities, including work in the augmented reality space, which might be of interest for the Council. Features Database Connectivity - supports connections to: Oracle + Oracle Spatial, MySQL, PostgreSQL, PostGIS, MS SQL Server Interoperability CityServer3D comply with a number of approved and under development standards relating to 3D. These include WMS,W3DS and 3DP.
Viewing and Accessing Data The casual user’s access to 3D information would be provided through a web browser via the ViewService tool (without a plug-in). This tool is supported by Safari and Firefox browsers, with only limited support of Internet Explorer (see ‘Concerns’ below). There are various approaches to uploading and downloading data. The AdminTool can be provided to authorised users to support both access to the data and also enable them to upload data through connecting to the CityServer3D database. Data can be downloaded through this connection in a range of formats including: CityGML/GML, VRML/X3D, DXF, KML/KMZ, COLLADA, ESRI TIN/Grid, XYZ, GeoTIFF, Shapefile, XPlanGML.
Approximate costs for CityServer3D are:
(cost removed) for purchase of the application suite. (cost removed) per year maintenance fees.
Issues and Concerns
3D data would need to be collected by a third party using Pictometry,
photogrammetry or LiDAR based technologies.
Training and maintenance would be provided from Germany via online tools.
Access to Internet Explorer is limited to Internet Explorer Version 11 that is
deployed with Windows 8.1. This is due to Microsoft only supporting WebGL
through its latest version of the browser. Earlier browsers will not support
WebGL and therefore will not support CityServer3D.
15 August 2014 3D Mapping System -Discussion Paper Page | 31
CityServer3D provides a range of capabilities required to meet the Council’s needs. While some capabilities may be lacking, it provides a very solid foundation and the Fraunhofer Institute has a level of openness that will enable considerable further development and also continue to provide the ability to link to other applications through its compliance with relevant interoperability standards.
7.5 AAM Group (AAM)
Description
AAM is a significant Australian geospatial company with a background in aerial photography and associated technologies. It collects a range of aerial sourced data including LiDAR and Pictometry and supports the integration of this into a number of spatial platforms. AAM already supports local government through the collection of data to the provision of tools and products. AAM has flown and continues to fly major Australian cities, supplying its own 3D data models and associated supporting
software. Its visualisation and analysis tool is called Key 2 Virtual Insight (K2Vi)5
.K2Vi has been developed for AAM and it has a product development program to continue adding functionality. AAM provide a number of possible solutions included hosted data management services with public access (through K2Vi) through to Council hosted capabilities with similar public access. AAM can provide an end-to-end capability including data collection, cloud based data management and visualisation for both the public and more advanced users within the Council. Features
AAM provides tools to support the use and integration of data from multiple instruments that assists in overcoming some of the limitations associated with individual instrument types. Also, their use of Pictometry helps overcome some of the limitations associated with other ‘pixel’ related data collection technologies such as LiDAR where locating and extracting individual features (.e.g. buildings) from a dataset is much more complex. AAM offers an ‘end-to-end’ technology capability providing data capture and processing capabilities through to the provision of data management and visualisation systems. The K2Vi Web architecture includes the following levels of visualisation:
General users have easy viewing access to the 3D model through the K2Vi
desktop viewer or the Web browser client.
Council’s internal users can view and measure in 3D, turning on GIS layers
and themes, to support planning scenarios, concept and master plans.
High-end analysis and presentation users can use K2Vi Professional desktop
for shadow and visibility studies of Development Applications whilst
connected to the 3D GeoCloud service.
Data management is part of the subscription service.
Pictometry models are geometrically accurate and consequently direct measurements

15 August 2014 3D Mapping System -Discussion Paper Page | 32
can be made from the data. Pictometry derived models can also be used for undertaking things such as calculating shadow cast and for other analysis activities. The accuracy of Pictometry for this purpose has been successfully tested in court (Melbourne). Detailed price estimates for AAM are provide in section 9.5.
Issues and Concerns There are no serious concerns with this vendor’s offering. A minor issue may be the capabilities of K2Vi compared to some of the other analysis and visualisation tools available. Given increasing demand for 3D mapping technology, this is unlikely to be a negative factor and it is expected that AAM will either conduct further development work of their K2Vi tools or provide support for other viewers. The ‘environmental effect’ visualise function tool within the K2Vi virtual view environment is suitable for many applications in Land Management and Development of city areas. Using shadow analysis, users can toggle the shadow with respect to different times of the day and seasons.
5 K2Vi - http://www.aamgroup.com/services-and-technology/3d-gis
7.6 AEROmetrex
Description
AEROmetrex is an Australian company with a head office in Adelaide and local support provided by a Melbourne Office. The company is able to capture, process and produce photo-realistic, high-resolution, fully textured and geographically accurate 3D models of all man-made and natural features present in a scene. AEROmetrex use a photogrammetry approach, but applying Pictometry style data capture where many hundreds of images are collected at a range of angles from vertical to oblique to capture features from multiple angles and derive 3D models from these images. Features
Features of the technology and offering include:
3D GIS Viewer available to display and interact with complex 3D Information
in real time.18
3D models are available in common 3D formats including .obj, .3ds, 3max as
well as LiDAR LAS files.
The 3 D models can be exported to KMZ format for publishing to a web
environment.
A potential benefit in the longer term – The University of Melbourne is
undertaking research into an appropriate model for developing a 3D
Cadastre; the AEROmetrex 3D solution is being used for the research.
Demonstrations:
o Melbourne CBD http://www.youtube.com/watch?v=qObATYOSwlM
1. 18 http://aero3dpro.com.au/
15 August 2014 3D Mapping System -Discussion Paper Page | 33
o Rockhampton Rail Yard http://www.youtube.com/watch?v=vMRoLqwUZ_g
o AEROmetrex Youtube Channel: http://www.youtube.com/AEROmetrex
AEROmetrex deliverables include the following:
Supply of models in generic OBJ format. Will go into most 3D packages.
Supply of models in OSG (open scene graph) format with the AEROmetrex
free “Aeroviewer” software.
Supply of models in KMZ format to load into Google Earth. Models may be
down sampled for viewing efficiency.
Supply of models as a colourised point cloud in LAS or ASCII XYZ format.
Pricing Information removed
AEROmetrex is currently investigating a suitable web service for aero3Dpro. The Skyline products offer 3D web solutions and it is considered that this service is the most ideal.
Issues and Concerns
AEROmetrex offer most of the functions required for a complete end-to-end service. The functionality that is lacking is the lack of a hosted, cloud based capability. However,
AEROmetrex collected data could be accessed from a 3rd party cloud environment. An external hosting environment solution while not yet available is understood to be coming. There is a possible issue around access to AEROmetrex data through standard web browsers. AEROmetrex suggest a number of approaches including converting the data to KML and enabling it to be used in Google environments; using Skyline technologies and also viewing the data through the Euclidean data streaming web applications (refer to the section on Euclidean). Skyline products will be useful for the internal Council and ‘expert’ user but may not provide the required level of simple and easy to use interface necessary to support public viewing and simple navigation through a 3D model. Additionally, the ability to extract specific features (or buildings) from the data model will require some level of manual effort. This activity could be outsourced but the cost of doing this would need to be determined.
7.7 Open Source 3D Applications
The 3D spatial community is relatively immature with most products coming from the recognised vendors of the 2D spatial community. Some applications are coming from adaptions of gaming software and a few companies have developed their own applications. An alternative to proprietary software is open source. While activities are underway to develop 3D open source products, they are likely not yet at a level of commercial maturity where they could be recommended for immediate implementation.
7.8 Federation University Australia
15 August 2014 3D Mapping System -Discussion Paper Page | 34
The Centre for eCommerce and Digital Innovation (CeRDI) at the Federation University
Australia has direct experience developing interoperable spatial knowledge systems with
dynamic modelling and visualisation capabilities, which have been developed to assist
natural resource management, socioeconomic research and municipal planning.
These systems typically have the following features:
The data resides with the data managers (ensuring currency and validity)
They are intuitive to use (similar to Google Earth)
All forms of data are included - vector, raster, text and multimedia
Data downloads are allowed (subject to data manager’s consent)
Spatial data links to original source documents and images
Spatial data links to real time data (data loggers, webcams)
They are capable of analysing the interoperable data on the fly
Interactive 3D visualisations can be created for user-selected scenes
Users can add, edit or update data (subject to QA/QC)
The spatial data and models are credible to the user
The underlying software is open source and the system uses open standards (OGC).
The 3D visualisation components have been developed in conjunction with the Institute
for Future Environments at the Queensland University of Technology (QUT). The 3D
visualisation tool currently used is built on VTK (on the web server side) and uses
HTML5 web sockets for full-duplex communication between the web browser and the
web server. It requires a modern HTML5-enabled browser (Chrome 14, Firefox 6,
Internet Explorer 10, Safari 6 or Opera 12.10). Rendering is currently “hard baked” on the
server side; however development of client side rendering is proposed
An example showing the visualisation of Victoria’s ground water systems can be viewed
at http://maps.ubspatial.com.au/vvg.php?agreement=Agree+and+Continue.
CeRDI have prepared a detailed research proposal to develop online tools to support
Ballarat’s HUL program19.
Fundamental to the proposal is the HUL approach of capturing and mapping the community values, and utilising these for city management. It initially proposes developing a single, authoritative, and credible web based portal to federate HUL information, data and databases. The research project will subsequently focus on the development of civic engagement and knowledge management and planning tools, including 3D and 4D visualisations together with augmented reality experiences of past, present and future Ballarat urban landscapes.
Issues and Concerns The University may be able to develop 3D terrain mapping capability for the Council as
19
Dr Peter Dahlhaus & Dr Helen Thompson, Centre for eResearch and Digital Innovation, “Visualising Ballarat - past, present, future “, Discussion Paper, 22/07/2014
15 August 2014 3D Mapping System -Discussion Paper Page | 35
part of its research proposal, including the specific capability required by the HUL approach. OMNILINK supports the proposal and the principles it is based on. However, this offer may take some time to come to fruition and does not provide an immediate 3D mapping solution for the City of Ballarat.
7.9 Other vendors
There are a number of companies that are starting to provide technology support for the development of 3D capabilities. Many of these companies have their own technologies or leverage technologies from other vendors. Most do not provide end-to-end capabilities required to meet the Council’s needs. However, an open tender process undertaken by the City of Ballarat would not preclude responses by new or additional vendors to those outlined above.
7.10 Supplementary Tools
Depending on the choice of technology above, additional tools may be required to complete a 3D implementation. 7.10.1 Feature Manipulation Engine
The use the Feature Manipulation Engine (FME) produced by Safe Software is an option to support the conversion of the vast array of different data formats used by different 3D technologies and the different vendors of 3D mapping applications. FME now supports the conversion (and therefore integration) of over 300 data formats across spatial and non-spatial data types including GIS, CAD, raster, database, 3D, XML, point cloud, etc. The Council has a license for FME as part of its 2D GIS. The ability to translate from the formats used by third parties such as architects and others will facilitate updates to the 3D model. The translation processes can be implemented as automated workflows supporting standard translation activities. 7.10.2 Euclidean Ltd Geoverse Cloud Tools
Euclidean Ltd is a Brisbane based company specialising in managing and processing point cloud data.
It provides a number of relevant applications including:
Geoverse Massive Data Manager – to manage very large point cloud data
sets.
Geoverse Convert – supporting the compression of data to 5-20% of its original
size to facilitate web based access to large data sets.
Geoverse View – an application enabling the viewing of large data sets in near
real time regardless of the data set size. The Viewer supports the following
15 August 2014 3D Mapping System -Discussion Paper Page | 36
formats: OBJ, BIN, e57, LAS, LAZ, FLS, PTS, PLY, PTX, XYB XYZ/TXT
and LlargBin.
The Euclidean GeoVerse View could potentially provide a useful web browser based viewing tool for public access to the Council’s 3D models.
7.10.3 EarthMine
EarthMine Australia provides a 3D street level technology (similar to Pictometry) for the rapid capture of data from ground based vehicles. EarthMine users can obtain real measurements of the panoramic images such as distance, height and elevation. EarthMine provides an excellent method of supplementing aerial data collection approaches where some data is missing due to features being hidden because of building overhangs such as balconies. In the Melbourne area this application is distributed by Geomatic Technologies. EarthMine has been used successfully by the City of Melbourne to enhance its street level views within its 3D model environment. Some approximate costing and related details are listed below:
Costed at (pricing removed) (linear road network).
Initial server access fee – (pricing removed)
Initial on-boarding fee – (pricing removed).
Accuracy: 2 – 50 cm (depending on use).
Capture: 80-90km/ delivered c/w up to 120km/day captured.
Approximately one month required to complete a processed data set.
Can be integrated with LiDAR – this is necessary to capture e levated
objects such as overhead wires.
Some council help partly justify cost by highlighting ARRB saving by using the
data that is captured to help tag cracks.
Typically the data is produced for desktop clients such as ArcGIS desktop,
Flex Viewer, Earthmine viewer, AutoCAD Map3D Pro.
Uses flash for web services.
Data centres – Primus, King St, Melbourne. Interactive, Port Melbourne.
Best suited to ESRI – CityViewer GUI.
7.10.4 CSIRO Zebedee20
Zebedee is a LiDAR technology handheld mapping system that can build a 3D point cloud in real time and in areas that may otherwise be inaccessible. It is suitable for 3D mapping applications in indoor, underground and outdoor environments. It offers a combination of portability, efficient data collection, accuracy in areas with no GPS, rapid
20http://www.csiro.au/Organisation-Structure/Divisions/Computational-Informatics/Zebedee-3D-mapping.aspx

15 August 2014 3D Mapping System -Discussion Paper Page | 37
scanning of large areas, and automatic data processing. The technology is expected to have many potential applications in Forestry, Mining, Emergency Services, Security and Manufacturing.
Some of the features of the Zebedee system are:
Raw data is captured by walking around the site with a hand held spring loaded device.
Once captured the raw data is uploaded to a commercial site for processing and output returned as a geo-referenced point cloud (.laz/.las or ply formats).
Geo-referencing is to a local coordinate system with origin at the position of the scanner head at the survey start, however it can be transferred into a known coordinate system using supplied post processing software.
Accuracy is in the order of 5 mm, although “noise” on flat surfaces of up to 30 mms can occur.
The technology is commercially available as ZEB1 through 3D Laser Mapping.
This technology may be a useful supplement to a 3D mapping system. It could be used to for example in indoor or underground environments, or to record changes to cultural and heritage sites by regularly creating 3D point clouds.
Use of the technology would involve:
Purchase of capture hardware including hand held device – Approximate cost (pricing removed).
Processing of raw data by a commercial “pay-as-you-go” service using a credit system.
Viewing of point cloud data by free viewers; or by importing into other proprietary 3D mapping systems.
7.10.5 ESRI ArcGIS Online The latest release of ArcGIS Online added the CityEngine Web Viewer, a new application that lets users explore 3D city scenes in a web browser built within the CityEngine desktop application. This application does not require a plugin for most browsers to view 3D scenes as it uses HTML 5 WebGL technology. According to ESRI, CityEngine delivers a full suite of industry-leading procedural tools to aggregate geospatial data, layout and edit street networks, generate and modify buildings, create 3D road profiles and distribute street furniture, control the shape of the skyline, and analyse urban planning projects.
CityEngine scenes can be published directly on the web for sharing 3D models, analysis results, or design proposals with decision makers or the public. City Engine provides easy-to-use editing tools for quick sketching and texturing of 3D models (e.g. multipatch). These tools include the ability for users to create a new building, extrude this building manually, move, scale, rotate, separate walls and texture individual faces. The key benefit is that the resultant 3D geometries can be efficiently saved to the Council’s existing enterprise geodatabase. City Engine can directly import the following file formats: Esri File Geodatabase, Wavefront OBJ, Autodesk FBX,
15 August 2014 3D Mapping System -Discussion Paper Page | 38
Autodesk 3DS, Collada DAE, Keyhole KMZ / KML, City Engine Web Scene (3ws),
Renderman RIB, and Mentalray MI.
For an example of a public facing city plan for Townsville, see: http://www.youtube.com/v/9Sbuh3A6T4A To summarise, CityEngine provides alternative tools for modelling, including the ability to import spectrometry and photogrammetry, for publishing as 3D models for use within the CityEngine 3D Viewer. The viewer is freely available to the public however the administrator requires an online account to publish the 3D model. This is an example of providing increased viewing and analysing capability without the use of desktop software.
7.11 Discussion Outcomes
SKYLINEGLOBE – provides a good high end 3D application which meets many of the Council’s internal requirements as well as data. Web browser tool is not ideal as it currently requires a downloadable plug-in.
GOOGLE - Widely used tools but native data is poor quality and emphasis is on marketing rather than spatial technology.
CITYSERVER3D – provides highly functional and interoperable high end application as well as a web browser viewing application (without a plug in); however data has to be sourced separately and local support is not currently available.
AAM GROUP (AAM) offers a complete ‘end-to-end’ technology providing data capture and processing capabilities, the capture and management of 3D data, as well as high end and browser based visualisation systems.
AEROMETREX provides very high quality data and a good high end user application, but 3D web browser tool for general council and public use is still under development.
FEDERATION UNIVERSITY has proposed to work with the City of Ballarat to develop a HUL portal for the federation of heritage related databases and information. Further work could then be undertaken to develop a 3D mapping capability based on interoperability principles and open source software. While this is a sound strategy it does not provide a commercial 3D solution in the short term.
New vendors may respond to a tender process as the 3D technology is developing rapidly.
Additional tools may be required to supplement a 3D implementation such as FME, Euclidean Geoverse Cloud Tools, EarthMine, Zebedee or ArcGIS Online.
15 August 2014 3D Mapping System -Discussion Paper Page | 39
8 Application Architecture 8.1 Introduction
The elements required to establish an architecture that meets the requirements identified by the Council are described in general terms below. Additionally, there is a brief description of the different types of users that are likely to access this capability. The description of different user categories is included to provide context for some of the architectural directions suggested.
8.2 Classification of Users
The visualisation of 3D models and associated data is complex. Possible solutions should be based on the level of interest and need for 3D information and also on the skill levels and technical capabilities of the potential users. In general terms users can be divided into two separate groups.
These consist of:
Casual users – this group would include the general public and also people within organisations who simply wished to ‘see’ what something looks like in a realistic context. Such a user will require a very simple and easy to use (intuitive) interface and with minimal technical functionality required. ‘Simple’ functionality such as locate a feature, zoom, pan, ‘stroll through’ a model would be required. It is unlikely that this user would be interested in downloading any application to view the 3D data. Therefore, a capability is required that is supported by common desktop web browsing applications.
Business and Technical users – these users would be accessing 3D capabilities for a specific purpose relating to their work or research needs. Such users would most likely have higher skill levels than the general public and therefore be capable of operating applications with much greater functionality (and therefore complexity). These users would generally have their own specific tools and applications to undertake their work such as GIS, CAD or gaming 3D technologies. It is also more likely that such users would be willing to download an application to help with their viewing or analysis of the 3D data.
Administrative users – the users perform administration control functions
ensure the 3D System functions properly for other users.
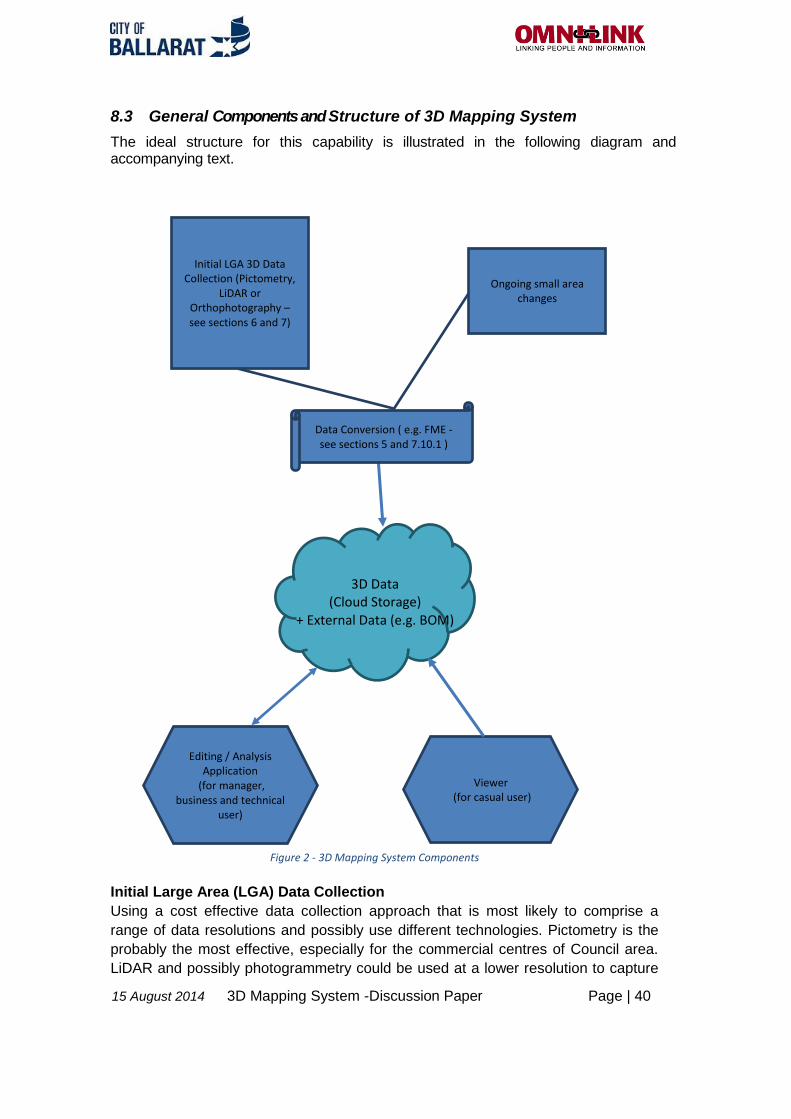
15 August 2014 3D Mapping System -Discussion Paper Page | 40
8.3 General Components and Structure of 3D Mapping System
The ideal structure for this capability is illustrated in the following diagram and accompanying text.
Initial Large Area (LGA) Data Collection
Using a cost effective data collection approach that is most likely to comprise a
range of data resolutions and possibly use different technologies. Pictometry is the
probably the most effective, especially for the commercial centres of Council area.
LiDAR and possibly photogrammetry could be used at a lower resolution to capture
3D Data (Cloud Storage)
+ External Data (e.g. BOM)
Data Conversion ( e.g. FME - see sections 5 and 7.10.1 )
Initial LGA 3D Data Collection (Pictometry,
LiDAR or Orthophotography – see sections 6 and 7)
Ongoing small area changes
Editing / Analysis Application
(for manager, business and technical
user)
Viewer (for casual user)
Figure 2 - 3D Mapping System Components
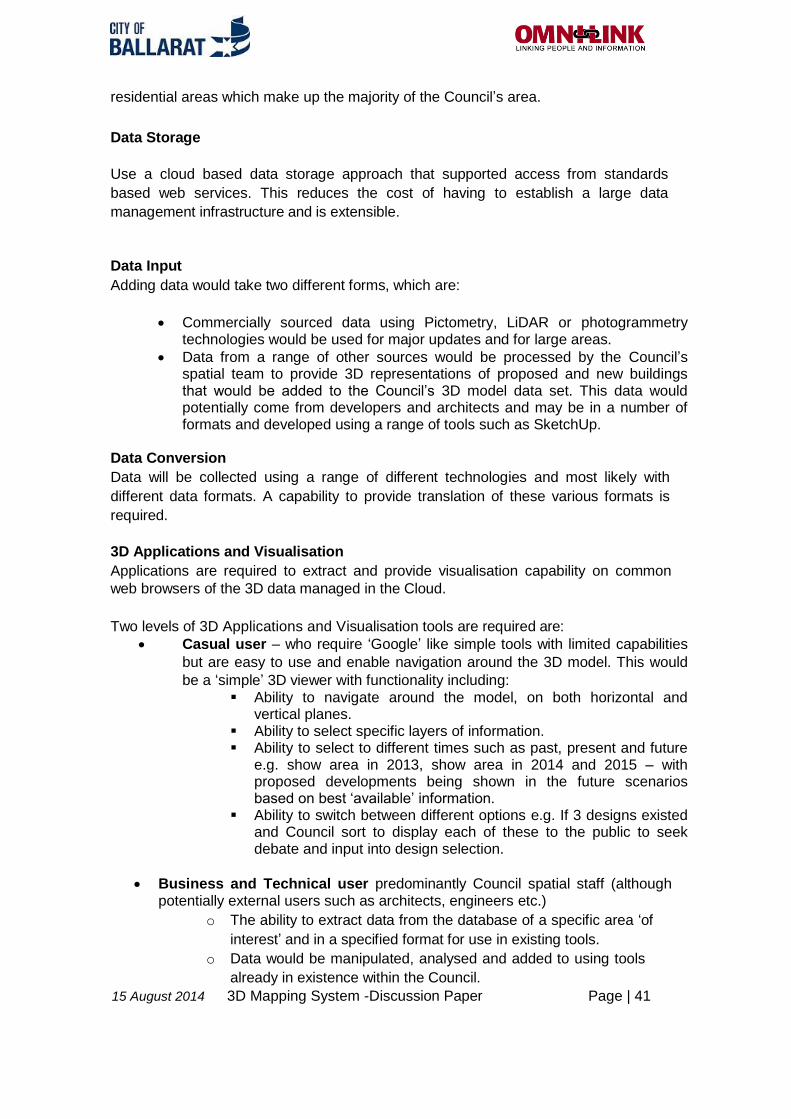
15 August 2014 3D Mapping System -Discussion Paper Page | 41
residential areas which make up the majority of the Council’s area.
Data Storage
Use a cloud based data storage approach that supported access from standards
based web services. This reduces the cost of having to establish a large data
management infrastructure and is extensible.
Data Input
Adding data would take two different forms, which are:
Commercially sourced data using Pictometry, LiDAR or photogrammetry technologies would be used for major updates and for large areas.
Data from a range of other sources would be processed by the Council’s spatial team to provide 3D representations of proposed and new buildings that would be added to the Council’s 3D model data set. This data would potentially come from developers and architects and may be in a number of formats and developed using a range of tools such as SketchUp.
Data Conversion
Data will be collected using a range of different technologies and most likely with
different data formats. A capability to provide translation of these various formats is
required.
3D Applications and Visualisation
Applications are required to extract and provide visualisation capability on common
web browsers of the 3D data managed in the Cloud.
Two levels of 3D Applications and Visualisation tools are required are:
Casual user – who require ‘Google’ like simple tools with limited capabilities
but are easy to use and enable navigation around the 3D model. This would
be a ‘simple’ 3D viewer with functionality including:
Ability to navigate around the model, on both horizontal and vertical planes.
Ability to select specific layers of information. Ability to select to different times such as past, present and future
e.g. show area in 2013, show area in 2014 and 2015 – with proposed developments being shown in the future scenarios based on best ‘available’ information.
Ability to switch between different options e.g. If 3 designs existed and Council sort to display each of these to the public to seek debate and input into design selection.
Business and Technical user predominantly Council spatial staff (although potentially external users such as architects, engineers etc.)
o The ability to extract data from the database of a specific area ‘of
interest’ and in a specified format for use in existing tools.
o Data would be manipulated, analysed and added to using tools
already in existence within the Council.
15 August 2014 3D Mapping System -Discussion Paper Page | 42
8.4 Discussion Outcomes
9 Proposed Roadmap and Recommendations 9.1 Introduction
The City of Ballarat’s Coordinator of Heritage Strategy advises priorities for a 3D Mapping System are that it:
• Is interoperable - allowing the integration of multiple data sources. • Is future proof - not tied to a long term contract, licences or proprietary
technology and endeavours to anticipate future technology directions. • Provides scenario modelling functionality (short, medium, long-term) e.g new
development proposals, strategic planning (height increase across large areas), climate change, etc.
• Provides visualisation functionality and thematic mapping capability. • Has current 3D data models.
OMNILINK has identified 3 suitable technologies that will provide a sound foundation tool to meet Council 3D mapping requirements, including Historic Urban Landscape management. The ability to have a consistent view of the landscape in 3 dimensions will be valuable in impact assessment of proposals on historic landscapes. Historical landscape views can also be developed from existing aerial photography dating back to 1934 and displayed on contemporary 3D systems. Other valuable current functionality includes view line analysis, shadow analysis and ‘fly throughs’. 3D mapping technology is still developing and not yet mature, and it is likely that a single system that will meet all of Council’s requirements is not available. For example, the requirements for software interoperability and crowd sourcing capability will not be met by current propriety systems. As technology matures more functionality will become available. This includes advanced community engagement functions such as the ability for client browsers to render buildings, to sketch suggested alternatives to proposals, to capture map layers including cultural or cognitive data, and to enable other participatory decision making tools. In the interim, the recommended approach is to capture desired information within the GIS as 2D layers, and display these in the 3D system by draping them over the 3D models. The recommendations are ranked in the most likely order of suitability, based on an initial scan of the current 3D market place. Any commitment to these recommendations should be subject to appropriate due diligence by the Council. Additionally, in OMNILINK’s
Users of 3D systems may be categorised into (1) Casual Users requiring a 3D viewing tool, and (2) Business or Technical Users requiring an editing and analysis application.
Key features and components of a 3D mapping capability are Initial LGA Data Collection, Cloud Storage of Data, Data Update capacity, Data Conversion engine and separate applications for viewing and editing/analysis.
15 August 2014 3D Mapping System -Discussion Paper Page | 43
view, a tender process should not preclude any other option from being successful. As discussed earlier, an alternative approach to implementing proprietary solutions is to pursue the research and development opportunity offered by the Federation University Australia. This initially involves developing a portal for federating HUL information and databases; but could be subsequently directed to build a 3D Mapping capability built on open source software and the acquisition of fully textured 3D models in an interoperable format such as CItyGML.
9.2 Option 1 - AAM
AAM can provide a number of the end-to-end capabilities but would require some additional (external) applications to provide a fully functional 3D capability to meet the requirements of the Council. AAM sourced capabilities comprising:
Pictometry data capture – extent of high and low resolution image capture
would need to be determine based on need and budget availability with high
resolution capture across both Council areas most likely beyond the projects
budget.
The AAM technologies would be linked through web services to the existing Council spatial systems that would require some upgrading to add the 3D capabilities that are available through their existing GIS vendor’s applications. Summary
Provides an end to end solution – 3D data, high end application, web browser for general users.
Provides future proofing as AAM is a major 3D systems and data provider and has a strong presence servicing local government across Australia.
Also likely to keep developing its applications products.
Good level of data interoperability with further extension by the use of FME.
Lack of software interoperability as it is proprietary system; changes to software changes can only be made through AAM.
9.3 Option 2 - AEROmetrex
The AEROmetrex option would be very similar in ‘composition’ to the AAM option. AEROmetrex would collect the data using their photogrammetry-based technologies and provide a number of tools to support the management and visualisation. AEROmetrex also do not provide a cloud facility but such a facility could be selected from the numerous offerings available in Australia, or perhaps using the FME Cloud service.
Summary
Provides very high quality and realistic data with good high end application.
15 August 2014 3D Mapping System -Discussion Paper Page | 44
Lacks a web browser for general users, and a cloud service for storage. (Potentially these could be provided by 3rd parties.)
Good level of data interoperability with further extension by the use of FME.
Lack of software interoperability as it is proprietary system; changes to software changes can only be made by AEROmetrex.
Aerometrex has a strong presence servicing local government across Australia, and is likely to keep developing its application products.
9.4 Option 3 - CityServer3D
The CityServer3D application provides a level of functionality not available through the first two options. However, there is still a requirement to collect the main 3D data set using what was considered the most effective technology. Once collected though, the CityServer3D application will provide the necessary tools to meet most of Council’s requirements. However, a key issue is the lack of support with earlier versions of Microsoft’s Internet Explorer due to the inability of earlier versions to support WebGL. Costs of CityServer3D are relatively low and its interoperability capabilities are strong. Data will have to be sourced separately for this option; it is envisaged it would be sourced from the best and most cost effective local provider. This could include AAM or AEROmetrex. It is understood that the Fraunhofer Institute may respond to a request for tender if they are invited to. Summary
Provides a highly functional high end application and web browser for general users.
Does not include 3D data acquisition would need to be sourced separately
CityServer3D is a well-established product in Europe, and is likely to keep developing its applications products
Good level of data interoperability with further extension by the use of FME.
Lack of software interoperability as it is proprietary system; changes to software changes can only be made by the German Fraunhofer Institute.
Lacks local support at this stage.
9.5 Costing Summary
The cost estimates are based on general discussions with the vendors and will need to be tested through a tender process. 9.5.1 Data Capture Extent A key issue determining the price of 3D data and the overall implementation cost, is the determination of the resolution of the 3D models. In simple terms, users have a more realistic experience with higher resolution data; but the higher the resolution the greater the data capture costs. There are varying perceptions of the requirements for data coverage, as indicated by
15 August 2014 3D Mapping System -Discussion Paper Page | 45
the response to an online survey of data coverage priorities (See Appendix B section 12.4). An initial estimate - provided by Council’s Project Control Group (PCB) - is 15 square kilometres of high resolution and 34 square kilometres of medium resolution capture. Further review, analysis and discussion within Council is required and may result in a different breakdown of coverage extents; however the initial estimate is used to give indicative prices for the recommended solutions below. 9.5.2 K2Vi Hosted Solution – AAM Pricing removed
9.5.3 AEROmetrex Pricing removed Additional costs will be incurred to support the capabilities not provided by AEROmetrex, such as cloud storage and visualisation tools. AEROmetrex can provide the data at a high level of quality but not the ancillary tools to provide a fully functional 3D capability. Additional implementation costs may be incurred if older PC’s require hardware and software upgrades, and training will be required for high end software (external) and 3D viewing software (in-house) In a later conversation, AEROmetrex indicated that there data capture costs for the proposed high resolution/low resolution breakdown would be significantly lower than the range indicated above. They also indicated costs vary for a particular specified Level of Detail depending on the density of features. For example LOD3 over a rural area will be cheaper than LOD3 over a suburban area. A final price in the range pricing removed to pricing reomved is possible; however AEROmetrex cannot be more definite or precise until they see a detailed specification.
9.5.4 Ongoing Support Resources Once the initial 3D models are captured and the 3D System is implemented, the data can be kept up to date by adding new 3D models for individual developments if these are provided by developers (e.g. for multi-storey larger building developments). OMNILINK suggests that once the new system is operational a 0. 5 FTE staff member will be required to manage the system, update the 3D model database with additional 3D building/developments, and perform specialist analysis. Ongoing funding for additional data capture may also be required. For example, new data models for a green-field residential estate may be needed once development has completed.
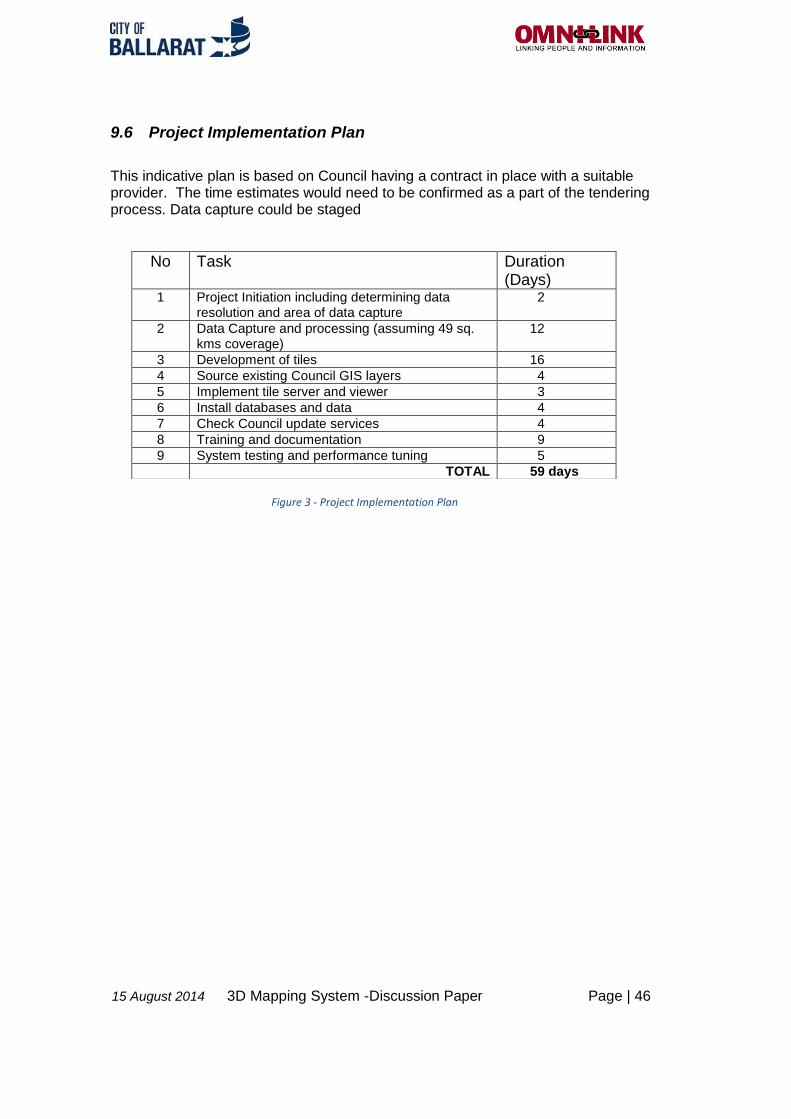
15 August 2014 3D Mapping System -Discussion Paper Page | 46
9.6 Project Implementation Plan
This indicative plan is based on Council having a contract in place with a suitable provider. The time estimates would need to be confirmed as a part of the tendering process. Data capture could be staged
No Task Duration (Days)
1 Project Initiation including determining data resolution and area of data capture
2
2 Data Capture and processing (assuming 49 sq. kms coverage)
12
3 Development of tiles 16
4 Source existing Council GIS layers 4
5 Implement tile server and viewer 3
6 Install databases and data 4
7 Check Council update services 4
8 Training and documentation 9
9 System testing and performance tuning 5
TOTAL 59 days
Figure 3 - Project Implementation Plan
15 August 2014 3D Mapping System -Discussion Paper Page | 47
10 Appendix 1 – Formats and Standards
10.1 3D Standards
10.1.1 CityGML21 CityGML is a common information model and XML-based encoding for the representation, storage, and exchange of virtual 3D city and landscape models. CityGML provides a standard model and mechanism for describing 3D objects with respect to their geometry, topology, semantics and appearance, and defines five different levels of detail. Included are also generalization hierarchies between thematic classes, aggregations, relations between objects, and spatial properties. CityGML is highly scalable and datasets can include different urban entities supporting the general trend toward modeling not only individual buildings but also whole sites, districts, cities, regions, and countries. CityGML has been implemented in many software solutions and is in use in many projects around the world. In National Spatial Data Infrastructure programs in the Netherlands, Germany, France, Malaysia, Abu Dhabi and other countries, CityGML provides an important platform for the transition from 2D to 3D data. It also plays an important role in bridging Urban Information Models with Building Information Models (BIM) to improve interoperability among information systems used in the design, construction, ownership and operation of buildings and capital projects. Because CityGML is based on GML, it can be used with the whole family of GML compatible OGC web services for data accessing, processing, and cataloging like the Web Feature Service, Web Processing Service, and the Catalog Service. CityGML is an open standard that can be used free of charge. CityGML provides open encoding for representation, storage, and exchange of virtual 3D city and landscape models. CityGML supports modelling not only individual buildings but also whole sites, districts, cities, regions, and countries. It allows users to share virtual 3D city and landscape models for sophisticated analysis and display tasks Several free viewers are available for CityGML, including LandXplorer, Aristotles, 3DGIS cityvu and libcitygml. Planning is underway for the development of the next version - CityGML 3 and also work is being undertaken to provide links to the BIM data models being established. 10.1.2 IFC - Industry Foundation Classes IFC forms a data model for describing building and construction industry data. The IFC specification is a neutral and open data model intended to facilitate interoperability and overcome the problems associated with proprietary formats.
21
http://www.citygml.org/index.php?id=1523
15 August 2014 3D Mapping System -Discussion Paper Page | 48
10.1.3 COLLADA COLLADA is an approved ISO standard (ISO/PAS 17506:2012) for use in 3D visualization. COLLADA is a Collaborative Design Activity that defines an XML-based schema to enable 3D authoring applications to freely exchange digital assets without loss of information, enabling multiple software packages to be combined into extremely powerful tool chains. It is relevant to those who import to or export from digital content creation (DCC) applications, 3D interactive applications and tool chains, prototyping tools, real-time visualization applications such as those used in the video game and movie industries, and CAD tools. ISO/PAS 17506:2012 covers the initial design and specifications of the COLLADA schema, as well as a minimal set of requirements for COLLADA exporters. 10.1.4 Related OGC Standards22 The OGC standards baseline comprises more than 30 standards, including:
• CSW - Catalog Service for the Web: access to catalog information. • GML - Geography Markup Language: XML-format for geographical information. • GeoXACML - Geospatial eXtensible Access Control Markup Language (as of
2009 in the process of standardization). • KML - Keyhole Markup Language: XML-based language schema for expressing
geographic annotation and visualization on existing (or future) Web-based, two-dimensional maps and three-dimensional Earth browsers.
• OGC Reference Model - a complete set of reference models. • OWS - OGC Web Service Common. • SOS - Sensor Observation Service. • SPS - Sensor Planning Service. • SensorML - Sensor Model Language. • SFS - Simple Features – SQL. • Styled Layer Descriptor (SLD). • WCS - Web Coverage Service: provides access, sub setting, and processing on
coverage objects. • WCPS - Web Coverage Processing Service: provides a raster query language for
ad-hoc processing and filtering on raster coverages. • WFS - Web Feature Service: for retrieving or altering feature descriptions. • WMS - Web Map Service(WMS): provides map images. • WMTS - Web Map Tile Service: provides map image tiles. • WPS - Web Processing Service: remote processing service. • GeoSPARQL - Geographic SPARQL Protocol and RDF Query Language
representation and querying of geospatial data for the Semantic Web.
22
http://en.wikipedia.org/wiki/Open_Geospatial_Consortium
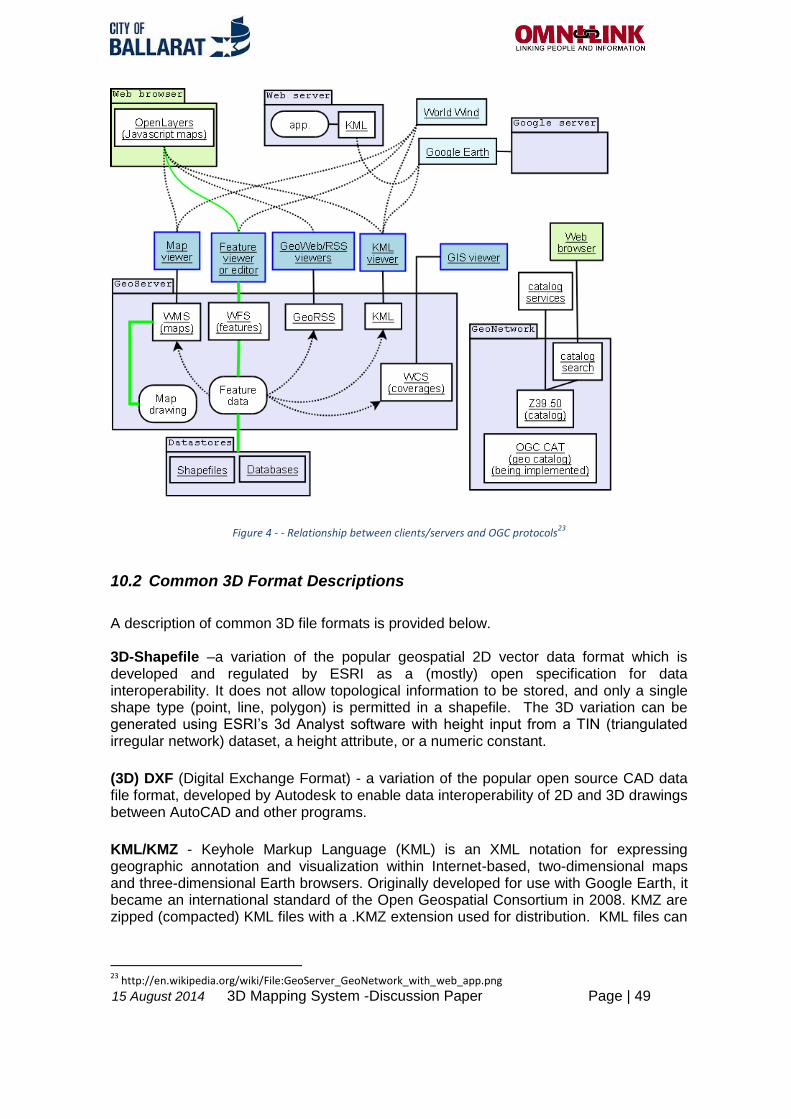
15 August 2014 3D Mapping System -Discussion Paper Page | 49
Figure 4 - - Relationship between clients/servers and OGC protocols23
10.2 Common 3D Format Descriptions
A description of common 3D file formats is provided below. 3D-Shapefile –a variation of the popular geospatial 2D vector data format which is developed and regulated by ESRI as a (mostly) open specification for data interoperability. It does not allow topological information to be stored, and only a single shape type (point, line, polygon) is permitted in a shapefile. The 3D variation can be generated using ESRI’s 3d Analyst software with height input from a TIN (triangulated irregular network) dataset, a height attribute, or a numeric constant.
(3D) DXF (Digital Exchange Format) - a variation of the popular open source CAD data file format, developed by Autodesk to enable data interoperability of 2D and 3D drawings between AutoCAD and other programs.
KML/KMZ - Keyhole Markup Language (KML) is an XML notation for expressing geographic annotation and visualization within Internet-based, two-dimensional maps and three-dimensional Earth browsers. Originally developed for use with Google Earth, it became an international standard of the Open Geospatial Consortium in 2008. KMZ are zipped (compacted) KML files with a .KMZ extension used for distribution. KML files can
23
http://en.wikipedia.org/wiki/File:GeoServer_GeoNetwork_with_web_app.png
15 August 2014 3D Mapping System -Discussion Paper Page | 50
display 3D models using the interactive 3D Applications interchange file format COLLADA.
3D PDF – The widely used Portable Document Format represents documents in a manner independent of application software, hardware, and operating systems. It can support 3D models using the Universal 3D (U3D), a compressed file format standard for 3D computer graphics data. 3D PDF files can be interactively visualized by Acrobat Reader (since version 7). 3DS (3D Studio) - 3DS is a file format used by the Autodesk 3ds Max 3D modelling, animation and rendering software. It was the native file format of the old Autodesk 3D Studio DOS (releases 1 to 4), which was popular until its successor (3D Studio MAX 1.0) replaced it in April 1996. Having been around since 1990 (when the first version of 3D Studio DOS was launched), it has grown to become a de facto industry standard for transferring models between 3D programs, or for storing models for 3D resource catalogues .
GML3 - Geography Markup Language 3 (GML3) is an extendible international standard for spatial data exchange issued by the OGC and the ISO TC211. It uses XML grammar for expressing spatial features.
X3D - X3D is a royalty-free ISO standard XML-based file format for representing 3D computer graphics. It is successor to the Virtual Reality Modelling Language (VRML).[1] X3D features extensions to VRML (e.g. CAD, Geospatial, Humanoid animation, NURBS etc.), the ability to encode the scene using an XML syntax as well as the Open Inventor-like syntax of VRML97, or binary formatting, and enhanced APIs.
VRML - Virtual Reality Modelling Language originally known as the Virtual Reality Markup Language is a standard file format for representing 3-dimensional (3D) interactive vector graphics, designed particularly with the World Wide Web in mind. It has been superseded by X3D.
GeoVRML - is a an extension to VRML supporting geographic applications that enable geo-referenced data, such as maps and 3-D terrain models, to be viewed over the web by a user with a standard VRML plugin for their web browser. ESRI Multipatch24 - The multipatch data format, a geographic information system (GIS industry standard developed by ESRI in 1997, is a geometry used as a boundary representation for 3D objects. A collection that can be made up of triangle strips, triangle fans, triangles, or rings, multipatch features can be used to construct 3D features in ArcGIS®, save existing data, and exchange data with other non-GIS 3D software packages such as Collaborative Design Activity (COLLADA) and SketchUp®. Siemens’ JT™ Data Format – Building Sector Format - This is a lightweight data format that makes it possible to view and share digital 3D product information in real-time. ISO has approved it as an International Standard. JT enhances collaboration by enabling manufacturers to move 3D product data seamlessly and instantly among the large number of computer-aided design (CAD) and product lifecycle management (PLM)
24
ESRI Multipatch - http://www.esri.com/library/whitepapers/pdfs/multipatch-geometry-type.pdf

15 August 2014 3D Mapping System -Discussion Paper Page | 51
software applications supporting the standard. With its acceptance as the world’s first ISO International Standard for lightweight 3D visualization, JT enables manufacturers to free themselves from dependence on vendor’s proprietary formats and more easily extend the use of 3D visualization and collaboration throughout their business.

15 August 2014 3D Mapping System -Discussion Paper Page | 52
11 Appendix 2 - Online Survey results
An online survey was prepared and made available to Council staff, as a means of capturing any additional input from those who attended the workshop or interviews, as well as those who could not attend either. The survey outcomes are supplementary to the outcomes of the workshop and interviews; they do not represent the broad view of council staff due the surveys limited participation.
11.1 Participants
Participants indicated the:
Coordinator Design and Development.
Coordinator Strategic Land Use Planning.
EM & FC.
Financial Operations Manager.
GIS Admin.
Health & Wellbeing Planner.
Health Services Officer.
Landscape Architect.
Place Names Officer.
Planning Strategy and Design Administration Officer.
Project Manager.
Strategic Planner.
Vegetation Planning Officer.
11.2 Perceived Benefits of 3D Mapping Systems
Participants in the online survey assigned identified benefits the following importance:
High
Benefit Occasional Benefit
No Benefit
Total Responses
Planning approval decision making 50% 40% 10% 10 Community consultation and communication
66% 33% 12
Marketing Council proposals 64% 18% 18% 11 Providing a single authoritative view of the city
20% 60% 20% 10
Historic Urban Landscape (HUL) functionality
40% 50% 10% 10
Strategic Planning tool 50% 30% 20% 10
Design benefit 100% 1 Open space planning 100% 1
Power line and vegetation management 100% 1 Tree Risk analysis 100% 1
Tree canopy cover and health analysis 100% 1 Property Valuation 100% 1
Figure 5 - Online survey rating of perceived benefits to participants work areas
Additional comments made in the online survey on benefits are:
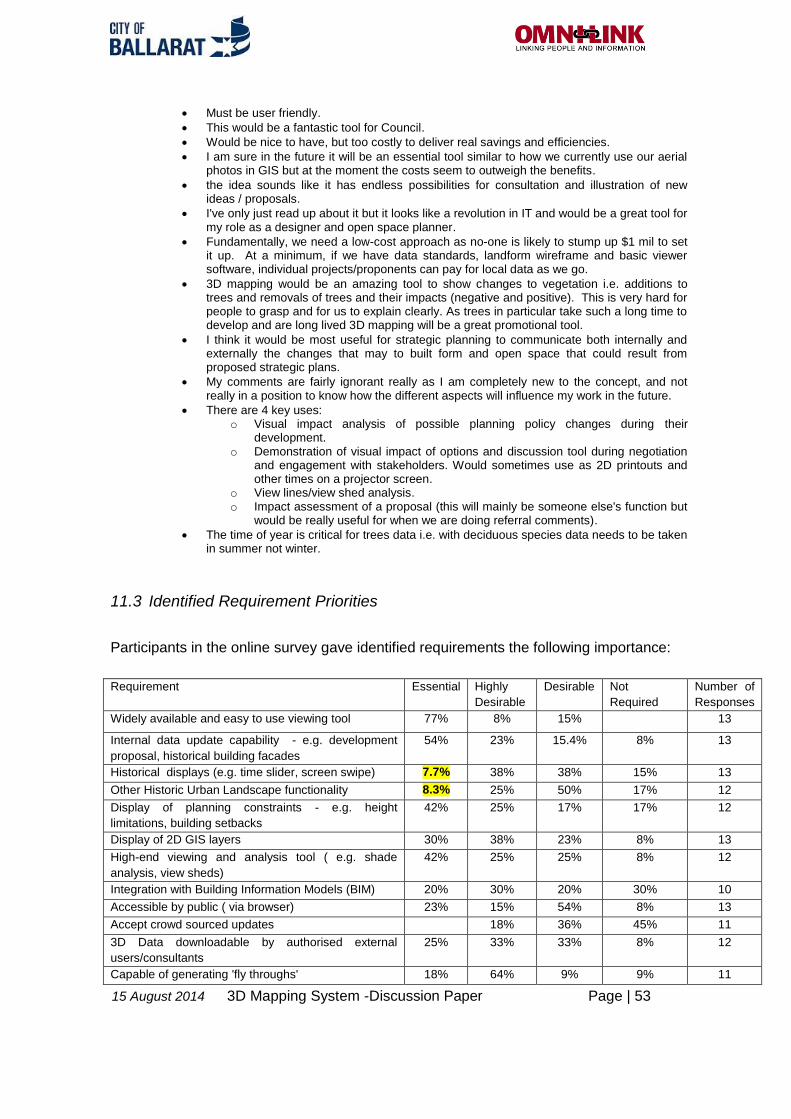
15 August 2014 3D Mapping System -Discussion Paper Page | 53
Must be user friendly.
This would be a fantastic tool for Council.
Would be nice to have, but too costly to deliver real savings and efficiencies.
I am sure in the future it will be an essential tool similar to how we currently use our aerial photos in GIS but at the moment the costs seem to outweigh the benefits.
the idea sounds like it has endless possibilities for consultation and illustration of new ideas / proposals.
I've only just read up about it but it looks like a revolution in IT and would be a great tool for my role as a designer and open space planner.
Fundamentally, we need a low-cost approach as no-one is likely to stump up $1 mil to set it up. At a minimum, if we have data standards, landform wireframe and basic viewer software, individual projects/proponents can pay for local data as we go.
3D mapping would be an amazing tool to show changes to vegetation i.e. additions to trees and removals of trees and their impacts (negative and positive). This is very hard for people to grasp and for us to explain clearly. As trees in particular take such a long time to develop and are long lived 3D mapping will be a great promotional tool.
I think it would be most useful for strategic planning to communicate both internally and externally the changes that may to built form and open space that could result from proposed strategic plans.
My comments are fairly ignorant really as I am completely new to the concept, and not really in a position to know how the different aspects will influence my work in the future.
There are 4 key uses: o Visual impact analysis of possible planning policy changes during their
development. o Demonstration of visual impact of options and discussion tool during negotiation
and engagement with stakeholders. Would sometimes use as 2D printouts and other times on a projector screen.
o View lines/view shed analysis. o Impact assessment of a proposal (this will mainly be someone else's function but
would be really useful for when we are doing referral comments).
The time of year is critical for trees data i.e. with deciduous species data needs to be taken in summer not winter.
11.3 Identified Requirement Priorities
Participants in the online survey gave identified requirements the following importance:
Requirement Essential Highly
Desirable
Desirable Not
Required
Number of
Responses
Widely available and easy to use viewing tool 77% 8% 15% 13
Internal data update capability - e.g. development
proposal, historical building facades
54% 23% 15.4% 8% 13
Historical displays (e.g. time slider, screen swipe) 7.7% 38% 38% 15% 13
Other Historic Urban Landscape functionality 8.3% 25% 50% 17% 12
Display of planning constraints - e.g. height
limitations, building setbacks
42% 25% 17% 17% 12
Display of 2D GIS layers 30% 38% 23% 8% 13
High-end viewing and analysis tool ( e.g. shade
analysis, view sheds)
42% 25% 25% 8% 12
Integration with Building Information Models (BIM) 20% 30% 20% 30% 10
Accessible by public ( via browser) 23% 15% 54% 8% 13
Accept crowd sourced updates 18% 36% 45% 11
3D Data downloadable by authorised external
users/consultants
25% 33% 33% 8% 12
Capable of generating 'fly throughs' 18% 64% 9% 9% 11
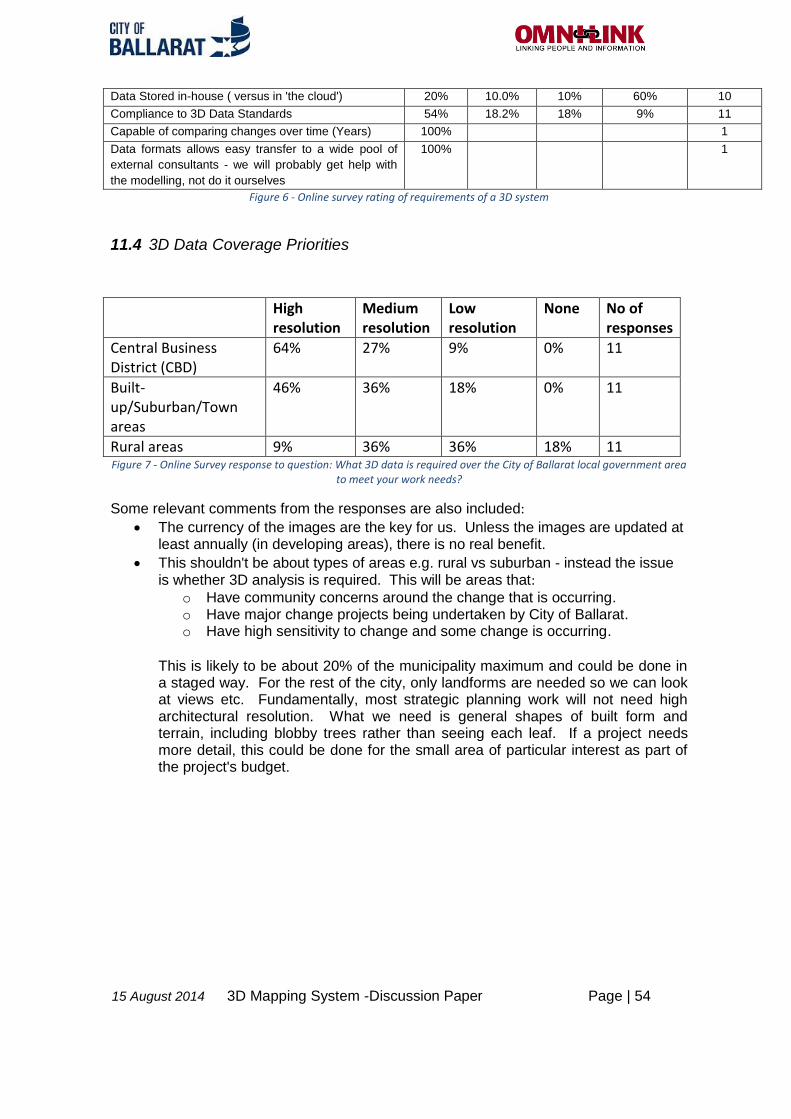
15 August 2014 3D Mapping System -Discussion Paper Page | 54
Data Stored in-house ( versus in 'the cloud') 20% 10.0% 10% 60% 10
Compliance to 3D Data Standards 54% 18.2% 18% 9% 11
Capable of comparing changes over time (Years) 100% 1
Data formats allows easy transfer to a wide pool of
external consultants - we will probably get help with
the modelling, not do it ourselves
100% 1
Figure 6 - Online survey rating of requirements of a 3D system
11.4 3D Data Coverage Priorities
High resolution
Medium resolution
Low resolution
None No of responses
Central Business District (CBD)
64% 27% 9% 0% 11
Built-up/Suburban/Town areas
46% 36% 18% 0% 11
Rural areas 9% 36% 36% 18% 11 Figure 7 - Online Survey response to question: What 3D data is required over the City of Ballarat local government area
to meet your work needs?
Some relevant comments from the responses are also included:
The currency of the images are the key for us. Unless the images are updated at least annually (in developing areas), there is no real benefit.
This shouldn't be about types of areas e.g. rural vs suburban - instead the issue is whether 3D analysis is required. This will be areas that:
o Have community concerns around the change that is occurring. o Have major change projects being undertaken by City of Ballarat. o Have high sensitivity to change and some change is occurring.
This is likely to be about 20% of the municipality maximum and could be done in a staged way. For the rest of the city, only landforms are needed so we can look at views etc. Fundamentally, most strategic planning work will not need high architectural resolution. What we need is general shapes of built form and terrain, including blobby trees rather than seeing each leaf. If a project needs more detail, this could be done for the small area of particular interest as part of the project's budget.
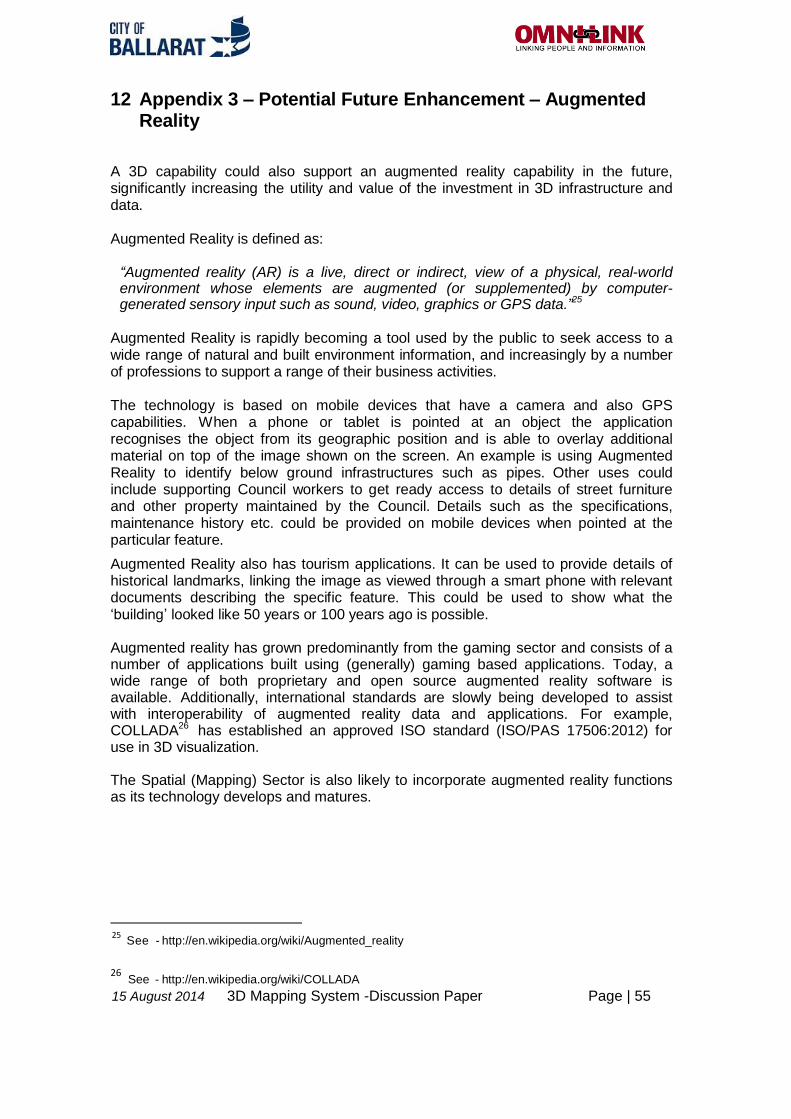
15 August 2014 3D Mapping System -Discussion Paper Page | 55
12 Appendix 3 – Potential Future Enhancement – Augmented Reality
A 3D capability could also support an augmented reality capability in the future, significantly increasing the utility and value of the investment in 3D infrastructure and data. Augmented Reality is defined as: “Augmented reality (AR) is a live, direct or indirect, view of a physical, real-world environment whose elements are augmented (or supplemented) by computer- generated sensory input such as sound, video, graphics or GPS data.”25
Augmented Reality is rapidly becoming a tool used by the public to seek access to a wide range of natural and built environment information, and increasingly by a number of professions to support a range of their business activities. The technology is based on mobile devices that have a camera and also GPS capabilities. When a phone or tablet is pointed at an object the application recognises the object from its geographic position and is able to overlay additional material on top of the image shown on the screen. An example is using Augmented Reality to identify below ground infrastructures such as pipes. Other uses could include supporting Council workers to get ready access to details of street furniture and other property maintained by the Council. Details such as the specifications, maintenance history etc. could be provided on mobile devices when pointed at the particular feature.
Augmented Reality also has tourism applications. It can be used to provide details of historical landmarks, linking the image as viewed through a smart phone with relevant documents describing the specific feature. This could be used to show what the ‘building’ looked like 50 years or 100 years ago is possible. Augmented reality has grown predominantly from the gaming sector and consists of a number of applications built using (generally) gaming based applications. Today, a wide range of both proprietary and open source augmented reality software is available. Additionally, international standards are slowly being developed to assist with interoperability of augmented reality data and applications. For example, COLLADA26 has established an approved ISO standard (ISO/PAS 17506:2012) for use in 3D visualization. The Spatial (Mapping) Sector is also likely to incorporate augmented reality functions as its technology develops and matures.
25 See - http://en.wikipedia.org/wiki/Augmented_reality
26
See - http://en.wikipedia.org/wiki/COLLADA
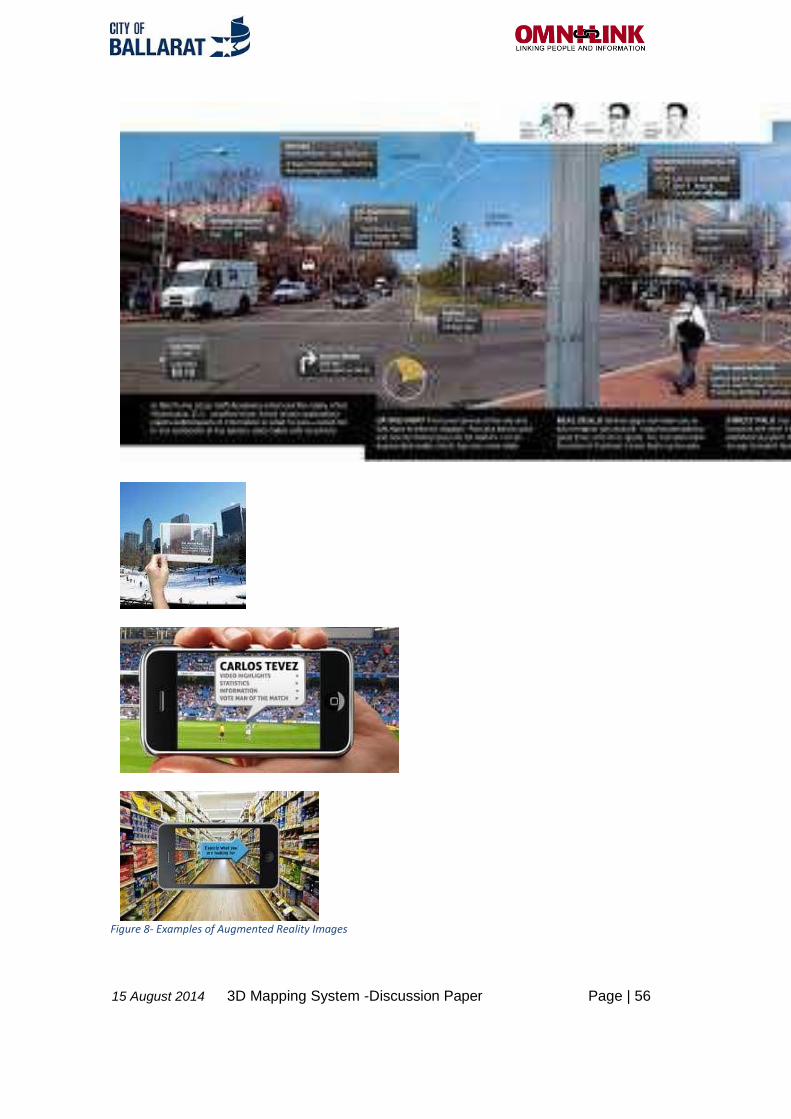
15 August 2014 3D Mapping System -Discussion Paper Page | 56
Figure 8- Examples of Augmented Reality Images