3d temporal characteristics analyses for chi-chi ... · 3d temporal characteristics analyses for...
TRANSCRIPT

3D TEMPORAL CHARACTERISTICS ANALYSES FOR CHI-CHI
EARTHQUAKE GROUND MOTIONS
Junwu DAI1, Xiaozhai QI2, Mai TONG3 and George C. LEE4
SUMMARY
Studies of 3D temporal characteristics of earthquake ground motions are definitely motivated by seismic
damage to structures. It is well known that six degree-of-freedom-correlated dynamic forces can cause
complicated structural damage and the uni-directional based indexes may only capture the damage
potential of a ground motion that can be observed in the projected direction. However, most of the
currently used ground motion indices largely simply the essential kinematics relationship of the 3D time
histories, no longer contain sufficient information to differentiate the various causes and formations of the
damage characteristics of the underlying ground motions. In this paper, using the recently developed 3D
temporal characteristics analysis, we examine the typical features of 47 near field motion records from
Chi-Chi earthquake. Some interesting phenomena are found to be very useful, such as the acceleration
pulses are kinematically independent of the velocity PVs and are not the causes of the velocity pulses, the
PA of the largest acceleration spike immediately follows the PV of the largest velocity pulse and the large
velocity pulse is due to prolonged positive tangential acceleration accumulation. In comparison to the
acceleration temporal characteristics, velocity time histories often show more of the ground motion
characters that affect a larger area such as wave propagation and attenuation.
INTRODUCTION
As one of the major advances in recent earthquake engineering research, near-field ground motions
containing large displacement, velocity and acceleration pulses are recognized as the principal cause of
significant damage to structures. While the damaging characteristics of ground motions are apparent in
1 Professor, Institute of Engineering Mechanics, China Seismological Bureau, P.R. China. [email protected] 2 Professor, Institute of Engineering Mechanics, China Seismological Bureau, P.R. China. [email protected] 3 Senior Scientist, Multidisciplinary Center for Earthquake Engineering Research, State University of New York at Buffalo, USA. 4 Professor, Multidisciplinary Center for Earthquake Engineering Research, State University of New York at Buffalo, USA.
13th World Conference on Earthquake Engineering Vancouver, B.C., Canada
August 1-6, 2004 Paper No. 2858

moderate to large earthquakes, the complexity and variation of the focal mechanism coupled with fault
rupture and strong site interactions make understanding different types of pulses a difficult task.
The 3D temporal characteristics analysis, including the normal and tangential accelerations and temporal
curvature and torsion, is a useful tool to help us look into the unique characteristics of earthquake ground
motions even the structural responses. In particular, after taking away the kinematics relations among the
acceleration, velocity and displacement time histories, we may find these temporal characteristics
particularly helpful for identifying certain nonlinear dynamics involved in the ground motions.
In Tong and Lee (1999), Lee, Tong and Tao (2000) and Tong, Qi and Lee (2001), some basic theoretical
background and applications of the 3D temporal characteristics analysis such as for a set of 10 records
from Chi-Chi earthquake have been developed. In this paper, we try to evaluate another set of near field
Chi-Chi earthquake records from different site conditions by using the 3D temporal characteristics
analysis.
GROUND MOTION SELECTION
Chi-Chi earthquake occurred on September 21, 1999, with the epicenter located in central Taiwan. Many
reports and investigations related to this earthquake have been carried out in the past 4 years. The general
observations and damage evaluations suggest that the causative fault propagated from the south toward the
north along an 80 Km fault line. The maximum horizontal displacement was up to 9 m and vertical
displacement was up to 1-4 m. Along the fault line, large ruptures and permanent offsets were observed in
the north, whereas the severe damages were observed mainly in the south. Many experts believed that the
heavy damages were due to the high frequency components in the ground motion in the south. In
comparison, the ground motion in the north carried a very low frequency, which produced the fault rupture,
but had relatively less impact on buildings and structures. Especially, there are quite number of records
with prominent site effects were also observed in this event. As is known, distance to the epicenter is not
the only dominant factor for high maximum PGA, we believe that the local area of each station had
experienced a unique dynamic process. The ground motion time history records contain specific seismic
activities need to be understood.
In the following, we selected 49 Chi-Chi ground motion records with different site conditions to evaluate
their 3D temporal characteristics. Table 1 gives out the basic information such as the locations and peak
motion information for these records. The selected ground motions can be generally classified as three
groups according to the site conditions. The first group consists with 9 records (Chi-1~Chi-9) with the soil
condition of shear velocity between 360~750 m/sec. In turn, the second group consists with 33 records
(Chi-10~Chi-41) with the soil condition of shear velocity between 180~360 m/sec and the third group
consists with 8 records (Chi-41~Chi-49) with the soil condition of shear velocity less than 180 m/sec.
Each group has a relatively similar soil condition. Some major aspects to be discussed are:
Amplitude bias for tangential acceleration

Decompositions of large acceleration spikes
Relations between PGA and PGV
Duration of acceleration and deceleration
Table 1 Selected ground motion records from Chi-Chi earthquake
Group Name Station Dist(Km) UD(gal) NS(gal) EW(gal) Latitude Longitude
Chi-1 TCU089 7.5 190.2 225.3 347.8 23.9037 120.8565
Chi-2 TCU084 10.5 311.8 422.8 989.2 23.883 120.8998
Chi-3 TCU120 23.2 166.5 193.5 223.0 23.9803 120.6130
Chi-4 CHY080 31.7 715.9 841.5 792.4 23.5972 120.6777 Chi-5 CHY074 38.8 97.7 157.0 229.2 23.5103 120.8052
Chi-6 CHY029 38.9 157.6 233.2 283.0 23.6135 120.5282
Chi-7 TCU057 39.6 81.5 100.1 111.3 24.1732 120.6107
Chi-8 TCU045 76.32 353 512 463 24.5417 120.9138
I
Chi-9 TCU095 94.43 251 685 367 24.6915 121.0137
Chi-10 TCU078 7.1 171 302.5 439.7 23.8120 120.8455
Chi-11 TCU079 9.9 383.8 417 579.8 23.8397 120.8942
Chi-12 TCU129 11.9 335 611 983 23.8783 120.6843 Chi-13 TCU076 13.7 275.4 420 340 23.9077 120.6757
Chi-14 TCU071 13.9 415.5 639 517.8 23.986 120.7882
Chi-15 TCU075 18.4 223.9 257.3 325.3 23.9827 120.6778
Chi-16 TCU074 20.0 270.2 368.4 585.9 23.9622 120.9618
Chi-17 TCU122 20.0 236 255.6 207.4 23.8128 120.6097
Chi-18 TCU072 20.6 274.7 370.5 465.3 24.0207 120.8488
Chi-19 TCU138 21.9 110.4 207.4 202.2 23.9223 120.5955
Chi-21 CHY024 22.8 141.4 162.2 276.3 23.7570 120.6062
Chi-22 TCU065 24.6 257.8 563.2 774.4 24.059 120.691
Chi-23 TCU067 26.8 230.6 312.7 488.9 24.0912 120.7200 Chi-24 CHY101 30.9 162.2 390 333 23.6862 120.5622
Chi-25 TCU123 31.4 85.5 132 149 24.0187 120.5437
Chi-26 CHY028 32.1 336 750 624 23.6327 120.6055
Chi-27 TCU063 33.2 133 130 179 24.1083 120.6158
Chi-28 TCU055 33.8 153 208 257 24.1392 120.6643
Chi-29 TCU109 34.0 133 159 149 24.0848 120.5713
Chi-30 TCU 34.2 119 187 201 24.1475 120.6760
Chi-31 TCU082 34.2 129 183 221 24.1475 120.6760
Chi-32 TCU106 35.3 116 122 157 24.0833 120.5518
Chi-33 TCU054 35.7 133 190 143 24.1612 120.6750
Chi-34 TCU051 36.5 110 231 157 24.1603 120.6518
II
Chi-35 TCU052 37.9 194 439 349 24.1980 120.7393

Chi-36 TCU053 39.2 121 132 225 24.1935 120.6688
Chi-37 TCU050 39.4 87 128 143 24.1815 120.6338
Chi-38 TCU061 39.7 86 154 133 24.1355 120.5490
Chi-39 CHY035 43.6 106 244 246 23.5200 120.5840
Chi-40 TCU102 43.8 173 169 298 24.2493 120.7208
Chi-41 TCU068 46.3 519 362 502 24.278 120.7657
Chi-42 TCU116 22.3 119 133 185 23.8568 120.5803 Chi-43 TCU110 26.0 116 188 178 23.9622 120.5695
Chi-44 CHY025 30.5 170 152 159 23.7795 120.5137
Chi-45 TCU141 34.3 107 89 87 23.8338 120.4640
Chi-46 TCU115 35.4 76 115 94 23.9595 120.4693
Chi-47 TCU056 37.6 117 140 154 24.1588 120.6238
Chi-48 CHY026 40.1 70 66 76 23.7987 120.4113
III
Chi-49 CHY104 40.1 130 177 143 23.6695 120.4648
3D TEMPORAL CHARACTERISTICS ANALYSIS
Group One The soil condition of this group is with the shear velocity between 360~750 m/sec which has the hardest
site in selected 3 group motions. From table 1 we can see that the bold marked records have the relatively
higher peak values although they are not the closest records to the epicenter in which Chi-2 has the highest
peak acceleration, while Chi-1 is the closest record to the epicenter. Chi-9 is most far away (94.43 Km)
from the epicenter but it has a quite high peak motion which is much higher than that of Chi-1.
Figure 1 Decomposed at and an of Chi-2 Figure 2 3D displacement trajectory of Chi-2
at
an

The decomposition of the Chi-2 acceleration into tangential acceleration at and normal acceleration an
show that large amplitudes of at are biased to the negative side (Figure 1). The largest peak deceleration is
about 0.93g; whereas the largest peak acceleration is about 0.65g. In addition, the accumulated large
deceleration (<-0.75g) significantly overwhelmed that of acceleration (>0.60g). Figure 3 shows the
histogram of large deceleration vs. large acceleration. Examining the maximum PGA and PGV (Figure 2),
we can see that maximum PGV occurred at 42.2 seconds, followed by the maximum PGA at 42.3 seconds.
The two peak values are kinematically related. The lag of maximum PGA indicates that it is due to a large
deceleration, which reduces the maximum PGA occurred a moment earlier. From the displacement
trajectory, it is seen that a rapid change of direction had occurred at 42.3 seconds (Figure 3).
Figure 3 Velocity norm, tangential acceleration at and normal acceleration an of Chi-2
Figure 4 Decomposed at and an of Chi-9 Figure 5 Decomposed at and an of Chi-1
at
an Velocity norm
an
Acceleration norm
at
an
Acceleration norm
at
velocity norm displacement

Figure 4 shows the histogram of large deceleration vs. large acceleration, together with the velocity and
displacement norm for record Chi-9 while figure 5 for record Chi-1. Generally, the common feature could
be found from these figures is a large acceleration results the increasing of the velocity while the
deceleration results the reduction of the velocity norm, and the occurrence time of the peak displacement
is strongly related with a lower velocity norm while a lower displacement is not necessary related with a
higher velocity norm. Another interesting phenomenon is that the 3D trajectory (figure 6) of these two
records (Chi-1 and Chi-9) is quite different. Chi-1 has fewer large displacement pulses than Chi-9
although Chi-1 is much closer to the epicenter.
Chi-9 Chi-1
Figure 6 3D displacement trajectory of Chi-9 and Chi-1
Figure 7 Displacement, velocity norm, tangential at and normal an of Chi-9
an
Acceleration norm
at
velocity norm
displacement

Chi-9: The maximum PGA in this record is 0.71g, but the maximum PGV is only 0.5 m/s. There are
several high acceleration and deceleration peaks at approximately the same time when the maximum PGV
occurred (Figure 7). The maximum PGA and PGV are kinematically related. The PGA precedes the PGV,
which indicates that the accumulation of acceleration in the time interval and that the maximum PGA
produced the maximum PGV. The time interval of the acceleration and deceleration is about 0.1 seconds,
which is much shorter than that displayed in Chi-41 record in group two.
Group Two
Although the ground motion record in this group (Chi-10~Chi-41) all have much softer soil condition
(between 180~360 m/sec) than group one, their temporal characteristics of the time histories have little
similarities. Each record possesses some unique properties. Some detailed analysis for Chi-11, Chi-22,
Chi-26 and Chi-41 are given out.
Chi-11: The station that recorded Chi-11 is only 9.9 km from the epicenter. It is the second closest to the
epicenter among all 32 records in this group. However, the maximum PGA in this group is relatively low
but much higher than record Chi-10. It is ranked 8th among the 49 records. The temporal characteristics of
Chi-11 are also different from the previous discussed records. The most outstanding aspects are
summarized in the following. The at and an decomposition of the acceleration time history shows that the
at amplitude distribution is not biased. Maximum PGV, which occurred at 44.5 seconds, is related to the
largest acceleration peak (44.3 seconds) and largest deceleration peak (44.6 seconds) (Figure 8). A similar
situation in less magnitude occurred at an earlier time (36.6 seconds). In both cases, the acceleration peaks
were almost the same as the consequent deceleration peaks.
Chi-22: The velocity time histories of record Chi-12, Chi-22 and Chi-41 have something in common. They
Figure 8 Displacement, velocity norm,
tangential at and normal an of Chi-11
Figure 9 Displacement, velocity norm,
tangential at and normal an of Chi-22
an
Acceleration norm
at
velocity norm displacement
an
Acceleration norm
at
velocity norm
displacement

all have a high level of velocity during a concentrated period. As shown in Figure 9, the level of high
velocity increases as the waves propagate from Chi-12 to Chi-41. However, the tangential acceleration at
displayed large narrow deceleration peaks. Similar to Chi-2 and Chi-26 and even more severely, the
amplitude of at is complete biased to the negative (deceleration). The top 50% amplitude of at norm ranges
from 0.4g to 0.81g, their accumulative duration is 0.15 seconds and are all contributed by deceleration. In
particular, compared to Chi-12 (Figure 10) and Chi-41, only Chi-22 has such deceleration peaks despite
the similarity among the velocity time histories. These peaks even repeated several times throughout the
Chi-22 time history. This suggests that the same dynamic process dominates the responses in this local
area. It is interesting to note that such peaks have little influence on the velocity time history. In fact, the
maximum PGV and PGA in this record are kinematically unrelated, which suggests that neither the
maximum PGA is caused by integration of the maximum PGA, nor the maximum PGA is caused by
derivative of the maximum PGV.
Chi-26: This record has similar characteristics as Chi-2, that is, large deceleration peaks dominate the
acceleration norm (Figure 11). at amplitudes biased with large peaks occurred more in the negative side
than in the positive side. The maximum PGA, which occurred at 36.76 seconds, is also associated with the
largest deceleration spike of 0.6g at 36.6 seconds. This phenomenon appears to be the result of the
maximum PGV as displayed in Chi-2, although the maximum PGA of Chi-26, which occurred at 36.8
seconds, is not kinematically related to the maximum PGV.
Chi-41: Despite the very short strong motion duration in the acceleration records, these three ground
motion velocity time histories are quite different. As indicated before, record Chi-41 can be basically
identified as the wave propagation from Chi-12 and Chi-22. It has the largest peak velocity of all the 49
records. With maximum PGA ranked 9th among the 49 records, the high velocity was due to a long period
Figure 10 Displacement, velocity norm,
tangential at and normal an of Chi-12
Figure 11 Displacement, velocity norm,
tangential at and normal an of Chi-26
an
Acceleration norm
at
velocity norm
displacement
an Acceleration norm
at
velocity norm displacement
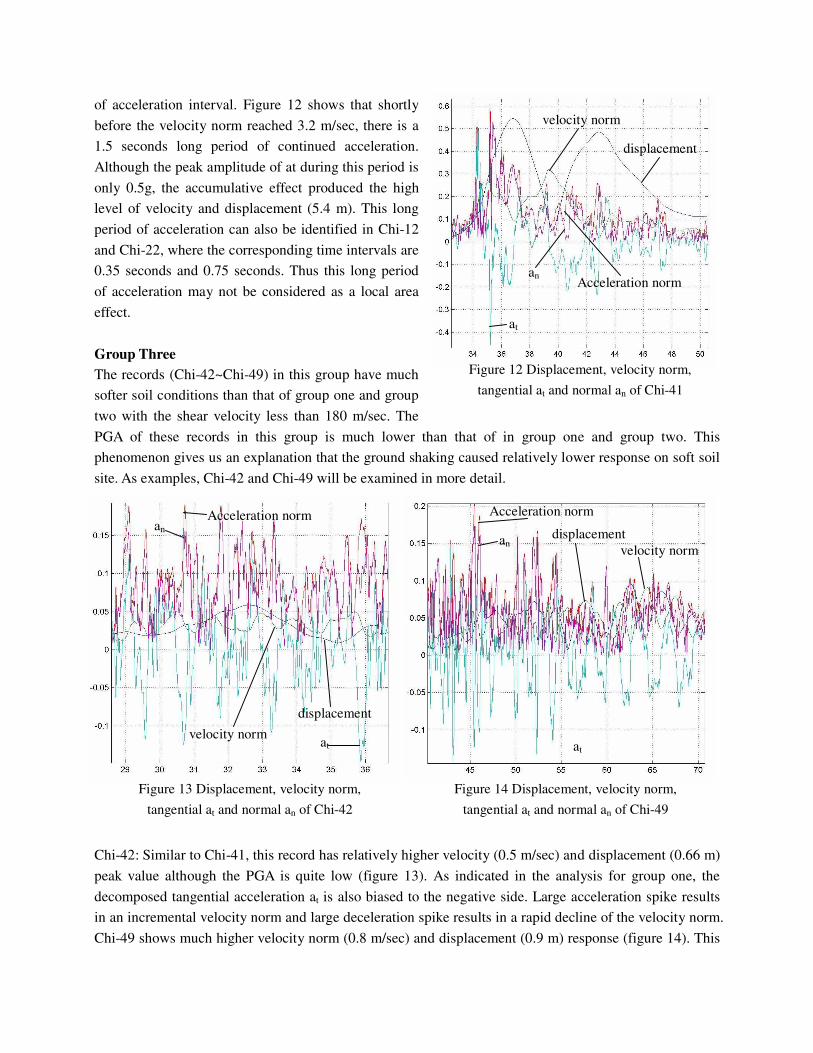
of acceleration interval. Figure 12 shows that shortly
before the velocity norm reached 3.2 m/sec, there is a
1.5 seconds long period of continued acceleration.
Although the peak amplitude of at during this period is
only 0.5g, the accumulative effect produced the high
level of velocity and displacement (5.4 m). This long
period of acceleration can also be identified in Chi-12
and Chi-22, where the corresponding time intervals are
0.35 seconds and 0.75 seconds. Thus this long period
of acceleration may not be considered as a local area
effect.
Group Three The records (Chi-42~Chi-49) in this group have much
softer soil conditions than that of group one and group
two with the shear velocity less than 180 m/sec. The
PGA of these records in this group is much lower than that of in group one and group two. This
phenomenon gives us an explanation that the ground shaking caused relatively lower response on soft soil
site. As examples, Chi-42 and Chi-49 will be examined in more detail.
Chi-42: Similar to Chi-41, this record has relatively higher velocity (0.5 m/sec) and displacement (0.66 m)
peak value although the PGA is quite low (figure 13). As indicated in the analysis for group one, the
decomposed tangential acceleration at is also biased to the negative side. Large acceleration spike results
in an incremental velocity norm and large deceleration spike results in a rapid decline of the velocity norm.
Chi-49 shows much higher velocity norm (0.8 m/sec) and displacement (0.9 m) response (figure 14). This
Figure 12 Displacement, velocity norm,
tangential at and normal an of Chi-41
Figure 13 Displacement, velocity norm,
tangential at and normal an of Chi-42
Figure 14 Displacement, velocity norm,
tangential at and normal an of Chi-49
an Acceleration norm
at
velocity norm
displacement
an
Acceleration norm
at
velocity norm
displacement an
Acceleration norm
at velocity norm
displacement

phenomenon reflects the site effects of soft soil conditions.
CONCLUSIONS
From the above analyses, we may make a number of general observations:
1. The ground acceleration from each station displays some unique dynamic process that had occurred in the local area. These dynamic processes are often reflected by high frequency temporal characteristics.
The phenomena expressed through these temporal characteristics vary from one record to another;
however, within each record, they often repeat, which indicates the consistency of the dynamic
process in the local area. In comparison to the acceleration temporal characteristics, velocity time
histories often show more of the ground motion characters that affect a larger area such as wave
propagation and attenuation.
2. The relation between maximum PGA and maximum PGV depends on the accumulative effect of acceleration and deceleration. The maximum accumulated effect of the acceleration interval is
associated with the maximum PGV. If the maximum PGA is kinematically related to PGV, it must fall
into the same time interval which generates the PGV or the time interval immediately follows the
maximum PGV.
3. In many of the record studied, the amplitudes of tangential acceleration are biased in the negative side, which indicates that deceleration dominated the PGAs.
4. Study also indicates that there is no obvious difference among the 3D temporal characteristics of ground motions on accelerations but the higher velocity norms and displacement responses roughly
reflects the site effects of soft soil conditions.
ACKNOWLEDGEMENT
The authors gratefully acknowledge the joint financial support of the China National Science Foundation
through Institute of Engineering Mechanics (50278092) and the US National Science Foundation through
Multidisciplinary Center for Earthquake Engineering Research.
REFERENCES
1. Tong, M. and Lee, G. C. (1999), 3D Temporal Characteristics of Earthquake Ground Motion at a Single
Point, Journal of Engineering Mechanics, ASCE, 1999; 125(10): 1099-1105.
2. Tong, Qi, and Lee (2000), Temporal aN and aT in Earthquake Ground Motion Analysis, Journal of
Engineering Mechanics, ASCE, 2002; 128(5): 502-510.
3. G. C. Lee, M. Tong and R. Tao, Temporal Characteristics of Chi-Chi Earthquake Ground Motion and
Their Possible Implications on Structural Damages, International Workshop on Annual Commemoration
of Chi-Chi Earthquake, Taipei, 2000.