3d transport of solar radiation in clouds - kitp online...
TRANSCRIPT

Solar radiation transport in the cloudy atmosphere: a 3D perspective on observations and
climate impacts
This article has been downloaded from IOPscience. Please scroll down to see the full text article.
2010 Rep. Prog. Phys. 73 026801
(http://iopscience.iop.org/0034-4885/73/2/026801)
Download details:
IP Address: 169.231.33.20
The article was downloaded on 01/05/2011 at 19:49
Please note that terms and conditions apply.
View the table of contents for this issue, or go to the journal homepage for more
Home Search Collections Journals About Contact us My IOPscience

IOP PUBLISHING REPORTS ON PROGRESS IN PHYSICS
Rep. Prog. Phys. 73 (2010) 026801 (70pp) doi:10.1088/0034-4885/73/2/026801
Solar radiation transport in the cloudyatmosphere: a 3D perspective onobservations and climate impactsAnthony B Davis1,3 and Alexander Marshak2
1 Los Alamos National Laboratory, Space and Remote Sensing Group, Los Alamos, NM 87545, USA2 NASA—Goddard Space Flight Center, Climate and Radiation Branch, Greenbelt, MD 20771, USA
E-mail: [email protected] and [email protected]
Received 8 July 2009, in final form 13 July 2009Published 19 January 2010Online at stacks.iop.org/RoPP/73/026801
AbstractThe interplay of sunlight with clouds is a ubiquitous and often pleasant visual experience, but itconjures up major challenges for weather, climate, environmental science and beyond. Thoseengaged in the characterization of clouds (and the clear air nearby) by remote sensing methodsare even more confronted. The problem comes, on the one hand, from the spatial complexity ofreal clouds and, on the other hand, from the dominance of multiple scattering in the radiationtransport. The former ingredient contrasts sharply with the still popular representation ofclouds as homogeneous plane-parallel slabs for the purposes of radiative transfercomputations. In typical cloud scenes the opposite asymptotic transport regimes of diffusionand ballistic propagation coexist. We survey the three-dimensional (3D) atmospheric radiativetransfer literature over the past 50 years and identify three concurrent and intertwining thrusts:first, how to assess the damage (bias) caused by 3D effects in the operational 1D radiativetransfer models? Second, how to mitigate this damage? Finally, can we exploit 3D radiativetransfer phenomena to innovate observation methods and technologies? We quickly realizethat the smallest scale resolved computationally or observationally may be artificial but isnonetheless a key quantity that separates the 3D radiative transfer solutions into two broad andcomplementary classes: stochastic and deterministic. Both approaches draw on classic andcontemporary statistical, mathematical and computational physics.
(Some figures in this article are in colour only in the electronic version)
This article was invited by A Kostinski.3 Now at: Jet Propulsion Laboratory, California Institute of Technology, Pasadena, CA 91109, USA.
Contents
1. Context, motivation and outline 31.1. Overview of the historical record 31.2. Solar radiation energetics in the presence of
clouds: climate modeling requirements on RT 41.3. Active and passive optical diagnostics of
clouds: remote sensing requirements on RT 41.4. Outline 6
2. Radiative transfer in the cloudy atmosphere: opticswith statistical and quantum physics 62.1. Emission, propagation, absorption and
scattering 6
2.2. Microscopic transport model: wave equation 82.3. Mesoscopic transport model: radiative
transfer equation 102.4. Macroscopic transport model: diffusion equation 11
3. Cloud geometry models, solutions of thecorresponding RT problems, and applications 133.1. The plane-parallel slab 133.2. A new application for 1d RT: exploitation of
the solar background in lidar 183.3. The spherical cloud: a tractable problem in
3D radiation transport 20
0034-4885/10/026801+70$90.00 1 © 2010 IOP Publishing Ltd Printed in the UK

Rep. Prog. Phys. 73 (2010) 026801 A B Davis and A Marshak
4. Spatial and temporal Green functions 214.1. The diffusion PDE-based approach to space–
time Green functions 224.2. New opportunities in cloud remote sensing 244.3. The random-walk scaling approach to space–
time Green functions 255. Realistic (3D) versus operational (1D) cloud RT 26
5.1. Dealing with unresolved random fluctuations 265.2. Dealing with resolved spatial variability 30
6. Assessment of 3D damage to 1D RT modeling 346.1. 3D RT phenomenology: how radiation flows
around opaque regions and is channeled intothe tenuous ones 34
6.2. Large-scale fluxes for GCMs, small-scalefluxes for LES/CRMs 36
6.3. Scale breaks: the spatial Green function revealed 376.4. Retrievals of cloud properties 396.5. Aerosol optical depth retrievals, near broken
clouds 41
7. Mitigation of 3D damage to 1D RT modeling 437.1. Large-scale fluxes for GCMs, small-scale
fluxes for LES/CRMs 437.2. Cloud remote sensing, corrected for 3D RT
effects 467.3. Broken cloud impacts on aerosol property
retrievals 488. Exploitation of 3D RT phenomenology in remote
sensing 498.1. Variable cloudiness observed from below, with
zenith radiance 498.2. Cloud-sensing sideways 548.3. Direct observation of Green functions in time
and/or space 569. Summary and outlook 62Acknowledgments 63References 63
List of abbreviations/acronyms
nD n-dimensional (n = 1, 2, 3)n+1D n-plus-one-dimensional (i.e. space–time)ACE Aerosol, Clouds and ocean Ecosystem
(upcoming NASA mission)AERONET AEROsol observation NETworkARM Atmospheric Radiation Measurement
(DOE program)AOT aerosol optical thicknessASTER Advanced Space-borne Thermal Emission and
Reflection Radiometer (on Terra)ATBD Algorithm Theory-Based DocumentBC boundary conditionBRDF bi-directional reflectance distribution functionCCN cloud condensation nucleiCKD correlated-k distribution (method for
spectral integration)CERES Clouds and the Earth’s Radiant Energy SystemCRM cloud resolving modelCi cirrusCu cumulusCWC condensed/cloud water contentCWP condensed/cloud water pathDISORT DIScrete Ordinate RT (DISORT),
a popular 1D RT codeDOAS differential optical absorption spectroscopyDOE US Department of EnergyEarthCARE Earth, Clouds, Aerosols and Radiation
Experiment (ESA-JAXA mission)EM electromagneticERBE Earth Radiation Budget ExperimentETA effective thickness approximationESA European Space AgencyFIRE’87 1987 First ISCCP Regional ExperimentFOV field-of-viewGCM global climate model
GHG greenhouse gasGLAS Geoscience Laser Altimeter SystemGSFC Goddard Space Flight Center (NASA center)GWTSA Gamma-weighted two-stream approximationH–G Henyey–Greenstein, a phase function modelICA Independent Column ApproximationICESat Ice, Cloud and land Elevation SatelliteIPA Independent Pixel ApproximationIR infra-redISCCP International Satellite Cloud
Climatology ProjectIWC ice water contentIWP ice water pathJAXA Japan Aerospace eXploration AgencyLANL Los Alamos National Laboratory
(part of DOE complex)LEO low-Earth orbitLES Large-Eddy SimulationLIDAR LIght raDARLITE Lidar-In-space Technology ExperimentLWC liquid water contentLWP liquid water pathMC Monte CarloMcICA Monte Carlo ICAMFP mean-free-pathMISR Multi-angle Imaging Spectro-Radiometer
(on Terra)MMCR millimeter-wave cloud radarMMF multi-scale modeling frameworkMODIS Moderate Resolution Imaging
Spectro-radiometer (on Terra and Aqua)MPL Micro-Pulse LidarMTI Multispectral Thermal ImagerMuSCL Multiple-Scattering Cloud LidarMWR microwave radiometerNASA National Aeronautics and Space
Administration
2

Rep. Prog. Phys. 73 (2010) 026801 A B Davis and A Marshak
NCAR National Center for Atmospheric ResearchNDCI Normalized Difference Cloud IndexNDVI Normalized Difference Vegetation IndexNFOV narrow FOVNIPA Nonlocal IPANIR near IR (spectrum)NOAA National Oceanic and Atmospheric
AdministrationOCO Orbiting Carbon ObservatoryODE ordinary differential equationPDE partial differential equationPDF probability density functionRADAR RAdio-frequency Detection And RangingRMS root-mean-squareRT radiative transferRTE RT equationRULLI Remote Ultra-Low Light Imaging
(a special LANL sensor)SNR signal-to-noise ratioSORCE SOlar Radiation and Climate ExperimentSc stratocumulusSF (2nd-order) structure functionSHDOM Spherical Harmonics Discrete Ordinates
MethodSt stratusSWIR shortwave IR (spectrum)SZA solar zenith angleTHOR THickness from Off-beam Returns
(an airborne MuSCL system)TIR thermal IRTM Thematic MapperTOA top of atmosphereUAV unmanned aerial vehicleUV ultra-violet (spectrum)Var VarianceVIS visible (spectrum)VNIR visible to near IR (spectrum)VZA viewing zenith angleWAIL Wide-Angle Imaging LidarWRF Weather Research and Forecasting
(NCAR community) model
1. Context, motivation and outline
1.1. Overview of the historical record
Clouds have forever been objects of fascination by artistsand scientists alike. The earliest recorded observations andexplanations of clouds certainly go back to antiquity, when inmost circumstances philosophy, mythology and natural sciencewere not yet distinguishable. Da Vinci, Renaissance manpar excellence, experimented with smoke and light. Newtonfamously explained the rainbow based on geometric optics,dispersion and the hypothesis of microscopic sphericallyshaped cloud/rain particles. The emergence of cloud physicsand dynamics can be traced to Luke Howard (1772–1864)and, more specifically, his 1802 lecture ‘On the Modificationsof Clouds (...)’ delivered to the London Askesian Society.
Therein, he introduced a classification of clouds (stratus,cumulus, cirrus, nimbus) that is still in use [1]; it wasentirely based on visual appearance. Atmospheric visibilitywas studied empirically by Bouguer, Lambert and Beer inthat order from the early 1700s to mid-1800s. The law ofexponential transmission encapsulates their research. Lambertalso uncovered his famous ‘cosine’ law of radiometry: acollimated beam deposits energy on a surface in proportionto its projection onto a plane perpendicular to the beam.
Just over a century ago, Gustav Mie published his famouspaper [2] on the scattering and absorption of electromagnetic(EM) waves by spheres in 1908. Peter Debye [3] was workingindependently on the same problem at the same time, andpublished his own paper in 1909. They were, however, bothpreceded by Ludvig Lorenz who investigated the problemearlier, publishing his work in 1890 ... in Danish. The originof multiple-scattering theory follows a similar pattern. ArthurSchuster’s 1905 paper [4] is often cited as the first use ofwhat would become known as two-stream theory in radiativetransfer, but previous and apparently independent studies hadbeen published by Lommel [5] in 1887 and by Chowlson [6] in1889. At any rate, the foundations of radiative transfer theoryper se were laid by Karl Schwarzschild and E Arthur Milnefor the angularly resolved case and by Arthur Eddington forthe coarser (flux-based) diffusion approximation. After that,radiative transfer became entangled with particle transport. Forthe decades leading up to the end of WWII, transport theorywas driven by early nuclear engineering projects: designingand building both steady-state and super-critical devices. Ofcourse, both reactors and weapons have their nature-madecounterparts in nuclear astrophysics. Astrophysics, boththeoretical and observational, has always been a driver foradvances in radiative transfer per se.
The definitive reference for one-dimensional (1D)radiative transfer (RT) in horizontally uniform plane-parallelatmospheres is Chandrasekhar’s 1950 monograph [7]. Theearliest study we are aware of in three-dimensional (3D)RT in the usual sense of horizontally non-uniform plane-parallel atmospheres is in Giovanelli’s 1959 paper [8], 50years ago at the time of this writing; he used 3D diffusiontheory. However, shortly before that, in 1956, Richards [9]had investigated isotropic point sources embedded in denseuniform clouds, again, where the diffusion regime prevails. In1958, Chandrasekhar published a rigorous RT-based study [10]of a narrow collimated beam (‘pencil-beam’) penetrating auniform semi-infinite isotropically scattering medium. Forreasons that will become clear as we proceed, we are highlyinterested in these non-uniform source problems, which are3D in their own right, even with solar RT in mind (think Greenfunctions). We will cover further developments in atmospheric3D RT in the main body of the paper, especially in the latersections (sections 6–8).
At present, we can identify two equally importantapplication areas for atmospheric RT in general, and 3D inparticular: broadband radiative energy budget estimation andwavelength-specific optical remote sensing signal modeling.Figure 1 illustrates the magnitude of the challenge posed bythe spatial complexity of cloudiness.
3

Rep. Prog. Phys. 73 (2010) 026801 A B Davis and A Marshak
Figure 1. Clouds. Left (a): the famous ‘blue marble’ full-face portrait of the Earth snapped by Apollo 17 astronauts on their way to theMoon. Right (b): a complex cloud scene viewed from the Space Shuttle.
1.2. Solar radiation energetics in the presence of clouds:climate modeling requirements on RT
Clouds are a naturally occurring component of the climatesystem: they are the planet’s first line of defense for regulatingits intake of solar energy, obviously a key quantity in climatebalance. The global albedo of the Earth is ≈0.3, largelydue to the powerful reflection by the most opaque clouds(cf figure 1(a)). They are also essential to the hydrologicalcycle, all scales considered from the droplet (∼10−5m) to theraindrop (∼10−3m) to the cloud system (∼10+4m) to the gridscales (∼10+5m) of global climate models (GCMs). Yet cloudsare taken for granted by the majority of the climate modelingcommunity. They are not mentioned at all in the 22 pages ofthe most recent ‘Climate Change 2007: Synthesis Report—Summary for Policymakers’ by the Intergovernmental Panelfor Climate Change (http://www.ipcc.ch/) while aerosols arementioned six times. We find some solace in the 18 pages of‘The Report of Working Group I (Physical Science Basis) ofthe IPCC—Summary for Policymakers’ [11] where clouds arementioned four times (and aerosols 11), including the ominousstatement that ‘Cloud feedbacks remain the largest source ofuncertainty.’
This under-appreciation of clouds is unfortunate becauseour skill in predicting their effect on the radiative and overallenergy budgets at the 50–200 km scales of interest in GCMs(cf figure 1(b)) is not so good. This is in large part becausethe clouds themselves are not well predicted. However, therequired RT is also overly simplified by assuming that ineach layer clouds occupy a fraction, Ac, between 0 and 1,and that within the cloudy and cloud-free portions horizontaluniformity is assumed. This makes the spatial aspect of theGCM RT problem amenable to a weighted average of 1Dcomputations. How to combine the various layers, accountingfor their radiative interactions is more tricky. This usuallyamounts to assuming either maximum or random overlapgeometry of the cloudy portions depending on whether or notAc goes to zero in between cloudy layers [12]. The treatmentof the spatial transport problem is expedited with a two-stream
or diffusion-type model while the real computational effort onradiation in GCMs is expended in the spectral domain. That isto be expected since the goal here is to compute by integrationover the entire solar spectrum how much radiation is reflectedback to space and how much solar heating occurs across theatmospheric layers and at the surface.
Cloud particles are not strong absorbers. Gases are,and clouds bounce the solar radiation through the gases veryefficiently. Now the spectral variations of gaseous absorptionare complex and shift with temperature and pressure. Thespectral domain thus gets the lion’s share of the CPU cycles inGCM solar RT ‘parametrizations,’ a.k.a. shortwave radiation‘schemes;’ this is even more the case in the thermal IR(a.k.a. long-wave) spectrum where the RT is dominatedby ubiquitous emission and absorption processes rather thanincoming radiation and multiple scattering.
If we want to inject more realism into the spatial partof the solar RT problem in GCMs, it has to be via a veryefficient computation. We briefly discuss such solutions, withparticular emphasis on the recent trend toward use of ‘multi-scale modeling frameworks’ (MMFs) in climate modeling[13, 14, and references therein]. MMFs embed cloud resolvingmodels (CRMs) with kilometer-scale resolutions in each GCMgrid-cell, thus removing the need to predict Ac and effectiveoptical properties for the uniform cloud. Consequently, awhole new 3D RT problem arises to get the energetics accurateenough, by some dynamics-based criterion, at every point inthe CRM.
1.3. Active and passive optical diagnostics of clouds: remotesensing requirements on RT
In solar heating rate estimation, we perform at a minimum full-range angular and spectral integrals. Moreover, some level ofspatial integration is usually in order: approximately kilometerscales for CRMs, hundreds of kilometers for GCMs, up to theplanetary scale for elementary ‘0D’ energy balance models.Remote sensing requirements for RT sharply contrast to thispicture: pixel scales range from meters to tens of kilometers,
4

Rep. Prog. Phys. 73 (2010) 026801 A B Davis and A Marshak
radiance propagation direction is at best sparsely sampled(often fixed at a single value), and narrow spectral bandsare used.
Although there is a new trend toward ‘smart’ detectorsystems that process data near the focal plane, satellite remotesensing data harvesting is currently band-width limited. Howmany radiance samples can we measure at a reasonable signal-to-noise ratio (SNR), store and forward to a ground station?Once received, the ‘level 0’ data in raw bytes and packetsare used to generate calibrated and geo-registered ‘level 1’radiance data, ready for extraction of geophysical informationby a wide variety of retrieval techniques. This key operationproduces ‘level 2’ data on a pixel-by-pixel or region-by-regionbasis in a given image. Once collected into a latitude–longitudegrid it becomes ‘level 3’ data, conveniently stratified andformatted for the end-users.
In one form or another, remote sensing always leadsto an inverse problem. Of particular interest to us are theso-called ‘physics-based’ retrieval techniques that invariablystart with forward RT modeling of remote sensing signals.Sensitivity studies will reveal whether or not existing orplanned observations, for known or assumed instrumentalerror, will support the retrieval of an inherent property ofthe target. If there is sensitivity, one can design a retrievalalgorithm with the right level of complexity (e.g. 1D or 3D RT)and accuracy (e.g. account or not for polarization effects), andthe right tradeoff between efficiency and flexibility (e.g. pre-computed look-up tables versus RT computations on the fly).
In principle, the goal of inverse RT is to infer geometrical,structural and optical properties of the medium that definethe forward RT problem locally and globally; such opticalproperties would describe for instance reflection, scatteringand absorption processes. In practice, end-users of remotesensing ‘products’ are generally more interested in the physicaland chemical properties that determine the optical parametersof the airborne particles; this leads to another inverse problemto solve. There is therefore tacit pressure to combine thesetwo non-trivial inverse problems even though they might bebest treated separately. In our experience, this cannot be donewithout making further assumptions about the medium, e.g.the particles are spherical and their radii are log–normallydistributed. Once such serial assumptions become buried inAlgorithm Theoretical Basis Documents (ATBDs), it becomesharder to trace the source of remote sensing uncertainties.
Geometrical and structural properties of interest in cloudremote sensing are cloud height, thickness and shape (e.g.through its outer aspect ratio, where a slab has an infiniteaspect ratio). Deliverable optical properties of clouds (definedformally below) will characterize scattering and/or absorptionthrough transport coefficients—or derived properties such asthe mean-free-path—at the observation wavelength. Validbut more difficult questions about physico-chemical (a.k.a.microphysical) properties of cloud particles include their phase(liquid, ice or a macroscale mix of both), their size (e.g. viamoments of the size distribution) and their density. This lastquantity is highly valued since it may, for instance, give ahint at the effect of pollution on clouds. Particulate emissioncan indeed increase the number of cloud condensation nuclei
(CCN), and thus affect the cloud radiative properties that matterfor the climate [15–17].
To provide answers to all of the above questions aboutclouds, multiple wavelengths, multiple viewing angles andmore and more multiple polarization channels must be broughtto bear. That is indeed the comprehensive suite of opticalcharacteristics the next generation of space-based instrumentwill combine [18, 19]. However, such a broad grasp inradiometric detail will always require sampling tradeoffs;typically, they will involve spectral and spatial resolution. It istherefore unlikely that a single optical sensor can answer all thequestions we have about the continuum of airborne particulatesranging from aerosols to clouds. Multiple instruments lookingat the same scene give us a better chance. More and more, datawill be fused from multiple satellites flying in a close formationsuch as the current ‘a train’ constellation [20].
From the signal modeling as well as engineeringperspectives, we distinguish ‘passive’ and ‘active’ instrumentswhere the former use natural sources of radiation while thelatter provide their own. Even considering the increasedcomplexity, cost and power requirements of the lattertechnology, an active approach is often the best choice. Thefocus of this review is on the solar spectrum, with reflectionand scattering of sunlight being at the origin of the signal.We will nonetheless consider pulsed lasers as an alternatesource, and we will discuss LIDAR (LIght raDAR). Wealso remind the reader that longer wavelengths, from thethermal IR to the microwave region, have also been usedto probe clouds, both passively and actively. Active radio-frequency instrumentation (RADAR) has long been used tomonitor precipitation. However, for the last couple of decadesmillimeter-wavelength sources have become available thatreveal the stuff that clouds are made of.
The authors’ institutional bias is toward satelliteremote sensing, but suborbital (airborne and ground-based)observations will also be considered in all of the above-mentioned modalities. There are, however, cloud-probingtechnologies that defy this classification. What would onecall an airborne instrument [21, 22] that is flown into the thickof a cloud where it fires laser pulses and its time-resolvedradiometry of the resulting multiply scattered light is used todetermine the cloud’s overall thickness and volume-averagedextinction coefficient (a local measure of opacity)? Whereis the ‘remote’ in this sensing? We would argue that this‘in situ cloud lidar’ is indeed a remote sensing technology byvirtue of the key role of RT in the signal prediction, hence dataprocessing. Moreover, the goal is to use light for detection-and-ranging of the cloud’s upper and lower boundaries.
There are other observations that defy some of theconventional wisdom about what constitutes remote sensing.For instance, physical climate scientists really want to knowglobally the up-welling, top-of-atmosphere (TOA) flux acrossthe solar spectrum (i.e. the local albedo when normalized tothe incoming flux) as it varies in space and time. NASA hasdedicated entire multi-platform instrumental missions to thismeasurement: the Earth Radiation Budget Experiment (ERBE)[23] and follow-on Clouds and the Earth’s Radiant EnergySystem (CERES) [24]. The problem amounts to sampling
5

Rep. Prog. Phys. 73 (2010) 026801 A B Davis and A Marshak
at best a small number of radiances emanating from a givenlocale and inferring a specific weighted integral over all theradiances. So an ‘angular model,’ the tell-tale RT ingredientin remote sensing, is required. A priori, determination of thiscloud scene attribute is not going after any of its geometrical,physical and chemical properties. A posteriori, the angularmodel selection has a lot to do with the cloud scene properties,even if we are not motivated here to retrieve them with specifiedaccuracy.
Insolation of the surface across the solar spectrum isanother important quantity strongly affected by clouds in allof their 3D glory. Can it be determined by remote sensing?Currently, the answer is yes, but with difficulty and dependingon the time-scale of interest. Given only TOA radiances, thisquantity is even more dependent on assumptions in the requiredRT- and composition-modeling than the TOA solar flux. It isnonetheless a high-value target for climate science, weatherforecasting and many kinds of biogeophysical investigation.
In summary, it is useful to separate the applications ofRT in the cloudy atmosphere into energetics and diagnosticsbecause, in many respects, the solution techniques will havea very different flavor. However, the threads of observationalradiometry and computational transport intertwine in ways wedo not need to unravel completely. Rather we should followboth strands and see the knots as opportunities for furtherresearch.
1.4. Outline
In the following section, we describe the fundamentalphysical processes of atmospheric radiation transport at themicroscopic, mesoscopic and macroscopic levels. Armedwith a complete description of the local balance of the radiantenergy budget, we introduce outer cloud geometry in section 3and solve in representative cases the radiation transportproblem; several applications illustrate these solutions. Insection 4, we introduce RT Green functions for densescattering and at-most-weakly absorbing media in space andin time; because of the remote sensing applications, particularattention is given to the description of transport from boundarysources to boundary/external observers. In section 5, wepartition the 3D radiation transport problem space into twosectors: resolved and unresolved spatial variability, leading todifferent phenomenologies and contrasting flavors of solutiontechniques.
Sections 6 and 7 are devoted, respectively, to theassessment and mitigation of the ‘damage’ that 3D radiationtransport phenomena cause in operational applications thathave adopted 1D RT models. Both energy budget estimationand cloud remote sensing are covered with several examplesfor each of these two tasks. Tables are turned in section 8where we describe, with examples, how 3D radiation transportphenomena can be used to design new algorithms and newinstruments for cloud remote sensing. We offer someconcluding remarks in section 9.
We will assume the reader has a basic background instatistical, mathematical and computational physics, but nomore than curiosity about cloud physics, optics, observation
and radiation energetics. Atmospheric scientists in general,and scientists from the National Aeronautics and SpaceAdministration (NASA) in particular, are prone to acute‘acronymitis’ (13 abbreviations defined so far, 97 in all). Theyare defined on the fly, but a comprehensive list of acronymsand abbreviations is also provided at the end of the paper.References will help the reader delve further into the topicof realistic-yet-practical modeling of solar radiation transportin the Earth’s cloudy atmosphere, and possibly in other naturalmedia.
2. Radiative transfer in the cloudy atmosphere:optics with statistical and quantum physics
2.1. Emission, propagation, absorption and scattering
The Sun is a distant source of thermal radiation that impingeson the Earth as an essentially unidirectional spatially uniformflux F0λ measured conventionally in W m−2 broadband andspectrally nm−1. This flux indeed has a rich spectral structurethat departs from black-body radiance at the effective 5775 Ktemperature of the Sun’s photosphere; it is tabulated ingreat detail by Kurucz [25]. The solar spectrum extends inwavelength from λ ≈ 0.2 µm to ∞, with everything beyond4 µm considered to be the thermal infra-red (TIR). It is dividedinto the ultra-violet (UV), largely absorbed by stratosphericozone, the visible (VIS) and the near-IR (NIR) regions withpartitions at 0.4 and 0.7 µm; the IR region of interest is alsoreferred to as the solar IR or reflected IR to distinguish it fromthe TIR that peaks at 10–12 µm and is dominated by terrestrialradiation sources.
The integral ofF0λ across all wavelengths is≈1365 W m−2,a number that matters of course tremendously for the Earth’sclimate, including 12 W m−2 beyond 4 µm in the TIR. It variesslightly and is monitored as continuously and accurately aspossible from space by missions such as SOlar Radiation andClimate Experiment (SORCE) [26] and soon Glory [18]. Thegoal of solar radiation transport is to track the fate of this influxof radiant energy from the somewhat elusive TOA [27]. It canbe either reflected back to space (and clouds play a critical rolein this mechanism that regulates the global climate), transmit-ted to the surface (where it is either absorbed or reflected) orabsorbed by one of many possible atmospheric constituents(that can be either in gaseous, liquid or solid phase). In thisprocess of energy-driven computation, one can also branch offto the prediction of signals for all matter of sensors. This is thebasis of physics-based atmospheric remote sensing in the solarspectrum. It is advantageous to use the Sun’s abundant lightin passive modalities. There are also good reasons to turn topulsed lasers in active ones. By far the most popular laser tech-nology used in this part of the spectrum is solid-state Nd : YAGwhich transmits at 1064 nm, often frequency-doubled to 532nm (as in green-colored laser pointers), where molecules scat-ter 16× more and aerosols somewhat more as well. Also,silicon-based photon detection is at its most efficient in thisspectral region.
Constituents of the molecular atmosphere of primaryinterest in solar spectrum are N2, O2, O3, NO2, H2O, NH4,
6

Rep. Prog. Phys. 73 (2010) 026801 A B Davis and A Marshak
CO, CO2 and CH4. The first two, by far the most abundantspecies, are responsible for the Rayleigh scattering that givesus the familiar blue hue of ultra-clear skies (no clouds orpollution). Spatially and spectrally selective absorption ishow the atmosphere gains heat at the expense of the solarradiation budget. Nitrogen has negligible absorption inthe solar spectrum. Oxygen, the other symmetric diatomicmolecule in the mix, absorbs some sunlight but not enoughto contribute energetically meaningful heating. This is ofcourse for basic quantum mechanical reasons that put theirtransitional, vibrational and rotational energies in other partsof the electromagnetic (EM) spectrum. However, O2 has afew narrow forbidden transitions between 0.63 and 0.78 µmknown as the γ -, B- and A-bands. Figure 2 shows the detailsof the O2 A-band, which we will develop a strong interest infurther on. The main role of ozone is to block the solar UVfrom reaching altitudes below ∼35 km, fortunately for mostlife-forms. Ozone also has a weak spectrally smooth featureacross the VIS regions known as the Chappuis band. For allpractical purposes, the stratospheric O3 layer defines the TOAfor solar radiation; at ≈6 pressure scale heights (≈8 km each),scattering is still negligible (although detectable by sensitivelidar techniques). All of the other molecules listed contributeabsorption bands in the NIR. Methane is an under-appreciatedabsorber, more effective in the solar spectrum than carbondioxide [28].
In applications where spectral integrals must be estimated,scanning the solar spectrum one-wavelength-at-a-time is notan efficient way of performing the computation. Among thepractical ways of capturing gaseous absorption (at a givenpressure and temperature), the most popular is currently theso-called ‘correlated-k distribution’ (CKD) method [29, 30].In CKD modeling, the gaseous absorption coefficient isre-ordered by strength and weighted by its occurrence withina spectral region small enough that other optical propertiesvary little. In essence, a Lebesgue integration [31] is usedin a case where variability is too unwieldy for a Riemannapproach. For a detailed account of molecular absorption andassociated modeling techniques, we refer the interested readerto the classic monograph by Goody and Yung [32].
In this review, we focus on scattering alone or incombination with absorption. Beyond molecular/Rayleighscattering, atmospheric optics at any given wavelength aredetermined by the properties of aerosols (typically sub-micrometer size airborne particulates) and cloud particles thatrange from ∼1 to many tens of micrometers in size. Thelatter can be either liquid or solid depending on environmentalconditions. At larger sizes, the Stokes flow results in netfall speeds, so we are dealing with drizzle, rain and otherforms of precipitation. Aerosols and clouds interact radiatively(cf section 6.5) and microphysically. Aerosols are indeednecessary to trigger cloud formation by ‘activation’ of tinyCCN. To a first approximation there is one cloud particle perCCN, so increasing the small aerosol population by pollutingthe air affects cloud properties: more particles compete forthe same amount of condensed water, and end up smalleron average. We will see that this ‘indirect’ aerosol effect(in climate parlance) makes clouds more reflective [16], as is
Figure 2. Simulated O2 A-band spectra in reflection. Bottom: finestructure of the A-band displayed using, as a relevant example, theO2 optical thickness across a layer from 860 to 911 hPa (altitudes0.85 to 1.3 km), where one could find a typical low-level cloud. Top:the reference spectrum (dashed) is for a background aerosolatmosphere above an ocean surface in a typical state(Cox–Munk [33] model for 5 m s−1 wind speed). The other (solid) isfor the same situation plus a liquid water cloud at 911–860 hPa withan optical depth of 64. Line-by-line computations were coarsened tothe 0.0146 nm resolution of the Orbiting Carbon Observatory(OCO) spectrometer. Both spectra were normalized to maximumradiance (given, for reference, in the inset). Computations werekindly provided by Dr Hartmut Bosch (University of Leicester,Department of Physics and Astronomy, Earth Observation Science,Space Research Centre).
dramatically illustrated by ship tracks in satellite imagery [34].There are further ramifications of this impact of pollution on thelife-cycle of clouds, all the way to the systematic suppressionof precipitation [15]. Apart from changing planetary albedo bymaking clouds more persistent, this effect can lead to changesfor hydrology and climate in the affected regions.
Beyond particle-size range, the distinction between cloudand aerosol is much more about constitution than density.Apart from trace chemicals in solution, as well as smallinternally mixed particulates, cloud particles are made ofcondensed water. Aerosols by contrast have an extremelydiverse chemical make-up, with more or less propensity for‘wetting’ within the prevailing water vapor. In spite of somepreconceptions, this distinction should not be seen as a question
7

Rep. Prog. Phys. 73 (2010) 026801 A B Davis and A Marshak
of altitude: there are indeed clouds at ground level (e.g. fogs andblowing snow) and there are aerosols in the stratosphere (e.g.from large volcanic eruptions). Nor is it about the local density:there are highly opaque aerosol plumes (e.g. from wild fires)and there are ‘sub-visible’ cirrus clouds. From the radiationtransport perspective, however, there are two extreme regimesthat nature mixes in interesting and challenging ways: opticallythin (a.k.a. clear-sky) regions and optically thick regimes.
This brings us to the fundamental issue of radiationpropagation, which is at the core of transport theory per se.Physicists will anticipate here a categorization based on theKnudsen number, the ratio of the mean-free-path (MFP) tothe characteristic outer scale of the flow. We will soon spellout some serious physical drawbacks to the conceptualizationof radiation transport as a flow of ‘photons’ through aparticipating medium. Nonetheless, one can envision a kinetictheory framework and think about optically thin regions of theatmosphere as dominated by (fast) ballistic motion, while theoptically thick ones are dominated by (slow) diffusive motion.In the following three subsections we will present in moretechnical detail radiation transport theory and position it withrespect to classic physical optics.
2.2. Microscopic transport model: wave equation
What does Maxwell’s electromagnetic (EM) wave theory oflight as a vector wave field bring to the table? Theoretically,it should be the starting point. Yet, until quite recently, itsrole was limited to the computation of the optical properties ofatmospheric particles, one at a time. How much does it absorb?How much does it scatter and how is that portion distributedaccording to scattering angle?
The reader will not be surprised to hear that the standardassumption about particle shape is a sphere. The answers tothe above questions then depend only on the non-dimensionalsize parameter 2πr/λ, where r is the radius of the sphere,and the complex index of refraction of the material, withthe imaginary part controlling absorption. As mentioned inSection 1, Lorenz–Mie theory for scattering and absorptionof EM waves by spheres was established over a century ago.The topic is still revealing some finer but fascinating detailsin the area of resonances [35]. For in-depth surveys, we referthe reader to the monographs by Bohren and Huffman [36]and Mishchenko et al [37]. As one might also suspect, thespherical assumption is often a very coarse approximation, butfor an important class of airborne particles of interest hereit is in fact a very good one: liquid cloud droplets, rangingbetween ≈2 and ≈30 µm in radius. These droplets formthe vast majority of low-level clouds such as stratus (St),cumulus (Cu) and stratocumulus (Sc) where mean or modalradii vary between 5 and 15 µm from cloud to cloud andfrom base to top (generally increasing). In turn, these cloudtypes dominate the radiation energy budget, especially viareflectivity (i.e. their significant contribution to the Earth’sglobal albedo of ≈0.3). Figure 3 shows the outcome of aLorenz–Mie computation of the differential scattering cross-section (in a normalization explained further on) averaged overa population of randomly positioned droplets with a so-called
Figure 3. Scattering phase functions. The cloud ‘C1’ phasefunction is plotted versus θs for λ = 0.532 µm; the (g = 0.85)Henyey–Greenstein model in (33) and the Rayleigh scattering phasefunction, P(θs) = (3/16π)(1 + cos2 θs), are also plotted.
‘Deirmendjian C1’ size distribution [38]. Even in semi-logaxes, we note the strong forward peak as well as the well-knownrainbow feature at ≈138. The former property is traceableto diffraction while the latter is attributable, to first order, togeometric optics, a reasonable approximation in the limit oflarge size parameters (r λ). For reference, the Rayleighscattering case is plotted as well; it applies to the oppositelimit of small size parameters (r λ).
Many important atmospheric particulates are, however,very far from spherical, not the least being ice crystals inelevated clouds that come in very diverse shapes (‘habits’).‘Equivalent sphere’ models have of course been used andabused to represent parametrically non-spherical particlepopulations in cloud and aerosol optics [39, 40]. Inthe case of cold clouds, typical ice crystal sizes arefortunately significantly larger than those of droplets, tensto hundreds of micrometers. Ray-tracing computations—assuming geometrical optics—therefore deliver reasonablyaccurate results in many cases, from regular hexagonal shapes[41] to convoluted fractal morphologies [42]. However,present computational resources open the road to practicalhigh-accuracy methods that can capture the optical propertiesof non-spherical particles, from the first principles of EM wavetheory [43–45, among others]. For a detailed survey of thetopic, we refer the interested reader to the monographs on thistopic authored and edited by Mishchenko et al [37, 46].
At any rate, most angular details in the single-particledifferential scattering cross-section are smoothed by averagingover the distribution of particle sizes, N(r), which is typicallyquite broad. The persistent diffraction peak survives averagingas does the rainbow, which is, to a good approximation, ageometrical optics (hence size-independent) feature.
Along the spectral dimension, macroscopic objects suchas aerosol and cloud particles have of course much smoother
8

Rep. Prog. Phys. 73 (2010) 026801 A B Davis and A Marshak
variations than molecules, particularly for absorption. Cross-sections in Lorenz–Mie theory are represented as follows:
ξλx(r) = πr2 × Qx(2πr/λ), (1)
where Qx is the efficiency ratio partitioned into scattering(x = s) and absorption (x = a) for a given size parameter.No sub-index is used for the extinction cross-section, the sumof scattering and absorption. In the limit of (liquid or ice)water spheres much larger than λ, we have Q ≈ Qs ≈ 2; inthe opposite (Rayleigh scattering) limit of very small particles,we have Q ≈ Qs ∝ (r/λ)4, hence
ξ(Rayleigh)
λs (r) ∼ r6/λ4. (2)
The overall cross-section for scattering4 ξλs averaged overa size distribution N(r) dominated by the population withr λ is thus expected to scale as r2, the mean square of theparticle size since that is the surface exposed to the incomingbeam. Moreover, the geometrical shape factor Q will beexactly 2 for spheres by Babinet’s principle [47]. Absorptionis more of a volume than surface process, so the correspondingcross-section ξλa will tend to scale as r3. It is also muchsmaller than ξλs because the imaginary part of the complexindex of refraction is generally much smaller than the realpart. Figure 4 shows the extinction cross-section (times dropletdensity, ‘σ ’ curve), and the ratio of the scattering to extinctioncross-section (‘0’ curve). We note that droplet absorptionstarts in earnest beyond 1.6 µm but, at the same time, there isless solar energy to absorb. We will see further on that multiplescattering makes bulk absorption a very strong function ofξλa ∝ 1 − 0.
Wavelengths where particles absorb the most are at apremium in remote sensing since they will give access to theeffective particle radius [48]
re = r3/r2. (3)
As for the extinction cross-section ξλ = ξλs + ξλa, it isempirically represented as a power law:
ξλ ∼ λ−α, (4)
where α is known as the Ångstrom exponent. Gammadistribution functions are a popular 2-parameter representationof N(r), namely,
N(r) ∼ rb−1 exp [−(b − 1)r/rm] , (5)
where rm is the mode (requiring b > 1) and b defines theshape of the distribution. For instance, the above-mentionedC1 distribution is obtained for rm = 4 µm and b = 7(leading to re = 6 µm). We note that (4) is exact for thisassumption in regimes where ξ(r) is a power law in the sizeparameter 2πr/λ.
In the limit of particles very small with respect to λ,the Rayleigh scattering cross-section in (2) is retrieved andα ≈ 4, which is the basis of the classic explanation of
4 We use an overscore to denote averages over disorder in the particlepopulation, both spatial and with respect to size.
Figure 4. Spectral dependence of cloud optical properties in thesolar spectrum. Single-scattering albedo 0 = ξ s/ξ (short dashes)in (18), asymmetry factor g (long dashes) from (20) and extinctionσ = ξ× droplet density (solid line, right-hand axis) are plottedversus wavelength λ for the ‘C1’ cloud droplet-size distribution.The VIS/NIR dividing line at 0.7 µm is highlighted, as well aswhere silicon-based sensors become too inefficient and othermaterials must be sought for light detection in the ‘shortwave’ IR(or SWIR) where the available solar radiation is dwindling anyway.
the blue color of clear skies. In the limit of particles verylarge with respect to λ, geometric optics become ever moreaccurate and we have ξλ(r) ∼ r2 irrespective of λ, andα is very small. Figure 4 shows the spectral dependenceof scattering and extinction cross-sections for cloud dropletsbased on Lorenz–Mie theory and the C1 distribution. Thissmall value of α contributes to the characteristic whitenessof clouds, but so does multiple scattering (as demonstratedfurther on). Aerosol particle distributions have α somewhere inbetween the Rayleigh and geometric-optics limits, and its valuefrom observations clearly informs us about the particle-sizedistribution.
All of the above contributions of EM wave theory are abouttransport coefficients encapsulated in particle cross-sectionsfor interaction with radiation. In particular, nothing has beensaid about propagation through the cloudy atmosphere viewedas an optical medium, nor about multiple scattering. Inthe next subsection we introduce the highly successful—butpurely phenomenological—theory of radiative transfer, with orwithout polarization. It is noteworthy that rigorous derivationof the polarized (a.k.a. ‘vector’) radiative transfer equationwas obtained only quite recently by Mishchenko [49] frommicrophysical predicates, i.e. Maxwell’s EM wave equationsand statistical optics. The key assumption is, as can beexpected intuitively, that the medium is ‘dilute’: inter-particledistances are large with respect to λ. Each particle is thereforein the far field of all the others. Mishchenko’s derivation isfor steady sources and spatially uniform particulate media. Hegeneralized his derivation to spatially variable media, but onlywhen the ‘clumps’ are small with respect to the MFP [50].
9

Rep. Prog. Phys. 73 (2010) 026801 A B Davis and A Marshak
Much of the work we present further on is for media that arespatially variable over a wide range of scales that typicallyinclude the MFP, and we also have a strong interest in transientsources (namely, pulsed lasers).
2.3. Mesoscopic transport model: radiative transfer equation
Liouville’s theorem states that Hamiltonian particle dynamicsunder a constant external force field F (x) preserves volumein the particle’s phase space, hence phase-space densityf (t, x, v) for non-interacting particles, where v is velocity.From there, Boltzmann’s equation expresses that any changein f (t, x, v) for an ensemble of particles is due tocollisions, thus providing a basis for kinetic theory. Thelinear Boltzmann/transport equation follows from the cleardistinction between ‘material’ particles, which are assumedvery massive (hence essentially stationary), and ‘transported’particles, which move relatively fast and can be scattered orabsorbed by the material. We can also drop the (F /mass)·∇vf
term that would normally appear in the Lagrangian derivativedf/dt since we can generally neglect the effects of externalforce fields on massless particles. We are left with a simpleEulerian relation for detailed balance in a small phase-spacevolume:
df
dt= ∂f
∂t+ v · ∇f = gains − losses. (6)
Now suppose that we are dealing with monokineticparticles, the so-called ‘1-group’ transport: v ≡ cΩ andf → f1δ(v − c)/c2, f1 is the particle density in the phasespace made of R
3 for x (or a subset thereof) and the associatedtwo-dimensional space of directions for Ω. It is temptingto view RT as a flow of light particles (photons), which itis not since Mishchenko’s [51] microphysical derivation ofthe RT equation (RTE) is purely classical. Radiant energy isnonetheless redistributed dynamically in space and time, andwe need to know how. Also, we prefer to work with radiance(a.k.a. specific intensity)
Iλ(t, x,Ω)=cEλf1λ(t, x,Ω), with Eλ =hνλ =ch/λ,
(7)
where h is Planck’s constant. Radiance has units ofW m−2 sr−1 nm−1. One often sees spectral radiance Iν =Iλ|dλ/dν| using wavenumber ν measured in the conventionalspectroscopy units of cm−1: ν = 107/λ, when λ is in nm. Inview of (6), this seven-dimensional field is constrained locallyby the monochromatic integro-differential 3D RTE[
1
c
(∂
∂t
)+ Ω · ∇ + σλ(x)
]Iλ
= σλs(x)
∫4π
Pλ(x,Ω′ · Ω) Iλ(t, x,Ω′) dΩ′
+ Qλ(t, x,Ω). (8)
Here, we useσλ(x) = n(x) × ξλ(x) (9)
to denote the extinction coefficient in m−1, where materialparticle density n is the integral of N(r), cf (5), over all values
of r . Like the advection term in (6), this is a net loss forthe radiant energy budget in a small volume around the lightbeam defined geometrically by the pair (x,Ω), so these twoterms are grouped on the left-hand side. On the other side ofthe equation, we have the gains. First, we have in-scatteringwhere σλs = nξs denotes the scattering coefficient while the‘phase function’ Pλ (cf figure 3) derives from the differentialcross-section for scattering, namely,
σλsPλ = n(x) × dξsλ
dΩ. (10)
Note that we normalize the phase function so that∫4π
Pλ(Ω′ → Ω) dΩ′ = 1, ∀Ω. Second, we have Qλ, denotinga (volume) source term.
Mathematically, there is no difference between the abovetime-dependent RTE and the linear Boltzmann equation usedin particle transport theory, primarily used for neutrons.Physically, they are fundamentally different since, as sketchedabove, the linear Boltzmann equation follows from coarse-grained particle dynamics [52] while the RTE follows fromMaxwell’s equations using statistical optics methods [51].At present, however, the rigorous derivation requires steadysources and essentially uniform optical media. The general(3D time-dependent) RTE in (8) remains a phenomenology.
We have so far neglected polarization. To accountfor the transport of polarized light, we need to redefine I
as a formal four-dimensional vector, and Pλ as a 4 × 4scattering matrix that can mix different polarization states.In his classic monograph [7], Chandrasekhar gives thecomplete phenomenological elaboration of polarized/vectorRT while Mishchenko’s microphysical derivation [51] capturespolarization by definition, being grounded in EM wave theory.We have also assumed axially symmetric scattering, meaningeither spherical or randomly oriented material particles.
Using (8), RT computations can be performed onefrequency at a time, and then integrated as necessary overλ. Because of this simplification of the radiation transportphysics, we will drop λ (or ν) subscripts from most of theremainder. Finally, one might be surprised that we retainthe possibility of time-dependence in a paper on clouds andsunlight, a very steady source indeed over time-of-flightdurations. The reason for this is that we will develop further ona strong interest in sources that are Dirac δ’s in time, both forheuristics and for exploratory observations using pulsed lasersources.
The important local scale in transport is the MFP ,which is the sole parameter of the basic transmission lawin homogeneous media of infinite extent. Indeed, ignoringmomentarily time-dependence, scattering, internal sources andthe spatial variability of σ , (8) reduces to Ω · ∇I = −σI . Fora given beam, distance from an arbitrary point x along Ω isdenoted s; we then have a simple ordinary differential equation(ODE) to solve, dI/ds = −σI , hence I (s) = I0 exp(−σs)
(Beer’s law). We can interpret physically I (s)/I0 from thisdirect transmission law as the probability that the transportedparticle will cover a distance s, or more, before suffering acollision of any type. The probability density function (PDF)
10

Rep. Prog. Phys. 73 (2010) 026801 A B Davis and A Marshak
of the random variable s is therefore σ exp(−σs). The qth-order moment of this PDF is 〈sq〉 = (q + 1)〈s〉q (q > −1),where (x) is Euler’s gamma function and, for q = 1,5
〈s〉 = = 1/σ (11)
is the MFP, from the given extinction of the infinite uniformmedium.
What if the optical medium is spatially heterogeneous?Then the transmission law becomes specific to the point x anddirection Ω of departure:
T (x,Ω; s) = exp
(−
∫ s
0σ(x + Ωs ′) ds ′
). (12)
So will the MFP, and all other moments of s. The spatial-directional and/or ensemble-average transmission law can bedenoted T (s) = T (x,Ω; s). What are its properties?
This fundamental question has been investigated recentlyby Kostinski [53], who proceeds from a refreshing discrete-point statistical perspective on particle transport theory ingeneral, as well as by the present authors [54], who usethe conventional (continuum-based) RTE. Either way, theprediction for T (s) is that it is sub-exponential in the followingsense: for the associated step PDF, |dT /ds|, moments obey〈sq〉 > (q + 1)〈s〉q for q > 1. This implies that the large-sdecay of T (s) is slower than the exponential law dictated by theactual MFP derived from the ensemble-average transmissionlaw. Moreover, this ensemble-average MFP 〈s〉 is greaterthan 1/σ(x), the naive prediction using (11). For a largeclass of media with long-range spatial correlations, ensemble-average MFP is indeed given by 1/σ(x) [54]. We can thinkof σ(x) as the extinction associated with the mean particledensity, i.e. n(x)ξ , noting that this assumption is equivalent tothe reasonable requirement of total mass or material particlenumber conservation.
The general ‘1+3+2 dimensional’ monochromatic RTproblem on (t, x,Ω) for a given medium becomes completelydetermined only after stating initial and boundary conditions,which we will defer until we discuss specific cloud geometries.At present, we only need to note (i) that the optical mediumM ⊆ R
3 can be considered convex with no loss of generality(just set coefficients to 0 as necessary) and (ii) that conditionson the boundary ∂M can be ‘absorbing’ (i.e. no incomingradiation) or express primary sources (e.g. solar illumination)or secondary sources (i.e. partial or total reflection, with orwithout bi-directional redistribution).
2.4. Macroscopic transport model: diffusion equation
In the case of clouds, we can go one step further awayfrom the microphysical model introduced in in section 2.2,leading to the RT equivalent of the hydrodynamic limit inkinetic theory. This involves averages of (8) over directionspace. To this effect, we introduce here the standard (z-axis)polar angles (θ, φ) to describe Ω, thus z = µ = cos θ ,x(y) =
√1 − µ2 cos(sin)φ and dΩ = dµ dφ.
5 We use 〈angular brackets〉 to denote ensemble averages of quantitiesdependent on random processes implicit in transport theory.
2.4.1. Definitions and derivation. Following the originalderivation by Eddington in 1916 [55], we define the moments
J (t, x) =∫
4π
I (t, x,Ω) dΩ, (13)
F (t, x) =∫
4π
ΩI (t, x,Ω) dΩ, (14)
K(t, x) =∫
4π
ΩΩI (t, x,Ω) dΩ, (15)
known in RT as the scalar (a.k.a. actinic) flux, vector flux andtensor flux, respectively. These quantities all have well-knowncounterparts in kinetic theory: U = J/c is the energy densityof the radiation field, F its current density and P = K/c itspressure tensor.
We then have the following expressions for theconservation of energy and momentum:
c−1 ∂J
∂t+ ∇ · F = −σa(x)J + qJ (t, x), (16)
c−1 ∂F
∂t+ ∇ · K = −σt(x)F + qF (t, x), (17)
where the new source terms follow from q(t, x,Ω) in (8)using the definitions in (13)–(14). Two new coefficients havealso appeared. First, we have the absorption coefficient,σa = σ − σs = (1 − 0)σ , where we introduce the veryuseful ‘single scattering albedo’ parameter:
0 = σs/σ. (18)
Second, we have the transport extinction,
σt = (1 − g)σs + σa = (1 − 0g)σ, (19)
where, letting µs = Ω′ · Ω
g = 2π
∫ +1
−1µsP(µs)dµs (20)
is known as the ‘asymmetry factor’ of the phase function,the mean cosine of the scattering angle. It is notable thatdroplet-size distributions observed in boundary-layer cloudsyield g ≈ 0.85 in the solar spectrum (cf figure 4) withremarkably small cloud-to-cloud variability [56]. Higher-levelice clouds (and most aerosol) tend to have somewhat smallervalues, g ≈ 0.8 [57] or even less [58]. Particles much smallerthan the wavelength are essentially Rayleigh scatterers, andtheir g is close to 0.
Can we close the system of equations in (16)–(17)? Asimple closure follows if we brutally truncate the expansionof I (t, x,Ω) in spherical harmonics at first order (a ‘P1’approximation in transport terminology):
I (t, x,Ω) ≈ [J (t, x) + 3Ω · F (t, x)] /4π (21)
and, accordingly,
P(x,Ω′ · Ω) ≈ [1 + 3g(x)Ω′ · Ω]/4π (22)
11

Rep. Prog. Phys. 73 (2010) 026801 A B Davis and A Marshak
for the phase function. This immediately tells us that theradiation pressure tensor K/c from (15) is isotropic, i.e. off-diagonal components vanish and on-diagonal components areequipartitioned (each one equal to 1/3 of the radiant energydensity J/c). By substitution into (17), we obtain
∂tF + ∇J/3 = −σt(x)F + qF (t, x), (23)
which complements the exact conservation law in (16).The PDE system in (16) and (23) is known as the
telegrapher’s problem. It is causal in the sense that bulkvelocities do not exceed c. However, the preferred diffusionmodel uses one more approximation: to neglect the timederivative in (23), hence
F = −∇J/3σt(x) + qF (t, x)/σt(x). (24)
This is the desired constitutive law, a closed expression for thevector flux that can be explicitly combined with (16). It is theradiative counterpart of Fick’s law of diffusivity,
F = −(D/c)∇J, (25)
whereD(x) = c/3σt(x) = ct(x)/3, (26)
plus a local correction for source anisotropy, namely,t(x)qF (t, x). Equations (16) and (24) thus define theradiation diffusion model, as an approximation to full time-dependent 3D RT theory. We can expect violations of causalityin this approximation, but they are limited for the most part toearly times in the important case of ‘δ-in-time’ sources. Weexperimented with the more accurate telegrapher’s transportproblem in (16) and (23) for space–time Green functionestimation [59], but the resulting expressions are complex, andit may be possible, in practice, to avoid those regions of space–time where diffusion breaks down.
Finally, we note that there are other derivations of themacroscopic transport model encapsulated in diffusion theory,with the most insightful coming from asymptotic analysis ofthe general RTE; the interested reader is referred to the originalpapers by Larsen [60] and Pomraning [61].
2.4.2. Reconsideration of directional details. In view of(25)–(26), we recognize that the transport MFP
t = 1/σt (27)
is a locally defined length scale that matters a lot in diffusiontheory; in the absence of absorption, there is no other to workwith. It is easy to see that t is larger than in (11) by a factor
1
1 − 0g=
∞∑n=0
(0g)n. (28)
It can be shown [62, 63] that the nth term in this sum isthe contribution from the order n in an infinite sequence offorward-biased scattering events, as quantified by g in (20).We can thus think of the transport MFP as the distance covered
on average by a collimated beam of light incident on a forward-scattering medium before it has all but lost the memory of itsoriginal direction.
Underlying this spatial ramification of a directionalmemory effect, there is a diffusion process in direction space.If a light beam starts, for simplicity, with a vertical directioncosine µ0 = 1, hence θ0 = 0, its first scatter will send it offin a random azimuthal direction φ1 and a random polar angleθ1, according to the scattering phase function. This is nothingmore than a first step in a discrete-time random walk on theunit sphere: (θn, φn), n ∈ N. Since that space is finite, weestimate that n ≈ 1/(1−0g) is the characteristic number ofsteps required to ‘dilute’ the original collimated beam over thewhole sphere. Now, each step into this directional memory lossprocess leaves a trace in propagation space. The first step s1
moves, on average, the transported particle a distance 〈s〉 =
along the positive z-axis; the next step moves it 〈µ1s〉 = g
further along the same axis and 0 times that to factor in thepossibility of suffering an absorption. That is the physicalinterpretation of the first two terms of the expansion in (28),and a recursion argument [62] shows that subsequent stepscontribute all the others.
Reconsidering figure 3, it is intuitively clear that thisdirectional diffusion may be better described as a 2-levelprocess: first move around within the forward diffractionpeak, based on another (smaller) value of the elementary stepvariance, then populate the rest of the sphere using an effectiveg that is smaller than 0.85. The first part captures the spirit of‘small-angle’ approximation in RT. It plays an important rolein the transmitted radiation field of hazes and cirrus clouds,and it is responsible for the silver lining of optically thick 3Dclouds (often a visually stunning phenomenon). However, it isnot important for the reflected radiation. Neither is it importantfor the truly diffuse transmission at any optical depth, since itis a perturbation around the direct beam. In contrast, diffusetransmission as well as reflection will be dominated by thesecond angular diffusion process controlled by an effectiveg′ < g. We define g′ formally in the next subsection.
2.4.3. Extension of the range of validity. Under whatconditions do we expect the diffusion/P1 theory to be areasonable approximation to atmospheric radiation transport?It is in essence an asymptotic limit of transport [60, 61] wherethe small parameter is the ratio of the transport MFP to theouter scale of the system. In other words, we recognize herethe small Knudsen numbers that we have already mapped to theopaque cloudy regions of the atmosphere. Another conditionthat favors diffusion (thinking of long random walks) is weakabsorption. In the limit of no absorption (no volume sinks)whatsoever and no volume sources, the diffusion equations in(16) and (24) can be combined into the familiar heat/diffusionequation: [
c−1 ∂
∂t− ∇ · (D∇)
]J = 0. (29)
If furthermore the boundary sources are steady and extinction(hence diffusivity) is uniform, we obtain the Laplace equation,−∇2J = 0, for which many analytical and numerical solutionmethods exist.
12

Rep. Prog. Phys. 73 (2010) 026801 A B Davis and A Marshak
What are diffusion/P1 theory’s main vulnerabilities? Evenin regimes where physical intuition tells us that radiationtransport should be diffusive, we can maybe improve itsperformance. Indeed, we suspect that the 2-term spherical-harmonic expansions of I (t, x,Ω) in (21) and certainly ofP(x, µs) in (22) can be very unrealistic in clouds. In the caseof radiance, (21) fails near collimated sources such as solar orlaser illumination. In the case of the phase function, we recallthat cloud particles have very forward-peaked scattering. Towit, (22) yields unphysical negative values in backscatteringdirections if g(x) > 1/3, which includes the values of interestfor clouds (0.75–0.85).
The fix is the same for both problems: the radiance field isbroken naturally into its un-collided and diffuse components,and the phase function is recast as the sum of a Dirac δ
in the forward direction—physically, just a boost in ballisticpropagation—and a residual 2-term expansion. So we think of(21) as only the diffuse radiance, and replace the 1-parametermodel phase function in (22) with the 2-parameter model in
P(x, µs) ≈ 1
4π[f (x)2δ(1 − µs)
+ (1 − f (x))(1 + 3g′(x)µs)]. (30)
This leads to the following rescaling of the local opticalproperties:
σ ′ = (1 − 0f )σ,
1 − ′0 = 1
1 − 0f(1 − 0),
1 − ′0g
′ = 1
1 − 0f(1 − 0g),
(31)
where f is the fraction of ‘δ-scattering.’ The smaller extinctionreflects the boost in ballistic propagation while the effectiveabsorption is increased. Finally, physically meaningfulvalues of
g′ = g − f
1 − f(32)
can now go up to 1/3(1 − f ) in (30) and (31); so it is better ifwe can rationalize f 2/3.
Following Joseph et al [64], we can take f = g2, henceg′ = g/(1 + g), because it fits the two first spherical-harmonicmoments of the popular Henyey–Greenstein (H–G) modelphase function [65] illustrated in figure 3. It is given by
P(µs) =(
1
4π
)1 − g2
(1 + g2 − 2gµs)3/2, (33)
and has gl as its lth spherical-harmonic moment. For liquidwater clouds, where g ≈ 0.85, we obtain f ≈ 0.72(exceeding 2/3), hence σ ′ ≈ 0.28σ and g′ ≈ 0.46 when ′
0 = 0 = 1. Alternatively, the whole diffraction peak—half of the scattered energy for particles with very largesize parameters (by Babinet’s principle)—can be recast asprolonged propagation in the original direction: hence f = 0.5(not exceeding 2/3), thus σ ′ ≈ 0.5σ and g′ ≈ 0.7 when ′
0 = 0 = 1.
3. Cloud geometry models, solutions of thecorresponding RT problems, and applications
Several things that happen to the radiant energy after leaving itssource have already been mentioned—propagation, scatteringand absorption—but there is one more possibility. Radiationcan propagate to a boundary point and then escape the mediumaltogether. When integrated over direction and space, escapingradiation matters hugely for the radiant energy balance of themedium.
This leads us to the natural mathematical completion ofthe RT problem statement by setting the boundary conditions(BCs). In a nutshell, we need to quantify the radiant energyentering or re-entering, via reflection, the medium through ∂M ,the boundary of a convex set M ⊆ R
3 where we wish to solvethe RTE.
3.1. The plane-parallel slab
3.1.1. Boundary conditions and escaping radiation. Thesimplest possible cloud geometry is a plane-parallel slabMpp(H) = x ∈ R
3; 0 < z < H and the simplest BCsare the ‘absorbing’ type, expressing that no radiation entersMpp(H):
I (t, x, y, 0,Ω) = 0, z = µ > 0, (34)
I (t, x, y, H,Ω) = 0, z = µ < 0, (35)
for t 0 (the usual time domain) and (x, y)T ∈ R2. Of course,
in the above case of absorbing BCs, the source term Q(t, x,Ω)
in (8) will not vanish everywhere, and it can in fact be usedto specify solar irradiation of Mpp(H). We model this internalsource as a steady spatially uniform mono-directional beamaligned with Ω0 = Ω(θ0, φ0) that is directly transmitted fromthe z = 0 plane, and then once scattered:
Q(x,Ω) = F0σs(x) P (x,Ω0 → Ω)
× exp
[−
∫ z
0σ
(x − 0x
z − z′
0z
, y − 0y
z − z′
0z
, z′)
dz′
0z
],
(36)
where F0 is the (spectral) solar flux in W m−2(nm−1 ofwavelength, as needed). Note that we have encoded herea beam entering the slab at z = 0, which we will alwaysview as the illuminated upper boundary (z increases downwardhere). Alternatively, we can set Q(x,Ω) ≡ 0 and use astraightforward variation of (34) to do the same job:
I (x, y, 0,Ω) = F0δ(Ω − Ω0), µ, µ0 > 0, (37)
where µ0 = 0z. In this case, the estimated radiance field willcontain the un-collided (directly transmitted) light as well asthe diffuse light. For an isotropic source, the right-hand sideof (37) would be simply F0/π . We note that we can assumeF0 = 1 without loss of generality since the linearity of the RTEcan be invoked to sum over wavelengths, as weighted by F0λ,after the fact.
13

Rep. Prog. Phys. 73 (2010) 026801 A B Davis and A Marshak
If the cloudy medium Mpp(H) is above a partiallyreflective surface at z = H , then there is re-entering radiationto account for. In this case, (35) is modified, becoming
I (x, y, H,Ω)
= α(x, y)
∫µ′>0
Ps(x, y,Ω′ → Ω)I (x, y, H,Ω′)dΩ′,
µ < 0, (38)
which is designed to look like the in-scattering term in (8).Here, α is the local surface albedo, defined as the ratio ofup-welling to down-welling hemispherical fluxes,
F±(x) =∫ +π
−π
dφ
∫ ±1
0I (x,Ω)µ dµ, (39)
at z = H :
α(x, y) = F−(x, y, H)/F+(x, y, H). (40)
The surface phase function, denoted here by Ps, is normalizedto
∫µ′>0 Ps(Ω′ → Ω)dΩ′ = 1, ∀µ < 0; it is used
here as a representation of the bi-directional reflectancedistribution function (BRDF) [66, 67]. Two contrastingexamples of surface scattering/reflection are the isotropic(a.k.a. Lambertian) case, Ps(Ω′ → Ω) = µ′/π andthe specular (a.k.a. Fresnel) case, Ps(Ω′ → Ω) =δ(µ′ + µ)δ(φ′ − φ).
Of particular interest in cloud remote sensing are theradiance fields that describe steady solar radiation escapingthe plane-parallel medium at its upper and lower boundaries:I (x, y, 0,Ω), µ < 0 and I (x, y, H,Ω), µ > 0, respectively,for observers above and below the cloud layer. It is convenientto normalize the reflected radiance such that it reads as theeffective albedo the cloud would have if the (sampled) radiancefield was uniform in direction:
R(x, y,Ω) = πI (x, y, 0,Ω)/µ0F0, µ < 0; (41)
T (x, y,Ω) = πI (x, y, H,Ω)/µ0F0, µ > 0, (42)
where we have similarly recast the transmittance field.These functions describe how the cloud layer redistributesthe spatially uniform and unidirectional solar beam bothhorizontally and directionally. In space-based observation, oneis often looking straight down (Ω = −z) at the nadir radiancefield while the detector overflies the scene. In ground-basedobservation, a static detector often looks straight up (Ω = +z)and captures zenith radiance as the clouds are advected by(Taylor’s ‘frozen turbulence hypothesis’ is often invoked tointerpret a time series of zenith radiance as an approximationof the horizontal spatial variations).
In the simpler diffusion theory for RT in the denser clouds,the BCs need to be stated as well. Physically, one needs toconstrain the fluxes of radiant energy crossing the upper andlower boundaries. In plane-parallel geometry, we first needto evaluate hemispherical fluxes in (39) that cross an arbitraryconstant-z plane in the ± directions, for given J and F :
F± = J/2 ± Fz
2, (43)
from (13)–(14) and (21). Restoring time-dependence, theabsorbing BCs in (34)–(35) thus become
4F+(t, ρ, 0) = J (t, ρ, 0) + 3χFz(t, ρ, 0) = 0, (44)
4F−(t, ρ, H) = J (t, ρ, H) − 3χFz(t, ρ, H) = 0, (45)
for all ρ = (x, y)T ∈ R2 and t > 0 and where, until further
notice, we take χ = 2/3. In the above case of absorbingboundaries, we need at least one non-vanishing volume sourceterm. For the steady solar beam, (36) yields
qJ (x) = F0σs(x, y, z)
× exp
[−
∫ z
0σ
(x − 0x
z − z′
0z
, y − 0y
z − z′
0z
, z′)
dz′
0z
],
(46)
qF (x) = qJ (x)g(x)Ω0. (47)
When the surface at the lower boundary is partially reflective,as in (38), we mandate the time-dependent version of (40) and,accordingly, the left-hand side of (45) becomes
[1 − α( ρ)]J (t, ρ, H) − 3χ [1 + α( ρ)]Fz(t, ρ, H) = 0. (48)
Solar radiation escaping a plane-parallel cloud, a prioriwith internal 3D structure, is characterized in diffusion theoryby the local hemispheric fluxes
R( ρ) = F−( ρ, 0)/µ0F0 = J ( ρ, 0)/2µ0F0, (49)
T ( ρ) = F+( ρ, H)/µ0F0 = J ( ρ, H)/2µ0F0, (50)
when (44)–(45) have been used, recalling that this assumesthe internal source model in (46)–(47). Consequently, thetransmittance field here is only for the diffuse component; iftotal transmittance is required, one must add the local directlytransmitted flux (normalized to the incident flux):
Tdir(x, y) =
exp
[−
∫ H
0σ
(x − 0x
H − z
0z
, y − 0y
H − z
0z
, z
)dz
0z
].
For an isotropic boundary source, we have F0/π on theright-hand side side of (37); its diffusion counterpart in (44)is then
4F+(t, ρ, 0) = J (t, ρ, 0) + 3χFz(t, ρ, 0) = 4F0. (51)
Notably, the same happens to the collimated source modelat the upper boundary in (37) since the diffusion frameworkcannot distinguish directional and isotropic boundary sources.In this case, it is conventional to treat χ , which multipliesFz(t, ρ, 0) and Fz(t, ρ, H) in boundary conditions (44)–(45),as an adjustable parameter that can differ—although typicallynot much—from 2/3. This numerical parameter is knownas the ‘extrapolation length’ (reckoned in units of t) andit enables diffusion results to follow more closely transport-theoretical predictions. Physically, χ is used to compensate forthe fully expected weakness of diffusion theory in the radiativeboundary layer, i.e. up to 1–2 times t in vertically measureddistance from either boundary. There is no violation of energyconservation here as long as the same substitution is made in
14

Rep. Prog. Phys. 73 (2010) 026801 A B Davis and A Marshak
(49)–(50) for the hemispherical fluxes in the opposite direction(i.e. for escaping radiation). Specifically, we now have
R( ρ) = J ( ρ, 0)/2F0 − 1, (52)
T ( ρ) = J ( ρ, H)/2F0, (53)
where it is understood that (i) the reflected flux must now bederived from an estimate of J ( ρ, 0) that includes the incomingradiation and (ii) the transmitted flux is now diffuse + direct.
3.1.2. Mainstream one-dimensional radiative transfer. Sofar, we have made no assumptions about the internal structureof the plane-parallel medium, nor about the spatial variationsof the optional lower surface BRDF. A widespread assumptionthat eases computations is exact translational symmetry in thehorizontal ( ρ) plane. This leads to the so-called 1D RT theory6
where optical properties and at least the radiance field canstill vary in the vertical (z) direction. This is of course agross approximation of real clouds that should always be—but still too rarely is—questioned before use. Dependingon the specifics of the application (cloud type, tolerance toerror, etc), it is not necessarily a bad approximation, but oftenis (cf section 6).
For a comprehensive survey of computational techniquesfor solving the 1D RTE, we refer the interested reader to themonograph edited by Lenoble [68]. The most popular areidentified by their approach to Ω-space: spherical harmonics(‘PN ’ methods) and discrete ordinates (‘SN ’ methods); bothapproaches benefit from Fourier mode decoupling in theazimuthal variable that follows directly from the invariance ofthe slab medium and solar source under horizontal translation.The adopted solutions in z-space are quite diverse: coupledODEs, eigenvalue methods, Gauss–Seidel iteration, successiveorders of scattering, invariant embedding, ‘adding/doubling’(illustrated below in 1D, equivalently, S2 theory) or any othertechnique.
One class of 1D RT models is fully tractable, and thereforeextensively used in atmospheric radiation science: uniformslabs in the diffusion/P1 approximation derived above and/orfor two-stream/S2 models, i.e. when the angular quadrature isreduced to two beams [69, 70]. The P3 model was also workedout in closed form (as a special case of the S4 model withGaussian quadrature points and weights) [71]. It naturallyoutperformed the standard P1 model [72, 73] and will likelyreplace it over time in GCM shortwave schemes.
These simplified angular representations are expected tobecome more accurate as the cloudy medium becomes moreopaque, i.e. optical thickness
τ = σH = H/ (54)
increases with H for a given extinction σ , equivalently, theMFP = 1/σ decreases for a given geometrical thicknessH . Very few other cloud geometries are amenable tocompletely analytical treatment, one exception being uniformspheres within the diffusion approximation (cf section 3.3 and
6 In the atmospheric RT community, only spatial dimensions are counted upfront.
references therein). Although far more relevant to aerosolsthan clouds, the opposite asymptotic limit of transport theory,τ vanishingly small, is amenable to the single-scatteringapproximation. This computation, including flux estimationvia angular integration, can be performed analytically for anumber of geometries including slabs [74] and spheres [75].
In the two-stream model, diffusion-type equations arisefor the sum and difference of the up- and down-welling fluxesand conversely, using the correspondence in (43). Intuitively,this plane-parallel cloud geometry may be a reasonableapproximation to solar RT in the real world for single-layeredunbroken stratiform clouds, and possibly better still if spatialand/or angular integrals are targeted, as in radiation energybudget modeling, for instance, in GCMs.
3.1.3. 1D ‘adding/doubling’ and diffusion theory for 0 = 1.In the procedure outlined above to derive boundary-leavingradiances and fluxes, one necessarily solves the transport ordiffusion equations for all the points in the medium. Thismay not be optimal when one is only interested in the overallradiation budget, let alone remote sensing applications, whereonly radiances and fluxes at the boundaries matter. Theadding/doubling method can be used to obtain directly R andT as functions of 0 in [0, 1], g in [−1, +1] and τ 0. Toillustrate this computational technique as well as the essentialtransport physics of uniform slab clouds, we will invoke‘literal’ 1D RT, i.e. where the entire steady-state radiance fieldis reduced to I+, I− expressed in watts, with no steradians oreven m2 to worry about. In one spatial dimension, the phasefunction reduces to the discrete probabilities of scatteringforward, pf = (1 + g)/2, or backward, pb = 1 − pf =(1 − g)/2.
Suppose we know the reflectivity/albedo R = I−(0)/F0
and transmittance T = I+(H)/F0 of a 1D ‘slab’ (i.e. theinterval [0, H ]), for given optical properties σ, 0, g. Ifthese local properties are all uniform between z = 0 andz = H , then only the non-dimensional product in (54) matters;we can take either H or (hence σ ) as unity without loss ofgenerality. Knowing R, T (τ ), can we compute it for τ + δτ ,where δτ 1? If we denote r, t = R, T (δτ ), then it isnot hard to show that
R + δR = r + Rt2/(1 − Rr) (55)
andT + δT = tT /(1 − Rr), (56)
where the 1/(1 − Rr) factor accounts for any number ofreflections between the two layers: t × [
∑∞n=0(Rr)n] × T in
transmission and without the last T but with R × t insteadfor reflection. Since the additional layer is infinitesimallythin, we have r, t ≈ 0+, 1−, hence R + δR, T + δT ≈r + Rt2(1 + Rr), tT (1 + Rr). More specifically, we have
r = 0(1 − g)δτ/2 (57)
andt = 1 − δτ + 0(1 + g)δτ/2 (58)
15
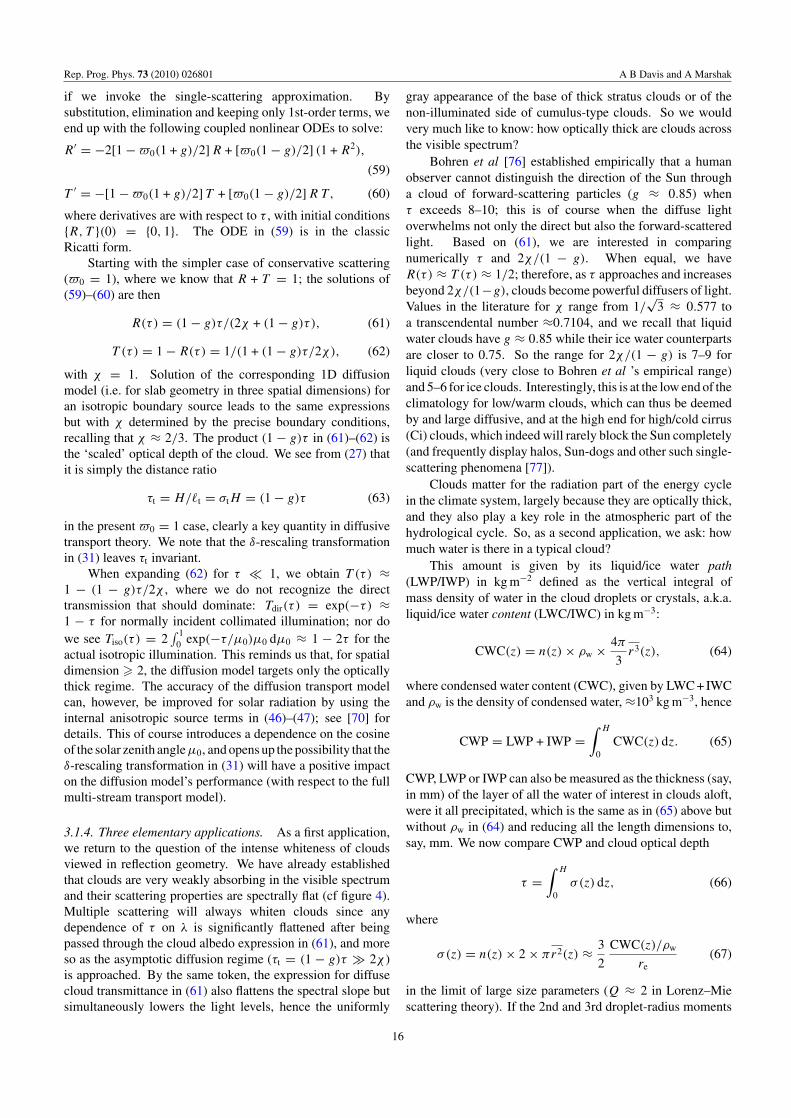
Rep. Prog. Phys. 73 (2010) 026801 A B Davis and A Marshak
if we invoke the single-scattering approximation. Bysubstitution, elimination and keeping only 1st-order terms, weend up with the following coupled nonlinear ODEs to solve:
R′ = −2[1 − 0(1 + g)/2] R + [0(1 − g)/2] (1 + R2),
(59)
T ′ = −[1 − 0(1 + g)/2] T + [0(1 − g)/2] R T, (60)
where derivatives are with respect to τ , with initial conditionsR, T (0) = 0, 1. The ODE in (59) is in the classicRicatti form.
Starting with the simpler case of conservative scattering(0 = 1), where we know that R + T = 1; the solutions of(59)–(60) are then
R(τ) = (1 − g)τ/(2χ + (1 − g)τ), (61)
T (τ) = 1 − R(τ) = 1/(1 + (1 − g)τ/2χ), (62)
with χ = 1. Solution of the corresponding 1D diffusionmodel (i.e. for slab geometry in three spatial dimensions) foran isotropic boundary source leads to the same expressionsbut with χ determined by the precise boundary conditions,recalling that χ ≈ 2/3. The product (1 − g)τ in (61)–(62) isthe ‘scaled’ optical depth of the cloud. We see from (27) thatit is simply the distance ratio
τt = H/t = σtH = (1 − g)τ (63)
in the present 0 = 1 case, clearly a key quantity in diffusivetransport theory. We note that the δ-rescaling transformationin (31) leaves τt invariant.
When expanding (62) for τ 1, we obtain T (τ) ≈1 − (1 − g)τ/2χ , where we do not recognize the directtransmission that should dominate: Tdir(τ ) = exp(−τ) ≈1 − τ for normally incident collimated illumination; nor dowe see Tiso(τ ) = 2
∫ 10 exp(−τ/µ0)µ0 dµ0 ≈ 1 − 2τ for the
actual isotropic illumination. This reminds us that, for spatialdimension 2, the diffusion model targets only the opticallythick regime. The accuracy of the diffusion transport modelcan, however, be improved for solar radiation by using theinternal anisotropic source terms in (46)–(47); see [70] fordetails. This of course introduces a dependence on the cosineof the solar zenith angleµ0, and opens up the possibility that theδ-rescaling transformation in (31) will have a positive impacton the diffusion model’s performance (with respect to the fullmulti-stream transport model).
3.1.4. Three elementary applications. As a first application,we return to the question of the intense whiteness of cloudsviewed in reflection geometry. We have already establishedthat clouds are very weakly absorbing in the visible spectrumand their scattering properties are spectrally flat (cf figure 4).Multiple scattering will always whiten clouds since anydependence of τ on λ is significantly flattened after beingpassed through the cloud albedo expression in (61), and moreso as the asymptotic diffusion regime (τt = (1 − g)τ 2χ )is approached. By the same token, the expression for diffusecloud transmittance in (61) also flattens the spectral slope butsimultaneously lowers the light levels, hence the uniformly
gray appearance of the base of thick stratus clouds or of thenon-illuminated side of cumulus-type clouds. So we wouldvery much like to know: how optically thick are clouds acrossthe visible spectrum?
Bohren et al [76] established empirically that a humanobserver cannot distinguish the direction of the Sun througha cloud of forward-scattering particles (g ≈ 0.85) whenτ exceeds 8–10; this is of course when the diffuse lightoverwhelms not only the direct but also the forward-scatteredlight. Based on (61), we are interested in comparingnumerically τ and 2χ/(1 − g). When equal, we haveR(τ) ≈ T (τ) ≈ 1/2; therefore, as τ approaches and increasesbeyond 2χ/(1−g), clouds become powerful diffusers of light.Values in the literature for χ range from 1/
√3 ≈ 0.577 to
a transcendental number ≈0.7104, and we recall that liquidwater clouds have g ≈ 0.85 while their ice water counterpartsare closer to 0.75. So the range for 2χ/(1 − g) is 7–9 forliquid clouds (very close to Bohren et al ’s empirical range)and 5–6 for ice clouds. Interestingly, this is at the low end of theclimatology for low/warm clouds, which can thus be deemedby and large diffusive, and at the high end for high/cold cirrus(Ci) clouds, which indeed will rarely block the Sun completely(and frequently display halos, Sun-dogs and other such single-scattering phenomena [77]).
Clouds matter for the radiation part of the energy cyclein the climate system, largely because they are optically thick,and they also play a key role in the atmospheric part of thehydrological cycle. So, as a second application, we ask: howmuch water is there in a typical cloud?
This amount is given by its liquid/ice water path(LWP/IWP) in kg m−2 defined as the vertical integral ofmass density of water in the cloud droplets or crystals, a.k.a.liquid/ice water content (LWC/IWC) in kg m−3:
CWC(z) = n(z) × ρw × 4π
3r3(z), (64)
where condensed water content (CWC), given by LWC + IWCand ρw is the density of condensed water, ≈103 kg m−3, hence
CWP = LWP + IWP =∫ H
0CWC(z) dz. (65)
CWP, LWP or IWP can also be measured as the thickness (say,in mm) of the layer of all the water of interest in clouds aloft,were it all precipitated, which is the same as in (65) above butwithout ρw in (64) and reducing all the length dimensions to,say, mm. We now compare CWP and cloud optical depth
τ =∫ H
0σ(z) dz, (66)
where
σ(z) = n(z) × 2 × πr2(z) ≈ 3
2
CWC(z)/ρw
re(67)
in the limit of large size parameters (Q ≈ 2 in Lorenz–Miescattering theory). If the 2nd and 3rd droplet-radius moments
16

Rep. Prog. Phys. 73 (2010) 026801 A B Davis and A Marshak
have the same vertical profile, i.e. re in (3) is invariant withaltitude, then [78]
τ = 3
2
CWP/ρw
re. (68)
Equivalently, τ is 1.5× the ratio of CWP and re when expressedin the same units. As an example, we can take τ = 15,which yields the reasonable cloud albedo value of R = 0.63for the canonical g = 0.85 and χ = 2/3 in (61); we alsotake re = 10 µm, another often-used value (although far lessjustifiably than g = 0.85). We then find that CWP is only0.1 mm. This illustrates how so little water, if dispersed intomany small particles in the atmosphere, can provide powerfulreflectivity for the planet. Adding water vapor to the mix raisesthe ‘precipitable’ water thickness to several millimeters in mostlocales. So clouds use only a small fraction of all the water inthe atmosphere.
Finally, we note that solving (68) for CWP makes clearwhy both τ and re are highly desirable retrieval products incloud remote sensing.
As a third and final application, we turn to the above-mentioned indirect effect of aerosols on climate via cloudalbedo, a.k.a. the Twomey effect [16]. For clouds formingin clean air, we can count on n ≈ 100 CCN cm−3; in pollutedair, this number can be 10× more. Consequently, r3 (hence re)will have to go down and, for a fixed cloud water budget givenby CWP in (65) and (68), τ will necessarily go up. In viewof (61), this means more reflective clouds. In the absence offurther feedbacks, this will cool the climate. If, due to the largerpopulation of smaller droplets, precipitation is also delayedor even suppressed, the longer life-cycle of clouds goes inthe same direction. The tough question about dynamical andmicrophysical feedbacks then becomes critically important,and is being actively investigated.
3.1.5. 1D ‘adding/doubling’ and diffusion theory for 0 < 1.The case of non-vanishing absorption (0 < 1) is moreinvolved. For the diffusion or S2 models, we find
R(τ) = 1 − X2
1 + X2 + 2X coth Y(69)
and
T (τ) = 2X cosh Y
1 + X2 + 2X coth Y, (70)
where
X = χ√
d(1 − 0)/(1 − 0g) = χt/Ld (71)
andY =
√d(1 − 0)(1 − 0g) τ = H/Ld (72)
with d = 1, 2, 3 being the number of spatial dimensions. It isreadily shown that all the factors of 3 in (21)–(26) and (44)–(45)ultimately come from the three spatial dimensions consideredtherein. In particular, the d = 1 case (with χ = 1) in (69)–(72)is the general solution of the Riccati ODE system in (59)–(60).The d = 3 case has naturally attracted considerable attention inthe atmospheric RT literature [70, 79, 80, among many others].
A new length scale appears:
Ld = t
/√3(1 − 0)
1 − 0g= 1/
√3(1 − 0)(1 − 0g) σ
(73)
in d = 3; quantities X and Y are ratios of Ld with theextrapolation length and the slab thickness, respectively. Itis commonly known as the ‘diffusion length’ of the medium.When Ld → ∞ (0 → 1), the expressions in (69)–(70)revert to (61)–(62) for any choice of d. The key (local) scaleratio here,
t/Ld = X/χ =√
3(1 − 0)
1 − 0g, (74)
is known as the ‘similarity’ factor. We note that the δ-rescalingtransformation in (31) leaves both X and Y , hence t and Ld,invariant. So no performance improvement can be expectedhere; again, that calls for diffuse/direct separation and bettersolar source representation using anisotropic internal sourceterms.
We therefore expect absorption to matter when Ld H
(Y 1), equivalently,√
(1 − 0g)/3(1 − 0) τt = σtH ,which in diffusion theory should itself be unity. In this non-conservative case, the finite rate of radiant energy absorption inthe slab is A(τ) = 1−[R(τ)+T (τ)] in units of F0. Like R(τ),A(τ) rises from 0 to an asymptotic value. For the isotropicsource model leading to (69)–(70) in three spatial dimensions,we have
A(∞) = 1 − R(∞) = 2X
1 + X≈ 2χ
√3(1 − 0)
1 − 0g, (75)
where we recognize the ratio in (74). This is a strong functionof (1 − 0) that results physically from the effectivenessof absorption when the transport is dominated by multiplescattering. To assess the power of multiple scattering as acatalyst of absorption, we focus on clouds where A(∞) ≈R(∞) ≈ 1/2. This occurs when 1 − 0 ≈ (1 − g)/48χ2,which is in the range 0.006–0.01 (depending on the choiceof χ ) when g = 0.85: less than 1% of the collisions resultin absorption. Furthermore, returning to finitely thick clouds,the approach to this asymptotic regime is exponentially fast,going as T (τ) ∝ exp[−τt
√3(1 − 0)/(1 − 0g)]. This high
sensitivity of cloud reflectivity to (1−0) is excellent news forremote sensing determination of re. Recall from section 2.2that σa = n ξa scales roughly as r3, so (1 − 0) will goas re. Fortunately there are several NIR wavelengths wherecondensed water has absorption bands. We can thus link cloudsnot only to the energy cycle (via r2) but also to the water cycle(via r3).
Absorption by cloud particles has important consequencesfor the solar radiation energy budget estimation as well asfor satellite and ground-based remote sensing, particularly ofcloud droplet size since, as previously noted, 1 − 0 = σa/σ
scales as re. On a related note, the rapidly flat asymptoticbehavior of R(τ) as τ → ∞ explains why opaque aerosolplumes composed of smoke from wild fires or volcanic ash are
17

Rep. Prog. Phys. 73 (2010) 026801 A B Davis and A Marshak
a barely bluish shade of gray, and sometimes almost white, inspite of the tiny size of the particles. They may be Rayleigh-type scatterers, but they are also strongly absorbing; therefore,as in the case of clouds, multiple scattering quickly flattens thespectral behavior as opacity increases.
Since diffusion naturally delivers boundary fluxes andabsorption rates, it is ideally suited for computation of the solarradiation budget. Beyond the version presented here explicitly,one can include the important dependence on solar zenith angle(SZA) cosine µ0, which by definition varies over the globe,if the more sophisticated (direct/diffuse separated) version ofthe model is used. It is in fact the one used routinely in thistask for GCM modeling, where it is known as the δ-Eddingtonmodel [70]. Unresolved spatial variability, however,remains a challenge in this application, to be discussedfurther on.
For remote sensing applications, one needs to go a stepfurther and access the dependence on the viewing geometry.This geometry is captured by µ and φ − φ0, the difference inazimuth between the (the so-called ‘principal’) plane, whichcontains the normal to the slab and the Sun and the observer’splane. In view of the sheer volume of remote sensing data, wewould like to do this without reverting to numerical solutionsof the full (multi-stream) 1D RTE. That is precisely the goalof ‘asymptotic’ RT theory. For a comprehensive survey of thismodeling framework and numerous applications, we refer theinterested reader to Kokhanovsky’s recent review paper [81].
3.2. A new application for 1d RT: exploitation of the solarbackground in lidar
One person’s noise is another person’s signal. In this section,we will show two examples of how noise can be treated asa signal; the ‘new’ signal can be then used for reaping a newharvest of information on clouds. We target ground- and space-based lidars.
3.2.1. Ground-based micro-pulse lidar (MPL). MPL,developed in 1992 [86], is now widely used to retrieve heightsof cloud layers and vertical distributions of aerosol [87].Conventional lidar observation is predicated on 1D time-dependent RT in the single-scattering limit in the special caseof scattering through 180. A periodic train of laser pulsesis transmitted into the vertical direction and the collocatedreceiver points in the same direction, with a FOV just bigenough to contain, within tolerance, the slightly divergingtransmitted beam. The MPL’s time-dependent returned signalis proportional to the amount of light backscattered byatmospheric molecules, aerosols and clouds. Measured photoncounts are converted into attenuated backscatter profiles. Inthis process, noise sources need to be accounted for [88, 89].A significant source of noise present at all times is solarbackground light measured by the MPL detector in additionto backscattered laser light.
When lidars point straight up, the background noise isthe diffusely transmitted sunlight in zenith radiance, whichhas been extensively used to retrieve cloud optical properties[90, 91]. However, the solar background signal is given in units
Figure 5. Normalized zenith and nadir radiances versus cloudoptical depth. Calculations from the 1D DIScrete Ordinate RT(DISORT) code [82] for SZA = 60. Surface is black and the C1phase function, as specified by Garcia and Siewert [83], was used.
of photon counts and, for retrieval purposes, photon countsmust be first converted to actual radiance. This can be donein a laboratory or using collocated measurements of zenithradiance. For MPL solar background calibration, we useda collocated multi-spectral photometer that tracks the Sun ifnot hidden by clouds in a narrow field-of-view (FOV). Thisis precisely what a standard Cimel instrument does for theAERONET (AErosol RObotic NETwork) [92]; it also provideszenith radiance either as part of its routine observations in theprincipal plane or in its ‘cloud mode’ [90].
After solar background calibration, we can translatemeasured zenith radiance to cloud optical depth τ . In contrastto nadir radiance, zenith radiance is not a one-to-one functionof cloud optical depth; see figure 5. Two cloud optical depthsgive the same zenith radiance: one for thinner clouds, the otherfor thicker clouds. Thus, it is impossible to unambiguouslyretrieve cloud optical depth from solar background signalof a one-channel MPL. To remove this ambiguity, a rule isneeded to distinguish thick from thin clouds. Chiu et al [84]proposed a reasonable criterion assuming that, if a lidar beamis completely attenuated, the detected clouds have the largeroptical depth.
Figure 6 illustrates two hours of observations of theMPL at NASA’s Goddard Space Flight Center (GSFC),Greenbelt, MD, on 29 October 2005. Calibrations of MPLsolar background signals were conducted against one yearof principal plane observations of the collocated AERONETCimel. As we can see from the time series of verticalbackscatter profile of MPL (panel 6(a)), there was a somewhatbroken cloud field. To separate thin from thick clouds, itwas assumed that clouds were thin if the returned signalwas not completely attenuated. Figure 6(b) shows the timeseries of retrieved cloud optical depth. The retrieved valueswere validated against an AERONET Cimel operated in cloudmode [90, 93]. The mean cloud optical depths from MPLand Cimel are 41 and 44, respectively, and their correlation isaround 0.86. Except for a few outliers, errors of retrievals fromMPL are around 10–15% compared with those retrieved fromCimel.
18

Rep. Prog. Phys. 73 (2010) 026801 A B Davis and A Marshak
Figure 6. Ground-based MPL observations at NASA–GSFC.(a) Time series of range-corrected vertical backscatter profiles.(b) Corresponding time series of cloud optical depths retrievedfrom MPL and Cimel (cloud mode). (b′) Same as the last third ofpanel (b), but co-plotted with the two possible optical depthsthat correspond to the same zenith radiance.Adapted from Chiu et al [84].
However, it is not always possible to separate thinner fromthicker cloud. In figure 6(b′) we have plotted together the twopossible optical depths; the solid line corresponds to smalleroptical depths and the dashed one to larger optical depths.
For certain radiance values, these two optical depths aresubstantially different and it is easy to remove any ambiguityusing a ‘returned’ or ‘not-returned’ signal. For instance, whenlidar pulses are completely attenuated (not-returned), the largercloud optical depth is the obvious choice (e.g. 16.8–17.1 UTC).Conversely, when lidar pulses are not completely attenuated,the smaller optical depth is the clear solution (e.g. 17.25 UTC).The problem arises when both of these optical depths resultin completely attenuated lidar pulses. In these cases, themargin of difference is too small to confidently determinewhich optical depth is the correct solution (cf circled data infigure 6(b′)). As a result, τ values ranging approximately from3 to 15 are hard to resolve. Retrieval of these intermediateoptical depths may require further information, such as anotherlidar wavelength or additional sensors.
3.2.2. Space-based geoscience laser altimeter system (GLAS).As for the MPL, laser pulses transmitted from GLAS on boardICESat (Ice, Cloud and land Elevation Satellite) and otherspace-borne lidars can only penetrate clouds to a depth ofa few MFPs. As a result, only optical depths of thinnerclouds (less than ≈3 for GLAS) are retrieved reliably fromthe reflected lidar signal. We illustrate here possible retrievalsof optical depth of thick clouds using solar background lightby treating the GLAS receiver as a solar radiometer. As inthe case with ground-based lidars, we first need to calibratethe reflected solar radiation received by the photon-countingdetectors. The solar background radiation is regarded as anoise to be subtracted in the retrieval process of the lidarproducts.
Yang et al [85] recently used three calibration methodsthat agreed well with each other: (1) calibration withcoincident airborne and GLAS observations; (2) calibrationwith coincident Geostationary Operational EnvironmentalSatellite (GOES) and GLAS observations of deep convectiveclouds; (3) first-principles calibration, using the optical depthsof thin water clouds over ocean readily retrieved by GLAS’sactive remote sensing. Cloud optical depth was also retrievedfrom the calibrated solar background signal using a one-to-onerelationship similar to the one shown in figure 5, but for theknown SZA.
To illustrate how passive remote sensing with GLAScomplements its original active remote sensing, we use a thickmarine Sc cloud observation. The Sc scene (figure 7(a))was recorded by GLAS on 1 November 2003. The clouddeck is optically thick and the standard GLAS active remotesensing was unable to retrieve its optical depth. However, thisinformation can be obtained using solar background signal.Figure 7(b) shows the retrieved cloud optical depth field. Thesignal physics are the same here as for the MPL. The problem ofambiguity in τ does not arise here, but the reflected radiancesignal levels off for large τ and, moreover, the receiver cansaturate. Although we do not in this case have independentvalidation data, we are confident the same retrieval accuracycan be achieved as for the MPL, at least for moderately opaqueclouds.
19

Rep. Prog. Phys. 73 (2010) 026801 A B Davis and A Marshak
Figure 7. GLAS observation of a thick marine stratocumulus deckover the southern Pacific Ocean: the 1 November 2003, transectgoes from 35.13–43.29 S and 84.30–85.80 W. (a) 0.532 µmbackscattering image and the corresponding solar backgroundphoton counts in units of photons/bin; (b) cloud optical depthretrieved from the 0.532 µm solar background at 0.2 s resolution(1.4 km). Adapted from Yang et al [85].
3.3. The spherical cloud: a tractable problem in 3D radiationtransport
So far, we have only used 1D RT taken either literally (in d = 1space) or in the framework of slab geometry (in d = 3) whentranslational invariance prevails, i.e. the cloud is horizontally,if not completely, uniform. At the very least, this crude cloudmodel has brought us some physical insights. The resulting1D RT may even be justifiably applied to the analysis of real-world clouds as long as they are in a single unbroken opaquelayer, the essence of stratiform (St) cloud decks. However,we are compelled to address—hopefully by way of analyticalcomputation—clouds that are at the opposite end of the gamutin outer geometry: clouds that, like cumulus (Cu), are finitein all three dimensions. For this class, we propose to use aspheroid as an archetype.
Other finite shapes have been investigated using bothtransport and diffusion theories: parallelepipeds-diffusion[94], parallelepipeds-transport [95, 96], truncated cylinderswith vertical axis of rotation with diffusion [97], and probablyothers. However, in the diffusion framework, such shapeswith sharp edges invariably lead to non-trivial problemswhere different eigenfunction expansions must be matched.Strangely overlooked in the literature, spheroids do not havethis complication.
Davis [98] worked out the problem of diffusive radiationtransport in optically thick non-absorbing spherical cloudsunder solar illumination properly distributed over one
hemisphere. Although the incoming solar flux is correctlymodulated by the cosine of the angle between the local out-going normal and the given direction of the Sun, this spatiallyvarying flux is converted at the boundary into an isotropicsource. This is in step with the boundary-source model usedin a previous section for the plane-parallel slab. Although notvery realistic for less than asymptotically large optical depths(thus reducing the thickness of the radiative boundary layer),it does allow the model to be solved in closed form. In thefollowing, we outline the problem and compare its solutionin the diffusion approximation with the golden standard ofMonte Carlo (MC) implementation of the corresponding lineartransport problem.
For a general optical medium defined by an open andconvex set M ⊂ R
3, with the closed boundary set ∂M , theslab-based BC in (37) expressing illumination by a collimatedbeam becomes
I (x,Ω) =
F0δ(Ω − Ω0), x ∈ ∂MR,
0, x ∈ ∂MT ,(76)
for all x ∈ ∂M . This set has been partitioned as follows:∂MR = x ∈ ∂M;Ω0 · n(x) 0,∂MT = x ∈ ∂M;Ω0 · n(x) > 0, (77)
where n(x) is the out-going normal to ∂M at x. For anisotropic boundary source distributed over ∂MR with the sameoverall solar flux intercepted by M , the right-hand side side ofthe top line in (76) becomes F0|Ω0 · n(x)|/π .
For convex media, ∂MF (F = R, T ) are two simply-connected sets. The choice of subscripts adopted here hintsat the fact that radiation escaping M through ∂MF contributesto reflection if F = R and transmission if F = T . Note thatthis partition between reflection and transmission is based onwhere the radiation escapes, rather than in what direction it isheading. This distinction does not arise in slab geometry. Inthe present finite 3D geometry, this choice of definition has theadvantage of separating topologically the cloud boundary intoits ‘sunny’ and ‘shady’ sides. In the case of a spherical cloud,M(rc) = x ∈ R
3; ‖x‖ < rc, with Ω0 = +z, we have∂MR(rc) = x ∈ R
3; ‖x‖ = rc, z 0,∂MT (rc) = x ∈ R
3; ‖x‖ = rc, z > 0.The natural choice of coordinate system here is7
x = (r cos ϑ, r sin ϑ cos ϕ, r sin ϑ sin ϕ)T.
For the simple diffusion model in a uniform sphere, with novolume sources or sinks (conservative scattering), the transportequation is simply −∇2J = 0, where ∇ = (∂r , r∂ϑ , 0)T in thisaxi-symmetric situation. The applicable Robin BCs forJ (r, ϑ)
on ∂M(rc) = x ∈ R3; ‖x‖ = rc are
Fin(ϑ) = 14 (1 + χt∂r)J |r=rc
=
F0| cos ϑ |, π/2 ϑ π,
0, 0 ϑ < π/2.
7 Note the curly fonts used here to distinguish spatial from directionalspherical coordinates.
20

Rep. Prog. Phys. 73 (2010) 026801 A B Davis and A Marshak
The original paper [98] gives the derivation of the 0th and1st coefficients in the natural expansion in (spatial) sphericalharmonics:
J (r, ϑ) =∑l0
rl Pl(ϑ).
Those two are the only ones that matter for the out-goingboundary fluxes
Fout(ϑ) = 14 (1 − χt∂r)J |r=rc = J (rc, ϑ)/2,
if integrated over the sunny and shady hemispheres. Indeed,we are interested here in the transmission
T = 1
πr2c F0
∫ π/2
0Fout(ϑ) dS(ϑ), (78)
where dS(ϑ) = 2πr2c sin(ϑ) dϑ and, by conservation, cloud
albedo R = 1 − T . This integral is easily done with sphericalharmonics and leads to the simple result that
R
T= rc
χt= (2rc)/t
2χ, (79)
where the numerator can be interpreted as the scaled opticaldiameter of the sphere. Since we have R + T = 1 in this purescattering case, we can solve for R and T as needed.
Figure 8 shows validation data for the above diffusionmodel obtained by implementing a MC solution of thecorresponding problem in linear transport theory. Morespecifically, we solved the steady-state version of (8) in M(rc)
with 0 = 1 and the H–G phase function in (33) forg = 0 and 0.85 using BCs in (76) for a collimated solarbeam as well as the isotropic boundary source with the sameflux (i.e. modulated by the local cosine of the SZA). Wesee that the two types of illumination converge to the sameanswer for spheres of large optical thickness. The diffusion-theoretical prediction for the ordinate, (R/T ) / (2rc/t), is1/2χ . This gives 3/4 for χ = 2/3 but, due to our statedflexibility about χ , can fall in the range 0.70–0.86. The MCdata support this prediction, particularly toward the low end(high χ ).
The result in (79) is quite remarkable because, going backto (61)–(62) for the non-absorbing slab model, we find
R
T= (1 − g)τ
2χ= H/t
2χ, (80)
which has precisely the same interpretation (since H is the‘diameter’ of the slab).
This leads us to some minor speculation. Let us broadenthe scope to non-absorbing ellipsoidal clouds M(a, b, c) =x ∈ R
3; (x/a)2 + (y/b)2 + (z/c)2 < 1 illuminated alongthe positive z-axis, but restrict ourselves to oblate cases, i.e.vertical aspect ratio mina, b/c 1. We already know thatthe cases a = b = c = rc and c = H/2 with a = b = ∞ leadto the same expression for R/T , namely, c/χt . Could it be thesame answer for arbitrary a and b? (This is most easily verifiedin the case of infinite horizontal cylinders, where b = ∞and a = c = rc.) In other words, for isolated horizontally(as well as vertically) finite clouds, R/T depends linearly on
Figure 8. Overall reflection/transmission ratio for conservativelyscattering spherical clouds of varying optical thickness. MCsimulation results for the ratio R/T divided by the scaled opticaldiameter of the sphere, τt = 2(1 − g)σrc, are plotted versus τt . Theanalytical diffusion model described in the main text predicts aconstant value of 1/2χ . The possible range for this number isindicated (horizontal dashed lines) and it is validated by theMC-based computational linear transport, the usual standard ofaccuracy, for large τt , as expected. Both collimated and diffuse (butlatitude-dependent) illumination was used and both isotropic (emptysymbols) and H–G (g = 0.85, full symbols) phase functions wereconsidered. The line for clouds with R = T (1–1) and R = 2T(2–1) is indicated by the (solid) diagonal lines, and the former givesthe small-τt limit for diffuse illumination scenario. For the small τt
with collimated illumination, a constant ratio is expected; for moredetail; see Dickinson et al [75] recent study in single scattering.
the optical thickness of M but does not seem to depend onits aspect ratio. If so, we can exploit this result for a new(inherently 3D) concept in cloud remote sensing, as describedfurther on (cf section 8.2.1).
4. Spatial and temporal Green functions
We are primarily interested in the relatively small subset ofGreen functions for boundary sources and boundary observers.Recalling that ρ = (x, y)T, we therefore take the unidirectionalboundary-source function I (t, ρ, 0,Ω), µ > 0, for the RTproblem to be as in (37) but with F0 = 1 and concentrated inspace and time with factors δ(t) and δ( ρ). For a normallyincident pulsed laser beam, we furthermore take Ω0 = z
(µ0 = 1). The spatial Green function for plane-parallel media,often described as the ‘pencil-beam’ problem, has attracted alot of attention in RT, starting with Chandrasekhar [10] up to thepresent, as well as in neutron transport [99]. It is particularlychallenging whenµ0 < 1 [100], when scattering is anisotropic,and when H < ∞ [101]. Closed-form expressions for suchtransport-theoretical Green functions have been proposed asbenchmarks for numerical 3D transport codes at large.
21
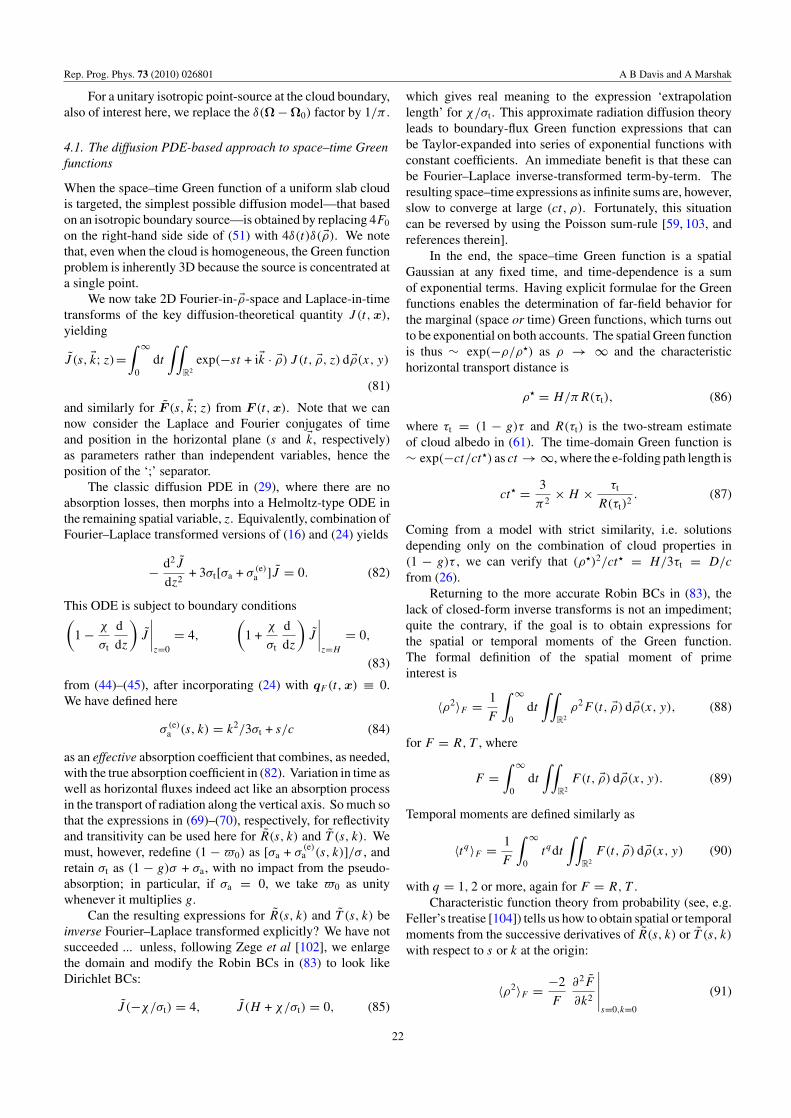
Rep. Prog. Phys. 73 (2010) 026801 A B Davis and A Marshak
For a unitary isotropic point-source at the cloud boundary,also of interest here, we replace the δ(Ω − Ω0) factor by 1/π .
4.1. The diffusion PDE-based approach to space–time Greenfunctions
When the space–time Green function of a uniform slab cloudis targeted, the simplest possible diffusion model—that basedon an isotropic boundary source—is obtained by replacing 4F0
on the right-hand side side of (51) with 4δ(t)δ( ρ). We notethat, even when the cloud is homogeneous, the Green functionproblem is inherently 3D because the source is concentrated ata single point.
We now take 2D Fourier-in- ρ-space and Laplace-in-timetransforms of the key diffusion-theoretical quantity J (t, x),yielding
J (s, k; z)=∫ ∞
0dt
∫∫R2
exp(−st + ik · ρ) J (t, ρ, z) d ρ(x, y)
(81)
and similarly for F (s, k; z) from F (t, x). Note that we cannow consider the Laplace and Fourier conjugates of timeand position in the horizontal plane (s and k, respectively)as parameters rather than independent variables, hence theposition of the ‘;’ separator.
The classic diffusion PDE in (29), where there are noabsorption losses, then morphs into a Helmoltz-type ODE inthe remaining spatial variable, z. Equivalently, combination ofFourier–Laplace transformed versions of (16) and (24) yields
− d2J
dz2+ 3σt[σa + σ (e)
a ]J = 0. (82)
This ODE is subject to boundary conditions(1 − χ
σt
d
dz
)J
∣∣∣∣z=0
= 4,
(1 +
χ
σt
d
dz
)J
∣∣∣∣z=H
= 0,
(83)
from (44)–(45), after incorporating (24) with qF (t, x) ≡ 0.We have defined here
σ (e)a (s, k) = k2/3σt + s/c (84)
as an effective absorption coefficient that combines, as needed,with the true absorption coefficient in (82). Variation in time aswell as horizontal fluxes indeed act like an absorption processin the transport of radiation along the vertical axis. So much sothat the expressions in (69)–(70), respectively, for reflectivityand transitivity can be used here for R(s, k) and T (s, k). Wemust, however, redefine (1 − 0) as [σa + σ
(e)a (s, k)]/σ , and
retain σt as (1 − g)σ + σa, with no impact from the pseudo-absorption; in particular, if σa = 0, we take 0 as unitywhenever it multiplies g.
Can the resulting expressions for R(s, k) and T (s, k) beinverse Fourier–Laplace transformed explicitly? We have notsucceeded ... unless, following Zege et al [102], we enlargethe domain and modify the Robin BCs in (83) to look likeDirichlet BCs:
J (−χ/σt) = 4, J (H + χ/σt) = 0, (85)
which gives real meaning to the expression ‘extrapolationlength’ for χ/σt . This approximate radiation diffusion theoryleads to boundary-flux Green function expressions that canbe Taylor-expanded into series of exponential functions withconstant coefficients. An immediate benefit is that these canbe Fourier–Laplace inverse-transformed term-by-term. Theresulting space–time expressions as infinite sums are, however,slow to converge at large (ct, ρ). Fortunately, this situationcan be reversed by using the Poisson sum-rule [59, 103, andreferences therein].
In the end, the space–time Green function is a spatialGaussian at any fixed time, and time-dependence is a sumof exponential terms. Having explicit formulae for the Greenfunctions enables the determination of far-field behavior forthe marginal (space or time) Green functions, which turns outto be exponential on both accounts. The spatial Green functionis thus ∼ exp(−ρ/ρ) as ρ → ∞ and the characteristichorizontal transport distance is
ρ = H/πR(τt), (86)
where τt = (1 − g)τ and R(τt) is the two-stream estimateof cloud albedo in (61). The time-domain Green function is∼ exp(−ct/ct) as ct → ∞, where the e-folding path length is
ct = 3
π2× H × τt
R(τt)2. (87)
Coming from a model with strict similarity, i.e. solutionsdepending only on the combination of cloud properties in(1 − g)τ , we can verify that (ρ)2/ct = H/3τt = D/c
from (26).Returning to the more accurate Robin BCs in (83), the
lack of closed-form inverse transforms is not an impediment;quite the contrary, if the goal is to obtain expressions forthe spatial or temporal moments of the Green function.The formal definition of the spatial moment of primeinterest is
〈ρ2〉F = 1
F
∫ ∞
0dt
∫∫R2
ρ2F(t, ρ) d ρ(x, y), (88)
for F = R, T , where
F =∫ ∞
0dt
∫∫R2
F(t, ρ) d ρ(x, y). (89)
Temporal moments are defined similarly as
〈tq〉F = 1
F
∫ ∞
0tqdt
∫∫R2
F(t, ρ) d ρ(x, y) (90)
with q = 1, 2 or more, again for F = R, T .Characteristic function theory from probability (see, e.g.
Feller’s treatise [104]) tells us how to obtain spatial or temporalmoments from the successive derivatives of R(s, k) or T (s, k)
with respect to s or k at the origin:
〈ρ2〉F = −2
F
∂2F
∂k2
∣∣∣∣∣s=0,k=0
(91)
22

Rep. Prog. Phys. 73 (2010) 026801 A B Davis and A Marshak
for the horizontal transport away from the point-source, and
〈tq〉F = 1
F
(− ∂
∂s
)q
F
∣∣∣∣s=0,k=0
(92)
for time. These last quantities describe how the incoming shortpulse is stretched in the responses of the scattering medium;in particular, we can determine how the variance of the transittime, 〈t2〉F − 〈t〉2
F , varies with cloud parameters.We can apply the above recipes for estimating spatial and
temporal moments to the fluxes obtained in the diffusion limit,namely, (69)–(70). In the absence of true absorption, we onlyneed to use
L(e)d (s, k) = 1/
√3σtσ
(e)a (s, k) (93)
when it appears in X and Y , in ratio with the extrapolationlength t and the slab thickness H , respectively, in the ancillarydefinitions (71)–(72).
Following Davis et al [105], we start with (69). Thisbasic diffusion model predicts the following dependencesof reflected Green function moments on the properties ofconservatively scattering clouds:
〈ρ2〉R = 8χ
3
1
τt× H 2 × [1 + C
(2)R,ρ(τt/2χ)], (94)
〈ct〉R = 2χ × H × [1 + C(1)R,ct (τt/2χ)], (95)
〈(ct)2〉R = 4χ
5τt × H 2 × [1 + C
(2)R,ct (τt/2χ)], (96)
where we have highlighted the asymptotic (large τt) trends.The pre-asymptotic correction terms are given by
C(2)R,ρ(Z) = C
(1)R,ct (Z) = Z + 3/2
2Z(Z + 1),
C(2)R,ct (Z) = 8Z3 + 41Z2/2 + 75Z/4 + 1/8
2Z2(Z + 1)2,
where, as in (79), we define
Z = R/T = τt/2χ. (97)
Time is recast here as the effective path length ct that the lighthas accumulated by random scattering in the medium, fromemission to escape.
Similarly, following Davis and Marshak [106], we apply(91) and (92) to (70) with all ancillary definitions, and obtain
〈ρ2〉T = 23 × H 2 × [1 + C
(2)T ,ρ(τt/2χ)], (98)
〈ct〉T = 12 τt × H × [1 + C
(1)T ,ct (τt/2χ)], (99)
〈(ct)2〉T = 720 τ 2
t × H 2 × [1 + C(2)T ,ct (τt/2χ)], (100)
where
C(2)T ,ρ(Z) = C
(1)T ,ct (Z) = 4Z + 3
2Z(Z + 1),
C(2)T ,ct (Z) = 56Z3 + (166Z2 + 15(10Z + 3))
14Z2(Z + 1)2.
A striking difference between the above expressions forT -moments and their counterparts for R-moments in (94)–(96)
Figure 9. Cloud responses to a pulsed isotropic point-source inreflection. Diffusion predictions from (95)–(94), with correctionterms, for moments and (61) for R, via T = 1 − R, are in solidlines; MC validation data are plotted with symbols. The best overallfit was obtained for χ = 1/
√3 ≈ 0.58. Adapted from [105].
is that the extrapolation length parameter χ has disappearedfrom the dominant terms. Recall that χ is a weak link indiffusion theory used to best capture radiative boundary-layereffects in the diffusion solution, by theoretical or numericalcomparison with the full RT solution. There are obviouslyradiative boundary layers on both sides of the cloud where thetransport regime goes from diffusing to streaming. However,the near-source/reflective side of an optically thick cloud isdominated by radiation that has suffered only a few scatterings(as little as a single one). So it is not surprising to see thesignature parameter χ , used for boundary-layer control, playan important role in reflected light characteristics, but not inthose of transmitted light.
Figures 9 and 10 illustrate the spatial and temporalmoments of the reflected and transmitted Green functionsrespectively, for the simplest (isotropic boundary point-source)diffusion problem. Explicit expressions are in (94)–(96) forR-moments and (98)–(100) for T -moments; we also plot thenormalized flux T = 1 − R from (62). All the momentsare normalized by cloud thickness H taken to the appropriatepower; then the square-root of the second-order moments iscomputed, thus producing root-mean-square (RMS) statistics.These non-dimensionalized quantities are plotted againstscaled optical depth (1 − g)τ , which is characteristic ofdiffusion theory. Spatial and temporal moments estimatedin the course of MC simulations of the corresponding RTproblems, assuming both isotropic and g = 0.85 Henyey–Greenstein (33) phase functions, are also plotted. The MCruns provide validation data for the diffusion model since theyresult from a higher-level model.
The isotropic boundary point-source model is not veryrealistic for representing either localized laser beams (typicallyat normal incidence) or the uniform solar beam (typicallyat some oblique incidence). Nor is the assumption of ahomogeneous cloud in view of the well-known tendency of
23

Rep. Prog. Phys. 73 (2010) 026801 A B Davis and A Marshak
Figure 10. Cloud responses to a pulsed isotropic point-source intransmission. Diffusion predictions from (98)–(100), withcorrection terms, for moments and (62) for T are in solid lines; MCvalidation data are plotted with symbols (two values of χ used toreproduce the MC benchmarks). Adapted from [106].
stratiform clouds to develop robust internal gradients in LWC,hence in extinction σ from (67). Moreover, this cloud-scalestratification is overlaid in most clouds with significant random3D fluctuations due to their inherent turbulence.
All of these limitations of the above transport model canbe removed without leaving the framework of diffusion theory,and still leading to closed-form expressions at least for thespatial and temporal moments. We highlight one particularlysimple approach for the small-scale random fluctuations insection 5.1.1. For further improvements, the interested readeris referred to the recent paper by Davis [107] for reflected light.The same enhancements are extended from reflected light totransmitted light by Davis et al [108]. Expressions therein areuseful, but not simple.
4.2. New opportunities in cloud remote sensing
Apart from the high accuracy of the diffusion-based predictionsfor τt = (1 − g)τ 1, the remarkable fact about figures 9 and10 is that, in both cases, different space and time moments scaledifferently. This is very good news for cloud remote sensingusing somehow observed Green functions, as discussed furtheron; indeed, given observed values for any two moments, onecan estimate the two cloud properties H and τ , recalling thatg hardly varies in nature (at least for liquid clouds [56]). Theabove-mentioned modeling refinements for laser-beam sourcerepresentation as well as internal stratification and randomfluctuations of extinction do not change these qualitativestatements based on the asymptotic behavior of (94)–(100)visible in the associated figures 9–10.
There are many other ways of obtaining cloud opticaldepth τ that are already operational. For instance, in section 3.2
the level of solar background noise in lidar systems wasexploited, just by treating the receiver as a basic narrow FOVradiometer. In essence, this technique consists in solving(61) for τ given R or (62) given T . We therefore extendthe list of possible ‘observables’ by including the spatiallyand temporally integrated fluxes in (89), also plotted in thefigures. In contrast, there are very few existing ways ofobtaining physical cloud thickness H . The best is probablyto use millimeter-wave cloud radar (MMCR), which is nowavailable from many ground-based stations world-wide as wellas from space (presently, only NASA’s CloudSat mission, butmore will come). This is the advanced active single-scatteringtechnology for clouds that are too opaque in the visible/near-IR(VNIR) for thin-cloud/aerosol penetrating lidar; moreover, thebackscattering follows Rayleigh’s law since droplets are λ.As powerful as MMCR has proven, it does not always work asoriginally planned; in particular, insects and even a light drizzlecan saturate the dynamic range of an MMCR [109]. Even whenit does work, it is not straightforward to translate the MMCRreflectivity, basically the droplet density ×r6 from (2), intoVNIR-TIR cloud information that matters for the climate.
We also note that, for all the observational possibilities in(88)–(90), there are very different calibration requirements.Indeed, the normalization of F by F0 in, e.g. (52)–(53),reminds us that these responses for steady and uniformillumination can be measured only if the radiometers haveabsolute calibration, which is notoriously difficult to establishand maintain with high precision. In contrast, the ratios in themoments per se (88) and (90) make their observation immuneto unknown multiplicative constants in the fluxes, i.e. absolutecalibration error.
An interesting difference between the plots for reflectedlight (figure 9) and its counterpart for transmitted light(figure 10) is that the mean and RMS values for path ct areclosely related in T but diverge in R as (1 − g)τ increaseswithout bound. This is much better news for the observationof clouds in reflection than in transmission. It indeed turns outthat
√〈t2〉F /〈t〉F is almost constant when F = T , but when
F = R it increases with τ . So, with access only to time-domainobservations of reflected light, one can in principle infer bothτ and H , still without any need for calibration.
A straightforward instrumental implementation of space–time RT Green function observation, potentially leadingto Green function moment estimation, uses pulsed lasers[110, 111]. In this case, the receiver is very near thetransmitter, at any rate, on the same side of the cloud; sothe relevant moments are the 〈· · ·〉R’s. Whether or not thesemoments are estimated explicitly with the field data, the abovecloud information content analysis proves correct.
Reliance on the expensive technology of pulsed lasers isnot strictly necessary to access time-domain observables suchas 〈tq〉F . We will show in section 8 how in fact both spatial andtemporal information can be determined even using a steadyand uniform source such as the Sun. In this case, reflectedquantities are obtained from airborne and space-based sensors,and transmitted ones from ground-based sensors.
24

Rep. Prog. Phys. 73 (2010) 026801 A B Davis and A Marshak
4.3. The random-walk scaling approach to space–time Greenfunctions
We have so far used a PDE-based theory of radiation diffusionto compute multiple-scattering Green functions, and we havesystematically used MC simulation to validate numerically thatRT approximation leading to convenient closed-form results.It is informative to go to the other extreme of this hierarchy inGreen function models and perform a highly simplified versionof MC simulation analytically, namely, estimate statisticalproperties of random (a.k.a. drunkard’s) walks. This approachreveals the physical essence of the problem of transportin dense clouds. Specifically, one can derive the scalingexponents of τt = (1 − g)τ in all the dominant terms of theGreen function moments, cf (94)–(96) and figure 9 for reflectedlight, (98)–(100) and figure 10 for transmitted light. Thesame exponents appear in all other spatial or temporal momentestimations based on more sophisticated representations ofthe cloudy medium or the source term [107, 108]; in otherwords, the refinements affect only scaling prefactors and pre-asymptotic corrections.
We note first that the key cloud parameter in diffusiontheory, τt , is the ratio of the only two scales that matter inrandom walks:
• H , the outer scale (size of the domain bounding thestochastic process);
• t , the inner scale (MFP for effectively isotropicscattering).
The latter defines diffusivity, namely, D = ct/d in d spatialdimensions.
4.3.1. Caveat about photons as ‘particles’ of light. The term‘photon’ was coined by Gilbert Lewis in 1926 to describe thequantum of the electromagnetic field, of which light is a primeexample. Even if second quantification assigns energy hν,momentum h/λ and spin ±h to photons, it is fundamentallyincorrect to think of them as either classic or quantic particlestraveling through space–time at velocity c. For instance, byany definition, it is not the same photon (EM field excitation)that is incident and re-emitted by a scattering entity. Photonscan populate energy levels in, e.g. thermal sources and lasercavities; they can also be detected using materials suchas silicon endowed with photo-electronic responsivity. Inbetween, it is light—not photons—that propagates in opticalmedia according to the laws of RT theory, which is a non-trivial construct from statistical optics in a classic framework[49]. The radiance field predicted by the RTE, and associatedboundary conditions, is only a probability of detecting a photon(per photon emitted at the source) with a roaming virtualinstrument.
In MC computation, it is very tempting to talk aboutthe ‘photons’ launched in a simulation. This should beavoided, proper terminology is ‘histories’ or ‘trajectories’ or‘realizations’ or even ‘Monte Carlo particles.’ Recall thatMC is only a random quadrature approach for estimatingfunctionals, integrals over high-dimensional radiance fields.The random-walk theory presented here is basically a poorperson’s MC, with only some basic results from probability
theory to work with. So, although strongly reminiscent ofwandering particles, we are dealing with light intensities, tobe interpreted strictly as probability densities for detectionevents. Only at that point can one talk about photons and,more correctly, photo-electrons.
4.3.2. Elements of Brownian motion theory. In boundary-free homogeneous 3D space, an isotropic source at r = 0 emitsa diffusing ‘wavefront’ of particles propagating at a decreasing‘velocity’ such that the mean distance from the origin, ≈
√〈r2〉,
grows only as√
Dt . This is a classic reading of the famouslaw of diffusion
〈r2〉 = 6Dt, (101)
in unbounded 3D space, which results directly from the well-known Green function for diffusion in three spatial dimensions:n(t, r) = e−r2/4Dt/(4πDt)3/2, itself the solution of ∂tn = ∇2n
for t > 0 when n(0, r) = δ(r).In the statistical physics of Brownian motion, a lesser
known but extremely useful result is the ‘law of first returns’[112]. Focusing, for simplicity, on 1D random walks (whereD = ct) along the z-axis, we seek the PDF of t > 0,the random epoch at which the coordinate of the Brownianparticle (that left z = 0 at t = 0) first changes sign. It can beshown [113, 104] that
Prt, dt = c√πt
(t
ct
)3/2
e−t/2ctdt ∼ dt
t3/2, (102)
if we acknowledge, then ignore, the exponential cut-off atearly times. This is an interesting PDF associated with thegambler’s ruin problem: How long does it take a person whocomes to the roulette table with $1, and always bets ‘red,’$1 at a time, to walk away with nothing? There is actuallyno mean for this duration—it is divergent—and that may goa long way in explaining why gambling is addictive, andaccordingly why casinos are open 24/7. Indeed, before losingeverything in time with probability one (even the initial $1) tothis casino with an infinite bank, gains can be considerable—and last a correspondingly long time—for a significant numberof players.
The corresponding RT problem is that of reflection froma semi-infinite (H → ∞) non-absorbing medium, where〈ct〉R is indeed infinite; this follows from (95) since the ratio〈ct〉R/H becomes insensitive to scaled optical thickness τt .Alternatively, one can consider the ratio 〈ct〉R/t that willincrease as τt = H/t when the transport MFP t is heldconstant. Higher-order moments follow suite at even fasterrates. Fractional-order moments of order q < 1/2 are,however, finite.
4.3.3. Transmitted light. Now r2 = x2 + y2 + z2 and, bysymmetry, all three components are equal in magnitude onaverage, at least in unbounded diffusion. Therefore, sincez = H whenever a transmission event occurs, ρ2 = x2 + y2 ≈(2/3)H 2. This concurs with the expression in (98) for 〈ρ2〉T : itis asymptotically invariant with respect to τt , and the prefactoris correctly predicted.
25

Rep. Prog. Phys. 73 (2010) 026801 A B Davis and A Marshak
Furthermore, when the bulk of the diffusing wavefrontreaches the opposite boundary, we will be detecting thetransmitted Green function at full strength. We can estimatethis epoch by setting 〈r2〉 ≈ (2/3)H 2 in (101), hencet ≈ (2/3)H 2/6D = H 2/3ct = (H/c) × τt/3. In otherwords, reinterpreting t as a random variable, we anticipatethat 〈ct〉T /H ≈ τt/3. This confirms the expectation in (99)based on ‘exact’ (PDE-based) diffusion theory, as illustratedin figure 10, for the scaling exponent if not the prefactor.
There is no simple argument for the scaling of the2nd-order moment in time, also plotted in figure 10. The factthat it goes as 〈ct〉2
T tells us that the distribution of arrival timesat the boundary opposite the source of diffusing particles isrelatively narrow.
It is interesting that we can estimate at least the scaling ofGreen function moments in transmission without knowledgeof the overall probability of transmission T . This is thetheoretical equivalent of the above-stated instrumental fact thatwe do not need calibrated radiometry to derive moment-basedobservables of cloud Green functions. To derive the scalingof T with τt calls for the law of first returns in (102). Realclouds have finite physical and optical thicknesses, and realcasinos have finite banks. We can approximate the probabilityof transmission—the ‘always red’ gambler breaks the casino’sbank—by truncating the PDF in (102) at the characteristictransit time 〈t〉T ∼ H 2/ct it takes for light from the pulseto be transmitted. This leads to
T ≈ Prt > 〈t〉T =∫ ∞
〈t〉TPrt, dt ∼ t/H, (103)
i.e. the asymptotic behavior T (τt) ∼ 1/τt in (62), clearlyvisible in the corresponding curve in figure 10.
4.3.4. Reflected light. Temporal/path moments for reflectedlight can also be estimated for a finite diffusion domain,namely, 0 < z < H , by defining a truncated (and, in principle,renormalized) version of the PDF in (102) for the first-returnprocess. Allowing time for the particle to return to z = 0 afterwandering deep into the medium (i.e. almost being transmittedat z = H ), we compute specifically
Iq =∫ 2〈t〉T
0tq Prt, dt, hence
〈tq〉R ≈ Iq
I0∼
(t
c
)1/2 (H
ct
)q−1/2
, (104)
where we have neglected the difference between I0 and unity,namely, T in (103). Recalling once more that H/t = τt , thisleads to 〈(ct)q〉1/q
R ∼ H × (τt)1−1/q , as was found in the limit
τt → ∞ in (95)–(96).As previously noticed, it is remarkable that the moments
〈(ct)q〉R all scale differently with τt whereas we fully expectthat 〈(ct)q〉T ∼ 〈ct〉qT , for q 2. From the vantage of thisrandom-walk approach to diffusion theory, we can trace thisproperty to the mixture, made clear in (104), of short and longpaths ct in reflected light. In RT language, this translatesto reflected light being a relatively balanced mixture of lightscattered both few and many times.
As we did for the spatial Green function in transmission,we can roughly estimate the RMS value of ρ for reflectionfrom (101), with D ∼ ct and (104) for q = 1. We obtain〈ρ2〉R ∼ D〈ct〉R ∼ Ht . In other words, the RMS ρ forreflected light goes as the harmonic mean of t and H , theinner and outer scales of the diffusion problem at hand, whichis just another reading of the dominant term in (94).
5. Realistic (3D) versus operational (1D) cloud RT
The atmospheric radiation communities engaged in both cloudremote sensing and energy cycling by clouds are, to this day,heavily invested in the plane-parallel slab representation ofclouds, at least in operational settings where efficiency and/orsimplicity are desirable in order to expedite frequent routinecomputations. This is irrespective of the pixel scale, whichrange from approximately tens of meters to approximately tensof kilometers, or of the grid scale of the dynamical model,which also range from approximately tens of meters in Large-Eddy Simulation (LES) models to ∼100 km (and decreasing)in GCMs. So, in spite of decades of research into 3DRT effects, 1D RT models are still an unavoidable point ofcomparison.
Scale-by-scale variability analysis is key to 3D RT becauseit can be used to determine what processes need to beconsidered. So is the question of resolved versus unresolvedspatial variability, be it in observations or in computations.Indeed the latter distinction, as artificial as it is, determineswhat kind of 3D RT solution should be explored. In thefollowing, we examine both situations and, for each one,discuss illustrative methods that address the fundamentalissues at hand.
5.1. Dealing with unresolved random fluctuations
If there are significant spatial fluctuations of optical propertiesat scales that are sub-pixel or sub-gridscale, then it is importantto assess their effect on the RT. This assessment is necessarilyprobabilistic since, by definition, detailed structure is notgiven; a (usually small) number of statistical properties areof course given. Accordingly, only domain-average radiativeproperties are required of the RT model.
There are three broad classes of solution to this problem.On the one hand, one can figure out a way of modifying thegiven (typically, mean) optical properties in such a way thatthe new values can be used in a standard 1D RT model and yetdeliver an accurate answer for the domain-average propertiesof interest. This is the ‘effective medium’ or ‘homogenization’approach. On the other hand, one can maybe derive a mean-field theory for the RT at the scale of the domain and this maylead to new transport equations calling, in general, for newsolution techniques. Between these two extremes, there isthe so-called independent pixel/column approximation wheremultiple 1D RT computations are performed and their outcomeis averaged over the variability of the input parameters;typically, cloud optical depth is varied.
We now illustrate each of these three approaches with twoor three examples each, one more detailed than the other(s);
26

Rep. Prog. Phys. 73 (2010) 026801 A B Davis and A Marshak
we also refer the interested reader to a more extensive surveyby Barker and Davis [114].
5.1.1. Homogenization. Computationally speaking, the bestway of accounting for 3D RT is to reduce it to a single 1DRT problem. That is the lofty goal of homogenization (a.k.a.effective medium) theory. As a first example of this idealapproach to the capture of unresolved spatial variability effectsin a standard (typically, 1D) RT model, we mention Cahalan’s[115] ‘effective thickness approximation’ (ETA). Therein asingle 1D RT computation for cloud reflectivity can closelyfollow the prediction for the domain average of a detailedindependent pixel approximation (see section 5.1.2 below)estimate for the bounded cascade model (see section 5.2.1below); that stochastic model for horizontal cloud variabilityhas a realistic lognormal-like PDF. The recipe is simple:replace the spatial mean optical depth τ by ητ , where η is givenby exp(log τ)/τ , which is <1. This is a direct consequenceof Jensen’s inequality [116] in probability theory concerningaverages of functions with definite convexity (in this case, theexponential). The η factor can be expressed approximatelybut conveniently with the parameters of the bounded cascademodel. Thus recentered around the log-mode of the PDF,the variance has a minimal effect on the average over R(τ),which is highly nonlinear of the range of interest in therandom variable τ . The ETA was soon adopted by some GCMmodelers [117], and this helped them reconcile the prognosticcloud optical thickness from the hydrology cycle with whatwas needed to produce a realistic albedo in the stratocumulusregions.
As a second example, we describe the rescaling solutionelaborated by Cairns et al in the years leading up to their2000 paper [118]. Cairns’ interesting effective medium theorydraws on statistical physics and renormalization. It leads to
σ ′ = (1 − ε)σ ,
1 − ′0 =
[1 − 0
(ε
1 − ε
)](1 − 0),
1 − ′0g
′ =[
1 − 0
(ε
1 − ε
)](1 − 0g).
(105)
The new parameter for the unresolved variability is ε and σ
is the average extinction over the presumably large region ofinterest. We see that 1/(1 + 0) 1/2 is a strict upper limitfor ε; it is probably best to not approach this limit too closelyin practice, especially not in diffusion modeling, because therescaled g approaches unity (hence no actual scattering out ofthe incident beam). The δ-rescaling in (31), which improvesthe scattering phase function model in diffusion theory, leavesthe product (1 − 0g)σ invariant; here it decreases boththrough σ and through 1 − 0g as ε increases (since g′ > g).For diffusion models with strict similarity, i.e. dependent onlyon σt = (1 − 0g)σ , we have
σ ′t ≈ (1 − 2ε)σ t (106)
when scattering is conservative or almost (0 ≈ 1). So theprediction is that the small-scale random internal variability
of clouds that Cairns and co-authors renormalized away havethe net effect of reducing the (transport) extinction, hencethe associated optical depth. This will in turn increase cloudtransmittance and decrease reflectance.
We will see that enhanced transmission and reducedreflection by clouds are robust predictions of all 3D RT modelsunder the assumption of a fixed mean optical depth. In thiscase, we have a fixed volume integral, hence mean value, of σ .
How does one obtain ε? Rossow et al [119]took an empirical approach using the database of theInternational Satellite Cloud Climatology Project (ISCCP,http://isccp.giss.nasa.gov) [120, and references therein] toexamine the statistical relationships between inferred cloudoptical depths at the small scale of satellite pixels and theradiances at larger scales typical of GCMs.
However, ε can also be computed from first principles.Recalling that overscores denote averages over the spatialvariability, Cairns et al show specifically that the ensemble-average effects moderate-amplitude fluctuations on the 3DRTE are captured with
ε = a −√
a2 − v2, (107)
where
v =√
σ 2
σ 2 − 1 and a = 1
2
(1 +
1
σ lc
). (108)
Parameter v is the standard-deviation-to-mean ratio, itselfexpressed with the RMS-to-mean ratio, for σ and we denotehere the characteristic correlation scale of the spatial variabilityby lc. We see that
• for small-scale fluctuations (i.e. when lc trans-port MFP ≈1/σ ), we anticipate little effect sinceε ≈ (v/a)2/2 ≪ 1 (irrespective of v) as a becomes verylarge;
• for fluctuations at larger scales (i.e. when σ lc 1), wecan have a strong impact (ε 1/2) although this scenarioclearly stretches the validity of the model, in particular,amplitude is then limited to cases where v2 a − 1/4,hence σ 2/σ 2 5/4 + 1/σ lc;
• for fluctuations at the largest scales (σ lc 1, hencea ≈ 1/2 and v 1/2), one should average overmacroscale responses rather than try to find a singleeffective medium to account for micro-scale variabilityeffects.
Figure 11 illustrates this analysis of ε. In the last(‘slow’) variability regime, the large-scale averaging ofradiative responses can be computed locally using a stronguniformity assumption, which is the essence of the independentpixel/column approximation described next in a special (butrepresentative) case.
The present authors come to the same scale-basedclassification of variability effects in RT from the standpointof steady-state 3D diffusion theory [121]. They arriveat essentially the same scale-by-scale breakdown of spatialvariability impacts using a the first-principles analysis of thepropagation process [54], the only difference being that the
27

Rep. Prog. Phys. 73 (2010) 026801 A B Davis and A Marshak
0.1
0.2
0.3
0.4
1.0 1.1 1.2 1.3 1.40
1
2
3
4
σ 2 σ2
sl c
Figure 11. Cairns’ scaling factor ε used in (106). Parameter ε is
plotted as a function of σ 21/2
/σ and σ lc using (107)–(108). Valuesup to ∼1/3 can be used with some confidence; when 0 = 1, thisupper limit leads to division of 1 − g at most by 2. Therefore, atmost moderate 1-point variability ratio (RMS/mean for σ ) can beconsidered. It can be only slightly more than unity, unless thecorrelations are very short range vis-a-vis the MFP defined here as1/σ (even though this is known to be an underestimation [54]).
transport MFP used in the above arguments is replaced by theusual MFP describing the mean distance between successivescatterings or, e.g. an emission or an absorption. In the samepaper Davis and Marshak show, incidentally, that the actualMFP is 1/σ in a broad class of variable media with long-rangecorrelations, including clouds. Moreover, that estimate alwaysexceeds 1/σ (they are equal only when σ is uniform).
5.1.2. Independent pixel/column approximation (IPA/ICA).From the standpoint of computational expediency, the next bestthing to homogenization, leading to a single 1D RT problem tosolve, is the IPA/ICA where a finite number of such problemsare solved. Alternatively, the closed-form solution of a 1DRT problem, such as obtained in section 3.1, may be averagedanalytically over an explicitly assumed PDF for the variabilityof an optical property, typically, cloud optical depth. In thiscase, we do not leave the realm of closed-form expressions,with the obvious computational efficiency that ensues. Wedemonstrate with two IPA/ICA computations.
First, we invoke the simplest possible model for spatialvariability of clouds, which is certainly the linear mixing modelbased on ‘cloud fraction’ Ac (between 0 and 1). We will see itagain in sections 7.3 and 8.1.1. As easy as it is to conceptualize,defining and measuring Ac empirically is not straightforward,in particular, because it depends on what type of instrumentis used and the resolution within a type [122]. At any rate,it is the first and still foremost application of the IPA/ICAconcept, predating by far that terminology and the acronyms(introduced in the early 1990s [123, 124]). Take, for instance,scene albedo under a given solar illumination. The clouds areassumed plane-parallel and give R(µ0; τc) while the clear sky
gives R(µ0; τa) where the subscript ‘a’ pertains to the aerosolload. In combination, we get
R(µ0; τa, τc, Ac) = Ac × R(µ0; τc) + (1 − Ac) × R(µ0; τa).
(109)
Simple enough! Since R(·) is a concave function(∂2
τ R(µ0; τ) < 0), R will be smaller than R(µ0; τ), whereτ = Acτc + (1 −Ac)τa. This inequality is in fact the definitionof a concave function, and the associated bias between R(τ)
and R(τ) did not go unnoticed by early developers of RTparametrizations for GCMs [125, 126].
Whether for the whole atmosphere or a single layer, weexpect optical depth τ to vary continuously rather than in theabove binary fashion. In the gamma-weighted IPA/ICA [127],one assumes that the 1-point statistics of τ follow
Pa(τ) = 1
(a)
(a
τ
)a
τ a−1e−aτ/τ , (110)
where
a = τ 2
Var(τ )= 1
τ 2/τ 2 − 1(111)
is the new variability parameter. This particular choice ofvariability model follows naturally from the ease of integratingrational functions over arbitrary combinations of power lawsand exponentials, resulting at most in exponential integralfunctions and/or incomplete gamma functions; possiblyinfinite series thereof that are easily summed numerically toa pre-specified accuracy. The above choice of PDF for τ isalso justified on the basis of fine-scale satellite observations ofmany different kinds of cloud fields [128].
To illustrate, we plot
T a(τ t) =∫ ∞
0
1
1 + τt/2χPa(τt) dτt = ξeξ Ea(ξ)|ξ=2χa/τ t
(112)
in figure 12(a). Although in a different notations, Oreopoulosand Barker [129] did the same computation. Here, Ea(ξ) isthe exponential integral of any real order a > 0, and wenote that ξ = a/Z from (97). We note in figure 12(a) asystematic positive bias of T a(τ t) with respect to T ∞(τ t) =1/(1 + τ t/2χ). We retrieve the well-known result in 3DRT: structured clouds transmit more (reflect less) than theirhomogeneous counterparts with the same mean τ . This isan immediate consequence of Jensen’s inequality [116] for aconvex function such as T (τt).
As another illustration, we plot
〈ct〉T /H = T × 〈ct〉TT a × H
= χ
2[1 + a + ξ + (2 − ξ)/T a(ξ)]|ξ=2χa/τ t (113)
in figure 12(b). Note how we have properly weighted thepath moment for transmitted light 〈ct〉T from (99), and thenaveraged over the gamma-PDF for τ in (110), and finallynormalized the result by T a in (112). As it turns out, thewhole variation of flux-weighted mean path, T × 〈ct〉T =χ(τ 2
t +6χτt +6χ2)/(τt +2χ)2, is between χ 1 and 3χ/2 ≈ 1.
28

Rep. Prog. Phys. 73 (2010) 026801 A B Davis and A Marshak
Figure 12. Transmittance and associated mean path for a gamma-weighted diffusion model. (a) The expression in (112) is plotted versusτ t for selected values of a in log-log axes; we note the increasing transmission as the unresolved variability increases (a decreases) at fixedτ t . (b) Mean path length, in units of H , from (113) versus τ t for the same values of a as in panel (a); we note that paths decrease on averageas variability increases (a decreases) at fixed τ t . See text for more explanation.
So the systematic trend toward shorter paths due to spatialvariability is traceable to the normalization by T a . Althoughone should also bring reflected light into the balance, shorterpaths translate to systematically less absorption in variableclouds. In the limit of asymptotically large τt , (112) and (113)yield, respectively,
T a ∝ τ− mina,1t and 〈ct〉T /H ∝ τ
mina,1t . (114)
We resume our discussion of this simple variability modelin section 7.1 where we find its prime application to GCMparametrization improvement.
5.1.3. Mean-field theory. Mean-field theory departs moreradically from 1D RT than both homogenization, whichattempts to reduce the 3D RT problem to a single 1D one,and the IPA, which attempts to reduce the 3D RT problem to alarger number of 1D ones. In this framework, which has a longand venerable history, we end up with new transport equationsto solve. A classic example is the so-called ‘stochastic’ RTmodel, which was first introduced into atmospheric RT byAvaste and Vainikko in 1974 [130]. It recasts the highly 3Dproblem of solar RT in broken cloud layers as two coupledintegro-differential equations, one for radiance in the clouds,the other for radiance in the clear regions. It predicts ensemble-average radiances and fluxes, which are generally used torepresent instantaneous large-scale spatial averages. Thecoupling assumes a Poissonian spatial distribution of cloudsin space (i.e. no correlations beyond the residual characteristicinter-cloud distance). Along beams cast through this randomlystructured medium, clear-to-cloud transitions (and vice-versa)are Markovian. This leads to the mathematically simplestpossible coupling between the two transport equations: linearcrossing terms where the two new parameters are mean cloudfraction Ac and mean cloud aspect ratio γ = L/H (where L
is the mean horizontal cloud size).
The stochastic RT model continues to be refined [131, 132,among others], validated [133–135], and applied [136, 137,among others] to this day; see also section 7.3 below, especiallyfigure 29. Interestingly, it was developed independently inthe neutron transport community [138, 139] where, again, itremains very popular. Indeed, the question of small-scalespatial variability, unresolved in large-scale models for nuclearreactors, is taken very seriously for good reasons. Pomraning,one of its originators in neutronics, and coworkers later onre-introduced the stochastic RT model into climate science[140]. It has two well-known limits. When γ → ∞, cloudsare horizontally very extended and there is little radiativecoupling with the clear regions, so the two-state IPA in (109)becomes accurate and, accordingly, the two RTEs decouple.In the opposite limit, γ → 0, ‘clouds’ become so smallthat between two elementary events (e.g. scatterings) at finitedistance the light samples many times both cloudy and clearair, so only the mean extinction (hence mean optical depth)matters, accordingly, the two RTEs degenerate to a single one.This latter case is known as the ‘atomistic mix’ limit. So, ina specific sense, the stochastic RT model goes continuouslyfrom the 1D RT case to the two-state IPA as γ increases from0 to ∞.
Another interesting and under-appreciated contribution tothe topic was by Stephens [141]. Targeting the spatial domain-average fluxes that matter in GCMs, he revisited the derivationof the two-stream 1D RT model. In this case, he had in handa parametrized expression (based on numerical simulationsin [142]) for the systematic directional effect of the radiative‘channeling’ described further on (section 6.1). This processintroduced a new optical coefficient (in the usual units of km−1)that, like Cairns’ ε, can be obtained in principle either fromtheory or from observations.
To illustrate mean-field theory within our own work,we revisit the time-dependent random-walk model used in
29

Rep. Prog. Phys. 73 (2010) 026801 A B Davis and A Marshak
Figure 13. Schematic of the anomalous diffusion and transportmodels for domain-average solar RT in columns with spatiallycomplex cloudiness. Sunlight gets trapped in clouds where therandom steps in multiple-scattering trajectories are small. However,there are also relatively frequent large jumps between the cloudsand/or the surface. Also note the large fraction of light bouncedback to space. In the anomalous diffusion model [62], the randomsteps are implicitly drawn from symmetric Levy-stabledistributions [143] with indices 1 < α 2 (α = 2 reverts to theclassic Gaussian case, and ‘normal’ diffusion ensues); computationsare analytic. In the anomalous transport model [63], the randomsteps s are drawn from the gamma-weighted mean directtransmission law Prs > S = (1 + σS/b)−b, where 1 < b ∞(b = ∞ reverts to the classic exponential case, and ‘normal’transport ensues); computations are numerical, using a modified 1DMC code. The asymptotic laws for the responses in reflection andtransmission are as in the diffusion model, with α = min2, b, byLevy’s generalized central limit theorem [143, 144].
section 4.3. To this effect, we consider the present authors’theory of anomalous diffusion of solar radiation. In theiroriginal paper, Davis and Marshak [62] generalized therandom-walk model to situations where steps are usuallysmall (inside clouds) but not infrequently very large (betweenclouds). See schematic in figure 13.
Davis and Marshak [62] assumed PDFs for step size s withpower-law tails, ∼1/s1+b, such that all moments of order q > b
are divergent. Yet it seems natural to require that the MFP(average value of s) be finite, hence we require b > 1. Thereare indeed theoretical reasons [54] stated in section 2.3 that themean direct transmission law, hence free-path distribution, issub-exponential. Moreover, there is empirical evidence [128]that the variability of extinction averaged over a range ofscales is gamma-like; this in turn leads to power-law meantransmission [129].
Recall from section 2.4.2 that the transport MFP t =〈s〉/(1 − g) can be introduced using random-walk language,i.e. without reliance on (standard) diffusion theory, as theeffective MFP for an isotropic (conservative) scattering. Sowe continue to use it here and address finite cloudy media withslab geometry (thickness H ). We showed [62]
(i) that transmittance Tα scales as τ−α/2t and
(ii) that the mean path for transmitted light 〈ct〉T goes asH × τα−1
t ,
where α = minb, 2. These scaling laws revert to our findingsin section 4.3 for any b 2 (the upper limit for α), and we
note the difference with the gamma-weighted ICA predictionsin (114).
For a more transport-like mean-field theory, yet closelyrelated to the above anomalous diffusion model, we refer toDavis [63]. Therein, a new 1D integral RTE is obtainedand solved numerically, and we refer to this model asanomalous transport. Large τt behavior is predicted correctlyby anomalous diffusion as far as the scaling is concerned.However, the τt values at which the asymptotic regime isachieved are notably large. This casts doubts about therelevance of (analytic) anomalous diffusion to real cloudyatmospheres and argues for the more robust (computational)anomalous transport model.
5.2. Dealing with resolved spatial variability
Suppose now that all the spatial variations of the cloudoptical properties are specified down to some ‘small’ scale.Furthermore, the radiation fields maybe required down to thesame scale or maybe only to a courser one. Either way, 3DRT modelers must find ways to deliver answers for the given3D cloud structure, and not any other. Fortunately, there aremany ways of solving specific 3D RT problems, but implicitin this challenge is to deliver an answer at some pre-definedaccuracy with an efficiency that may preclude many of thestandard approaches.
So we need to discuss solutions of both the full 3DRT problem based on the linear Boltzmann equation as wellas more practical approximations thereof. The former arevery briefly described in section 5.2.3, primarily as accuracybenchmarks. The latter are exemplified by computational3D diffusion modeling, a problem set up in section 2.4 andused analytically in section 6.1; for a relatively recent surveyof numerical 3D RT approximation techniques, we refer thereader to Davis and Polonsky [145].
As an intermediate model that lies at the crossroads ofstandard 1D RT, full 3D RT and efficient approximationsthereof, we have the local IPA/ICA, as defined in section 5.2.2.This is a straightforward answer to the resolved variabilityproblem: we compute for each vertical column the 1D RTsolution, but do not necessarily perform the spatial averageused in section 5.1.2. At that point, we only had statisticalknowledge of the variability, but here we know all the details.
First, however, we must touch on another issue. If weare pursuing more realistic modeling of RT in clouds, then itcan only be as realistic as the 3D representation of the cloudsthemselves. In the applications, this preliminary question hasto be addressed in order to gauge the computational effort in theRT. There are both stochastic and physics-based approaches tocloud modeling.
• It is hard to argue against using state-of-the-art cloudresolving models precisely because they are basedon a full suite of physics: fluid dynamics, fine-scale turbulence closures, multi-phase thermodynamics,cloud microphysics, even radiation (at least from a1D RT model). These models unfold either in 2Dor (more and more) in 3D. The microphysics, i.e.droplet-scale processes can use just a few moments
30
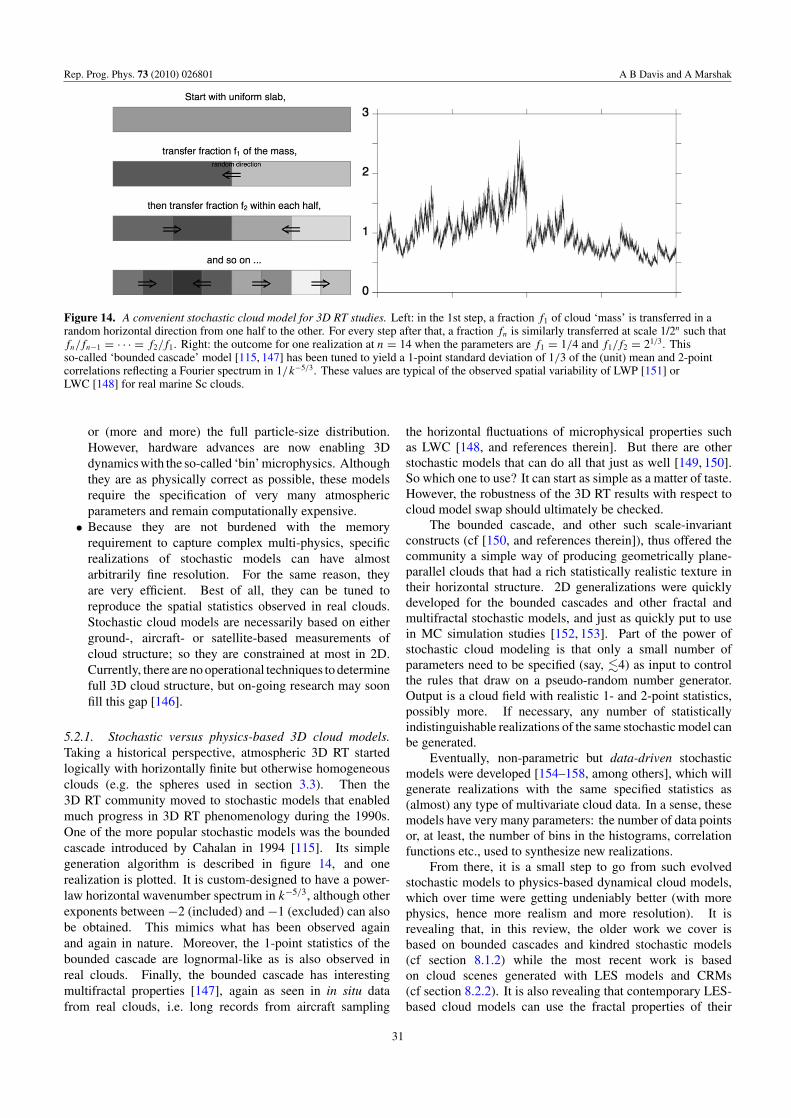
Rep. Prog. Phys. 73 (2010) 026801 A B Davis and A Marshak
Figure 14. A convenient stochastic cloud model for 3D RT studies. Left: in the 1st step, a fraction f1 of cloud ‘mass’ is transferred in arandom horizontal direction from one half to the other. For every step after that, a fraction fn is similarly transferred at scale 1/2n such thatfn/fn−1 = · · · = f2/f1. Right: the outcome for one realization at n = 14 when the parameters are f1 = 1/4 and f1/f2 = 21/3. Thisso-called ‘bounded cascade’ model [115, 147] has been tuned to yield a 1-point standard deviation of 1/3 of the (unit) mean and 2-pointcorrelations reflecting a Fourier spectrum in 1/k−5/3. These values are typical of the observed spatial variability of LWP [151] orLWC [148] for real marine Sc clouds.
or (more and more) the full particle-size distribution.However, hardware advances are now enabling 3Ddynamics with the so-called ‘bin’ microphysics. Althoughthey are as physically correct as possible, these modelsrequire the specification of very many atmosphericparameters and remain computationally expensive.
• Because they are not burdened with the memoryrequirement to capture complex multi-physics, specificrealizations of stochastic models can have almostarbitrarily fine resolution. For the same reason, theyare very efficient. Best of all, they can be tuned toreproduce the spatial statistics observed in real clouds.Stochastic cloud models are necessarily based on eitherground-, aircraft- or satellite-based measurements ofcloud structure; so they are constrained at most in 2D.Currently, there are no operational techniques to determinefull 3D cloud structure, but on-going research may soonfill this gap [146].
5.2.1. Stochastic versus physics-based 3D cloud models.Taking a historical perspective, atmospheric 3D RT startedlogically with horizontally finite but otherwise homogeneousclouds (e.g. the spheres used in section 3.3). Then the3D RT community moved to stochastic models that enabledmuch progress in 3D RT phenomenology during the 1990s.One of the more popular stochastic models was the boundedcascade introduced by Cahalan in 1994 [115]. Its simplegeneration algorithm is described in figure 14, and onerealization is plotted. It is custom-designed to have a power-law horizontal wavenumber spectrum in k−5/3, although otherexponents between −2 (included) and −1 (excluded) can alsobe obtained. This mimics what has been observed againand again in nature. Moreover, the 1-point statistics of thebounded cascade are lognormal-like as is also observed inreal clouds. Finally, the bounded cascade has interestingmultifractal properties [147], again as seen in in situ datafrom real clouds, i.e. long records from aircraft sampling
the horizontal fluctuations of microphysical properties suchas LWC [148, and references therein]. But there are otherstochastic models that can do all that just as well [149, 150].So which one to use? It can start as simple as a matter of taste.However, the robustness of the 3D RT results with respect tocloud model swap should ultimately be checked.
The bounded cascade, and other such scale-invariantconstructs (cf [150, and references therein]), thus offered thecommunity a simple way of producing geometrically plane-parallel clouds that had a rich statistically realistic texture intheir horizontal structure. 2D generalizations were quicklydeveloped for the bounded cascades and other fractal andmultifractal stochastic models, and just as quickly put to usein MC simulation studies [152, 153]. Part of the power ofstochastic cloud modeling is that only a small number ofparameters need to be specified (say, 4) as input to controlthe rules that draw on a pseudo-random number generator.Output is a cloud field with realistic 1- and 2-point statistics,possibly more. If necessary, any number of statisticallyindistinguishable realizations of the same stochastic model canbe generated.
Eventually, non-parametric but data-driven stochasticmodels were developed [154–158, among others], which willgenerate realizations with the same specified statistics as(almost) any type of multivariate cloud data. In a sense, thesemodels have very many parameters: the number of data pointsor, at least, the number of bins in the histograms, correlationfunctions etc., used to synthesize new realizations.
From there, it is a small step to go from such evolvedstochastic models to physics-based dynamical cloud models,which over time were getting undeniably better (with morephysics, hence more realism and more resolution). It isrevealing that, in this review, the older work we cover isbased on bounded cascades and kindred stochastic models(cf section 8.1.2) while the most recent work is basedon cloud scenes generated with LES models and CRMs(cf section 8.2.2). It is also revealing that contemporary LES-based cloud models can use the fractal properties of their
31

Rep. Prog. Phys. 73 (2010) 026801 A B Davis and A Marshak
output as validation that they are correctly capturing the highlynonlinear physics [159].
5.2.2. The local IPA/ICA. In section 5.1.2 we presented theIPA/ICA as a statistical technique based on available 1D RTtheory to cope with unresolved spatial variability by averagingthe 1D RT results over the 1-point cloud variability. However,in the present problem posed by resolved cloud structure, theidea of using 1D RT to predict not just a domain average butalso the fluctuations of the radiation field itself is worthy ofconsideration.
Assume, for simplicity, that only the extinction coefficientσ(x, y, z) varies spatially within a plane-parallel mediumMpp(H) occupying the space between z = 0 and z = H ;Mpp(H) need not be the full support of the extinction fieldsince there can be substantial regions of optical void insideMpp(H). With this option in mind, it is not much of a constraintto assume the outer cloud geometry is plane-parallel.
Formally, we can define without reference to any grid
τ(x, y) =∫ H
0σ(x, y, z) dz. (115)
All other optical properties, single-scattering albedo 0 andphase function P(Ω′ → Ω), including asymmetry factor g in(20), are assumed uniform in Mpp(H), but only for simplicity.The local IPA/ICA prediction for, say, reflected boundary fluxis then F1D(x, y) = µ0F0R(τ(x, y), 0, g; µ0).
Let us put this idea into the broader context. Theuniform plane-parallel slab model for clouds is much malignedby the 3D RT community, for scientifically sound reasons(cf section 6). However, that simple model is actually just onepossible approximate solution to a difficult problem. Granted,one that has been abused. This abuse has established theplane-parallel model as an apparently immutable standard ofreference, in atmospheric 3D RT research.
In the not too distant future, we hope to have thisperspective reversed. At present, the plane-parallel modelpresented as the only one deemed a priori to be ‘practical’enough for use in operational settings. We would rather seethe plane-parallel model be humbly submitted as a possibleapproach, with advantages and flaws, to the challengingproblem of radiation transport in the real 3D world. Atthat point, 3D RT becomes the standard of reference in theoptics and energetics of the Earth’s cloudy atmosphere. Inthe interim, we continue to use the plane-parallel slab model(where, by definition, all net horizontal fluxes are neglected) topredict even highly resolved radiation fields. Consideration ofcomputational limitations should be secondary, partly becausecomputational resources are improving tremendously fromdecade to decade (roughly the life-cycle of a major programor mission) and partly because of on-going efforts describedin sections 7–8 to mitigate—even exploit—3D RT effects.
5.2.3. Computational 3D RT. There will always be a needfor high accuracy and high precision benchmarks in 3D RT.In this subsection, we overview the two general numericaltechniques: random and deterministic quadrature methods.
The interested reader is referred to a relatively recent surveyby Evans and Marshak [160, and references therein] for moredetails. For a recent survey of the various 3D RT models inuse and an illustration of their typical capability, we refer toCahalan et al ’s [161] overview of the Intercomparison of 3DRadiation Codes (I3RC). The I3RC is a grass-roots initiativethat built up a challenging suite of cases designed to exercisethe models with increasing scene complexity.
In short, there are discretization (deterministic) andprobabilistic (Monte Carlo) methods for solving the integro-differential 3D RTE in (8), and there are potentially verypowerful hybrid methods [162, 163].
Preliminaries. For easy reference, we rewrite the steady-state version of (8) succinctly as
LI = SI + q, (116)
where L is the (differential) linear transport operator Ω ·∇ +σ ,S is the (integral) scattering operator σs
∫4π
P (Ω′ · Ω)[·] dΩ′
and q is the (optional) source term. This equation can be putin a purely integral form,
I = KI + Q, (117)
whereK = L−1S (118)
is the full transport kernel and
Q = L−1q. (119)
The physical interpretation (and numerical implementation)of the integral operator L−1 is an upwind ‘sweep’ through the3D medium, in this case, collecting in Q all the light directlytransmitted, using (12), from the primary sources in q to thegeneric point-and-direction of interest (x,Ω). We will assumesteady sources for the time being.
Formally, the solution of (117) can be written as aNeumann series
I = (1 − K)−1 Q =∞∑
n=0
KnQ. (120)
Both deterministic and Monte Carlo methods capitalize onthis expansion by successive iterations of K. The physicalinterpretation of the series is radiance contributions fromsuccessive orders of scattering. The convergence rate of theNeumann series, and possibly its acceleration, is a centralquestion in numerical transport methods. Theoretical analysisof this key issue is out of our present scope, but it should beknown that it involves the eigen-value spectrum of the integraloperator K in (118): numbers η that give non-trivial solutions toKφ = ηφ where φ are eigen-functions. The radiative transferequation has a unique positive eigenvalue that corresponds toa unique positive eigen-function. See Case and Zweifel [164]and Vladimirov [165] for more details.
To make this classic decomposition more transparent,suppose we know all the terms in (120) for some RT problemwith everywhere conservative scattering (0 ≡ 1), and we
32

Rep. Prog. Phys. 73 (2010) 026801 A B Davis and A Marshak
call them I (1)n ; the Neumann series then becomes I (1) =∑∞
n=0 I (1)n . Then suppose we want to know the solution of
the same problem but with some uniform level of absorption(i.e. 0 0 < 1). We can factor out 0 from each term in(120), leading to
I (0) =∞∑
n=0
I (0)n =
∞∑n=0
n0 I (1)
n , (121)
where the nth term of this Taylor series in 0 is the contributionto I (0) of radiation scattered n times. Although it isphysically impossible to filter orders of scattering, someinstruments are designed to select them as best possible. Sun-photometers use in principle only the 0th-order term I
(0)0 ,
while standard lidars use in principle only the 1st-order termI
(0)1 . In practice, both these types of observation need to
be examined and possibly corrected for the presence of allthe higher-order terms as soon as they collectively exceed thetolerance threshold for systematic overestimation.
Considering the expansion of the steady-state Greenfunction into its order-of-scattering components in (121), itis interesting to note that both G
(0)0 (x,Ω) and G
(0)1 (x,Ω)
are singular in the following sense. Given a distribution sourceterms δ(x−x0)δ(Ω−Ω0), where either x0 or Ω0 span less thantheir full supports, there is a measurable subset of points (x,Ω)
in the transport phase space where the resulting superpositionI (0)n (x,Ω) (n = 0, 1) has discontinuities. An interesting
corollary of this singularity property in inverse transport theory[166, and references therein] is that, with full and perfectknowledge of only these two terms, one can reconstruct exactlyboth σ(x) from I
(0)0 and σs(x)P (x,Ω′ · Ω) from both.
Computed (x-ray) tomography works because 0 ≈ 0 in(121); moreover, the robust features in x-ray images that enablethe reconstruction technique to overcome the effects of noiseand residual scattering result directly from those singularities.The corresponding instrument in atmospheric research is thesun-photometer, only interested in the non-scattered sunlightI
(0)0 . Lidar and all forms of radar are only interested in I
(0)1
for a special value of Ω′ ·Ω = −1, and they are indeed our mainsources of tomographic information about the atmosphere.
All higher-order terms, n 2, in (121) are smooth evenfor a single δ-source. Consequently they are an impedimentto standard tomographic methods, lidar and radar in particular.Near the end of this review, we will describe a novel type oflidar (as well as a closely related passive solar technique) thatperforms a limited but useful form of cloud tomography usingonly the diffuse multiply scattered light field.
Finally, both deterministic and Monte Carlo (MC)methods can be generalized to account for time-dependence.This is, however, by far easier with MC methods than to have todiscretize t deterministically. Even though this new dimensionis not much extra burden on computer memory, one needs tocarefully maintain congruence with the discretization of x inorder to keep the numerical scheme stable. By contrast, ina MC scheme, it is as simple as adding path ct as a fourthindependent variable to (x, y, z) when generating the randomtrajectories; ct is just the running sum of all the steps betweenscattering events, without the direction cosines that apply to
the propagation in spatial variables. Many time-dependentMC results were used to generate the figures in the previoussection.
Deterministic methods. Both deterministic and Monte Carlomethods call for a grid, Cartesian or otherwise convenient,or an unstructured mesh, to define (in computer memory) thespatial variability of the optical medium as well as the sourceterm q. It covers a finite subset M of R
3. Deterministicmethods also need the spatial grid to discretize the differentialpart of the 3D transport equation represented in (116) byLI . Furthermore, these methods call for a discretization ofdirection space (‘SN ’ methods)—or a truncated expansionin spherical harmonics (‘PN ’ methods)—or both, to treatthe scattering integral represented by SI . The algorithmspecified in (120) is technically known as ‘source iteration,’and there are clever ways of accelerating its convergence,cf [167–169, among others].
The atmospheric 3D RT community is overwhelminglydominated by Monte Carlo modelers, but there is onedeterministic model called the spherical harmonics discreteordinates method (SHDOM) by Evans [170] that evolvednaturally from his spherical harmonics spatial grid model[171], adding the efficiency of spherical harmonics to theangular integrations and adaptive grid refinement in the spatialdomain. SHDOM is freely available and quite widelyused. Recent and welcome additions to this too short list ofdeterministic codes are the EVENT [172, 173] and RADUGA[174] models but, as far as we know, they are not openlydistributed. Another interesting development is the applicationof wavelet transforms to the numerical solution of the 3DRTE [175, 176]. This recent effort was inspired by an earlyattempt at spatial representation of the 3D RTE by horizontalFourier transforms [177], but leads to potentially far moreefficient multi-scale methods with sparsely populated matricesto process.
Figure 15 shows an SHDOM computation. It is adetailed 3D rendering of the directionally averaged radiancefield, J (x, 0, z)/4π from (13), for the rotationally symmetricboundary-source Green function of a uniform cloud in thespatial domain. It is plotted both inside and outside the cloudusing a logarithmic color-scale.
Monte Carlo methods. Where MC methods depart funda-mentally from their deterministic counterparts is that they onlyneed a grid or mesh to define the spatial distribution of opticalproperties and sources. After that, the elements of K in (118)are used as rules to generate a random realization of a Markovchain of propagation and scattering events. The integral sourceterm Q is used to generate random starting points and the chainis stopped, in the absence of absorption, when it crosses theboundary of M . In the presence of absorption, there is a finiteprobability of terminating the chain inside the medium; alter-natively, the ‘weight’ of the roaming Monte Carlo ‘particle’can be reduced to track absorption. There are various waysof tallying Monte Carlo particles, with or without weights, toestimate precisely what is asked of the 3D RT model.
33

Rep. Prog. Phys. 73 (2010) 026801 A B Davis and A Marshak
Figure 15. A transect of mean radiance for the pencil-beam illumination problem inside a finite homogeneous slab, from SHDOM. Theoptical medium is a uniform non-absorbing (0 = 1) plane-parallel cloud of thickness H = 1.2 km and extinction σ = 30 km−1, henceoptical thickness τ = σH = 36. The phase function is for a ‘C1’ droplet-size distribution for λ = 532 nm. Mean radiance, J/4π from (13),is plotted for a domain larger than the cloud itself. A close look at the logarithmic color-scale reveals that the light field in the cloud isdecaying exponentially with distance from the source as dictated by ρ in (86). The ‘rays’ emanating from the source region near the top ofthe cloud are an artifact of the discrete ordinates scheme (in this case, Nµ = 12 and Nφ = 24). This result was graciously contributed byDr Franklin Evans (University of Colorado).
Monte Carlo is at its best when tasked to compute spatialand/or angular integrals. Formally, we seek [179]
E = (f, I ) =∫
4π
∫∫∫M
f (x,Ω)I (x,Ω) dx dΩ, (122)
where dx denotes dx dy dz. Function f describes the responseof a virtual detector inside or at the boundary of M . Thebigger the support of f , the better the accuracy achieved forE, simply because all the more histories will contribute. Weknow the convergence rate is slow, in 1/
√N (where N is the
total number of histories generated); so the size of the supportof f matters for the variance of the estimator, but its choiceis dictated by the application. So, for a given application, inatmospheric RT in particular, there is always a tradeoff study toperform between deterministic and MC methods, as recentlyemphasized by Pincus and Evans [180].
Now, independently of f , there are many clever ways ofreducing MC variance in general [181, 182, among others],and they find their way into atmospheric RT applications[183, 184, among others]. The most effective are to use anapproximate deterministic solution to guide the Markov-chainsampling and determine the weight multiplier; these are theso-called ‘hybrid’ methods [163] and they remain an area ofopen research.
It is important to note that, in MC simulation, there isno need to forcibly truncate the Neumann series in (120).Indeed, if a MC particle wanders for too long (or into regionsof less interest) by some criterion, it can be terminated atthe flip of a digital coin ... or continued (temporarily) withtwice the weight. This game of ‘Russian Roulette’ increasessomewhat the variance, but ensures that there is no bias in theestimate of E.
It is also important to remember that, if f describes adomain-scale integration, as in the estimation of total (asopposed to local) reflectance or transmittance, MC can benot only more accurate but also faster than a deterministicestimate. In the deterministic model, radiance is computedeverywhere whether or not it is required. When local values
of the boundary-leaving fluxes—and worse still radiance—arerequired, then deterministic methods have an edge.
As in figure 15 for SHDOM, figure 16 shows MC estimatesof Green functions for a homogeneous plane-parallel cloud.In this case, we are looking at boundary-source/boundary-detector Green functions. The numerical noise is evident andincreases as expected as the number of locally tallied historiesdecreases, i.e. as the distance from the source increases.
6. Assessment of 3D damage to 1D RT modeling
There has been a sustained interest in spatially variable sourcesin uniform media, this review included (cf figures 15–16).However, the vast majority of atmospheric 3D RT studiesare based on spatially variable media and uniform sources.From the earliest theoretical studies [8] to the most recent dataanalyses [185], the latter use 1D RT as a reference. It mayseem strange to use such a coarse representation of reality asa standard benchmark but we must bear in mind that, whenit comes to the applications, RT is generally just a meansto an end. So there is usually an expectation—and oftena requirement—of expediency. Typically, the effects of 3DRT with respect to this benchmark are quantified under somereasonable assumption such as conservation of the total mass(i.e. number of material particles responsible for the scatteringand absorption). We think of this activity as an assessment ofthe damage that 3D RT causes for the accepted operational1D solution to the RT problem embedded in virtually allapplications.
6.1. 3D RT phenomenology: how radiation flows aroundopaque regions and is channeled into the tenuous ones
One-dimensional atmospheric RT modeling is always alignedwith the vertical (z) axis. Cloud shadows cast by the Sun underoblique incidence (as seen through an airplane window) are themost obvious cloud-related 3D RT effect. This may not be abig concern in the case of extensive stratiform clouds since
34

Rep. Prog. Phys. 73 (2010) 026801 A B Davis and A Marshak
Figure 16. Boundary fluxes for the pencil-beam illumination in a 2 × 2 km2 domain for a finite homogeneous slab, from a MC scheme. Theoptical medium is a uniform non-absorbing (0 = 1) plane-parallel cloud of thickness H = 0.3 km and optical thickness τ = 13. The phasefunction is the H–G model in (33) with g = 0.85. Boundary fluxes are plotted for reflectance (left), R(x, y) = F−(x, y, 0), and transmission(right), T (x, y) = F+(x, y, H), on 128×128 grids. The isophotes are on a log-scale, so we recognize the exponential decay controlled by ρ
in (86). Double-headed arrows on the side indicate the RMS values for ρ, i.e. 〈x2 + y2〉1/2F (F = R, T ). The signature numerical noise of the
MC method is visible at the lowest light levels. In this case, 108 histories were traced and this particular cloud has R ≈ T ≈ 0.5, leading to≈0.5% noise in the center and ≈5% near the edge. Reproduced from [178].
they have, in the sense of fractal geometry, much more bulkthan boundary both in 3D space and under vertical projection.However, we are curious about how this zeroth-order scatteringstatement generalizes to diffuse light and how it flows through3D media such as cloudy skies.
As far as we know, not much can be proven analyticallyin full 3D RT in a scattering medium. Consequently, generalstatements about 3D RT phenomenology tend to be qualitativeand substantiated largely by numerical experiments. Thepresent authors have attempted to create at least one exceptionto this rule. There is a price, however, which is to usethe asymptotic limit of 3D RT captured by diffusion theoryand, moreover, to assume isotropic (rather than collimated)boundary sources. There is no doubt that many instancesof solar RT in real clouds are in the diffusion regime, ascompellingly demonstrated by King et al [186] using in-cloudradiometry. However, we already know that diffusion does notdo so well in the radiative boundary layer, with a few MFPsfrom all boundaries. It appears that this is not a roadblock.
The details of the derivation are in the 2000 paper by Davisand Marshak [121]. Here we will only state, illustrate anddiscuss the ‘theorem.’ Let M be a 3D optical medium basedon M0 = x ∈ R
3; 0 < x < Lx, 0 < y < Ly, 0 < z < H : itis contained in a plane parallel slab of thickness H along thevertical and its spatial variability in M0 is replicated cyclicallyin the horizontal plane with periods Lx,y in the x, y directions,respectively. The medium is purely scattering (0 = 1) andwith horizontally averaged and scaled optical depth (1 − g)τ
sufficiently large for diffusion to be a reasonable model for theRT. Sources are uniformly distributed on cloud top (z = 0)but, as previously stated, modeled as isotropic, i.e. we neglectradiative boundary-layer effects in this solar case, with F0
being the incoming flux, normal to the cloud top. Cloudbase (z = H ) is purely absorbing. We use the homogeneouscloud case as a reference for the total transmittance/reflectancecomputations, e.g. R1D results from the fixed mean extinction
σ = 1
LxLyH
∫∫∫M0
σ(x) dx = τ
H.
We then compare to R1D the corresponding outcome R3D forany realization σ(x) of the optical variability with the samemean. Note that holding the mean σ(x) constant is equivalentto conserving mass, cf (9) for the relation between σ(x) andscattering particle density.
The flow obeys ∇ · [σt(x)−1∇J ] = 0 with Robin-typeBCs [1 − χσt(x)∂z]J |z=0 = 4, [1 + χσt(x)∂z]J |z=H = 0.Domain-average reflectance is then given by
R3D = R(x, y) = 1
2LxLy
∫ Lx
0
∫ Ly
0J (x, y, 0) dx dy − 1.
A straightforward but tedious non-perturbative computationyields [121]
δR
R1D= 3χ
δσ(x)δFz(x)
σF0, (123)
where δR = R3D − R1D, δFz(x) = F (3D)z (x) − F (1D)
z (z) andδσ (x) = σ(x) − σ . So the relative change in R caused by 3Deffects is proportional to the spatial correlation between
• fluctuations of extinction—hence of density—relative toand normalized by its mean value and
• deviations of net vertical flux from the 1D RT prediction(based on the mean extinction) and normalized by theincoming flux.
Figure 17 shows schematically how these quantities varyin opposite directions. This systematic anti-correlation willclearly dominate the spatial averaging. We thus predict thatδR < 0: reflectance of a 3D cloud is always less thanreflectance for the homogeneous medium with the same totalamount of scattering material.
This prediction applies to the large-scale flow of radiationin (or around) clouds. The same forecast was madein section 5.1.2 based on the ICA as applied to domainaverages. However, the present computation makes nosuch approximation. One can imagine 3D optical mediadecomposed into vertical columns of finite width where eachcolumn has the same total optical depth (large enough fordiffusive transport to prevail), but the distribution of extinction
35

Rep. Prog. Phys. 73 (2010) 026801 A B Davis and A Marshak
Figure 17. Schematic of radiation channeling at a non-absorbingwavelength. Regions with positive and negative fluctuations ofextinction are illustrated for a geometrically plane-parallel cloudunder uniform normal or diffuse illumination. They have oppositeeffects on the local values of the vertical component of the vectorflux. Reproduced from [121].
Figure 18. Radiation channeling by a finite cloud under obliqueillumination. Both the reflected-to-space and transmitted-to-groundradiance fields are affected, positively by the flux deflected on theilluminated side, negatively by the shadowing. Reproducedfrom [121].
in each one is random. In this case of constrained randomness,RICA = R1D yet we still have R3D < R1D because of howthe radiant energy is ‘channeled,’ to adopt the expression ofCannon [187]. As seen in figure 17, the solar radiation isessentially reflected off the opaque regions of the cloud andconcentrated into the tenuous ones.
The inherently 3D phenomenology of radiative channelingemerging from the above analysis is based, for simplicity,on an isotropic illumination scenario. The symmetry of theillumination can be thought of as a spatial average over thehemisphere illuminated at any one time by the Sun. However,the idea of a uniform cloud layer covering the planet as areference is not very helpful. So it is of interest to ask aboutchanneling in the case of a collimated and, in general, obliqueillumination. Figure 18 illustrates this situation, and we seethat the 3D cloud-driven perturbation of the flow contributesto the reflected light returning space and to the transmitted lightthat reaches the surface. We thus expect that 3D effects notcaptured by the ICA will largely, but not completely, cancel inquantities averaged over extended domains.
6.2. Large-scale fluxes for GCMs, small-scale fluxes forLES/CRMs
The essentially constant irradiation of the Earth with solarradiation, from the UV to the shortwave IR, is the primary
source of energy for the climate system. So the climate-driven task for RT is to compute across the whole solarspectrum how much energy is deposited at the surface, howmuch in the various parts of the atmosphere, and how muchgoes back to space. Other physical models take care ofthe rest of the story: what happens to the influx of solarheat as it is pooled with other types of heat flux (e.g. phasechanges).
The fundamental quantity of interest here is −∇ · Fλ
in W m−3 nm−1. Once spectrally integrated, it is eventuallyconverted into the solar contribution to the heating rateexpressed in day−1. By conservation of radiant energy (16)for steady sources, this rate can be computed from σaλ(x)Jλ(x)
as long as both direct and diffuse radiation are included, thatis when the Qλ(x) ≡ 0 convention is used in (8) and thesolar irradiation is captured in the BCs (37) for the RTE.So the kinetic recipe is simple: (i) determine what is thelocal density of radiant energy Jλ(x)/c in J m−3 nm−1 from(13), then (ii) multiply by the local collision rate cσaλ(x) forradiative absorption processes in s−1, then (iii) integrate overthe solar spectrum. This is of course easier said than donewith RT models. The spatial scale at which we wish to know∫ ∞
0 (−∇ · Fλ) dλ will determine the approach. In the questfor improved methods for treating the spatial RT problem it isequally important to keep in mind that the spectral integrationalso has inherent error, which has been studied in great detailunder the 1D RT assumption [188, 189]. From the end-user’sperspective, only the total (spatial+spectral) error that matters,as well as the computational effort (in CPU cycles) it takes toget the answer.
Figure 19 illustrates schematically the two main situationsencountered in atmospheric RT targeting the energy budget.The rather large domains spanned by a single cell in a typicalGCM or a generic column in a CRM.
In the former case (upper left-hand panel), net horizontalfluxes are arguably of minor importance. Indeed, from ourinvestigation of the spatial Green function in transmissionor reflection, we suspect that horizontal fluxes will unfoldat most over scales comparable to the thickness of themedium. In this case, the medium is much wider than itis thick. So there is at least a chance that horizontal fluxeswill cancel. On the other hand, it matters greatly to getthe vertical fluxes right. So it seems that we will have toaddress vertical correlations in clouds [190] sooner than theirhorizontal counterparts [191]. This is the ideal situation for theICA and that approximation has indeed proven very effectivein improving the problem of RT in GCM grid-cells; seesection 7.1.
In the latter case (right-hand panel of figure 19), whatis happening in neighboring columns clearly matters a lot.In this model for small-scale cloud processes, it is patentlyabsurd to force the radiation to flow up and down ... yetthat is what is done routinely. This is the effect of legacy:radiation parametrizations in CRMs are inherited from GCMs,the obvious place a dynamical modeler would go to find aradiation scheme. This radical modeling short-cut is certainlyefficient, but is it justified?
36
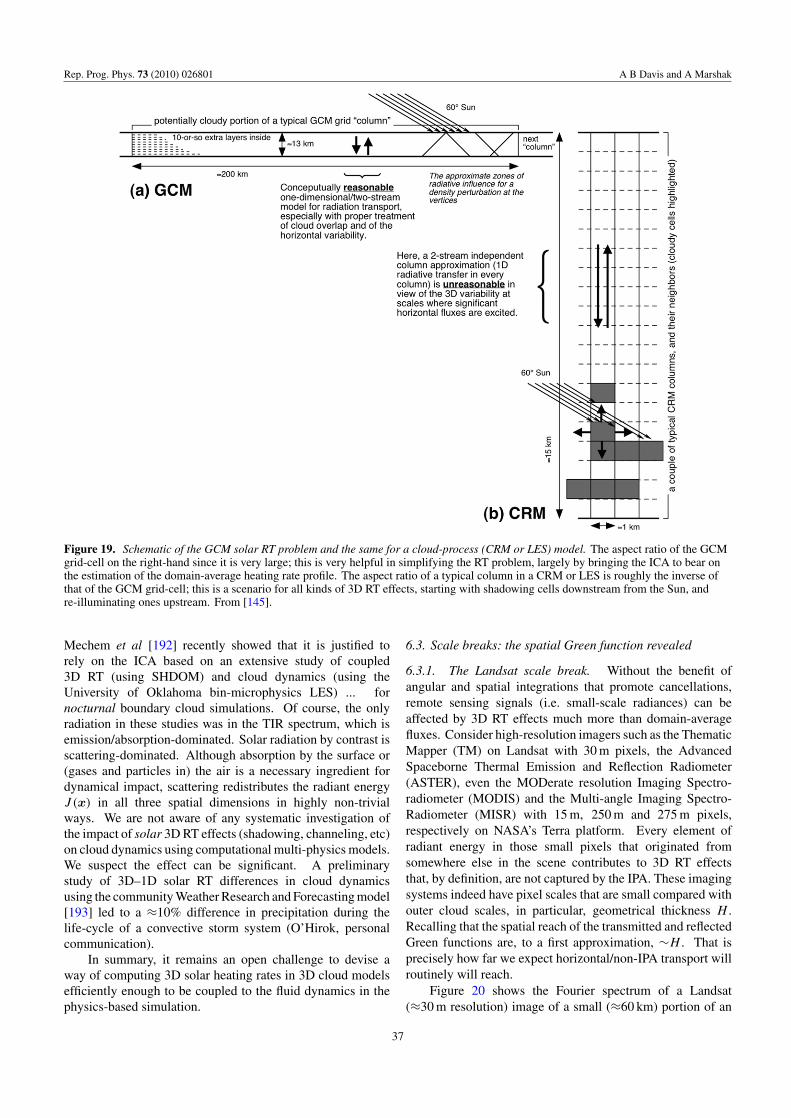
Rep. Prog. Phys. 73 (2010) 026801 A B Davis and A Marshak
Figure 19. Schematic of the GCM solar RT problem and the same for a cloud-process (CRM or LES) model. The aspect ratio of the GCMgrid-cell on the right-hand since it is very large; this is very helpful in simplifying the RT problem, largely by bringing the ICA to bear onthe estimation of the domain-average heating rate profile. The aspect ratio of a typical column in a CRM or LES is roughly the inverse ofthat of the GCM grid-cell; this is a scenario for all kinds of 3D RT effects, starting with shadowing cells downstream from the Sun, andre-illuminating ones upstream. From [145].
Mechem et al [192] recently showed that it is justified torely on the ICA based on an extensive study of coupled3D RT (using SHDOM) and cloud dynamics (using theUniversity of Oklahoma bin-microphysics LES) ... fornocturnal boundary cloud simulations. Of course, the onlyradiation in these studies was in the TIR spectrum, which isemission/absorption-dominated. Solar radiation by contrast isscattering-dominated. Although absorption by the surface or(gases and particles in) the air is a necessary ingredient fordynamical impact, scattering redistributes the radiant energyJ (x) in all three spatial dimensions in highly non-trivialways. We are not aware of any systematic investigation ofthe impact of solar 3D RT effects (shadowing, channeling, etc)on cloud dynamics using computational multi-physics models.We suspect the effect can be significant. A preliminarystudy of 3D–1D solar RT differences in cloud dynamicsusing the community Weather Research and Forecasting model[193] led to a ≈10% difference in precipitation during thelife-cycle of a convective storm system (O’Hirok, personalcommunication).
In summary, it remains an open challenge to devise away of computing 3D solar heating rates in 3D cloud modelsefficiently enough to be coupled to the fluid dynamics in thephysics-based simulation.
6.3. Scale breaks: the spatial Green function revealed
6.3.1. The Landsat scale break. Without the benefit ofangular and spatial integrations that promote cancellations,remote sensing signals (i.e. small-scale radiances) can beaffected by 3D RT effects much more than domain-averagefluxes. Consider high-resolution imagers such as the ThematicMapper (TM) on Landsat with 30 m pixels, the AdvancedSpaceborne Thermal Emission and Reflection Radiometer(ASTER), even the MODerate resolution Imaging Spectro-radiometer (MODIS) and the Multi-angle Imaging Spectro-Radiometer (MISR) with 15 m, 250 m and 275 m pixels,respectively on NASA’s Terra platform. Every element ofradiant energy in those small pixels that originated fromsomewhere else in the scene contributes to 3D RT effectsthat, by definition, are not captured by the IPA. These imagingsystems indeed have pixel scales that are small compared withouter cloud scales, in particular, geometrical thickness H .Recalling that the spatial reach of the transmitted and reflectedGreen functions are, to a first approximation, ∼H . That isprecisely how far we expect horizontal/non-IPA transport willroutinely will reach.
Figure 20 shows the Fourier spectrum of a Landsat(≈30 m resolution) image of a small (≈60 km) portion of an
37

Rep. Prog. Phys. 73 (2010) 026801 A B Davis and A Marshak
Figure 20. The Landsat scale-break, as observed in Fourier space.This wavenumber spectrum EI (k) for the nadir radiance field is theazimuthal average of the 2D Fourier mode energies for a largeportion of a Landsat-5 TM image, itself of a small portion of marineSc deck off the coast of Southern California. We observe threedistinct regimes where EI (k) goes as k−β : β ≈ 0 (no spatialcorrelations), from r = 1/k ≈ 100 to 30 km; β ≈ 5/3 (turbulence),from 30 to 0.2 km; β 3 (radiative smoothing), from 200 m to theNyquist scale 60 m. Full details in Davis et al ’s paper [178]. Theinset, from [151], shows a 61×61 km2 portion of another Landsatimage (0.52–0.69 µm channel) of the same cloud type capturedduring the same field campaign: the 1987 First ISCCP RegionalExperiment (FIRE’87) [194].
extensive and persistent marine strato-cumulus cloud deck.Such clouds are major contributors to the Earth’s global albedo,hence climate balance, hence are of considerable interest.It had been noticed [151, 195] that cloud radiance fields, assampled by Landsat, exhibited a break in their k−5/3 scalingaround the equivalent in wavenumber space of about 1/3to 1 km; at smaller scales (larger wavenumbers) there is anotable lack of variance relative to the extrapolated scalinglaw. Various explanations had been advanced for this scalebreak that involved a slew of processes ranging inherentcloud structure/dynamics (‘it is real’) [151] to a mismatchof the Thematic Mapper’s sampling (instantaneous FOV)and true resolving power (‘it is an artifact’) [195]. Daviset al [178] explained the feature as a clear manifestation of‘radiative smoothing’ [142, 196], which, in turn, is a directconsequence of horizontal transport of radiation over scalescommensurate with 〈ρ2〉1/2
R from section 4 on Green functions.MC simulations of 3D RT in perfectly scaling multifractalcloud models were performed, which were considered at thetime of heroic proportions (many multi-day runs). Theyshowed that the scale associated with the critical wavenumberhad the same behavior with respect to H , τ and even g,as the RMS horizontal transport distance, i.e. ∝√
Ht =H/
√(1 − g)τ from (94).
Radiative smoothing is always present but it is trulyevident in wavenumber spectra only if θ0 30. At moreoblique illumination angles, brightening/shadowing effects(cf figure 18) produce a radiative roughening in the senseof enhanced amplitudes in Fourier space [197, 198]. Thisenhanced variability becomes manifest at scales determinedby the amplitude of cloud-top height variations (H ) afterprojection along solar rays, hence H × tan θ0.
6.3.2. The Zenith-radiance scale break. If one canessentially visualize the spatial Green function for reflectionin the Fourier spectrum of nadir radiance fields captured byspace-based imagers with sufficient resolution, what aboutzenith radiance that reaches ground? Imaging is not an optionbut one can certainly point a narrow FOV (NFOV) radiometerupward at a ground station and collect a time series of zenith-radiance measurements Izen(time). This is in fact quite easyto do, as long as radiometric calibration (and especially itsmaintenance) is not a requirement, as is the case here: onlyrelative fluctuations are of interest, so the notorious ‘arbitraryunits’ are good enough. Then, to interpret spatially what wasmeasured temporally, Taylor’s frozen turbulence hypothesis isinvoked: Izen(space) = Izen(time)|time=space/mean wind.
The left panel in figure 21 shows Izen(x) from underan extensive St layer based on NFOV data for a non-absorbing (red) wavelength collected on 8 October 1998,at the Chilbolton Observatory (51.13N, 1.43W), UK, bySavigny et al [199, 200]; their sampling rate was 2 Hz, theirlongest record covered ≈4 h (≈3 104 measurements), and theywere able to collect on three other days during the samemonth. Rather than the frequency or wavenumber (Fourier)spectrum, the 2nd-order structure function was used: SF(r) =[Izen(x + r) − Izen(x)]2. It has the advantage that, if there aredata drop-outs, they can simply be skipped. As for the k-dependence of the wavenumber spectrum, one naturally seekspower-law behaviors in r:
√SF(r) = [Izen(x + r) − Izen(x)]2
1/2 ∼ rh, (124)
where h is the Hurst exponent, a.k.a. the (global) Holder–Lipschitz exponent.
A variant of the Weiner–Khintchin theorem for non-stationary processes with stationary increments relates thewavenumber spectrum and the 2nd-order SF(r) [201]: theyform a Fourier transform pair. In particular, if the spectrumscales as k−β with 1 < β < 3 then β = 2h + 1 and,more generally speaking, h = min1, max0, (β − 1)/2.Recognizable scaling behaviors are h = 0 for all stationaryprocesses (i.e. that are de-correlated over the associated rangeof r), h = 1/3 for turbulence-like variability (correspondsto a Fourier spectrum in k−5/3, as for the simple fractal cloudmodel in figure 14) and h = 1 for all smooth (i.e. differentiable)fields. Interestingly, all three of these regimes are present inthe right-hand panel of figure 21:
(i) at the smallest scales, up to the extent of the transmittedGreen function, which is ∼H , Izen(x) is a smooth function(h 1);
38

Rep. Prog. Phys. 73 (2010) 026801 A B Davis and A Marshak
Figure 21. The zenith-radiance scale break, as observed in the time domain using Taylor’s frozen turbulence hypothesis. Left: the solidblack lines show the time series of Izen in arbitrary units, resampled in order to show the whole record and leaving same visual impression asturbulence; the inset displays a small sample of the raw 2 Hz data showing the fully smoothed fluctuations. The bold gray points are for theground-based time series of broadband flux; it behaves like a smoothed version of Izen, but for a different reason: the angular integral of allthe down-welling radiance corresponds to a large-scale spatial average determined by the cloud ceiling height. Right: SFs for Izen and thebroadband flux as functions of r expressed in samples. A nominal 5 m s−1 wind speed was used in the Taylor hypothesis and the exponent ζ2
is denoted 2h in the main text. Reproduced from [199].
(ii) at the intermediate scales, the transmitted sunlight inIzen(x) follows the general turbulence-like structure of thecloud (h 1/3);
(iii) at the largest scales, the fluctuations of transmittedsunlight are de-correlated (h ≈ 0).
The small-scale behavior is as expected in a fully 3D RTregime where radiative smoothing occurs, noting that finite-size effects and noise prevent the empirical value of h fromreaching the theoretical limit of unity. The two larger-scale behaviors are as expected in IPC/ICA regimes wherethe 1D RT model is a reasonable approximation, preferablyadjusted for unresolved variability effects using one or anotherof the approaches described in section 5.1. Savigny et al[199] found the predicted transition from smooth behaviorto turbulence-like behavior at time lags that translated (viaTaylor’s hypothesis) to spatial scales commensurate with thethickness of the cloud deck, which was known through acollocated millimeter-wave radar.
6.4. Retrievals of cloud properties
The above discussion of scale breaks is in the context offorward 1D RT modeling error. However, an immediateconsequence is that the mapping of higher radiances to higheroptical depths in 1D RT can be in error. At a minimum,the pixel adjacency effects manifested in radiative smoothinglead to PDFs of τ that are too narrow, but there can alsobe systematic biases due to unresolved variability. That isjust a beginning. Numerous studies have focused on 3D-induced cloud remote sensing error (a few examples follow)and this issue continues to attract interest; see [202] for a recentstatistical inquiry.
6.4.1. Cloud optical depth retrievals. The RT model used instandard satellite remote sensing retrievals of cloud propertiesis entirely 1D, being based on two main assumptions:clouds are horizontally homogeneous inside each satellite pixel(no unresolved variability effects), and the radiative effectof neighboring pixels is negligible (no resolved variabilityeffects). Under these conditions, clouds can be represented asinfinitely wide plane-parallel slabs with uniform, or possiblyz-dependent, properties.
Horvath and Davies [203] quantified how frequently theabove assumptions are met globally as a function of pixelscale using a high-resolution data set. Specifically, they usedthe above-mentioned MISR radiances reflected from waterclouds over ice-free oceans. MISR views the Earth from theTerra platform at four VNIR wavelengths with nine cameras,ranging from a 70 zenith viewing forward through nadirto 70 viewing aft [204]. The time interval between thetwo most oblique observations is 7 min and the cross-trackresolution is 275 m. Accurately co-registering the multi-angleobservations, Horvath and Davies compared direct retrievalsof cloud optical depth τ based on 1D RT [82] calculationsfor each camera. Their test used a passing rate based on 5%uncertainty as defined by the spread of the MISR pixel-scaleretrievals across the nine cameras. Figure 22 shows the resultsof the comparison for clouds with τ > 3. We see the passingrate increases with pixel size, i.e. clouds behave increasinglylike plane-parallel slabs in direction space as the resolution isdegraded. For a resolution of ≈1 km, only 20% of water cloudspass the test while at ≈10 km resolution this number increasesto 35%. This does not prove that the retrieved τ is accurate(substantial effects are expected from unresolved variability atsuch large scales), but at least there is directional consistencywith the 1D RT model.
For the above-mentioned MODIS instrument, which isonboard both Terra and Aqua platforms, Varnai and Marshak
39
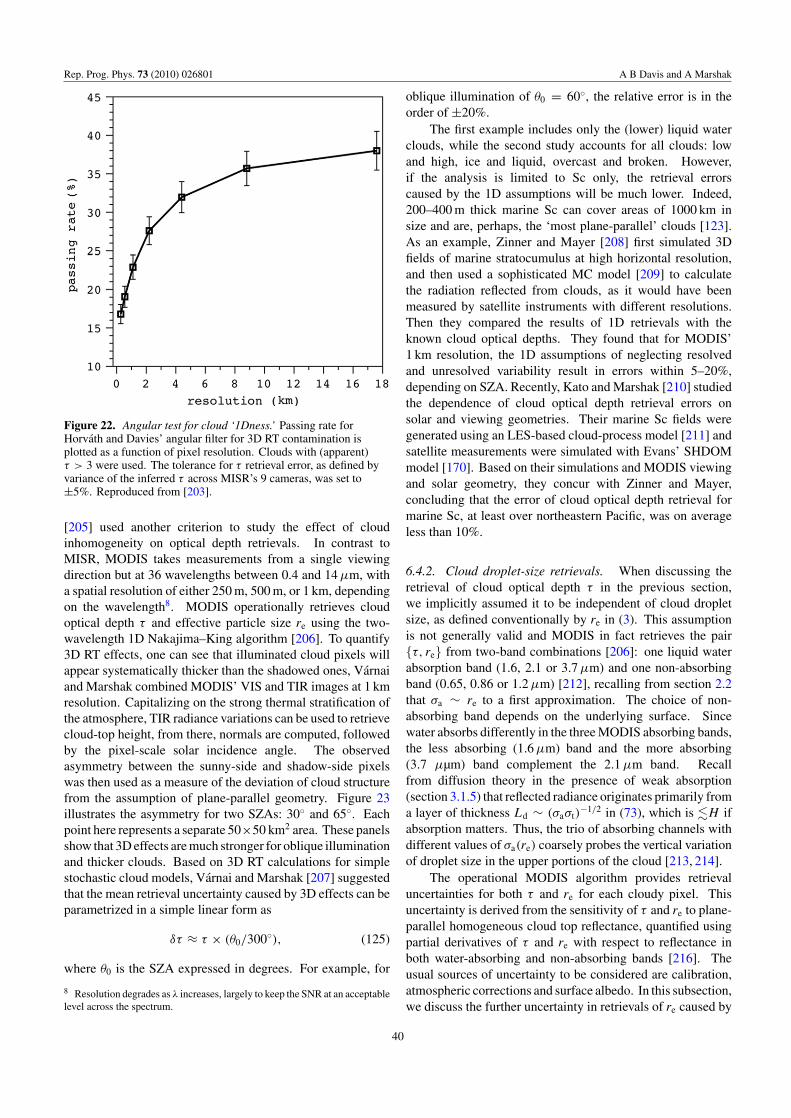
Rep. Prog. Phys. 73 (2010) 026801 A B Davis and A Marshak
Figure 22. Angular test for cloud ‘1Dness.’ Passing rate forHorvath and Davies’ angular filter for 3D RT contamination isplotted as a function of pixel resolution. Clouds with (apparent)τ > 3 were used. The tolerance for τ retrieval error, as defined byvariance of the inferred τ across MISR’s 9 cameras, was set to±5%. Reproduced from [203].
[205] used another criterion to study the effect of cloudinhomogeneity on optical depth retrievals. In contrast toMISR, MODIS takes measurements from a single viewingdirection but at 36 wavelengths between 0.4 and 14 µm, witha spatial resolution of either 250 m, 500 m, or 1 km, dependingon the wavelength8. MODIS operationally retrieves cloudoptical depth τ and effective particle size re using the two-wavelength 1D Nakajima–King algorithm [206]. To quantify3D RT effects, one can see that illuminated cloud pixels willappear systematically thicker than the shadowed ones, Varnaiand Marshak combined MODIS’ VIS and TIR images at 1 kmresolution. Capitalizing on the strong thermal stratification ofthe atmosphere, TIR radiance variations can be used to retrievecloud-top height, from there, normals are computed, followedby the pixel-scale solar incidence angle. The observedasymmetry between the sunny-side and shadow-side pixelswas then used as a measure of the deviation of cloud structurefrom the assumption of plane-parallel geometry. Figure 23illustrates the asymmetry for two SZAs: 30 and 65. Eachpoint here represents a separate 50×50 km2 area. These panelsshow that 3D effects are much stronger for oblique illuminationand thicker clouds. Based on 3D RT calculations for simplestochastic cloud models, Varnai and Marshak [207] suggestedthat the mean retrieval uncertainty caused by 3D effects can beparametrized in a simple linear form as
δτ ≈ τ × (θ0/300), (125)
where θ0 is the SZA expressed in degrees. For example, for
8 Resolution degrades as λ increases, largely to keep the SNR at an acceptablelevel across the spectrum.
oblique illumination of θ0 = 60, the relative error is in theorder of ±20%.
The first example includes only the (lower) liquid waterclouds, while the second study accounts for all clouds: lowand high, ice and liquid, overcast and broken. However,if the analysis is limited to Sc only, the retrieval errorscaused by the 1D assumptions will be much lower. Indeed,200–400 m thick marine Sc can cover areas of 1000 km insize and are, perhaps, the ‘most plane-parallel’ clouds [123].As an example, Zinner and Mayer [208] first simulated 3Dfields of marine stratocumulus at high horizontal resolution,and then used a sophisticated MC model [209] to calculatethe radiation reflected from clouds, as it would have beenmeasured by satellite instruments with different resolutions.Then they compared the results of 1D retrievals with theknown cloud optical depths. They found that for MODIS’1 km resolution, the 1D assumptions of neglecting resolvedand unresolved variability result in errors within 5–20%,depending on SZA. Recently, Kato and Marshak [210] studiedthe dependence of cloud optical depth retrieval errors onsolar and viewing geometries. Their marine Sc fields weregenerated using an LES-based cloud-process model [211] andsatellite measurements were simulated with Evans’ SHDOMmodel [170]. Based on their simulations and MODIS viewingand solar geometry, they concur with Zinner and Mayer,concluding that the error of cloud optical depth retrieval formarine Sc, at least over northeastern Pacific, was on averageless than 10%.
6.4.2. Cloud droplet-size retrievals. When discussing theretrieval of cloud optical depth τ in the previous section,we implicitly assumed it to be independent of cloud dropletsize, as defined conventionally by re in (3). This assumptionis not generally valid and MODIS in fact retrieves the pairτ, re from two-band combinations [206]: one liquid waterabsorption band (1.6, 2.1 or 3.7 µm) and one non-absorbingband (0.65, 0.86 or 1.2 µm) [212], recalling from section 2.2that σa ∼ re to a first approximation. The choice of non-absorbing band depends on the underlying surface. Sincewater absorbs differently in the three MODIS absorbing bands,the less absorbing (1.6 µm) band and the more absorbing(3.7 µµm) band complement the 2.1 µm band. Recallfrom diffusion theory in the presence of weak absorption(section 3.1.5) that reflected radiance originates primarily froma layer of thickness Ld ∼ (σaσt)
−1/2 in (73), which is H ifabsorption matters. Thus, the trio of absorbing channels withdifferent values of σa(re) coarsely probes the vertical variationof droplet size in the upper portions of the cloud [213, 214].
The operational MODIS algorithm provides retrievaluncertainties for both τ and re for each cloudy pixel. Thisuncertainty is derived from the sensitivity of τ and re to plane-parallel homogeneous cloud top reflectance, quantified usingpartial derivatives of τ and re with respect to reflectance inboth water-absorbing and non-absorbing bands [216]. Theusual sources of uncertainty to be considered are calibration,atmospheric corrections and surface albedo. In this subsection,we discuss the further uncertainty in retrievals of re caused by
40

Rep. Prog. Phys. 73 (2010) 026801 A B Davis and A Marshak
Figure 23. Asymmetry of cloud optical depth retrievals between sunny-side pixels (vertical axis) and shadow-side pixels (horizontal axis).Each point represents average optical depth in a 50 × 50 km2 area. Only areas with cloud fractions larger than 10% were examined. Left:θ0 = 30. Right: θ0 = 65. Reproduced from Horvath A and Davies R 2004 Simultaneous retrieval of cloud motion and height frompolar-orbiter multiangle measurements Geophys. Res. Lett. 31 L01102. Copyright [2004] American Geophysical Union. Reproduced bypermission of American Geophysical Union.
unaccounted 3D cloud structure, both resolved (at scales largerthan a pixel) and unresolved (at a sub-pixel scaled).
The effect of unresolved variability follows directly fromthe highly nonlinear relationship between reflectance andeffective radius re, through the single-scattering co-albedo,1 − 0 = σa/σ . That relationship is monotonic (a good thingfor remote sensing); specifically, it is a decreasing and convexfunction; to see this, we can think of R(∞) = 1 − A(∞)
in (75) as a rough approximation of how reflectivity dependson 1 − 0 ∝ re at large but finite τ . Because of the strongconvexity of R(∞) (in −√
re), the ICA-type average of sub-pixel reflectances will be smaller than the pixel average ofthe effective radii [215]. In other words, ignoring sub-pixelvariability of re always results in a retrieval that underestimatesthe true pixel-averaged value. The stronger the nonlinearity inthe relationship, the larger the underestimation.
As compared with the effect of unresolved variability onthe retrieval of re, the radiative effect of resolved pixel-to-pixel variability is not so straightforward. However, undersome general assumptions (reasonable for large enough τ
and re, say, τ > 10 and re > 5 µm), Marshak et al [215]found that pixel adjacency effects will always increase thedomain-averaged retrieved re with respect to the value thatwould be retrieved in a uniform plane-parallel surrounding.In other words, ignoring the resolved variability leads to anoverestimation of the domain-average droplet size. Note thatthis is opposite to the negative bias from sub-pixel variability.
We illustrate here the retrieval of re using a cumulus cloudfield generated with an LES model [211]. The cloud fieldconsists of 100 × 100 × 36 cells with grid sizes 66.7 × 66.7 ×40 m3, respectively. Figure 24(a) shows optical thickness andfigure 24(b) cloud-top height. For simplicity, cloud dropletscattering has been described by a Mie phase function forconstant re = 10 µm. For SZA at 60, with illuminationfrom the north (top of images) and a surface albedo α of 0.2,nadir radiance fields at the non-absorbing (0.67 µm) and water-absorbing (2.13 µm) wavelengths calculated with a MC codeare shown in figures 24(c) and (d), respectively.
We now assume that τ and re are unknown. They are theninferred for each cloudy pixel from the pair of reflectances
R0.67, R2.13 using the Nakajima–King retrieval algorithm[206]. We will focus on the retrieval of re, comparing inferredvalues with the predetermined re = 10 µm.
We see in figure 24(e) that about 30% of all cloudy pixelshave a saturated value of re at 30 µm. This is the area whereR2.13 is low. Low reflectance at 2.13 µm can result from either(i) small optical thickness, (ii) large effective radius, (iii) darksurface, (iv) 3D radiative effects, shadowing in particularor (v) any combination of the above. The average opticalthickness, τ , of pixels with a retrieved value of re = 30 µm is24, which is quite large; the true re of those pixels is 10 µm, andthe surface is relatively bright (α = 0.2 at both wavelengths).Thus the most likely reason for small R2.13 is shadowing.
The smallest scale in figures 24(a)–(e) is 67 m. Spatialaveraging of the measurements improves somewhat theretrievals. Figure 24(f ) shows the retrieved values of re whenboth R0.67 and R2.13 are averaged over 5×5 pixels (335 m)before the retrieval is performed. Indeed, the number ofsaturated pixels with respect to re decreased from 30% to 18%,i.e. averaging dilutes the shadowing effect, and thus lowers theretrieved value of re.
It is interesting to relate the retrievals of re to the retrievalsof optical thickness τ . Following Cornet et al [217], wesubdivide all cloudy pixels into two categories based on theirretrieved values of cloud optical thickness. Pixels where thetrue optical thickness, τ3D, is larger than the retrieved opticalthickness, τ1D, will be called ‘shadowed’ while pixels withτ1D > τ3D will be called ‘illuminated;’ see figure 25. Aswas pointed out by Cornet et al , the retrieved re in theshadowed regions (τ1D < τ3D) are much larger than the onesin the illuminated ones (τ1D > τ3D), as if there was moreabsorption [118, 218, 219]. To conclude, overestimation of re
corresponds to underestimation of τ .
6.5. Aerosol optical depth retrievals, near broken clouds
Aerosols are very poorly understood agents in the climatesystem, particularly their impact on cloud optics [16] andphysics [15]. Aerosol optical thickness (AOT) is thereforea high-value retrieval from satellites because global coverage
41

Rep. Prog. Phys. 73 (2010) 026801 A B Davis and A Marshak
Figure 24. 3D RT effects in cloud droplet-size retrievals. (a) Cloud optical thickness field. (b) Cloud-top height above the surface. Thecloud is illuminated from the north with a 60 SZA. Droplet scattering is described by a Mie phase function computed with re = 10 µm. Thesurface is assumed to be Lambertian with uniform spectrally invariant surface albedo 0.2. (c) Nadir reflectance fields at 0.67 µm calculatedby MC with 5 × 10⁸ histories. The average simulation error is less than 2%. (d) Same as in panel (c) but for nadir reflectance at 2.13 µm. (e)re retrieved from reflectances on panels (c) and (d). (f ) Same as in (e) but for reflectances averaged over 25 pixels. Reproduced from [215].
is necessary to track the long-range transport and propertyevolution of the airborne particulates, starting at their sources.Some are anthropogenic, coming from industrial activity,deliberate biomass burning and all manner of land-use change.
Numerous studies based on satellite observations havereported a positive correlation between cloud amount andAOT [222–226]. This positive correlation can be explained
as a result of physical phenomena such as the humidificationof aerosols in the relatively moist cloud environment, orit can result from remote sensing artifacts such as cloudcontamination of the cloud-free fields of view used in theaerosol retrievals.
There are two ways that clouds affect the retrievals ofaerosols [137]: (i) the existence of small amounts of sub-pixel
42

Rep. Prog. Phys. 73 (2010) 026801 A B Davis and A Marshak
Figure 25. Correlation between retrieved re and τ for ‘illuminated’and ‘shadowed’ areas in the Cu cloud field in figure 24. Radiancewas averaged over 2 × 2 pixels (134 m grid). The horizontal dashedline indicates the true re = 10 µm, prescribed uniformly across thesimulated cloud scene. Note that the maximal allowable retrievalvalue was set to 150 for optical thickness τ and to 30 µm foreffective radius re. Reproduced from [215].
size clouds in pixels identified as being cloud-free and (ii) anenhancement in the illumination of the cloud-free columnthrough the reflection of sunlight by nearby clouds. Whenthe pixels are relatively large, only the first type (unresolvedvariability), cloud contamination is considered. The secondtype (resolved variability), also called the ‘cloud adjacencyeffect,’ is more pronounced when satellite pixels are relativelysmall (e.g. ∼0.5 km for MODIS and MISR). Kobayashi et al[227], Cahalan et al [228], Nikolaeva et al [174] and Wen et al[220] studied the cloud adjacency effect when cloud-free pixelsare brightened by reflected light from surrounding clouds using3D RT calculations. Both cloud contamination and the cloudadjacency effect may substantially increase reflected radiationand thus lead to significant overestimates of the AOT. However,these two types of cloud effect have different impacts on theretrieved AOT:
• sub-pixel clouds increase AOT by increasing the apparentcontribution due to large particles (aerosol ‘coarse’ modecomposed of sea salt, dust, etc);
• cloud adjacency mostly increases the apparent contribu-tion due to small particles (aerosol ‘fine’ mode composedof smoke, ash, pollution, gas-to-particle conversion prod-ucts, etc).
We illustrate here the effect of cloud adjacency for brokencumulus clouds as observed by MODIS and ASTER. ASTERviews the Earth from nadir direction at high (15 m) spatialresolution [229]. Figure 26(a) shows a 68 × 68 km2 ASTERimage of a region in Brazil taken on 25 January 2003, whenbiomass burning occurred. The 15 × 15 km2 box in the leftlower corner is also zoomed in figure 26(b). The original 15 mresolution imagery was aggregated to the 90 m resolution andcloud optical depth τ was retrieved. Wen et al [220] then used
3D and 1D RT calculations to determine the cloud-induced‘enhancement’ as the average difference between the 3D and1D reflectances for all cloud-free pixels
δR = R3D(x, y) − R1D. (126)
Figure 26(c) shows the cloud-induced enhancement fieldR3D(x, y)−R1D in clear-sky regions at 0.47 µm, assuming thesame amount of aerosols (AOT = 0.1) for the whole scene.We see that clouds enhance the reflectance almost everywhere;the average enhancement δR is 0.019, which corresponds toroughly 0.1–0.2 increase in AOT. From the climate modelingperspective, this enhancement is much too large to be ignored[230]. As shown by Wen et al [231], 80% of this enhancementis due to cloud-to-molecule scattering interaction even thoughthe Rayleigh optical thickness at 0.47 µm, 0.186, is not muchlarger than the AOT. However, aerosols are forward-peakedscatters, although less than cloud droplets (with g ≈ 0.7, downfrom 0.85). So the broader vertical distribution of moleculesand the lateral illumination geometry from clouds to intra-cloud regions with substantial fractions of their local directionspace covered by bright illuminated cloud boundaries favorthe near-isotropic scattering of molecules toward space. Inmore quantitative terms, scattering angles encountered in theretrievals of aerosol properties are typically between 90 and130 and, in this range, phase functions for aerosols are muchsmaller than the Rayleigh phase function; see figure 3 where theH–G model, as a representative of typical aerosol scattering,is about an order of magnitude lower than Rayleigh.
Figure 27 demonstrates a striking example of a goodcorrelation between clear-sky reflectances observed byMODIS (on the same Terra satellite as ASTER) and simulatedreflectances for the same pixels that were generated assumingconstant aerosol optical thickness throughout the whole sceneplotted in figure 26(a). The simulated clear-sky reflectancevalues were obtained through 3D RT calculations that accountfor the distribution of cloud optical properties retrieved fromMODIS and ASTER radiances. The correlation betweenobserved and simulated values indicates that, in reality, higherclear-sky reflectance is not necessarily caused by larger AOT.It could rather be a 3D RT effect of Cu clouds in neighboringareas. How to unravel real and apparent variations of aerosolquantity and quality in the vicinity of clouds remains an openresearch question in remote sensing science.
7. Mitigation of 3D damage to 1D RT modeling
For the past couple of decades, we have seen increasing effortby atmospheric 3D RT specialists to bring to the broadercommunity of RT end-users practical ways of making theirmodeling more realistic than with the familiar 1D RT they use,often without questioning its applicability. This is true forapplications to radiation energy budget estimation as well asto cloud, aerosol and surface remote sensing.
7.1. Large-scale fluxes for GCMs, small-scale fluxes forLES/CRMs
At first glance, the problem of 3D RT through an atmosphericcolumn populated with broken and/or multiple cloud layers
43

Rep. Prog. Phys. 73 (2010) 026801 A B Davis and A Marshak
Figure 26. Impact of cloud-induced 3D RT on clear-sky nadir radiances and associated aerosol retrievals. (a) ASTER image centered at(0N, 53.78W) acquired on 25 January 2003. Panels (b)–(c) are zoomed into the lower left-hand corner. (b) Cloud optical depth retrievedfrom ASTER at 90 m resolution. The cloud cover is 59%; average cloud optical depth is 14. (c) Enhancement of reflected radiation due to3D RT effects for clear regions at 0.47 µm. Cloudy pixels are masked as white. The mean enhancement δR in (126) is 0.019. Reproducedfrom [220].
seems intractable, except maybe with heavy-duty numericalmethods. Depending on what radiative properties are targeted,that first impression may be quite inaccurate.
7.1.1. The GCM solar RT problem. Consider the problemdescribed in section 6.2 on computing solar heating rates (i.e.broadband radiative flux divergence) in large domains suchas GCM grid-cells, ∼100 km on a side. Surely we can startby neglecting radiative interactions with neighboring regionssince the vertical extent of the cloudy layer (10–15 km) issmall by comparison with the horizontal size. Moreover,
in mainstream GCMs only a few pieces of information areprovided about the clouds, layer-by-layer: cloud fraction,mean cloud optical depth (and maybe its variance), aswell as cloud optical properties resulting from microphysics(especially 0 and g for the 2-stream computation) asfunctions of wavelength.
This is clearly fertile ground for all three classes of 3D RTtechniques overviewed in section 5.1 that address unresolvedvariability: homogenization/effective medium, ICA and mean-field approaches. They have all been used with varieddegrees of success. However, we must note that, until quite
44

Rep. Prog. Phys. 73 (2010) 026801 A B Davis and A Marshak
Modeled vs Observed Reflectance (0.47µm)
9.5 10.0 10.5
Modeled Reflectance (%)
8.5
9.0
9.5
Obs
erve
d R
efle
ctan
ce (
%)
82 Samples
Figure 27. Reflectance measured by MODIS versus 3D RTsimulations assuming constant AOT. The plot includes those 0.5 kmpixels that were used in calculating operational MODIS aerosolproduct at 10 km resolution [221]. This figure was graciouslycontributed by Dr Guoyong Wen (NASA-GSFC/UMBC-GEST).
recently, it was not clear what ‘success’ means. This isindeed a situation where we know that doing nothing leads tosystematic bias, by Jensen’s inequality. But the extra burdenin CPU cycles is a serious concern, any improvement mustbe computationally cost-effective. So this led to a burst ofcreativity in the 3D RT community during the 1990s describedbriefly in section 5.1 and in more depth by Barker and Davis[114] in a relatively recent survey. In the mid-2000s, thesteady progress in computer hardware performance enabledthe emergence of CRMs, leading to MMFs. At the sametime, it made MC the standard approach in 3D RT. So, eventhough the RT embedded in CRMs is still 1D (cf section 7.1.2),they deliver 3D cloud structures of immediate relevance toGCMs. CRMs were developed largely for that purpose.Computing vertical profiles of the domain-average radiativeheating rate with MC is now very feasible, and approximatingthat outcome is the goal of any new parametrization of RTin GCMs.
There has not been a systematic comparison of thenumerous candidate 3D RT models for unresolved cloudvariability based on the above-mentioned testbed provided byCRMs and MC, not even of one representative from each ofthe three categories. However, a major comparison study ofall existing 1D RT models has been performed [12]. A keyplayer was the gamma-weighted two-stream approximation(GWTSA) of Barker co-authors [127–129] described insection 5.1.2 and used to illustrate the statistical version ofthe ICA. A clear winner emerged from the comparison studythat generalized the GWTSA: the MC independent columnapproximation (McICA) model developed, specifically withGCMs in mind [232]. McICA is an efficient numerical methodof estimating large-scale broadband boundary fluxes and flux-divergence profiles, hence radiative heating/cooling rates, thatis unbiased with respect to the local ICA standard used in
CRMs. It creatively merges the concepts
• of MC, viewed simply as a robust random quadraturemethod (rather than a numerical solution of the 3DRTE) and
• of IPA, appropriately renamed ICA (for independentcolumn approximation) in this context of radiation energybudget computation, where there are no pixels per se.
Recall that we target here the domain-average broadbandfluxes, hence spatial–spectral-angular integrals of the radiancefield that matter for the energy budget in a single grid-cellof a GCM. Since such domains extend for 50–200 km inboth horizontal directions, one can capitalize on the quasi-cancellation of all localized 3D RT features affecting bothreflection and transmission. Ideally, we would like to bringthe residual 3D–1D (spatial domain) RT modeling error downto the level already accepted by the GCM community for thespectral-domain computations. McICA basically pools theseinevitable modeling errors and uses a random quadrature rulefor the combined spatial and spectral integrations. This has thecurious effect that, for one sample in a McICA sub-gridscalecomputation, a cloudy sub-column is randomly generated(with specified rules) and assigned a random wavelength.
In spite of the MC part of the acronym, there is actuallyno 3D RT going on here beyond the above-mentioned testcases for model performance assessment/comparison. Thestatistical version of the ICA is accepted as good enough for theclimate modeling application at hand. However, current GCMspredict at best a fractional cloud coverage of the horizontaldomain for each of many atmospheric layers: Ac(n) for thenth layer. The most basic optical properties for the cloudyand clear portions are also predicted, only those required bythe two-stream/diffusion 1D RT model: optical depth τ , single-scattering albedo 0 and asymmetry factor g. See section 3.1.3(0 = 1) and section 3.1.5 (0 < 1) and also refinements inthe literature accounting for the collimated solar beam directlytransmitted to layer n [70]. Since, by definition, the ICA makesno attempt at the RT impact of spatial correlations of cloudstructure in the horizontal plane, the only remaining issue ishow to distribute the cloudy portions of the GCM grid-cellvertically. How to place it in layer n, in view of clouds inneighboring layers n ± 1?
The generally accepted rule is known as the ‘maxi-mum/random overlap’ rule: if two adjacent layers have non-vanishing Ac(n), then the cloudy portions are required to over-lap as much as possible; if there is a cloud-free layer betweentwo cloudy ones, overlap is random. It is not easy to workout the combinatorics underlying this rule explicitly [12]. So,at the spatial core of the McICA model is a stochastic sub-column cloud generator that circumvents this awkward maxi-mum/random overlap rule and uses instead a simple exponen-tial decorrelation law [233]. The price to pay for the elim-ination of any intra-ICA modeling bias by adopting McICAsampling is of course the numerical noise inherent to the MCquadrature method. So we have to ask, in the context of GCMs:is accuracy more important than precision? In an applicationwhere the proper partition of the energy budget matters a lot,
45

Rep. Prog. Phys. 73 (2010) 026801 A B Davis and A Marshak
we of course require an accurate (unbiased) answer and, more-over, experimentation has shown that GCM models can assim-ilate dynamically a considerable amount of MC integrationnoise [234].
In summary, McICA has proven to be a very good stop-gapsolution in GCM-driven RT modeling that balances adaptivelythe error in spectral and spatial integrations. Over the pastfew years, the McICA has been adopted by most GCMs [235],including the majority of those mature enough to be used in thecomprehensive assessments and forecasts of the anthropogeniceffects on the climate system published on a regular basis by theIntergovernmental Panel on Climate Change (IPCC) [11, forthe most recent release].
7.1.2. The LES/CRM solar RT problem. What about LES-based cloud-process models and CRMs? And, by extension,what about those ‘research’ GCMs that incorporate CRMs ineach ∼100 km cell? Based on our discussion in section 6.2, theassociated ranges of scales (tens of meters to a few kilometersfor LES, and 1 km to 100 km in CRMs) are highly vulnerableto inherently 3D effects, especially in the LES range. If thedynamical cloud model is used in lieu of the stochastic sub-column cloud generator in the McICA, little difference is notedin the domain-average fluxes [236]. That is to say that, asfar as the radiative part of the large-scale energy budget isconcerned, added realism in cloud representation has a smallimpact within the framework of 1D RT. The remaining questionis the quantitative impact of 3D RT effects not captured by theICA on the detailed cloud dynamics, as captured by CRMs. Ifit has little impact, then why? The issue cannot be put to restconfidently unless there is sufficient understanding. If it does,then what can be done about it in a practical way? How doesone design representative case-studies and, since 3D MC willbe the almost unavoidable benchmark, how can we guaranteeuniformly accurate heating rates across a large CRM grid?
At the time of writing, these remain open questions. Fora survey of the highly desirable class of 3D RT approximation(efficient-yet-accurate-enough) models that target the detailedspatial distribution of solar heating rates, we refer the interestedreader to Davis and Polonsky’s relatively recent review[145, and citations therein].
7.2. Cloud remote sensing, corrected for 3D RT effects
In the previous subsection, we have gone from the GCM issueof unresolved cloud variability, and its state-of-the-art McICAsolution, to the current challenge of 3D ‘adjacency’ effectsof individual cloudy cells in LES models or CRMs. Movingon to radiances instead of fluxes, and narrow-band spectralsampling rather than broadband integration, we now addressremote sensing concerns.
Here, the pixel scale can be too small for 1D RT tobe anywhere near realistic, even if the clouds are stratiform(near-plane-parallel outer geometry). More precisely, thepixel footprint is so small that, even if it were internallyhomogeneous, net horizontal fluxes coming from denser ormore tenuous neighboring pixels will affect observed radiancesat cloud top or cloud base. Can we mitigate local biases caused
by radiative interactions between adjacent small-scale pixels,and thus estimate what a 1D RT treatment of a real 3D cloudwould yield?
Alternatively, can’t we just retroactively make the pixelbig enough that we can ignore these net horizontal fluxes andfocus only on the pixel-average vertical transport? Maybe, butthis tactic of avoidance (as opposed to mitigation) leads rightback to the issue of unresolved variability that will then haveto be accounted for.
7.2.1. Nonlocal independent pixel approximation (NIPA).We describe here a specific method proposed as a step towardimproved accuracy of cloud property retrievals based on thebusiness-as-usual procedure involving 1D RT models. We firstconsider satellite imagery, and then ground-based time seriesmeasurements of zenith radiance where the notion of a pixelis replaced by a short radiometric exposure to down-wellingdiffuse radiation within a narrow FOV instrument.
With their ∼30 m pixels, NASA’s series of Landsatmissions, carrying Thematic Mapper instruments, are by far themost popular assets delivering high-resolution cloud imagery,high enough that it is affected significantly by adjacencyeffects, cf section 6.3.1. To the best of our knowledge, thefirst deliberate attempt to go beyond quantification and attemptto mitigate this inescapable 3D RT effect in clouds was byMarshak et al [237] who proposed the ‘nonlocal IPA’ (NIPA).
NIPA is based on the intuitive idea that multiple-scattering processes cause an apparent smoothing of the cloudstructure, as observed in the remotely sensed radiance field[142, 196, 178]. Rather than run a full 3D RT simulationwith an expensive MC code, or even a more efficient grid-based solver such as SHDOM [170], one can simply apply alow-pass filter (smoothing kernel) to the IPA prediction, thecomputational cost of which has already been accepted. Thisapproximate 3D RT method works well, at least for stratiformclouds under near-normal illumination.
We note that what is required here is the Fourier transformP (k) of the smoothing kernel P( ρ) since we wish to performthe convolution product of P and the IPA-derived radiancefield IIPA( ρ) in the horizontal plane:
INIPA( ρ) =∫∫
P( ρ ′)IIPA( ρ − ρ ′) d ρ ′, (127)
which becomes a simple product in Fourier space, INIPA(k) =P (k)IIPA(k). The Fourier-space reflected Green functions forpoint-wise illumination can be put to use here. They willdepend parametrically on H , τ , g and 0. Depending onwhether local albedo or nadir radiance is targeted, we couldchoose a spatial Green function for isotropic (section 4.1) ornormal [108] illumination.
Marshak et al [237] had an even more pragmatic approach.Eschewing normalized solutions in Fourier space of boundary-value PDE problems, they used a convenient two-parameterexpression like (110) but for ρ instead of τ and averagesbased on cloud radiative Green functions. The authors didtheir proof-of-concept computations with cloud models havingoptical depth variability in a single horizontal direction, say, x.
46

Rep. Prog. Phys. 73 (2010) 026801 A B Davis and A Marshak
The required 1D Fourier transform of (110), with τ → |x| anddivision by 2 (to cover the support extended to all of R), yields
P (k) =cos
[a tan−1
( 〈|x|〉ka
)][
1 +
( 〈|x|〉ka
)2]a/2 . (128)
This smoothing kernel acts in Fourier space as a particular kindof low-pass filter; features rather gentle power-law cut-offs ink−a at wavenumber k ≈ 1/〈|x|〉R . z
Power-law tails in P (k) are a natural choice to reconcilethe spatial correlations observed in satellite images of extensivestratocumulus [178] with those observed with airborne in situprobes [148] for the same type of cloud system. The latterhave scale-invariant (power-law) internal structure, obviouslydriven by turbulence; specifically, one finds extinction(actually, LWC) fluctuations in k−5/3, typically over scalesfrom approximately tens of kilometers down to tens of meters.Satellite (nadir-looking) radiances also have this trend, whichfollows from the IPA (a nonlinear but monotonic mapping oflocal τ to local radiance), but only down to a scale foundby numerical simulation to be ≈
√〈ρ2〉R [196, 178]. Above
the associated cut-off wavenumber, a trend approaching k−3
is found.Figure 28 illustrates the NIPA procedure for the fractal
model for variable stratiform clouds described in figure 14.The differences between MC, IPA and NIPA are easy to see.The upper panel shows, on the one hand, τ(x) for a 2 kmportion of the synthetic fractal cloud that extends to 12.8 km(and is periodically replicated beyond that). On the otherhand, both MC and IPA predictions are plotted for the localalbedo: we see how the IPA responds immediately to the fractalvariability while the MC results are much like a running meanover several pixels. The lower panel shows MC, IPA andNIPA predictions for the local value of nadir radiance overthe same portion of cloud. By comparing the two registeredpanels, we see that the MC radiance field is not as smooth asits counterpart for albedo, patently because there is no angularintegration. The NIPA computation used the smoothing kernelin (128) with 〈|x|〉 = 0.1 km (8 pixels) and a = 0.5. Finally,the bottom curve shows how much the prediction error withrespect to MC ‘truth’ is reduced by going from the IPA tothe NIPA.
That completes the description of NIPA as a means toimprove the realism of the forward IPA model by introducingscale-specific smoothness. The inverse NIPA consists intaking actual or synthetic cloud radiances and applying thecorresponding roughening filter to restore the IPA and, fromthere, perform straightforward retrievals of (say) the cloudoptical depth field. Formally, that amounts to solving (127),viewed as an integral equation, for IIPA( ρ) knowing INIPA( ρ)
from 3D RT computations, as in the present demonstration orfrom observations [238].
In an ideal (infinite-accuracy, noisless) world, one onlyneeds to perform the inverse FFT of IIPA(k) = INIPA(k)/P (k).However, 1/P (k) is a high-pass filter that will amplify any
Figure 28. Comparison of simulated reflectivity fields for a portionof a fractal stratocumulus cloud. Top: on the left-hand axis, we readthe 1D horizontal variation in x of local optical depth τ(x) (lowercurve); the vertically uniform cloud is generated with a 10-stepbounded cascade process described in figure 14 with τ = 13 andH = 0.3 km (pixel/grid-scale = 12.5 m). The upper curves(right-hand axis) in the same panel show the associated fluctuationsof albedo R(x), the normalized up-welling flux in (49) for steadyand uniform illumination, using both IPA and MC schemes; SZA is22.5 and scattering is according to a Deirmendjian C1 phasefunction at a red wavelength for simplicity (both water- andland-surface albedoes are negligibly small). Bottom: the right-handaxis is the same as in the top panel but for normalized nadir radiancein (41) rather than hemispherical flux, under the same conditions ofspatially uniform and steady illumination, and the computationalNIPA scheme is added. The lower curves (left-hand axis) highlightthe reduced error with respect to MC when NIPA is used instead ofIPA. Reproduced from [150].
noise or small-scale numerical error. This is a classic ill-posed (i.e. numerically unstable) inverse problem. Marshaket al [237] demonstrate on ‘observations’ obtained with a MCcode (where the ‘truth’ is known) that careful Tikhonov-typeregularization [239] can be used to estimate IIPA( ρ) even inthe presence of considerable noise from the MC scheme itselfand, from there, obtain reasonable estimates of the local valueof τ from a pre-computed inverse map of τ to nadir radiancebased on 1D RT.
7.2.2. Other 3D–1D RT compensation methodologies.NIPA’s use of spatial Green functions is not unique in the fieldof efficient 3D–1D RT compensation techniques. A notableeffort involves an adjoint perturbation formalism for forward3D effects as defined by δE = E3D−E1D = (f, I3D−I1D) from(122), where f is used to define a specific feature of interest,such as an instrument response. The perturbation I3D − I1D
is evaluated from spatial Green functions operating on theperturbed transport and scattering operators in (116). Formal
47

Rep. Prog. Phys. 73 (2010) 026801 A B Davis and A Marshak
expansions were derived to arbitrary order [240] and the first-order theory was worked out on specific examples [241].
Neural networks were also brought to bear by Cornet andco-authors on the problem of forward 3D RT [242, 243] andinverse 3D RT based on simulated observations [244–246].Another statistical approach based on multivariate regressionhas been explored [247]. All these algorithms show asubstantial improvement in retrieval accuracy. However, allof them are still in ‘research’ mode and much work wouldhave to be done to implement them in an operational pipelinefor retrieving cloud optical depth from satellite measurementson the fly.
It is commonly believed that the more observations ofsolar radiation reflected from clouds into different directionsare used, the more accurate the retrieved cloud properties willbe. Evans et al [248] recently asked themselves if we cando better with multiple viewing angles, as compared withnadir-only reflectance. They simulated MISR multi-angularmeasurements with SHDOM for a large number of cloud fieldsgenerated with an LES model. They then retrieved the meanand standard deviation of τ(x, y) using a neutral networkalgorithm trained on some of the LES + SHDOM fields andevaluated on the others. They found that for large Sc clouds,multi-angular measurements decrease the mean optical depthretrieval error by 20–40% (respectively, for 45 and 25 SZA)while for small Cu clouds the retrieval error decreases only by13%. These small improvements for Cu clouds suggest thatmultiple directions do not necessarily contribute substantiallyto more accurate retrievals. However, the statistical retrievalsbased on 3D RT, even with only one direction, were shown to bemuch more accurate than standard retrievals based on 1D RT.
7.3. Broken cloud impacts on aerosol property retrievals
As previously mentioned in (section 6.5), cloud–molecularinteraction is the dominant mechanism for cloud-inducedenhancement of the reflectance in the cloud-free column, atleast for shorter wavelengths and boundary-layer cumulus overdark surfaces [231]. Here we assume that the enhancement isentirely due to Rayleigh scattering, i.e. the enhancement comesfrom the re-illumination of the molecular layer through thereflection of sunlight by the surrounding clouds. Considera simple two-layer model with broken clouds below and auniform molecular layer above (figure 29, top panel). Marshaket al [137] recently suggested that the cloud enhancement ofreflected radiation, δR, be defined as the difference betweenthe following two radiances: R1 reflected from a broken cloudfield with a scattering Rayleigh layer above it and R2 reflectedfrom the same broken cloud field but with the molecules inthe upper layer causing extinction, but no scattering. In otherwords,
δR = R1 − R2, (129)
where, as in (55),
R1(θ0, θ) = Rm(θ0, θ) + Tm(θ0)αc(τ, θ0)
1 − αc(τ, θ0)R(dif)m
T (dif)m (θ),
(130)
R2(θ0, θ) = Rm(θ0, θ) + Tm(θ0)αc(τ, θ0)T(dif)
m (θ), (131)
Figure 29. Schematic of the two-layer 3D stochastic model forcloud enhancement estimation. Top: optically thick but brokenclouds are below, with an optically thin Rayleigh scattering layerabove. Bottom: two examples of the Poisson distribution of brokenclouds. These fields both have cloud fraction Ac = 0.30 in a10 × 10 km2 area. For a cloud vertical thickness of 1 km, the leftpanel has cloud aspect ratio γ = 2 and the right panel has γ = 1.The uniform plane-parallel limit of the model corresponds to Ac = 1for any γ . The two-state (cloudy/clear) ICA limit is obtained for any0 < Ac < 1 and γ → ∞, meaning a single very flat (i.e.plane-parallel) cloud radiance with weight Ac in the domain-averageand clear-sky radiance with weight 1 − Ac.
sub-index ‘m’ standing for molecular and ‘c’ for cloud.Rm(θ0, θ) is the reflectance for the molecular layer with noclouds below (known technically as ‘planar albedo’). Cloud-layer reflectance, viewed here as a lower surface, is denotedaccordingly αc(τ, θ0); it is the critical parameter in this simplemodel because, in addition to cloud optical depth τ and SZA θ0,it depends on the broken cloud layer’s geometry. Tm(θ0) is thetransmittance through the molecular layer with direct sunlightincident from above while T
(dif)m (θ) is the transmission through
the molecular layer for diffuse illumination from below, intodirection θ . Finally, R
(dif)m is the reflectance of the molecular
layer illuminated by diffuse radiation from below (knowntechnically as ‘spherical albedo’). With the sole exception ofαc, all the quantities in (129)–(131) are 1D and are calculatedusing a standard plane-parallel RT code.
To calculate the cloud reflectance for broken cloudyregions, αc, we can use a one-layer Poissonian model forbroken clouds originally proposed by Titov in 1990 [131].The main parameters in the model are (i) cloud fraction Ac;(ii) average cloud optical depth τ , which is normally quitelarge and (iii) cloud aspect ratio, γ , defined as the ratio ofthe cloud’s horizontal to vertical dimensions. One can alsothink of aerosols filling the space between the clouds withAOT τa(λ), which is normally quite small. The lower panelof figure 29 shows examples of two broken cloud fields withthe same value of Ac = 30% and γ = 2 and 1. Outputof the stochastic RT model is the azimuthally and domain-averaged upward and downward fluxes, with downward fluxessubdivided into diffuse and direct components.
48

Rep. Prog. Phys. 73 (2010) 026801 A B Davis and A Marshak
Note that, out of the three principal input parameters, two(averaged cloud optical depth, τ , and cloud fraction, Ac) canbe determined from the MODIS Cloud Product suite. Thethird parameter (cloud aspect ratio γ ) is not readily available.Fortunately, the cloud enhancement is not very sensitive to theaspect ratio, at least for small SZA. The results of detailednumerical simulations of the enhancement by Wen et al [220]were shown to be in relatively good agreement with this simplemodeling exercise by Marshak et al [137].
It is also interesting to note that the ratio of cloud-inducedenhancements at two wavelengths λ1 and λ2 in (129)–(131)is only weakly sensitive to cloud properties (τ is almostindependent of λ), and is therefore determined by the Rayleighscattering molecular layer. Indeed,
(λ1, λ2) = δR(λ1)
δR(λ2)= C(λ1, λ2; θ, θ0)
1 − αc(τ, θ0)R(dif)mλ2
1 − αc(τ, θ0)R(dif)mλ1
,
(132)
where the R(dif)mλ terms are relatively small, and we have defined
C(λ1, λ2; θ, θ0) = Tmλ1(θ0)T(dif)
mλ1(θ)R
(dif)mλ1
Tmλ2(θ0)T(dif)
mλ2(θ)R
(dif)mλ2
. (133)
This means that the ratio of cloud-induced enhancements attwo different wavelengths is essentially independent of cloudproperties, and depends only on θ0 and θ ; hence can bepre-calculated.
To mitigate the retrieval errors from the cloud-inducedenhancement, Kassianov and Ovtchinnikov [249] recentlyproposed to use reflectance ratios to retrieve aerosol opticaldepth. Based on (132)–(133), the underlying idea of theirmethod is that ratios are less sensitive to 3D cloud effects thanreflectances themselves. In other words, they assumed that
3D(λ1, λ2) = R3D(λ1)
R3D(λ2)= R1D(λ1) + δR(λ1)
R1D(λ2) + δR(λ2)
≈ R1D(λ1)
R1D(λ2)= 1D(λ1, λ2), (134)
thus
3D(λ1, λ2) ≈ 1D(λ1, λ2) ≡ (λ1, λ2). (135)
Their method was tested in a simulated case using two ratiosat three wavelengths λ1, λ2 and λ3. At given solar andviewing angles, this approximately constant ratio is a functionof AOT, aerosol model and the underlying surface albedo.AOT, as a function of wavelength λ, is then described by apower law, τa(λ) = βλ−α , as in (4); this closes the retrievalproblem with two unknowns (α and β) and two observations,namely, 3D(λ1, λ2) and 3D(λ1, λ3). The sensitivity of theproposed retrieval method to errors from measurements andRT modeling was recently evaluated [250].
8. Exploitation of 3D RT phenomenology in remotesensing
To summarize the two previous sections, the ‘3D RT is toocomplicated and expensive’ argument for keeping operational
cloud remote sensing grounded in 1D RT is getting old,and hopefully will soon be obsolete, as the communitygains research-based experience and institutional computingfacilities harness more power. Earth, Clouds, Aerosols andRadiation Experiment (EarthCARE) is a future joint EU-Japan mission focused on clouds and aerosols, the nextmajor Earth observation satellite to be launched by theEuropean Space Agency (ESA) and instrumented jointlywith the Japan Aerospace Exploration Agency (JAXA). Witha planned launch in 2013, EarthCARE is in the planningstages for its suite of retrieval algorithms, both conventionaland experimental. The latter effort, spearheaded by Barker(Meteorological Service of Canada) and Donovan (KoninklijkNederlands Meteorologisch Instituut), will be synergisticacross multiple instruments and fully 3D as far as RT isconcerned. If successful, the 1D/plane-parallel paradigm willbe on its way out, and the new one will embrace the 3D structureof the real world. We are confident that NASA’s planning willbe as forward-looking for its future Aerosol, Clouds and oceanEcosystem (ACE) mission with, at the time of writing, launchplanned for the 2020 timeframe.
In this final technical section, we take the final stepaway from 1D RT and examine some emerging cloudobservation techniques that are inherently 3D—they are noteven conceivable in a modeling framework limited to 1D RT.Some are astonishingly simple, given the right kind of data.
8.1. Variable cloudiness observed from below, with zenithradiance
8.1.1. Spectral signatures. Figure 30 shows a 22 minutefragment of zenith radiance measured by a ground-based‘Cimel,’ a multi-channel sun-photometer pointing straight up.The Cimel has a narrow FOV of 1.2 and four filters at0.44, 0.67, 0.87 and 1.02 µm designed for retrieving aerosolproperties under clear-sky conditions. In our example, theCimel measured zenith radiance at 20 s temporal resolutionwhile in ‘cloud’ mode, i.e. constant zenith viewing (as opposedto a special sky scan optimized for aerosol property retrievals).
There are three distinct regions in figure 30, from leftto right: a single unbroken cloud, broken clouds, and clearsky. For clear-sky conditions, due to Rayleigh scatteringand optically thicker aerosol at shorter wavelengths, zenithradiance increases as wavelength decreases from 1.02 to0.44 µm. By contrast, under cloudy skies, radiances in channel0.44 and 0.67 µµm are almost indistinguishable; this is alsotrue for channels 0.87 and 1.02 µm. This is a clear indicationthat, in the presence of clouds, the spectral contrast in surfacealbedo (back-reflected from clouds) dominates over Rayleighand aerosol effects. In contrast to the small fluctuations typicalfor clear and overcast skies, broken clouds show sharp changesin radiances around cloud edges.
More formally, we can distinguish three main cases basedon cloud–vegetation radiative interactions:
(1) Atmosphere dominates. In this case,
I0.44 I0.67 > I0.87 > I1.02 (136)
and aerosol optical properties can be retrieved.
49

Rep. Prog. Phys. 73 (2010) 026801 A B Davis and A Marshak
Figure 30. Zenith radiance measured by a Cimel sun-photometerat Greenbelt, MD, on 24 May 1999. Four channels 0.44, 0.67, 0.87and 1.02 µm are used. The measured radiance has relative(channel-to-channel) calibration and is normalized by the solar fluxat the TOA in the corresponding spectral interval. The ordinate’s‘arbitrary units’ are therefore linear for T (abcissa, z) from (42).
(2) Vegetated surface and cloud dominates. In this case,
I0.44 ≈ I0.67 < I0.87 ≈ I1.02 (137)
and cloud optical properties can be retrieved, given thesurface albedo.
(3) Transition between the first two cases. This scenario ischaracterized by rapid changes between the ordering of Iλ
from cloudy to clear and back. In this case, neither aerosolnor cloud properties can be reliably retrieved using onlyone wavelength.
By analogy with the well-known Normalized DifferenceVegetation Index (NDVI) [251], Marshak et al [252] proposedthe Normalized Difference Cloud Index (NDCI) defined as theratio between the difference and sum of two normalized zenithradiances measured for two narrow spectral bands in the NIR(0.87 µm) and RED (0.67 µm) spectral regions:
NDCI = INIR − IRED
INIR + IRED. (138)
Compared with a two-valued optical depth versus zenith-radiance relationship that makes its retrieval impossiblewithout ancillary information [91], the transmitted NDCI isa monotonic function with respect to optical depth [252].Conventional methods of estimating cloud optical depthfrom surface fluxes use either broadband [253] or multi-wavelength [254] radiometry, and are expected to workwell only for overcast skies [255]. In sharp contrast, theNDCI-based retrieval technique is much less sensitive tocloud structure. The sensitivity is weak because the NDCI-based method eliminates the part of downward radiationthat did not have interactions with surface; this radiationis the most sensitive to both illumination conditions andcloud inhomogeneity [252, 256]. As follows from therelations in (136)–(137), the NDCI will be negative for aclear sky and positive for an overcast sky. In the case ofbroken clouds, NDCI can take on either positive or negative
values, depending on whether there is a cloud in the zenithdirection or not.
The first shortcoming of the NDCI-based retrievaltechnique comes from the underestimation in 1D RT ofzenith radiance for large optical depth in NIR. Indeed, inthe NIR, the 1D RT prediction for radiance systematicallyunderestimates the actual 3D radiances for large opticaldepths. This has a simple explanation: for 3D clouds,more radiation is transmitted (by Jensen’s inequality and/orby oblique channeling); thus more surface-leaving radiationis reflected back from thick clouds to the ground-basedsensor.
Another shortcoming innate to all concepts based onspectral-indices is that the spectral information is reduced toone number by algebraic transformation; see, e.g. Tian et al[257]. In other words, instead of two spectral values of zenithradiances in RED and NIR, only one, NDCI, is used. Eachmeasurement can indeed be assigned to a specific point on the(IRED, INIR) plane, equivalently:
η =√
I 2RED + I 2
NIR, (139)
α = tan−1(IRED/INIR). (140)
Both coordinates can depend on the cloud optical depth.However, NDCI is a function of α only,
NDCI = 1 − tan α
1 + tan α, (141)
and thus cloud optical depth can vary considerably yet leaveNDCI unchanged.
Instead of using a single index such as NDCI, Marshaket al [90] directly utilized radiance observations on the REDversus NIR plane (see figure 31). Since most vegetatedsurfaces are dark at red wavelengths and bright at NIRwavelengths, points above the diagonal correspond to cloudysituations due to surface–cloud interactions, while pointsbelow the diagonal correspond to clear sky. Since the surfaceis dark in the RED region, having the same RED radiancesat points A and B indicates that they have the same values ofcloud optical depth, τ . However, they have different radiancesin the NIR region. Clearly, more surface–cloud interactionsoccur and more photons reach the ground for point B. Thisindicates that point B corresponds to a smaller cloud fractionthan point A. This can all be made more quantitative in themethod referred to hereinafter as ‘REDvsNIR,’ which retrievesboth optical depth and ‘effective’ cloud fraction from a pointin the RED versus NIR plane. Note that points A and C infigure 31 have the same NDCI but correspond to differentvalues of τ and effective cloud fraction.
Next we briefly discuss the REDvsNIR retrieval methodproposed in Marshak et al [90] and validated by Chiu et al [91].The method retrieves overhead cloud optical properties in anycloud situation using measurements of zenith radiance at 0.673and 0.870 µm wavelengths, and only requires the presence ofgreen vegetation in the surrounding area.
We first note that for plane-parallel clouds over aLambertian surface, any ground-based measurement of
50

Rep. Prog. Phys. 73 (2010) 026801 A B Davis and A Marshak
Figure 31. Schematic of the REDvsNIR algorithm. See main textfor description of the method for retrieving cloud optical depth τand cloud fraction Ac.
radiance I can be expressed as [258]
I = I0 + T0α
1 − αRIs. (142)
The first term on the right-hand side, I0, is downward radiationcalculated for a black (non-reflecting) surface, while the secondterm is radiation introduced by interactions between cloudsand the underlying surface. The cloud–surface interactions arefully determined by α, T0, R and Is, where α is the albedo of theunderlying surface; T0 is the transmittance of monochromaticflux over a black surface; R is the spherical albedo of clouds foruniform and isotropic illumination from below; and finally, Is
is the radiance generated at the upper boundary by an isotropicsource at the surface.
Consider the following approximation:
T0 ≈ (1 − Ac) × 1 + Ac × T(pp)
0 , (143)
where Ac is cloud fraction and T(pp)
0 is total transmittance overa black surface in the uniform plane-parallel assumption. Wecan then rewrite (142) as an explicit function of cloud opticaldepth τ and Ac. For the RED and NIR wavelengths, weobtain
IRED(τ, Ac) = I0,RED(τ )
+[1 − (1 − T
(pp)
0,RED)Ac]αRED
1 − αREDRRED(τ )Is,RED(τ ),
INIR(τ, Ac) = I0,NIR(τ )
+[1 − (1 − T
(pp)
0,NIR)Ac]αNIR
1 − αNIRRNIR(τ )Is,NIR(τ ), (144)
where it is assumed that the dependence on Ac comes onlyfrom (143).
Note that Ac accounts here not only for the fraction ofcloudy ‘pixels’ in the zenith-radiance time series but alsofor the horizontal photon transport [259, for instance] thatis ignored by 1D RT. Therefore, Ac is not the real cloudfraction but rather a ‘radiatively effective’ one that forces 1D
Figure 32. Illustration of the Ac, τ retrieval algorithm based on(144) with real measurements. DISORT-calculated values ofINIR + IRED and INIR − IRED are plotted for a wide range of τ and Ac
for SZA = 62 and surface albedos αRED = 0.092 and αNIR = 0.289.When Ac is constant and τ varies, the set of calculated values definethe cloud-fraction isolines. When τ is constant and cloud fractionvaries, the set of values define the τ -isolines. Values INIR + IRED andINIR − IRED (30 dots, with 10 for each cluster) are from the Cimelmeasurements at the ARM site in Oklahoma on 28 July 2002.Measurements were taken around 13 : 45Z, 13 : 58Z and 14 : 11Zrespectively, corresponding to decreasing abscissa NIR + RED. Thestraight line through (0,0) corresponds to NDCI ≈0.08, henceτ ≈ 80 along the Ac = 1 line.
RT calculations to give the same values of INIR and IRED asthe measured (3D) ones. In this case, one may allow Ac tobe negative! Then it immediately follows from (143) that T0
can exceed 1 and will thus be able to mimic reflectance offcloud edges that reaches the surface. This commonly observedphenomenon [134, 260, for typical examples] often leads tosurface fluxes in excess of the values predicted by 1D RT.Detailed explanations, examples and discussions can be foundin Marshak et al ’s 2004 paper [90].
As an example of retrievals, figure 32 shows a NIR-RED versus NIR + RED plane with Cimel measurements atthe DOE Atmospheric Radiation Measurement (ARM) site inOklahoma (97.48W, 36.61N) on 28 July 2002. The plotillustrates INIR and IRED as functions of τ and Ac calculatedby using the DISORT 1D RT model to compute the variousquantities in (144) for SZA = 62 and surface albedoes αRED =0.092 and αNIR = 0.289. Three groups of data points (10points per group) measured by the ARM Cimel are also plotted.The data points, while having different values of INIR and IRED
thus being located at different positions on the plane, havealmost the same NDCI—a straight line through the (0,0) point.Therefore, if retrieved from it, the same optical depth wouldhave arisen (τ ≈ 80 for Ac = 1). However, as follows from theplot, these groups correspond to three different Ac, τ pairs ofcloud properties: 0.9, 28, 0.8, 22 and 0.4, 12 with clearlydifferent values of τ .
51

Rep. Prog. Phys. 73 (2010) 026801 A B Davis and A Marshak
8.1.2. Spatial signatures. Stratiform clouds (St and Sc)may have cloud-top and cloud-base altitudes that are relativelywell-defined, at least over horizontal scales up to a few timestheir thickness H . A plane-parallel slab assumption maytherefore be reasonable for their outer geometry. However,these clouds are generally quite turbulent environments; sotheir inner structure is highly variable. Microphysical probeson aircraft have sampled the spatial variability of LWC, andits wavenumber spectrum indeed follows the ubiquitous k−5/3
law [105, 261, among others], even though the turbulenceis far from Kologorov’s [262] statistically isotropic andhomogeneous model and condensed water is far from beinga passive scalar. LWP, vertically integrated LWC, can bemeasured from ground-based microwave radiometers (MWRs)[151, among others]. Time-series of LWP, viewed as frozenturbulence advected past the instrument (much like in wind-tunnel experiments), leads to the same conclusion. Incontrast, solar radiation observed from space or ground followsthe turbulence-driven k−5/3 law too, but only down to acharacteristic wavenumber k. At smaller scales (larger k),the spectrum dips to lower levels of variability. In section 6.3,we have shown observations and 3D RT simulations of thisscale break. We were able to explain the scale break byintroducing the inherently 3D RT phenomenon of ‘radiativesmoothing’ [196], in essence, an observable manifestation ofthe spatial Green function for multiple scattering [178].
So we have, on the one hand, at least an indirectobservation of the Green function and, on the other hand, areasonable diffusion-based theory of RT Green functions, atleast for optically thick clouds. We used this conjunction in theNIPA (section 7.2.1) to mitigate the 3D RT effect of radiativesmoothing for the purposes of cloud remote sensing in theconventional sense where an operational 1D RT model is usedas a predictor for cloud radiances. However, there is also herea clear opportunity for a remote sensing retrieval of H usingsimple passive instrumentation.
Indeed, suppose we have a ground-based NFOVradiometer recording zenith radiance, as did Savigny et al[200]. Then either Fourier or structure-function analysis ofthe time series yields an empirically determined characteristicscale r(=1/k) where the break occurs in the scaling. Thisdetermination does not call for any radiometric calibration,only a reliably constant gain factor that converts the incomingradiance into photo-electrons or current. We know from thedetailed 3D RT computations shown in section 6.3.2 that
r ∼ 〈ρ2〉1/2T , (145)
where sub-index T stands for transmitted light. Finally, weknow from diffusion theory (section 4.1) that
〈ρ2〉1/2T ≈
√2/3 H,
if necessary with small correction terms dependent on cloudoptical thickness τ and asymmetry factor g (cf section 4.1), andpossibly also the cosine of the SZA µ0. Now, µ0 is known,g ≈ 0.85 for low-level liquid water clouds, and τ can beinferred independently from passive but calibrated radiometry(as described, e.g. in section 3.2). The latter determinationis, in essence, based on the inversion for τ of transmitted flux
µ0F0 × T (τ, g; µ0), or of zenith radiance (with the added buttractable issue of ambiguity). The only remaining question istherefore about the precise relation to use in (145). Is a simpleproportionality enough and, if so, does the constant depend onanything we should know about? Computational 3D RT cananswer this question using realistic cloud models.
One might start worrying about a fundamental inconsis-tency that is building up here. We detect and quantify a scalebreak, which presumes turbulent cloud structure ... and wethen invoke results from analytic diffusion theory that arebased on a uniform cloud assumption. What that means ofcourse is that the retrieved H and τ are ‘effective’ cloud prop-erties: those of the uniform slab that give the observed valuesof T (τ, g; µ0) and 〈ρ2〉T (H, τ, g; µ0). Is that good enough?That question will depend on the application, but we can besure that in some cases the biased answers are not accept-able. That is why we now have refined theory for RT Greenfunction observations, even with the framework of diffusion.We have models for estimating the impact of unresolved small-scale variability that the measurements have basically averagedover. In fact three different types of model were discussed insection 5.1. Although they were generally designed with theradiation budget of ∼100 km GCM grid-cells in mind, thereis no fundamental reason why they cannot be applied, withproper thought, to unresolved spatial variability in remote sens-ing observations. Again, particularly attractive here are ho-mogenization techniques such as Cairns’ renormalization (cfsection 5.1.1).
So, looking up from the ground at stratiform clouds,we can tell their thickness using 3D RT phenomenology andrelatively simple instrumentation. What about looking downfrom aircraft or space? The opportunity for remote passivedetermination of H remains just as good, with one caveat.Since we have
〈ρ2〉1/2R ∝ H/
√(1 − g)τ , (146)
from section 4.1, where sub-index R stands for transmittedlight, we will definitely need to know τ—and not just forcorrection terms. So we will have to use an instrument withabsolute radiometric calibration (or a collocated one, possiblywith coarser resolution). Moreover, the prefactor in (146) willlikely depend on µ0, as is the case for temporal Green functionmoments [108], and there will be a notable (x, y) anisotropyif µ0 is significantly < 1. The role for computational 3DRT is still there to refine the connection between r and somecombination of 〈x2〉R and 〈y2〉R .
Another fundamental concern arises at this point. Solar1D RT in clouds is not sensitive to vertical variations inextinction σ(z) as long as other optical properties are notdependent on altitude. Indeed, the natural independent variablein the 1D RTE is τ(z) = ∫ z
0 σ(z′) dz′. So, beyond the keyposition of the source, R and T (spatially integrated Greenfunctions) do not depend on what side is up or down if 0
and g are constant. This cannot be true of 〈ρ2〉R , a measure ofhorizontal transport from the source position to the observationpoint, if the cloud is actually denser at its top than at itsbase. And that is indeed what we learn from elementarycloud physics, a.k.a. ‘parcel theory’ [263]: moist air and CCN,
52

Rep. Prog. Phys. 73 (2010) 026801 A B Davis and A Marshak
rising in an adiabatic environment. For the natural assumptionof a fixed number of CCN, hence cloud droplets, adiabaticgrowth predicts a linear trend in LWC(z) where it is 0 atzbase and maximal at ztop. This leads to a power law forσ(z) in |z − zbase|2/3.
Diffusion theory, based on (29), for a (pulsed) point-wiseboundary source remains tractable for D(z) = 1/(1 − g)σ (z)
with a power-law trend D(z) ∝ |z − zbase|−ζ , with 0 ζ 1.However, the solution has already sufficiently complicatedexpressions for a constant-gradient model
σ(z) = σ ×[
1 +
H
(z − zbase + ztop
2
)], (147)
with 0 || 2. The case of < 0 corresponds toobservation and source points above the cloud, which appliesto passive solar measurements, while the > 0 scenariocorresponds to observation and source below (cf section 8.3.3for an application). Moreover, a straightforward least-squaresminimization [108] maps ζ to
(ζ) = ±6 ×[
2
(ζ + 1
ζ + 2
)− 1
], (148)
hence ζ = 2/3 to (2/3) = −3/2 in the solar case. MCsimulations by Davis et al [108] show that, for all Greenfunction moments of interest here, the difference betweenusing the power-law model or the linear model using (ζ)
is negligible.The two panels in figure 33 show three key Green function
moments (two in time, one in space), all normalized to H , asfunctions of for reflected and transmitted light; (1−g)τ is setat 8.1. Continuously varying diffusion-theoretical predictionsare compared with sparse but representative MC validationdata. Focusing on the spatial statistic (RMS ρ) in transmissiongeometry (bottom panel), the diffusion model has singularbehavior when || → 2− (σ vanishes at cloud base). Maybeworse is that the correction for stratification has the wrongsign for this particular value of τ ; this is not the case at larger τ
and a parametrization based on that regime can be used [108].The effect is 2nd-order in || anyway. In reflection (toppanel), the effect of is 1st-order and there is no singularityin this observation geometry ( < 0) applicable to bothsolar and laser sources. Here again, Davis et al proposein [108] an accurate parametrization (based on logarithmicderivatives in at = 0), at least for the RMS ρ and meanct (used further on).
We have now taken care of all the most important structuraland optical properties of a Sc cloud in the forward diffusion-based RT model for RMS ρ, hence the direct observable r.Yet there remains one main obstacle for implementation ofthe above algorithm for a passive determination of H fromabove, given τ . It is the need for Landsat- or ASTER-like pixelsizes in the tens of meters since radiatively smoothed scalesneed to be resolved. Earth observation satellites that targetglobal coverage do not have this level of spatial resolutionsince they require wider swaths. Nonetheless, there may someday be high-altitude unmanned airborne vehicles (UAVs), oreven stratospheric balloons [264], that will deliver the requiredresolution.
Figure 33. Effects of cloud stratification on moments of Greenfunctions. Top: reflected light, in semi-log axes, where diffusionpredictions for the prescribed cloud (τt = 8.1) are in solid lineswhile the MC validation data are plotted with bold symbols; we notethe presence of a logarithmic singularity in 〈ρ2〉R at = +2.Bottom: same as above but for transmitted light for the same clouds;we note the nearly flat behavior of 〈ρ2〉T away from || = 0 and upto the onset of the logarithmic singularity at || = 2. Reproducedfrom [108].
In the meantime, it is important to promote multi-pixelapproaches, like the above procedure, in the physics-basedremote sensing community at large (beyond just clouds). Theindustry has indeed been dominated since its inception bysingle-pixel methods predicated on the assumptions that (1) allthe desirable information is somehow encoded in the multi-or hyperspectral dimension of the data and (2) that there aretoo many pixels coming down the pipeline to start processingmore than one at a time. The previous subsection is one moreproof that there are indeed vast amounts of cloud, aerosol and
53
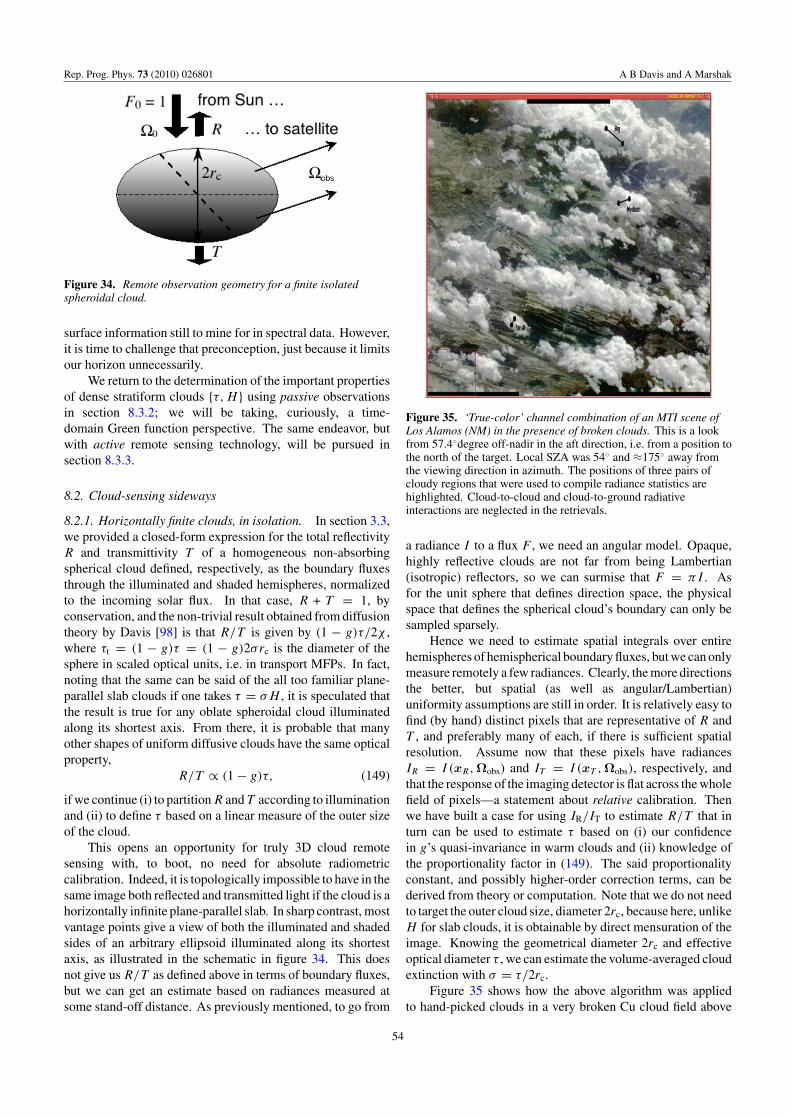
Rep. Prog. Phys. 73 (2010) 026801 A B Davis and A Marshak
Figure 34. Remote observation geometry for a finite isolatedspheroidal cloud.
surface information still to mine for in spectral data. However,it is time to challenge that preconception, just because it limitsour horizon unnecessarily.
We return to the determination of the important propertiesof dense stratiform clouds τ, H using passive observationsin section 8.3.2; we will be taking, curiously, a time-domain Green function perspective. The same endeavor, butwith active remote sensing technology, will be pursued insection 8.3.3.
8.2. Cloud-sensing sideways
8.2.1. Horizontally finite clouds, in isolation. In section 3.3,we provided a closed-form expression for the total reflectivityR and transmittivity T of a homogeneous non-absorbingspherical cloud defined, respectively, as the boundary fluxesthrough the illuminated and shaded hemispheres, normalizedto the incoming solar flux. In that case, R + T = 1, byconservation, and the non-trivial result obtained from diffusiontheory by Davis [98] is that R/T is given by (1 − g)τ/2χ ,where τt = (1 − g)τ = (1 − g)2σrc is the diameter of thesphere in scaled optical units, i.e. in transport MFPs. In fact,noting that the same can be said of the all too familiar plane-parallel slab clouds if one takes τ = σH , it is speculated thatthe result is true for any oblate spheroidal cloud illuminatedalong its shortest axis. From there, it is probable that manyother shapes of uniform diffusive clouds have the same opticalproperty,
R/T ∝ (1 − g)τ, (149)
if we continue (i) to partition R and T according to illuminationand (ii) to define τ based on a linear measure of the outer sizeof the cloud.
This opens an opportunity for truly 3D cloud remotesensing with, to boot, no need for absolute radiometriccalibration. Indeed, it is topologically impossible to have in thesame image both reflected and transmitted light if the cloud is ahorizontally infinite plane-parallel slab. In sharp contrast, mostvantage points give a view of both the illuminated and shadedsides of an arbitrary ellipsoid illuminated along its shortestaxis, as illustrated in the schematic in figure 34. This doesnot give us R/T as defined above in terms of boundary fluxes,but we can get an estimate based on radiances measured atsome stand-off distance. As previously mentioned, to go from
Figure 35. ‘True-color’ channel combination of an MTI scene ofLos Alamos (NM) in the presence of broken clouds. This is a lookfrom 57.4degree off-nadir in the aft direction, i.e. from a position tothe north of the target. Local SZA was 54 and ≈175 away fromthe viewing direction in azimuth. The positions of three pairs ofcloudy regions that were used to compile radiance statistics arehighlighted. Cloud-to-cloud and cloud-to-ground radiativeinteractions are neglected in the retrievals.
a radiance I to a flux F , we need an angular model. Opaque,highly reflective clouds are not far from being Lambertian(isotropic) reflectors, so we can surmise that F = πI . Asfor the unit sphere that defines direction space, the physicalspace that defines the spherical cloud’s boundary can only besampled sparsely.
Hence we need to estimate spatial integrals over entirehemispheres of hemispherical boundary fluxes, but we can onlymeasure remotely a few radiances. Clearly, the more directionsthe better, but spatial (as well as angular/Lambertian)uniformity assumptions are still in order. It is relatively easy tofind (by hand) distinct pixels that are representative of R andT , and preferably many of each, if there is sufficient spatialresolution. Assume now that these pixels have radiancesIR = I (xR,Ωobs) and IT = I (xT ,Ωobs), respectively, andthat the response of the imaging detector is flat across the wholefield of pixels—a statement about relative calibration. Thenwe have built a case for using IR/IT to estimate R/T that inturn can be used to estimate τ based on (i) our confidencein g’s quasi-invariance in warm clouds and (ii) knowledge ofthe proportionality factor in (149). The said proportionalityconstant, and possibly higher-order correction terms, can bederived from theory or computation. Note that we do not needto target the outer cloud size, diameter 2rc, because here, unlikeH for slab clouds, it is obtainable by direct mensuration of theimage. Knowing the geometrical diameter 2rc and effectiveoptical diameter τ , we can estimate the volume-averaged cloudextinction with σ = τ/2rc.
Figure 35 shows how the above algorithm was appliedto hand-picked clouds in a very broken Cu cloud field above
54

Rep. Prog. Phys. 73 (2010) 026801 A B Davis and A Marshak
Los Alamos, NM, USA (35.875N, 106.3245W), collectedon 22 September 2000, at 19:05 UTC. The data were capturedby the Multispectral Thermal Imager (MTI) satellite [265]from a viewing direction of ≈60 off-nadir. MTI was asatellite mission funded by the US Department of Energy(DOE) as a technology demonstration in dual-purpose Earthobservation, partly for nuclear proliferation detection, partlyfor environmental science. The only important facts aboutMTI that need to be known here are (i) that its 14 spectralchannels included VNIR wavelengths where there is virtuallyno absorption by droplets or tropospheric gases and (ii) that itsspatial resolution was 5 m at VIS and one NIR wavelengths,otherwise 20 m.
Three clouds were picked to cover the range of outer sizes,then small patches of pixels in the easily identified sunny andshady portions of each cloud were hand-selected and the meanradiances, as well as their standard deviations, were computedand used as the inputs IR and IT . The proportionality constantfor the sphere, 1/2χ ≈ 3/4, was used for simplicity in (149)to derive estimates of τ , assuming of course g = 0.85. The‘big,’ ‘medium’ and ‘small’ clouds yielded effective τ -valuesof 45 ± 11, 43 ± 10 and 26 ± 7, respectively. These numbersare realistic for such clouds.
As in the prototype algorithm presented in section 8.1.2to obtain H for stratiform clouds, the above algorithm toobtain τ for cumuliform clouds is mono-spectral but multi-pixel. So it serves as a second counterpoint to the mono-pixel but multi-spectral theme used in mainstream remotesensing of clouds, aerosols, surfaces, etc. As it stands, it hasthe same obstacle for implementation: the need for unusuallyhigh-resolution imaging that is generally precluded by theneed for global coverage. Again, there may be some day aconstellation of suborbital platforms with inexpensive non-calibrated sensors that can nonetheless be used to supportphysics-based remote sensing of the environment usingthe kind of technique presented here. Alternatively, thelower spatial resolution readily available from space assets(approximately few hundreds of meters) can be used if onecan unravel mixtures of R, T , and clear sky. This should bepossible given enough multi-angle data, such as provided byMISR (275 m pixels).
8.2.2. Horizontally finite clouds, with microphysicalstratification. What if one could measure the vertical profilesof the cloud microphysical properties by retrieving them fromthe solar radiation reflected directly off cloud sides? As wementioned earlier, all existing operational retrieval algorithmsare based on the plane-parallel approximation that does not takeinto account the cloud horizontal’s structure. In terms of cloudaspect ratio, γ = L/H , where L and H are horizontal andvertical dimensions of the clouds, respectively, the main plane-parallel assumption used for any remote sensing retrieval is thatγ is very large (cf figure 29). In that case, the satellite alwayssees either the cloud top or the clear sky. From there, in thecase of cloud, using the 1D Nakajima–King algorithm [206],a pair of reflectances at non-absorbing and droplet-absorbingbands indicates both how optically thick the clouds are (by
Figure 36. Reflectance from a single cuboidal cloud with avariable droplet effective radius. Cloud height H = 4 km, cloudwidth L = 6.5 km (aspect ratio γ = 1.6), flat cloud top, τ = 80,SZA = 60, VZA = 45 with the Sun in the back of the sensor.Droplet effective radius re increases linearly with height from 5 to25 µm. Reflectance from cloud top is at the right side of the cloudedge while reflectance from cloud side is at the left. Dots indicate‘measurements’ sampled at δx = 0.25 km resolution. Horizontalaxis starts at x = 0, which is 3.5 km away from the first cloud-sidemeasurement. Altogether, there are H × tan(VZA)/δx = 16cloud-side measurements that go from x = 3.5 km to x = 7.5 km onhorizontal axis. Cloud top starts at x = 7.5 km and ends atx = 14 km. Top: λ = 0.67 µm. Bottom: λ = 2.1 µm.
estimating τ ) and how much condensed water they containfrom (68): CWP ≈ (2/3)ρwreτ (by estimating re).
For cloud-side remote sensing in the solar spectrum,Marshak et al [266] and Martins et al [267] suggested usingthe same two wavelengths: one non-absorbing (0.67 µm) andone with strong absorption by liquid water (2.1 µm). Incontrast to the 1D plane-parallel approximation, 3D RT isused for interpreting the observed reflectances. As a proof-of-concept that the signature of the ‘true’ effective particlesize is detectable in the observable reflectances at λ = 0.67and 2.1 µm in a statistical sense, these authors experimentedon a few examples of simulated radiance fields reflected fromcloud fields generated by a simple stochastic cloud model withprescribed vertically variable microphysics.
Figure 36 shows an example of reflectances from cloudside and cloud top for two wavelengths: 0.67 and 2.1 µmcalculated with SHDOM [170]. The droplet effective radiusre increases linearly with height from 5 µm (at the cloud base)to 25 µm (at the cloud top). Cloud geometrical thickness
55

Rep. Prog. Phys. 73 (2010) 026801 A B Davis and A Marshak
Figure 37. Feasibility of remote determination of effective droplet radius along the sides of convective clouds. (a) True (i.e. prescribed)effective radius for droplets (blue) and ice particles (red). Smallest droplet radii are at the bottom of the cloud cells, largest droplets around15 µm are at the top of the liquid water volume just below the largest ice effective radius values (re = 60 µm). The color-scale for re is‘painted’ onto a 3D isosurface of constant CWC that defines cloud boundaries. (b) Observed reflectance values for λ = 0.87 and 2.1 µm forcertain true re ranges (droplets only). SZA = 45, VZA = 60 with the Sun in the back of the sensor. The inserted histogram illustrates theunderlying true re distribution.
H = 4 km and cloud optical thickness is τ = 80 (thusextinction coefficient is 20 km−1). With horizontal resolutionδx = 0.25 km and viewing zenith angle (VZA) θ = 45,there are H × tan θ/δx = 16 cloud-side ‘measurements.’ Wesee that, under relatively low solar illumination (60 SZA),I0.67 reaches its maximum near the cloud top (which is atx = 7.5 km) where most of the photons are already reflectedback from the cloud side without either transmission throughthe cloud and escape from cloud base, nor reflection from thecloud top. The horizontal size L of this cloud is only 6.5 kmand, with the extinction coefficient 20 km−1, γ ≈ 1.6 is notsufficiently large to reach a stable 1D plane-parallel regimeat cloud top. As a result, I0.67 decreases steadily from theilluminated cloud edge to the shadowed one. In contrast,I2.10 has a flat plateau, 5 km across, where the 3D reflectanceperfectly matches the 1D one. Because droplet size increaseswith height, the maximum is reached much lower than in thecase of conservative scattering. It is around 1 km from cloudbase where re = 9–11 µm. With a further increase in re,reflectance I2.10 drops fast and reaches a flat 1D level on thecloud top (re = 25 µm) at only ≈1 km from the edge.
To account for the complex 3D nature of cloud geometryand ensuing RT, Zinner et al [268] recently tested the approachin realistic cloud-observing situations. They used a CRM [269]to provide complex 3D structures of ice, water and mixed-phase clouds, from the early stage of convective developmentto mature deep convection. A 3D MC-based RT model [209]was used to simulate realistically the proposed observations. Alarge number of cloud data sets and corresponding simulatedobservations provided a large database for an experimentalBayesian retrieval.
As an example, figure 37 shows a simulated cloud fieldand calculated reflectances. Left panel shows the ‘truth,’i.e. the value of re that is visible for the given observationalperspective into the cloud structure. Due to the complexity
of 3D cloud structure and 3D RT a wide range of possiblereflectance values at 0.87 and 2.1 µm occurs for each value ofre (right panel, with droplets only). This differs clearly fromthe classical picture of 1D RT through plane-parallel cloudswhere a clear deterministic one-to-one map exists between apair of reflectances I0.87, I2.10 and one pair of cloud opticalthickness and droplet effective radius values τ, re, for givensurface, viewing and illumination conditions [206, 212]. Inspite of blurring the separation by re, the core informationof droplet size is still visible in the reflectance picture. Forexample, there is clear evidence that smaller 2.1 µm reflectanceis related to larger cloud particle size. To demonstrate theperformance of the experimental Bayesian retrievals, Zinneret al used an independent simulation of an additional cloudfield as a synthetic testbed; see [268] for full details.
8.3. Direct observation of Green functions in time and/orspace
The spatial Green function of clouds for multiple scattering,generally without droplet absorption, has already been usedextensively. It was used to assess 3D RT effects (e.g.in the Landsat scale break), to mitigate them (e.g. usingNIPA) and was even exploited, albeit indirectly, to estimatecloud thickness from passive solar observations using 3DRT phenomenology (see section 8.1.2). This is quiteremarkable for a purely mathematical construct based infact on linear transport in a uniform plane-parallel medium,or its approximation by the diffusion limit. The 3D RTinformation content of the Green function comes entirely fromthe concentration of the source to a single point in space.
We now ask what if we could observe the cloud’s Greenfunction directly? Moreover, we broaden our scope fromthe steady-state problem and the spatial Green function to itstemporal and space–time counterparts.
56

Rep. Prog. Phys. 73 (2010) 026801 A B Davis and A Marshak
8.3.1. Pathlength statistics 1, space-based wide-FOV/multiple-scattering lidar. We start with purely temporal Green func-tions excited by a uniformly distributed pulse of light. Wewould gladly observe this Green function using time-sampledradiometry, if such a physical source exists. Approximationsdo. Imagine a normally diverging laser pulse (say, 1.2 mrad)impinging on a cloud from a transmitter at a very large stand-off distance. Also imagine that the receiever FOV is somewhatlarger, as for standard ground-based lidar systems, but maybemore (say, 3.5 mrad). That was precisely one of the possi-ble configurations used by the first lidar system launched intolow-Earth orbit (LEO), and returned, in the cargo-bay of SpaceShuttle Discovery. The STS-64 mission thus carried the Lidar-In-space Technology Experiment (LITE) to ≈260 km altitudeon 9–20 September 1994 [270]. More precisely, that widerFOV was used on the nighttime side (no solar backgroundnoise) of orbit #135, which overflew an extensive marine Scdeck off the coast of Southern California. The transmitterproduced 0.5 J pulses at 532 nm (using a frequency-doubledNd : YAC solid-state laser) with a 10 Hz rep-rate, and the re-ceiver had a 1-m diameter telescope. It was a rather heftyinstrument, but it was the first to go to space and operate ac-cording to specs.
The diameter of LITE’s laser beam was ≈0.3 km atcloud top, and the footprint for its FOV ≈0.9 km. Sothe detected light could have been transported horizontallyanywhere between 0 and 1.2 km (from one side of the laserbeam to the opposite side of the FOV); within its FOV, itcollected all the available light transported less than 0.6 km.The targeted marine boundary-layer clouds have H in therange 0.2–0.5 km. Optical depth τ is in the range 4–40,hence 0.6 (1 − g)τ 6 (typically with a skewed, log-normal-type distribution). Also, it tends to correlate looselywith H , specifically, H ∼ τ 2/3 [271]. Using typical values,H = 0.3 km, τ = 13, (94) then gives the RMS spread of thespatial Green function as ≈0.3 km, and this number is expectedto go up or down only by a factor of 3±1/6 (0.8–1.2) on average.So we can confidently say that LITE has captured most of themultiply scattered laser light coming its way.
Among the ≈2000 pulses returned from this 13 minsegment, four were particularly interesting because they werein close proximity and not saturated at their peak values.They are shown in figure 38. The point at which the optical‘echo’ appears to come below sea-level is indicated, and thismakes the pulse stretching by multiple scattering particularlyevident. From these signals the background (in this case, shotand electronic) noise level can be determined visually and theabove-noise signal can be used to estimate temporal moments,〈ct〉R and 〈(ct)2〉R . From there, one can use (95)–(96), but asrecently refined [107] for collimated beam effects, to infer bothH and τ . The outcome is τ ≈ 17 and H ≈ 0.28 km, which isnot unreasonable in view of the marine Sc climatology brieflydescribed above. An independent refinement for stratificationeffects by Davis et al [272], possibly over-compensating, leadsto τ ≈ 11 and H ≈ 0.4 km, which is still well within theclimatology.
Other methods of analysis based on explicit expressionsfor the time-domain signal concur with these numbers [59], and
Figure 38. Four non-saturated LITE pulses returned from anoptically thick marine Sc deck. Time-dependent reflected radianceR(t) is plotted in arbitrary (engineering) units as a function ofaltitude of the apparent echo (upper axis) and path inside the cloud(lower axis), respectively, the interpretations applicable to theconventional single-backscattering model for the lidar signal and tothe new multiple-scattering model that is favored here.
could be used in the presence of saturated portions because therange of time-bins used in the retrieval can be varied by the user.To illustrate with a consistency check, we can use the effectiveH, τ pair obtained for the uniform cloud assumption in (87).Assuming χ = 2/3 for simplicity, this predicts the ct to be≈0.50 km. The observed value in figure 38 is ≈0.54 km, andthe 7% difference is well within experimental error.
8.3.2. Pathlength statistics 2, high-resolution O2 A-Bandspectroscopy. To study and exploit temporal statistics, onedoes not need to obtain explicit time-domain data as long asLaplace-domain data are available. In the case of multiplescattering in the cloudy atmosphere, there happens to be anemerging observational technology that gives us access toLaplace-space data. It is high-resolution differential opticalabsorption spectroscopy (DOAS) in the ‘A-band’ of oxygen at759–771 nm, which was mentioned briefly in section 2.1. Thelower panel of figure 2 for O2 optical depth κν × H across atypical low-level stratus cloud layer. For the instrumentalist’sconvenience, it sits roughly at the maximum of the solarspectrum when expressed in photons s−1 m−2.
The important property of O2 used here is that, being adominant component of air, its density n is known everywherewith high accuracy. We also know its optical absorption cross-section ξa(ν) very well as a function of wavenumber ν, givenpressure and temperature (i.e. altitude). So, we know itsabsorption coefficient κν = n × ξa(ν) as a function of ν,and it varies over several orders of magnitude (cf figure 2).Therefore, for a known path L and a known source ofbroadband radiance I (0), we are able to predict directlytransmitted radiance from Beer’s law:
Iν(L) = I (0) exp(−κνL). (150)
This is the simple forward model for DOAS of a gas, O2 orother, at least for high-enough resolution that we do not need
57

Rep. Prog. Phys. 73 (2010) 026801 A B Davis and A Marshak
to convolve the spectral variations with a ‘slit’ function. Inpractice, that is never quite true. The point here is that we willneed this high-enough resolution to justify the use of Beer’s lawof exponential transmission as a reasonable approximation forthe RT-based signal model. In DOAS, we focus on the directtransmittance factor Tdir(ν, L) = Iν(L)/I (0), where I (0)
can be determined empirically by seeking a wavelength withnegligible absorption, yet not too far from the absorption bandof immediate interest, to avoid questions about the spectralinvariance assumed for the scattering and reflection.
In operational DOAS, one does not know everything in(150). Unforeseen spectral features can be used to detectand identify unknown molecules in the path. Alternatively,the strength of the spectral lines can be used to estimate thedensity of a molecular species with a known cross-section.In the present case of multiple-scattering in clouds, we knoweverything about the molecules but not the path L(≡ct) per se,because it is in fact a random variable. Consequently, if weknow G(ct, x,Ω), the temporal Green function for the uniformboundary source of interest in solar radiation from (3 + 1)DRT at the A-band wavelength but only for scattering/reflectionprocesses, then the forward model in (150) becomes
Iν(x,Ω) =∫ ∞
0G(ct, x,Ω)e−κνct dct, (151)
which is sometimes called the ‘equivalence’ theorem[273, 274]. Note that, apart from again forgetting the slit-
function convolution, we have not yet decided what kinds ofspatial (x) and angular (Ω) integrations we will use, if any.If we do not know the Green function, it is not too serious ifnature gives the left-hand side of (151) from measurementsand we are only interested in temporal moments, as definedin (89)–(90). Indeed, we can recognize in the equivalencetheorem the temporal part of the Fourier–Laplace transform in(81) but where κνc plays the role of s. This enables us to use therecipe in (92) to obtain successive moments of t , hence of ct .
So we end up in this paradoxical situation wheretwo radically different kinds of instrument—one active andmonochromatic, and the other passive and hyperspectral (manycontiguous spectral bands)—can be brought to bear on studiesof path length. Each of these has a host of technologicalidiosyncrasies, enough that each instrument class is ownedby a different community of observation experts. Yet they candeliver the same primary products, namely, 〈(ct)q〉R (q = 1, 2and possibly more). Having obtained from an O2 A-bandspectrum at least the first two moments of path length, we canperform the same cloud property retrievals as demonstratedabove with LITE data. Thus, H, τ would be the final(‘level 2’) product.
If, for any reason, we prefer not to estimate the momentsexplicitly, we still have a compelling moment-based argumentthat there is enough cloud information content in Iν(x,Ω) toperform the same remote sensing task. One way to do that isto fit the spectroscopic data, re-ordered by value of κνc, whichyields a monotonically decreasing function. The nonlinearmodel could be one or another of the analytic expressionsfor R(s) from sections 3–4 or from the literature since theeffects of oblique collimated illumination have recently been
incorporated [107]. The optimal choice of cloud parameters isthen found by fixing χ (or µ0) and g, and varying the pair inH, τ to fit the data.
All of this is for reflected light of course, which meansthat the A-band instrument must be above the clouds, eitheron an aircraft or a satellite. There is a long and venerableline of theoretical and observational studies, many done inthe former Soviet Union, on A-band spectroscopy from aboveground that, incidentally, has other applications than cloudremote sensing. This literature is surveyed in great detail in arecent review paper by Davis et al [108]. Spectrometers thathappen to cover the A-band or are custom-built for it havethus been flown for a long time, both on aircraft and in space.However, only now are we achieving the spectral resolvingpower we need to fully benefit from this opportunity in cloudremote sensing. In particular, we were looking forward to thecloudy pixel data from the imaging A-band spectrometer onthe Orbiting Carbon Observatory (OCO) mission; figure 2 wasin fact computed at the exquisite spectral resolution OCO’sinstrument. Unfortunately, the launch vehicle failed ... butwe are looking forward to the replacement mission (not yetappropriated by NASA at the time of writing).
It is interesting to note that OCO’s mission had nothingto do with clouds and everything to do with mapping CO2
globally. The only programmatic reason OCO had an O2
A-band instrument was to deliver the CO2 column densityas a mixing ratio expressed in ppms, which is the way thegreenhouse gas (GHG) monitoring community likes to seeit (as opposed to g m−2). This is a recurring scenario ininstrument and algorithm development, particularly for space,at the cutting-edge of remote sensing science: we start byusing something that exists for some other reason, because anew concept will take a long time to prevail all the way tofunding decisions and implementation.
At least two academic institutions have invested time andeffort to deploy high-resolution O2 A-band spectrometers atground-based stations in recent years. This of course forces usto work with the light transmitted by clouds. Interestingly, boththe University of Heidelberg (K Pfeilstiker, PI) [275–277] andthe State University of New York at Albany (Q Min, PI) [278–281] teams have focused their A-band research on assessingthe spatial complexity of clouds rather than the remote sensingtasks described above. This is a good thing because we recallfrom section 4 that the 2nd-order temporal moment of thetransmitted Green function, 〈(ct)2〉T , adds nothing new tothe information conveyed by the 1st-order moment, 〈ct〉T ,their ratio being essentially constant across variations of τ ;see (99)–(100) and figure 10. These teams both started withstudies of 〈ct〉T and moved on to 〈(ct)2〉T with upgradedresolving power. Overall, the better the spectral resolutionand, just as importantly, the out-of-band rejection of the slitfunction, the more pieces of path length information that canbe inferred [278].
For their basic O2 A-band DOAS data analysis, both theHeidelberg and the SUNY-Albany groups used a compromisebetween the two approaches sketched above. They used anonlinear fit in Laplace/κν-space. Specifically, they used the
58

Rep. Prog. Phys. 73 (2010) 026801 A B Davis and A Marshak
Laplace transform of the gamma distribution in (110), but forrandom variable ct instead of τ , i.e.
P (s/c) = 1(1 + 〈ct〉T s/c
a
)a , (152)
where s/c is identified with κν . This is like its Fourier-spaceuse in the NIPA (section 7.2.1), but with the two first momentsof path ct rather than horizontal transport ρ. In this case, theparameters to determine numerically by fit are 〈ct〉T and a,where the latter value immediately yields the interesting ratioυ = 〈(ct)2〉T /〈ct〉2
T through a = (υ2 − 1)−1.To the above two teams at universities, we add a National
Oceanic and Atmospheric Administration (NOAA) team thatmade a successful foray into this research area. Interestingly,Portmann et al [282] used the weaker O2 B-band (∼687 nm)and relatively low-resolution, but good enough to extractthe mean path length. Also, their focus was primarily oncompletely overcast skies and they therefore reached very goodagreement between their observed values of τ and 〈ct〉T withstraightforward 1D RT predictions.
Because√
〈(ct)2〉T ∝ 〈ct〉T ∝ (1 − g)τ × H , thereare more unknowns (τ, H ) than independent observations byground-based A-band instruments in cloud remote sensingrole, even when limited to single/unbroken layers. Theymust therefore be used in synergy with one or more ancillarycloud-probing sensors, e.g. the new exploitation of the solarbackground in MPLs to determine τ from Izen (as explainedin section 3.2). Another instrument pairing could includethe simple NFOV radiometers that can be used to derive τ
if calibrated, and H if not. The latter scenario uses (98),as explained in section 8.1.2. Moreover, the raw data mayeven be sampled from the A-band instrument at the non-absorbing wavelengths, otherwise used only to normalize theradiances within the absorption band. At any rate, givenH (e.g. from a NFOV) or τ (e.g. from an MPL’s solarbackground), A-band will give the other cloud parameterthrough the observed value of 〈ct〉T and the prediction for itin (99), or a refinement that accounts for oblique collimatedillumination and/or stratification.
With access to 〈ct〉T and 〈(ct)2〉T , the Heidelberg andSUNY-Albany groups noticed that the empirical relationshipbetween 〈ct〉T and τ undergoes a qualitative change when thecloudy skies go from a single unbroken layer to a complexscene with multiple and/or broken layers. For a given τ
(obtained by some other means), 〈ct〉T is radically reduced by3D RT effects for given H . This is as predicted in sections 5.1.2and 5.1.3 and other theoretical studies, most notably byStephens et al [283, and references therein]; these last authorsmade extensive use of time-dependent MC methods applied tospecific realizations of fractal or data-driven stochastic cloud-field models.
The Heidelberg group adopted the anomalous diffusion(mean-field 3D RT) model from section 5.1.3. They findthat the vast majority of cloudy skies had effective Levyindices α between 1 and 2 [276, 277], where the upper boundcorresponds to the standard 1+1D RT model. They also foundthat the ratio
√〈(ct)2〉T /〈ct〉T was essentially independent of
both τ (as predicted for uniform slab clouds using PDEs) andα (the more-or-less chaotic cloudiness). Figure 39 illustratesthis interesting finding by Scholl et al [277] that challengescurrent models. Davis’ [63] recent mean-field model basedon anomalous transport generalizes the anomalous diffusiontheory and explains the constant ratio. However, it is reallyjust a MC-based computational technique that uses an ad hocsubstitution of exponentially distributed steps with a tunablepower-law. Analytical solutions leading to predictions forprefactors and pre-asymptotic corrections, as were obtainedfor the normal diffusion model, are of course desirable; theymay be obtainable following the formalism of Buldyrev et al[284] based on pseudo-differential operators (i.e. fractionalderivatives).
In summary, there are basically two cloud-probingfunctions for hi-res O2 A-band spectroscopy depending on skyconditions. If the cloud structure is simple, a single near plane-parallel layer, then A-band spectrometry is a cloud remotesensing technique bringing more or less information to the tabledepending on the vantage point: are we looking at reflected ortransmitted sunlight? If the cloud structure is complex, witheither multiple or broken layers, then (i) A-band responses candetect it and (ii) A-band signals can help to assess—and maybeparametrize—the 3D RT effects.
What good is the later functionality of O2 A-band DOAS?We must recall that the most challenging case for radiationbudget estimation in a GCM grid-cell is for the shortwaveheating rates when the cloud structure is complex. A-band isafter all about how multiple scattering in and between cloudsaffects the process of gaseous absorption, which is key toclimate when the gas is energetically relevant in the solarspectrum (primarily, GHGs H2O and CO2). So it is clear that,if there is a claim that a given GCM shortwave parametrizationfor cloudy columns makes accurate broadband predictionsusing all the important species, then it should be able to doso for O2 since it is very well mixed.
Therefore, by slightly tweaking GCM shortwaveparametrizations to become A-band signal predictors (ratherthan broadband integrators), the O2 A-band’s strong responseto 3D cloud structure can be exploited. By making it a sensitivediagnostic of 3D RT effects, it can be used to evaluate theperformance of GCM shortwave parametrizations, for givenclouds. This activity would normally lead to improved solarRT parametrizations, up to the point where the weakest link inthe GCM physics is somewhere else, probably in the forecastof cloud amount and optical properties based on microphysics.Even then, A-band may be able to help by providing a radiativecriterion for what is a good-enough representation of theclouds from the important standpoint of shortwave gaseousabsorption.
8.3.3. Wide-FOV/multiple-scattering cloud lidar, at suborbitalranges. Our last technical topic is a small conceptualextension of cloud remote sensing with space-based/wide-FOV lidar pioneered with LITE (cf section 8.3.1). If the stand-off distance is not so great, surely there is a way of directlyrecording the spatial part of the Green function excited by thepulsed laser beam. We already know from section 4.2, that this
59

Rep. Prog. Phys. 73 (2010) 026801 A B Davis and A Marshak
Figure 39. Millimeter-Wave Cloud Radar (MMCR) transects and path length moments from O2 A-band for the cloudy sky over Cabauw,NL, on 11 May 2003. The upper panel shows the structure of clouds according to the collocated MMCR as a function of time, roughly for1 h. The scene is color-coded for three successive periods where the clouds go from two solid layers to a more and more broken structure.The lower left-hand panel shows 〈ct〉T /H , H being the thickness of the whole cloud system (from the MMCR), and 〈ct〉T from the2nd-generation University of Heidelberg O2 A-band spectrometer. This ratio is plotted as a function of scaled optical depth τt = (1 − g)τ(obtained from other collocated instruments). Overlaid on the data is an ad hoc hybrid model that used the prefactor and pre-asymptoticcorrections in (95) but the scaling exponent for τt taken from section 5.1.3. The lower right-hand panel shows
√〈(ct)2〉T /〈ct〉T as a function
of τt for the same observations. We note the essentially constant RMS/mean ratio. Reproduced from [277].
added information will help determine the cloud properties ofimmediate interest H, τ .
As far as we know, two groups have worked on this taskassuming different stand-off distances. The NASA–GSFCteam (led by R F Cahalan) developed an airborne device thatoperates from ∼10 km above cloud top; it was baptized as the[cloud] THickness from Off-Beam Returns (THOR) system.The Los Alamos National Laboratory team (led by a presentauthor, AD, and S P Love) developed a ground-based devicethat operates from ∼1 km below cloud base; it was baptized asthe Wide-Angle Imaging Lidar (WAIL) system. Both projectssucceeded at the proof-of-concept level for nighttime operationin the relevant environment [110, 111]. The receiever hardwareimplementations were very different at the focal plane as wellas the fore-optics. In spite of the identical signal physics, theadopted data analysis procedures were also very different inphilosophy and in execution.
THOR was designed to produce an azimuthally integratedprofile of the spatial part of the Green function; it is based on
eight different concentric bundles of fiber-optics that channelthe spatially partitioned light from the focal plane to as manyfast detectors (designed for otherwise standard lidar work).
WAIL went through two receivers, both being imagers.The first was a special detector custom-built at Los AlamosNational Laboratory (LANL) for the Remote Ultra-Low LightImaging (RULLI) program [285]. It worked well for laboratorymock-ups [286] and in the far field for real clouds [287].However, it could not cope with the huge dynamic rangewithout a cumbersome system of density filters used inthe deployments. The second receiver was an off-the-shelfgated/intensified CCD camera that has far more capabilitythan has been harnessed so far; of prime interest here is thepossibility of adaptive exposure times for different time gates,given the hugely variable signal levels.
Both WAIL and THOR were fielded at a coordinatedvalidation campaign in March 2002, respectively , at andabove the previously mentioned DOE ARM program’s climatemonitoring facility in Oklahoma. An extended stratus layer
60

Rep. Prog. Phys. 73 (2010) 026801 A B Davis and A Marshak
Figure 40. Observed and predicted spatial Green function. Thecolor-coded data points are from LANL’s WAIL instrument,collected on 25 March 2002, at the ARM Southern Great Plains siteunder overcast skies. The three colors correspond to the threebackground-suppression interference filters used to rebuild thespatial Green function from three successive acquisitions; theirangular responses at the laser wavelength (532 nm) are displayed inthe inset on a log scale. Also plotted is a smoothed version of theobservations from a moving-mean filter (magenta curve), and thesignal prediction from the diffusion-based forward RT model (blackcurve), as optimally fit to the data by varying H, τ . Only the θ(ρ)region highlighted with the arrows was used to compute the fittingcost-function, as it is where the diffusion model can be used withsome confidence. Reproduced from [111].
developed and was thus probed, from both sides, by wide-FOV/multiple-scattering lidar systems. The objective was tocompare THOR and WAIL cloud property retrievals with thoseobtained from operational ARM instruments. The outcome forboth systems and data analysis procedures compared well withstandard ARM products or a cloud-cover reanalysis based onradiosonde profiles, and are thus deemed ‘validated.’
Figure 40 shows one example of how WAIL data wereprocessed. Since WAIL’s (and, for that matter, THOR’s) time-domain signals are not fundamentally different from those ofLITE, we choose to display some spatial data. Every pointcorresponds to the time-integrated signal at each pixel fromthe gated/intensified CCD plotted as a function of its distanceto the pixel estimated to be where the laser beam hit thecloud base. The three primary colors are for three separatebackground-suppression filters used to reduce the (lunar) noiselevel; see inset. Each of the 10 nm band-width interferencefilters also had a characteristic angular response at the fixedlaser wavelength (532 nm) and the trio were necessary tobuild up the full 53 FOV image—in fact ‘movie’ (before theillustrated time-integration was performed).
One interesting aspect of the spatial signal displayedin figure 40 is that it is severely truncated. For instance,multiplication by ρ2 ×2πρ, which is preliminary to estimating
〈ρ2〉R , leads to an increasing curve that levels but does notdecay to zero. So moment estimation is useless. The cloudwas too low or the 53 FOV was too small. That is one of thereasons why it proved important to obtain more approximatebut explicit expressions for the Green functions in space andtime [59, 103]. Their free cloud parameters can be fit to thespace–time data only where data are available and only wherethe model is known to be valid. As previously mentioned,the trick to obtain Fourier–Laplace invertible solutions is torewrite the BCs approximately as Dirichlet-type rather thanRobin-type. The resulting analytical prediction for R(ρ) isshown in the figure, as fitted to the data (black curve).
8.3.4. Wide-FOV/multiple-scattering cloud lidar and O2
A-band: a general discussion. In view of the manytechnological and logistical differences between the LANLand GSFC systems and in the way their signals were analyzed,we see their joint successes as an overarching validation ofthe whole idea of using direct space–time Green functionobservation to probe clouds and retrieve important cloudproperties. This successful innovation of lidar technology addstremendous capability to active cloud remote sensing. Indeed,standard (on-beam/single-scattering) lidar cannot penetrateclouds with τ 3, even after corrections for multipleforward scatterings that reduce the apparent extinction, andthat is precisely where these off-beam/multiple-scattering lidarsystems start performing.
The successful analysis of LITE cloud data surveyed insection 8.3.1 reinforces to this validation statement and, atthe same time, defines LITE a forerunner of the emergingconcept we refer generically to as Multiple-ScatteringCloud Lidar (MuSCL). Another novel active technique forprobing the bulk properties of clouds was mentioned in theintroductory section, in situ cloud lidar [21, 22], which wasdeveloped at the University of Colorado and by StrattonPark Engineering Company (SPEC), Inc. (Boulder, Co)〈http://www.specinc.com/〉. Its signal physics are the sameas in THOR and WAIL (and, like LITE’s, purely temporal).It should therefore be considered as part of the same class ofMuSCL techniques. Who cares if the source and sensor areinside the cloud? It is still a remote detection of the presenceof cloud boundaries above and below the aircraft, hence itsestimate of H . The other cloud property it delivers is volume-averaged extinction for the cloudy air all around the aircraft,in other words, τ/H .
It is interesting to ask about the spatial resolution of Greenfunction observation techniques, both passive and active. It isinherently adaptive. Imagine, for instance, a ground-basedMuSCL system such as WAIL. Basically, it is the width of thespatial Green function, which itself depends on H, τ , becausethe retrieval is in effect for volume-averaged cloud properties.The volume is ∼ H ×〈ρ2〉F (H, τ), with F = R for WAIL andF = T for ground-based A-band. In any application (such asclimate prediction) where solar RT matters, this is the optimalresolution; the unresolved variability is then, by definition,incorporated into the Green function measurement.
We cannot close this discussion without mentioning thatactive Green function observation with wide-FOV/multiple-scattering lidar has other applications than clouds in
61

Rep. Prog. Phys. 73 (2010) 026801 A B Davis and A Marshak
environmental science, and it has analogs in other branchesof science altogether. All that is required really is a highlyscattering optical medium, the instrumentation can be adaptedto a wide variety of scales and levels of access to themedium, starting in the lab and ending (why not?) withplanetary missions. As an example, the THOR team hasproposed to use its technology to probe sea ice and snowcover [288]. Applications to turbid coastal water also cometo mind.
Since the 1990s, the new medical imaging field of ‘diffuseoptical tomography’ [289] has gone from the concept to thelab to clinical applications. It is predicated on the fact that softtissue is highly scattering in the NIR, but anomalies (smalltumors, aneurysms and so on) are either highly absorbing orthey behave like optical voids. With enough sampling of thespace–time Green functions from any number of source-and-sensor positions, one can reconstruct the medium at a coarsescale that may be sufficient for screening and diagnostics. Thisnovel and inherently non-invasive tomography was enabledby progress in computational physics and numerical analysis:there are now extremely fast solvers for the (3+1)D diffusionequation in arbitrary outer and inner geometry. In thiscontext, WAIL and THOR are a poor-man’s version of opticaltomography suitable for clouds. Only one sample of the space–time Green function allowed, but it can be assumed that theonly ‘anomaly’ to be located is the absorbing boundary of thecloud opposite the illuminated one, hence H . Also, we wishto estimate the volume-averaged scattering coefficient of thecloudy medium, hence σ = τ/H , which is a known quantity inthe biomedical application. The strong response of O2 A-bandproducts (i.e. 〈(ct)q〉F for q = 1, 2, 3, . . .) to 3D complexityin cloud structure is another manifestation of the crude butvaluable tomographic capability of radiative Green functionobservation.
It is too early to know how the atmospheric sciencecommunity at large will assimilate and use this new kindof information. What we do know, since section 4, is thatreflected A-band spectra will contain more cloud informationthan their transmitted counterparts. Conceivably, one couldretrieve H, τ, , ε, · · · or H, τ, α, · · ·, referring to internalstructure parameters used in previous subsections. Moreover,when we get such data from space, we will have globalcoverage of the daytime hemisphere. And for the nighttimeside of the orbit, a co-manifested MuSCL system (with a FOVsimilar to LITE’s) will hopefully be there to pick up the relay.
In view of the technicalities of Green function observationand the ensuing physics-based data processing, it is verylikely that—as in the medical profession for tomography—there will be a natural separation of labor into subject-matterexperts (remote sensing scientists) and end-users engaged inEarth-science endeavors that are much bigger than the remotesensing. Each type of individual will be easily identifiableand each individual will have distinctive passions. These sub-communities will have to understand intimately each other’sneeds and interests if Earth science is to benefit fully from thenew technology.
9. Summary and outlook
Driven by climate and remote sensing applications, wereviewed the physics underlying the transport of solar (andsome laser) radiation through the Earth’s cloudy atmosphere.We encountered along the way many challenging problemsstemming from (i) the spatial complexity of real clouds and(ii) the physical complexity of multiple-scattering processes.For each problem that presented itself, we discussed state-of-the-art solutions, emphasizing those that bring physicalinsights that can be used again and again. We discovered inparticular that Green functions play a key role in almost everyaspect of the phenomenology of 3D radiative transfer in andbetween the clouds, the aerosols, the gases and the surface.We also discovered that, even though the problem at handis steady-state, time-dependent radiation transport has provedvery helpful. After all, transport of radiant energy unfolds inspace, and time for that to happen is implicit.
One century ago, Peter Debye published a seminal paper[3] on scattering of EM waves by spheres, one at a time, andhis paper appeared only a year after the better-known one byGustav Mie [2]. Radiative transfer in 1D in the presence ofmultiple scattering is older, although maybe not by much, sinceit can be traced back at least to Arthur Schuster’s 1905 paper [4]on visibility through fog. At the time of writing, we crossthe significant milestone of a half-century of research in 3Dradiative transfer in spatially variable media such as clouds,which started (as far as we know) with Giovanelli’s landmark1959 paper [8] applying a perturbative diffusion theory of 3Dradiation transport to plane-parallel media with a regular sine-wave structure.
Taking a historical perspective on this development, wehave identified three phases and the associated thrusts continueto this day.
• First, there was a long period of damage assessmentsince 1D radiative transfer had become the de factostandard model in all the application areas, spanningfrom solar heating rate estimation for the energy cycle inclimate models to the translation of pixel-scale reflectedor transmitted solar radiances into inherent optical ormicrophysical cloud properties.
• Then came attempts to mitigate this damage since,realistically, we expect that 1D radiative transfer is notgoing away any time soon. At any rate, its statuswill slowly evolve from being the point of reference,simply because it is so popular, to being just one possibleapproximation to 3D reality that happens to simplifyradically the computations. Enhancements of its range ofvalidity via 3D–1D bias mitigation will help in practicalsituations.
• Finally, as our understanding of 3D radiative transferphenomena matures, we enter a new era where we embracethe spatial complexity and find ways to exploit inherently3D radiative transfer processes and thus re-invigorate thescience and technology of cloud remote sensing. Wehave every reason to believe that both passive and activemodalities will emerge, and we can already detect a trendtoward techniques that avoid the costly and cumbersomeneed for absolute radiometric calibration.
62

Rep. Prog. Phys. 73 (2010) 026801 A B Davis and A Marshak
At all three levels, the preliminary question about any specific3D radiative transfer problem at hand is whether the spatialvariability is resolved or unresolved, given the scale of interest.That scale can be either the computational grid constantor the remote sensing pixel size. Approaches for treatingunresolved variability invariably have a stochastic flavor (andoften analytical methods work well), while those we apply tocases of resolved variability are necessarily deterministic (andtypically lead to a computational scheme).
As part of a second generation of 3D radiative transferexperts, following in the steps of pioneers, the present authorsare confident that the field has a bright future. There areclear signs that the old paradigm grounded in stalwart 1Dradiative transfer is waning and that a new paradigm groundedin theoretical, computational and observational 3D radiativetransfer is gaining considerable momentum.
Acknowledgments
The author’s research described in this paper was supportedlargely by the Office of Biological and Environmental Researchof the US Department of Energy as part of the AtmosphericRadiation Measurement (ARM) Program. The authorsalso acknowledge sustained financial support from NASA’sRadiation Sciences Program and from the Laboratory DirectedResearch & Development (LDRD) Programs at the DOE’sLos Alamos National Laboratory. Most of the writing andpublication of this paper was supported by JPL/CalTech,under contract with NASA. The authors thank HowardBarker, Luc Bissonnette, Hartmut Bosch, Bob Cahalan,Brian Cairns, Christine Chiu, Jim Coakley, Dave Crisp,Roger Davies, Ed Eloranta, Frank Evans, Nicolas Ferlay,Pierre Flamant, Philip Gabriel, Mike Garay, Barry Ganapol,Larry di Girolamo, Mike Hall, Lee Harrison, Robin Hogan,Yongxiang Hu, Yuri Knyazikhin, Alexander Kokhanovsky,Alexander Kostinski, Ed Larsen, Paul Lawson, Norman Loeb,Steve Love, Bernhart Mayer, Charles Miller, Qilong Min,Michael Mishchenko, Jim Morel, Dennis O’Brien, LazarosOreopoulos, Klaus Pfeilsticker, Igor Polonsky, Christian vonSavigny, Jim Spinhirne, Graeme Stephens, Tamas Varnai,Mark Vaughan, Jim Weinman, Guoyong Wen, Dave Winker,Warren Wiscombe, Ping Yang, Yuekui Yang, Eleonora Zegeand Tobias Zinner for many fruitful discussions.
References
[1] Hamblyn R 2001 The Invention of Clouds: How an AmateurMeteorologist Forged the Language of the Skies(New York: Farrar, Straus, and Giroux)
[2] Mie G 1908 Beitrage zur Optik truber Medien, speziellkolloidaler Metallosungen Annal. Phys., Lpz. 330 377–445
[3] Debye P 1909 Der lichtdruck auf kugeln von beliebigemmaterial Annal. Phys., Lpz. 335 57–136
[4] Schuster A 1905 Radiation through a foggy atmosphereAstrophys. J. 21 1–22
[5] Lommel E 1887 Die photometrie der diffusen zuruchwerfungSitzber. Acad. Wiss. Munchen 17 95–124
[6] Chowlson O 1889 Grunzuge einer mathematischen theorieder inneren diffusion des lichtes Bull. Acad. Imp. Sci. St.Petersburg 33 221–56
[7] Chandrasekhar S 1950 Radiative Transfer (Oxford: OxfordUniversity Press) (reprinted by (New York: Dover))
[8] Giovanelli R G 1959 Radiative transfer in non-uniform mediaAust. J. Phys. 12 164–70
[9] Richards P I 1956 Scattering from a point-source in planeclouds J. Opt. Soc. Am. 46 927–34
[10] Chandrasekhar S 1958 On the diffuse reflection of a pencil ofradiation by a plane-parallel atmosphere Proc. Natl Acad.Sci. USA 44 933–40
[11] Solomon S, Qin D and Manning M (ed) 2007 ClimateChange 2007 The Physical Science Basis (Geneva:Intergovernmental Panel on Climate Change)
[12] Barker H W and 31 co-authors 2003 Assessing 1Datmospheric solar radiative transfer models: interpretationand handling of unresolved clouds J. Clim. 16 2676–99
[13] Randall D A, Khairoutdinov M, Arakawa A andGrabowski W 2003 Breaking the cloud-parameterizationdeadlock Bull. Am. Meteorol. Soc. 84 1547–64
[14] Tao W-K et al 2009 A multiscale modeling system:developments, applications, and critical issues Bull. Am.Meteorol. Soc. 90 515–34
[15] Albrecht B A 1989 Aerosols, cloud microphysics, andfractional cloudiness Science 245 1227–30
[16] Twomey S A 1991 Aerosols, clouds and radiation Atmos.Environ. A 25 2435–42
[17] Ramanathan V 2001 Aerosols, climate, and the hydrologicalcycle. Science 294 2119
[18] Mishchenko M I, Cairns B, Kopp G, Schueler C F,Fafaul B A, Hansen J E, Hooker R J, Itchkawich T,Maring H B and Travis L D 2007 Accurate monitoring ofterrestrial aerosols and total solar irradiance: introducingthe glory mission Bull. Am. Meteorol. Soc. 88 677–91
[19] Diner D J, Davis A, Hancock B, Gutt G, Chipman R A andCairns B 2007 Dual photoelastic modulator-basedpolarimetric imaging concept for aerosol remote sensingAppl. Opt. 46 8428–45
[20] Stephens G L et al and the CloudSat Science Team 2002 TheCloudSat mission and the A-train Bull. Am. Meteorol. Soc.83 1771–90
[21] Evans K F, Lawson R P, Zmarzly P and O’Connor D 2003In situ cloud sensing with multiple scattering cloud lidar:simulations and demonstration. J. Atmos. Ocean. Technol.20 1505–22
[22] Evans K F, O’Connor D, Zmarzly P and Lawson R P 2006In situ cloud sensing with multiple scattering cloud lidar:design and validation of an airborne sensor J. Atmos.Ocean. Technol. 23 1068–81
[23] Barkstrom B, Harrison E, Smith G, Green R, Kibler J, Cess Rand the ERBE Science Team 1989 Earth Radiation BudgetExperiment (ERBE) archival and April 1985 results Bull.Am. Meteorol. Soc. 70 1254–62
[24] Wielicki B A, Barkstrom B R, Harrison E F, Lee R B,Louis Smith G and Cooper J E 1996 Clouds and the Earth’sRadiant Energy System (CERES): an Earth ObservingSystem experiment Bull. Am. Meteorol. Soc. 77 853–68
[25] Kurucz R L, Furenlid I, Brault J and Testerman L (ed) 1984Solar Flux Atlas from 296 to 1300 nm 2nd edn (Sunspot,NM: National Solar Observatory)
[26] Anderson D E and Cahalan R F 2005 The SOlar radiation andClimate Experiment (SORCE) mission for the NASAEarth Observing System (EOS) Solar Phys. 203 3–6
[27] Loeb N G, Kato S and Wielicki B A 2002 Definingtop-of-the-atmosphere flux reference level for Earthradiation budget studies J. Clim. 15 3301–9
[28] Collins W D, Valero F P J, Flatau P J, Lubin D, Grassl H andPilewskie P 1996 Radiative effects of convection in thetropical Pacific J. Geophys. Res. D 101 14999–5012
[29] Fu Q and Liou K N 1993 Parameterization of the radiativeproperties of cirrus clouds J. Atmos. Sci. 50 2008–25
63

Rep. Prog. Phys. 73 (2010) 026801 A B Davis and A Marshak
[30] Li J and Barker H W 2005 A radiation algorithm withcorrelated-k distribution: I. Local thermal equilibrium J.Atmos. Sci. 62 286–309
[31] Bartle R G 1995 The Elements of Integration and LebesgueMeasure (New York: Wiley)
[32] Goody R M and Yung Y L 1989 Atmospheric RadiationTheoretical Basis (New York: Oxford University Press)
[33] Cox C and Munk W 1954 Measurement of the roughness ofthe sea surface from photographs of the sun’s glitter J. Opt.Soc. Am. 44 838–50
[34] Coakley J A Jr, Bernstein R L and Durkee P A 1987 Effect ofship-stack effluents on cloud reflectivity Science237 1020–2
[35] Nussenzveig H M 1992 Diffraction Effects in SemiclassicalScattering (Cambridge: Cambridge University Press)
[36] Bohren C F and Huffman D R 1983 Absorption andScattering of Light by Small Particles (New York: Wiley)
[37] Mishchenko M I, Travis L D and Lacis A A (ed) 2002Scattering, Absorption, and Emission of Light by SmallParticles (Cambridge: Cambridge University Press)
[38] Deirmendjian D 1969 Electromagnetic Scattering onSpherical Polydispersions (New York: Elsevier)
[39] Warren S G 1984 Optical constants of ice from the ultravioletto the microwave Appl. Opt. 23 1206–25
[40] Grenfell T C and Warren S G 1999 Representation of anon-spherical ice particle by an assembly of spheres J.Geophys. Res. D 104 31697–709
[41] Takano Y and Jayaweera K 1985 Scattering phase matrix forhexagonal ice crystals computed from ray optics Appl.Opt. 24 3254–63
[42] Macke A 1993 Scattering of light by polyhedral ice crystalsAppl. Opt. 32 2780–8
[43] Mishchenko M I and Travis L D 1994 T-matrix computationsof light scattering by large spheroidal particles Opt.Commun. 109 16–21
[44] Mishchenko M I, Travis L D and Mackowski D W 1996T-matrix computations of light scattering by non-sphericalparticles J. Quant. Spectrosc. Radiat. Transfer 55 535–76
[45] Yang P and Liou K N 1996 Finite-difference time domainmethod for light scattering by small ice crystals inthree-dimensional space J. Opt. Soc. Am. A 13 2072–85
[46] Mishchenko M I, Hovenier J W and Travis L D (ed) 2000Light Scattering by Nonspherical Particles: Theory,Measurements, and Applications (San Diego, CA:Academic)
[47] Born M and Wolf E 1999 Principles of Optics:Electromagnetic Theory of Propagation, Interference andDiffraction of Light 7th expanded edn (New York:Cambridge University Press)
[48] Hansen J E and Travis L D 1974 Light-scattering in planetaryatmospheres Space Sci. Rev. 16 527–610
[49] Mishchenko M I 2002 Vector radiative transfer equation forarbitrarily shaped and arbitrarily oriented particles: amicrophysical derivation from statistical electromagneticsAppl. Opt. 41 7114–35
[50] Mishchenko M I 2006 Radiative transfer in clouds withsmall-scale inhomogeneities: the microphysicalapproach Geophys. Res. Lett. 33 L14820
[51] Mishchenko M I 2008 Multiple scattering, radiative transfer,and weak localization in discrete random media: unifiedmicrophysical approach Rev. Geophys. 46 RG2003
[52] Mihalas D 1979 Stellar Atmospheres 2nd edn (San Francisco,CA: Freeman)
[53] Kostinski A B 2001 On the extinction of radiation by ahomogeneous but spatially correlated random medium J.Opt. Soc. Am. A 18 1929–33
[54] Davis A B and Marshak A 2004 Photon propagation inheterogeneous optical media with spatial correlations:enhanced mean-free-paths and wider-than-exponential
free-path distributions J. Quant. Spectrosc. Radiat.Transfer 84 3–34
[55] Eddington A S 1916 On the radiative equilibrium of starsMon. Not. R. Astron. Soc. 77 16–35
[56] Gerber H, Takano Y, Garrett T J and Hobbs P V 2000Nephelometer measurements of the asymmetryparameter, volume extinction coefficient, andbackscatter ratio in arctic clouds J. Atmos. Sci.57 3021–34
[57] Baran A J, Francis P N, Labonnote L C andDoutriaux-Boucher M 2001 A scattering phase functionfor ice cloud: Tests of applicability using aircraft andsatellite multi-angle multi-wavelength radiancemeasurements of cirrus Q. J. R. Meteorol. Soc.127 2395–416
[58] Baran A J 2009 A review of the light scattering properties ofcirrus J. Quant. Spectrosc. Radiat. Transfer 110 1239–60
[59] Polonsky I N and Davis A B 2005 Off-beam cloud lidar: anew diffusion model and an analysis of lite returnsTechnical Report LA-UR-05-0794 Los Alamos NationalLaboratory, Los Alamos (NM)
[60] Larsen E W 1980 Diffusion theory as an asymptoticlimit of dtransport theory for nearly critical systems withsmall mean free paths Annal Nucl. Energy 7 249–55
[61] Pomraning G C 1989 Diffusion theory via asymptoticsTransp. Theory and Stat. Phys. 18 383–428
[62] Davis A and Marshak A 1997 Levy kinetics in slabgeometry: scaling of transmission probability FractalFrontiers ed M M Novak and T G Dewey (Singapore:World Scientific) pp 63–72
[63] Davis A B 2006 Effective propagation kernels in structuredmedia with broad spatial correlations, illustration withlarge-scale transport of solar photons through cloudyatmospheres Computational Methods inTransport—Granlibakken 2004 (Lecture Notes inComputational Science and Engineering vol 48)ed F Graziani (New York: Springer) pp 84–140
[64] Joseph J H, Wiscombe W J and Weinman J A 1976 Thedelta-Eddington approximation for radiative flux transferJ. Atmos. Sci. 33 2452–9
[65] Henyey L C and Greenstein J L 1941 Diffuse radiation in thegalaxy Astrophys. J. 93 70–83
[66] Nicodemus F E, Richmond J C, Hsia J J, Ginsberg I W andLimperis T 1977 Geometrical considerations andnomenclature for reflectance Technical Report NBSMonograph No 160 (Washington, DC: National Bureau ofStandards)
[67] Martonchik J V, Bruegge C J and Strahler A 2000 A reviewof reflectance nomenclature used in remote sensingRemote Sens. Rev. 19 9–20
[68] Lenoble J (ed) 1985 Radiative Transfer in Scattering andAbsorbing Atmospheres: Standard ComputationalProcedures (Hampton, VA: Deepak)
[69] Stephens G L 1978 Radiation profile in extended waterclouds: I. Theory J. Atmos. Sci. 35 2111–22
[70] Meador W E and Weaver W R 1980 Two-streamapproximations to radiative transfer in planetaryatmospheres: a unified description of existing methods anda new improvement J. Atmos. Sci. 37 630–43
[71] Takano Y and Liou K N 1989 Solar radiative transfer incirrus clouds: I. Single-scattering and optical properties ofhexagonal ice crystals J. Atmos. Sci. 46 3–18
[72] Li J and Ramaswamy V 1996 Four-stream sphericalharmonic expansion approximation for solar radiativetransfer J. Atmos. Sci. 53 1174–86
[73] Lu P, Zhang H and Li J 2009 A comparison of two-streamDISORT and Eddington radiative transfer schemes in areal atmospheric profile J. Quant. Spectrosc. Radiat.Transfer 110 129–38
64

Rep. Prog. Phys. 73 (2010) 026801 A B Davis and A Marshak
[74] Coakley J A Jr and Chylek P 1975 The two-streamapproximation in radiative transfer: including the angle ofthe incident radiation J. Atmos. Sci. 32 409–18
[75] Dickinson R E, Zhou L, Tian Y, Liu Q, Lavergne T, Pinty B,Schaaf C B and Knyazikhin Y 2008 A three-dimensionalanalytic model for the scattering of a spherical bushJ. Geophys. Res. 113 D20113
[76] Bohren C F, Linskens J R and Churma M E 1995 At whatoptical thickness does a cloud completely obscure the sun?J. Atmos. Sci. 52 1257–9
[77] Tape W 1994 Atmospheric Halos (Antarctic Research SeriesNumber 64) (Washington, DC: American GeophysicalUnion)
[78] Stephens G L 1978 Radiation profile in extended waterclouds: II. Parameterization schemes J. Atmos. Sci.35 2123–32
[79] Welch R M and Zdunkowski W G 1982 Backscatteringapproximations and their influence on Eddington-typesolar flux calculations Contrib. Atmos. Phys. 55 28–42
[80] King M D and Harshvardhan 1986 Comparative accuracy ofselected multiple scattering approximations J. Atmos. Sci.43 784–801
[81] Kokhanovsky A A 2006 Asymptotic radiative transfer LightScattering Reviews vol 1, ed A A Kokhanovsky (Berlin:Springer) pp 253–89
[82] Stamnes K, Tsay S-C, Wiscombe W J and Jayaweera K 1988Numerically stable algorithm for discrete-ordinate-methodradiative transfer in multiple scattering and emittinglayered media Appl. Opt. 27 2502–09
[83] Garcia R and Siewert C 1985 Benchmark results in radiativetransfer Transp. Theory Stat. Phys. 14 437–84
[84] Chiu J C, Marshak A, Wiscombe W J, Valencia S C andWelton E J 2007 Cloud optical depth retrievals from solarbackground signals of micropulse lidars IEEE Geosc.Remote Sens. Lett. 4 456–60
[85] Yang Y, Marshak A, Chiu J C, Wiscombe W J, Palm S P,Davis A B, Spangenberg D A, Nguyen L, Spinhirne J andMinnis P 2008 Calibration of solar background signal forretrievals of cloud optical depth from the GeoscienceLaser Altimeter System (GLAS) J. Atmos. Sci. 653531–27 (doi:10.1175/2008JAS2744.1)
[86] Spinhirne J D, Rall J A R and Scott V S 1995 Compacteye-safe lidar systems Rev. Laser Eng. 23 112–8
[87] Welton E J, Voss K J, Quinn P K, Flatau P J, Markowicz K,Campbell J R, Spinhirne J D, Gordon H R and Johnson J E2002 Measurements of aerosol vertical profiles and opticalproperties during INDOEX 1999 using micropulse lidarsJ. Geophys. Res. D 107 D8019
[88] Campbell J R, Hlavka D L, Welton E J, Flynn C J,Turner D D, J.D. Spinhirne, Scott V S and Hwang I H2002 Full-time, eye-safe cloud and aerosol lidarobservation at Atmospheric Radiation Measurementprogram sites: instruments and data processing J. Atmos.Ocean. Technol. 19 431–42
[89] Welton E J and Campbell J R 2002 Micropulse lidar signals:uncertainty analysis J. Atmos. Ocean. Technol. 19 2089–94
[90] Marshak A, Knyazikhin Y, Evans K D and Wiscombe W J2004 The ‘red versus nir’ plane to retrieve broken-cloudoptical depth from ground-based measurements J. Atmos.Sci. 61 1911–25
[91] Chiu J C, Marshak A, Knyazikhin Y, Wiscombe W J,Barker H W, Barnard J C and Luo Y 2006 Remote sensingof cloud properties using ground-based measurements ofzenith radiance J. Geophys. Res. D 111 D16201
[92] Holben B N et al 1998 AERONET—a federated instrumentnetwork and data archive for aerosol characterizationRemote Sens. Environ. 66 1–16
[93] Chiu J C, Huang C-H, Marshak A, Slutsker I, Giles D M,Holben B N, Knyazikhin Y and Wiscombe W J 2009
Cloud optical depth retrievals from the Aerosol RoboticNetwork (AERONET) cloud mode observations J.Geophys. Res. at press
[94] Davies R 1978 The effect of finite geometry on thethree-dimensional transfer of solar irradiance in clouds J.Atmos. Sci. 35 1712–25
[95] Preisendorfer R W and Stephens G L 1984 Multimoderadiative transfer in finite optical media: I. FundamentalsJ. Atmos. Sci. 41 709–24
[96] Stephens G L and Preisendorfer R W 1984 Multimoderadiative transfer in finite optical media: II. Solutions J.Atmos. Sci. 41 725–35
[97] Barkstrom B R and Arduini R F 1977 The effect of finite sizeof clouds upon the visual albedo of the Earth Radiation inthe Atmosphere ed H-J Bolle (Princeton, NJ: SciencePress) pp 188–90
[98] Davis A B 2002 Cloud remote sensing with sideways-looks:theory and first results using Multispectral ThermalImager (MTI) data SPIE Proc. 4725 397–405
[99] Ganapol B D, Kornreich D E, Dahl J A, Nigg D W,Jahshan S N and Temple C A 1994 The searchlightproblem for neutrons in a semi-infinite medium Nucl. Sci.Eng. 118 38–53
[100] Kornreich D E and Ganapol B D 1997 Numerical evaluationof the three-dimensional searchlight problem in ahalf-space Nucl. Sci. Eng. 127 317–37
[101] Machida M, Panasyuk G Y, Schotland J C and Markel V A2009 Green’s function for the radiative transport equationin slab geometry J. Phys. A: Math. Gen. at press
[102] Zege E P, Ivanov A P and Katsev I L 1991 Image TransferThrough a Scattering Medium (Heidelberg: Springer)
[103] Polonsky I N and Davis A B 2004 Lateral photon transport indense scattering and weakly absorbing media of finitethickness: asymtotic analysis of the space–time Greenfunction J. Opt. Soc. Am. A 21 1018–25
[104] Feller W 1971 An Introduction to Probability Theory and itsApplications vol 1 and 2 (New York: Wiley)
[105] Davis A B, Cahalan R F, Spinehirne J D, McGill M J andLove S P 1999 Off-beam lidar: an emerging technique incloud remote sensing based on radiative Green-functiontheory in the diffusion domain Phys. Chem. Earth B24 177–85
Davies A B, Cahalan R F, Spinhirne J D, McGill M J andLove S P 1999 Off-beam lidar: an emerging technique incloud remote sensing based on radiative Green-functiontheory in the diffusion domain Phys. Chem. Earth B24 757–65 (erratum)
[106] Davis A B and Marshak A 2002 Space-time characteristics oflight transmitted through dense clouds: a Green’s functionanalysis J. Atmos. Sci. 59 2713–27
[107] Davis A B 2008 Multiple-scattering lidar from both sidesof the clouds: Addressing internal structure J. Geophys.Res. D 113 14S10
[108] Davis A B, Polonsky I N and Marshak A 2009 Space-timeGreen functions for diffusive radiation transport, inapplication to active and passive cloud probing LightScattering Rev. vol 4, ed A A Kokhanovsky (Heidelberg:Springer) pp 169–292
[109] Clothiaux E E, Miller M A, Albrecht B A, Ackerman T P,Verlinde J, Babb D M, Peters R M and Syrett W J 1995 Anevaluation of a 94 GHz radar for remote sensing of cloudproperties J. Atmos. Ocean. Technol. 12 201–29
[110] Cahalan R F, McGill M J, Kolasinski J, Varnai T andYetzer K 2005 THOR, cloud THickness from Offbeamlidar Returns J. Atmos. Ocean. Techol. 22 605–27
[111] Polonsky I N, Love S P and Davis A B 2005 Wide-angleimaging lidar deployment at the ARM Southern GreatPlains site: intercomparison of cloud property retrievals J.Atmos. Ocean. Technol. 22 628–48
65
Rep. Prog. Phys. 73 (2010) 026801 A B Davis and A Marshak
[112] Redner S 2001 A Guide to First-Passage Processes(Cambridge: Cambridge University Press)
[113] Chandrasekhar S 1943 Stochastic problems in physics andastronomy Rev. Mod. Phys. 15 1–89
[114] Barker H W and Davis A B 2005 Approximation methods inatmospheric 3D radiative transfer: II. Unresolvedvariability and climate applications 3D Radiative Transferin Cloudy Atmospheres (Heidelberg: Springer)ed A Marshak and A B Davis pp 343–83 chapter 6
[115] Cahalan R F 1994 Bounded cascade clouds: Albedoand effective thickness Nonlinear Proc. Geophys.1 156–67
[116] Jensen J L W V 1906 Sur les fonctions convexes et lesinegalities entre les valeurs moyennes Acta Math.30 175–93
[117] Tiedtke M 1996 An extension of cloud-radiationparameterization in the ECMWF model: therepresentation of subgridscale variations in optical depthMon. Weather Rev. 124 745–50
[118] Cairns B, Lacis A A and Carlson B E 2000 Absorption withininhomogeneous clouds and its parameterization in generalcirculation models J. Atmos. Sci. 57 700–14
[119] Rossow W B, Delo C and Cairns B 2002 Implications of theobserved mesoscale variations of clouds for the Earth’sradiation budget J. Clim. 15 557–85
[120] Rossow W B and Schiffer R A 1999 Advances inunderstanding clouds from ISCCP Bull. Am. Meteorol.Soc. 80 2261–87
[121] Davis A B and Marshak A 2001 Multiple scattering inclouds: Insights from three-dimensional diffusion/P1
theory Nucl. Sci. Eng. 137 251–80[122] Di Girolamo L and Davies R 1997 Cloud fraction errors
caused by finite resolution measurements J. Geophys. Res.D 102 1739–56
[123] Cahalan R F, Ridgway W, Wiscombe W J, Bell T L andSnider J B 1994 The albedo of fractal stratocumulusclouds J. Atmos. Sci. 51 2434–55
[124] Cahalan R F, Ridgway W, Wiscombe W J, Gollmer S andHarshvardhan 1994 Independent pixel and Monte Carloestimates of stratocumulus albedo J. Atmos. Sci.51 3776–90
[125] Harshvardhan and Randall D 1985 Comments on ‘Theparameterization of radiation for numerical weatherprediction and climate models’ Mon. Weather Rev.113 1832–3
[126] Stephens G L 1985 Mon. Weather Rev. 113 1834–5 (Replyto Harshvardhan and Randall)
[127] Barker H W 1996 A parameterization for computinggrid-averaged solar fluxes for inhomogeneous marineboundary layer clouds: I. Methodology and homogeneousbiases J. Atmos. Sci. 53 2289–303
[128] Barker H W, Wielicki B A and Parker L 1996 Aparameterization for computing grid-averaged solar fluxesfor inhomogeneous marine boundary layer clouds: II.Validation using satellite data J. Atmos. Sci. 53 2304–16
[129] Oreopoulos L and Barker H W 1999 Accounting forsubgrid-scale cloud variability in a multi-layer, 1D solarradiative transfer algorithm Q. J. R. Meteorol. Soc.125 301–30
[130] Avaste O A and Vainikko G M 1974 Solar radiative transferin broken clouds Izv. Acad. Sci. USSR Atmos. Ocean. Phys.10 1054–61
[131] Titov G A 1990 Statistical description of radiation transfer inclouds J. Atmos. Sci. 47 24–38
[132] Kassianov E 2002 Stochastic radiative transfer in multilayerbroken clouds: I. Markovian approach J. Quant.Spectrosc. Radiat. Transfer 75 373–93
[133] Kassianov E, Ackerman T P, Marchand R andOvtchinnikov M 2002 Stochastic radiative transfer in
multilayer broken clouds: II. Validation testsJ. Quant. Spectrosc. Radiat. Transfer 75 375–416
[134] Lane D E, Goris K and Somerville R C 2002 Radiativetransfer through broken clouds: observations and modelvalidation J. Clim. 15 2921–33
[135] Zhuravleva T and Marshak A 2005 On the validation of thePoisson model of broken clouds Izv. Atmos. Ocean. Phys.41 713–25
[136] Byrne R N, Somerville R C J and Subasilar B 1996Broken-cloud enhancement of solar radiation absorption J.Atmos. Sci. 53 878–86
[137] Marshak A, Wen G, Coakley J A Jr, Remer L A, Loeb N Gand Cahalan R F 2008 A simple model of the cloudadjacency effect and the apparent bluing of aerosols nearclouds J. Geophys. Res. D 113 D14S17
[138] Pomraning G C 1986 Transport and diffusion in a statisticalmedium. Transp. Theory Stat. Phys. 5 773–802
[139] Levermore C D, Pomraning G C, Sanzo D L and Wong J1986 Linear transport theory in a random medium J. Math.Phys. 27 2526–36
[140] Malvagi F, Byrne R N, Pomraning G C and Somerville R C J1993 Stochastic radiative transfer in a partially cloudyatmosphere J. Atmos. Sci. 50 2146–58
[141] Stephens G L 1988 Radiative transfer through arbitraryshaped optical media: II. Group theory J. Atmos. Sci.45 1837–49
[142] Stephens G L 1988 Radiative transfer through arbitraryshaped optical media: I. A general method of solution J.Atmos. Sci. 45 1818–36
[143] Samorodnitsky G and Taqqu M S 1994 Stable Non-GaussianRandom Processes (New York: Chapman and Hall)
[144] Levy P 1937 Theorie de l’Addition des Variables Aleatoires(Paris: Gauthier Villars)
[145] Davis A B and Polonsky I N 2005 Approximation methods inatmospheric 3D radiative transfer: II. Resolved variabilityand phenomenology 3D Radiative Transfer in CloudyAtmospheres ed A Marshak and A B Davis (Heidelberg:Springer) pp 283–340 chapter 5
[146] Huang D, Liu Y and Wiscombe W J 2008 Determination ofcloud liquid water distribution using 3D cloud tomographyJ. Geophys. Res. D 113 D13201
[147] Marshak A, Davis A, Cahalan R F and Wiscombe W J 1994Bounded cascade models as non-stationary multifractalsPhys. Rev. E 49 55–69
[148] Davis A B, Marshak A, Gerber H and Wiscombe W J 1999Horizontal structure of marine boundary-layer clouds fromcm- to km-scales J. Geophys. Res. D 104 6123–44
[149] Schertzer D and Lovejoy S 1987 Physical modeling andanalysis of rain and clouds by anisotropic scalingmultiplicative processes J. Geophys. Res. 92 9693–714
[150] Marshak A and Davis A B 2005 Scale-by-scale analysis andfractal cloud models 3D Radiative Transfer in CloudyAtmospheres ed A Marshak and A B Davis (Heidelberg:Springer) pp 653–63
[151] Cahalan R F and Snider J B 1989 Marine stratocumulusstructure during FIRE Remote Sens. Environ.28 95–107
[152] Cahalan R F, Silberstein D and Snider J 1995 Liquid waterpath and plane-parallel albedo bias during ASTEX J.Atmos. Sci. 52 3002–12
[153] Marshak A, Davis A, Wiscombe W J and Titov G 1995 Theverisimilitude of the independent pixel approximation usedin cloud remote sensing Remote Sens. Environ. 52 72–8
[154] Evans K F and Wiscombe W J 2004 An algorithm forgenerating stochastic cloud fields from radar profilestatistics Atmos. Res. 72 263–89
[155] Hogan R J and Kew S F 2005 A 3D stochastic cloud modelfor investigating the radiative properties of inhomogeneouscirrus clouds Q. J. R. Meteorol. Soc. 131 2585–608
66

Rep. Prog. Phys. 73 (2010) 026801 A B Davis and A Marshak
[156] Schmidt K S, Venema V, Di Giuseppe F, Scheirer R,Wendisch M and Pilewski P 2007 Reproducing cloudmicrophysics and irradiance measurements using three 3Dcloud generators Q. J. R. Meteorol. Soc. 133 765–80
[157] Venema V, Meyer S, Garcia S G, Kniffka A, Simmer C,Crewell S, Lohnert U, Trautmann T and Macke A 2006Surrogate cloud fields generated with the iterativeamplitude adapted Fourier transform algorithm Tellus. Ser.A, Dyn. Meteorol. Oceangr. 58 104–20
[158] Prigarin S and Marshak A 2009 A simple stochastic modelfor generating broken cloud optical depth and cloud-topheight fields J. Atmos. Sci. 66 92–104
[159] Siebesma A P and Jonker H J J 2000 Anomalous scaling ofcumulus cloud boundaries Phys. Rev. Lett.85 214–7
[160] Evans K F and Marshak A 2005 Numerical methods 3DRadiative Transfer in Cloudy Atmospheres ed A Marshakand A B Davis (Heidelberg: Springer) pp 243–81 chapter 4
[161] Cahalan R F and 26 co-authors 2005 The internationalIntercomparison of 3D Radiation Codes (I3RC):bringing together the most advanced radiative transfertools for cloudy atmospheres Bull. Am. Meteorol. Soc.86 1275–93
[162] Kalos M H 1963 Importance sampling in Monte Carloshielding calculations. I. Neutron penetration throughthick hydrogen slabs Nucl. Sci. Eng. 16 227–34
[163] Ueki T and Larsen E W 1996 Deterministic theory of MonteCarlo variance Trans. Am. Nucl. Soc. 75 133–5
[164] Case K M and Zweifel P F 1967 Linear Transport Theory(Reading, MA: Addison-Wesley)
[165] Vladimirov V 1963 Mathematical Problems in theOne-Velocity Theory of Particle Transport AECL-1661,At. Energy of Can. Ltd
[166] Bal G 2009 Inverse transport theory and applications InverseProblems 25 055006
[167] Larsen E W 1982 Unconditionally stable diffusion syntheticacceleration methods for the slab geometry discreteordinates equations: I. Theory Nucl. Sci. Eng. 82 47
[168] Ramone G L, Adams M L and Nowak P F 1997 A transportsynthetic acceleration method for transport iterations Nucl.Sci. Eng. 125 257
[169] Balsara D 2001 Fast and accurate discrete ordinate methodsfor multidimensional radiative transfer: I. Basic methodsJ. Quant. Spectrosc. Radiat. Transfer 69 671–707
[170] Evans K F 1998 The spherical harmonics discrete ordinatemethod for three-dimensional atmospheric radiativetransfer J. Atmos. Sci. 55 429–46
[171] Evans K F 1993 Two-dimensional radiative transfer in cloudyatmospheres: the spherical harmonic spatial grid methodJ. Atmos. Sci. 50 3111–24
[172] Trasi N S, de Oliveira C R E and Haigh J D 2004 A finiteelement spherical harmonics model for radiative transferin inhomogeneous clouds: I. The EVENT model Atmos.Res. 72 197–221
[173] Cook P A, de Oliveira C R E, Haigh J D and Goddard A J2004 A finite element spherical harmonics model forradiative transfer in inhomogeneous clouds: II. Someapplications Atmos. Res. 72 223–37
[174] Nikolaeva O V, Bass L P, Germogenova T A,Kokhanovisky A A, Kuznetsov V S and Mayer B 2005The influence of neighboring clouds on the clear skyreflectance with the 3-D transport code RADUGA J.Quant. Spectrosc. Radiat. Transfer 94 405–24
[175] Ferlay N and Isaka H 2006 Multiresolutionanalysis of radiative transfer throughinhomogeneous media: I. Theoreticaldevelopment J. Atmos. Sci. 63 1200–12
[176] Ferlay N, Isaka H, Gabriel P and Benassi A 2006Multiresolution analysis of radiative transfer through
inhomogeneous media: II. Validation and new insights J.Atmos. Sci. 63 1213–30
[177] Stephens G L 1986 Radiative transfer in spatiallyheterogeneous, two-dimensional anisotropically scatteringmedia J. Quant. Spectrosc. Radiat. Transfer 36 51–67
[178] Davis A, Marshak A, Cahalan R F and Wiscombe W J 1997The Landsat scale break in stratocumulus as athree-dimensional radiative transfer effect: Implicationsfor cloud remote sensing J. Atmos. Sci. 54 241–60
[179] Marchuk G I 1995 Adjoint Equations and Analysis ofComplex Systems (Norwell, MA: Kluwer Academic)
[180] Pincus R and Evans K F 2009 Computational cost andaccuracy in calculating three-dimensional radiativetransfer: results for new implementations ofMonte Carlo and SHDOM J. Atmos. Sci. 66 3131–46
[181] Sobol I M 1974 The Monte Carlo Method (Chicago, IL:University of Chicago Press)
[182] Spanier J 1995 Quasi-Monte Carlo Methods for ParticleTransport Problems (Lecture Notes in StatisticsNumber 106) (New York: Springer)
[183] Marchuk G I, Mikhailov G, Nazaraliev M, Darbinjan R,Kargin B and Elepov B 1980 The Monte Carlo Methods inAtmospheric Optics (New York: Springer)
[184] Iwabuchi H 2006 Efficient Monte Carlo methods for radiativetransfer modeling J. Atmos. Sci. 63 2324–39
[185] Varnai T and Marshak A 2009 MODIS observations ofenhanced clear sky reflectance near clouds Geophys. Res.Lett. 36 L06807
[186] King M D, Radke L F and Hobbs P V 1990 Determination ofthe spectral absorption of solar radiation by marinestratocumulus clouds from airborne measurements withinclouds J. Atmos. Sci. 47 894–907
[187] Cannon C J 1970 Line transfer in two dimensions Astrophys.J. 161 255–64
[188] Stephens G L, Gabriel P M and Partain P T 2001Parameterization of atmospheric radiative transfer: I.Validity of simple models J. Atmos. Sci.58 3391–409
[189] Gabriel P M, Partain P T and Stephens G L 2001Parameterization of atmospheric radiative transfer: II.Selection rules J. Atmos. Sci. 58 3311–423
[190] Stephens G L, Wood N B and Gabriel P M 2004 Anassessment of the parameterization of subgrid-scale cloudeffects on radiative transfer: I: Vertical overlap J. Atmos.Sci. 61 715–32
[191] Wood N B, Gabriel P M and Stephens G L 2005 Anassessment of the parameterization of subgrid-scale cloudeffects on radiative transfer: II. Horizontal inhomogeneityJ. Atmos. Sci. 62 2895–909
[192] Mechem D B, Kogan Y L, Ovtchinnikov M, Davis A B,Evans K F, and Ellingson R G 2008 Multidimensionallongwave forcing of boundary layer cloud systemsJ. Atmos. Sci. 65 3963–77
[193] Skamarock W C, Klemp J B, Dudhia J, Gill D O,Barker D M, Duda M G, Huang X-Y, Wang W andPowers J G 2008 A description of the Advanced ResearchWRF, Version 3 Technical Report NCAR/TN475 + STR,National Center for Atmospheric Research TECHNICALNOTE, Boulder (CO)
[194] Cox S K, McDougal D S, Randall D A and Schiffer R A 1987FIRE – The First ISCCP Regional Experiment Bull. Am.Meteorol. Soc. 68 114–18
[195] Lovejoy S, Schertzer D, Silas P, Tessier Y and Lavallee D1993 The unified scaling model of atmospheric dynamicsand systematic analysis of scale invariance in cloudradiances Ann. Geophys. 11 119–27
[196] Marshak A, Davis A, Wiscomb W J and Cahalan R F 1995Radiative smoothing in fractal clouds J. Geophys. Res. D100 26247–61
67

Rep. Prog. Phys. 73 (2010) 026801 A B Davis and A Marshak
[197] Zuidema P and Evans K F 1998 On the validity of theindependent pixel approximation for the boundary layerclouds observed during ASTEX J. Geophys. Res. D103 6059–74
[198] Oreopoulos L, Marshak A, Cahalan R F and Wen G 2000Cloud three-dimensional effects evidenced in Landsatspatial power spectra and autocorrelation function J.Geophys. Res. D 105 14777–88
[199] von Savigny C, Funk O, Platt U and Pfeilsticker K 1999Radiative smoothing in zenith-scattered sky lighttransmitted through clouds to the ground Geophys. Res.Lett. 26 2949–52
[200] von Savigny C, Davis A B, Funk O and Pfeilsticker K 2002Large-scale stationarity in time-series of zenith radianceunder cloudy skies Geophys. Res. Lett. 29 1825
[201] Papoulis A and Pillai S U 2001 Probability, RandomVariables and Stochastic Processes (New York:McGraw-Hill Science/Engineering/Mathematics)
[202] Gabriel P, Barker H W, O’Brien D, Ferlay N andStephens G L 2009 Statistical approaches to erroridentification for plane-parallel retievals of optical andmicrophysical properties of three-dimensional clouds:Baysian inference J. Geophys. Res. D 114 06207
[203] Horvath A and Davies R 2004 Simultaneous retrieval ofcloud motion and height from polar-orbiter multianglemeasurements Geophys. Res. Lett. 31 L01102
[204] Diner D J et al 1998 Multi-angle Imaging SpectroRadiometer(MISR) instrument description and experiment overviewIEEE Trans. Geosci. Remote Sens. 36 1072–87
[205] Varnai T and Marshak A 2002 Observations ofthree-dimensional radiative effects that influence MODIScloud optical thickness retrievals J. Atmos. Sci. 59 1607–18
[206] Nakajima T and King M D 1990 Determination of opticalthickness and effective radius of clouds from reflectedsolar radiation measurements: I. Theory J. Atmos. Sci.47 1878–93
[207] Varnai T and Marshak A 2001 Statistical analysis of theuncertainties in cloud optical depth retrievals caused bythree-dimensional radiative effects J. Atmos. Sci.58 1540–8
[208] Zinner T and Mayer B 2006 Remote sensing ofstratocumulus clouds: uncertainty and biases due toinhomogeneity J. Geophys. Res. D 111 D14209
[209] Mayer B 2009 Radiative transfer in the cloudy atmosphereEur. Phys. J. Conf. 1 75–99
[210] Kato S and Marshak A 2008 Solar zenith and viewinggeometry dependent errors in satellite retrieved cloudoptical thickness: marine stratocumulus case J. Geophys.Res. D 114 01202
[211] Stevens B and Lenschow D H 2001 Observations,experiments, and large eddy simulations Bull. Am.Meteorol. Soc. 82 283–94
[212] Platnick S, King M D, Ackerman S A, Menzel W P,Baum B A, Riedi J C and Frey R A 2003 The MODIScloud products: algorithms and examples from Terra IEEETrans. Geosci. Remote Sens. 41 459–73
[213] Platnick S 2000 Vertical photon transport in cloud remotesensing problems J. Geophys. Res. D 105 22919–35
[214] Chang F-L and Li Z 2002 Estimating the vertical variation ofcloud droplet effective radius using multispectralnear-infrared satellite measurements J. Geophys. Res. D107 4257
[215] Marshak A, Platnick S, Varnai T, Wen G and Cahalan R F2006 Impact of 3D radiative effects on satellite retrievalsof cloud droplet sizes J. Geophys. Res. D 111 DO9207
[216] Platnick S, Pincus R, Wind B, King M D, Gray M andHubanks P 2005 An initial analysis of the pixel-leveluncertainties in global MODIS cloud optical thicknessand effective particle size retrievals SPIE Proc. 5652 1–12
[217] Cornet C, Buriez J-C, Riedi J, Isaka H and Guillemet B 2005Case study of inhomogeneous cloud parameter retrievalfrom MODIS data Geophys. Res. Lett. 32 L13807
[218] Szczap F, Isaka H, Saute M, Guillemet B and Ioltukhovski A2000 Effective radiative properties of bounded cascadeabsorbing clouds: definition of effective single scatteringalbedo J. Geophys. Res. D 105 20635–48
[219] Petty G 2002 Area-average solar radiative transfer inthree-dimensionally inhomogeneous clouds: theindependently scattering cloudlet model J. Atmos. Sci.59 2910–29
[220] Wen G, Marshak A, Cahalan R F, Remer L A andKleidman R G 2007 3D aerosol–cloud radiative interactionobserved in collocated MODIS and ASTER images ofcumulus cloud fields J. Geophys. Res. D 112 D13204
[221] Remer L A et al 2005 The MODIS aerosol algorithm,products, and validation J. Atmos. Sci. 62 947–73
[222] Loeb N G and Manalo-Smith N 2005 Top-of-atmospheredirect radiative effect of aerosols over global oceans frommerged CERES and MODIS observations J. Clim.18 3506–26
[223] Ignatov A, Minnis P, Loeb N, Wielicki B, Miller W,Sun-Mack S, Tanre D, Remer L, Laslo I and Geier E 2005Two MODIS aerosol products over ocean on the Terra andAqua CERES SSF J. Atmos. Sci. 62 1008–31
[224] Zhang J, Reid J S and Holben B N 2005 An analysis ofpotential cloud artifacts in MODIS over ocean aerosoloptical thickness product Geophys. Res. Lett. 32 L15803
[225] Kaufman Y J et al 2005 A critical examination of the residualcloud contamination and diurnal sampling effects onMODIS estimates of aerosol over ocean IEEE Trans.Geosci. Remote Sens. 43 2886–97
[226] Matheson M A, Coakley J A Jr and Tahnk W R 2005 Aerosoland cloud property relationships for summertimestratiform clouds in the northeastern Atlantic fromAVHRR observations J. Geophys. Res. D 110 D24204
[227] Kobayashi T, Masuda K, Sasaki M and Mueller J 2000 MonteCarlo simulations of enhanced visible radiance in clear-airsatellite fields of view near clouds J. Geophys. Res. D105 26569–76
[228] Cahalan R F, Oreopoulos L, Wen G, Marshak A, Tsay S-Cand DeFelice T 2001 Cloud characterization and clear skycorrection from Landsat 7 Remote Sens. Environ. 78 83–98
[229] Yamaguchi Y, Kahle A B, Tsu H, Kawakami T and Pniel M1998 Overview of Advanced Spaceborne ThermalEmission and Reflection radiometer (ASTER) IEEETrans. Geosci. Remote Sens. 36 1062–71
[230] Mishchenko M I, Cairns B, ,Hansen J E, Travis L D, Burg R,Kaufman Y J, Martins J V and Shettle E P 2004Monitoring of aerosol forcing of climate from space:analysis of measurement requirements J. Quant.Spectrosc. Radiat. Transfer 88 149–61
[231] Wen G, Marshak A and Cahalan R F 2008 The role ofmolecular Rayleigh scattering in the enhancement of clearsky radiance in the vicinity of cumulus clouds J. Geophys.Res. D 113 D24207
[232] Pincus R, Barker H W and Morcrette J J 2003 A fast, flexible,approximate technique for computing radiative transfer ininhomogeneous cloud fields J. Geophys. Res. D108 4376–9
[233] Raisasen P, Barker H W, Khairoutdinov M F, Li J andRandall D A 2004 Stochastic generation of subgrid-scalecloudy columns for large-scale models Q. J. R. Meteorol.Soc. 130 2047–67
[234] Raisasen P, Barker H W and Cole J 2005 The Monte CarloIndependent Column Approximation’s conditional randomnoise: impact on simulated climate J. Clim. 18 4715–30
[235] Barker H W, Cole J N, Morcrette J, Pincus R, Raisanen P,von Salzen K and Vaillancourt P A 2008 The Monte Carlo
68

Rep. Prog. Phys. 73 (2010) 026801 A B Davis and A Marshak
Independent Column Approximation: an assessment usingseveral global atmospheric models Q. J. R. Meteorol. Soc.134 1463–78
[236] Cole J N S, Barker H W, O’Hirok W, Clothiaux E E,Khairoutdinov M F and Randall D A 2005 Atmosphericradiative transfer through global arrays of 2D cloudsGeophys. Res. Lett. 32 L19817
[237] Marshak A, Davis A, Cahalan R F and Wiscombe W J 1998Nonlocal independent pixel approximation: direct andinverse problems IEEE Trans. Geosc. Remote Sens.36 192–205
[238] Iwabuchi H and Hayasaka T 2003 A multi-spectral non-localmethod for retrieval of boundary layer cloud propertiesfrom optical remote sensing data Remote Sens. Environ.88 294–308
[239] Tikhonov A N and Arsenin V Y 1977 Solutions of Ill-PosedProblems (Scripta Series in Mathematics) (Washington,DC: Winston)
[240] Box M A, Polonsky I N and Davis A B 2003 Higher-orderperturbation theory applied to radiative transfer innon-plane-parallel media J. Quant. Spectrosc. Radiat.Transfer 78 105–18
[241] Polonsky I N, Box M A and Davis A B 2003 Radiativetransfer through inhomogeneous turbid media:implementation of the adjoint perturbation approach at thefirst-order J. Quant. Spectrosc. Radiat. Transfer 78 85–98
[242] Faure T, Isaka H and Guillemet B 2001 Neural networkanalysis of the radiative interaction between neighboringpixels in inhomogeneous clouds J. Geophys. Res. D106 14465–84
[243] Faure T, Isaka H and Guillemet B 2001 Mapping neuralnetwork computation of high-resolution radiantfluxes of inhomogeneous clouds J. Geophys. Res. D106 14961–74
[244] Faure T, Isaka H and Guillemet B 2002 Neural networkretrieval of cloud parameters of inhomogeneous andfractional clouds: Feasibility study Remote Sens. Environ.77 123–38
[245] Faure T, Isaka H and Guillemet B 2002 Neural networkretrieval of clouds parameters from high-resolutionmulti-spectral radiometric data Remote Sens. Environ.80 285–96
[246] Cornet C, Isaka H, Guillemet B and Szczap F 2004 Neuralnetwork retrieval of cloud parameters of inhomogeneouscloud from multispectral and multiscale radiance data:feasibility study J. Geophys. Res. D 109 D12203
[247] Zinner T, Mayer B and Schroder M 2006 Determination ofthree-dimensional cloud structures from high-resolutionradiance data J. Geophys. Res. D 111 D08204
[248] Evans K F, Marshak A and Varnai T 2008 The potential forimproved cloud optical depth retrievals from the multipledirections of MISR J. Atmos. Sci. 65 3179–96
[249] Kassianov E and Ovtchinnikov M 2008 On reflectance ratiosand aerosol optical depth retrieval in the presence ofcumulus clouds Geophys. Res. Lett. 35 L06807
[250] Kassianov E, Ovtchinnikov M, Berg L, McFarlane S A andFlynn C 2009 Retrieval of aerosol optical depth in vicinityof broken clouds from reflectance ratios: sensitivity studyJ. Quant. Spectrosc. Radiat. Transfer 110 1677–89
[251] Tucker C J 1979 Red and photographic infrared linearcombination for monitoring vegetation Remote Sens.Environ. 8 127–50
[252] Marshak A, Knyazikhin Y, Davis A, Wiscombe W J andPilewskie P 2000 Cloud–vegetation interaction: use ofnormalized difference cloud index for estimation of cloudoptical thickness Geophys. Res. Lett. 27 1695–8
[253] Leontieva E and Stamnes K 1994 Estimations of cloudoptical thickness from ground-based measurements ofincoming solar radiation in the Arctic J. Clim. 7 566–78
[254] Min Q-L and Harrison L C 1996 Cloud properties derivedfrom surface MFRSR measurements and comparison withGOES results at the ARM SGP site Geophys. Res. Lett.23 1641–4
[255] Boers R, van Lammeren A and Feijt A 2000 Accuracy ofoptical depth retrieval from ground-based pyranometers J.Atmos. Ocean. Technol. 17 916–27
[256] Barker H W and Marshak A 2001 Inferring optical depth ofbroken clouds above green vegetation using surface solarradiometric measurements J. Atmos. Sci.58 2989–3006
[257] Tian Y, Zhang Y, Knyazikhin Y, Myneni R B, Glassy J,Dedieu G and Running S W 2000 Prototyping of MODISLAI and FPAR algorithm with LASUR and LANDSATdata IEEE Trans. Geosci. Remote Sens. 38 2387–401
[258] Box M A, Gerstl S A W and Simmer C 1988 Computation ofatmospheric radiative effects via perturbation theory Beitr.Phys. Atmos. 62 193–9
[259] Titov G A 1998 Radiative horizontal transport and absorptionin stratocumulus clouds J. Atmos. Sci. 55 2549–60
[260] Chylek P, Borel C, Davis A B, Augustine J and Hodges G2004 Effect of broken clouds on satellite-based columnarwater vapor retrieval IEEE Geosc. Remote Sens. Lett.1 175–8
[261] Gerber H, Boers R, Jensen J, Davis A, Marshak A andWiscombe W J 2001 Spectral density of cloud liquid watercontent at high frequencies J. Atmos. Sci. 58 497–503
[262] Kolmogorov A N 1941 Local structure of turbulence in anincompressible liquid for very large Reynolds numbersDokl. Akad. Nauk SSSR 30 299–303
[263] Rodgers R R and Yau M K 1989 A Short Course in CloudPhysics 3rd edn (Burlington, MA: Butterworth andHeinmann)
[264] Pankine A, Li Z, Parsons D, Purucker M, Weinstock E,Wiscombe W and Nock K 2009 Stratospheric satellites forearth observation Bull. Am. Meteorol. Soc.90 1109–19
[265] Weber P G, Brock B C, Garrett A J, Smith B W, Borel C C,Clodius W B, Bender S C, Rex Kay R and Decker M L1999 Multispectral Thermal Imager mission overviewSPIE Proc. 3753 340–6
[266] Marshak A, Martins J V, Zubko V and Kaufman Y J 2006What does reflection from cloud sides tell us about verticaldistribution of cloud droplet sizes? Atmos. Chem. Phys.6 5295–305
[267] Martins J V, Marshak A, Remer L, Rosenfeld D,Kaufman Y J, Fernandez-Borda R, Koren I, Zubko Vand Artaxo P 2007 Remote sensing the vertical profileof cloud droplet effective radius, thermodynamic phase,and temperature Atmos. Chem. Phys. Discss. 7 4481–519
[268] Zinner T, Marshak A, Lang S, Martins J V and Mayer B 2008Remote sensing of cloud sides of deep convection: towarda three-dimensional retrieval of cloud particle size profilesAtmos. Chem. Phys. 8 4741–57
[269] Tao W-K and Simpson J 1993 The Goddard cumulusensemble model: I. Model description Terr. Atmos. OceanSci. 4 35–72
[270] Winker D M, Couch R H and McCormick M P 1996 Anoverview of LITE: NASA’s Lidar In-space TechnologyExperiment Proc. IEEE 84 164–80
[271] Minnis P, Heck P W, Young D F, Fairall C W and Snider J B1992 Stratocumulus cloud properties derived fromsimultaneous satellite- and island-based measurementsduring FIRE J. Appl. Meteorol. 31 317–39
[272] Davis A B, Winker D M and Vaughan M A 2001 Firstretrievals of dense cloud properties fromoff-beam/multiple-scattering lidar data collected in spaceLaser Remote Sensing of the Atmosphere: Selected Papersfrom the 20th Int. Conf. on Laser Radar (ILRC 20),
69

Rep. Prog. Phys. 73 (2010) 026801 A B Davis and A Marshak
9–14 July 2000 (Vichy, France) ed A Dabas and J Pelon(Palaiseau: Ecole Polytechnique) pp 35–8
[273] Irvine W M 1964 The formation of absorption bands and thedistribution of photon optical paths in a scatteringatmosphere Bull. Astron. Inst. Neth. 17 226–79
[274] Ivanov V V and Sabashvili Sh A 1972 Transfer of resonanceradiation and photon random walks Astrophys. Space Sci.17 13–22
[275] Pfeilsticker K, Erle F, Funk O, Veitel H and Platt U 1998 Firstgeometrical path lengths probability density functionderivation of the skylight from spectroscopically highlyresolving oxygen A-band observations: I. Measurementtechnique, atmospheric observations, and modelcalculations J. Geophys. Res. D 103 11483–504
[276] Pfeilsticker K 1999 First geometrical path lengths probabilitydensity function derivation of the skylight fromspectroscopically highly resolving oxygen A-bandobservations: II. Derivation of the Levy-index for theskylight transmitted by mid-latitude clouds J. Geophys.Res. D 104 4101–16
[277] Scholl T, Pfeilsticker K, Davis A B, Baltink H K, Crewell S,Lohnert U, Simmer C, Meywerk J and Quante M 2006Path length distributions for solar photons under cloudyskies: Comparison of measured first and second momentswith predictions from classical and anomalous diffusiontheories J. Geophys. Res. D 111 12211–26
[278] Min Q-L and Harrison L C 1999 Joint statistics of photonpath length and cloud optical depth Geophys. Res. Lett.26 1425–8
[279] Min Q-L, Harrison L C and Clothiaux E E 2001 Jointstatistics of photon path length and cloud optical depth:case studies J. Geophys. Res. D 106 7375–85
[280] Min Q-L and Clothiaux E E 2003 Photon path lengthdistributions inferred from rotating shadowbandspectroradiometer measurements at the AtmosphericRadiation Measurment Program Southern Great Plains siteJ. Geophys. Res. D 108 4456–64
[281] Min Q-L, Harrison L C, Kiedron P, Berndt J and Joseph E2004 A high-resolution oxygen A-band and water vaporband spectrometer J. Geophys. Res. D 109 2202–10
[282] Portmann R W, Solomon S, Sanders R W and Daniel J S2001 Cloud modulation of zenith sky oxygen path lengthsover Boulder, Colorado: measurement versus model J.Geophys. Res. D 106 1139–55
[283] Stephens G L, Heidinger A K and Gabriel P M 2005 Photonpaths and cloud inhomogeneity: an observational strategyto assess effects of 3D geometry on radiative transfer 3DRadiative Transfer in Cloudy Atmospheres ed A Marshakand A B Davis (Heidelberg: Springer) pp 587–616chapter 13
[284] Buldyrev S V, Gitterman M, Havlin S, Kazakov A Ya,da Luz M G E, Raposo E P, Stanley H E andViswanathan G M 2001 Properties of Levy flights on aninterval with absorbing boundaries Physica A 302 148–61
[285] Priedhorsky W C, Smith R C and Ho C 1996 Laser rangingand mapping with a photon-counting detector Appl. Opt.35 441–52
[286] Davis A B, Ho C and Love S P 1998 Off-beam(multiply-scattered) lidar returns from stratus: II.Space-time measurements in a laboratory simulation 19thInt. Laser Radar Conf. (ILRC 19) Proceedings (Annapolis,MD, 6–10 July 1998) ed U Singh et al (Washington, DC:NASA Center for Aero-Space Information (CASI))pp 55–8
[287] Love S P, Davis A B, Ho C and Rohde C A 2001Remote sensing of cloud thickness and liquid watercontent with Wide-Angle Imaging Lidar Atmos. Res.59–60 295–312
[288] Varnai T and Cahalan R F 2007 Potential for airborneoffbeam lidar measurements of snow and seaice thickness J. Geophys. Res. C 112 12S90(doi:10.1029/2007JC004091)
[289] Yodh A and Chance B 1995 Spectroscopy/imaging withdiffusing light Phys. Today 48 34–40
70