3d visualization and statistical analysis of structural ...tupa.gtk.fi/posteri/tp_0414.pdffaster...
TRANSCRIPT
Lay-
out:
Riitt
a Tu
rune
n &
Har
ri Ku
tvon
en
Geological Survey of FinlandEeva-Liisa Laine, Geological Survey of Finland, Espoo, e-mail: [email protected] Johan Ersfolk and Jan Westerholm, Åbo Akademi University, High Performance Computing
ACKNOWLEDGEMENTS
This study was funded by Academy of Finland (Gecco, funding decision nos. 292481 (Åbo Akademi) and 292569 (GTK)). Pyhäsalmi Mine Oy is thanked for providing data for the use in the Gecco project.
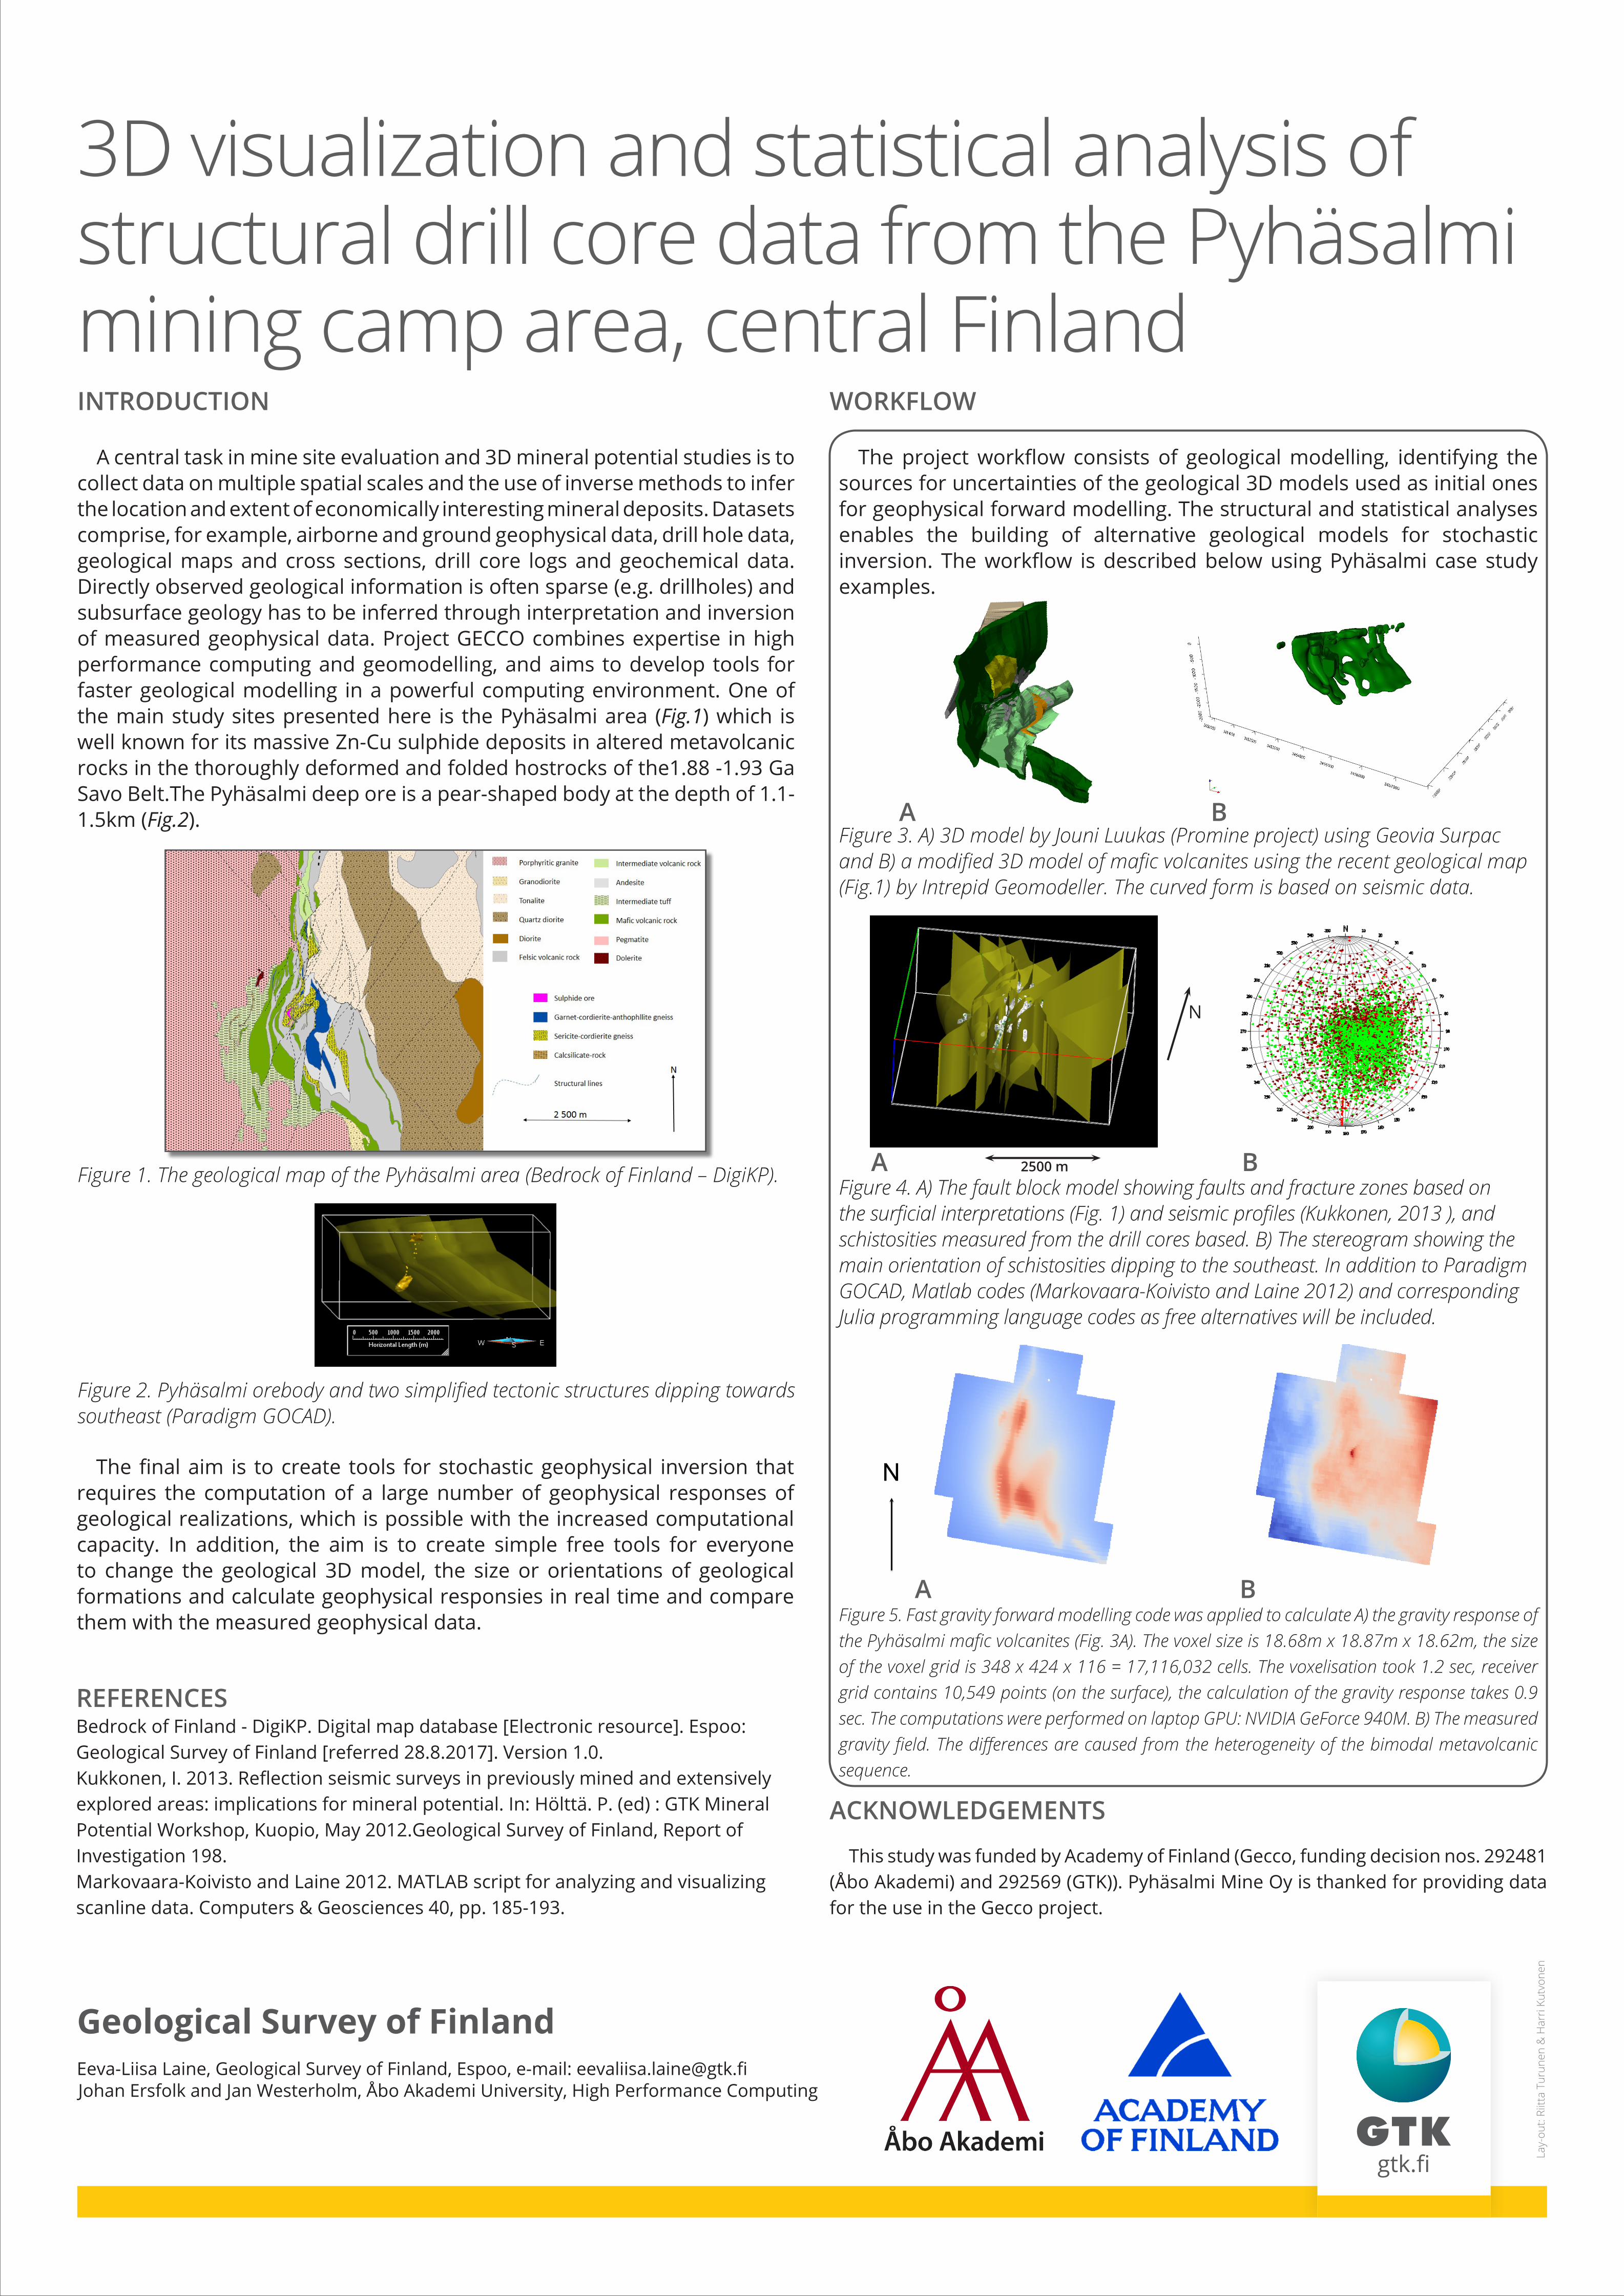
Figure 5. Fast gravity forward modelling code was applied to calculate A) the gravity response of the Pyhäsalmi mafic volcanites (Fig. 3A). The voxel size is 18.68m x 18.87m x 18.62m, the size of the voxel grid is 348 x 424 x 116 = 17,116,032 cells. The voxelisation took 1.2 sec, receiver grid contains 10,549 points (on the surface), the calculation of the gravity response takes 0.9 sec. The computations were performed on laptop GPU: NVIDIA GeForce 940M. B) The measured gravity field. The differences are caused from the heterogeneity of the bimodal metavolcanic sequence.
INTRODUCTION
A central task in mine site evaluation and 3D mineral potential studies is to collect data on multiple spatial scales and the use of inverse methods to infer the location and extent of economically interesting mineral deposits. Datasets comprise, for example, airborne and ground geophysical data, drill hole data, geological maps and cross sections, drill core logs and geochemical data. Directly observed geological information is often sparse (e.g. drillholes) and subsurface geology has to be inferred through interpretation and inversion of measured geophysical data. Project GECCO combines expertise in high performance computing and geomodelling, and aims to develop tools for faster geological modelling in a powerful computing environment. One of the main study sites presented here is the Pyhäsalmi area (Fig.1) which is well known for its massive Zn-Cu sulphide deposits in altered metavolcanic rocks in the thoroughly deformed and folded hostrocks of the1.88 -1.93 Ga Savo Belt.The Pyhäsalmi deep ore is a pear-shaped body at the depth of 1.1-1.5km (Fig.2).
The final aim is to create tools for stochastic geophysical inversion that requires the computation of a large number of geophysical responses of geological realizations, which is possible with the increased computational capacity. In addition, the aim is to create simple free tools for everyone to change the geological 3D model, the size or orientations of geological formations and calculate geophysical responsies in real time and compare them with the measured geophysical data.
REFERENCESBedrock of Finland - DigiKP. Digital map database [Electronic resource]. Espoo: Geological Survey of Finland [referred 28.8.2017]. Version 1.0.Kukkonen, I. 2013. Reflection seismic surveys in previously mined and extensively explored areas: implications for mineral potential. In: Hölttä. P. (ed) : GTK Mineral Potential Workshop, Kuopio, May 2012.Geological Survey of Finland, Report of Investigation 198. Markovaara-Koivisto and Laine 2012. MATLAB script for analyzing and visualizing scanline data. Computers & Geosciences 40, pp. 185-193.
The project workflow consists of geological modelling, identifying the sources for uncertainties of the geological 3D models used as initial ones for geophysical forward modelling. The structural and statistical analyses enables the building of alternative geological models for stochastic inversion. The workflow is described below using Pyhäsalmi case study examples.
N
N
A B
A B
A B
2500 mFigure 1. The geological map of the Pyhäsalmi area (Bedrock of Finland – DigiKP).
Figure 2. Pyhäsalmi orebody and two simplified tectonic structures dipping towards southeast (Paradigm GOCAD).
Figure 3. A) 3D model by Jouni Luukas (Promine project) using Geovia Surpac and B) a modified 3D model of mafic volcanites using the recent geological map (Fig.1) by Intrepid Geomodeller. The curved form is based on seismic data.
Figure 4. A) The fault block model showing faults and fracture zones based on the surficial interpretations (Fig. 1) and seismic profiles (Kukkonen, 2013 ), and schistosities measured from the drill cores based. B) The stereogram showing the main orientation of schistosities dipping to the southeast. In addition to Paradigm GOCAD, Matlab codes (Markovaara-Koivisto and Laine 2012) and corresponding Julia programming language codes as free alternatives will be included.
3D visualization and statistical analysis of structural drill core data from the Pyhäsalmi mining camp area, central Finland
WORKFLOW