3d whiteboard: collaborative sketching with 3d-tracked smart
TRANSCRIPT

3D Whiteboard: Collaborative Sketching with 3D-TrackedSmart Phones
James Lue and Jurgen P. Schulze
University of California San Diego, La Jolla, CA, USA
ABSTRACT
We present the results of our investigation of the feasibility of a new approach for collaborative drawing in 3D,based on Android smart phones. Our approach utilizes a number of fiduciary markers, placed in the working areawhere they can be seen by the smart phones’ cameras, in order to estimate the pose of each phone in the room.Our prototype allows two users to draw 3D objects with their smart phones by moving their phones around in3D space. For example, 3D lines are drawn by recording the path of the phone as it is moved around in 3Dspace, drawing line segments on the screen along the way. Each user can see the virtual drawing space on theirsmart phones’ displays, as if the display was a window into this space. Besides lines, our prototype applicationalso supports 3D geometry creation, geometry transformation operations, and it shows the location of the otheruser’s phone.
Keywords: Smart Phone, Augmented Reality, Multi-User, Networked
1. INTRODUCTION
3D data visualization1 is a typical application for virtual environments (VE). When displaying data to a user,the user may want to manipulate or query the data or objects in the virtual world to obtain more detailedinformation.2 Collaborative virtual reality (VR) applications allow multiple users to navigate the virtual worldand view the data.3 Some of the existing multi-user VR systems or applications have been developed for the PC,where the input devices are simply keyboard and mouse4.5 In this type of non-immersive VR the user typicallysits in front of the computer and does not get up and move around to interact with the system. In immersiveVR systems, such as virtual reality CAVEs,6 the user is surrounded by large displays and can operate the systemwhile standing and moving about. This better takes advantage of the spatial skills people have developed overthe course of evolution. However, immersive VR systems often require customized and expensive display andinput devices to operate, and are thus unavailable to the average person. Head-mounted VR devices, such asthe Oculus Rift, allow the user to be immersed in the graphics, but block the view on the real world, so thatcollaborative applications with people in the same room are more difficult to achieve. Mobile devices are aninexpensive alternative with which users are able to navigate through the virtual world by moving the devicesas if they were windows into the virtual world, while the virtual world remains co-located with the real world.Using this concept, we set off to build an application which implements a prototype of a multi-user VR aplicationbased on smart phones, in which the users can simultaneously draw in 3D and view their own drawings, as wellas their collaborators’. We call this a 3D whiteboard, because our concept allows the users to collaborativelycreate 3D sketches, for which they might otherwise have used an actual whiteboard.
The paper is organized as follows: Section 2 discusses prior work in this field. Section 3 explains how thedevices communicate with one another, and how the 3D world is synchronized. Section 4 discusses how wedo pose estimation. Section 5 examines performance and accuracy of our application. Section 6 discusses ourresults, before Section 7 concludes the paper.
Contact e-mail: [email protected] (Jurgen Schulze)

2. RELATED WORK
Mobile virtual reality applications have used a variety of ways in order to solve the problem of pose estimation.Traditional virtual reality systems rely on 3D tracking devices,7,8 or simply take input from mouse, joystick, orspecialized 3D input devices. Our goal was to use only the smart phone for pose estimation, so that the userdoes not have to acquire additional hardware.
Some of the existing applications for mobile VR can estimate the device’s pose by using the data frommultiple of its sensors, which is called sensor fusion.9 The idea is to use the data from gyroscope, accelerometerand magnetometer (compass) to obtain as accurately as possible a position and orientation.10,11 Sensor fusionworks well for orientation, but it is very difficult to estimate position due to issues with noise. Additionally, theaccuracy of the accelerometer is poor at high velocity, as discussed in.12 Since position is a critical componentof VR applications, other approaches have been investigated. Some commercial products use the device’s GPS(Global Positioning System),13 but because the precision of the GPS is on the order of meters14 and requires aline of sight connection with the satellites, it is insufficient for a 3D whiteboard, let alone using it indoors.
Another alternative for pose estimation is structure from motion (SfM). This is a technique from computervision, which estimates both orientation and position based on images taken of the environment. However, SfMis a very compute intensive approach, not yet suitable for smart phones.
A more successful approach has been marker-based pose estimation. It is suitable for collaborative augmentedreality (AR) applications15 because it has high accuracy, and automatically comes with a global coordinatesystem, namely the space the markers are located in. A simple AR tennis game16 illustrates this idea forcollaborative AR. We decided to utilize this approach in our project because existing libraries work reasonablywell and run on a smart phone. Similar collaborative AR ideas are used in multi-user AR games such as ”InvisibleTrain”17 and ”Rock ’Em Sock ’Em Robots”.18 These collaborative AR applications build their global coordinatesystems with special marker patterns, which blend more into the scene than the fiduciary markers we use, butare more complex to parse. We require our markers to be placed in multiple locations around the work area, sothat the users’ phones do not all have to point in the same direction.
3. COMMUNICATION AND SYNCHRONIZATION
Because our 3D whiteboard application is for multiple users, the smart phones need to communicate with oneanother. We use the wireless network for communication. The network architecture to exchange informationbetween users is a traditional client-server model with a TCP connection. The server runs on one of the Androidphones, the others run clients. Our prototype only supports two devices: one is the server and the other one isthe client. We exchange the state of the virtual world (the 3D scene) every 10 milliseconds. Only changes to thescene are exchanged during this time window. The scene is rendered locally on each phone. The state includesthe following data:
• Position and orientation of the other user.
• Commands for transferring geometry and the geometry’s parameters.
• Commands for geometry creation (creation of lines or cubes) and modifications (transformation, deletionand color changes).
• Other information (e.g., marker IDs and positions).
4. POSE ESTIMATION
We use a set of fiduciary markers, which consist of a black square on a white background, along with a non-rotationally symmetrical pattern inside it. Multiple markers in our work environment allow greater ranges oforientations for the phones, as well as a larger area the users can move around in.

4.1 Marker Encoding, Detection and Pose Estimation
To detect and track the markers, we use OpenCV’s marker detection functionality19 with a custom marker IDencoding method. The marker patterns are composed of eight black and white squares. We calculate the markerID as a binary number. This allows us to more easily create a large number of distinct markers compared to theARToolkit method, which is done by a bitwise XOR operation with ARTag.20 We slightly modified that markerencoding method: the original encoding algorithm is similar to the encoding system in ARTag,20 which dividesthe inner rectangle of the marker into grids, with each rectangle in the grid representing one bit; if the rectangleis filled, the bit is set. With our method we can distinguish a total of 28 = 256 different markers. The remainingalgorithms for marker detection, recognition and pose estimation are similar to other marker tracking librariessuch as ARToolKit.21
Figure 1. Marker with 8 fields to encode 8 bits.
4.2 Enlarging the Workspace by Using Multiple Markers
Using only one marker limits the size of the working area to one that is too small for two people to do reasonablework with our 3D whiteboard technique. In order to increase the size of the workspace, we use multiple markersto enlarge the workspace. The AR library ArUco22 discusses this approach. The benefit is not just to enlargethe workspace; the robustness of tracking is also increased: if only one marker is tracked, sometimes the markerdetection algorithm will fail and report an incorrect pose. However, with multiple markers in the camera’s fieldof view, the probability that all pose estimations are wrong is relatively low, so tracking is more stable. Inaddition, users can just track part of the marker array since the camera pose can be calculated by only onemarker if the 3D positions for all the markers are known. Based on the multiple markers concept, we extend thisidea to place markers anywhere in the work space rather than putting them all in one plane. Putting markersin arbitrary positions can give the users more freedom to move their phones around the space. However, it isharder to measure the positions of the markers with respect to one another. In order to allow users to calibratethe marker positions, we use 3D reconstruction techniques, which we discuss in the next section.
4.2.1 Measuring Marker Positions
To measure the 3D positions of markers, we need to use camera frames that include the markers whose 3Dpositions are known and markers whose 3D positions are not known. We use the known markers as referencesto determine the poses of the other markers. We assume that the first marker processed has the origin as itscenter and its ID value is zero. We decide that the first marker lies in the XY plane, and the positions of itsfour corners are determined by the physical marker size, which is 90mm for each side (see Figure 2). For eachimage that we use to reconstruct the unknown markers, we record the image coordinates of four corners of eachunknown marker and the camera pose of that image. The camera pose is computed by known markers. Wechoose the marker which is the earliest reconstructed in the image to estimate the camera pose to reduce the

error that is accumulated from previous marker reconstructions. To find out which marker was reconstructedthe earliest, we record the markers’ ”age”, which is a number indicating how many marker reconstructions aremade before reconstructing this marker. The age of each reconstructed marker is calculated as the average ageof the markers that are used to find the camera pose. The oldest marker is the origin whose age is zero, theyounger markers have successively larger numbers. We do the marker position measurement offline and storeeach marker’s position; then we can load the stored marker information to allow for pose estimation when the3D whiteboard application is running.
Figure 2. Coordinate system of the marker.
4.2.2 Triangulation
To reconstruct the markers’ positions, we use several triangulation methods. The first one is linear triangula-tion,23 which is based on solving the linear system of 3D point projection; however, due to non-linear distortionand noise, the actual position cannot be perfectly reconstructed. We further use iterative linear triangulation24
to minimize the reprojection error. Sometimes noise or an oblique viewing angle of the marker that is usedfor pose estimation causes a poor reconstruction result. To avoid problematic reconstruction errors, we userandom sampling techniques.25 For a non-reconstructed marker, we collect enough numbers of images for it andrandomly choose some images to do the reconstruction. After the reconstruction, we check if the reprojectionerror is below a certain threshold; if it is, we accept the result. Users can run the random sampling multipletimes to find better reconstruction results for different images. We also tried the Levenberg-Marquardt (LM)algorithm to minimize the reprojection error after using linear triangulation. The LM algorithm very effectivelyreduces the reprojection error; however, we found that the reconstruction result is similar to that of iterativelinear triangulation. Since iterative linear triangulation is faster, we chose to use it.
After the reconstruction for every marker is finished, we force the four corners of each marker to be coplanar;this reduces instability when estimating the camera position in our experiments. To make the corners coplanar,the least square plane fitting method26 is used to find the plane that allows the sum of distances from the cornersto the plane to be minimized. We further adjust the corners to restore the marker’s properties (right angle foreach corner and length of 90mm for each edge). We first make the two diagonals in the reconstructed markerperpendicular by rotating the corner around the intersection of the diagonals, which we call C. The rotationaxis is the norm of the fitting plane. After the diagonals are perpendicular, we adjust the length between C andeach corner to be 45
√2mm; this further stabilizes the estimated pose.
4.2.3 How Many Images Are Needed for Marker Calibration?
To find out how many images are sufficient for marker calibration, we use different numbers of image to do thereconstruction several times and find the error range of the reconstruction result. To measure the error of the

reconstruction result, we use the markers whose actual positions are known and compare the differences betweenthe reconstructed positions and actual positions. As mentioned above, we use ”age” to represent how earlya marker was reconstructed. Age 0 is the oldest (the first found) marker which contains the origin, youngermarkers have larger number as their ages. We measured the error for ages from 0 to 3. Figure 3 shows that theerror range is similar if we use more than 5 images, so we use 5 images for the reconstruction since more imagestake more time to do the reconstruction.
4.2.4 Multiple Markers in Field of View
Currently, if there is more than one marker in the camera frame, we take at most two markers to do the poseestimation. We estimate the camera pose from each marker, and then use linear interpolation between these twoposes to get our final pose estimation. The linear interpolation includes translation and rotation. The rotationinterpolation is done with quaternions.27 We use the distance between the marker and the phone’s camera tocalculate the weight for the interpolation. The weight is inversely proportional to the distance between themarker and the phone, which means that markers closer to the phone have higher weight in the interpolation.
4.2.5 Help From Sensor
When markers are not in the field of view of the camera, we switch to using the gyroscope to at least estimatethe orientation. The orientation estimation from the gyroscope is reliable in the short term;11 as long as we canget the marker back into the camera frame by rotating, the gyroscope can help compensate for the loss of markervisibility.
5. ACCURACY
We measured the accuracy and stability of our pose estimation, done by OpenCV’s marker detection algorithms,to find out the effective tracking range. We use a very precise optical DTrack tracking system as our positiontracking reference and compute the error as the distance between reference position and estimated position.We measured markers with ages from 0 to 3. The markers’ positions and the coordinate systems are shown inFigure 4. However, since the positional reconstruction errors for reconstructed markers are constant for eachmarker, the measurement results are similar for each age. Therefore, we only show the results for age 0. Weonly move the camera in the XZ plane since we do not have devices that can control the position on the Y axiswell. We measured with resolutions of 640×480 and 320×240. Figures 5 and 6 show the results. We treat thecenters of the markers as world origins, the graph shows the distance in X and Z directions between the markercenter and the camera postion. There are two subgraphs. The upper subgraph shows the average error and thelower subgraph shows the standard deviation of the error. The average of the error shows the average absolutedistance between actual camera postion and estimated postion. The standard deviation of the error representsthe stability of the tracking, low standard deviation means the error does not scatter much. According to thegraphs, we can see that the standard deviation grows quickly once the Z distance between marker center andcamera is greater than 800mm. Therefore, to get stable tracking, we should keep the distance between markerand camera less than 800mm.
6. RESULTS
6.1 Screen Shots
To illustrate what our Android app looks like, we are presenting a few screen shots in this section. There isalso a short video clip, see Video 1 at the end of the paper. Figure 7 shows a red box, which is created byone of the users, and both users can see it. Figure 8 shows a box; after a transformation it became a cuboid.Figure 9 demonstrates the line drawing function. We can use the function to draw lines or write text in 3Dspace. Figure 10 is a close-up.

Figure 3. Reconstruction error for different ages with different numbers of images.
6.2 Processing Time
6.2.1 Camera Frame Processing Time
The camera frame processing time depends on the camera resolution. We tested the application on a SamsungGalaxy S II. The camera frame processing for a resolution of 640×480 takes about 100 to 200ms depending on

Figure 4. Experimental setup for accuracy measurements and the coodinate system.
Figure 5. Accuracy measurements for resolution of 640x480 pixels.
Figure 6. Accuracy measurements for resolution of 320x240 pixels.
how many markers are detected. At a resolution of 320×240 it takes about 60ms to 120ms. Unsurprisingly, lowerresolution reduces processing time. However, since the marker’s image is smaller then, too, marker detectionbecomes harder, and the effective tracking space would also shrink.

Figure 7. A box was created and is visible on both phones.
Figure 8. A box after translation and transformation to a cuboid.
Figure 9. We drew ”‘OK”’ in 3D space and both users can see it.
6.3 A Case Study for Scene Design
We used our application to build a simple scene with the functions we provide. The purpose was to find out ifour application can allow users to design a simple scene. The scene includes a house and a tree. The house isconstructed using transformed cubes and a heart-shaped line. The tree is composed of a transformed box and
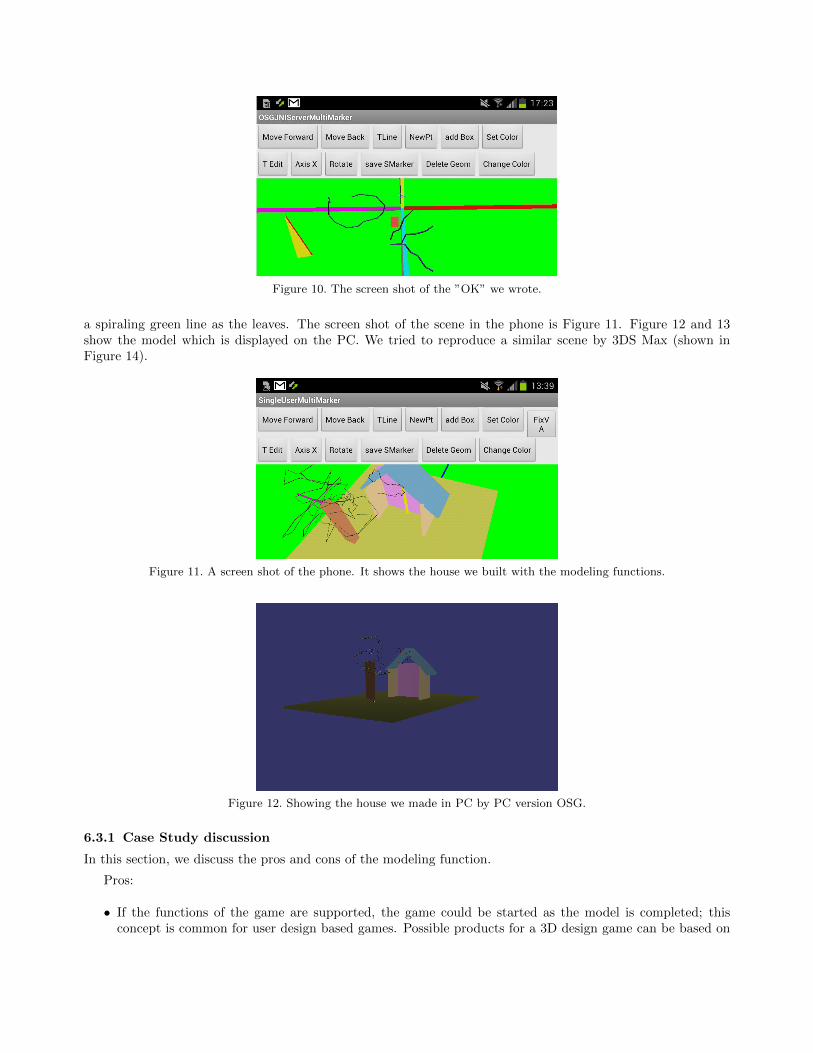
Figure 10. The screen shot of the ”OK” we wrote.
a spiraling green line as the leaves. The screen shot of the scene in the phone is Figure 11. Figure 12 and 13show the model which is displayed on the PC. We tried to reproduce a similar scene by 3DS Max (shown inFigure 14).
Figure 11. A screen shot of the phone. It shows the house we built with the modeling functions.
Figure 12. Showing the house we made in PC by PC version OSG.
6.3.1 Case Study discussion
In this section, we discuss the pros and cons of the modeling function.
Pros:
• If the functions of the game are supported, the game could be started as the model is completed; thisconcept is common for user design based games. Possible products for a 3D design game can be based on

Figure 13. Another viewing direction of the house we made. This figure shows that some transformation of the geometriesare not very accurate.
Figure 14. The model we reproduced by 3DS Max.
structure design. For example, users will be able to create a building together and see if their building canwithstand an earthquake once they finish the design.
• Since free hand drawing in 3D space is supported, the 3D spiral line (the leaves) can be drawn in anintuitive way. This process does not require that the line is drawn on a plane and then modified.
Cons:
• We found that the precision of transformations cannot be controlled as well as with a modeling tool ona PC, as Figure 13 illustrates; it can only make the transformation roughly because the amount for thetransformation is set by the movement amount on the touch screen. We do not support users insofar asinputting the transformation amount currently.
• The tracking precision is still a problem, which dramatically affects the line drawing since the point positionwill be wrong. The problem is not only the pose estimation noise; sometimes, there is marker misdetection.Marker misdetection introduces huge errors in the pose estimation.
• The total time for modeling by our application is much longer than when using 3DS Max since the functionsfor modeling and basic geometry creation are not supported well. For example, geometry copy and pastefunctions are not supported. This really slows down the speed for creating objects that have symmetricalstructures. Also, the box creation must start from a cube and its dimensions must be modified later.Notably, 3DS Max can determine the dimensions of the box while the user is creating it.

. Video 1. This video clip shows the 3D Whiteboard app in action: http://dx.doi.org/doi.number.goes.here
7. CONCLUSIONS AND FUTURE WORK
We showed that a collaborative Android application with 3D pose estimation is feasible. This applicationdemonstrates that it is possible to develop multi-user interactive 3D applications with mobile devices. Possibleapplications of this prototype could be multi-user games based on user-designed 3D objects. The users do notneed a dedicated network server. The user’s positional tracking is done by multiple fiducial markers in physical3D space. Users can use our application to find the 3D positions of the markers. The marker information andthe drawn objects can be saved and shared with other users. The effective working distance from markers isabout 800mm according to our experiments. The camera frame processing time depends on processor speed andcamera resolution, but it is possible that it can run in real-time with latest phones.
Our application still requires markers in the environment. In the future, we hope that we can use markerlesstracking. PTAM on the iPhone 3G28 shows that markerless augmented reality is possible on smart phones.However, some issues remain regarding markerless systems, which need to be considered. One is determininghow to make the coordinate systems of each user consistent. PTAM builds the coordinate system by assumingthat the first two key frames are taken by moving the camera approximately along the X direction of the imagecoordinate system; the actual distance between the two key frames is assumed. As such, it is hard to guaranteethat other users can build the same coordinate system since it is impossible for each user to have the same keyframes. Using some special natural feature could build the same coordinate system for both users,29 but we needto consider how large the workspace could be for users. Making a coordinate system consistent for multiple usersis a key point in the development of this type of technology. In addition, we can also try to allow more usersto be involved; however, this may require a workstation as the networking server to deal with the informationexchange for more users.
REFERENCES
[1] Bryson, S., “Virtual reality in scientific visualization,” Commun. ACM 39, 62–71 (May 1996).
[2] “What is an interactive data visualization?.” http://visual.ly/what\-is\-an\-interactive\-data\
-visualization (2013).
[3] Wood, J., Wright, H., and Brodie, K., “Collaborative visualization,” in [Visualization ’97., Proceedings ],253 –259 (oct. 1997).
[4] Chen, J. X., Yang, Y., and Loftin, R. B., “Muvees: a pc-based multi-user virtual environment for learning.,”in [VR ], 163–170, IEEE Computer Society (2003).
[5] “Second life.” http://secondlife.com (2013).
[6] Cruz-Neira, C., Sandin, D. J., DeFanti, T. A., Kenyon, R. V., and Hart, J. C., “The cave: Audio visualexperience automatic virtual environment,” Commun. ACM 35, 64–72 (June 1992).
[7] Baratoff, G. and Blanksteen, S., “Tracking devices,” (2013).

[8] “trackd.” http://www.mechdyne.com/trackd.aspx (2013).
[9] Wolfgang Hrst, M. H., “Mobile 3d graphics and virtual reality interaction,” in [Proceedings of the 8thInternational Conference on Advances in Computer Entertainment Technology (ACE 2011) ], (November2011).
[10] Lawitzki, P., “Android sensor fusion tutorial.” http://www.thousand-thoughts.com/2012/03/
android-sensor-fusion-tutorial/ (2013).
[11] Sachs, D., “Sensor fusion on android devices: A revolution in motion processing.” http://www.youtube.
com/watch?v=C7JQ7Rpwn2k (August 2010).
[12] Shala, U. and Rodriguez, A., “Indoor positioning using sensor-fusion in android devices,” (2011).
[13] “Layar.” http://gpsobsessed.com/layar-augmented-reality-for-android/index.html (2013).
[14] “Gps accuracy.” http://wiki.xkcd.com/geohashing/GPS\_accuracy (2013).
[15] Billinghurst, M. and Kato, H., “Collaborative augmented reality,” Communications of the ACM 45, 64–70(2002).
[16] Henrysson, A., Billinghurst, M., and Ollila, M., “Face to Face Collaborative AR on Mobile Phones,” in[International Symposium on Mixed and Augmented Reality (ISMAR 2005) ], 80–89, IEEE Computer Society(2005).
[17] Wagner, D., Pintaric, T., Ledermann, F., and Schmalstieg, D., “Towards massively multi-user augmentedreality on handheld devices,” in [Proceedings of the Third international conference on Pervasive Computing ],PERVASIVE’05, 208–219, Springer-Verlag, Berlin, Heidelberg (2005).
[18] Hollister, S., “Qualcomm demos augmented reality and peer-to-peer tech, triesto punch cellular gaming’s block off.” http://www.engadget.com/2010/07/06/
qualcomm-demos-augmented-reality-and-peer-to-peer-tech-tries-to/ (2013).
[19] “Opencv marker detector 1.3.” https://sites.google.com/site/playwithopencv/home/markerdetect
(2013).
[20] Fiala, M., “Artag, a fiducial marker system using digital techniques,” in [Computer Vision and PatternRecognition, 2005. CVPR 2005. IEEE Computer Society Conference on ], 2, 590 – 596 vol. 2 (June 2005).
[21] “Artoolkit.” http://www.hitl.washington.edu/artoolkit/ (2013).
[22] ArUco. http://www.uco.es/investiga/grupos/ava/node/26 (2013).
[23] Richard Hartley, A. Z., [Multiple View Geometry in Computer Vision ], 312, O’Reilly Media, Inc. (2007).
[24] Hartley, R. I. and Sturm, P. F., “Triangulation,” in [Proceedings of the 6th International Conference onComputer Analysis of Images and Patterns ], CAIP ’95, 190–197, Springer-Verlag, London, UK, UK (1995).
[25] Fischler, M. A. and Bolles, R. C., “Random sample consensus: a paradigm for model fitting with applicationsto image analysis and automated cartography,” Commun. ACM 24, 381–395 (June 1981).
[26] Eberly, D., “Least squares fitting of data,” tech. rep., Geometric Tools, LLC (February 2008).
[27] Erik B. Dam, Martin Koch, M. L., “Quaternions, interpolation and animation,” tech. rep., University ofCopenhagen (1998).
[28] Klein, G. and Murray, D., “Parallel tracking and mapping on a camera phone,” in [Proc. Eigth IEEE andACM International Symposium on Mixed and Augmented Reality (ISMAR’09) ], (October 2009).
[29] Lee, T. and Hollerer, T., “Hybrid feature tracking and user interaction for markerless augmented reality,”in [Virtual Reality Conference, 2008. VR ’08. IEEE ], 145 –152 (March 2008).