3ftfbsdi sujdmf %(fptubujtujdbm ...downloads.hindawi.com/journals/jgr/2013/687947.pdf · +pvsobm pg...
TRANSCRIPT

Hindawi Publishing CorporationJournal of Geological ResearchVolume 2013 Article ID 687947 7 pageshttpdxdoiorg1011552013687947
Research Article3D Geostatistical Modeling and Uncertainty Analysis ina Carbonate Reservoir SW Iran
Mohammad Reza Kamali1 Azadeh Omidvar2 and Ezatallah Kazemzadeh1
1 Research Institute of Petroleum Industry (RIPI) West Boulevard Azadi Sport Complex Tehran 1485733111 Iran2epartment of eoloy Science and Research Branch Islamic Azad niversity nd of Ashra sfahani ihaySimon Boulevard PO Box 1944964814 Tehran Iran
Correspondence should be addressed to Azadeh Omidvar omidvarazadehyahoocom
Received 30 March 2012 Revised 8 August 2012 Accepted 24 November 2012
Academic Editor Agust Gudmundsson
Copyright copy 2013 M R Kamali et al is is an open access article distributed under the Creative Commons Attribution Licensewhich permits unrestricted use distribution and reproduction in any medium provided the original work is properly cited
e aim of geostatistical reservoir characterization is to utilize wide variety of data in different scales and accuracies to constructreservoir models which are able to represent geological heterogeneities and also quantifying uncertainties by producing numbersof equiprobable models Since all geostatistical methods used in estimation of reservoir parameters are inaccurate modelingof estimation error in form of uncertainty analysis is very important In this paper the denition of Sequential GaussianSimulation has been reviewed and construction of stochastic models based on it has been discussed Subsequently ranking anduncertainty quantication of those stochastically populated equiprobable models and sensitivity study of modeled properties havebeen presented Consequently the application of sensitivity analysis on stochastic models of reservoir horizons petrophysicalproperties and stochastic oil-water contacts also their effect on reserve clearly shows any alteration in the reservoir geometry hassignicant effect on the oil in place e studied reservoir is located at carbonate sequences of Sarvak ormation agros Iran itcomprises three layerse rst onewhich is located beneath the cap rock contains the largest portion of the reserve and other layersjust hold little oil Simulations show that average porosity and water saturation of the reservoir is about 20 and 52 respectively
1 Introduction
e rst step in optimizing the use of explored resourcesis to dene the reservoir which has a determinant role inreservoir management [1] Denition of a reservoir includesdescription of empty spaces and size of grains porosity andpermeability of reservoir identication of facies sedimen-tary environment and description of basin [2]
ree-dimensional models provide the best mechanismfor linking all the existing data [3] Nowadays efficient three-dimensional simulation is popular in all major oil companiesand has become an essential part of normal explorationand production activities To overcome the inherent two-dimensional limitation of paper it is necessary to use denedthree-dimensional data ree-dimensional simulation ofgeological structures enables collection of all the existing data
for a certain project in a unitedmodel bymeans ofwhich datacan be analyzed in soware environment [4]
ere are several methods for estimation In a generalclassication they can be divided into geostatistical andclassical methods Classical methods are those using classicalstatistics for estimation while in geostatistical methodsthe estimation is made based on spatial structure in theenvironment [5]
3D geologicalmodels play an important role in petroleumengineeringere are different methods for 3Dmodeling ineach of these methods geological mathematical or statisticalinformation is used [6]
Modern specialized soware programs can model com-plicated and nonorderly geological volumes in three dimen-sionsis is done by using geological maps and constructioninformation for creating a proper model [7]
2 Journal of Geological Research
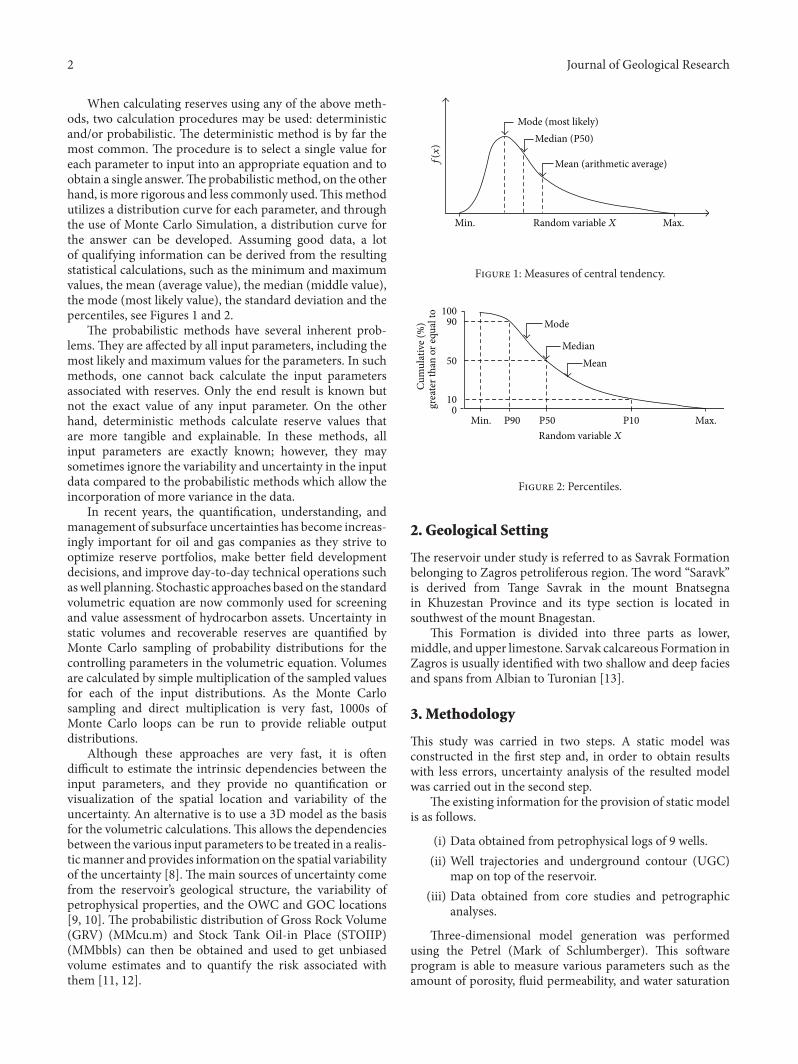
When calculating reserves using any of the above meth-ods two calculation procedures may be used deterministicandor probabilistic e deterministic method is by far themost common e procedure is to select a single value foreach parameter to input into an appropriate equation and toobtain a single answere probabilisticmethod on the otherhand is more rigorous and less commonly usedismethodutilizes a distribution curve for each parameter and throughthe use of Monte Carlo Simulation a distribution curve forthe answer can be developed Assuming good data a lotof qualifying information can be derived from the resultingstatistical calculations such as the minimum and maximumvalues the mean (average value) the median (middle value)the mode (most likely value) the standard deviation and thepercentiles see Figures 1 and 2
e probabilistic methods have several inherent prob-lems ey are affected by all input parameters including themost likely and maximum values for the parameters In suchmethods one cannot back calculate the input parametersassociated with reserves Only the end result is known butnot the exact value of any input parameter On the otherhand deterministic methods calculate reserve values thatare more tangible and explainable In these methods allinput parameters are exactly known however they maysometimes ignore the variability and uncertainty in the inputdata compared to the probabilistic methods which allow theincorporation of more variance in the data
In recent years the quantication understanding andmanagement of subsurface uncertainties has become increas-ingly important for oil and gas companies as they strive tooptimize reserve portfolios make better eld developmentdecisions and improve day-to-day technical operations suchaswell planning Stochastic approaches based on the standardvolumetric equation are now commonly used for screeningand value assessment of hydrocarbon assets Uncertainty instatic volumes and recoverable reserves are quantied byMonte Carlo sampling of probability distributions for thecontrolling parameters in the volumetric equation Volumesare calculated by simple multiplication of the sampled valuesfor each of the input distributions As the Monte Carlosampling and direct multiplication is very fast 1000s ofMonte Carlo loops can be run to provide reliable outputdistributions
Although these approaches are very fast it is oendifficult to estimate the intrinsic dependencies between theinput parameters and they provide no quantication orvisualization of the spatial location and variability of theuncertainty An alternative is to use a 3D model as the basisfor the volumetric calculationsis allows the dependenciesbetween the various input parameters to be treated in a realis-ticmanner and provides information on the spatial variabilityof the uncertainty [8] e main sources of uncertainty comefrom the reservoirrsquos geological structure the variability ofpetrophysical properties and the OWC and GOC locations[9 10] e probabilistic distribution of Gross Rock Volume(GRV) (MMcum) and Stock Tank Oil-in Place (STOIIP)(MMbbls) can then be obtained and used to get unbiasedvolume estimates and to quantify the risk associated withthem [11 12]
Mode (most likely)
Median (P50)
Mean (arithmetic average)
MaxMin
119891(119909)
Random variable119883
F 1 Measures of central tendency
Mode
Median
P50
Mean
MaxMin P90 P10
10090
50
100
Cu
mu
lati
ve (
)
grea
ter
than
or
equ
al t
oRandom variable
F 2 Percentiles
2 Geological Setting
e reservoir under study is referred to as Savrak Formationbelonging to Zagros petroliferous region e word ldquoSaravkrdquois derived from Tange Savrak in the mount Bnatsegnain Khuzestan Province and its type section is located insouthwest of the mount Bnagestan
is Formation is divided into three parts as lowermiddle and upper limestone Sarvak calcareous Formation inZagros is usually identied with two shallow and deep faciesand spans from Albian to Turonian [13]
3 Methodology
is study was carried in two steps A static model wasconstructed in the rst step and in order to obtain resultswith less errors uncertainty analysis of the resulted modelwas carried out in the second step
e existing information for the provision of static modelis as follows
(i) Data obtained from petrophysical logs of 9 wells(ii) Well trajectories and underground contour (UGC)
map on top of the reservoir(iii) Data obtained from core studies and petrographic
analyses
ree-dimensional model generation was performedusing the Petrel (Mark of Schlumberger) is sowareprogram is able to measure various parameters such as theamount of porosity uid permeability and water saturation
Journal of Geological Research 3
in each point by using petrophysical data of wells suchas acoustic nuclear and electrical logs and by employingpositioning and statistical methods [14]
Modeling is carried out in four main steps as follows(1) Data loading and data quality controlling (Data
input)(2) Structural modeling(3) Creation of three-dimensional petrophysical models
for reservoirs properties (property modeling)(4) Analysis of uncertainty and volumetric calculationsBriey aer loading data in the rst step and creating a
cohesive model proportionate to the existing map a blockedthree-dimensional network was produced (Figure 3) isnetwork as themain body of themodel enables the simultane-ous study of construction data and petrophysical propertiesin order to produce reality-oriented models Moreover whenproducing the petrophysical model it enables petrophysicalparameters dened for each well to be generalized to theentire reservoir
e candidate reservoir is divided into a blocked networkin which the properties of each block such as petrophysicaland lithological properties are equal in all volumes andsimilar properties in the blockswhich lack information can beestimated in view of distance between networks and the valueof data Obviously the higher the amount of this informationthemore realistic these estimationswill beedimensions ofblocks of this network in linewith119883119883 and119884119884have been set 100lowast100m and are separated with one-meter distance in reservoirzone and with two meters distance in nonreservoir zonesaer creation of horizons (Figure 4) and in time of layeringNext in the step of production of petrophysical models ofproperties petrophysical logs information was scaled up
Scale up means attribution of logs recorded values toblocks of three-dimensional network [15] Scaled up data areprocessed during variography step in terms of permanencyand normality (average of data is zero and their standarddeviation is 1) and related variograms are depicted
ere are several methods to assess normal data distribu-tion e two most common methods are considered below
e rst method is a graphical approach so that thecumulative frequency curve of data is plotted according tohigh-level categories on a paper of which one of the axes isarithmetic scale and the other axis a logarithmic scale Sincethe cumulative frequency curve of a normal distributionin terms of high-level categories in these coordinates is astraight line the closer the extension of the sum of pointsplotted on this paper to straight line the closer the datadistribution to normal e second method for evaluatingnormal distribution of data is the qualitativemethod For thispurpose it is sufficient to plot the histogram of data [16]
Variogram analysis is an important part of geostatisticalmodeling Indeed variogram shows the mean square differ-ence between the two values as a function of their increment[17] e value of variogram is calculated by
120574120574 (ℎ) =sum119899119899ℎ
119894119894=1 10076491007649119909119909119894119894 minus 119909119909119894119894119894ℎ100766510076652
2119899119899ℎ (1)
T 1 Parameters of variograms are delineated for porosity andsaturation data
Nugget Sill Effective range Variogram layer property0126 1 26052 spherical Layer 1
Porosity0092 1 28401 spherical Layer 20277 1 3800 spherical Layer 30290 1 35295 spherical Layer 1
Water saturation0095 1 40478 spherical Layer 20032 1 38432 spherical Layer 3
In the above equation 120574120574(ℎ) is called semivariogram and 2120574120574(ℎ)is called variogram and 119899119899ℎ is the number of pairs of pointswith the distance ℎ from each other participating in thevariogram 119909119909119894119894 is a grade in point 119894119894 and 119909119909119894119894119894ℎ is grade in a pointwith distance ℎ from the point 119894119894
By calculating variogram for different ℎ values the 120574120574(ℎ)diagram in terms of ℎ can be drawn and the ℎ value is calledlag
For many modeling the variogram model begins froma nonzero value and increases up to range called effectiverange (a) eventually reach to the constant value called sille effective range is the range in which the data spatialstructure is relevant and outside the range the data effect isindependent from each other [18] (Table 1)
Property modeling is usually used for inherent propertiesof a parameter Variogram is a tool for describing theseinherent properties [19] In other words variogram is amethod of analyzing and describing these spatial changesbased on the principle that samples close together are moresimilar than samples far from each other (Figure 5)
Following this three-dimensional model of reservoirproperties including porosity and water saturation are mod-eled by using output variograms of variography step bysequential Gaussian simulation method (one of probability-oriented methods) (Figures 6 and 7)
In sequential simulation methods the places lackingsample are consecutively visited in a stochastic manner untilall places without sample are visited In each place whichhas no sample multiple realizations can be obtained fromsimulated variable on the basis of estimation as well as localuncertainty and in the order that places without sample arevisited and the way in which a value in places without sampleare simulated Two sequential simulation methods whichare widely used are sequential index simulation (SIS) andsequential Gaussian simulation (SGS)
Sequential Gaussian simulation is the most widely usedgeostatistical method in the recent modeling projects ismethod is very simple and exible Sequential simulationof a variable is carried out in ve steps conversion of maindata to a new space variogram modeling in new spacedetermination of a stochastic route in order to visit all of theplaces lacking sample estimation of places without samplein alternate way and nally reversed conversion of simulatedvalues
4 Journal of Geological Research
660000657500
655000
652500
650000
2906000
2908000
2910000
2912000
2914000
minus1000
minus2000
minus3000
650000652000
654000656000658000660000
2914000
2912000
2910000
2908000
2906000
119885-axis
119885-axis
119884-axis
119884-axis
119883-axis
119883-axis
minus2000minus3000
minus1000
F 3 Structural grid of the studied reservoir dimensions of blocks are 100m lowast 100m lowast 1m along119883119883 119884119884 and 119885119885 directions respectively
652000656000
660000
2914000
2912000
2910000
2908000
2906000
660000
656000
652000
2909000
2910000
2911000
2912000
2913000
2914000
2915000
minus1000
minus1100
minus1200
119883-asis
119883-asis
119884-asis
119884-asis
F 4 Horizons generated in Petrel
Volumetric calculation produced models are performedon the basis of linear equation119861119861119874119874 andOWCvalues have beenset 12 and minus104 in laboratory and eld studies
For oil reservoirs the original oil-in place (OOIP) volu-metric calculation is [20] as follows
31 Imperial Consider
OOIP (STB) = Rock Volume lowast 7 758 lowast 120601120601 lowast (1 minus 119878119878119878119878) lowast 1119861119861119900119900
(2)
Journal of Geological Research 5
0
0
400
400
800
800
1200 1600 2000 2400 2800
1200
Nu
mb
er o
f p
airs
(5
97
7 i
n t
ota
l)
26
05
2
19
92
21
2
13
79
22
4
76
62
35
3
15
32
47
112
08
04
0
Sem
ivar
ian
ce
F 5 Variogram for porosity data in layer number oneVariogram type is spherical the sill is 1 and the nugget is 0126
where rock volume (acre feet) is the 119860119860 119860 119860 119860119860 is the drainagearea acres 119860 is the net pay thickness feet 7758 is the API Bblper acre-feet (converts acre-feet to stock tank barrels) 120601120601 is theporosity fraction of rock volume available to store uids 119878119878119878119878is the volume fraction of porosity lled with interstitial water119861119861119861119861 is the formation volume factor (Reservoir BblSTB) 1119861119861119861119861is the shrinkage (STBreservoir Bbl) 119861119861119861119861 and OWC valueshave been set 12 and minus107 in laboratory and eld studies
4 Uncertainty Analysis
e available data for oil and gas elds are in generalnot enough to minimize the uncertainties related to theconstruction of reservoir models e understanding ofuncertainties involved in reservoir modeling is an essentialtool to support decisions in the petroleum industry eknowledge of uncertainty management related to predictionof hydrocarbon volumes has increased in the last decadesas a result of reliable 3D geological models made availableby improvements in computer processing [21] Lelliott et algrouped the sources of uncertainties related to geologicalmodeling into data density (the density of boreholes usedto construct the model) data quality (quality of the dataused to construct the model including borehole elevationsample type drillingmethod and logging quality) geologicalcomplexity (geological variability throughout the site) andmodeling soware
According to Zabalza-Mezghani et al [22] the sourcesof uncertainties in reservoir engineering can be classi-ed as anywhere within the reservoir modeling workowSuch uncertainties are associated with the static model upscaling uid ow modeling production data integrationproduction scheme development and economic evaluationese authors classied the different uncertainty behaviors asdeterministic discrete and stochastic uncertainties [23]
So the uncertainties inherent to each input data set usedto build 3D static reservoir models cannot be expressed in asingle deterministic realization Each of the said calculationshas an inherent uncertainty which causes a major uncer-tainty in reservoir estimation in time of combination ree-dimensional models also follow this rule and the existence ofbig elements of uncertainty in modeling steps is undeniableis amount of error is usually determined by using volumet-ric equations but recent soware advancements have enabled
PorEff
030275025022502017501501250100750050025
F 6 Cross-section of porosity distribution which is modeledusing SGS algorithm Note align along 119868119868-Direction
the use of three-dimensional models as the foundation ofinvestigating this uncertainty in reservoir
e use of these three-dimensional models has manyadvantages over estimation based on direct application ofvolumetric equations Among these advantages is that three-dimensional models enable presentation of inherent correla-tions in a realistic attitude and this results in more accuracyin our estimation of uncertainty and creation of a betterfoundation for conscious capital management In a generalclassication we can mention analysis of uncertainty ofreservoirs impure stone volume uncertainty of properties ofstone and uid and uncertainty of simulations of ow inreservoir
In the present static model analysis of uncertainty isperformed on reservoir stone volume and consequently volu-metric calculations (which is affected by the said parameter)To this end such parameters as reservoir geometric structure(existing horizons and zones) depth of water and oil (OWC)and three-dimensional models produced for porosity andwater saturation have been studied Each of these factors isseparately studied and the amount of its effect on volumetriccalculation and the amount of oil is determined For thispurpose cycles are created in which a combination ofrealizations is created in each investigation by Mont Carlomethod and the effect of factor changes on the result ofvolumetric calculations are measured Next the best choice(closest sample to level of 50) and its seed number areidentied from among hundreds of produced samples eresults can be shown in histograms (Figures 8 9 and 10)in which probability level of 10 probability level of 50(reality-oriented model) and probability level of 90 havebeen identied and CDF curve can be depicted is way wecan study performance of that parameter on the amount ofoil
In analysis of uncertainty 300 realizations (normallybetween 50 and 500) for each of parameters under studywere produced by Mont Carlo method and the best routesfor creation of petrophysical models of reservoir were deter-mined e realization made by these routes is selected asoptimal model and the results of volumetric calculationare reported as estimations with highest probability andlowest error Finally aer studying the results of three-dimensional simulation of well data modeling distributionof petrophysical properties and analyzing uncertainty in thepresent model the depth of water and oil contact surface
6 Journal of Geological Research
Sw1
095
09
085
08
075
07
065
06
055
05
045
F 7 Cross-section of water saturation distribution which ismodeled using SGS algorithm Note align along 119868119868-Direction
1
08
06
04
02
0
1
08
06
04
02
0
Fraction
STOOIP
STOOIP
2885518119864+
8
2885518119864+
8
2885518119864+
8
2885518119864+
8
2885518119864+
8
2885518119864+
8
2885518119864+
8
2885518119864+
8
2885518119864+
8
2885518119864+
8
F 8 Uncertainty analysis which has performed on reservoirgeometry using onte Carlo method e gure shows effect ofreservoir geometry on calculated STOOIP
was determined as the most effective factor in creation ofuncertainty in themodel meaning that lowest changes in thisvalue have high effect on the amount of estimations becausethe depth has a direct effect on the volume of reservoir stone(geometrical structure of reservoir) and nally on the amountof estimation of reserve amount It is evident that in order tominimize this error (uncertainty) the certainty of this valuemust be increased To this end accurate recording of thisdepth in more wells and more situations in the reservoir cangive us a more reliable value (a more frequent value)
5 Conclusion
e results of geostatistical simulation and creation of three-dimensional models from petrophysical parameters andanalyses of uncertainty in reservoir indicated the following
(i) Sequential Gaussian simulation is very efficient indetermination and investigation of uncertainties ofthree-dimensional models owing to their high accu-racy absence of soening property and possibility to
26E
+8
25E
+8
24E
+8
23E
+8
27E
+8
28E
+8
29E
+8
3E
+8
31E
+8
32E
+8
33E
+8
34E
+8
35E
+8
36E
+8
37E
+8
38E
+8
26E
+8
25E
+8
24E
+8
23E
+8
27E
+8
28E
+8
29E
+8
3E
+8
31E
+8
32E
+8
33E
+8
34E
+8
35E
+8
36E
+8
37E
+8
38E
+8
0
008
016
024
032
04
016
0
008
016
024
032
04
016
Fracti
on
STOOIP
STOOIP
F 9 Uncertainty analysis which has performed on reservoirgeometry using onte Carlo method e gure shows effect ofOWC on calculated STOOIP
0
008
016
024
032
04
016
0
008
016
024
032
04
016
Fraction
STOOIP
STOOIP
23
+8
24
+8
25
+8
26
+8
27
+8
28
+8
29
+8
3+831
+8
32
+8
33
+8
34
+8
35
+8
36
+8
37
+8
38
+8
23
+8
24
+8
25
+8
26
+8
27
+8
28
+8
29
+83
+8
31
+8
32
+8
33
+8
34
+8
35
+8
36
+8
37
+8
38
+8
F 10 Uncertainty analysis which has performed on reservoirgeometry using onte Carlo method e gure shows effect ofproperty distribution on calculated STOOIP
create many three dimensional realizations in whichheterogeneity and scope of changes in variables areshown well
(ii) According to results of study of uncertainty the depthof water and oil contact surface was determined as themost effective parameter in calculations ereforeit is obvious that special care must be taken indetermination and investigation of changes of thissurface in reservoir ese changes have direct effecton geometry and total volume of reservoir (bulkvolume) and nally on the amount of reserves
(iii) e results of simulation showed that layer no 1 holdsthe highest volume of oil and has constituted oil zoneof the reservoir under study
Journal of Geological Research 7
(iv) Generally in the simulations performed the averageporosity of reservoir was about 20 and water satu-ration 52
(v) In volumetric calculations amount of reserves in themajor layer (layer 1) is estimated 280 million barrels
References
[1] M Nikravesh ldquoComputational intelligence for geosciences andoil explorationrdquo in Forging New Frontiers Fuzzy Pioneers I vol66 pp 267ndash332 California University Press 2007
[2] B Yeten and F Guumlmrah ldquoe use of fractal geostatistics andarticial neural networks for carbonate reservoir characteriza-tionrdquo Transport in Porous Media vol 41 no 2 pp 173ndash1952000
[3] G Zamora Valcarce T Zapata A Ansa and G Selva ldquoree-dimensional structural modeling and its application for devel-opment of the El Portn eld Argentinardquo AAPG Bulletin vol90 no 3 pp 307ndash319 2006
[4] R R Jones K J W McCaffrey P Clegg et al ldquoIntegration ofregional to outcrop digital data 3D visualisation of multi-scalegeological modelsrdquo Computers and Geosciences vol 35 no 1pp 4ndash18 2009
[5] R Haining Spatial Data Analysis eory and Practice Cam-brige University Press Cambrige UK 2003
[6] J W Jennings Jr F J Lucia S C Ruppel A John and GKatherine ldquo3D modeling of startigraphically controlled petro-physical variability in the South Wasson Clear Fork reservoirrdquoin Proceedings of the SPE Annual Technical Conference andExhibition pp 2209ndash2223 San Antonio Tex USA October2002
[7] O Kaufmann and T Martin ldquo3D geological modeling fromboreholes cross section and geological maps application overformer natural gas storages in coal minesrdquo Computers andGeosciences vol 34 pp 278ndash290 2008
[8] A MacDonald and J L Tollesfrud ldquo3D reservoir Uncertaintymodeling workows production and benetsrdquo Roxar Septem-ber 2008
[9] D P Hampson J S Schuelke and J A Quirein ldquoUse ofmultiattribute transforms to predict log properties from seismicdatardquo Geophysics vol 66 no 1 pp 220ndash236 2001
[10] P J Hatchell ldquoFault whispers transmission distortions onprestack seismic reection datardquo Geophysics vol 65 no 2 pp377ndash389 2000
[11] K Hirsche J Porter-Hirsche L Mewhort and R Davis ldquoeuse and abuse of geostatisticsrdquo Leading Edge vol 16 no 3 pp253ndash260 1997
[12] M T Olowokere ldquoGeostatistical modeling of interval velocityto quantifying hydrocarbon resource in multi-layer reservoirfrom TMB eld Niger deltardquo International Journal of PhysicalSciences vol 5 no 12 pp 1897ndash1907 2010
[13] H Motii ldquoGeology of Iran Zagros Geologyrdquo Geological Surveyof Iran 2009
[14] Schlumberger ldquoPetrel Introduction Courserdquo Seismic-to-Simulation Soware petrel introduction course 2008
[15] Schlumberger ldquoPetrel Introduction Courserdquo Shlumberger infor-mation solutions 2006
[16] M Abdideh and D Bargahi ldquoDesigning a 3D model forprediction the top of formation in oil elds using geostatisticalmethodsrdquo Geocarto International Journal vol 27 pp 569ndash5792012
[17] N Cressie and D M Hawkins ldquoRobust estimation of thevariogramrdquo Journal of the International Association for Math-ematical Geology vol 12 no 2 pp 115ndash125 1980
[18] R Corstanje S Grunwald and R M Lark ldquoInferences fromuctuations in the local variogram about the assumption ofstationarity in the variancerdquo Geoderma vol 143 no 1-2 pp123ndash132 2008
[19] Schlumberger ldquoProperty Modeling Courserdquo Shlumberger infor-mation solutions 2004
[20] L Dean ldquoReservoir engineering for geologistsrdquo Part 3mdashVolu-metric Estimation Reservoir no 11 pp 21ndash23 2007
[21] M R Lelliott M R Cave and G P Walthall ldquoA structuredapproach to the measurement of uncertainty in 3D geologicalmodelsrdquo Quarterly Journal of Engineering Geology and Hydro-geology vol 42 no 1 pp 95ndash105 2009
[22] I Zabalza-Mezghani E Manceau M Feraille and A JourdanldquoUncertainty management from geological scenarios to pro-duction scheme optimizationrdquo Journal of Petroleum Science andEngineering vol 44 no 1-2 pp 11ndash25 2004
[23] J F Bueno R D Drummond A C Vidal and S S SanceveroldquoConstraining uncertainty in volumetric estimation a casestudy from Namorado Field Brazilrdquo Journal of PetroleumScience and Engineering vol 77 no 2 pp 200ndash208 2011
Submit your manuscripts athttpwwwhindawicom
Hindawi Publishing Corporationhttpwwwhindawicom Volume 2014
ClimatologyJournal of
EcologyInternational Journal of
Hindawi Publishing Corporationhttpwwwhindawicom Volume 2014
EarthquakesJournal of
Hindawi Publishing Corporationhttpwwwhindawicom Volume 2014
Hindawi Publishing Corporationhttpwwwhindawicom
Applied ampEnvironmentalSoil Science
Volume 2014
Mining
Hindawi Publishing Corporationhttpwwwhindawicom Volume 2014
Journal of
Hindawi Publishing Corporation httpwwwhindawicom Volume 2014
International Journal of
Geophysics
OceanographyInternational Journal of
Hindawi Publishing Corporationhttpwwwhindawicom Volume 2014
Journal of Computational Environmental SciencesHindawi Publishing Corporationhttpwwwhindawicom Volume 2014
Journal ofPetroleum Engineering
Hindawi Publishing Corporationhttpwwwhindawicom Volume 2014
GeochemistryHindawi Publishing Corporationhttpwwwhindawicom Volume 2014
Journal of
Atmospheric SciencesInternational Journal of
Hindawi Publishing Corporationhttpwwwhindawicom Volume 2014
OceanographyHindawi Publishing Corporationhttpwwwhindawicom Volume 2014
Advances in
Hindawi Publishing Corporationhttpwwwhindawicom Volume 2014
MineralogyInternational Journal of
Hindawi Publishing Corporationhttpwwwhindawicom Volume 2014
MeteorologyAdvances in
The Scientific World JournalHindawi Publishing Corporation httpwwwhindawicom Volume 2014
Paleontology JournalHindawi Publishing Corporationhttpwwwhindawicom Volume 2014
ScientificaHindawi Publishing Corporationhttpwwwhindawicom Volume 2014
Hindawi Publishing Corporationhttpwwwhindawicom Volume 2014
Geological ResearchJournal of
Hindawi Publishing Corporationhttpwwwhindawicom Volume 2014
Geology Advances in
2 Journal of Geological Research
When calculating reserves using any of the above meth-ods two calculation procedures may be used deterministicandor probabilistic e deterministic method is by far themost common e procedure is to select a single value foreach parameter to input into an appropriate equation and toobtain a single answere probabilisticmethod on the otherhand is more rigorous and less commonly usedismethodutilizes a distribution curve for each parameter and throughthe use of Monte Carlo Simulation a distribution curve forthe answer can be developed Assuming good data a lotof qualifying information can be derived from the resultingstatistical calculations such as the minimum and maximumvalues the mean (average value) the median (middle value)the mode (most likely value) the standard deviation and thepercentiles see Figures 1 and 2
e probabilistic methods have several inherent prob-lems ey are affected by all input parameters including themost likely and maximum values for the parameters In suchmethods one cannot back calculate the input parametersassociated with reserves Only the end result is known butnot the exact value of any input parameter On the otherhand deterministic methods calculate reserve values thatare more tangible and explainable In these methods allinput parameters are exactly known however they maysometimes ignore the variability and uncertainty in the inputdata compared to the probabilistic methods which allow theincorporation of more variance in the data
In recent years the quantication understanding andmanagement of subsurface uncertainties has become increas-ingly important for oil and gas companies as they strive tooptimize reserve portfolios make better eld developmentdecisions and improve day-to-day technical operations suchaswell planning Stochastic approaches based on the standardvolumetric equation are now commonly used for screeningand value assessment of hydrocarbon assets Uncertainty instatic volumes and recoverable reserves are quantied byMonte Carlo sampling of probability distributions for thecontrolling parameters in the volumetric equation Volumesare calculated by simple multiplication of the sampled valuesfor each of the input distributions As the Monte Carlosampling and direct multiplication is very fast 1000s ofMonte Carlo loops can be run to provide reliable outputdistributions
Although these approaches are very fast it is oendifficult to estimate the intrinsic dependencies between theinput parameters and they provide no quantication orvisualization of the spatial location and variability of theuncertainty An alternative is to use a 3D model as the basisfor the volumetric calculationsis allows the dependenciesbetween the various input parameters to be treated in a realis-ticmanner and provides information on the spatial variabilityof the uncertainty [8] e main sources of uncertainty comefrom the reservoirrsquos geological structure the variability ofpetrophysical properties and the OWC and GOC locations[9 10] e probabilistic distribution of Gross Rock Volume(GRV) (MMcum) and Stock Tank Oil-in Place (STOIIP)(MMbbls) can then be obtained and used to get unbiasedvolume estimates and to quantify the risk associated withthem [11 12]
Mode (most likely)
Median (P50)
Mean (arithmetic average)
MaxMin
119891(119909)
Random variable119883
F 1 Measures of central tendency
Mode
Median
P50
Mean
MaxMin P90 P10
10090
50
100
Cu
mu
lati
ve (
)
grea
ter
than
or
equ
al t
oRandom variable
F 2 Percentiles
2 Geological Setting
e reservoir under study is referred to as Savrak Formationbelonging to Zagros petroliferous region e word ldquoSaravkrdquois derived from Tange Savrak in the mount Bnatsegnain Khuzestan Province and its type section is located insouthwest of the mount Bnagestan
is Formation is divided into three parts as lowermiddle and upper limestone Sarvak calcareous Formation inZagros is usually identied with two shallow and deep faciesand spans from Albian to Turonian [13]
3 Methodology
is study was carried in two steps A static model wasconstructed in the rst step and in order to obtain resultswith less errors uncertainty analysis of the resulted modelwas carried out in the second step
e existing information for the provision of static modelis as follows
(i) Data obtained from petrophysical logs of 9 wells(ii) Well trajectories and underground contour (UGC)
map on top of the reservoir(iii) Data obtained from core studies and petrographic
analyses
ree-dimensional model generation was performedusing the Petrel (Mark of Schlumberger) is sowareprogram is able to measure various parameters such as theamount of porosity uid permeability and water saturation
Journal of Geological Research 3
in each point by using petrophysical data of wells suchas acoustic nuclear and electrical logs and by employingpositioning and statistical methods [14]
Modeling is carried out in four main steps as follows(1) Data loading and data quality controlling (Data
input)(2) Structural modeling(3) Creation of three-dimensional petrophysical models
for reservoirs properties (property modeling)(4) Analysis of uncertainty and volumetric calculationsBriey aer loading data in the rst step and creating a
cohesive model proportionate to the existing map a blockedthree-dimensional network was produced (Figure 3) isnetwork as themain body of themodel enables the simultane-ous study of construction data and petrophysical propertiesin order to produce reality-oriented models Moreover whenproducing the petrophysical model it enables petrophysicalparameters dened for each well to be generalized to theentire reservoir
e candidate reservoir is divided into a blocked networkin which the properties of each block such as petrophysicaland lithological properties are equal in all volumes andsimilar properties in the blockswhich lack information can beestimated in view of distance between networks and the valueof data Obviously the higher the amount of this informationthemore realistic these estimationswill beedimensions ofblocks of this network in linewith119883119883 and119884119884have been set 100lowast100m and are separated with one-meter distance in reservoirzone and with two meters distance in nonreservoir zonesaer creation of horizons (Figure 4) and in time of layeringNext in the step of production of petrophysical models ofproperties petrophysical logs information was scaled up
Scale up means attribution of logs recorded values toblocks of three-dimensional network [15] Scaled up data areprocessed during variography step in terms of permanencyand normality (average of data is zero and their standarddeviation is 1) and related variograms are depicted
ere are several methods to assess normal data distribu-tion e two most common methods are considered below
e rst method is a graphical approach so that thecumulative frequency curve of data is plotted according tohigh-level categories on a paper of which one of the axes isarithmetic scale and the other axis a logarithmic scale Sincethe cumulative frequency curve of a normal distributionin terms of high-level categories in these coordinates is astraight line the closer the extension of the sum of pointsplotted on this paper to straight line the closer the datadistribution to normal e second method for evaluatingnormal distribution of data is the qualitativemethod For thispurpose it is sufficient to plot the histogram of data [16]
Variogram analysis is an important part of geostatisticalmodeling Indeed variogram shows the mean square differ-ence between the two values as a function of their increment[17] e value of variogram is calculated by
120574120574 (ℎ) =sum119899119899ℎ
119894119894=1 10076491007649119909119909119894119894 minus 119909119909119894119894119894ℎ100766510076652
2119899119899ℎ (1)
T 1 Parameters of variograms are delineated for porosity andsaturation data
Nugget Sill Effective range Variogram layer property0126 1 26052 spherical Layer 1
Porosity0092 1 28401 spherical Layer 20277 1 3800 spherical Layer 30290 1 35295 spherical Layer 1
Water saturation0095 1 40478 spherical Layer 20032 1 38432 spherical Layer 3
In the above equation 120574120574(ℎ) is called semivariogram and 2120574120574(ℎ)is called variogram and 119899119899ℎ is the number of pairs of pointswith the distance ℎ from each other participating in thevariogram 119909119909119894119894 is a grade in point 119894119894 and 119909119909119894119894119894ℎ is grade in a pointwith distance ℎ from the point 119894119894
By calculating variogram for different ℎ values the 120574120574(ℎ)diagram in terms of ℎ can be drawn and the ℎ value is calledlag
For many modeling the variogram model begins froma nonzero value and increases up to range called effectiverange (a) eventually reach to the constant value called sille effective range is the range in which the data spatialstructure is relevant and outside the range the data effect isindependent from each other [18] (Table 1)
Property modeling is usually used for inherent propertiesof a parameter Variogram is a tool for describing theseinherent properties [19] In other words variogram is amethod of analyzing and describing these spatial changesbased on the principle that samples close together are moresimilar than samples far from each other (Figure 5)
Following this three-dimensional model of reservoirproperties including porosity and water saturation are mod-eled by using output variograms of variography step bysequential Gaussian simulation method (one of probability-oriented methods) (Figures 6 and 7)
In sequential simulation methods the places lackingsample are consecutively visited in a stochastic manner untilall places without sample are visited In each place whichhas no sample multiple realizations can be obtained fromsimulated variable on the basis of estimation as well as localuncertainty and in the order that places without sample arevisited and the way in which a value in places without sampleare simulated Two sequential simulation methods whichare widely used are sequential index simulation (SIS) andsequential Gaussian simulation (SGS)
Sequential Gaussian simulation is the most widely usedgeostatistical method in the recent modeling projects ismethod is very simple and exible Sequential simulationof a variable is carried out in ve steps conversion of maindata to a new space variogram modeling in new spacedetermination of a stochastic route in order to visit all of theplaces lacking sample estimation of places without samplein alternate way and nally reversed conversion of simulatedvalues
4 Journal of Geological Research
660000657500
655000
652500
650000
2906000
2908000
2910000
2912000
2914000
minus1000
minus2000
minus3000
650000652000
654000656000658000660000
2914000
2912000
2910000
2908000
2906000
119885-axis
119885-axis
119884-axis
119884-axis
119883-axis
119883-axis
minus2000minus3000
minus1000
F 3 Structural grid of the studied reservoir dimensions of blocks are 100m lowast 100m lowast 1m along119883119883 119884119884 and 119885119885 directions respectively
652000656000
660000
2914000
2912000
2910000
2908000
2906000
660000
656000
652000
2909000
2910000
2911000
2912000
2913000
2914000
2915000
minus1000
minus1100
minus1200
119883-asis
119883-asis
119884-asis
119884-asis
F 4 Horizons generated in Petrel
Volumetric calculation produced models are performedon the basis of linear equation119861119861119874119874 andOWCvalues have beenset 12 and minus104 in laboratory and eld studies
For oil reservoirs the original oil-in place (OOIP) volu-metric calculation is [20] as follows
31 Imperial Consider
OOIP (STB) = Rock Volume lowast 7 758 lowast 120601120601 lowast (1 minus 119878119878119878119878) lowast 1119861119861119900119900
(2)
Journal of Geological Research 5
0
0
400
400
800
800
1200 1600 2000 2400 2800
1200
Nu
mb
er o
f p
airs
(5
97
7 i
n t
ota
l)
26
05
2
19
92
21
2
13
79
22
4
76
62
35
3
15
32
47
112
08
04
0
Sem
ivar
ian
ce
F 5 Variogram for porosity data in layer number oneVariogram type is spherical the sill is 1 and the nugget is 0126
where rock volume (acre feet) is the 119860119860 119860 119860 119860119860 is the drainagearea acres 119860 is the net pay thickness feet 7758 is the API Bblper acre-feet (converts acre-feet to stock tank barrels) 120601120601 is theporosity fraction of rock volume available to store uids 119878119878119878119878is the volume fraction of porosity lled with interstitial water119861119861119861119861 is the formation volume factor (Reservoir BblSTB) 1119861119861119861119861is the shrinkage (STBreservoir Bbl) 119861119861119861119861 and OWC valueshave been set 12 and minus107 in laboratory and eld studies
4 Uncertainty Analysis
e available data for oil and gas elds are in generalnot enough to minimize the uncertainties related to theconstruction of reservoir models e understanding ofuncertainties involved in reservoir modeling is an essentialtool to support decisions in the petroleum industry eknowledge of uncertainty management related to predictionof hydrocarbon volumes has increased in the last decadesas a result of reliable 3D geological models made availableby improvements in computer processing [21] Lelliott et algrouped the sources of uncertainties related to geologicalmodeling into data density (the density of boreholes usedto construct the model) data quality (quality of the dataused to construct the model including borehole elevationsample type drillingmethod and logging quality) geologicalcomplexity (geological variability throughout the site) andmodeling soware
According to Zabalza-Mezghani et al [22] the sourcesof uncertainties in reservoir engineering can be classi-ed as anywhere within the reservoir modeling workowSuch uncertainties are associated with the static model upscaling uid ow modeling production data integrationproduction scheme development and economic evaluationese authors classied the different uncertainty behaviors asdeterministic discrete and stochastic uncertainties [23]
So the uncertainties inherent to each input data set usedto build 3D static reservoir models cannot be expressed in asingle deterministic realization Each of the said calculationshas an inherent uncertainty which causes a major uncer-tainty in reservoir estimation in time of combination ree-dimensional models also follow this rule and the existence ofbig elements of uncertainty in modeling steps is undeniableis amount of error is usually determined by using volumet-ric equations but recent soware advancements have enabled
PorEff
030275025022502017501501250100750050025
F 6 Cross-section of porosity distribution which is modeledusing SGS algorithm Note align along 119868119868-Direction
the use of three-dimensional models as the foundation ofinvestigating this uncertainty in reservoir
e use of these three-dimensional models has manyadvantages over estimation based on direct application ofvolumetric equations Among these advantages is that three-dimensional models enable presentation of inherent correla-tions in a realistic attitude and this results in more accuracyin our estimation of uncertainty and creation of a betterfoundation for conscious capital management In a generalclassication we can mention analysis of uncertainty ofreservoirs impure stone volume uncertainty of properties ofstone and uid and uncertainty of simulations of ow inreservoir
In the present static model analysis of uncertainty isperformed on reservoir stone volume and consequently volu-metric calculations (which is affected by the said parameter)To this end such parameters as reservoir geometric structure(existing horizons and zones) depth of water and oil (OWC)and three-dimensional models produced for porosity andwater saturation have been studied Each of these factors isseparately studied and the amount of its effect on volumetriccalculation and the amount of oil is determined For thispurpose cycles are created in which a combination ofrealizations is created in each investigation by Mont Carlomethod and the effect of factor changes on the result ofvolumetric calculations are measured Next the best choice(closest sample to level of 50) and its seed number areidentied from among hundreds of produced samples eresults can be shown in histograms (Figures 8 9 and 10)in which probability level of 10 probability level of 50(reality-oriented model) and probability level of 90 havebeen identied and CDF curve can be depicted is way wecan study performance of that parameter on the amount ofoil
In analysis of uncertainty 300 realizations (normallybetween 50 and 500) for each of parameters under studywere produced by Mont Carlo method and the best routesfor creation of petrophysical models of reservoir were deter-mined e realization made by these routes is selected asoptimal model and the results of volumetric calculationare reported as estimations with highest probability andlowest error Finally aer studying the results of three-dimensional simulation of well data modeling distributionof petrophysical properties and analyzing uncertainty in thepresent model the depth of water and oil contact surface
6 Journal of Geological Research
Sw1
095
09
085
08
075
07
065
06
055
05
045
F 7 Cross-section of water saturation distribution which ismodeled using SGS algorithm Note align along 119868119868-Direction
1
08
06
04
02
0
1
08
06
04
02
0
Fraction
STOOIP
STOOIP
2885518119864+
8
2885518119864+
8
2885518119864+
8
2885518119864+
8
2885518119864+
8
2885518119864+
8
2885518119864+
8
2885518119864+
8
2885518119864+
8
2885518119864+
8
F 8 Uncertainty analysis which has performed on reservoirgeometry using onte Carlo method e gure shows effect ofreservoir geometry on calculated STOOIP
was determined as the most effective factor in creation ofuncertainty in themodel meaning that lowest changes in thisvalue have high effect on the amount of estimations becausethe depth has a direct effect on the volume of reservoir stone(geometrical structure of reservoir) and nally on the amountof estimation of reserve amount It is evident that in order tominimize this error (uncertainty) the certainty of this valuemust be increased To this end accurate recording of thisdepth in more wells and more situations in the reservoir cangive us a more reliable value (a more frequent value)
5 Conclusion
e results of geostatistical simulation and creation of three-dimensional models from petrophysical parameters andanalyses of uncertainty in reservoir indicated the following
(i) Sequential Gaussian simulation is very efficient indetermination and investigation of uncertainties ofthree-dimensional models owing to their high accu-racy absence of soening property and possibility to
26E
+8
25E
+8
24E
+8
23E
+8
27E
+8
28E
+8
29E
+8
3E
+8
31E
+8
32E
+8
33E
+8
34E
+8
35E
+8
36E
+8
37E
+8
38E
+8
26E
+8
25E
+8
24E
+8
23E
+8
27E
+8
28E
+8
29E
+8
3E
+8
31E
+8
32E
+8
33E
+8
34E
+8
35E
+8
36E
+8
37E
+8
38E
+8
0
008
016
024
032
04
016
0
008
016
024
032
04
016
Fracti
on
STOOIP
STOOIP
F 9 Uncertainty analysis which has performed on reservoirgeometry using onte Carlo method e gure shows effect ofOWC on calculated STOOIP
0
008
016
024
032
04
016
0
008
016
024
032
04
016
Fraction
STOOIP
STOOIP
23
+8
24
+8
25
+8
26
+8
27
+8
28
+8
29
+8
3+831
+8
32
+8
33
+8
34
+8
35
+8
36
+8
37
+8
38
+8
23
+8
24
+8
25
+8
26
+8
27
+8
28
+8
29
+83
+8
31
+8
32
+8
33
+8
34
+8
35
+8
36
+8
37
+8
38
+8
F 10 Uncertainty analysis which has performed on reservoirgeometry using onte Carlo method e gure shows effect ofproperty distribution on calculated STOOIP
create many three dimensional realizations in whichheterogeneity and scope of changes in variables areshown well
(ii) According to results of study of uncertainty the depthof water and oil contact surface was determined as themost effective parameter in calculations ereforeit is obvious that special care must be taken indetermination and investigation of changes of thissurface in reservoir ese changes have direct effecton geometry and total volume of reservoir (bulkvolume) and nally on the amount of reserves
(iii) e results of simulation showed that layer no 1 holdsthe highest volume of oil and has constituted oil zoneof the reservoir under study
Journal of Geological Research 7
(iv) Generally in the simulations performed the averageporosity of reservoir was about 20 and water satu-ration 52
(v) In volumetric calculations amount of reserves in themajor layer (layer 1) is estimated 280 million barrels
References
[1] M Nikravesh ldquoComputational intelligence for geosciences andoil explorationrdquo in Forging New Frontiers Fuzzy Pioneers I vol66 pp 267ndash332 California University Press 2007
[2] B Yeten and F Guumlmrah ldquoe use of fractal geostatistics andarticial neural networks for carbonate reservoir characteriza-tionrdquo Transport in Porous Media vol 41 no 2 pp 173ndash1952000
[3] G Zamora Valcarce T Zapata A Ansa and G Selva ldquoree-dimensional structural modeling and its application for devel-opment of the El Portn eld Argentinardquo AAPG Bulletin vol90 no 3 pp 307ndash319 2006
[4] R R Jones K J W McCaffrey P Clegg et al ldquoIntegration ofregional to outcrop digital data 3D visualisation of multi-scalegeological modelsrdquo Computers and Geosciences vol 35 no 1pp 4ndash18 2009
[5] R Haining Spatial Data Analysis eory and Practice Cam-brige University Press Cambrige UK 2003
[6] J W Jennings Jr F J Lucia S C Ruppel A John and GKatherine ldquo3D modeling of startigraphically controlled petro-physical variability in the South Wasson Clear Fork reservoirrdquoin Proceedings of the SPE Annual Technical Conference andExhibition pp 2209ndash2223 San Antonio Tex USA October2002
[7] O Kaufmann and T Martin ldquo3D geological modeling fromboreholes cross section and geological maps application overformer natural gas storages in coal minesrdquo Computers andGeosciences vol 34 pp 278ndash290 2008
[8] A MacDonald and J L Tollesfrud ldquo3D reservoir Uncertaintymodeling workows production and benetsrdquo Roxar Septem-ber 2008
[9] D P Hampson J S Schuelke and J A Quirein ldquoUse ofmultiattribute transforms to predict log properties from seismicdatardquo Geophysics vol 66 no 1 pp 220ndash236 2001
[10] P J Hatchell ldquoFault whispers transmission distortions onprestack seismic reection datardquo Geophysics vol 65 no 2 pp377ndash389 2000
[11] K Hirsche J Porter-Hirsche L Mewhort and R Davis ldquoeuse and abuse of geostatisticsrdquo Leading Edge vol 16 no 3 pp253ndash260 1997
[12] M T Olowokere ldquoGeostatistical modeling of interval velocityto quantifying hydrocarbon resource in multi-layer reservoirfrom TMB eld Niger deltardquo International Journal of PhysicalSciences vol 5 no 12 pp 1897ndash1907 2010
[13] H Motii ldquoGeology of Iran Zagros Geologyrdquo Geological Surveyof Iran 2009
[14] Schlumberger ldquoPetrel Introduction Courserdquo Seismic-to-Simulation Soware petrel introduction course 2008
[15] Schlumberger ldquoPetrel Introduction Courserdquo Shlumberger infor-mation solutions 2006
[16] M Abdideh and D Bargahi ldquoDesigning a 3D model forprediction the top of formation in oil elds using geostatisticalmethodsrdquo Geocarto International Journal vol 27 pp 569ndash5792012
[17] N Cressie and D M Hawkins ldquoRobust estimation of thevariogramrdquo Journal of the International Association for Math-ematical Geology vol 12 no 2 pp 115ndash125 1980
[18] R Corstanje S Grunwald and R M Lark ldquoInferences fromuctuations in the local variogram about the assumption ofstationarity in the variancerdquo Geoderma vol 143 no 1-2 pp123ndash132 2008
[19] Schlumberger ldquoProperty Modeling Courserdquo Shlumberger infor-mation solutions 2004
[20] L Dean ldquoReservoir engineering for geologistsrdquo Part 3mdashVolu-metric Estimation Reservoir no 11 pp 21ndash23 2007
[21] M R Lelliott M R Cave and G P Walthall ldquoA structuredapproach to the measurement of uncertainty in 3D geologicalmodelsrdquo Quarterly Journal of Engineering Geology and Hydro-geology vol 42 no 1 pp 95ndash105 2009
[22] I Zabalza-Mezghani E Manceau M Feraille and A JourdanldquoUncertainty management from geological scenarios to pro-duction scheme optimizationrdquo Journal of Petroleum Science andEngineering vol 44 no 1-2 pp 11ndash25 2004
[23] J F Bueno R D Drummond A C Vidal and S S SanceveroldquoConstraining uncertainty in volumetric estimation a casestudy from Namorado Field Brazilrdquo Journal of PetroleumScience and Engineering vol 77 no 2 pp 200ndash208 2011
Submit your manuscripts athttpwwwhindawicom
Hindawi Publishing Corporationhttpwwwhindawicom Volume 2014
ClimatologyJournal of
EcologyInternational Journal of
Hindawi Publishing Corporationhttpwwwhindawicom Volume 2014
EarthquakesJournal of
Hindawi Publishing Corporationhttpwwwhindawicom Volume 2014
Hindawi Publishing Corporationhttpwwwhindawicom
Applied ampEnvironmentalSoil Science
Volume 2014
Mining
Hindawi Publishing Corporationhttpwwwhindawicom Volume 2014
Journal of
Hindawi Publishing Corporation httpwwwhindawicom Volume 2014
International Journal of
Geophysics
OceanographyInternational Journal of
Hindawi Publishing Corporationhttpwwwhindawicom Volume 2014
Journal of Computational Environmental SciencesHindawi Publishing Corporationhttpwwwhindawicom Volume 2014
Journal ofPetroleum Engineering
Hindawi Publishing Corporationhttpwwwhindawicom Volume 2014
GeochemistryHindawi Publishing Corporationhttpwwwhindawicom Volume 2014
Journal of
Atmospheric SciencesInternational Journal of
Hindawi Publishing Corporationhttpwwwhindawicom Volume 2014
OceanographyHindawi Publishing Corporationhttpwwwhindawicom Volume 2014
Advances in
Hindawi Publishing Corporationhttpwwwhindawicom Volume 2014
MineralogyInternational Journal of
Hindawi Publishing Corporationhttpwwwhindawicom Volume 2014
MeteorologyAdvances in
The Scientific World JournalHindawi Publishing Corporation httpwwwhindawicom Volume 2014
Paleontology JournalHindawi Publishing Corporationhttpwwwhindawicom Volume 2014
ScientificaHindawi Publishing Corporationhttpwwwhindawicom Volume 2014
Hindawi Publishing Corporationhttpwwwhindawicom Volume 2014
Geological ResearchJournal of
Hindawi Publishing Corporationhttpwwwhindawicom Volume 2014
Geology Advances in