3rd quarter financials(from san miguel webste)
TRANSCRIPT
8/13/2019 3rd Quarter Financials(from san miguel webste)
http://slidepdf.com/reader/full/3rd-quarter-financialsfrom-san-miguel-webste 1/65
- 1 -
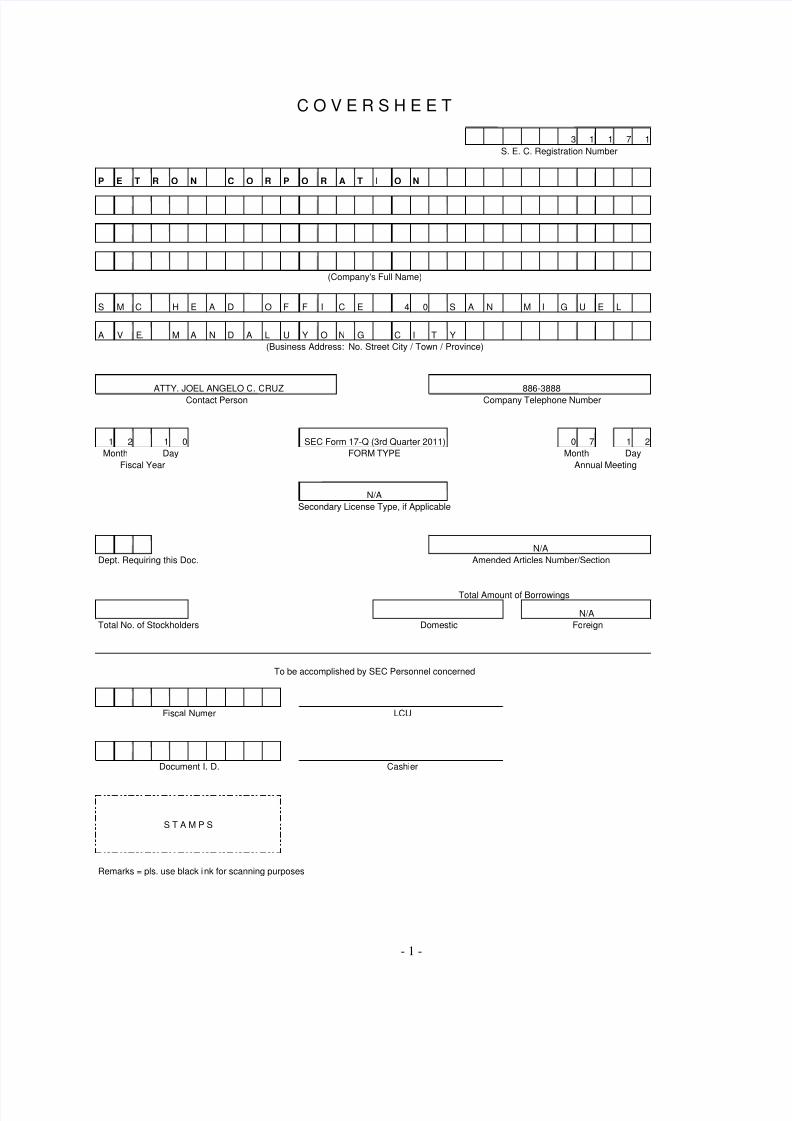
3 1 1 7 1
P E T R O N C O R P O R A T I O N
S M C H E A D O F F I C E 4 0 S A N M I G U E L
A V E. M A N D A L U Y O N G C I T Y
1 2 - 1 0 0 7 1 2
Dept. Requiring this Doc.
Total No. of Stockholders
Remarks = pls. use black ink for scanning purposes
C O V E R S H E E T
S. E. C. Registration Number
(Company's Full Name)
Fiscal Year
Month
(Business Address: No. Street City / Town / Province)
ATTY. JOEL ANGELO C. CRUZ 886-3888
Contact Person Company Telephone Number
SEC Form 17-Q (3rd Quarter 2011)
FORM TYPEMonth Day
N/A
Secondary License Type, if Applicable
N/A
Day
Annual Meeting
Domestic Foreign
To be accomplished by SEC Personnel concerned
Amended Articles Number/Section
N/A
Total Amount of Borrowings
S T A M P S
Fiscal Numer LCU
Document I. D. Cashier

8/13/2019 3rd Quarter Financials(from san miguel webste)
http://slidepdf.com/reader/full/3rd-quarter-financialsfrom-san-miguel-webste 2/65
- 2 -
SECURITIES AND EXCHANGE COMMISSION
SEC FORM 17-Q
QUARTERLY REPORT PURSUANT TO SECTION 17 OF THE SECURITIESREGULATION CODE AND SRC RULE 17 (2)(b) THEREUNDER
1. For the quarterly period ended September 30, 2011.
2. SEC Identification Number 31171 3. BIR Tax Identification No. 000-168-801
4. Exact name of registrant as specified in its charter PETRON CORPORATION
5. Philippines 6. (SEC Use Only)Province, Country or other jurisdiction of incorporation ororganization
Industry Classification Code:
7. SMC Head Office Complex, 40 San Miguel Avenue, Mandaluyong City, 1550Address of principal office
Postal Code
8. (0632) 886-3888Registrant's telephone number, including area code
9. N/A(Former name, former address, and former fiscal year, if changed since last report.)
10. Securities registered pursuant to Sections 8 and 12 of the SRC or Sections 4 and 8 of the RSA
Title of Each Class Number of Shares of Common StockOutstanding and Amount of DebtOutstanding
Common Stock 9,375,104,497 SharesPreferred Stock 100,000,000 SharesTotal Liabilities P111,676 million
8/13/2019 3rd Quarter Financials(from san miguel webste)
http://slidepdf.com/reader/full/3rd-quarter-financialsfrom-san-miguel-webste 3/65
- 3 -
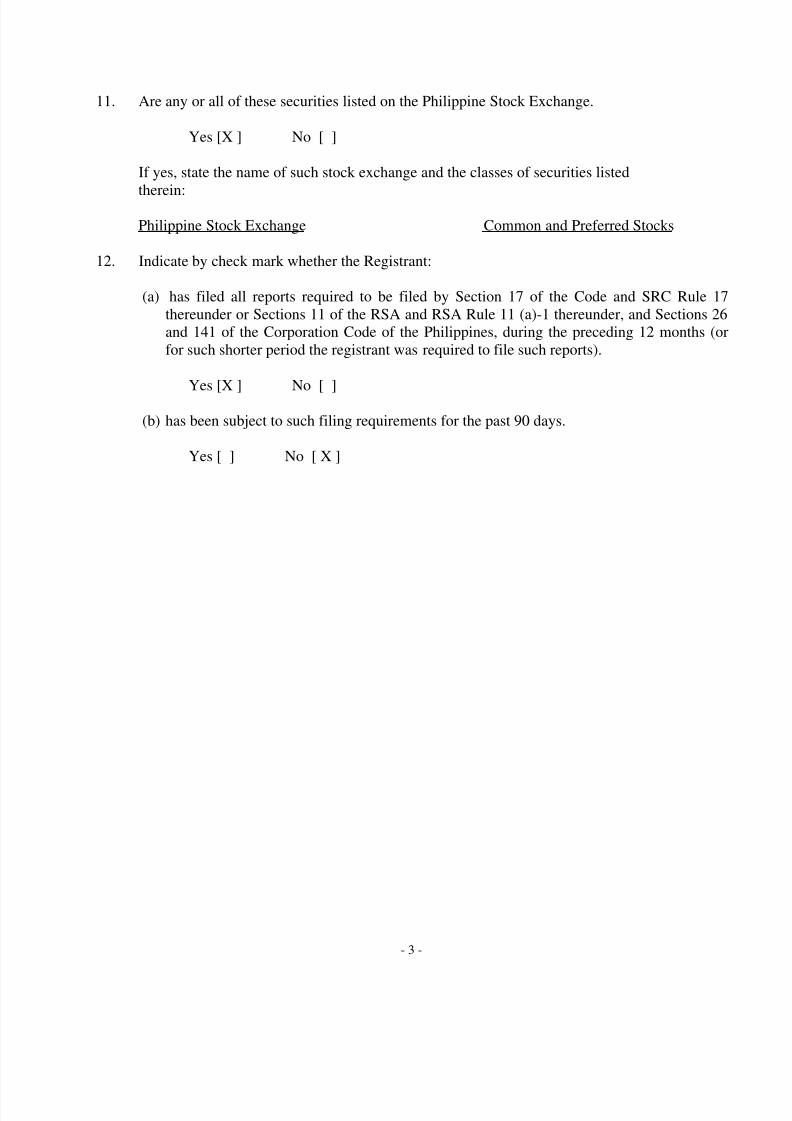
11. Are any or all of these securities listed on the Philippine Stock Exchange.
Yes [X ] No [ ]
If yes, state the name of such stock exchange and the classes of securities listed
therein:
Philippine Stock Exchange Common and Preferred Stocks
12. Indicate by check mark whether the Registrant:
(a) has filed all reports required to be filed by Section 17 of the Code and SRC Rule 17thereunder or Sections 11 of the RSA and RSA Rule 11 (a)-1 thereunder, and Sections 26and 141 of the Corporation Code of the Philippines, during the preceding 12 months (orfor such shorter period the registrant was required to file such reports).
Yes [X ] No [ ]
(b) has been subject to such filing requirements for the past 90 days.
Yes [ ] No [ X ]

8/13/2019 3rd Quarter Financials(from san miguel webste)
http://slidepdf.com/reader/full/3rd-quarter-financialsfrom-san-miguel-webste 4/65
- 4 -
TABLE OF CONTENTS
Page No.
PART I - FINANCIAL INFORMATIONItem 1 Financial Statements
Petron Corporation & SubsidiariesConsolidated Statements of FinancialPosition
5
Petron Corporation & SubsidiariesConsolidated Statements of Income
6
Petron Corporation & Subsidiaries
Consolidated Statements of ComprehensiveIncome 7
Petron Corporation & SubsidiariesConsolidated Statements of Changes inEquity
8
Petron Corporation & SubsidiariesConsolidated Statements of Cash Flows
9
Selected Notes to Consolidated Financial
Statements10-53
Details of Accounts Receivables 54
Item 2 Management’s Discussion and Analysis ofFinancial Conditions and Results ofOperations
55-63
PART II - OTHER INFORMATION
SIGNATURES 64

8/13/2019 3rd Quarter Financials(from san miguel webste)
http://slidepdf.com/reader/full/3rd-quarter-financialsfrom-san-miguel-webste 5/65
- 5 -

8/13/2019 3rd Quarter Financials(from san miguel webste)
http://slidepdf.com/reader/full/3rd-quarter-financialsfrom-san-miguel-webste 6/65
- 6 -

8/13/2019 3rd Quarter Financials(from san miguel webste)
http://slidepdf.com/reader/full/3rd-quarter-financialsfrom-san-miguel-webste 7/65
- 7 -

8/13/2019 3rd Quarter Financials(from san miguel webste)
http://slidepdf.com/reader/full/3rd-quarter-financialsfrom-san-miguel-webste 8/65
- 8 -

8/13/2019 3rd Quarter Financials(from san miguel webste)
http://slidepdf.com/reader/full/3rd-quarter-financialsfrom-san-miguel-webste 9/65
- 9 -

8/13/2019 3rd Quarter Financials(from san miguel webste)
http://slidepdf.com/reader/full/3rd-quarter-financialsfrom-san-miguel-webste 10/65
- 10 -
PETRON CORPORATION AND SUBSIDIARIES
SELECTED NOTES TO THE CONSOLIDATED FINANCIAL STATEMENTS(Amounts in Millions, Except Per Share Data)
1. Summary of Significant Accounting and Financial Reporting Policies
Petron Corporation and Subsidiaries (collectively referred to as the “Group”) prepared itsconsolidated interim financial statements as of and for the period ended September 30, 2011 andcomparative financial statements for the same period in 2010 following the new presentation rulesunder Philippine Accounting Standard (PAS) No. 34, Interim Financial Reporting. Theconsolidated financial statements of the Group have been prepared in compliance with PhilippineFinancial Reporting Standards (PFRS).
The consolidated financial statements are presented in Philippine peso and all values are rounded
to the nearest million (P=000,000), except when otherwise indicated.
The principal accounting policies and methods adopted in preparing the interim consolidatedfinancial statements of the Group are the same as those followed in the most recent annual auditedfinancial statements.
Adoption of New Standards, Amendments to Standards and InterpretationsThe Financial Reporting Standards Council (FRSC) approved the adoption of a number of new orrevised standards, amendments to standards, and interpretations [based on International FinancialReporting Interpretation Committee (IFRIC) Interpretations] as part of PFRS.
Amendments to Standard and Interpretations Adopted in 2011
Starting January 1, 2011, the Group adopted the following PFRS:
Prepayments of a Minimum Funding Requirement (Amendments to Philippine Interpretation
IFRIC 14: PAS 19 – The Limit on a Defined Benefit Asset, Minimum Funding Requirements
and their Interaction). These amendments remove unintended consequences arising from thetreatment of prepayments where there is a minimum funding requirement and result inprepayments of contributions in certain circumstances being recognized as an asset rather thanan expense. The amendments are effective for annual period beginning on or after January 1,2011.
Revised PAS 24, Related Party Disclosures (2009), amends the definition of a related partyand modifies certain related party disclosure requirements for government-related entities.The revised standard is effective for annual periods beginning on or after January 1, 2011.

8/13/2019 3rd Quarter Financials(from san miguel webste)
http://slidepdf.com/reader/full/3rd-quarter-financialsfrom-san-miguel-webste 11/65
- 11 -
Improvements to PFRSs 2010 contain 11 amendments to 6 standards and 1 interpretation, ofwhich only the following are applicable to the Group:
o PAS 1, Presentation of Financial Statements. The amendments clarify that disaggregationof changes in each component of equity arising from transactions recognized in other
comprehensive income also is required to be presented either in the statement of changesin equity or in the notes. The amendments are effective for annual periods beginning on orafter January 1, 2011.
o PAS 27, Consolidated and Separate Financial Statements. The amendments clarify thatthe consequential amendments to PAS 21, The Effects of Changes in Foreign Exchange
Rates, PAS 28, Investment in Associates, and PAS 31, Interest in Joint Ventures resultingfrom PAS 27 (2008) should be applied prospectively, with the exception of amendmentsresulting from renumbering. The amendments are effective for annual periods beginningon or after July 1, 2010.
o
PAS 34, Interim Financial Reporting. The amendments add examples to the list of eventsor transactions that require disclosure under PAS 34 and remove references to materialityin PAS 34 that describes other minimum disclosures. The amendments are effective forannual periods beginning on or after January 1, 2011.
o PFRS 1, First-time Adoption of PFRSs. The amendments: (i) clarify that PAS 8 is notapplicable to changes in accounting policies occurring during the period covered by anentity’s first PFRS financial statements; (ii) introduce guidance for entities that publishinterim financial information under PAS 34, Interim Financial Reporting and change eithertheir accounting policies or use of the PFRS 1 exemptions during the period covered bytheir first PFRS financial statements; (iii) extend the scope of paragraph D8 of PFRS 1 sothat an entity is permitted to use an event-driven fair value measurement as deemed cost forsome or all of its assets when such revaluation occurred during the reporting periodscovered by its first PFRS financial statements; and (iv) introduce an additional optionaldeemed cost exemption for entities to use the carrying amounts under previous GAAP asdeemed cost at the date of transition to PFRSs for items of property, plant and equipmentor intangible assets used in certain rate-regulated activities. The amendments are effectivefor annual periods beginning on or after January 1, 2011.

8/13/2019 3rd Quarter Financials(from san miguel webste)
http://slidepdf.com/reader/full/3rd-quarter-financialsfrom-san-miguel-webste 12/65
- 12 -
o PFRS 3, Business Combinations. The amendments: (i) clarify that contingent considerationarising in a business combination previously accounted for in accordance with PFRS 3(2004) that remains outstanding at the adoption date of PFRS 3 (2008) continues to beaccounted for in accordance with PFRS 3 (2004); (ii) limit the accounting policy choice tomeasure non-controlling interests upon initial recognition at fair value or at the non-
controlling interest’s proportionate share of the acquiree’s identifiable net assets toinstruments that give rise to a present ownership interest and that currently entitle theholder to a share of net assets in the event of liquidation; (iii) expand the current guidanceon the attribution of the market-based measure of an acquirer’s share-based paymentawards issued in exchange for acquiree awards between consideration transferred and post-combination compensation cost when an acquirer is obliged to replace the acquiree’sexisting awards to encompass voluntarily replaced unexpired acquiree awards. Theseamendments are effective for annual periods beginning on or after July 1, 2010.
o PFRS 7, Financial Instruments: Disclosures. The amendments add an explicit statementthat qualitative disclosure should be made in the context of the quantitative disclosures to
better enable users to evaluate the entity’s exposure to risks arising from financialinstruments. In addition, the IASB amended and removed existing disclosure requirements.The amendments are effective for annual periods beginning on or after January 1, 2011.
o Philippine Interpretation IFRIC 13, Customer Loyalty Programmes. The amendmentsclarify that the fair value of award credits takes into account the amount of discounts orincentives that otherwise would be offered to customers that have not earned the awardcredits. The amendments are effective for annual periods beginning on or after January 1,2011.
Philippine Interpretation IFRIC 19, Extinguishing Financial Liabilities with Equity
Instruments, addresses issues in respect of the accounting by the debtor in a debt for equityswap transaction. It clarifies that equity instruments issued to a creditor to extinguish all orpart of the financial liability in a debt for equity swap are consideration paid in accordancewith PAS 39 paragraph 41. The interpretation is applicable for annual period beginning on orafter July 1, 2010.
The adoption of these foregoing new or revised standards, amendments to standards andPhilippine Interpretations of IFRIC did not have a material effect on the interim consolidatedfinancial statements.

8/13/2019 3rd Quarter Financials(from san miguel webste)
http://slidepdf.com/reader/full/3rd-quarter-financialsfrom-san-miguel-webste 13/65
- 13 -
New or Revised Standards, Amendments to Standards and Interpretations Not Yet Adopted
The Group will adopt the following new or revised standards, amendments to standards andinterpretations in the respective effective dates:
Disclosures - Transfers of Financial Assets (Amendments to PFRS 7), require additionaldisclosures about transfers of financial assets. The amendments require disclosure of
information that enables users of financial statements to understand the relationship betweentransferred financial assets that are not derecognized in their entirety and the associatedliabilities; and to evaluate the nature of, and risks associated with, the entity’s continuinginvolvement in derecognized financial assets. Entities are required to apply the amendmentsfor annual periods beginning on or after July 1, 2011.
Philippine Interpretation IFRIC 15, Agreements for the Construction of Real Estate, appliesto the accounting for revenue and associated expenses by entities that undertake theconstruction of real estate directly or through subcontractors. It provides guidance on the
recognition of revenue among real estate developers for sales of units, such as apartments orhouses, “off plan”; i.e., before construction is completed. It also provides guidance on how todetermine whether an agreement for the construction of real estate is within the scope of PAS11, Construction Contracts, or PAS 18, Revenue, and the timing of revenue recognition. Theinterpretation is effective for annual periods beginning on or after January 1, 2012.
The Group will assess the impact of the new or revised standards, amendments to standards andinterpretations on the consolidated financial statements upon adoption on their respectiveeffective dates.
PFRS 9, Financial Instruments (2009) was issued as the first phase of the PAS 39replacement project. The chapters of the standard released in 2009 only related toclassification and measurement of financial assets. PFRS 9 (2009) retains but simplifies themixed measurement model and establishes two primary measurement categories for financialassets: amortized cost and fair value. The basis of classification depends on the entity’sbusiness model and contractual cash flow characteristics of the financial asset. In October2010, a new version of PFRS 9, Financial Instruments (2010) was issued which now includesall the requirements of PFRS 9 (2009) without amendment. The new version of PFRS 9 alsoincorporates requirements with respect to the classification and measurement of financialliabilities and the derecognition of financial assets and financial liabilities. The guidance inPAS 39 on impairment of financial assets and hedge accounting continues to apply. The newstandard is effective for annual periods beginning on or after January 1, 2013. PFRS 9 (2010)supersedes PFRS 9 (2009). However, for annual periods beginning before January 1, 2013,an entity may elect to apply PFRS 9 (2009) rather than PFRS 9 (2010).

8/13/2019 3rd Quarter Financials(from san miguel webste)
http://slidepdf.com/reader/full/3rd-quarter-financialsfrom-san-miguel-webste 14/65
- 14 -
The Group has decided not to early adopt either PFRS 9 (2009) or PFRS 9 (2010) for its 2011annual financial reporting. The Group shall conduct in early 2012 another impact evaluationusing the outstanding balances as of December 31, 2011. The Group’s decision whether to earlyadopt either PFRS 9 (2009) or PFRS 9 (2010) for the 2012 financial reporting shall be disclosedin the Group’s interim financial statements as of March 31, 2012.
2. Segment Information
Management identifies segments based on business and geographic locations. These operatingsegments are monitored and strategic decisions are made on the basis of adjusted segmentoperating results. The CEO (the chief operating decision maker) reviews management reports on aregular basis.
The Group’s major sources of revenues are as follows:
a. Sales of petroleum and other related products which include gasoline, diesel and keroseneoffered to motorists and public transport operators through its service station network aroundthe country.
b. Insurance premiums from the business and operation of all kinds of insurance andreinsurance, on sea as well as on land, of properties, goods and merchandise, of transportationor conveyance, against fire, earthquake, marine perils, accidents and all others forms and linesof insurance authorized by law, except life insurance.
c. Lease of acquired real estate properties for petroleum, refining, storage and distributionfacilities, gasoline service stations and other related structures.
d. Sales on wholesale or retail and operation of service stations, retail outlets, restaurants, andthe like.
e. Export sales of various petroleum and non-fuel products to other Asian countries such asSouth Korea, Taiwan, China, Thailand, Indonesia, Singapore, Cambodia, Japan, India, UAE,Pakistan and Malaysia.
Segment Assets and LiabilitiesSegment assets include all operating assets used by a segment and consist principally of operatingcash, receivables, inventories, and property, plant and equipment, net of allowances andimpairment. Segment liabilities include all operating liabilities and consist principally of accountspayable, wages, taxes currently payable and accrued liabilities. Segment assets and liabilities donot include deferred taxes.

8/13/2019 3rd Quarter Financials(from san miguel webste)
http://slidepdf.com/reader/full/3rd-quarter-financialsfrom-san-miguel-webste 15/65
- 15 -
Inter-segment TransactionsSegment revenues, expenses and performance include sales and purchases between operatingsegments. Transfer prices between operating segments are set on an arm’s length basis in amanner similar to transactions with third parties. Such transfers are eliminated in consolidation.The following tables present revenue and income information and certain asset and liability
information regarding the business segments as of September 30, 2011 and December 31, 2010and for the nine months ended September 30, 2011 and 2010. Segment assets and liabilitiesexclude deferred tax assets and deferred tax liabilities:
Petroleum Insurance Leasing Marketing Elimination Total
Period Ended Sept. 30,2011Revenue
External Sales P200,702 P - P - P1,227 P - P201,929Inter-segment Sales 159,033 89 265 - (159,387) -Segment results 12,588 70 123 65 268 13,114Net income 7,581 120 32 75 (208) 7,600
As of Sept. 30, 2011Assets and liabilitiesSegment assets 190,536 1,877 3,437 832 (25,891) 170,791Segment liabilities 131,297 243 2,497 161 (24,294) 109,904
Other segment informationProperty, plant and
equipment 39,495 - - 216 3,267 42,978Depreciation and
amortization 2,676 - - 29 - 2,705
Period Ended Sept. 30,2010Revenue
External Sales P166,434 P - P - P3,364 P - P169,798
Inter-segment Sales 2,354 107 247 - (2,708) -Segment results 8,459 89 128 122 107 8,905
Net income 5,075 132 44 120 (24) 5,347
As of Dec. 31, 2010
Assets and liabilitiesSegment assets 163,823 2,086 2,935 1,097 (8,153) 161,788
Segment liabilities 108,665 559 2,027 303 (5,040) 106,514
Other segment informationProperty, plant and
equipment 31,753 - 1 379 2,824 34,957
Depreciation andamortization 3,419 - - 65 (1) 3,483

8/13/2019 3rd Quarter Financials(from san miguel webste)
http://slidepdf.com/reader/full/3rd-quarter-financialsfrom-san-miguel-webste 16/65
- 16 -
The following tables present additional information on the petroleum business segment as ofSeptember 30, 2011 and December 31, 2010 and for the nine months ended September 30, 2011and 2010:
Retail Lube Gasul Industrial Others Total
Property, plant andequipmentAs of September 30, 2011 P4,990 P293 P211 P73 P33,921 P39,488As of December 31, 2010 4,524 345 181 43 26,660 31,753
Capital Expenditures As of September 30, 2011 P492 P - P44 P6 P11,880 P12,422As of December 31, 2010 169 1 8 2 2,615 2,795
Revenue
Period ended Sept. 30, 2011 P79,885 P1,855 P14,668 P78,187 P26,822 P201,417Period ended Sept. 30, 2010 67,632 1,594 10,855 69,742 18,964 168,787
Geographical Segments
The following table presents revenue information regarding the geographical segments of the Group for the nine months ended September 30, 2011 and 2010.
Petroleum Insurance Leasing Marketing Elimination Total
Period endedSeptember 30, 2011Revenue
Local P181,085 P56 P265 P1,227 (P1,742) P180,891
Export/International 178,650 33 - - (157,645) 21,038
Period ended
September 30, 2010 Revenue
Local P154,830 P63 P247 P3,364 (P2,708) P155,796
Export/International 13,958 44 - - - 14,002

8/13/2019 3rd Quarter Financials(from san miguel webste)
http://slidepdf.com/reader/full/3rd-quarter-financialsfrom-san-miguel-webste 17/65
- 17 -
3. Related Party Transactions
Lease Agreement
On September 30, 2009, New Ventures Realty Corporation entered into a 25-year lease with the
Philippine National Oil Company (PNOC) without rent-free period, covering a property whichshall be used for refinery, commencing January 1, 2010 and ending on December 31, 2039. Theannual rental shall be P93 payable on the 15
th day of January each year without the necessity of
demand. This non-cancellable lease is subject to renewal options and annual escalation clauses of3% per annum up to 2011. The leased premises shall be reappraised starting 2012 and every fifthyear thereafter in which the new rental rate shall be determined equivalent to 5% of thereappraised value, and still subject to annual escalation clause of 3% for the four years followingthe appraisal. Prior to this agreement, Petron has an outstanding lease agreement on the sameproperty from PNOC. Also, as of September 30, 2011, Petron leases other parcels of land fromPNOC for its bulk plants and service stations.
Transactions with Current Owners/Related Parties
a. Sales relate to the Parent Company’s supply agreements with various subsidiaries of SanMiguel Corporation (SMC). Under these agreements, the Parent Company supplies thebunker, diesel fuel and lube requirements of selected SMC plants and subsidiaries.
b. Purchases relate to purchase of goods and services such as construction, informationtechnology and shipping.
c. Petron entered into lease agreement with San Miguel Properties, Inc. (SMPI) for its officespace covering 6,759 square meters with a monthly rate of P3.9. The lease, which commenced
on June 1, 2011, is for a period of one year and maybe renewed for a period in accordancewith the written agreement of the parties.
d. The Parent Company also pays SMC for its share in common expenses such as utilities andadministrative fees.
e. The Parent Company has advances to Petron Corporation Employee Retirement Plan(PCERP) amounting to P22,668 and P22,435 as of September 30, 2011 and December 31,2010, respectively, included as part of “Other noncurrent assets” account.
f. As of September 30, 2011, the Parent Company has current receivables of P172 andnoncurrent receivables of P529 from Petrochemical Asia (HK) Limited included as part of“Other current assets” and “Other noncurrent assets” accounts, respectively.

8/13/2019 3rd Quarter Financials(from san miguel webste)
http://slidepdf.com/reader/full/3rd-quarter-financialsfrom-san-miguel-webste 18/65
- 18 -
The balances and transactions with related parties as of September 30, 2011 and December 31,2010 follows:
Revenue Purchases Amounts Amountsfrom from owed by owed to
September 30, 2011 Relationship with Related Related Related RelatedRelated Parties Related parties Parties Parties Parties Parties
SMC Ultimate Parent P1 P56 P0.07 P3
Distileria Bago, Inc. Under common 374 - 131 -control
San Miguel Brewery Inc. Under common 677 0.18 97 44control
San Miguel Yamamura Under common 532 0.19 108 -Packaging Corporation control
SMC Shipping and Under common 302 555 48 43Lighterage Corporation control
Ginebra San Miguel, Inc. Under common 106 12 19 5control
San Miguel Foods, Inc. Under common 229 0.02 31 -control
San Miguel Energy Under common 87 453 - 56Corporation control
San Miguel Yamamura Under common 575 - 83 -Asia Corporation control
Challenger Aero Air Under common 20 - 13 -Corporation control
Mindanao Corrugated Under common 31 - 4 -Fibreboard, Inc. control
San Miguel Purefoods Under common 125 2 40 1Company, Inc. control
Archen Technologies, Inc. Under common 12 307 - 93control
SMPI Under common - 40 29 -control
Others Under common 27 55 16 12control
P3,098 P1,480.39 P619.07 P257

8/13/2019 3rd Quarter Financials(from san miguel webste)
http://slidepdf.com/reader/full/3rd-quarter-financialsfrom-san-miguel-webste 19/65
- 19 -
Revenue Purchases Amounts Amounts
from from owed by owed toDecember 31, 2010 Relationship with Related Related Related RelatedRelated Parties Related parties Parties Parties Parties Parties
SMC Ultimate Parent P1 P29 P2 P33
PanAsia Energy Under common 8,045 - 1,428 -Holdings, Inc. control
Distileria Bago, Inc. Under common 720 - 38 -control
San Miguel Brewery Inc. Under common 573 0.60 100 -control
San Miguel Yamamura Under common 350 - 51 -Packaging Corporation control
SMC Shipping and Under common 304 407 46 13Lighterage Corporation control
Ginebra San Miguel, Inc. Under common 169 0.30 58 -control
San Miguel Foods, Inc. Under common 150 3 36 -control
San Miguel Energy Under common 83 - 25 -Corporation control
San Miguel Yamamura Under common 40 - 40 -Asia Corporation control
Challenger Aero Air Under common 22 2 9 -Corporation control
Mindanao Corrugated Under common 17 - 4 -Fibreboard, Inc. control
San Miguel Purefoods Under common 14 4 - 7Company, Inc. control
Archen Technologies, Inc. Under common 12 227 2 26control
SMPI Under common - 63 - 5control
San Miguel Paper Under common - - 49 -Packaging Corporation control
Others Under common 12 39 5 6control
P10,512 P774.90 P1,893 P90

8/13/2019 3rd Quarter Financials(from san miguel webste)
http://slidepdf.com/reader/full/3rd-quarter-financialsfrom-san-miguel-webste 20/65
- 20 -
4. Property, Plant and Equipment
Property, plant and equipment consists of:
September 30, 2011
January 1, 2011Additions and
TransfersDisposals and
Reclassifications Sept. 30, 2011
Cost:
Buildings P8,055 P42 (P2) P8,095
Machinery & Equipment 5,816 (198) - 5,618
Refinery and PlantEquipment 37,292 83 - 37,375
Service Stations and OtherEquipment 5,353 301 (8) 5,646
Transportation Equipment 519 63 (20) 562
Office Equipment,Furniture & Fixtures 1,626 187 (62)
1,751
Land Improvements 4,332 430 - 4,762
Leasehold Improvements 194 12 - 206
Capital Projects in Progress 2,796 9,626 - 12,422
65,983 10,546 (92) 76,437
Accumulated Depreciation:
Buildings (3,714) (248) - (3,962)
Machinery & Equipment (3,907) (168) - (4,075) Refinery and Plant
Equipment (16,552) (1,516) - (18,068) Service Stations and Other
Equipment (3,756) (362) 6 (4,112)
Transportation Equipment (355) (38) 19 (374) Office Equipment,
Furniture & Fixtures (1,373) (95) 48 (1,420)
Land Improvements (1,271) (27) - (1,298)
Leasehold Improvements (98) (52) - (150)
(31,026) (2,506) 73 (33,459)
Net Book Value P34,957 P8,040 (P19) P42,978
8/13/2019 3rd Quarter Financials(from san miguel webste)
http://slidepdf.com/reader/full/3rd-quarter-financialsfrom-san-miguel-webste 21/65
- 21 -
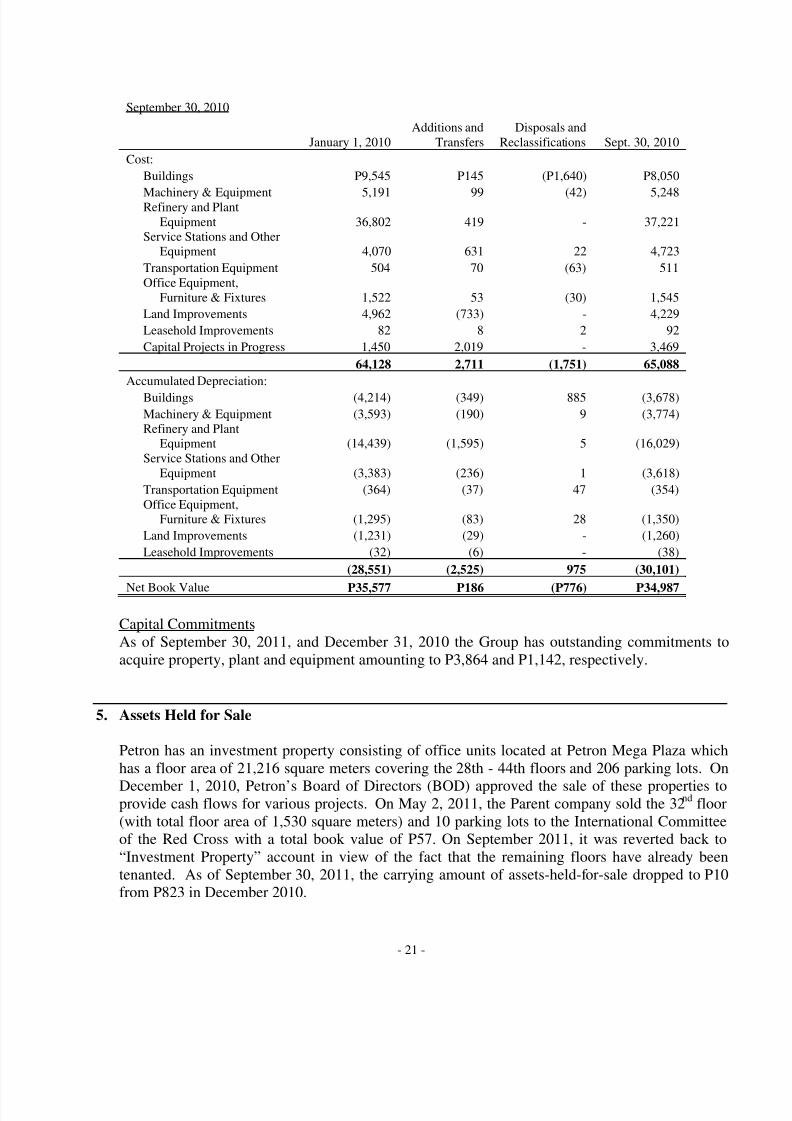
September 30, 2010
January 1, 2010Additions and
TransfersDisposals and
Reclassifications Sept. 30, 2010
Cost:
Buildings P9,545 P145 (P1,640) P8,050
Machinery & Equipment 5,191 99 (42) 5,248Refinery and PlantEquipment 36,802 419 - 37,221
Service Stations and OtherEquipment 4,070 631 22 4,723
Transportation Equipment 504 70 (63) 511Office Equipment,
Furniture & Fixtures 1,522 53 (30) 1,545
Land Improvements 4,962 (733) - 4,229
Leasehold Improvements 82 8 2 92
Capital Projects in Progress 1,450 2,019 - 3,469
64,128 2,711 (1,751) 65,088
Accumulated Depreciation:
Buildings (4,214) (349) 885 (3,678)
Machinery & Equipment (3,593) (190) 9 (3,774)Refinery and Plant
Equipment (14,439) (1,595) 5 (16,029)Service Stations and Other
Equipment (3,383) (236) 1 (3,618)
Transportation Equipment (364) (37) 47 (354)Office Equipment,
Furniture & Fixtures (1,295) (83) 28 (1,350)
Land Improvements (1,231) (29) - (1,260)
Leasehold Improvements (32) (6) - (38)
(28,551) (2,525) 975 (30,101)
Net Book Value P35,577 P186 (P776) P34,987
Capital CommitmentsAs of September 30, 2011, and December 31, 2010 the Group has outstanding commitments toacquire property, plant and equipment amounting to P3,864 and P1,142, respectively.
5. Assets Held for Sale
Petron has an investment property consisting of office units located at Petron Mega Plaza whichhas a floor area of 21,216 square meters covering the 28th - 44th floors and 206 parking lots. On
December 1, 2010, Petron’s Board of Directors (BOD) approved the sale of these properties toprovide cash flows for various projects. On May 2, 2011, the Parent company sold the 32
nd floor
(with total floor area of 1,530 square meters) and 10 parking lots to the International Committeeof the Red Cross with a total book value of P57. On September 2011, it was reverted back to“Investment Property” account in view of the fact that the remaining floors have already beentenanted. As of September 30, 2011, the carrying amount of assets-held-for-sale dropped to P10from P823 in December 2010.

8/13/2019 3rd Quarter Financials(from san miguel webste)
http://slidepdf.com/reader/full/3rd-quarter-financialsfrom-san-miguel-webste 22/65
- 22 -
6. Fuel Supply Contract
The Parent Company entered into various fuel supply contracts with National Power Corporation(NPC). Under the agreements, the Parent Company supplies the bunker and diesel fuel oilrequirements of NPC, its Independent Power Producers (IPP) and Small Power Utility Groups
(SPUG) power plants/barges. For the nine months ended September 30, 2011, the following arethe fuel supply contracts granted to Petron:
Bid DateDate ofAward Contract Duration
IFO**(in KL**)
IFO(Amount)
DFO**(in KL)
DFO(Amount)
Jan 12, 2011 Jan 31, 2011 Jan to Dec 2011 44,587 P1,127 15,192 P490
Mar 10, 2011 Mar 23, 2011 Apr to Jun 2011 4,833 140 9,560 373
Jun 17, 2011 Jul 8, 2011 Jul to Dec 2011 87,000 3,074
Jul 1, 2011 Jul 6, 2011 Jul to Aug 2011 1,326 48 2,791 121
Jul 18, 2011 Jul 25, 2011 Jul to Aug 2011 1,610 71
Aug 26, 2011 Aug 26, 2011 Apr to Jun 2011 1,207 35 569 22
Sep 5, 2011 Sep 20, 2011 Sep to Dec 2011 5,709 197 22,913 980
Sep 15, 2011 Sep 16, 2011 Sep to Dec 2011 900 36
** IFO = Industrial Fuel Oil
DFO = Diesel Fuel Oil
KL = Kilo Liters
7. Earnings Per Share
Basic and diluted earnings per share amounts for the nine months ended September 30, 2011 and
2010 are as follows:
2011 2010
Net income attributable to equity holders of theParent Company P7,581 P5,320
Dividends on preferred shares for the period 714 476Net income attributable to common shareholders
of Parent Company P6,867 P4,844Weighted average number of common shares
outstanding (in millions) 9,375 9,375
Basic/diluted earnings per common share P0.73 P0.52
As of September 30, 2011 and 2010, the Group has no dilutive debt or equity instruments.

8/13/2019 3rd Quarter Financials(from san miguel webste)
http://slidepdf.com/reader/full/3rd-quarter-financialsfrom-san-miguel-webste 23/65
- 23 -
8. Dividends
Cash dividends declared by the Parent Company’s BOD to common shareholders amounted toP0.10 per share as of September 30, 2011 and 2010.
While cash dividends declared by the Parent Company’s BOD to preferred stockholdersamounted to P7.146 per share as of September 30, 2011 and P4.764 per share as of September 30,2010.
9. Investment in an Associate
On January 3, 2011, Petron entered into a Share Sale and Purchase Agreement with HarbourCentre Port Terminal, Inc. for the purchase of 35% of the outstanding and issued capital stock ofManila North Harbour Port Inc.
10. Commitments and Contingencies
Unused Letters of Credit and Outstanding Standby Letters of Credit
Petron has unused letters of credit amounting to approximately P13 as of September 30, 2011 andP532 as of December 31, 2010. On the other hand, outstanding standby letters of credit for crudeimportations amounted to P18,272 and P8,704 as of September 30, 2011 and December 31, 2010,respectively.
Tax Credit Certificates Related Cases
In 1998, Petron contested before the Court of Tax Appeals (CTA), the collection by theBureau of Internal Revenue (BIR) of deficiency taxes arising from the company’sacceptance and use of Tax Credit Certificates (TCCs) worth P659 million from 1993-1997. The CTA ruled in favor of Petron. The BIR then appealed the case to the Court ofAppeals (CA) after which the CA issued a resolution suspending decision on the case untilthe termination of the Department of Finance (DOF) investigation. Petron filed a motionfor reconsideration which remains pending at the moment.
In May 2002, the BIR issued a collection letter for deficiency taxes of P254 million plusinterest and charges for the years 1995-1998, as a result of the cancellation of the TaxDebit Memos and TCCs by the DOF Center ExCom. Petron elevated the protest to theCTA. The Second Division CTA denied Petron’s Petition for Review for lack of merit.Petron then appealed the case with the CTA En Banc. On December 3, 2008, the CTA EnBanc promulgated a decision reversing the unfavorable decision of the CTA 2nd Division.The CIR filed a Petition for Review with the Supreme Court where the case remainssubmitted for resolution.

8/13/2019 3rd Quarter Financials(from san miguel webste)
http://slidepdf.com/reader/full/3rd-quarter-financialsfrom-san-miguel-webste 24/65
- 24 -
Pandacan Terminal OperationsPandacan Terminal OperationsPandacan Terminal OperationsPandacan Terminal Operations
Citing concerns for safety, security and health, the City of Manila passed City OrdinanceNo. 8027 which reclassified the Pandacan Terminal from industrial to commercial. Petron,together with the other oil companies asked the Supreme Court to change the ruling sincethe Comprehensive Land Use Plan and Zoning Ordinance (Ordinance No.8119) repealed
the Manila Ordinance No. 8027. Ordinance No. 8119 gives Petron a seven-year graceperiod to continue its operations in the Pandacan Terminal. In February 2008, the SupremeCourt denied the oil company’s motion for reconsideration and declared Manila OrdinanceNo. 8027 valid and applicable to all oil terminals. The Court directed the oil companies tosubmit their relocation plans to the RTC within 90 days to determine the reasonableness ofthe time frame for relocation. In May 2008, Petron, Shell and Chevron submitted theirComprehensive Relocation Plan in compliance with the February Resolution. ThePandacan Terminal is strategically significant since it serves about 40% of the company’srefinery output and 100% of the company’s lubricants, greases and oxidized asphalt.
On May 28, 2009, Mayor Alfredo Lim of Manila approved and signed proposed
Ordinance 7177 (which became Ordinance No. 8187) repealing Ordinance No. 8027 and8119 and allowing the continued stay of the oil depots at Pandacan. Mayor Lim wasreelected Mayor of Manila in the May 10, 2010 election.
On June 1, 2009, Social Justice Society officers filed a petition for prohibition againstMayor Lim before the Supreme Court, seeking the nullification of Ordinance 8187. OnJune 5, 2009, former Mayor Lito Atienza filed his own petition with the Supreme Courtseeking to stop the implementation of Ordinance 8187. The Court has ordered the City tofile its comment but the Court did not issue a temporary restraining order. The City filedits comment on August 13, 2009.
The main storage facility of Petron is located at the Pandacan Terminal. Approximately40% of Petron‘s total sales volume is moved through Pandacan. To ensure steady supplyand in order to mitigate the risks at the Pandacan Terminal, the company‘s nearby depotsin Navotas, Metro Manila and in Rosario, Cavite can also distribute products to the areasbeing served by the Pandacan terminal.
Petron believes that, given the prevailing law and existing jurisprudence, the SupremeCourt will uphold the validity of Ordinance No. 8187.
As stated in the papers (Philippine Daily Inquirer, June 28, 2010 issue), and as confirmedduring the management meeting in 2010, Petron is looking at the Manila North Harbor asa possible location for its depot that will replace its facilities at the Pandacan Terminal.
This is just one of the sites that Petron is looking at for the transfer, should it be forced tomove out of Pandacan. According to SMC President and COO, Mr. Ramon Ang, movingPetron’s depot facilities to the North Harbor would reduce the company’s handling costsby as much as 80%, which may, in turn, result in lower pump prices. Mr. Ang explainedthat bringing oil to Pandacan can only be done with barges as a result of the Pasig River’sshallow draught of only 3 meters. North Harbor, on the other hand, has deep-waterfacilities which tankers can use directly.
8/13/2019 3rd Quarter Financials(from san miguel webste)
http://slidepdf.com/reader/full/3rd-quarter-financialsfrom-san-miguel-webste 25/65
- 25 -
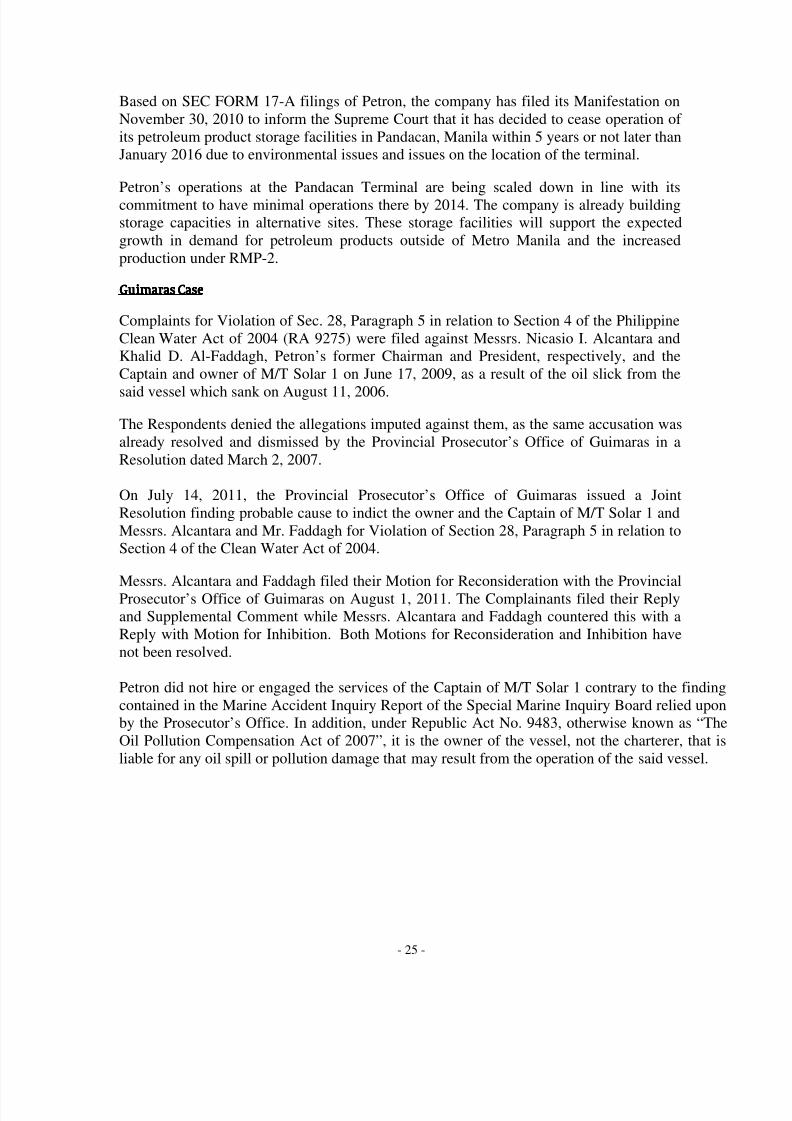
Based on SEC FORM 17-A filings of Petron, the company has filed its Manifestation onNovember 30, 2010 to inform the Supreme Court that it has decided to cease operation ofits petroleum product storage facilities in Pandacan, Manila within 5 years or not later thanJanuary 2016 due to environmental issues and issues on the location of the terminal.
Petron’s operations at the Pandacan Terminal are being scaled down in line with itscommitment to have minimal operations there by 2014. The company is already buildingstorage capacities in alternative sites. These storage facilities will support the expectedgrowth in demand for petroleum products outside of Metro Manila and the increasedproduction under RMP-2.
Guimaras CaseGuimaras CaseGuimaras CaseGuimaras Case
Complaints for Violation of Sec. 28, Paragraph 5 in relation to Section 4 of the PhilippineClean Water Act of 2004 (RA 9275) were filed against Messrs. Nicasio I. Alcantara andKhalid D. Al-Faddagh, Petron’s former Chairman and President, respectively, and theCaptain and owner of M/T Solar 1 on June 17, 2009, as a result of the oil slick from the
said vessel which sank on August 11, 2006.
The Respondents denied the allegations imputed against them, as the same accusation wasalready resolved and dismissed by the Provincial Prosecutor’s Office of Guimaras in aResolution dated March 2, 2007.
On July 14, 2011, the Provincial Prosecutor’s Office of Guimaras issued a JointResolution finding probable cause to indict the owner and the Captain of M/T Solar 1 andMessrs. Alcantara and Mr. Faddagh for Violation of Section 28, Paragraph 5 in relation toSection 4 of the Clean Water Act of 2004.
Messrs. Alcantara and Faddagh filed their Motion for Reconsideration with the ProvincialProsecutor’s Office of Guimaras on August 1, 2011. The Complainants filed their Replyand Supplemental Comment while Messrs. Alcantara and Faddagh countered this with aReply with Motion for Inhibition. Both Motions for Reconsideration and Inhibition havenot been resolved.
Petron did not hire or engaged the services of the Captain of M/T Solar 1 contrary to the findingcontained in the Marine Accident Inquiry Report of the Special Marine Inquiry Board relied uponby the Prosecutor’s Office. In addition, under Republic Act No. 9483, otherwise known as “TheOil Pollution Compensation Act of 2007”, it is the owner of the vessel, not the charterer, that isliable for any oil spill or pollution damage that may result from the operation of the said vessel.

8/13/2019 3rd Quarter Financials(from san miguel webste)
http://slidepdf.com/reader/full/3rd-quarter-financialsfrom-san-miguel-webste 26/65
- 26 -
11. Financial Risk Management Objectives and Policies
Objectives and PoliciesThe Group has significant exposure to the following financial risks primarily from its use offinancial instruments:
• Foreign currency risk
• Interest rate risk
• Credit risk
• Liquidity risk
• Commodity price risk
• Other market price risk
This note presents information about the Group’s exposure to each of the foregoing risks, theGroup’s objectives, policies and processes for measuring and managing these risks, and theGroup’s management of capital.
The Group’s principal financial instruments include cash and cash equivalents, debt and equitysecurities, bank loans and derivative instruments. The main purpose of bank loans is to financeworking capital relating to importation of crude and petroleum products, as well as to partly fundcapital expenditures. The Group has other financial assets and liabilities such as trade and otherreceivables and trade and other payables, which are generated directly from its operations.
It is the Group’s policy not to enter into derivative transactions for speculative purposes. TheGroup uses hedging instruments to protect its margin on its products from potential pricevolatility of crude oil and products. It also enters into short-term forward currency contracts tohedge its currency exposure on crude oil importations.
The main risks arising from the Group’s financial instruments are foreign exchange risk, interestrate risk, credit risk, liquidity risk and commodity price risk. The BOD regularly reviews andapproves the policies for managing these financial risks. Details of each of these risks arediscussed below, together with the related risk management structure.
Risk Management StructureThe Group follows an enterprise-wide risk management framework for identifying, assessing andaddressing the risk factors that affect or may affect its businesses.
The Group’s risk management process is a bottom-up approach, with each risk owner mandated
to conduct regular assessment of its risk profile and formulate action plans for managingidentified risks. As the Group’s operation is an integrated value chain, risks emanate from everyprocess, while some could cut across groups. The results of these activities flow up to theManagement Committee and, eventually, the BOD through the Group’s annual business planningprocess.

8/13/2019 3rd Quarter Financials(from san miguel webste)
http://slidepdf.com/reader/full/3rd-quarter-financialsfrom-san-miguel-webste 27/65
- 27 -
Oversight and technical assistance is likewise provided by corporate units and committees withspecial duties. These groups and their functions are:
1. The Risk and Insurance Management Group, which is mandated with the overallcoordination and development of the enterprise-wide risk management process.
2. The Financial Risk Management Unit of the Treasurer’s Department, which is in charge offoreign exchange hedging transactions.
3. The Transaction Management Unit of Controllers Department, which provides backroomsupport for all hedging transactions.
4. The Corporate Technical & Engineering Services Group, which oversees strict adherence tosafety and environmental mandates across all facilities.
5. The Internal Audit Department, which has been tasked with the implementation of a risk-
based auditing.
The BOD also created separate board-level entities with explicit authority and responsibility inmanaging and monitoring risks, as follows:
a. The Audit Committee, which ensures the integrity of internal control activities throughoutthe Group. It develops, oversees, checks and pre-approves financial management functionsand systems in the areas of credit, market, liquidity, operational, legal and other risks of theGroup, and crisis management. The Internal Audit Department and the External Auditordirectly report to the Audit Committee regarding the direction, scope and coordination ofaudit and any related activities.
b. The Compliance Officer, who is a senior officer of Petron reports to the BOD through theAudit Committee. He monitors compliance with the provisions and requirements of theCorporate Governance Manual, determines any possible violations and recommendscorresponding penalties, subject to review and approval of the BOD. The ComplianceOfficer identifies and monitors compliance risk. Lastly, the Compliance Officer representsthe Group before the SEC regarding matters involving compliance with the Code ofCorporate Governance.
Foreign Currency Risk
The Group’s functional currency is the Philippine peso, which is the denomination of the bulk of
the Group’s revenues. The Group’s exposures to foreign exchange risk arise mainly from UnitedStates (US) dollar-denominated sales as well as purchases principally of crude oil and petroleumproducts. As a result of this, the Group maintains a level of US dollar-denominated assets andliabilities during the period. Foreign exchange risk occurs due to differences in the levels of USdollar-denominated assets and liabilities.

8/13/2019 3rd Quarter Financials(from san miguel webste)
http://slidepdf.com/reader/full/3rd-quarter-financialsfrom-san-miguel-webste 28/65
- 28 -
The Group pursues a policy of hedging foreign exchange risk by purchasing currency forwards orby substituting US dollar-denominated liabilities with peso-based debt. The natural hedgeprovided by US dollar-denominated assets is also factored in hedging decisions. As a matter ofpolicy, currency hedging is limited to the extent of 100% of the underlying exposure.
The Group is allowed to engage in active risk management strategies for a portion of its foreignexchange risk exposure. Loss limits are in place, monitored daily and regularly reviewed bymanagement.
Information on the Group’s US dollar-denominated financial assets and liabilities and theirPhilippine peso equivalents as of September 30, 2011 and December 31, 2010 are as follows:
September 30, 2011 December 31,2010
US DollarPeso
Equivalent US DollarPeso
Equivalent
Assets Cash and cash equivalents US$318 P13,897 US$648 P28,395Trade and other receivables 608 26,573 173 7,606Non-current receivables 1 63 1 29
927 40,533 822 36,030
Liabilities Drafts and loans payable 30 1,312 59 2,573Liabilities for crude oil and
petroleum product importation 1,067 46,629 288 12,606Long-term debt (including
current maturities) 276 12,072 355 15,563
1,373 60,013 702 30,742
Net foreign currency-denominated monetary assets (US$446) (P19,480) US$120 P5,288
The Group reported net foreign exchange gains (losses) amounting to (P18) and P1,182 for theperiod ending September 30, 2011 and 2010, respectively, with the translation of its foreigncurrency-denominated assets and liabilities. These mainly resulted from the movements of thePhilippine peso against the US dollar as shown in the following table:
Peso to US Dollar
December 31, 2009 46.20
September 30, 2010 43.88
December 31, 2010 43.84September 30, 2011 43.72
The management of foreign currency risk is also supplemented by monitoring the sensitivity offinancial instruments to various foreign currency exchange rate scenarios. Foreign exchangemovements affect reported equity through the retained earnings arising from increases ordecreases in unrealized and realized foreign exchange gains or losses.

8/13/2019 3rd Quarter Financials(from san miguel webste)
http://slidepdf.com/reader/full/3rd-quarter-financialsfrom-san-miguel-webste 29/65
- 29 -
The following table demonstrates the sensitivity to a reasonably possible change in the US dollarexchange rate, with all other variables held constant, of profit before tax and equity as ofSeptember 30, 2011 and December 31, 2010:
P1 decrease in the US$exchange rate
P1 increase in the US$exchange rate
September 30, 2011
Effect onIncome before
Income TaxEffect on
Equity
Effect onIncome before
Income TaxEffect on
Equity
Cash and cash equivalents (P299) (P228) P299 P228
Trade and other receivables (95) (579) 95 579Noncurrent receivables - (2) - 2
(394) (809) 394 809
Drafts and loans payable 30 21 (30) (21)
Liabilities for crude oil andpetroleum productimportation
569 896 (569) (896)
Long-term debt (includingcurrent maturities)
276 193 (276) (193)
875 1,110 (875) (1,110)
P481 P301 (P481) (P301)
P1 decrease in the US$exchange rate
P1 increase in the US$ exchangerate
December 31, 2010
Effect onIncome before
Income Tax
Effect on
Equity
Effect onIncome before
Income Tax
Effect on
EquityCash and cash equivalents (P642) (P455) P642 P455
Trade and other receivables (97) (144) 97 144Noncurrent receivables - (1) - 1
(739) (600) 739 600
Drafts and loans payable - 59 - (59)
Liabilities for crude oil andpetroleum productimportation
285 202 (285) (202)
Long-term debt (includingcurrent maturities)
355 249 (355) (249)
640 510 (640) (510)(P99) (P90) P99 P90
Exposures to foreign exchange rates vary during the period depending on the volume of overseastransactions. Nonetheless, the analysis above is considered to be representative of the Group’scurrency risk.

8/13/2019 3rd Quarter Financials(from san miguel webste)
http://slidepdf.com/reader/full/3rd-quarter-financialsfrom-san-miguel-webste 30/65
- 30 -
Interest Rate Risk
Interest rate risk is the risk that future cash flows from a financial instrument (cash flow interestrate risk) or its fair value (fair value interest rate risk) will fluctuate because of changes in marketinterest rates. The Group’s exposure to changes in interest rates relates mainly to long-termborrowings and investment securities. Investments or borrowings issued at fixed rates expose the
Group to fair value interest rate risk. On the other hand, investments or borrowings issued atvariable rates expose the Group to cash flow interest rate risk.
The Group manages its interest costs by using a combination of fixed and variable rate debtinstruments. Management is responsible for monitoring the prevailing market-based interest ratesand ensures that the marked-up rates levied on its borrowings are most favorable andbenchmarked against the interest rates charged by other creditor banks.
On the other hand, the Group’s investment policy is to maintain an adequate yield to match orreduce the net interest cost from its borrowings prior to deployment of funds to their intended usein operations and working capital management. However, the Group invests only in high-quality
money market instruments while maintaining the necessary diversification to avoid concentrationrisk.
In managing interest rate risk, the Group aims to reduce the impact of short-term volatility onearnings. Over the longer term, however, permanent changes in interest rates would have animpact on profit or loss.
The management of interest rate risk is also supplemented by monitoring the sensitivity offinancial instruments to various standard and non-standard interest rate scenarios. Interest ratemovements affect reported equity through the retained earnings arising from increases ordecreases in interest income or interest expense as well as fair value changes reported in profit orloss, if any.
The sensitivity to a reasonably possible 1% increase in the interest rates, with all other variablesheld constant, would have decreased the Group’s profit before tax (through the impact on floatingrate borrowings) by P136 and P180 in the period ending September 30, 2011 and December 31,2010, respectively. A 1% decrease in the interest rate would have had the equal but oppositeeffect. There is no impact on the Group’s other income.
8/13/2019 3rd Quarter Financials(from san miguel webste)
http://slidepdf.com/reader/full/3rd-quarter-financialsfrom-san-miguel-webste 31/65
- 31 -
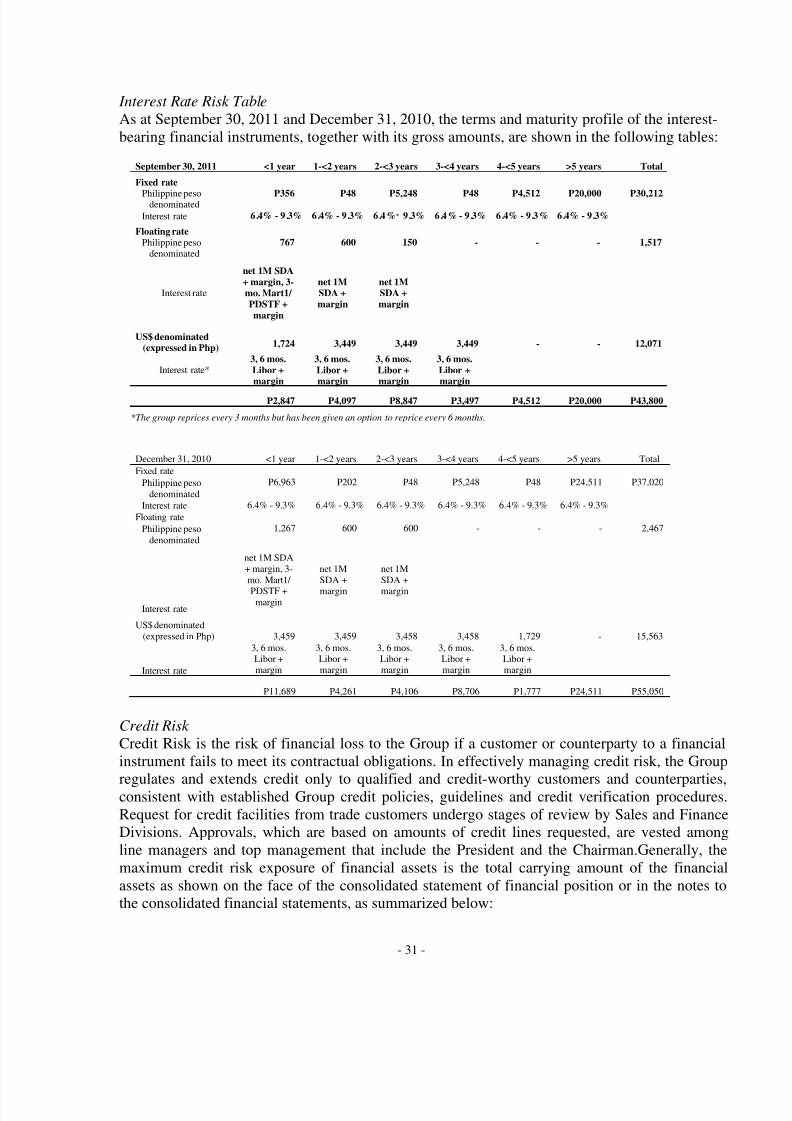
Interest Rate Risk Table
As at September 30, 2011 and December 31, 2010, the terms and maturity profile of the interest-bearing financial instruments, together with its gross amounts, are shown in the following tables:
September 30, 2011 <1 year 1-<2 years 2-<3 years 3-<4 years 4-<5 years >5 years Total
Fixed rate
Philippine pesodenominated P356 P48 P5,248 P48 P4,512 P20,000 P30,212
Interest rate 6.4% - 9.3% 6.4% - 9.3% 6.4% 9.3% 6.4% - 9.3% 6.4% - 9.3% 6.4% - 9.3%
Floating ratePhilippine peso
denominated767 600 150 - - - 1,517
Interest rate
net 1M SDA+ margin, 3-mo. Mart1/PDSTF +margin
net 1MSDA +margin
net 1MSDA +margin
US$ denominated(expressed in Php) 1,724 3,449 3,449 3,449 - - 12,071
Interest rate*3, 6 mos.Libor +margin
3, 6 mos.Libor +margin
3, 6 mos.Libor +margin
3, 6 mos.Libor +margin
P2,847 P4,097 P8,847 P3,497 P4,512 P20,000 P43,800
*The group reprices every 3 months but has been given an option to reprice every 6 months.
December 31, 2010 <1 year 1-<2 years 2-<3 years 3-<4 years 4-<5 years >5 years Total
Fixed rate
Philippine pesodenominated
P6,963 P202 P48 P5,248 P48 P24,511 P37,020
Interest rate 6.4% - 9.3% 6.4% - 9.3% 6.4% - 9.3% 6.4% - 9.3% 6.4% - 9.3% 6.4% - 9.3%
Floating rate
Philippine pesodenominated
1,267 600 600 - - - 2,467
Interest rate
net 1M SDA+ margin, 3-mo. Mart1/
PDSTF +margin
net 1MSDA +
margin
net 1MSDA +
margin
US$ denominated(expressed in Php) 3,459 3,459 3,458 3,458 1,729 - 15,563
Interest rate
3, 6 mos.Libor +margin
3, 6 mos.Libor +margin
3, 6 mos.Libor +margin
3, 6 mos.Libor +margin
3, 6 mos.Libor +margin
P11,689 P4,261 P4,106 P8,706 P1,777 P24,511 P55,050
Credit Risk
Credit Risk is the risk of financial loss to the Group if a customer or counterparty to a financialinstrument fails to meet its contractual obligations. In effectively managing credit risk, the Group
regulates and extends credit only to qualified and credit-worthy customers and counterparties,consistent with established Group credit policies, guidelines and credit verification procedures.Request for credit facilities from trade customers undergo stages of review by Sales and FinanceDivisions. Approvals, which are based on amounts of credit lines requested, are vested amongline managers and top management that include the President and the Chairman.Generally, themaximum credit risk exposure of financial assets is the total carrying amount of the financialassets as shown on the face of the consolidated statement of financial position or in the notes tothe consolidated financial statements, as summarized below:

8/13/2019 3rd Quarter Financials(from san miguel webste)
http://slidepdf.com/reader/full/3rd-quarter-financialsfrom-san-miguel-webste 32/65
- 32 -
September 30, 2011 December 31, 2010
Cash in bank and cash equivalents P17,141 P40,358
Derivative assets 138 34
Trade and other receivables-net 26,003 24,266Due from affiliates 23,378 22,447
Noncurrent receivables 110 122
P66,770 P87,227
The credit risk for cash in bank and cash equivalents and derivative financial instruments isconsidered negligible, since the counterparties are reputable entities with gain high qualityexternal credit ratings. The credit quality of these financial assets is considered to be high grade.
In monitoring trade receivables and credit lines, the Group maintains up-to-date records wheredaily sales and collection transactions of all customers are recorded in real-time and month-endstatements of accounts are forwarded to customers as collection medium. Finance Division’sCredit Department regularly reports to management trade receivables balances (monthly) andcredit utilization efficiency (semi-annually).
Collaterals. To the extent practicable, the Group also requires collateral as security for a creditfacility to mitigate risk in trade receivables. Among the collaterals held are letters of credit, bankguarantees, real estate mortgages, and cash bonds valued at P3,138 and P2,736 as of September30, 2011 and December 31, 2010, respectively. These securities may only be called on or appliedupon default of customers.
Credit Risk Concentration. The Group’s exposure to credit risk arises from default ofcounterparty. Generally, the maximum credit risk exposure of trade and other receivables is itscarrying amount without considering collaterals or credit enhancements, if any. The Group has nosignificant concentration of credit risk since the Group deals with a large number of homogenoustrade customers. The Group does not execute any guarantee in favor of any counterparty.
Credit Quality. In monitoring and controlling credit extended to counterparty, the Group adopts acomprehensive credit rating system based on financial and non-financial assessments of itscustomers. Financial factors being considered comprised of the financial standing of the customerwhile the non-financial aspects include but are not limited to the assessment of the customer’snature of the business, management profile, industry background, payment habit and both present
and potential business dealings with the Group.
Class A “High Grade” are accounts with strong financial capacity and business performance andwith the lowest default risk.
Class B “Moderate Grade” refer to accounts of satisfactory financial capability and creditstanding but with some elements of risks where certain measure of control is necessary in order tomitigate risk of default.

8/13/2019 3rd Quarter Financials(from san miguel webste)
http://slidepdf.com/reader/full/3rd-quarter-financialsfrom-san-miguel-webste 33/65
- 33 -
Class C “Low Grade” are accounts with high probability of delinquency and default.
Liquidity Risk
Liquidity risk pertains to the risk that the Group will encounter difficulty in meeting obligations
associated with financial liabilities that are settled by delivering cash of another financial asset.
The Group’s objectives in managing its liquidity risk are as follows: a) to ensure that adequatefunding is available at all times; b) to meet commitments as they arise without incurringunnecessary costs; c) to be able to access funding when needed at the least possible cost; and d) tomaintain an adequate time spread of refinancing maturities.
The Group constantly monitors and manages its liquidity position, liquidity gaps or surplus on a daily basis. A committed stand-by credit facility from several local banks is also available toensure availability of funds when necessary. The Group also uses derivative instruments such asforwards and swaps to manage liquidity.
The table below summarizes the maturity profile of the Group’s financial assets and financialliabilities based on contractual undiscounted payments used for liquidity management as ofSeptember 30, 2011 and December 31, 2010.
September 30, 2011CarryingAmount
ContractualCash Flow
1yearor less
>1 year- 2 years
>2 year- 5 years
Over 5years
Financial assetsCash and cash
equivalents P20,399 P20,399 P20,399 P- P- P-Trade and other
receivables 26,003 26,003 26,003 - - -Due from affiliates 23,378 24,141 1,764 21,952 425 -Derivative assets 138 138 138 - - -Financial assets at FVPL 185 185 185 - - -AFS financial assets 1,034 1,211 71 112 1,028 -Noncurrent receivables 110 122 7 25 56 34
Financial liabilitiesShort-term loans 35,502 35,760 35,760 - - -Accounts payable and
accrued expenses(excluding taxespayable) 28,067 28,067 28,067 - - -
Derivative liabilities 97 97 97 - - -Long-term debt(including
current maturities) 43,282 59,261 5,819 6,957 24,104 22,381Cash bonds 305 313 260 12 12 29Cylinder deposits 346 346 - - - 346Other noncurrent
liabilities 51 51 - 1 32 18

8/13/2019 3rd Quarter Financials(from san miguel webste)
http://slidepdf.com/reader/full/3rd-quarter-financialsfrom-san-miguel-webste 34/65
- 34 -
December 31, 2010CarryingAmount
ContractualCash Flow
1yearor less
>1 year- 2 years
>2 year- 5 years
Over 5years
Financial assetsCash and cash
equivalents P43,984 P43,984 P43,984 P- P- P-
Trade and otherreceivables 24,266 24,266 24,266 - - -Due from affiliates 22,447 22,921 907 22,014 - -Derivative assets 34 34 34 - - -Financial assets at FVPL 193 193 193 - - -AFS financial assets 1,161 1,372 250 57 1,065 -Noncurrent receivables 122 122 - 20 65 37
Financial liabilitiesShort-term loans 32,457 32,733 32,733 - - -Accounts payable and
accrued expenses
(excluding taxespayable) 17,375 17,375 17,375 - - -Derivative liabilities 30 30 30 - - -Long-term debt(including
current maturities) 54,402 72,752 15,360 7,198 22,162 28,032Cash bonds 275 284 219 26 19 20Cylinder deposits 274 274 - - - 274Other noncurrent
liabilities 60 60 - 10 27 23
Commodity Price Risk
Commodity price risk is the risk that future cash flows from a financial instrument will fluctuatebecause of changes in market prices.
To minimize the Company’s risk of potential losses due to volatility of international crude andproduct prices, the Group implemented commodity hedging for petroleum products. The Groupenters into various commodity derivatives to (a) protect margins of MOPS (Mean of Platts ofSingapore) based sales and (b) protect product inventories from downward price risk. Hedgingpolicy includes the use of commodity price swaps, buying of put options, and use of collars and 3-way options. Decisions are guided by the conditions set and approved by the Group’smanagement.
Other Market Price RiskThe Group’s market price risk arises from its investments carried at fair value (FVPL and AFSfinancial assets). The Group manages its risk arising from changes in market price by monitoringthe changes in the market price of the investments.

8/13/2019 3rd Quarter Financials(from san miguel webste)
http://slidepdf.com/reader/full/3rd-quarter-financialsfrom-san-miguel-webste 35/65
- 35 -
Capital Management
The Group’s capital management policies and programs aim to provide an optimal capitalstructure that would ensure the Group’s ability to continue as a going concern while at the sametime provide adequate returns to the shareholders. As such, it considers the best trade-off betweenrisks associated with debt financing and relatively higher cost of equity funds. Likewise,
compliance with the debt to equity ratio covenant of bank loans has to be ensured.
An enterprise resource planning system is used to monitor and forecast the Group’s overallfinancial position. The Group may adjust the amount of dividends paid to shareholders, issue newshares as well as increase or decrease assets and/or liabilities depending on the prevailing internaland external business conditions.
The Group monitors capital via carrying amount of equity as stated in the consolidated statementof financial position. The Group’s capital for the covered reporting period is summarized in thetable below:
September 30, 2011 December 31, 2010Total assets P170,961 P161,816
Total liabilities 111,676 108,472
Total equity 59,285 53,344
Debt to equity ratio 1.9:1 2.0:1
There were no changes in the Group’s approach to capital management during the period.
12. Financial Assets and Financial Liabilities
Date of Recognition. The Group recognizes a financial asset or a financial liability in theconsolidated statements of financial position when it becomes a party to the contractualprovisions of the instrument. In the case of a regular way purchase or sale of financial assets,recognition is done using settlement date accounting.
Initial Recognition of Financial Instruments. Financial instruments are recognized initially at fairvalue of the consideration given (in case of an asset) or received (in case of a liability). The initialmeasurement of financial instruments, except for those designated at fair value through profit orloss (FVPL), includes transaction costs.
The Group classifies its financial assets in the following categories: held-to-maturity (HTM)
investments, available for sale (AFS) financial assets, financial assets at FVPL and loans andreceivables. The Group classifies its financial liabilities as either FVPL or other financialliabilities. The classification depends on the purpose for which the investments are acquired andwhether they are quoted in an active market. Management determines the classification of itsfinancial assets and financial liabilities at initial recognition and, where allowed and appropriate,re-evaluates such designation at every reporting date.

8/13/2019 3rd Quarter Financials(from san miguel webste)
http://slidepdf.com/reader/full/3rd-quarter-financialsfrom-san-miguel-webste 36/65
- 36 -
Determination of Fair Value. The fair value for financial instruments traded in active markets atthe reporting date is based on their quoted market price or dealer price quotations (bid price forlong positions and ask price for short positions), without any deduction for transaction costs.When current bid and ask prices are not available, the price of the most recent transactionprovides evidence of the current fair value as long as there is no significant change in economic
circumstances since the time of the transaction.
For all other financial instruments not listed in an active market, the fair value is determined byusing appropriate valuation techniques. Valuation techniques include the discounted cash flowmethod, comparison to similar instruments for which market observable prices exist, optionspricing models and other relevant valuation models.
‘Day 1’ Profit. Where the transaction price in a non-active market is different from the fair valueof the other observable current market transactions in the same instrument or based on a valuationtechnique whose variables include only data from observable market, the Group recognizes thedifference between the transaction price and fair value (a ‘Day 1’ profit) in profit or loss unless it
qualifies for recognition as some other type of asset. In cases where use is made of data which arenot observable, the difference between the transaction price and model value is only recognized inthe consolidated statement of income when the inputs become observable or when the instrumentis derecognized. For each transaction, the Group determines the appropriate method ofrecognizing the ‘Day 1’ profit amount.
Financial Assets
Financial Assets at FVPL. A financial asset is classified at FVPL if it is classified as held fortrading or is designated as such upon initial recognition. Financial assets are designated at FVPLif the Group manages such investments and makes purchase and sale decisions based on their fairvalue in accordance with the Group’s documented risk management or investment strategy.Derivative instruments (including embedded derivatives), except those covered by hedgeaccounting relationships, are classified under this category.
Financial assets are classified as held for trading if they are acquired for the purpose of selling inthe near term.
Financial assets may be designated by management at initial recognition as at FVPL, when any ofthe following criteria is met:
the designation eliminates or significantly reduces the inconsistent treatment that wouldotherwise arise from measuring the assets or recognizing gains or losses on a differentbasis;
the assets are part of a group of financial assets which are managed and their performancesare evaluated on a fair value basis, in accordance with a documented risk management orinvestment strategy; or
8/13/2019 3rd Quarter Financials(from san miguel webste)
http://slidepdf.com/reader/full/3rd-quarter-financialsfrom-san-miguel-webste 37/65
- 37 -
the financial instrument contains an embedded derivative, unless the embedded derivativedoes not significantly modify the cash flows or it is clear, with little or no analysis, that itwould not be separately recognized.
The Group uses commodity price swaps to protect its margin on petroleum products from
potential price volatility of international crude and product prices. It also enters into short-termforward currency contracts to hedge its currency exposure on crude oil importations. In addition,the Company has identified and bifurcated embedded foreign currency derivatives from certainnon-financial contracts.
Derivatives instruments are initially recognized at fair value on the date in which a derivativetransaction is entered into or bifurcated, and are subsequently re-measured at fair value.Derivatives are presented in the separate statement of financial position as assets when the fairvalue is positive and as liabilities when the fair value is negative. Gains and losses from changesin fair value of these derivatives are recognized under the caption marked-to-market gain (losses)included as part of “Other Income (Expenses)” in the separate statement of comprehensive
income.
The fair values of freestanding and bifurcated forward currency transactions are calculated byreference to current exchange rates for contracts with similar maturity profiles. The fair values ofcommodity swaps are determined based on quotes obtained from counterparty banks.
The Group’s financial assets at FVPL and derivative assets are included in this category.
The carrying values of financial assets under this category amounted to P323, P195 and P227 asof September and June 30, 2011 and December 31, 2010, respectively.
Loans and Receivables. Loans and receivables are non-derivative financial assets with fixed ordeterminable payments and maturities that are not quoted in an active market. They are notentered into with the intention of immediate or short-term resale and are not designated as AFSfinancial assets or financial assets at FVPL.
Subsequent to initial measurement, loans and receivables are carried at amortized cost using theeffective interest rate method, less any impairment in value. Any interest earned on loans andreceivables shall be recognized as part of “Interest income” in profit and loss on an accrual basis.Amortized cost is calculated by taking into account any discount or premium on acquisition andfees that are integral part of the effective interest rate. The periodic amortization is also includedas part of “Interest income” in the consolidated statements of income. Gains or losses arerecognized in profit or loss when loans and receivables are derecognized or impaired, as well asthrough the amortization process.
Cash includes cash on hand and in banks which are stated at face value. Cash equivalents areshort-term, highly liquid investments that are readily convertible to known amounts of cash andwhich are subject to an insignificant risk of changes in value.
8/13/2019 3rd Quarter Financials(from san miguel webste)
http://slidepdf.com/reader/full/3rd-quarter-financialsfrom-san-miguel-webste 38/65
- 38 -
The Group’s cash and cash equivalents, trade and other receivables, due from affiliates andnoncurrent receivables are included in this category.
The combined carrying values of financial assets under this category amounted to P69,890,P69,031 and P90,819 as of September and June 30, 2011 and December 31, 2010, respectively.
HTM Investments. HTM investments are quoted non-derivative financial assets with fixed ordeterminable payments and fixed maturities for which the Group’s management has the positiveintention and ability to hold to maturity. Where the Group sells other than an insignificantamount of HTM investments, the entire category would be tainted and reclassified as AFSfinancial assets. After initial measurement, these investments are measured at amortized costusing the effective interest rate method, less impairment in value. Any interest earned on theHTM investments shall be recognized as part of “Interest income” in the consolidated statementsof income on an accrual basis. Amortized cost is calculated by taking into account any discountor premium on acquisition and fees that are integral part of the effective interest rate. The periodicamortization is also included as part of “Interest income” in the consolidated statements of
income. Gains or losses are recognized in profit or loss when the HTM investments arederecognized or impaired, as well as through the amortization process.
As of September and June 30, 2011 and December 31, 2010, the Group has no investmentsaccounted under this category.
AFS Financial Assets. AFS financial assets are non-derivative financial assets that are eitherdesignated in this category or not classified in any of the other financial asset categories.Subsequent to initial recognition, they are measured at fair value and changes therein, other thanimpairment losses and foreign currency differences on AFS debt instruments, are recognized inother comprehensive income and presented in the “Other reserves” in equity. The effective yieldcomponent of AFS debt securities, as well as the impact of restatement on foreign currency-denominated AFS investment securities, is reported as part of “Interest income” in theconsolidated statement of income. The unrealized gains and losses arising from the changes in fairvalue of AFS financial assets, net of tax, are excluded from profit and loss and are recognized asother comprehensive income reported in the consolidated statement of comprehensive income andin the consolidated statement of changes in equity under “Other Reserves” account. Any interestearned on AFS debt securities shall be recognized as part of “Interest income” in the consolidatedstatement of income on an accrual basis. Dividends earned on holding AFS equity securities arerecognized as “Dividend income” when the right of collection has been established. Whenindividual AFS financial assets are either derecognized or impaired, the related accumulatedunrealized gains or losses previously reported equity are transferred to and recognized in profit orloss.
Where the Group holds more than one investment in the same security, these are deemed to bedisposed on a first-in, first-out basis. Interest and dividends earned on holding AFS financialassets are recognized in “Other Income” account in the consolidated statement of income whenthe right to receive payment has been established. The losses arising from impairment of suchinvestments are recognized as impairment losses in profit or loss.

8/13/2019 3rd Quarter Financials(from san miguel webste)
http://slidepdf.com/reader/full/3rd-quarter-financialsfrom-san-miguel-webste 39/65
- 39 -
AFS financial assets also include unquoted equity instruments with fair values which cannot bereliably determined. These instruments are carried at cost less impairment in value, if any. TheGroup’s investments in debt are classified under this category.
The carrying values of financial assets under this category amounted to P1,034, P1,186 and
P1,161 as of September and June 30, 2011 and December 31, 2010, respectively.
Financial Liabilities
Financial Liabilities at FVPL. Financial liabilities are classified under this category through thefair value option. Derivative instruments (including embedded derivatives) with negative fairvalues are also classified under this category.
The Group carries financial liabilities at FVPL using their fair values and reports fair valuechanges in the consolidated statement of income.
The carrying values of financial liabilities under this category amounted to P97, P6 and P30 as of
September and June 30, 2011 and December 31, 2010, respectively.
Other Financial Liabilities. This category pertains to financial liabilities that are not designated orclassified as at FVPL. After initial measurement, other financial liabilities are carried atamortized cost using the effective interest rate method. Amortized cost is calculated by takinginto account any premium or discount and any directly attributable transaction costs that areconsidered an integral part of the effective interest rate of the liability.
Included in this category are the Group’s liabilities arising from its short term loans, liabilities forcrude oil and petroleum product importation, trade and other payables, long-term debt, cash bond,cylinder deposits and other non-current liabilities.
The combined carrying values of financial liabilities under this category amounted to P107,553,P99,415 and P104,843 as of September and June 30, 2011 and December 31, 2010, respectively .
Debt Issue CostsDebt issue costs are considered as an adjustment to the effective yield of the related debt and aredeferred and amortized using the effective interest rate method. When a loan is paid, the relatedunamortized debt issue costs at the date of repayment are charged against current operations.

8/13/2019 3rd Quarter Financials(from san miguel webste)
http://slidepdf.com/reader/full/3rd-quarter-financialsfrom-san-miguel-webste 40/65
- 40 -
Embedded Derivatives
The Group assesses whether embedded derivatives are required to be separated from hostcontracts when the Group becomes a party to the contract.
An embedded derivative is separated from the host contract and accounted for as a derivative if all
of the following conditions are met: a) the economic characteristics and risks of the embeddedderivative are not closely related to the economic characteristics and risks of the host contract; b)a separate instrument with the same terms as the embedded derivative would meet the definitionof a derivative; and c) the hybrid or combined instrument is not recognized at FVPL.Reassessment only occurs if there is a change in the terms of the contract that significantlymodifies the cash flows that would otherwise be required.
Derecognition of Financial Assets and Financial LiabilitiesFinancial Assets. A financial asset (or, where applicable, a part of a financial asset or part of agroup of similar financial assets) is derecognized when:
the rights to receive cash flows from the asset expired;
the Group retains the right to receive cash flows from the asset, but has assumed anobligation to pay them in full without material delay to a third party under a “pass-through” arrangement; or
the Group has transferred its rights to receive cash flows from the asset and either:(a) has transferred substantially all the risks and rewards of the asset; or (b) has neithertransferred nor retained substantially all the risks and rewards of the asset, but hastransferred control of the asset.
When the Group has transferred its rights to receive cash flows from an asset and has neithertransferred nor retained substantially all the risks and rewards of the asset nor transferred controlof the asset, the asset is recognized to the extent of the Group’s continuing involvement in theasset. Continuing involvement that takes the form of a guarantee over the transferred asset ismeasured at the lower of the original carrying amount of the asset and the maximum amount ofconsideration that the Group could be required to repay.
Financial Liabilities. A financial liability is derecognized when the obligation under the liabilityis discharged, cancelled or expired. When an existing financial liability is replaced by anotherfrom the same lender on substantially different terms, or the terms of an existing liability aresubstantially modified, such an exchange or modification is treated as a derecognition of theoriginal liability and the recognition of a new liability. The difference in the respective carryingamounts is recognized in profit or loss.
Impairment of Financial AssetsThe Group assesses at reporting date whether a financial asset or group of financial assets isimpaired.

8/13/2019 3rd Quarter Financials(from san miguel webste)
http://slidepdf.com/reader/full/3rd-quarter-financialsfrom-san-miguel-webste 41/65
- 41 -
A financial asset or a group of financial assets is deemed to be impaired if, and only if, there isobjective evidence of impairment as a result of one or more events that have occurred after theinitial recognition of the asset (an incurred loss event) and that loss event has an impact on theestimated future cash flows of the financial asset or the group of financial assets that can bereliably estimated.
Assets Carried at Amortized Cost. For assets carried at amortized cost such as loans andreceivables, the Group first assesses whether objective evidence of impairment exists individuallyfor financial assets that are individually significant, or collectively for financial assets that are notindividually significant. If no objective evidence of impairment has been identified for a particularfinancial asset that was individually assessed, the Group includes the asset as part of a group offinancial assets pooled according to their credit risk characteristics and collectively assesses thegroup for impairment. Assets that are individually assessed for impairment and for which animpairment loss is, or continues to be, recognized are not included in the collective impairmentassessment.
Evidence of impairment for specific impairment purposes may include indications that theborrower or a group of borrowers is experiencing financial difficulty, default or delinquency inprincipal or interest payments, or may enter into bankruptcy or other form of financialreorganization intended to alleviate the financial condition of the borrower. For collectiveimpairment purposes, evidence of impairment may include observable data on existing economicconditions or industry-wide developments indicating that there is a measurable decrease in theestimated future cash flows of the related assets.
If there is objective evidence of impairment, the amount of loss is measured as the differencebetween the asset’s carrying amount and the present value of estimated future cash flows(excluding future credit losses) discounted at the financial asset’s original effective interest rate(i.e., the effective interest rate computed at initial recognition). Time value is generally notconsidered when the effect of discounting the cash flows is not material. If a loan or receivablehas a variable rate, the discount rate for measuring any impairment loss is the current effectiveinterest rate, adjusted for the original credit risk premium. For collective impairment purposes,impairment loss is computed based on their respective default and historical loss experience.
The carrying amount of the asset shall be reduced either directly or through use of an allowanceaccount. The impairment loss for the period shall be recognized in profit or loss. If, in asubsequent period, the amount of the impairment loss decreases and the decrease can be relatedobjectively to an event occurring after the impairment was recognized, the previously recognizedimpairment loss is reversed. Any subsequent reversal of an impairment loss is recognized in profitor loss, to the extent that the carrying amount of the asset does not exceed its amortized cost at thereversal date.
8/13/2019 3rd Quarter Financials(from san miguel webste)
http://slidepdf.com/reader/full/3rd-quarter-financialsfrom-san-miguel-webste 42/65
- 42 -
AFS Financial Assets. If an AFS financial asset is impaired, an amount comprising the differencebetween the cost (net of any principal payment and amortization) and its current fair value, lessany impairment loss on that financial asset previously recognized in profit or loss, is transferredfrom equity to profit or loss. Reversals in respect of equity instruments classified as AFS financialassets are not recognized in profit or loss. Reversals of impairment losses on debt instruments are
recognized in profit or loss, if the increase in fair value of the instrument can be objectivelyrelated to an event occurring after the impairment loss was recognized in profit or loss.
In the case of an unquoted equity instrument or of a derivative asset linked to and must be settledby delivery of an unquoted equity instrument, for which its fair value cannot be reliablymeasured, the amount of impairment loss is measured as the difference between the asset’scarrying amount and the present value of estimated future cash flows from the asset discountedusing its historical effective rate of return on the asset.
Classification of Financial Instruments Between Debt and EquityFrom the perspective of the issuer, a financial instrument is classified as debt instrument if it
provides for a contractual obligation to:
deliver cash or another financial asset to another entity;
exchange financial assets or financial liabilities with another entity under conditions thatare potentially unfavorable to the Group; or
satisfy the obligation other than by the exchange of a fixed amount of cash or anotherfinancial asset for a fixed number of own equity shares.
If the Group does not have an unconditional right to avoid delivering cash or another financialasset to settle its contractual obligation, the obligation meets the definition of a financial liability.
Offsetting Financial InstrumentsFinancial assets and financial liabilities are offset and the net amount is reported in theconsolidated statements of financial position if, and only if, there is a currently enforceable legalright to offset the recognized amounts and there is an intention to settle on a net basis, or torealize the asset and settle the liability simultaneously. This is not generally the case with masternetting agreements, and the related assets and liabilities are presented gross in the consolidatedstatements of financial position.

8/13/2019 3rd Quarter Financials(from san miguel webste)
http://slidepdf.com/reader/full/3rd-quarter-financialsfrom-san-miguel-webste 43/65
- 43 -
The table below presents a comparison by category of carrying amounts and fair values of theGroup’s financial instruments as of September 30, 2011 December 31, 2010:
September 30, 2011 December 31, 2010
Carrying
Value
Fair
Value
Carrying
Value
Fair
ValueFinancial assets (FA):
Cash and cash equivalents P20,399 P20,399 P43,984 P43,984
Trade and other receivables 26,003 26,003 24,266 24,266
Due from affiliates 23,378 23,378 22,447 22,447
Long-term receivables 110 110 122 122
Loans and receivables 69,890 69,890 90,819 90,819
AFS financial assets 1,034 1,034 1,161 1,161
Financial assets at FVPL 185 185 193 193
Derivative assets 138 138 34 34FA at FVPL 323 323 227 227
Total financial assets P71,247 P71,247 P92,207 P92,207
September 30, 2011 December 31, 2010
CarryingValue
FairValue
CarryingValue
FairValue
Financial liabilities (FL):
Short-term loans P35,502 P35,502 P32,457 P32,457
Liabilities for crude oil and
petroleum productimportation 21,872 21,872 11,194 11,194
Trade and other payables
(excluding specific taxes
and other taxes payable) 6,195 6,195 6,181 6,181
Long-term debt including
current portion 43,282 43,282 54,402 54,402
Cash bonds 305 305 275 275
Cylinder deposits 346 346 274 274
Other noncurrent liabilities 51 51 60 60
FL at amortized cost 107,553 107,553 104,843 104,843
Derivative liabilities 97 97 30 30
Total financial liabilities P107,650 P107,650 P104,873 P104,873
8/13/2019 3rd Quarter Financials(from san miguel webste)
http://slidepdf.com/reader/full/3rd-quarter-financialsfrom-san-miguel-webste 44/65
- 44 -
The following methods and assumptions are used to estimate the fair value of each class offinancial instruments and when it is practicable to estimate such value:
Cash and Cash Equivalents, Trade and Other Receivables and Noncurrent Receivables. Thecarrying amount of cash and cash equivalents and receivables approximates fair value primarily
due to the relatively short-term maturities of these financial instruments. In the case of long-termreceivables, the fair value is based on the present value of expected future cash flows using theapplicable discount rates based on current market rates of identical or similar quoted instruments.
Derivatives. The fair values of freestanding and bifurcated forward currency transactions arecalculated by reference to current forward exchange rates for contracts with similar maturityprofiles. Mark-to-market valuation in 2011 and 2010 of commodity hedges were based on theforecasted crude and product prices by Mitsui & Co. Commodity Risk Management Ltd.(MCRM), an independent trading group.
Financial Assets at FVPL and AFS Financial Assets. The fair values of publicly traded
instruments and similar investments are based on quoted market prices in an active market. Fordebt instruments with no quoted market prices, a reasonable estimate of their fair values iscalculated based on the expected cash flows from the instruments discounted using the applicablediscount rates of comparable instruments quoted in active markets. Unquoted equity securities arecarried at cost less impairment.
Long-term Debt - Floating Rate. Variable rate loans are repriced every three month, the carryingvalue approximates its fair value because of recent regular repricing based on current marketrates.
Cash Bonds. Fair value is estimated as the present value of all future cash flows discounted usingthe market rates for similar types of instruments.
Derivative Financial InstrumentsThe Group’s derivative financial instruments according to the type of financial risk beingmanaged and the details of freestanding and embedded derivative financial instruments arediscussed below.
The Group enters into various commodity derivative contracts to manage its exposure oncommodity price risk. The portfolio is a mixture of instruments including forwards, swaps andoptions covering the Group’s requirements on crude oil and finished products. These includefreestanding and embedded derivatives found in host contracts, which are not designated asaccounting hedges. Changes in fair value of these instruments are recognized directly in profit orloss.
The Group’s derivative financial instruments according to the type of financial risk beingmanaged are discussed below.

8/13/2019 3rd Quarter Financials(from san miguel webste)
http://slidepdf.com/reader/full/3rd-quarter-financialsfrom-san-miguel-webste 45/65
- 45 -
Freestanding DerivativesFreestanding derivatives consist of commodity derivatives and currency derivatives entered intoby the Group.
Currency Forwards
As of September and June 30, 2011 and December 31, 2010, the Company has outstandingforeign currency forward contracts with aggregate notional amount of US$182, US$155 andUS$15, respectively with various maturities up to December 2011. As of September and June 30,2011 and December 31, 2010, the net positive (negative) fair value of these currency forwardsamounted to P138, (P1) and nil, respectively.
Currency Options
The Company has no outstanding currency option agreements as of September and June 30, 2011and December 31, 2010.
Commodity Swaps
The Company has outstanding swap agreements covering its fuel and crude requirements, withvarious maturities in 2011. Under the agreement, payment is made either by the Company or itscounterparty for the difference between the agreed fixed price of fuels and crude and the pricebased on the relevant price index. The outstanding equivalent notional quantities covered by thecommodity swaps as of September and June 30, 2011 and December 31, 2010 were 3.0 MMB,5.7 MMB and 1.5 MMB, respectively. As of September and June 30, 2011 and December 31,2010, the total mark-to-market gain (loss) of these swaps amounted to (P267), (P128) and P32,respectively.
Commodity Options
The Company has outstanding commodity option agreements as of September and June 30, 2011and December 31, 2010 with notional quantities totaling 2.4 MMB, 0.9 MMB and 2.8 MMB,respectively. The respective mark-to-market gain (loss) of these hedges amounted to P634, P102 and P234 as of September and June 30, 2011 and December 31, 2010, respectively.
Embedded DerivativesThe Group assesses whether embedded derivatives are required to be separated from the hostcontracts when the Group becomes a party to the contract.
An embedded derivative is separated from the host contract and accounted for as a derivative if allof the following conditions are met: a) the economic characteristics and risks of the embeddedderivative are not closely related to the economic characteristics and risks of the host contract; b)a separate instrument with the same terms as the embedded derivative would meet the definitionof a derivative; and c) the hybrid or combined instrument is not recognized at FVPL.Reassessment only occurs if there is a change in the terms of the contract that significantlymodifies the cash flows that would otherwise be required.
The Group’s embedded derivatives include currency derivatives (forwards and options) embeddedin non-financial contracts.

8/13/2019 3rd Quarter Financials(from san miguel webste)
http://slidepdf.com/reader/full/3rd-quarter-financialsfrom-san-miguel-webste 46/65
- 46 -
Embedded Currency Forwards
As of September and June 30, 2011 and December 31, 2010, the total outstanding notionalamount of currency forwards embedded in non-financial contracts amounted to US$71, US$4 andUS$151, respectively. These non-financial contracts consist mainly of foreign currency-denominated service contracts, purchase orders and sales agreements. The embedded forwards are
not clearly and closely related to their respective host contracts. As of September and June 30,2011 and December 31, 2010, the net positive (negative) fair value of these embedded currencyforwards amounted to (P97), (P0.7) and (P4), respectively.
For the periods ended September 30, 2011 and 2010 and June 30, 2011 and 2010, the Grouprecognized marked-to-market gains from embedded derivatives amounting to P229, P189, P68and P85, respectively.
Fair Value HierarchyIn accordance with PFRS 7, financial assets and liabilities measured at fair value in the statementof financial position are categorized in accordance with the fair value hierarchy. This hierarchy
groups financial assets and liabilities into three levels based on the significance of inputs used inmeasuring the fair value of the financial assets and liabilities.
The table below analyzes financial instruments carried at fair value, by valuation method as ofSeptember 30, 2011 and December 31, 2010. The different levels have been defined as follows:
• Level 1: quoted prices (unadjusted) in active markets for identical assets or liabilities.
• Level 2: inputs other than quoted prices included within Level 1 that are observable forthe asset or liability, either directly or indirectly.
• Level 3: inputs for the asset or liability that are not based on observable market data.
September 30, 2011 Level 1 Level 2 TotalFinancial Assets
Financial assets at FVPL P185 P- P185
Derivative assets - 138 138
AFS financial assets - 1,034 1,034
Financial Liabilities
Derivative liabilities 97 97
December 31, 2010 Level 1 Level 2 Total
Financial Assets
Financial assets at FVPL P193 P - P193
Derivative assets - 34 34
AFS financial assets - 1,161 1,161
Financial Liabilities
Derivative liabilities 30 30

8/13/2019 3rd Quarter Financials(from san miguel webste)
http://slidepdf.com/reader/full/3rd-quarter-financialsfrom-san-miguel-webste 47/65
- 47 -
As of September 30, 2011 and December 31, 2010, the Group has no financial instruments valuedbased on Level 3. During the year, there were no transfers between Level 1 and Level 2 fair valuemeasurements, and no transfers into and out of Level 3 fair value measurements.
13. Events after the Reporting Date
On October 7, 2011, we disclosed that the Philippine Rating Services Corporation (PhilRatings)maintained Petron Corporation’s corporate credit rating of PRS Aaa (corp.) on the Company’soverall capacity to service its maturing obligations within a period of one year. A PRS Aaa creditrating is the highest score on PhilRatings’ issuer/corporate credit rating scale, which is given tocompanies exhibiting a strong capacity to meet its financial commitments relative to that of otherPhilippine corporate.
On October 21, 2011, the BOD declared a cash dividend of P2.382/share to all preferredstockholders for the last quarter of 2011 and the first quarter of 2012 with the following record
and payment dates:
Period Record Date Payment Date 4t Quarter 2011 November 16, 2011 December 5, 2011 1st Quarter 2012 February 21, 2012 March 5, 2012
On October 28, 2011, the Parent Company raised P3,600 from the sale of fixed-rate corporatenotes with ING Bank N.V.’s Manila Branch as arranger and bookrunner.
14. Other Matters
a. There were no unusual items as to nature and amount affecting assets, liabilities, equity, netincome or cash flows, except those stated in Management’s Discussion and Analysis ofFinancial Position and Performance.
b. There were no seasonal aspects that had a material effect on the financial position or financialperformance of the Group.
c. There were no material off-statements of financial position transactions, arrangements,obligations (including contingent obligations), and other relationship of the Group withunconsolidated entities or other persons created during the reporting period, except for the
outstanding derivative transactions entered by the Group as of and for the period endedSeptember 30, 2011.

8/13/2019 3rd Quarter Financials(from san miguel webste)
http://slidepdf.com/reader/full/3rd-quarter-financialsfrom-san-miguel-webste 48/65
- 48 -
d. Known trends, demands, commitments, events or uncertainties that will have a materialimpact on the Group’s liquidity.
Gross Domestic Product (GDP)
After growing robustly in 2010 due to high election spending, the domestic economy sloweddown in 2011. GDP in the 2Q11 expanded merely by 3.4% after the strong 8.9% growth inthe same quarter last year. The slowdown was due to the rising commodity prices, particularlyof fuels, lower growth of remittances due to the turmoil in the Middle East and North Africaand the tragedy in Japan, lower foreign direct investments and exports, and large decline ingovernment spending. Government underspending was observed as the current administrationhas become more stringent in releasing funds for infrastructure and other social projects toavoid corruption and reduce budget deficit.
91-Day Treasury-Bill Rate
91-day T-bills averaged 1.6% in the first three quarters of 2011, substantially lower than thesame period last year of 3.9% and FY 2010 average of 3.7%. Interest rates in 2011 have beenlow due to the sufficient liquidity in the domestic financial markets.
Peso-Dollar Exchange Rate
The local currency sustained its strength and averaged P43.3/$ in the first three quarters of2011 from 2010 FY average of P45.1/$ and 3-quarter average of P45.6/$ in 2010. Thecontinuously growing OFW remittances, and strong portfolio investments contributed to thepeso’s appreciation. The Dollar’s general weakness due to the US’ fragile economy alsobenefitted other currencies like the peso.
Inflation
Inflation averaged 4.3% in the first nine months of 2011 (based on 2000 prices), slightlyhigher from 4.1% average in the same period last year and from FY 2010’s 3.8% average.Prices of fuel, light, water, and services have been higher this year compared to 2010. YTDSeptember average inflation remains within the government’s target inflation of 3-5% for FY2011.
Dubai price
Dubai crude averaged $106.2/bbl as of YTD September 2011, a large leap from the $76.0/bblaverage in the same period last year and $77.1/bbl FY average in 2010. The surge of crudeprices was triggered by the heightened turmoil in the oil-exporting regions Middle East andNorth Africa especially during the 1H, disrupting some supply of crude. Crude prices werealso boosted by high investment in the crude futures market due to the weakness of the dollar,and the strength of the equities market.

8/13/2019 3rd Quarter Financials(from san miguel webste)
http://slidepdf.com/reader/full/3rd-quarter-financialsfrom-san-miguel-webste 49/65
- 49 -
Industry Oil Demand
Data from DOE shows that as of August 2011, total oil industry demand dropped by 5.9%from 308.6 MBD in the same period last year to only 290.4 MBD this year. The rising pricesof fuels in 2011 affected industry demand. Motorists, industries, and households tend to
conserve fuel consumption during times of high prices.
Tight Industry Competition
Competition remains stiff with the new players implementing different marketing strategiesand aggressively expanding. As of YTD August 2011, the new players (excluding directimports) have collectively cornered around 24.6% of the total oil market. Collectively, thenew players are leading the LPG market segment with 45.0% market share.
Updates on 2011 Capital Program
The 2011 capital program endorsed last December 2010 is P88.6 billion. Of this amount P23.7billion has already been approved and includes partial funding for the refinery expansionproject, service station network expansion, consumer facilities, asphalt facilities, maintenanceand other efficiency projects.
e. Known trends, events or uncertainties that have had or that are reasonably expected to have afavorable or unfavorable impact on net sales or revenues or income from continuingoperation.
Illegal Trading Practices
Cases of smuggling and illegal trading (e.g. “bote-bote” retailing, illegal refilling) continue tobe a concern. These illegal practices have resulted in unfair competition among players.
Existing or Probable Government Regulation
EO 890: Removing Import Duties on All Crude and Refined Petroleum Products. After theASEAN Trade in Goods Agreement (ATIGA) was implemented starting 2010, tariff ratestructure in the oil industry was distorted with crude and product imports from ASEANcountries enjoying zero tariff while crude and product imports from outside the ASEAN arelevied 3%. To level the playing field, Petron filed a petition with the Tariff Commission toapply the same tariff duty on crude and petroleum product imports, regardless of source. InJune 2010, the government approved Petron’s petition and issued Executive Order 890 which
eliminates import duties on all crude and petroleum products regardless of source. Thereduction of duties took effect on July 4, 2010.

8/13/2019 3rd Quarter Financials(from san miguel webste)
http://slidepdf.com/reader/full/3rd-quarter-financialsfrom-san-miguel-webste 50/65
- 50 -
Biofuels Act of 2006. The Biofuels Act of 2006 mandates that ethanol comprise 5% of totalgasoline volumes, and diesels contain 2% CME (cocomethyl ester). By 2011, all gasolinegrades should contain 10% ethanol.The Department of Energy circular (DC 2011-02-0001) signed February 6, 2011 furtherelaborates that the 10% ethanol blend shall be mandatory beginning August 26, 2011, subject
to exempt gasoline grades. These exempt gasoline grades are regular gasoline with RON 81for use of off-road engines, farm equipment and small motorized bancas; regular gasolinewith RON 87 for use of motorcycles and premium plus gasoline with minimum RON of 97.By February 6, 2012 or upon full implementation, all gasoline grades, no exemptions, shall berequired to contain 10% ethanol. Full implementation will be subject to review 30 days beforeFebruary 6, 2012 to determine its economic viability given availability of supply and ethanolprices.
To produce compliant fuels, the Company invested in CME (coco methyl esther) injectionsystems at the refinery and depots. Prior to the mandatory blending of ethanol into gasoline by2009, the Company already started selling ethanol blended gasoline in selected service
stations in Metro Manila in May 2008.
Renewable Energy Act of 2008. The Renewable Energy Act signed in December 2008 aimsto promote development and commercialization of renewable and environment-friendlyenergy resources (e.g. biomass, solar, wind) through various tax incentives. Renewable energydevelopers will be given 7-year income tax holiday, power generated from these sources willbe VAT-exempt, and facilities to be used or imported will also have tax incentives.
Laws on Oil Pollution .To address issues on marine pollution and oil spillage, the MARINAmandated the use of double-hull vessels for transporting black products beginning end-2008and by January 2012 for white products.
Petron has been using double-hull vessels in transporting all black products and some whiteproducts already.
Clean Air Act. Petron invested in a Gasoil Hydrotreater Plant and in an Isomerization Plant toenable it to produce diesel and gasoline compliant with the standards set by law.
Liquefied Petroleum Gas (LPG) Bill. The LPG Act of 2009 aims to ensure safe practices andquality standards and mitigate unfair competition in the LPG sector. LPG cylinder sealsuppliers must obtain a license and certification of quality, health and safety from theDepartment of Energy before they are allowed to operate. LPG cylinder requalifiers, repairersand scrapping centers, will also have to obtain a license from the Department of Trade andIndustry. The Bill also imposes penalties on underfilling, underdelivering, illegal refilling andstorage, sale or distribution of LPG-filled cylinders without seals, illegal possession of LPGcylinder seal, hoarding, and importation of used or second-hand LPG cylinders, refusal ofinspection, and non-compliance to standards.

8/13/2019 3rd Quarter Financials(from san miguel webste)
http://slidepdf.com/reader/full/3rd-quarter-financialsfrom-san-miguel-webste 51/65
- 51 -
f. Events that will trigger direct or contingent financial obligation that is material to thecompany, including any default or acceleration of an obligation.
Tax Credit Certificates Related Cases
In 1998, Petron contested before the Court of Tax Appeals (CTA), the collection bythe Bureau of Internal Revenue (BIR) of deficiency taxes arising from the company’sacceptance and use of Tax Credit Certificates (TCCs) worth P659 million from 1993-1997. The CTA ruled in favor of Petron. The BIR then appealed the case to the Courtof Appeals (CA) after which the CA issued a resolution suspending decision on thecase until the termination of the Department of Finance (DOF) investigation. Petronfiled a motion for reconsideration which remains pending at the moment.
In May 2002, the BIR issued a collection letter for deficiency taxes of P254 millionplus interest and charges for the years 1995-1998, as a result of the cancellation of theTax Debit Memos and TCCs by the DOF Center ExCom. Petron elevated the protest
to the CTA. The Second Division CTA denied Petron’s Petition for Review for lack ofmerit. Petron then appealed the case with the CTA En Banc. On December 3, 2008,the CTA En Banc promulgated a decision reversing the unfavorable decision of theCTA 2nd Division. The CIR filed a Petition for Review with the Supreme Court wherethe case remains submitted for resolution.
PandPandPandPandacan Terminal Operationsacan Terminal Operationsacan Terminal Operationsacan Terminal Operations
Citing concerns for safety, security and health, the City of Manila passed CityOrdinance No. 8027 which reclassified the Pandacan Terminal from industrial tocommercial. Petron, together with the other oil companies asked the Supreme Court tochange the ruling since the Comprehensive Land Use Plan and Zoning Ordinance
(Ordinance No.8119) repealed the Manila Ordinance No. 8027. Ordinance No. 8119gives Petron a seven-year grace period to continue its operations in the PandacanTerminal. In February 2008, the Supreme Court denied the oil company’s motion forreconsideration and declared Manila Ordinance No. 8027 valid and applicable to all oilterminals. The Court directed the oil companies to submit their relocation plans to theRTC within 90 days to determine the reasonableness of the time frame for relocation.In May 2008, Petron, Shell and Chevron submitted their Comprehensive RelocationPlan in compliance with the February Resolution. The Pandacan Terminal isstrategically significant since it serves about 40% of the company’s refinery outputand 100% of the company’s lubricants, greases and oxidized asphalt.
On May 28, 2009, Mayor Alfredo Lim of Manila approved and signed proposedOrdinance 7177 (which became Ordinance No. 8187) repealing Ordinance No. 8027and 8119 and allowing the continued stay of the oil depots at Pandacan. Mayor Limwas reelected Mayor of Manila in the May 10, 2010 election.

8/13/2019 3rd Quarter Financials(from san miguel webste)
http://slidepdf.com/reader/full/3rd-quarter-financialsfrom-san-miguel-webste 52/65

8/13/2019 3rd Quarter Financials(from san miguel webste)
http://slidepdf.com/reader/full/3rd-quarter-financialsfrom-san-miguel-webste 53/65
- 53 -
The Respondents denied the allegations imputed against them, as the same accusationwas already resolved and dismissed by the Provincial Prosecutor’s Office of Guimarasin a Resolution dated March 2, 2007.
On July 14, 2011, the Provincial Prosecutor’s Office of Guimaras issued a Joint
Resolution finding probable cause to indict the owner and the Captain of M/T Solar 1and Messrs. Alcantara and Mr. Faddagh for Violation of Section 28, Paragraph 5 inrelation to Section 4 of the Clean Water Act of 2004.
Messrs. Alcantara and Faddagh filed their Motion for Reconsideration with theProvincial Prosecutor’s Office of Guimaras on August 1, 2011. The Complainantsfiled their Reply and Supplemental Comment while Messrs. Alcantara and Faddaghcountered this with a Reply with Motion for Inhibition. Both Motions forReconsideration and Inhibition have not been resolved.
Petron did not hire or engaged the services of the Captain of M/T Solar 1 contrary to thefinding contained in the Marine Accident Inquiry Report of the Special Marine Inquiry Boardrelied upon by the Prosecutor’s Office. In addition, under Republic Act No. 9483, otherwiseknown as “The Oil Pollution Compensation Act of 2007”, it is the owner of the vessel, not thecharterer, that is liable for any oil spill or pollution damage that may result from the operationof the said vessel.

8/13/2019 3rd Quarter Financials(from san miguel webste)
http://slidepdf.com/reader/full/3rd-quarter-financialsfrom-san-miguel-webste 54/65
- 54 -
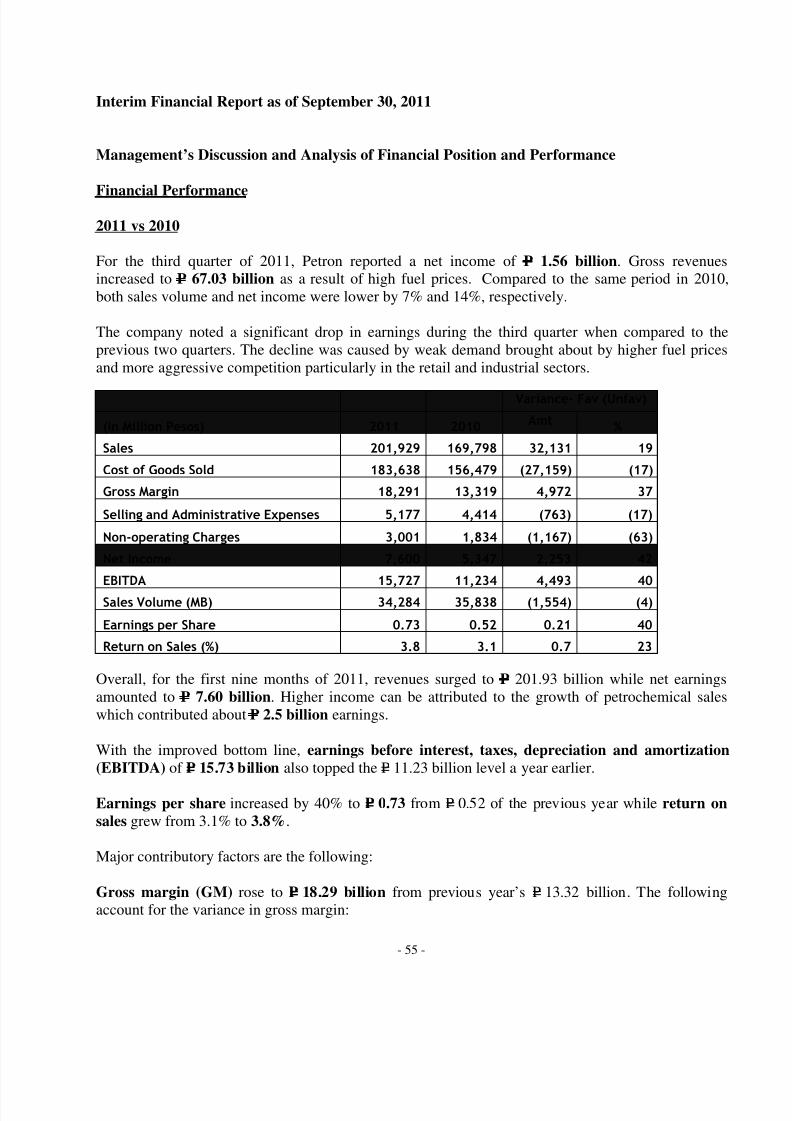
8/13/2019 3rd Quarter Financials(from san miguel webste)
http://slidepdf.com/reader/full/3rd-quarter-financialsfrom-san-miguel-webste 55/65
- 55 -
Interim Financial Report as of September 30, 2011
Management’s Discussion and Analysis of Financial Position and Performance
Financial Performance
2011 vs 2010
For the third quarter of 2011, Petron reported a net income of P 1.56 billion. Gross revenuesincreased to P 67.03 billion as a result of high fuel prices. Compared to the same period in 2010,both sales volume and net income were lower by 7% and 14%, respectively.
The company noted a significant drop in earnings during the third quarter when compared to theprevious two quarters. The decline was caused by weak demand brought about by higher fuel pricesand more aggressive competition particularly in the retail and industrial sectors.
Variance- Fav (Unfav)
(In Million Pesos) 2011 2010 Amt %
Sales 201,929 169,798 32,131 19
Cost of Goods Sold 183,638 156,479 (27,159) (17)
Gross Margin 18,291 13,319 4,972 37
Selling and Administrative Expenses 5,177 4,414 (763) (17)
Non-operating Charges 3,001 1,834 (1,167) (63)
Net Income 7,600 5,347 2,253 42
EBITDA 15,727 11,234 4,493 40
Sales Volume (MB) 34,284 35,838 (1,554) (4)
Earnings per Share 0.73 0.52 0.21 40
Return on Sales (%) 3.8 3.1 0.7 23
Overall, for the first nine months of 2011, revenues surged to P 201.93 billion while net earningsamounted to P 7.60 billion. Higher income can be attributed to the growth of petrochemical saleswhich contributed about P 2.5 billion earnings.
With the improved bottom line, earnings before interest, taxes, depreciation and amortization (EBITDA) of P= 15.73 billion also topped the P= 11.23 billion level a year earlier.
Earnings per share increased by 40% to P= 0.73 from P= 0.52 of the previous year while return onsales grew from 3.1% to 3.8%.
Major contributory factors are the following:
Gross margin (GM) rose to P= 18.29 billion from previous year’s P= 13.32 billion. The followingaccount for the variance in gross margin:

8/13/2019 3rd Quarter Financials(from san miguel webste)
http://slidepdf.com/reader/full/3rd-quarter-financialsfrom-san-miguel-webste 56/65
- 56 -
♦ Sales volume as of September 2011 ended lower at 34.3MMB compared to last year’s35.8MMB as current level of prices resulted in a 7% (2.16MMB) contraction in the domesticmarket. Meanwhile, exports improved by 17% (0.62MMB). The slowdown in local sales camefrom Diesel (1,233MB) and Fuel Oil (1,774MB) mitigated by the growth in LPG and Jet(880MB).
♦ Net sales revenue grew by 19% to P= 201.93 billion from P= 169.80 billion the year beforeessentially due to the hike in average selling price per liter (2011: P= 36.13 vs. 2010: P= 29.08)prompted by the 36% spike in regional MOPS prices (2011 Ave - US$122.64/bbl vs. 2010 Ave- US$90.48/bbl), tempered by the P= 2.33 average appreciation of the peso versus the US dollar.
♦ Cost of Goods Sold (CGS) went up to P= 183.64 billion from last year’s P= 156.48 billion as theaverage cost per liter increased by 22% (2011: P= 32.88 vs 2010: P= 26.94). Higher cost per literwas principally due to the 31% escalation in landed cost of crude that formed part of the totalcost of goods sold (2011: US$ 104.08/bbl vs 2010: US$ 79.37).
♦ Refinery Operating Expenses which formed part of CGS rose to P= 4.12 billion from P= 3.71billion during the same period last year. This was attributed to increased power consumptiondue to higher cost per kilowatt-hour (2011: P= 6.31 vs 2010: P= 4.65) and higher maintenance andrepairs on several facilities. Employee costs also moved up due largely to additional manpowercomplement and payment of signing bonus to rank-and-file employees.
Selling and Administrative Expenses of P= 5.18 billion exceeded last year’s P= 4.41 billionexpenditures as newly built service stations resulted in increased rent and depreciation. Materialsand supplies also went up due to acquisition of LPG cylinders while aggressive promotionalactivities accounted for higher advertising expenses. With the surge in operating expenses despitethe drop in volume, opex per liter of volume sold grew from P= 0.77 last year to P= 0.95 this year.
Net Financing Costs and Other Charges rose to P= 3.00 billion from the P= 1.84 billion level as ofSeptember 2010. The increase in average borrowing level and rate (2011: P 77.00 billion @ 5.8%vs. 2010: P 59.00 billion @ 5.3%) resulted to higher interest expense. Losses from US-dollardenominated transactions also contributed to the increment. The increase was partly offset by theinterest earned from advances to Petron Corporation Employee Retirement Plan, marked-to-market gains on Embedded Derivatives, and commodity hedging gains.

8/13/2019 3rd Quarter Financials(from san miguel webste)
http://slidepdf.com/reader/full/3rd-quarter-financialsfrom-san-miguel-webste 57/65
- 57 -
2010 vs 2009
Variance- Fav (Unfav)
(In Million Pesos) 2010 2009 Amt %
Sales 169,798 123,635 46,163 37
Cost of Goods Sold 156,479 111,620 (44,859) (40)
Gross Margin 13,319 12,015 1,304 10
Selling and Administrative Expenses 4,414 4,116 (298) (7)
Non-operating Charges 1,835 3,261 1,426 46
Net Income 5,347 3,366 1,981 58
EBITDA 11,234 10,394 840 8
Sales Volume (MB) 35,838 32,324 3,514 10
Earnings per Share 0.57 0.36 0.21 58
Return on Sales (%) 3.1 2.7 0.40 14
Petron’s consolidated net income for the first nine months of 2010 reached P 5.35 billion, up byP 1.98 billion from the P3.37 billion earnings posted during the same period in 2009. The 59%improvement in the company’s bottom line was primarily attributed to the combined effect of highersales volume, better margins of petrochemical products, lower interest expense and unrealized foreignexchange gains on outstanding US$ loan with the continued appreciation of the Philippine pesoversus the U.S. dollar.
In the third quarter of 2010, Petron posted a net profit of P 1.81 billion, 16% better than the P 1.56billion income reported in 2009 despite the P 0.91 billion drop in margin. The deterioration in margin
was more than offset by higher interest income and translation gains versus translation losses in 2009.
On a year to date basis, earnings before interest, taxes, depreciation and amortization (EBITDA) of P 12.1 billion surpassed 2009 level by 16% or P1.7 billion.
Earnings per share improved to P 0.57 from P 0.36 in 2009 while return on sales increased from2.7% to 3.1%.
Major contributory factors are the following:
Gross margin (GM) grew by 11% to P 13.32 billion from prior year’s P 12.02 billion. The
following accounted for the variance in gross margin:
♦ Sales volume reached 35.8MMB, up by 11% from 32.3MMB in 2009 prompted by higherdiesel, fuel oil and petrochemical sales. Diesel sales rose due to volume requirements of newbuilds while increase in fuel oil was triggered by heightened operations of independent powerproducers. Also, the commercial operations of BTX units which produce new petrochemicalproducts benzene and toluene started only in April 2009.

8/13/2019 3rd Quarter Financials(from san miguel webste)
http://slidepdf.com/reader/full/3rd-quarter-financialsfrom-san-miguel-webste 58/65
- 58 -
♦ Net sales revenue of P= 169.8 billion for the first three quarters of 2010 exceeded 2009 level ofP 123.6 billion by 37%, due to the combined effect of higher average selling price (2010:P= 29.13 vs. 2009:P= 23.48) and volume. Regional MOPS prices increased from an averageUS$60.64/bbl in 2009 to US$80.45/bbl in 2010.
♦
Cost of Goods Sold (CGS) soared to P= 156.48 billion from P= 111.62 in 2009 billion as crudecost went up (2010: US$77.46 vs. 2009: US$57.97). In 2010, 85% of CGS was sourced fromcrude compared to 67% of the same period in 2009. Lower crude consumption in 2009 wasprimarily due to the total plant shutdown in the first few months of 2010.
♦ Refinery Operating Expenses, which formed part of CGS, totaled P= 3.71 billion or 5% lowerthan 2009. The decline in expenses was brought about mainly by the decrease in maintenanceand repairs (M&R) and lower depreciation expense. M&R was higher in 2009 due to repairs ofproperties damaged by the fire incident and turnaround activities of some units. The reduction,however, was partly offset by the increases in purchase utilities and materials and supplies onaccount of higher crude run.
Selling & Administrative Expenses amounted to P= 4.41 billion, 7% higher than 2009.Aggressive retail expansion, rental on SMC offices and higher purchase of LPG cylinderscontributed to the rise in expenses. However, on a peso per liter basis, actual operating expensewas lower at P= 0.65 versus P= 0.76 in 2009 primarily on account of the 11% rise in sales volume.
Net Financing Costs & Other Charges dropped significantly from 2009 total of P= 3.26 billion to P 1.84 billion in 2010. Interest expense declined by P 362 million attributed to favorable averageborrowing rate (2010: 5.2% vs. 2009: 6.4%) despite the increase in average borrowing level (2010:P= 59.4 billion vs. 2009: P= 56.3 billion). In addition, higher interest income coupled with favorableforeign exchange translation on dollar-denominated loans largely contributed to the positivevariance.
8/13/2019 3rd Quarter Financials(from san miguel webste)
http://slidepdf.com/reader/full/3rd-quarter-financialsfrom-san-miguel-webste 59/65
- 59 -
Financial Position
September 2011 vs. December 2010
As of September 30, 2011, consolidated resources stood at P= 170.96 billion, 6% (P= 9.14 billion)
higher compared to end-December 2010 level of P= 161.82 billion due to the combined effects of thefollowing:
Cash and cash equivalents were reduced by 54% to P= 20.40 billion primarily to fund workingcapital requirement (Inventories and Receivables), capital expenditures and other investments.
Financial assets at fair value through profit or loss was up by 42% from P= 0.23 billion to P= 0.32billion brought about by the strengthened fair value of free standing derivatives partly offset by thedecline in market value of investments in marketable securities and club membership shares.
Trade and other receivables-net rose by 7% (P= 1.74 billion) to P= 26.00 billion from the P= 24.27
billion level in December 2010 attributed to increased sales to industrial customers.
Inventories grew significantly from P= 28.15 billion to P= 47.09 billion largely due to higher crudeprice and volume.
Other current assets of P= 7.09 billion surpassed the P= 4.29 billion level as at year-end of 2010owing to higher Input VAT as a result of higher purchase price of crude and finished products.
The drop in Assets-held-for-sale from P= 0.82 billion to P= 0.01 billion pertained to the transfer ofPetron Mega Plaza to Investment Properties which surged to P= 0.82 billion from P= 0.12 billion.
Property, plant and equipment-net increased by 23% from P= 34.96 billion to P= 42.98 billion due tovarious capital projects in the refinery such as the Refinery Solid Fuel Fired Power Plant andRefinery Master Plan 2, and additional service stations.
Investment in associates also increased from P= 0.80 billion to P= 1.32 billion with the purchase of35% interest in Manila North Harbour Port, Inc.
Available-for-sale financial assets (current and non-current) fell to P= 1.03 billion from P= 1.16billion in December 2010 resulting from lesser investments in government securities and corporatebonds during the period.
Deferred tax assets-net went up to P= 170 million from P= 28 million in 2010 due essentially to theeffect of unrealized profit from subsidiaries.
Short-term loans and liabilities for crude oil and petroleum product importations of P= 57.37billion surged by 31% (P= 13.72 billion), an offshoot of higher crude and finished product prices thisyear.

8/13/2019 3rd Quarter Financials(from san miguel webste)
http://slidepdf.com/reader/full/3rd-quarter-financialsfrom-san-miguel-webste 60/65
- 60 -
Derivative Liabilities of P= 97 million more than tripled the P= 30 million level as at end of December2010 due to higher notional amounts heightened by deteriorating fair value of embedded derivativetransactions.
Income tax payable ballooned from P= 14 million to P= 532 million prompted by higher taxable
income during the nine-month period. The December 2010 taxable income considered the netoperating loss carry-over (NOLCO) of prior years. In addition, last year’s tax due was reduced by theutilization of past years’ MCIT as against zero this year.
Long-term debt inclusive of current portion went lower by 20% from P= 54.40 billion to P= 43.28billion with the settlement of maturing loans.
Deferred tax liabilities-net of P= 1.77 billion, showed a 9% reduction from the P= 1.96 billion balanceas at December 31, 2010 after considering the impact of temporary differences in income taxcomputation.
Asset retirement obligation escalated by 8% (P= 63 million) to P= 878 million on account of higheraccretion rate.
Other non-current liabilities perked up by 15% ( P= 93 million) to P= 702 million with the increase incylinder deposit and cash bonds.
Total equity amounted to P= 59.29 billion, 11% higher than the P= 53.34 billion level in December2010, traceable to the P= 7.58 billion income realized during the first nine months of the year partlyoffset by cash dividends paid to preferred and common shareholders totaling P= 1.65 billion.
September 2010 vs. December 2009
Petron closed the third quarter of 2010 with total assets of P= 138.34 billion, 22% or P= 25.15 billionhigher than end-December 2009 level of P= 113.19 billion.
Cash and cash equivalents increased by 24% or P= 3.07 billion to P= 16.05 billion principally due tothe proceeds from loan availments and issuance of preferred shares.
Available for-sale investments (current and non-current) of P= 1.20 billion declined by 11% or P= 151million on account of the maturity of investment in government securities of the local insurancesubsidiary.
Trade and other receivables-net amounted to P= 25.25 billion, 15% or P= 4.45 billion lower than theP= 29.70 billion level as of December 31, 2009 mainly due to the drop in government receivables as aresult of significant utilization of tax credit certificates.
8/13/2019 3rd Quarter Financials(from san miguel webste)
http://slidepdf.com/reader/full/3rd-quarter-financialsfrom-san-miguel-webste 61/65
- 61 -
Inventories-net went up to P= 32.12 billion from P= 28.17 billion as at end of 2009. The P= 3.95 billionincrease was primarily attributed to higher volume of both crude and finished products. There wereminimal purchases in December 2009 in anticipation of the implementation of the ASEAN Trade inGoods Agreement (ATIGA) starting January 2010.
Other current assets posted a 29% or P= 1.31 billion reduction from P= 4.47 billion to P= 3.16 billion,essentially due to the filing of input VAT claims on zero-rated sales.
Investment Properties of P= 0.96 billion was four times higher than the P= 0.23 billion figure reportedin December 2009 chiefly due to the transfer of the book value of Petron Megaplaza Offices fromProperty, Plant and Equipment account.
Deferred tax assets of P= 15 million was twice as much from end-December 2009 balance of P= 7million due mainly to the effect of translation adjustment of the foreign insurance subsidiary.
Other non-current assets were considerably higher at P= 24.43 billion in 2010 from P= 1.33 billion in
year-end 2009 primarily traced to advances to the retirement fund.
Short-term loans and liabilities for crude oil and petroleum product importations went down by9% (P= 4.54 billion) to P= 45.74 billion principally due to settlements made countered by highercrude/finished products importations.
Long-term debt inclusive of current portion showed a significant movement from P= 18.89 billionto P= 33.12 billion chiefly due to the newly-availed NORD loan amounting to US$355 million partlyreduced by amortizations of outstanding loans.
Income tax payable increased to P= 14 million from P= 10 million as at December 31, 2009 owing tohigher tax liabilities reported by the subsidiaries.
Deferred income tax liabilities-net at P= 1.89 billion grew almost three-fold from P= 514 millionlargely due to the impact of NOLCO as well as temporary differences reflected under parent andsubsidiaries’ accounts.
Other non-current liabilities rose by 10% or P= 109 million to P= 1.16 billion mainly due to theincreases in provision for Asset Retirement Obligation and cylinder/cash bond deposits.
Total equity attributable to equity holders of the parent aggregated P= 51.10 billion at the end ofthird quarter 2010, showing a 37% or P= 13.81 billion improvement over the end-December 2009 leveldue to the combined effect of the following:
P= 9.86 billion issuance of preferred shares, net of issue cost P= 5.35 billion year-to-date net income partly reduced by the P= 1.44 billion dividends on
common and preferred shares.

8/13/2019 3rd Quarter Financials(from san miguel webste)
http://slidepdf.com/reader/full/3rd-quarter-financialsfrom-san-miguel-webste 62/65
- 62 -
Cash Flow
Cash generated from operating activities was more than offset by the substantial increase ininventories, thus, resulted in a net cash outflow of P= 0.64 billion.
Cash outflows from investing activities were used primarily in capital projects in the refinery,construction of additional service stations, and investment in Manila North Harbour Port, Inc.
Available cash was also used to pay-off maturing obligations and dividends.
In Million Pesos Sept 30, 2011 Sept 30, 2010 Change
Operating (outflows)/inflows (641) 20,691 (21,332)
Investing Outflows (13,057) (29,500) 16,443
Financing (outflows)/inflows (9,947) 11,935 (21,882)
Discussion of the company’s key performance indicators:
Ratio Sept 30, 2011 Dec 31, 2010
Current Ratio 1.5 1.6
Debt to Equity Ratio 1.9 2.0
Return on Equity (%) 18.0 17.4
Debt Service Coverage 4.1 4.2
Tangible Net worth 59.3B 53.3B
Current Ratio: Total current assets divided by total current liabilities. This ratio is a rough indicationof a company's ability to service its current obligations. Generally, the higher the current ratio, thegreater the "cushion" between current obligations and a company's ability to pay them.
Debt to Equity Ratio: Total liabilities divided by tangible net worth. This ratio expresses therelationship between capital contributed by creditors and that contributed by owners. It expresses thedegree of protection provided by the owners for the creditors. The higher the ratio, the greater therisk being assumed by creditors. A lower ratio generally indicates greater long-term financial safety. Return on Equity: Net income divided by average total stockholders’ equity. This ratio reveals howmuch profit a company earned in comparison to the total amount of shareholder equity found on thestatements of financial position. A business that has a high return on equity is more likely to be onethat is capable of generating cash internally. For the most part, the higher a company’s return onequity compared to its industry, the better.

8/13/2019 3rd Quarter Financials(from san miguel webste)
http://slidepdf.com/reader/full/3rd-quarter-financialsfrom-san-miguel-webste 63/65
- 63 -
Debt Service Coverage: Free cash flows add available closing cash balance divided by projected debtservice. This ratio shows the cash flow available to pay for debt to the total amount of debt paymentsto be made. It also measures the company’s ability to settle dividends, interests and other financingcharges.
Tangible Net Worth: Net worth minus intangible assets. This figure gives a more immediatelyrealizable value of the company.

8/13/2019 3rd Quarter Financials(from san miguel webste)
http://slidepdf.com/reader/full/3rd-quarter-financialsfrom-san-miguel-webste 64/65
- 64 -

8/13/2019 3rd Quarter Financials(from san miguel webste)
http://slidepdf.com/reader/full/3rd-quarter-financialsfrom-san-miguel-webste 65/65