3rdpresentationfinalversion
TRANSCRIPT

8/7/2019 3rdPresentationFinalVersion
http://slidepdf.com/reader/full/3rdpresentationfinalversion 1/29
Mistica, Musa, Ng, Noguera, Ocampo, Pandy, Pangingasan,
Pedroso, Pua, Reyes, Rillo, Salido
8/7/2019 3rdPresentationFinalVersion
http://slidepdf.com/reader/full/3rdpresentationfinalversion 2/29
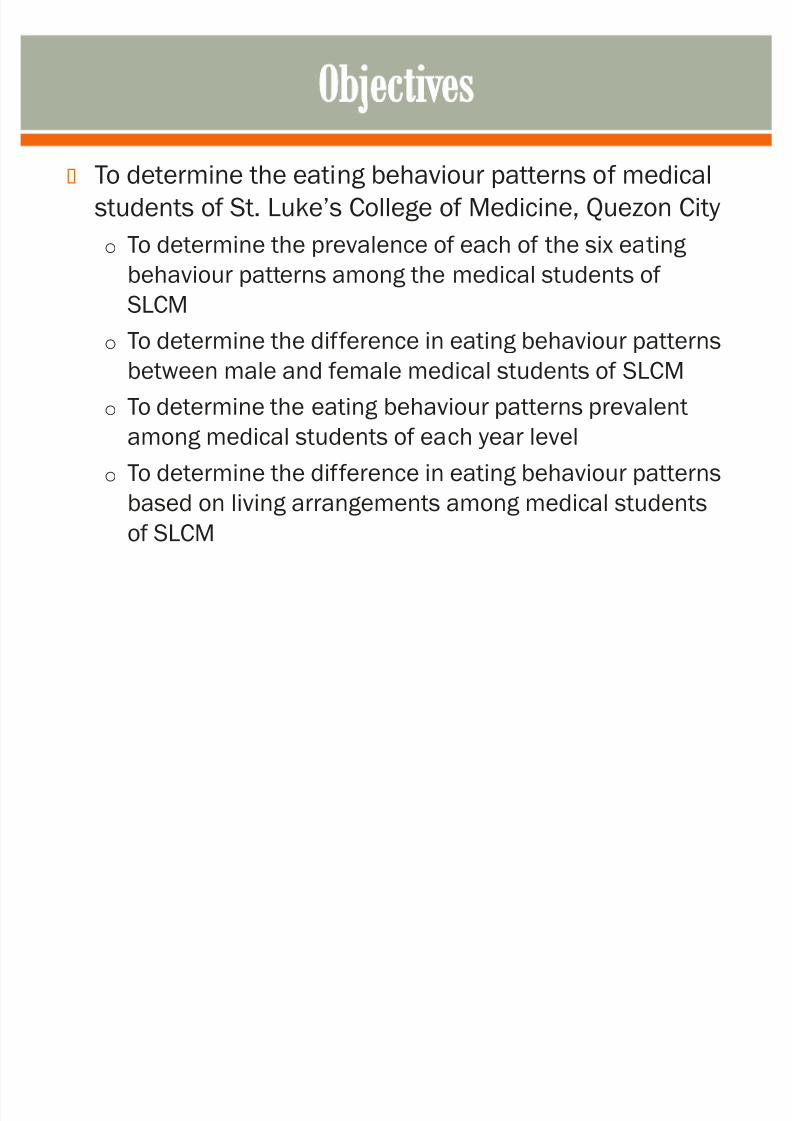
To determine the eating behaviour patterns of medical
students of St. Luke·s College of Medicine, Quezon City
o To determine the prevalence of each of the six eating
behaviour patterns among the medical students of SLCM
o To determine the difference in eating behaviour patterns
between male and female medical students of SLCM
o To determine the eating behaviour patterns prevalentamong medical students of each year level
o To determine the difference in eating behaviour patterns
based on living arrangements among medical students
of SLCM

8/7/2019 3rdPresentationFinalVersion
http://slidepdf.com/reader/full/3rdpresentationfinalversion 3/29

8/7/2019 3rdPresentationFinalVersion
http://slidepdf.com/reader/full/3rdpresentationfinalversion 4/29
Study area/Population
o
The study is concerned with the studentscurrently enrolled in the doctor of medicine
program of St. Luke·s College of Medicine in
Quezon City.
o The target population consists of the first years,
second years, third years, clerks, and intern.
8/7/2019 3rdPresentationFinalVersion
http://slidepdf.com/reader/full/3rdpresentationfinalversion 5/29
Study area/Population
o Exclusion criteria� Students who have been clinically diagnosed with
eating disorders and serious medical conditions
that necessitate dietary restrictions
8/7/2019 3rdPresentationFinalVersion
http://slidepdf.com/reader/full/3rdpresentationfinalversion 6/29
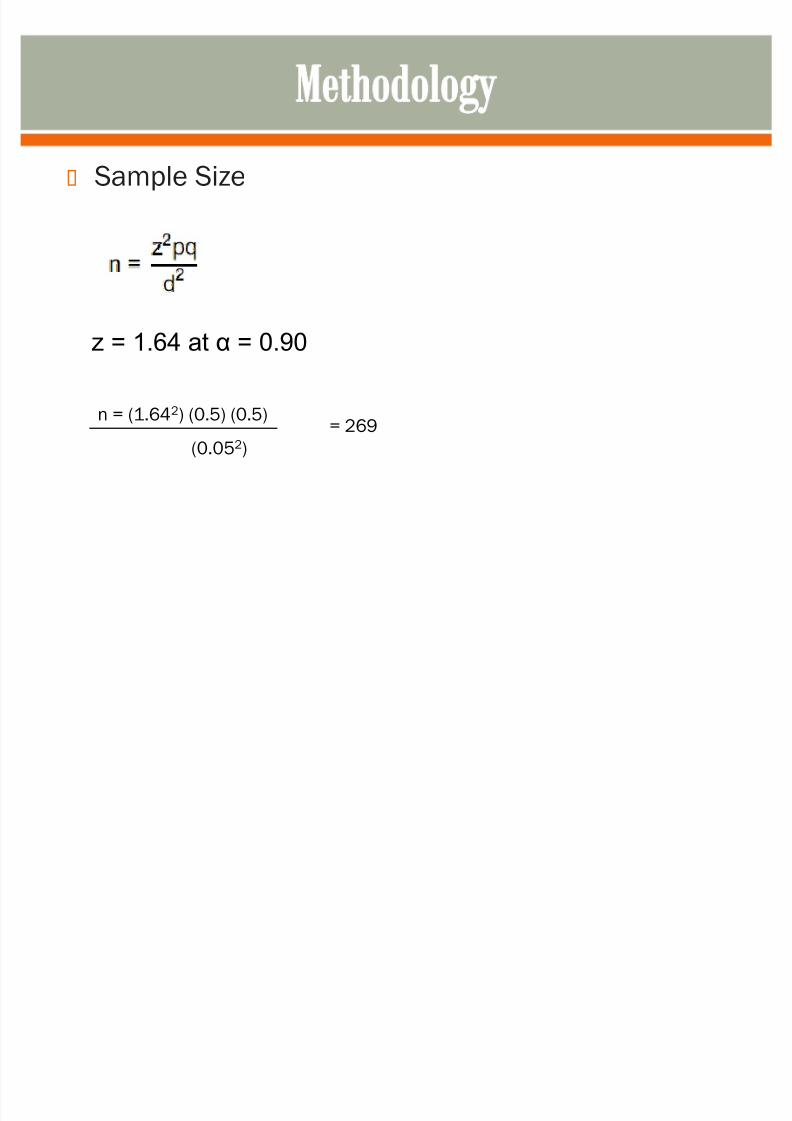
Sample Size
z = 1.64 at = 0.90
n = (1.642) (0.5) (0.5)
(0.052)
= 269
8/7/2019 3rdPresentationFinalVersion
http://slidepdf.com/reader/full/3rdpresentationfinalversion 7/29
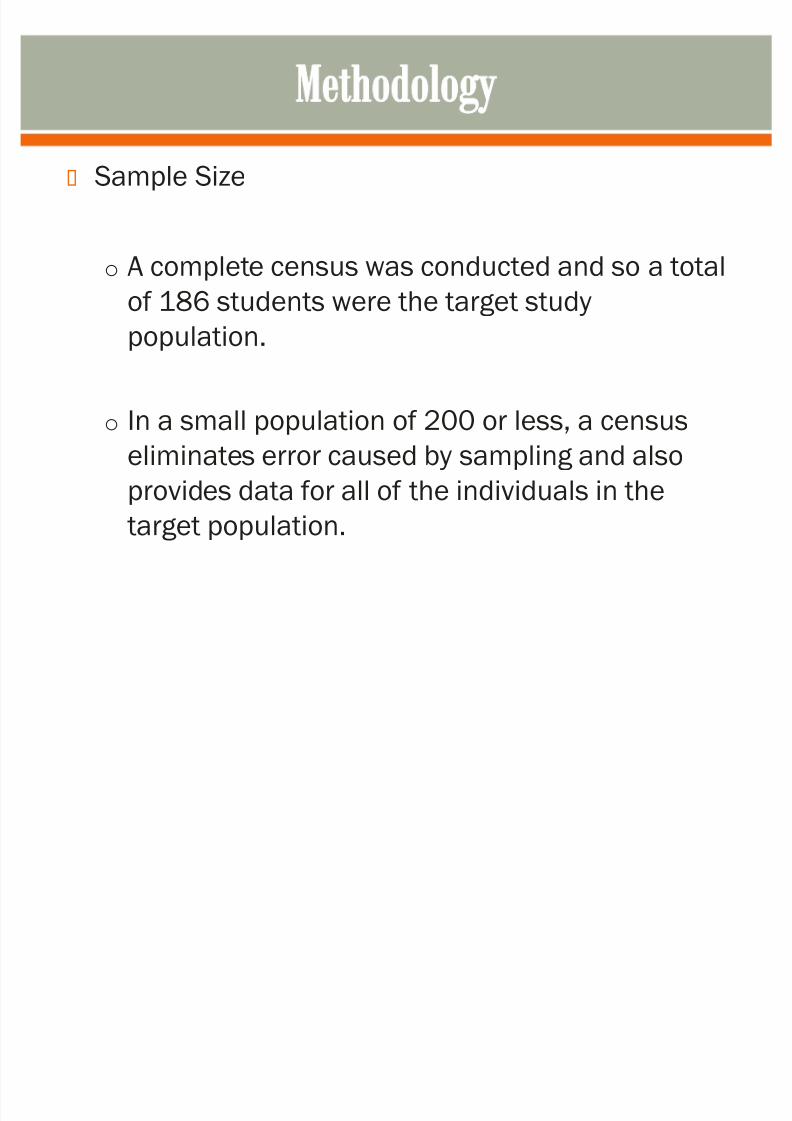
Sample Size
o Acomplete census was conducted and so a total
of 186 students were the target study
population.
o In a small population of 200 or less, a censuseliminates error caused by sampling and also
provides data for all of the individuals in the
target population.

8/7/2019 3rdPresentationFinalVersion
http://slidepdf.com/reader/full/3rdpresentationfinalversion 8/29
1�Simulation
2�Data collection proper
3�Scoring

8/7/2019 3rdPresentationFinalVersion
http://slidepdf.com/reader/full/3rdpresentationfinalversion 9/29
Prior to the actual survey, questionnaire administration
was simulated among the group members to:
o Evaluate the comprehensibility of the questionnaire
o Predict the possible problems and/or questions that
may arise during the administration
o Come up with operational definitions and limitations
o Plan the strategy of administration

8/7/2019 3rdPresentationFinalVersion
http://slidepdf.com/reader/full/3rdpresentationfinalversion 10/29
Subjects
o List of currently enrolled students and their contact
numbers was requested from the OUR
o For the clerks and interns (4th and 5th years,
respectively), their schedule of rotation was
requested from the College Secretary

8/7/2019 3rdPresentationFinalVersion
http://slidepdf.com/reader/full/3rdpresentationfinalversion 11/29
Setting
o For the 1st to 3rd years, the survey was conducted
inside their respective classrooms during their pre-arranged schedules
o For the 4th and 5th years, the questionnaires were
distributed individually or among small groupsdepending on the time and place they wereavailable (respective departments and on-callrooms)

8/7/2019 3rdPresentationFinalVersion
http://slidepdf.com/reader/full/3rdpresentationfinalversion 12/29
Prior to distributing the questionnaires, the administratorsbriefed the respondents by reading out loud the guidelines:
Good morning! We are a group of first-year students conducting
a study on Eating Behavior Patterns among Medical Students. Inthis regard, we would like to ask for your kind cooperation. All of you will be given a two-page questionnaire composed of 51items. The questionnaire is intuitive and easy to understand. Weassure you that the data gathered will be kept in strict
confidentiality. If you have any questions, kindly raise your handto any member of the group so that we may address your concern. The time allotted is 20 minutes. In the event you finishahead of time, you may submit the questionnaire to any member of the group nearest you.

8/7/2019 3rdPresentationFinalVersion
http://slidepdf.com/reader/full/3rdpresentationfinalversion 13/29
Questionnaire administration
o The respondents were given consent forms to
ensure their willingness to participate in the survey
o After the consent form has been duly filled out, the
questionnaires were distributed.
o Upon submission, the administrator checks if the
questionnaire is properly filled out (i.e. all required
fields are answered)

8/7/2019 3rdPresentationFinalVersion
http://slidepdf.com/reader/full/3rdpresentationfinalversion 14/29
For rapid calculations as well as data recording, Microsoft
Office Excel 2007 was utilized.
Control # III-11 Survey Results
Name 3 4 2 5 1 2 8 13 4 18 4
Gender M Number Rating Number Rating Number Rating 4 wala 9 3 14 3 16 22 4 26 5
Age 23 1 2 21 5 41 2 5 3 10 3 21 5 29 31 5 37 4
Year Level 3rd 2 5 22 4 42 1 6 5 11 4 43 1 32 39 2 38 3
3 4 23 2 43 1 7 4 15 3 44 2 33 41 2 49 4
Living Arrangements 4 wala 24 2 44 2 12 3 17 2 45 2 34 47 3
5 3 25 3 45 2 19 3 20 1 46 5 35
Living with parents/guardians 6 5 26 5 46 1 23 2 24 4 48 3
Number of family meals per week: 7 4 27 4 47 3 25 3 28 1 51 4
8 2 28 1 48 3 27 4 42 1
* Living Independently 9 3 29 3 49 4 30 3
Number of years: 11 10 3 30 3 50 4 36 1
11 4 31 5 51 4 40 3
Previously diagnosed with an eating disorder 12 3 32 3 50 4
13 4 33 1
Yes * No 14 3 34 3 Total 42 27 27 20 20
15 3 35 2 Average 3.230769 2.7 3 3.333333 4
Dietary restrictions due to medical condition/s 16 3 36 117 2 37 4
Yes * No 18 4 38 3 Low-fat Eating
19 3 39 2 Emotional Eating
Email Address 20 1 40 3 Haphazard Planning
Notification Cultural/lifestyl Behavior
*Input only on the blanks. Locked lahat ng cells. Snacking on sweets
Yes * No *Input scores sa Survey Results, scoring is automatic. Meal Skipping
*Just put "*" dun sa Living Arrangements and Conditions
3
2.428571429
3.333333333
4
2.7
2
3
3
3
1
3
2
17
2.428571429
3.230769231
Meal SkippingLow-fat Eating Emotional Eating Haphazard Planning Cultural/lifestyle Behavior Snacking on sweetsControl # III-11 Survey Results
Name 3 4 2 5 1 2 8 13 4 18 4
Gender M Number Rating Number Rating Number Rating 4 wala 9 3 14 3 16 22 4 26 5
Age 23 1 2 21 5 41 2 5 3 10 3 21 5 29 31 5 37 4
Year Level 3rd 2 5 22 4 42 1 6 5 11 4 43 1 32 39 2 38 3
3 4 23 2 43 1 7 4 15 3 44 2 33 41 2 49 4
Living Arrangements 4 wala 24 2 44 2 12 3 17 2 45 2 34 47 3
5 3 25 3 45 2 19 3 20 1 46 5 35
Living with parents/guardians 6 5 26 5 46 1 23 2 24 4 48 3
Number of family meals per week: 7 4 27 4 47 3 25 3 28 1 51 4
8 2 28 1 48 3 27 4 42 1
* Living Independently 9 3 29 3 49 4 30 3
Number of years: 11 10 3 30 3 50 4 36 1
11 4 31 5 51 4 40 3
Previously diagnosed with an eating disorder 12 3 32 3 50 4
13 4 33 1
Yes * No 14 3 34 3 Total 42 27 27 20 20
15 3 35 2 Average 3.230769 2.7 3 3.333333 4
Dietary restrictions due to medical condition/s 16 3 36 117 2 37 4
Yes * No 18 4 38 3 Low-fat Eating
19 3 39 2 Emotional Eating
Email Address 20 1 40 3 Haphazard Planning
Notification Cultural/lifestyl Behavior
*Input only on the blanks. Locked lahat ng cells. Snacking on sweets
Yes * No *Input scores sa Survey Results, scoring is automatic. Meal Skipping
*Just put "*" dun sa Living Arrangements and Conditions
3
2.428571429
3.333333333
4
2.7
2
3
3
3
1
3
2
17
2.428571429
3.230769231
Meal SkippingLow-fat Eating Emotional Eating Haphazard Planning Cultural/lifestyle Behavior Snacking on sweets

8/7/2019 3rdPresentationFinalVersion
http://slidepdf.com/reader/full/3rdpresentationfinalversion 15/29
Schulundt, et al.
o Department of Psychology and Diabetes Research and
Training Centero Vanderbilt University School of Medicine
o Assesses both fat and fiber consumption
o Formulation of questionnaire involved three stagedesigns:
� Questionnaire item generation
� Questionnaire refinement
� Questionnaire validation

8/7/2019 3rdPresentationFinalVersion
http://slidepdf.com/reader/full/3rdpresentationfinalversion 16/29
Questionnaire item generation
o 40 African American women were subjected to
focus groups sessions
Questionnaire refinement
o 80 African American women
Questionnaire validation
o 310 African American women of differentsocioeconomic background

8/7/2019 3rdPresentationFinalVersion
http://slidepdf.com/reader/full/3rdpresentationfinalversion 17/29
1
�Initial EBPQ = 113 behavioralquestionnaire items
2
�Initial EBPQ was administered along withMeharry food frequency questionnaire
3�Final EBPQ = 51 items

8/7/2019 3rdPresentationFinalVersion
http://slidepdf.com/reader/full/3rdpresentationfinalversion 18/29
8/7/2019 3rdPresentationFinalVersion
http://slidepdf.com/reader/full/3rdpresentationfinalversion 19/29
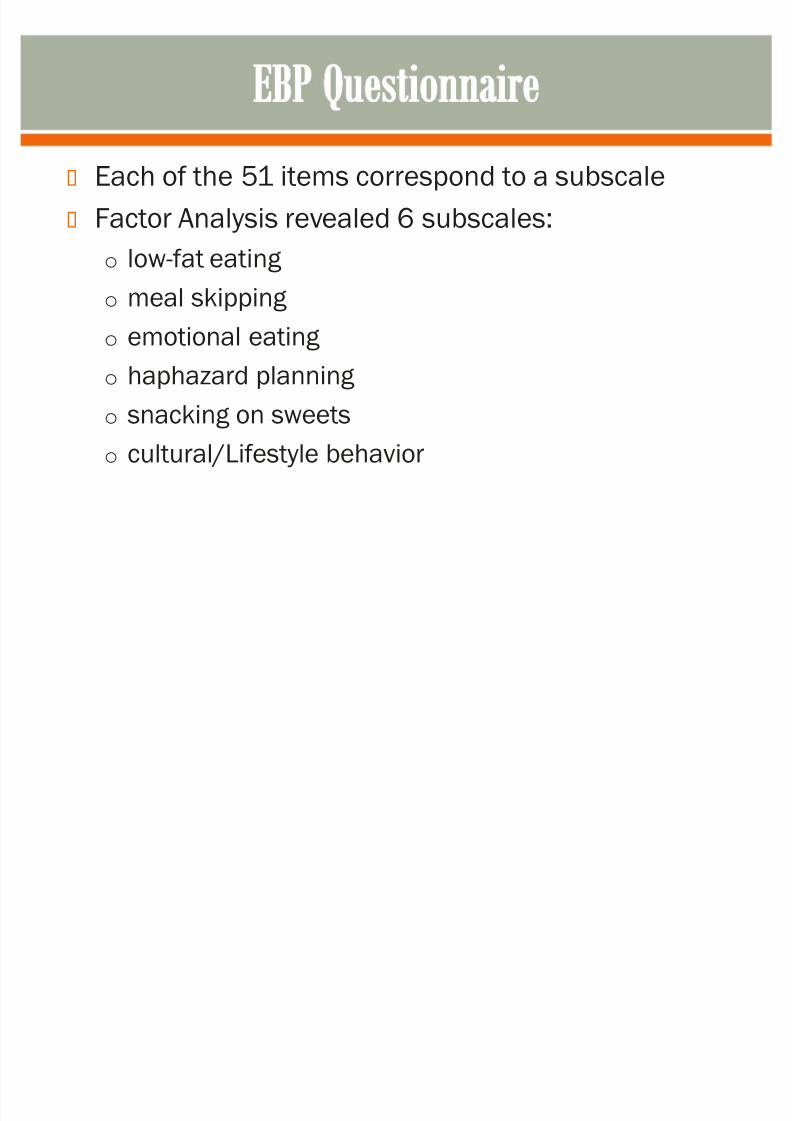
Each of the 51 items correspond to a subscale
Factor Analysis revealed 6 subscales:
o low-fat eating
o meal skipping
o emotional eating
o haphazard planning
o snacking on sweetso cultural/Lifestyle behavior

8/7/2019 3rdPresentationFinalVersion
http://slidepdf.com/reader/full/3rdpresentationfinalversion 20/29
Y EAR LEVEL TOTAL NUMBER OF
SAMPLES
TOTAL NUMBER OF
SAMPLES COVERED
(as of January 25,
2011)
1st Y ear 49 49
2nd Y ear 45 45
3rd Y ear 11 11
Clerks 31 19
Interns 51 39
TOTAL 186 163

8/7/2019 3rdPresentationFinalVersion
http://slidepdf.com/reader/full/3rdpresentationfinalversion 21/29

8/7/2019 3rdPresentationFinalVersion
http://slidepdf.com/reader/full/3rdpresentationfinalversion 22/29
Male Female Total
No. % No. %
1st Y ear 18 56.25 31 42.46 49
2nd Y ear 13 40.63 32 43.84 45
3rd Y ear 1 3.12 10 13.70 11
Total 32 100 73 100 105
Table 1. Baseline characteristics of medical students of SLCM
Exclusions: 16 subjects

8/7/2019 3rdPresentationFinalVersion
http://slidepdf.com/reader/full/3rdpresentationfinalversion 23/29
Y ear Level Excluded % ( n = 105) Included % ( n = 105) Population
1 8 7.62 41 39.05 49
2 6 5.71 39 37.14 45
3 2 1.90 9 8.57 11
Total 16 89 105
Table 2. Percentage of excluded and included subjects among medical students of
SLCM
8/7/2019 3rdPresentationFinalVersion
http://slidepdf.com/reader/full/3rdpresentationfinalversion 24/29
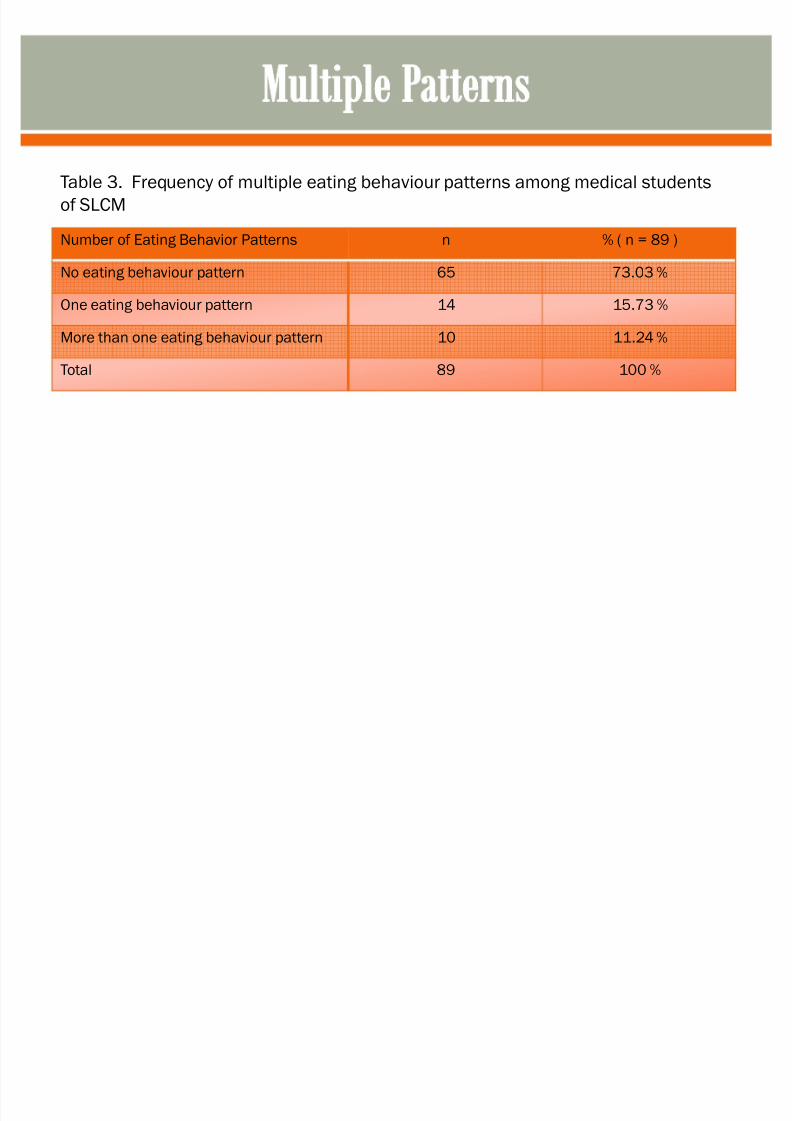
Number of Eating Behavior Patterns n % ( n = 89 )
No eating behaviour pattern 65 73.03 %
One eating behaviour pattern 14 15.73 %
More than one eating behaviour pattern 10 11.24 %
Total 89 100 %
Table 3. Frequency of multiple eating behaviour patterns among medical students
of SLCM

8/7/2019 3rdPresentationFinalVersion
http://slidepdf.com/reader/full/3rdpresentationfinalversion 25/29
Eating Behavior Pattern Number of RespondentsPercentage
(n=89)
Low-Fat Eating 4 4.49 %
Emotional Eating 10 11.24 %
Haphazard Planning 3 3.37 %
Cultural/LifestyleBehavior 0 0 %
Snacking on Sweets 9 10.11 %
Meal Skipping 8 8.99 %
No Eating Behavior Pattern 65 73.03 %
Table 4. Frequency of eating behaviour patterns among medical students of SLCM

8/7/2019 3rdPresentationFinalVersion
http://slidepdf.com/reader/full/3rdpresentationfinalversion 26/29
Majority (73.03%) of the respondents did not
exhibit any eating pattern.
Emotional eating (11.24%) was the most prevalent
eating pattern among the respondents.

8/7/2019 3rdPresentationFinalVersion
http://slidepdf.com/reader/full/3rdpresentationfinalversion 27/29
Eating Behavior
Pattern
Male % ( n = 89 ) Female % ( n = 89 )
Low-Fat Eating 0 0 % 4 4.49 %
Emotional Eating 2 2.25% 8 8.99 %
Haphazard Planning 0 0 % 3 3.37 %
Cultural/Lifestyle
Behavior
0 0 % 0 0 %
Snacking on Sweets 0 0 % 9 10.11 %
Meal Skipping 2 2.25% 6 6.74 %
No Eating Behavior
Pattern
25 28.09% 40 44.94 %
Table 5. Frequency of eating behavior patterns according to gender among medical
students of SLCM

8/7/2019 3rdPresentationFinalVersion
http://slidepdf.com/reader/full/3rdpresentationfinalversion 28/29
Eating Behavior
Pattern
I % ( n = 41) II % ( n = 39 ) III % ( n = 9 )
Low-Fat Eating 3 7.32% 1 2.56% 0 0 %
Emotional Eating 7 17.07% 3 7.69% 0 0 %
Haphazard
Planning
2 4.88% 1 2.56% 0 0 %
Cultural/Lifestyle
Behavior
0 0 % 0 0 % 0 0 %
Snacking on
Sweets
5 12.20% 3 7.69% 1 11.11%
Meal Skipping 3 7.32% 4 10.26% 1 11.11%
No Eating Behavior
Pattern
27 65.85% 31 79.49% 7 77.78%
Table 6. Frequency of eating behaviour patterns according to year level
among medical students of SLCM

8/7/2019 3rdPresentationFinalVersion
http://slidepdf.com/reader/full/3rdpresentationfinalversion 29/29
Eating Behavior
Pattern
Living with
Parents/Guardians
% ( n = 89 ) Living
independently
% ( n = 89 )
Low-Fat Eating 1 1.12% 3 3.37%
Emotional Eating 3 3.37% 7 7.87%
Haphazard Planning 1 1.12% 2 2.25%
Cultural/Lifestyle
Behavior
0 0 % 0 0 %
Snacking on Sweets 1 1.12% 8 8.99%
Meal Skipping 1 1.12% 7 7.87%
No Eating Behavior
Pattern
31 34.83% 34 38.20%
Table 7. Frequency of eating behavior patterns according to living arrangement among
medical students of SLCM