3tatistics 2012 statistics - home - ncbe york 4,011 1,749 44% 11,734 7,931 68% 15,745 9,680 61% a...
TRANSCRIPT

2012 StatiSticSThis section includes data, by jurisdiction, on the following categories for 2012:
• thenumberofpersonstakingandpassingbarexaminations;
• thenumbertakingandpassingbarexaminationscategorizedbysourceoflegaleducation;
• thenumberofandpassageratesforfirst-timeexamtakersandrepeaters,bothoverallandforgraduatesofABA-approvedlawschools;
• thenumberofandpassageratesforgraduatesofnon-ABA-approvedlawschoolsbytypeofschool;
• thenumberofattorneycandidatestakingandpassingspecialAttorneys’Examinations;and
• thenumberofdisbarredor suspendedattorneys takingandpassingexaminationsasaconditionofreinstatement.
Also included are the following:
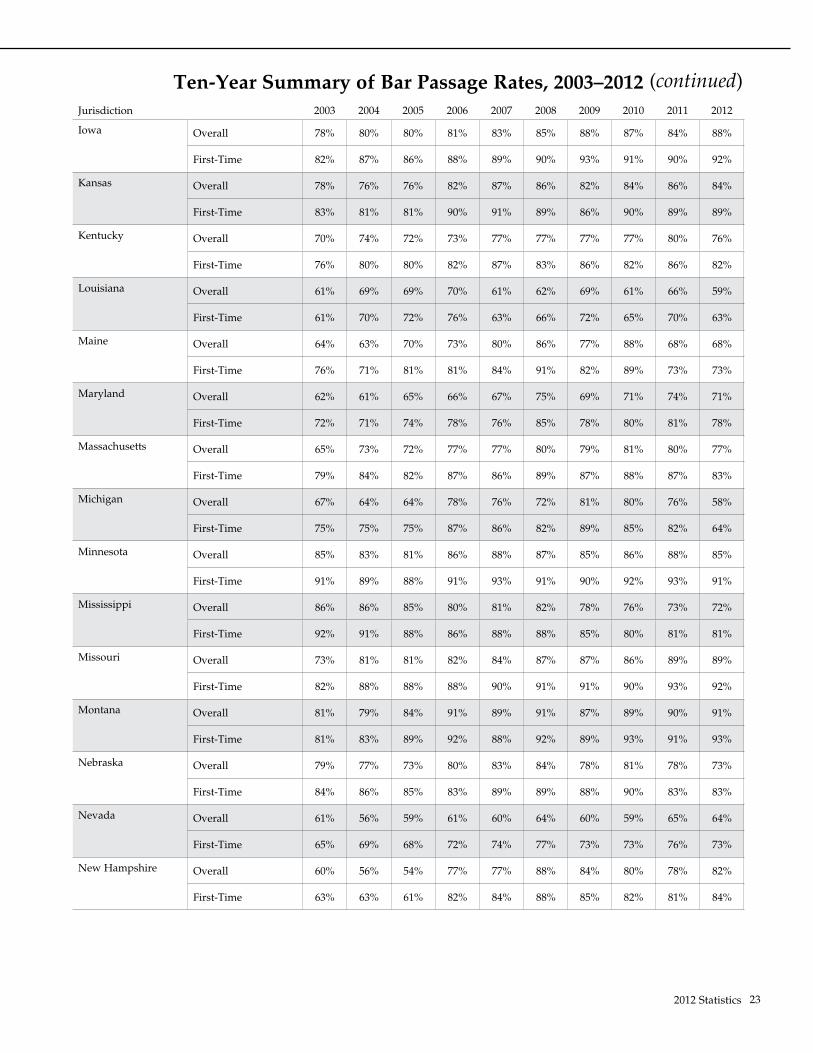
• achartshowingalongitudinalviewofbarpassagerates,bothoverallandforfirst-timetakers,overa10-yearperiod;
• a five-year snapshot, by jurisdiction, of the number of persons admitted to the bar byexamination,onmotion,andbydiplomaprivilege,aswellasthenumberofindividualslicensedasforeignlegalconsultants;and
• achartdisplayingrelativeadmissionstothebarin2012byexamination,onmotion,andbydiplomaprivilege.
Dataforthefirst10chartsweresuppliedbythe jurisdictions.Inreviewingthedata,thereader
shouldkeepinmindthatsomeindividualsseekadmissioninmorethanonejurisdictioninagiven
year.Thechartsrepresentthedataasofthedatetheywerereceivedfromjurisdictionsandmay
not reflect possible subsequent appeals or pending issues that might affect the overall passing
statistics foragiven jurisdiction.Statisticswillbeupdatedtoreflectany laterchangesreceived
fromjurisdictionsandcanbefoundontheNCBEwebsite,www.ncbex.org.
ThefollowingnationaldataareshownfortheadministrationsoftheMultistateBarExamination
(MBE)andtheMultistateProfessionalResponsibilityExamination(MPRE):
• summarystatistics,• scoredistributions,• examineecountsovera10-yearperiod,and• meanscaledscoresovera10-yearperiod.
Theuse,byjurisdiction,isillustratedfortheMBE,theMPRE,theMultistateEssayExamination
(MEE),andtheMultistatePerformanceTest(MPT).
2012Statistics
TheBarExaminer,March20136

2012 StatiSticS contentS
Persons Taking and Passing the 2012 Bar Examination ......................................................................... 8
Persons Taking and Passing the 2012 Bar Examination by Source of Legal Education .................. 10
First-Time Exam Takers and Repeaters in 2012 ..................................................................................... 12
2012 First-Time Exam Takers and Repeaters from ABA-Approved Law Schools ........................... 16
2012 Exam Takers and Passers from Non-ABA-Approved Law Schools by Type of School ......... 20
Attorneys’ Examinations in 2012 .............................................................................................................. 21
Examinations Administered to Disbarred or Suspended Attorneys as a Condition of Reinstatement in 2012 ................................................................................................................................ 21
Ten-Year Summary of Bar Passage Rates, 2003–2012 ........................................................................... 22
Admissions to the Bar by Type, 2008–2012 ............................................................................................ 26
2012 Admissions to the Bar by Examination, on Motion, and by Diploma Privilege ..................... 29
Multistate Bar Examination ..................................................................................................................... 30
Jurisdictions Using the MBE in 2012 .................................................................................................. 31
2012 MBE National Summary Statistics (Based on Scaled Scores) ................................................ 32
2012 MBE National Score Distributions ............................................................................................. 32
MBE National Examinee Counts, 2003–2012 .................................................................................... 33
MBE National Mean Scaled Scores, 2003–2012 ................................................................................. 33
Multistate Professional Responsibility Examination .........................................................................34
Jurisdictions Using the MPRE in 2012 (with Pass/Fail Standards Indicated) ........................... 35
2012 MPRE National Summary Statistics (Based on Scaled Scores) ............................................ 36
2012 MPRE National Score Distributions ........................................................................................ 36
MPRE National Examinee Counts, 2003–2012 ................................................................................ 37
MPRE National Mean Scaled Scores, 2003–2012 ............................................................................ 37
Multistate Essay Examination ................................................................................................................. 38
Jurisdictions Using the MEE in 2012 ................................................................................................ 39
Multistate Performance Test .................................................................................................................... 40
Jurisdictions Using the MPT in 2012 ................................................................................................41
72012 Statistics

2012 Statistics
The Bar Examiner, March 20138
Persons Taking and Passing the 2012 Bar Examination
February July Total
Jurisdiction Taking Passing % Passing Taking Passing % Passing Taking Passing % Passing
Alabama 255 133 52% 510 358 70% 765 491 64%
Alaska 56 36 64% 102 70 69% 158 106 67%
Arizona 287 190 66% 692 543 78% 979 733 75%
Arkansas 111 64 58% 256 185 72% 367 249 68%
California 4,382 1,849 42% 8,737 4,834 55% 13,119 6,683 51%
Colorado 443 309 70% 1,001 799 80% 1,444 1,108 77%
Connecticut 279 185 66% 531 409 77% 810 594 73%
Delaware No February examination 223 140 63% 223 140 63%
District of Columbia 237 116 49% 210 111 53% 447 227 51%
Florida 1,305 799 61% 3,414 2,547 75% 4,719 3,346 71%
Georgia 517 327 63% 1,321 1,053 80% 1,838 1,380 75%
Hawaii 119 80 67% 175 119 68% 294 199 68%
Idaho 78 61 78% 137 110 80% 215 171 80%
Illinois 901 645 72% 2,616 2,220 85% 3,517 2,865 81%
Indiana 294 196 67% 572 427 75% 866 623 72%
Iowa 94 76 81% 308 278 90% 402 354 88%
Kansas 131 105 80% 262 225 86% 393 330 84%
Kentucky 212 146 69% 408 326 80% 620 472 76%
Louisiana 319 171 54% 755 462 61% 1,074 633 59%
Maine 65 38 58% 120 88 73% 185 126 68%
Maryland 562 308 55% 1,615 1,227 76% 2,177 1,535 71%
Massachusetts 644 390 61% 2,356 1,911 81% 3,000 2,301 77%
Michigan 525 311 59% 967 549 57% 1,492 860 58%
Minnesota 198 133 67% 771 695 90% 969 828 85%
Mississippi 105 63 60% 231 178 77% 336 241 72%
Missouri 268 221 82% 793 718 91% 1,061 939 89%
Montana 79 74 94% 140 126 90% 219 200 91%
Nebraska 25 16 64% 86 65 76% 111 81 73%
Nevada 211 117 55% 338 232 69% 549 349 64%
New Hampshire 61 45 74% 144 124 86% 205 169 82%
New Jersey 965 460 48% 3,709 2,862 77% 4,674 3,322 71%
New Mexico 151 126 83% 215 180 84% 366 306 84%
New York 4,011 1,749 44% 11,734 7,931 68% 15,745 9,680 61%
aExaminations in Puerto Rico are administered in March and September.

92012 Statistics
Persons Taking and Passing the 2012 Bar Examination
February July Total
Jurisdiction Taking Passing % Passing Taking Passing % Passing Taking Passing % Passing
North Carolina 469 217 46% 1,197 866 72% 1,666 1,083 65%
North Dakota 39 29 74% 95 75 79% 134 104 78%
Ohio 397 250 63% 1,209 977 81% 1,606 1,227 76%
Oklahoma 142 109 77% 399 323 81% 541 432 80%
Oregon 216 149 69% 451 331 73% 667 480 72%
Pennsylvania 664 396 60% 2,077 1,606 77% 2,741 2,002 73%
Rhode Island 57 39 68% 199 160 80% 256 199 78%
South Carolina 252 154 61% 504 349 69% 756 503 67%
South Dakota 19 13 68% 90 77 86% 109 90 83%
Tennessee 307 173 56% 686 503 73% 993 676 68%
Texas 1,056 694 66% 2,931 2,308 79% 3,987 3,002 75%
Utah 141 102 72% 337 268 80% 478 370 77%
Vermont 50 28 56% 95 66 69% 145 94 65%
Virginia 528 294 56% 1,533 1,136 74% 2,061 1,430 69%
Washington 470 304 65% 878 564 64% 1,348 868 64%
West Virginia 103 66 64% 220 167 76% 323 233 72%
Wisconsin 95 72 76% 188 163 87% 283 235 83%
Wyoming 69 38 55% 82 42 51% 151 80 53%
Guam 12 6 50% 9 6 67% 21 12 57%
N. Mariana Islands 4 4 100% 4 4 100% 8 8 100%
Palau No February examination 10 3 30% 10 3 30%
Puerto Ricoa 510 152 30% 742 300 40% 1,252 452 36%
Virgin Islands 25 17 68% 20 12 60% 45 29 64%
TOTALS 23,515 12,845 55% 59,405 42,408 71% 82,920 55,253 67%aExaminations in Puerto Rico are administered in March and September.
(continued)

2012 Statistics
The Bar Examiner, March 201310
Persons Taking and Passing the 2012 Bar Examination by Source of Legal Education
ABA-Approved Law School
Non-ABA-Approved Law Schoola
Law School Outside the USA Law Office Study
Jurisdiction Taking Passing % Passing Taking Passing % Passing Taking Passing % Passing Taking Passing % Passing
Alabama 478 400 84% 256 78 30% 31 13 42% — — —
Alaska 158 106 67% — — — — — — — — —
Arizona 976 731 75% — — — 3 2 67% — — —
Arkansas 367 249 68% — — — — — — — — —
California 9,178b,c 5,578b,c 61% 2,041b,c 395b,c 19% 812 142 17% 5 1 20%
Colorado 1,439 1,107 77% 2 1 50% 3 0 0% — — —
Connecticut 739 569 77% 68 25 37% 3 0 0% — — —
Delaware 223 140 63% — — — — — — — — —
District of Columbia 287 173 60% 16 3 19% 144 51 35% — — —
Florida 4,713 3,343 71% 6 3 50% — — — — — —
Georgia 1,804 1,378 76% 31 1 3% 3 1 33% — — —
Hawaii 294 199 68% — — — — — — — — —
Idaho 215 171 80% — — — — — — — — —
Illinois 3,484 2,853 82% — — — 33 12 36% — — —
Indiana 866 623 72% — — — — — — — — —
Iowa 401 354 88% — — — 1 0 0% — — —
Kansas 393 330 84% — — — — — — — — —
Kentucky 620 472 76% — — — — — — — — —
Louisiana 1,052 630 60% — — — 22 3 14% — — —
Maine 182 125 69% 2 1 50% 1 0 0% — — —
Maryland 2,157 1,524 71% 6 4 67% 14 7 50% — — —
Massachusetts 2,632 2,133 81% 343 154 45% 25 14 56% — — —
Michigan 1,490 859 58% — — — 2 1 50% — — —
Minnesota 969 828 85% — — — — — — — — —
Mississippi 336 241 72% — — — — — — — — —
Missouri 1,056 938 89% — — — 5 1 20% — — —
aSee page 20 for a breakdown of exam takers and passers from non-ABA-approved law schools by type of school.bCalifornia does not recognize U.S. attorneys taking the general bar examination as being from either ABA-approved or non-ABA-approved law schools. This number of applicants (1,011 taking, 555 passing) is therefore omitted from either category. California’s “U.S. Attorneys Taking the General Bar Exam” category is composed of attorneys admitted in other jurisdictions less than four years who must take, and those admitted four or more years who have elected to take, the general bar examination.cApplicants under California’s four-year qualification rule who did not earn J.D. degrees (72 taking, 12 passing) are not included in either the ABA-approved or non-ABA-approved category. California’s four-year qualification rule allows applicants to take the general bar examination through a combination of four years of law study without graduating from a law school.

112012 Statistics
Persons Taking and Passing the 2012 Bar Examination by Source of Legal Education
ABA-Approved Law School
Non-ABA-Approved Law Schoola
Law School Outside the USA Law Office Study
Jurisdiction Taking Passing % Passing Taking Passing % Passing Taking Passing % Passing Taking Passing % Passing
Montana 219 200 91% — — — — — — — — —
Nebraska 111 81 73% — — — — — — — — —
Nevada 543 348 64% 2 0 0% 4 1 25% — — —
New Hampshire 179 152 85% 24 16 67% 2 1 50% — — —
New Jersey 4,674 3,322 71% — — — — — — — — —
New Mexico 366 306 84% — — — — — — — — —
New York 11,038 8,071 73% 10 1 10% 4,675 1,604 34% 22 4 18%
North Carolina 1,666 1,083 65% — — — — — — — — —
North Dakota 134 104 78% — — — — — — — — —
Ohio 1,599 1,225 77% — — — 7 2 29% — — —
Oklahoma 541 432 80% — — — — — — — — —
Oregon 656 476 73% 1 1 100% 10 3 30% — — —
Pennsylvania 2,737 2,002 73% 2 0 0% 2 0 0% — — —
Rhode Island 253 198 78% 1 0 0% 2 1 50% — — —
South Carolina 756 503 67% — — — — — — — — —
South Dakota 109 90 83% — — — — — — — — —
Tennessee 766 571 75% 211 104 49% 16 1 6% — — —
Texas 3,964 2,987 75% 8 5 63% 15 10 67% — — —
Utah 477 369 77% 1 1 100% — — — — — —
Vermont 126 90 71% — — — 4 2 50% 15 2 13%
Virginia 2,003 1,419 71% — — — 47 9 19% 11 2 18%
Washington 1,305 845 65% 10 5 50% 20 7 35% 13 11 85%
West Virginia 323 233 72% — — — — — — — — —
Wisconsin 268 225 84% 7 6 86% 8 4 50% — — —
Wyoming 151 80 53% — — — — — — — — —
Guam 21 12 57% — — — — — — — — —
N. Mariana Islands 8 8 100% — — — — — — — — —
Palau 3 2 67% 5 0 0% 2 1 50% — — —
Puerto Rico 1,197 442 37% 55 10 18% — — — — — —
Virgin Islands 45 29 64% — — — — — — — — —
TOTALS 72,747 51,959 71% 3,108 814 26% 5,916 1,893 32% 66 20 30%
aSee page 20 for a breakdown of exam takers and passers from non-ABA-approved law schools by type of school.
(continued)

2012 Statistics
The Bar Examiner, March 201312
First-Time Exam Takersa and Repeaters in 2012
First-Timers RepeatersJurisdiction 2012 Administration Taking Passing % Passing Taking Passing % Passing
Alabama February 165 107 65% 90 26 29%
July 429 344 80% 81 14 17%
Total 594 451 76% 171 40 23%
Alaska February 34 27 79% 22 9 41%
July 76 59 78% 26 11 42%
Total 110 86 78% 48 20 42%
Arizona February 182 130 71% 105 60 57%
July 598 495 83% 94 48 51%
Total 780 625 80% 199 108 54%
Arkansas February 71 46 65% 40 18 45%
July 217 174 80% 39 11 28%
Total 288 220 76% 79 29 37%
California February 1,446 764 53% 2,936 1,085 37%
July 6,485 4,427 68% 2,252 407 18%
Total 7,931 5,191 65% 5,188 1,492 29%
Colorado February 305 244 80% 138 65 47%
July 900 764 85% 101 35 35%
Total 1,205 1,008 84% 239 100 42%
Connecticut February 189 154 81% 90 31 34%
July 466 386 83% 65 23 35%
Total 655 540 82% 155 54 35%
Delaware February No February examination
July 180 125 69% 43 15 35%
Total 180 125 69% 43 15 35%
Dist. of Columbia February 150 100 67% 87 16 18%
July 125 88 70% 85 23 27%
Total 275 188 68% 172 39 23%
Florida February 871 664 76% 434 135 31%
July 3,034 2,433 80% 380 114 30%
Total 3,905 3,097 79% 814 249 31%
Georgia February 299 236 79% 218 91 42%
July 1,157 987 85% 164 66 40%
Total 1,456 1,223 84% 382 157 41%
Hawaii February 87 68 78% 32 12 38%
July 146 107 73% 29 12 41%
Total 233 175 75% 61 24 39%
Idaho February 61 54 89% 17 7 41%
July 126 106 84% 11 4 36%
Total 187 160 86% 28 11 39%
Illinois February 625 509 81% 276 136 49%
July 2,423 2,147 89% 193 73 38%
Total 3,048 2,656 87% 469 209 45%
Indiana February 200 151 76% 94 45 48%
July 505 409 81% 67 18 27%
Total 705 560 79% 161 63 39%aFirst-time exam takers are defined as examinees taking the bar examination for the first time in the reporting jurisdiction.

132012 Statistics
First-Time Exam Takersa and Repeaters in 2012
First-Timers RepeatersJurisdiction 2012 Administration Taking Passing % Passing Taking Passing % Passing
Iowa February 66 60 91% 28 16 57%
July 292 271 93% 16 7 44%
Total 358 331 92% 44 23 52%
Kansas February 107 93 87% 24 12 50%
July 243 217 89% 19 8 42%
Total 350 310 89% 43 20 47%
Kentucky February 135 106 79% 77 40 52%
July 355 297 84% 53 29 55%
Total 490 403 82% 130 69 53%
Louisiana February 130 58 45% 189 113 60%
July 643 432 67% 112 30 27%
Total 773 490 63% 301 143 48%
Maine February 41 26 63% 24 12 50%
July 103 79 77% 17 9 53%
Total 144 105 73% 41 21 51%
Maryland February 286 193 67% 276 115 42%
July 1,427 1,149 81% 188 78 41%
Total 1,713 1,342 78% 464 193 42%
Massachusetts February 384 275 72% 260 115 44%
July 2,151 1,834 85% 205 77 38%
Total 2,535 2,109 83% 465 192 41%
Michigan February 374 244 65% 151 67 44%
July 822 525 64% 145 24 17%
Total 1,196 769 64% 296 91 31%
Minnesota February 146 116 79% 52 17 33%
July 721 670 93% 50 25 50%
Total 867 786 91% 102 42 41%
Mississippi February 57 45 79% 48 18 38%
July 209 170 81% 22 8 36%
Total 266 215 81% 70 26 37%
Missouri February 214 191 89% 54 30 56%
July 750 697 93% 43 21 49%
Total 964 888 92% 97 51 53%
Montana February 67 65 97% 12 9 75%
July 138 125 91% 2 1 50%
Total 205 190 93% 14 10 71%
Nebraska February 12 9 75% 13 7 54%
July 77 65 84% 9 0 0%
Total 89 74 83% 22 7 32%
Nevada February 140 94 67% 71 23 32%
July 263 202 77% 75 30 40%
Total 403 296 73% 146 53 36%aFirst-time exam takers are defined as examinees taking the bar examination for the first time in the reporting jurisdiction.
(continued)

2012 Statistics
The Bar Examiner, March 201314
First-Time Exam Takersa and Repeaters in 2012
First-Timers RepeatersJurisdiction 2012 Administration Taking Passing % Passing Taking Passing % Passing
New Hampshire February 45 32 71% 16 13 81%
July 139 122 88% 5 2 40%
Total 184 154 84% 21 15 71%
New Jersey February 476 320 67% 489 140 29%
July 3,497 2,774 79% 212 88 42%
Total 3,973 3,094 78% 701 228 33%
New Mexico February 122 110 90% 29 16 55%
July 192 170 89% 23 10 43%
Total 314 280 89% 52 26 50%
New York February 1,488 883 59% 2,523 866 34%
July 9,801 7,445 76% 1,933 486 25%
Total 11,289 8,328 74% 4,456 1,352 30%
North Carolina February 188 152 81% 281 65 23%
July 1,004 790 79% 193 76 39%
Total 1,192 942 79% 474 141 30%
North Dakota February 30 25 83% 9 4 44%
July 91 73 80% 4 2 50%
Total 121 98 81% 13 6 46%
Ohio February 224 173
July 1,084 920 85% 125 57 46%
Total 1,308 298
Oklahoma February 95 79 83% 47 30 64%
July 375 316 84% 24 7 29%
Total 470 395 84% 71 37 52%
Oregon February 109 83 76% 107 66 62%
July 384 316 82% 67 15 22%
Total 493 399 81% 174 81 47%
Pennsylvania February 349 260 74% 315 136 43%
July 1,872 1,554 83% 205 52 25%
Total 2,221 1,814 82% 520 188 36%
Rhode Island February 32 29 91% 25 10 40%
July 188 153 81% 11 7 64%
Total 220 182 83% 36 17 47%
South Carolina February 155 107 69% 97 47 48%
July 433 321 74% 71 28 39%
Total 588 428 73% 168 75 45%
South Dakota February 15 12 80% 4 1 25%
July 87 76 87% 3 1 33%
Total 102 88 86% 7 2 29%
Tennessee February 185 128 69% 122 45 37%
July 594 439 74% 92 64 70%
Total 779 567 73% 214 109 51%
aFirst-time exam takers are defined as examinees taking the bar examination for the first time in the reporting jurisdiction.
(continued)

152012 Statistics
First-Time Exam Takersa and Repeaters in 2012
First-Timers RepeatersJurisdiction 2012 Administration Taking Passing % Passing Taking Passing % Passing
Texas February 691 521 75% 365 173 47%
July 2,601 2,180 84% 330 128 39%
Total 3,292 2,701 82% 695 301 43%
Utah February 110 90 82% 31 12 39%
July 302 248 82% 35 20 57%
Total 412 338 82% 66 32 48%
Vermont February 36 20 56% 14 8 57%
July 81 61 75% 14 5 36%
Total 117 81 69% 28 13 46%
Virginia February 263 174 66% 265 120 45%
July 1,373 1,084 79% 160 52 33%
Total 1,636 1,258 77% 425 172 40%
Washington February 252 158 63% 218 146 67%
July 727 493 68% 151 71 47%
Total 979 651 66% 369 217 59%
West Virginia February 66 50 76% 37 16 43%
July 189 158 84% 31 9 29%
Total 255 208 82% 68 25 37%
Wisconsin February 79 63 80% 16 9 56%
July 171 151 88% 17 12 71%
Total 250 214 86% 33 21 64%
Wyoming February 34 25 74% 35 13 37%
July 65 34 52% 17 8 47%
Total 99 59 60% 52 21 40%
Guam February 9 4 44% 3 2 67%
July 6 5 83% 3 1 33%
Total 15 9 60% 6 3 50%
N. Mariana Islands
February 3 3 100% 1 1 100%
July 4 4 100% — — —
Total 7 7 100% 1 1 100%
Palau February No February examination
July 8 3 38% 2 — —
Total 8 3 38% 2 — —
Puerto Ricob February 164 59 36% 346 93 27%
July 475 231 49% 267 69 26%
Total 639 290 45% 613 162 26%
Virgin Islands February 20 16 80% 5 1 20%
July 20 12 60% — — —
Total 40 28 70% 5 1 20%
TOTALS February 12,084 70% 11,431
July 50,824 39,917 79% 8,581 2,491 29%
Total 62,908 77% 20,012aFirst-time exam takers are defined as examinees taking the bar examination for the first time in the reporting jurisdiction.bExaminations in Puerto Rico are administered in March and September.
(continued)

2012 Statistics
The Bar Examiner, March 201316
2012 First-Time Exam Takersa and Repeatersfrom ABA-Approved Law Schools
ABA First-Timers ABA Repeaters
Jurisdiction 2012 Administration Taking Passing % Passing Taking Passing % Passing
Alabama February 98 78 80% 20 9 45%
July 344 309 90% 16 4 25%
Total 442 387 88% 36 13 36%
Alaska February 34 27 79% 22 9 41%
July 76 59 78% 26 11 42%
Total 110 86 78% 48 20 42%
Arizona February 180 129 72% 105 60 57%
July 598 495 83% 93 47 51%
Total 778 624 80% 198 107 54%
Arkansas February 71 46 65% 40 18 45%
July 217 174 80% 39 11 28%
Total 288 220 76% 79 29 37%
California February 762 432 57% 1,775 827 47%
July 5,532 4,064 73% 1,109 255 23%
Total 6,294 4,496 71% 2,884 1,082 38%
Colorado February 305 244 80% 137 65 47%
July 896 763 85% 101 35 35%
Total 1,201 1,007 84% 238 100 42%
Connecticut February 169 146 86% 65 23 35%
July 453 380 84% 52 20 38%
Total 622 526 85% 117 43 37%
Delaware February No February examination
July 180 125 69% 43 15 35%
Total 180 125 69% 43 15 35%
Dist. of Columbia February 100 74 74% 48 11 23%
July 100 77 77% 39 11 28%
Total 200 151 76% 87 22 25%
Florida February 869 663 76% 433 135 31%
July 3,033 2,432 80% 378 113 30%
Total 3,902 3,095 79% 811 248 31%
Georgia February 299 236 79% 201 91 45%
July 1,155 985 85% 149 66 44%
Total 1,454 1,221 84% 350 157 45%
Hawaii February 87 68 78% 32 12 38%
July 146 107 73% 29 12 41%
Total 233 175 75% 61 24 39%
Idaho February 61 54 89% 17 7 41%
July 126 106 84% 11 4 36%
Total 187 160 86% 28 11 39%
Illinois February 619 506 82% 267 133 50%
July 2,414 2,143 89% 184 71 39%
Total 3,033 2,649 87% 451 204 45%
Indiana February 200 151 76% 94 45 48%
July 505 409 81% 67 18 27%
Total 705 560 79% 161 63 39%aFirst-time exam takers are defined as examinees taking the bar examination for the first time in the reporting jurisdiction.

172012 Statistics
2012 First-Time Exam Takersa and Repeatersfrom ABA-Approved Law Schools
ABA First-Timers ABA Repeaters
Jurisdiction 2012 Administration Taking Passing % Passing Taking Passing % Passing
Iowa February 66 60 91% 27 16 59%
July 292 271 93% 16 7 44%
Total 358 331 92% 43 23 53%
Kansas February 107 93 87% 24 12 50%
July 243 217 89% 19 8 42%
Total 350 310 89% 43 20 47%
Kentucky February 135 106 79% 77 40 52%
July 355 297 84% 53 29 55%
Total 490 403 82% 130 69 53%
Louisiana February 128 57 45% 180 111 62%
July 641 432 67% 103 30 29%
Total 769 489 64% 283 141 50%
Maine February 39 26 67% 24 12 50%
July 102 78 76% 17 9 53%
Total 141 104 74% 41 21 51%
Maryland February 279 188 67% 276 115 42%
July 1,418 1,144 81% 184 77 42%
Total 1,697 1,332 78% 460 192 42%
Massachusetts February 294 228 78% 188 95 51%
July 2,031 1,753 86% 119 57 48%
Total 2,325 1,981 85% 307 152 50%
Michigan February 374 244 65% 151 67 44%
July 820 524 64% 145 24 17%
Total 1,194 768 64% 296 91 31%
Minnesota February 146 116 79% 52 17 33%
July 721 670 93% 50 25 50%
Total 867 786 91% 102 42 41%
Mississippi February 57 45 79% 48 18 38%
July 209 170 81% 22 8 36%
Total 266 215 81% 70 26 37%
Missouri February 213 190 89% 52 30 58%
July 750 697 93% 41 21 51%
Total 963 887 92% 93 51 55%
Montana February 67 65 97% 12 9 75%
July 138 125 91% 2 1 50%
Total 205 190 93% 14 10 71%
Nebraska February 12 9 75% 13 7 54%
July 77 65 84% 9 0 0%
Total 89 74 83% 22 7 32%
Nevada February 139 94 68% 69 23 33%
July 260 201 77% 75 30 40%
Total 399 295 74% 144 53 37%aFirst-time exam takers are defined as examinees taking the bar examination for the first time in the reporting jurisdiction.
(continued)

2012 Statistics
The Bar Examiner, March 201318
2012 First-Time Exam Takersa and Repeatersfrom ABA-Approved Law Schools
ABA First-Timers ABA Repeaters
Jurisdiction 2012 Administration Taking Passing % Passing Taking Passing % Passing
New Hampshire February 27 22 81% 13 10 77%
July 135 118 87% 4 2 50%
Total 162 140 86% 17 12 71%
New Jersey February 476 320 67% 489 140 29%
July 3,497 2,774 79% 212 88 42%
Total 3,973 3,094 78% 701 228 33%
New Mexico February 122 110 90% 29 16 55%
July 192 170 89% 23 10 43%
Total 314 280 89% 52 26 50%
New York February 1,069 733 69% 1,248 501 40%
July 7,885 6,569 83% 836 268 32%
Total 8,954 7,302 82% 2,084 769 37%
North Carolina February 188 152 81% 281 65 23%
July 1,004 790 79% 193 76 39%
Total 1,192 942 79% 474 141 30%
North Dakota February 30 25 83% 9 4 44%
July 91 73 80% 4 2 50%
Total 121 98 81% 13 6 46%
Ohio February 223 177 79% 172 73 42%
July 1,081 919 85% 123 56 46%
Total 1,304 1,096 84% 295 129 44%
Oklahoma February 95 79 83% 47 30 64%
July 375 316 84% 24 7 29%
Total 470 395 84% 71 37 52%
Oregon February 106 82 77% 104 64 62%
July 381 315 83% 65 15 23%
Total 487 397 82% 169 79 47%
Pennsylvania February 349 260 74% 313 136 43%
July 1,872 1,554 83% 203 52 26%
Total 2,221 1,814 82% 516 188 36%
Rhode Island February 32 29 91% 23 10 43%
July 188 153 81% 10 6 60%
Total 220 182 83% 33 16 48%
South Carolina February 155 107 69% 97 47 48%
July 433 321 74% 71 28 39%
Total 588 428 73% 168 75 45%
South Dakota February 15 12 80% 4 1 25%
July 87 76 87% 3 1 33%
Total 102 88 86% 7 2 29%
Tennessee February 111 87 78% 79 31 39%
July 514 395 77% 62 58 94%
Total 625 482 77% 141 89 63%aFirst-time exam takers are defined as examinees taking the bar examination for the first time in the reporting jurisdiction.
(continued)

192012 Statistics
2012 First-Time Exam Takersa and Repeatersfrom ABA-Approved Law Schools
ABA First-Timers ABA Repeaters
Jurisdiction 2012 Administration Taking Passing % Passing Taking Passing % Passing
Texas February 685 516 75% 360 169 47%
July 2,593 2,174 84% 326 128 39%
Total 3,278 2,690 82% 686 297 43%
Utah February 110 90 82% 31 12 39%
July 301 247 82% 35 20 57%
Total 411 337 82% 66 32 48%
Vermont February 28 20 71% 13 7 54%
July 77 60 78% 8 3 38%
Total 105 80 76% 21 10 48%
Virginia February 255 172 67% 244 117 48%
July 1,359 1,080 79% 145 50 34%
Total 1,614 1,252 78% 389 167 43%
Washington February 315 166 53% 131 122 93%
July 785 495 63% 74 62 84%
Total 1,100 661 60% 205 184 90%
West Virginia February 66 50 76% 37 16 43%
July 189 158 84% 31 9 29%
Total 255 208 82% 68 25 37%
Wisconsin February 74 60 81% 14 8 57%
July 165 146 88% 15 11 73%
Total 239 206 86% 29 19 66%
Wyoming February 34 25 74% 35 13 37%
July 65 34 52% 17 8 47%
Total 99 59 60% 52 21 40%
Guam February 9 4 44% 3 2 67%
July 6 5 83% 3 1 33%
Total 15 9 60% 6 3 50%
N. Mariana Islands
February 3 3 100% 1 1 100%
July 4 4 100% — — —
Total 7 7 100% 1 1 100%
Palau February No February examination
July 3 2 67% — — —
Total 3 2 67% — — —
Puerto Ricob February 158 57 36% 328 90 27%
July 464 227 49% 247 68 28%
Total 622 284 46% 575 158 27%
Virgin Islands February 20 16 80% 5 1 20%
July 20 12 60% — — —
Total 40 28 70% 5 1 20%
TOTALS February 10,665 7,749 73% 8,559 3,703 43%
July 47,598 38,459 81% 5,925 2,048 35%
Total 58,263 46,208 79% 14,484 5,751 40%aFirst-time exam takers are defined as examinees taking the bar examination for the first time in the reporting jurisdiction.bExaminations in Puerto Rico are administered in March and September.
(continued)

2012 Statistics
The Bar Examiner, March 201320
2012 Exam Takers and Passers from Non-ABA-Approved Law Schools by Type of School
Distance Educationb
Conventional Law Schoola Correspondence Law Schoolc Online Law Schoold
Jurisdiction Taking Passing % Passing Taking Passing % Passing Taking Passing % Passing
Alabama 256 78 30% — — — — — —
Californiae 1,396 287 21% 156 38 24% 379 67 18%
Colorado 2 1 50% — — — — — —
Connecticut 68 25 37% — — — — — —
District of Columbia 8 1 13% 2 1 50% 6 1 17%
Florida 6 3 50% — — — — — —
Georgia 31 1 3% — — — — — —
Maine 2 1 50% — — — — — —
Maryland 6 4 67% — — — — — —
Massachusetts 343 154 45% — — — — — —
Nevada 2 0 0% — — — — — —
New Hampshire 24 16 67% — — — — — —
New York 10 1 10% — — — — — —
Oregon 1 1 100% — — — — — —
Pennsylvania 2 0 0% — — — — — —
Rhode Island 1 0 0% — — — — — —
Tennessee 211 104 49% — — — — — —
Texas 8 5 63% — — — — — —
Utah 1 1 100% — — — — — —
Washington 10 5 50% — — — — — —
Wisconsin 2 1 50% — — — 5 5 100%
Palau 5 0 0% — — — — — —
Puerto Rico 55 10 18% — — — — — —
TOTALS 2,450 699 29% 158 39 25% 390 73 19%
aConventional law schools are fixed-facility schools that conduct instruction principally in physical classroom facilities.bDistance education is an educational process characterized by the separation, in time or place, between instructor and student.cCorrespondence law schools are schools that conduct instruction principally by correspondence.dOnline law schools are schools that conduct instruction and provide interactive classes principally by technological transmission, including Internet transmission and electronic conferencing.eCalifornia applicants from non-ABA-approved law schools also include those who attended schools no longer in operation, composed of an unverifiable mixture of conventional and distance-education schools. This number of applicants (110 taking, 3 passing) is therefore omitted from this chart.

212012 Statistics
Attorneys’ Examinationsa in 2012
February July Total
Jurisdiction Taking Passing % Passing Taking Passing % Passing Taking Passing % Passing
California 438 201 46% 435 152 35% 873 353 40%
Georgia 124 108 87% 119 103 87% 243 211 87%
Maine 28 21 75% 25 18 72% 53 39 74%
Maryland 89 74 83% 98 88 90% 187 162 87%
Rhode Island 27 17 63% 20 12 60% 47 29 62%
Tennessee 1 0 0% — — — 1 0 0%
Utah 10 7 70% 8 7 88% 18 14 78%
Washington 111 69 62% — — — 111 69 62%
N. Mariana Islands — — — 3 3 100% 3 3 100%
TOTALS 828 497 60% 708 383 54% 1,536 880 57%
aAttorneys’ Examination refers to a short form or other form of bar examination administered to attorneys admitted in other jurisdictions.
Examinations Administered to Disbarred or Suspended Attorneys as a Condition of Reinstatement in 2012a
Jurisdictionb Taking Passing % Passing
Arizona 3 2 67%
California 50 7 14%
Colorado 3 1 33%
Georgia 1 0 0%
Kentucky 2 1 50%
Mississippi 3 2 67%
Missouri 9 5 56%
South Carolina 5 3 60%
Texas 2 2 100%
Virginia 1 1 100%
Wisconsin 1 0 0%
TOTALS 80 24 30%aThe form of examination administered to disbarred or suspended attorneys varied among jurisdictions as follows: regular bar examination (8 jurisdictions), local essay only (2 jurisdictions), Attorneys’ Examination (1 jurisdiction). bFlorida administers the regular bar examination to disbarred or suspended attorneys but does not report separate statistics for this category.

2012 Statistics
The Bar Examiner, March 201322
Ten-Year Summary of Bar Passage Rates, 2003–2012Jurisdiction 2003 2004 2005 2006 2007 2008 2009 2010 2011 2012
Alabama Overall 58% 63% 64% 65% 64% 67% 65% 67% 65% 64%
First-Time 77% 83% 80% 80% 78% 79% 77% 78% 77% 76%
Alaska Overall 56% 68% 63% 62% 60% 70% 58% 71% 59% 67%
First-Time 73% 81% 75% 75% 82% 80% 72% 81% 71% 78%
Arizona Overall 67% 67% 67% 68% 70% 76% 73% 73% 70% 75%
First-Time 74% 74% 72% 75% 78% 84% 80% 81% 76% 80%
Arkansas Overall 70% 69% 70% 69% 70% 72% 67% 65% 71% 68%
First-Time 80% 78% 78% 80% 80% 83% 74% 72% 84% 76%
California Overall 45% 44% 46% 47% 49% 54% 49% 49% 51% 51%
First-Time 61% 60% 62% 65% 66% 71% 66% 65% 67% 65%
Colorado Overall 70% 65% 68% 68% 69% 73% 74% 74% 79% 77%
First-Time 75% 73% 78% 76% 78% 83% 85% 83% 86% 84%
Connecticut Overall 76% 73% 74% 75% 77% 78% 75% 71% 71% 73%
First-Time 82% 81% 81% 83% 86% 87% 83% 81% 82% 82%
Delaware Overall 64% 61% 57% 59% 62% 73% 63% 66% 67% 63%
First-Time 73% 67% 63% 67% 71% 80% 71% 72% 73% 69%
District of Columbia Overall 51% 51% 51% 51% 54% 56% 49% 41% 48% 51%
First-Time 70% 74% 69% 72% 76% 70% 65% 60% 69% 68%
Florida Overall 67% 64% 60% 64% 66% 71% 68% 69% 72% 71%
First-Time 76% 74% 71% 75% 78% 81% 78% 78% 80% 79%
Georgia Overall 70% 72% 73% 76% 75% 79% 76% 75% 76% 75%
First-Time 84% 85% 84% 86% 85% 89% 86% 84% 85% 84%
Hawaii Overall 79% 66% 71% 71% 70% 76% 76% 68% 75% 68%
First-Time 87% 74% 81% 77% 82% 88% 86% 77% 83% 75%
Idaho Overall 70% 70% 74% 79% 76% 72% 81% 78% 79% 80%
First-Time 78% 78% 80% 85% 81% 80% 86% 83% 85% 86%
Illinois Overall 75% 76% 78% 79% 82% 85% 84% 84% 83% 81%
First-Time 84% 85% 85% 87% 89% 91% 91% 89% 89% 87%
Indiana Overall 70% 73% 75% 76% 76% 78% 75% 75% 74% 72%
First-Time 78% 82% 84% 84% 84% 84% 83% 81% 83% 79%
232012 Statistics
Ten-Year Summary of Bar Passage Rates, 2003–2012Jurisdiction 2003 2004 2005 2006 2007 2008 2009 2010 2011 2012
Iowa Overall 78% 80% 80% 81% 83% 85% 88% 87% 84% 88%
First-Time 82% 87% 86% 88% 89% 90% 93% 91% 90% 92%
Kansas Overall 78% 76% 76% 82% 87% 86% 82% 84% 86% 84%
First-Time 83% 81% 81% 90% 91% 89% 86% 90% 89% 89%
Kentucky Overall 70% 74% 72% 73% 77% 77% 77% 77% 80% 76%
First-Time 76% 80% 80% 82% 87% 83% 86% 82% 86% 82%
Louisiana Overall 61% 69% 69% 70% 61% 62% 69% 61% 66% 59%
First-Time 61% 70% 72% 76% 63% 66% 72% 65% 70% 63%
Maine Overall 64% 63% 70% 73% 80% 86% 77% 88% 68% 68%
First-Time 76% 71% 81% 81% 84% 91% 82% 89% 73% 73%
Maryland Overall 62% 61% 65% 66% 67% 75% 69% 71% 74% 71%
First-Time 72% 71% 74% 78% 76% 85% 78% 80% 81% 78%
Massachusetts Overall 65% 73% 72% 77% 77% 80% 79% 81% 80% 77%
First-Time 79% 84% 82% 87% 86% 89% 87% 88% 87% 83%
Michigan Overall 67% 64% 64% 78% 76% 72% 81% 80% 76% 58%
First-Time 75% 75% 75% 87% 86% 82% 89% 85% 82% 64%
Minnesota Overall 85% 83% 81% 86% 88% 87% 85% 86% 88% 85%
First-Time 91% 89% 88% 91% 93% 91% 90% 92% 93% 91%
Mississippi Overall 86% 86% 85% 80% 81% 82% 78% 76% 73% 72%
First-Time 92% 91% 88% 86% 88% 88% 85% 80% 81% 81%
Missouri Overall 73% 81% 81% 82% 84% 87% 87% 86% 89% 89%
First-Time 82% 88% 88% 88% 90% 91% 91% 90% 93% 92%
Montana Overall 81% 79% 84% 91% 89% 91% 87% 89% 90% 91%
First-Time 81% 83% 89% 92% 88% 92% 89% 93% 91% 93%
Nebraska Overall 79% 77% 73% 80% 83% 84% 78% 81% 78% 73%
First-Time 84% 86% 85% 83% 89% 89% 88% 90% 83% 83%
Nevada Overall 61% 56% 59% 61% 60% 64% 60% 59% 65% 64%
First-Time 65% 69% 68% 72% 74% 77% 73% 73% 76% 73%
New Hampshire Overall 60% 56% 54% 77% 77% 88% 84% 80% 78% 82%
First-Time 63% 63% 61% 82% 84% 88% 85% 82% 81% 84%
(continued)

2012 Statistics
The Bar Examiner, March 201324
Ten-Year Summary of Bar Passage Rates, 2003–2012Jurisdiction 2003 2004 2005 2006 2007 2008 2009 2010 2011 2012
New Jersey Overall 64% 69% 70% 73% 73% 77% 77% 76% 77% 71%
First-Time 73% 78% 77% 81% 82% 85% 84% 82% 84% 78%
New Mexico Overall 81% 79% 81% 86% 78% 85% 84% 81% 82% 84%
First-Time 84% 85% 85% 91% 83% 92% 91% 88% 88% 89%
New York Overall 63% 62% 62% 63% 64% 69% 65% 65% 64% 61%
First-Time 75% 74% 74% 77% 77% 81% 77% 76% 76% 74%
North Carolina Overall 65% 63% 64% 64% 65% 71% 67% 68% 70% 65%
First-Time 75% 75% 71% 75% 76% 83% 77% 78% 80% 79%
North Dakota Overall 75% 75% 83% 72% 69% 77% 80% 78% 83% 78%
First-Time 78% 79% 90% 83% 79% 85% 87% 84% 85% 81%
Ohio Overall 68% 67% 71% 74% 76% 79% 76% 78% 79% 76%
First-Time 78% 80% 80% 83% 86% 88% 86% 86% 86%
Oklahoma Overall 71% 73% 82% 83% 85% 89% 80% 82% 83% 80%
First-Time 80% 83% 89% 91% 91% 93% 87% 89% 88% 84%
Oregon Overall 72% 67% 67% 72% 74% 71% 69% 68% 68% 72%
First-Time 79% 75% 74% 80% 81% 78% 77% 75% 78% 81%
Pennsylvania Overall 67% 68% 70% 71% 72% 77% 76% 74% 77% 73%
First-Time 76% 79% 80% 83% 83% 87% 86% 83% 85% 82%
Rhode Island Overall 62% 70% 65% 71% 75% 75% 74% 74% 69% 78%
First-Time 66% 76% 71% 77% 79% 79% 78% 79% 74% 83%
South Carolina Overall 75% 77% 80% 77% 79% 75% 72% 73% 73% 67%
First-Time 80% 82% 85% 78% 82% 82% 78% 80% 77% 73%
South Dakota Overall 80% 69% 72% 77% 85% 88% 83% 94% 94% 83%
First-Time 81% 71% 83% 85% 89% 95% 90% 99% 94% 86%
Tennessee Overall 75% 77% 74% 75% 71% 76% 68% 70% 69% 68%
First-Time 80% 83% 80% 79% 80% 83% 77% 79% 77% 73%
Texas Overall 72% 68% 71% 74% 76% 78% 78% 76% 80% 75%
First-Time 81% 77% 80% 82% 84% 84% 85% 83% 86% 82%
Utah Overall 87% 87% 86% 83% 81% 83% 83% 82% 84% 77%
First-Time 90% 89% 90% 89% 85% 87% 89% 89% 88% 82%
(continued)

252012 Statistics
Ten-Year Summary of Bar Passage Rates, 2003–2012Jurisdiction 2003 2004 2005 2006 2007 2008 2009 2010 2011 2012
Vermont Overall 75% 75% 73% 68% 66% 65% 61% 76% 68% 65%
First-Time 82% 83% 80% 78% 70% 79% 68% 87% 71% 69%
Virginia Overall 65% 64% 68% 68% 67% 73% 69% 70% 72% 69%
First-Time 73% 72% 76% 74% 76% 82% 76% 77% 79% 77%
Washington Overall 70% 73% 71% 78% 77% 73% 67% 71% 66% 64%
First-Time 71% 79% 77% 80% 78% 74% 69% 70% 67% 66%
West Virginia Overall 62% 69% 64% 60% 63% 67% 73% 65% 74% 72%
First-Time 71% 77% 71% 64% 74% 79% 81% 76% 83% 82%
Wisconsin Overall 74% 79% 77% 78% 89% 89% 89% 90% 84% 83%
First-Time 81% 80% 80% 82% 92% 92% 93% 92% 88% 86%
Wyoming Overall 67% 60% 72% 72% 62% 64% 75% 71% 62% 53%
First-Time 68% 63% 80% 74% 70% 67% 79% 75% 62% 60%
Guam Overall 67% 53% 77% 75% 76% 75% 52% 80% 67% 57%
First-Time 75% 67% 100% 70% 79% 73% 60% 90% 81% 60%
N. Mariana Islands Overall 60% 70% 100% 88% 88% 83% 100% 63% 83% 100%
First-Time 50% 75% 100% 88% 86% 83% 100% 57% 100% 100%
Palau Overall 67% 100% 71% 27% — 67% 17% 57% 25% 30%
First-Time 100% 100% 71% 27% — 50% 17% 67% 0% 38%
Puerto Rico Overall 48% 47% 38% 46% 42% 44% 41% 42% 44% 36%
First-Time 56% 54% 46% 57% 52% 52% 48% 50% 50% 45%
Virgin Islands Overall 58% 55% 69% 73% 56% 76% 65% 71% 49% 64%
First-Time 66% 76% 70% 70% 65% 84% 70% 77% 52% 70%
AVERAGES Overall 64% 64% 64% 67% 67% 71% 68% 68% 69% 67%
First-Time 75% 75% 76% 78% 79% 82% 79% 79% 79% 77%
(continued)

2012 Statistics
The Bar Examiner, March 201326
Admissions to the Bar by Type, 2008–2012Admisson by Examination Admission on Motion
Jurisdiction 2008 2009 2010 2011 2012 2008 2009 2010 2011 2012
Alabama 504 492 492 516 533 21 30 19 32 —
Alaska 67 66 106 70 106 25 27 19 36 44
Arizona 745 418 543 506 629 — — 234 183 145
Arkansas 308 222 236 260 253 56 56 49 47 55
California 7,216 6,766 6,423 6,627 6,846 — — — — —
Colorado 952 928 1,005 1,101 1,080 125 127 130 155 157
Connecticut 841 811 635 531 585 26 30 15 28 83
Delaware 165 154 142 122 147 — — — — —
District of Columbia 299 259 191 194 204 3,434 3,823 2,875 2,970 2,932
Florida 3,047 2,990 3,190 3,646 3,342 — — — — —
Georgia 1,422 980 1,174 1,165 1,144 208 132 90 123 124
Hawaii 200 176 160 208 219 — — — — —
Idaho 145 155 149 137 183 59 94 91 73 92
Illinois 3,208 3,008 2,943 2,793 2,786 87 77 93 135 191
Indiana 572 607 618 578 625 52 59 42 65 52
Iowa 269 292 329 335 364 58 59 73 96 79
Kansas 400 418 370 356 322 50 52 47 39 116
Kentucky 503 477 486 554 476 65 56 62 91 83
Louisiana 1,747 723 671 744 664 — — — — —
Maine 133 153 168 157 145 9 13 4 6 20
Maryland 1,401 1,373 1,365 1,653 1,685 — — — — —
Massachusetts 2,169 2,158 2,216 2,278 2,289 167 170 162 138 174
Michigan 938 1,024 986 979 878 100 75 100 120 138
Minnesota 866 883 824 732 825 226 151 215 191 233
Mississippi 306 268 259 252 172 — 13 29 32 26
Missouri 930 941 861 877 922 98 121 72 88 111
Montana 149 153 150 192 200 — — — — —
Nebraska 117 112 117 104 80 131 — 146 141 198
Nevada 465 392 373 542 550 — — — — —

272012 Statistics
Admissions to the Bar by Type, 2008–2012Admisson by Examination Admission on Motion
Jurisdiction 2008 2009 2010 2011 2012 2008 2009 2010 2011 2012
New Hampshire 160 154 149 159 164 104 132 86 118 91
New Jersey 3,012 2,691 3,133 2,844 3,175 — — — — —
New Mexico 322 278 268 287 298 — — — — —
New York 9,134 9,724 9,649 9,309 9,046 554 470 483 546 613
North Carolina 1,063 1,045 998 1,032 1,094 130 95 107 69 76
North Dakota 57 65 69 67 102 49 50 70 128 185
Ohio 1,260 1,026 1,263 1,234 1,235 116 91 65 90 118
Oklahoma 407 387 380 411 510 62 63 61 54 73
Oregon 602 598 537 616 496 69 84 172 179 138
Pennsylvania 1,853 1,534 2,220 2,099 1,886 457 132 331 305 285
Rhode Island 217 209 202 185 204 — — — — —
South Carolina 557 475 466 508 526 — — — — —
South Dakota 90 91 74 74 87 16 24 18 22 23
Tennessee 746 748 700 681 668 201 155 150 140 124
Texas 2,778 3,032 2,929 3,097 2,988 562 363 328 379 408
Utah 425 409 385 545 390 64 49 67 61 53
Vermont 55 45 67 82 73 36 29 37 27 35
Virginia 1,450 1,370 1,645 1,411 1,577 49 60 60 41 43
Washington 991 870 950 923 935 244 220 231 225 232
West Virginia 203 191 193 224 221 64 63 66 83 73
Wisconsin 248 248 269 256 241 92 135 141 202 174
Wyoming 99 121 103 96 91 22 30 16 16 27
Guam 9 8 11 12 6 — — — — —
N. Mariana Islands 7 3 5 5 8 — — — 11 9
Palau 1 0 4 0 4 — — — — —
Puerto Rico 487 506 465 557 466 — — — — —
Virgin Islands 40 41 37 23 25 — — — 2 —
TOTALS 56,357 53,268 54,353 54,946 54,770 7,888 7,410 7,056 7,487 7,833
(continued)

2012 Statistics
The Bar Examiner, March 201328
Admissions to the Bar by Type, 2008–2012Foreign Legal Consultants
Jurisdiction 2008 2009 2010 2011 2012
Arizona 3 5 1 — 1
California 10 10 5 3 4
Delaware 4 2 — 1 —
District of Columbia 14 13 6 8 11
Florida 31 29 32 47 52
Georgia — — 1 — 1
Illinois 4 2 2 — —
Iowa — — 1 — —
Massachusetts 1 1 — 1 —
Michigan 1 — — — —
Minnesota — — — 1 1
New Jersey — — 1 — —
new Mexico — — — — 1
New York 18 10 13 23 36
Ohio — 1 — — —
Pennsylvania 1 — — 1 —
South Carolina — — — 2 1
Texas 8 11 2 4 6
Utah — 1 — — —
Washington 4 — — — 1
TOTALS 99 85 64 91 115
Admission by Diploma Privilege
Jurisdiction 2008 2009 2010 2011 2012
New Hampshirea 13 14 14 19 20
Wisconsin 455 472 466 462 463
TOTALS 468 486 480 481 483
aThe individuals admitted in New Hampshire by diploma privilege were graduates of its Daniel Webster Scholar Honors Program.
(continued)

292012 Statistics
0 1,000 2,000 3,000 4,000 5,000 6,000 7,000 8,000 9,000 10,000
Alabama
Alaska
Arizona
Arkansas
California
Colorado
Connecticut
Delaware
District of Columbia
Florida
Georgia
Hawaii
Idaho
Illinois
Indiana
Iowa
Kansas
Kentucky
Louisiana
Maine
Maryland
Massachusetts
Michigan
Minnesota
Mississippi
Missouri
Montana
Nebraska
Nevada
New Hampshire
New Jersey
New Mexico
New York
North Carolina
North Dakota
Ohio
Oklahoma
Oregon
Pennsylvania
Rhode Island
South Carolina
South Dakota
Tennessee
Texas
Utah
Vermont
Virginia
Washington
West Virginia
Wisconsin
Wyoming
Guam
N. Mariana Islands
Palau
Puerto Rico
Virgin Islands
By Examination On Motion By Diploma Privilege
2012 Admissions to the Bar by Examination, on Motion, and by Diploma Privilege
(Note: Some jurisdictions have relatively low percentages of on-motion admissions, which may not be easily visible in this chart. Please refer to the accompanying chart on pages 26–28 for precise numbers.)

2012 Statistics
The Bar Examiner, March 201330
The National Conference of Bar Examiners has produced the Multistate Bar Examination (MBE)
since 1972. In 2012, the MBE was part of the bar examination in 53 jurisdictions.
The MBE is a 200-item multiple-choice examination consisting of questions in the following areas:
Constitutional Law, Contracts, Criminal Law and Procedure, Evidence, Real Property, and Torts.
The purpose of the MBE is to assess the extent to which an examinee can apply fundamental legal
principles and legal reasoning to analyze given fact patterns.
Both a raw score and a scaled score are computed for each examinee. A raw score is the number
of questions answered correctly. Raw scores from different administrations of the MBE are not
comparable, primarily due to differences in the difficulty of the questions from one administra-
tion to the next. The statistical process of equating adjusts for variations in the difficulty of the
questions, producing scaled scores that represent the same level of performance across all MBE
administrations. For instance, if the questions appearing on the July MBE were more difficult than
those appearing on the February MBE, then the scaled scores for the July MBE would be adjusted
upward to account for this difference. These adjustments ensure that no examinee is unfairly
penalized or rewarded for taking a more or less difficult exam. Each jurisdiction determines its
own policy with regard to the relative weight given to the MBE and other scores. (Jurisdictions
that administer the Uniform Bar Examination [UBE] weight the MBE component 50%.)

312012 Statistics
Jurisdictions Using the MBE in 2012
Key for Jurisdictions Using the MBE in 2012
Gray shading indicates jurisdictions using the MBE. Jurisdictions not shown on the map that are included in this category: the District of Columbia, Guam, Northern Mariana Islands, Palau, and Virgin Islands.
No shading indicates jurisdictions not using the MBE. Jurisdiction not shown on the map that is included in this category: Puerto Rico.

2012 Statistics
The Bar Examiner, March 201332
2012 MBE National Summary Statistics (Based on Scaled Scores)February July 2012 Total
Number of Examinees 20,695 52,337 73,032
Mean Scaled Score 137.0 143.4 141.6
Standard Deviation 15.7 15.5 15.8
Maximum 184 188 188
Minimum 74 58 58
Median 137 144 142
2012 MBE National Score Distributions
0.0
2.5
5.0
7.5
10.0
12.5
15.0
90 100 110 120 130 140 150 160 170 180 190
MBE Scaled Score
Perc
enta
ge o
f Exa
min
ees
February Exam (Mean = 137.0)
July Exam (Mean = 143.4)
MBE Scaled ScoreaPercentage of Examinees
February (Mean = 137.0) July (Mean = 143.4)
90 0.2 0.195 0.4 0.1100 0.6 0.3105 1.3 0.6110 2.4 1.0115 3.5 1.8120 6.7 3.4125 8.3 5.4130 10.7 6.8135 10.5 10.7140 12.6 11.3145 12.4 10.5150 11.0 13.3155 6.8 12.2160 6.2 8.4165 3.5 7.2170 1.6 3.9175 1.0 1.9180 0.2 0.8185 0.1 0.1190 0.0 0.0
aThese data represent scaled scores in increments of 5. For example, the percentage reported for 135 includes examinees whose MBE scaled scores were between 130.5 and 135.4.

332012 Statistics
Mean Scaled Scores
February JulyYear Total
2003 135.7 141.6 139.8
2004 135.9 141.2 139.6
2005 137.7 141.6 140.4
2006 137.5 143.3 141.5
2007 136.9 143.7 141.6
2008 137.7 145.6 143.3
2009 135.7 144.5 142.1
2010 136.6 143.6 141.7
2011 138.6 143.8 142.3
2012 137.0 143.4 141.6
MBE National Mean Scaled Scores, 2003–2012a
Number of Examinees
February JulyYear Total
2003 20,204 46,486 66,690
2004 20,946 47,433 68,379
2005 21,265 49,998 71,263
2006 22,824 51,176 74,000
2007 22,250 50,181 72,431
2008 20,822 50,011 70,833
2009 18,868 50,385 69,253
2010 19,504 50,114 69,618
2011 20,369 49,933 70,302
2012 20,695 52,337 73,032
MBE National Examinee Counts, 2003–2012a
0
10,000
20,000
30,000
40,000
50,000
60,000
2003 2004 2005 2006 2007 2008 2009 2010 2011 2012Year
MB
E E
xam
inee
Cou
nt
February Exam July Exam
130
135
140
145
150
2003 2004 2005 2006 2007 2008 2009 2010 2011 2012
Year
MB
E M
ean
Scal
ed S
core
February Exam July Exam
aThe values reflect data from scores available electronically; in administrations prior to 2011 an insignificant number of score records were hand scored for various reasons including irregularities.

2012 Statistics
The Bar Examiner, March 201334
The National Conference of Bar Examiners has produced the Multistate Professional Responsibility
Examination (MPRE) since 1980. In 2012, the MPRE was required in 52 jurisdictions.
The MPRE consists of 60 multiple-choice questions whose scope of coverage includes the fol-
lowing: regulation of the legal profession; the client-lawyer relationship; client confidentiality;
conflicts of interest; competence, legal malpractice, and other civil liability; litigation and other
forms of advocacy; transactions and communications with persons other than clients; different
roles of the lawyer; safekeeping funds and other property; communications about legal services;
lawyers’ duties to the public and the legal system; and judicial conduct. The purpose of the MPRE
is to measure the examinee’s knowledge and understanding of established standards related to a
lawyer’s professional conduct.
The MPRE scaled score is a standard score. Standard scaled scores range from 50 (low) to 150
(high). The mean (average) scaled score was established at 100, based upon the performance of
the examinees who took the MPRE in March 1999. The conversion of raw scores to scaled scores
involves a statistical process that adjusts for variations in the difficulty of different forms of the
examination so that any particular scaled score will represent the same level of knowledge from
test to test. For instance, if a test is more difficult than previous tests, then the scaled scores on
that test will be adjusted upward to account for this difference. If a test is easier than previous
tests, then the scaled scores on the test will be adjusted downward to account for this difference.
The purpose of these adjustments is to help ensure that no examinee is unfairly penalized or
rewarded for taking a more or less difficult form of the test. Passing scores are established by each
jurisdiction.

352012 Statistics
Jurisdictions Using the MPRE in 2012 (with Pass/Fail Standards Indicated)
Key for Jurisdictions Using the MPRE in 2012
Gray shading indicates jurisdictions using the MPRE. Jurisdictions not shown on the map that are included in this category: the District of Columbia (75), Guam (80), Northern Mariana Islands (80), Palau (75), and Virgin Islands (75).
No shading indicates jurisdictions not using the MPRE. Jurisdiction not shown on the map that is included in this category: Puerto Rico.

2012 Statistics
The Bar Examiner, March 201336
2012 MPRE National Summary Statisticsa (Based on Scaled Scores)b
March August November 2012 Total
Number of Examinees 24,280 19,028 23,191 66,499
Mean Scaled Score 99.3 95.8 97.2 97.6
Standard Deviation 16.5 16.9 17.4 17.0
Maximum 150 150 150 150
Minimum 50 50 50 50
Median 100 97 98 98
2012 MPRE National Score Distributionsa,b
0.0
2.5
5.0
7.5
10.0
12.5
15.0
17.5
20.0
22.5
25.0
50 60 70 80 90 100 110 120 130 140 150
MPRE Scaled Score
Perc
enta
ge o
f Exa
min
ees
March (Mean = 99.3) August (Mean = 95.8) November (Mean = 97.2)
MPRE Scaled Scorec Percentage of ExamineesMarch (Mean = 99.3) August (Mean = 95.8 ) November (Mean = 97.2)
50 0.8 1.9 1.360 2.7 4.6 5.170 7.5 11.0 11.180 14.7 19.9 13.890 22.2 18.5 23.9100 25.0 23.5 18.1110 14.9 13.0 17.6120 8.8 6.1 6.8130 3.1 1.3 1.9140 0.3 0.3 0.4150 0.0 0.0 0.1
aThe values reflect data from scores available electronically; across administrations an insignificant number of score records were hand scored for vari-ous reasons including irregularities. bThe values for November 2012 include records from 840 examinees who sat for the alternative administration offered in response to test center closures associated with Hurricane Sandy. cThese data represent scaled scores in increments of 10. For example, the percentage reported for 70 includes examinees whose MPRE scaled scores were between 70 and 79.

372012 Statistics
90
95
100
105
110
2003 2004 2005 2006 2007 2008 2009 2010 2011 2012Year
MPR
E M
ean
Scal
ed S
core
March Exam August Exam November Exam
Mean Scaled Scores
Mar. Aug. Nov. Year Total
2003 99.2 96.9 99.8 98.8
2004 100.3 97.5 99.1 99.1
2005 98.3 98.0 99.6 98.7
2006 98.6 96.9 98.1 98.0
2007 98.5 98.0 99.2 98.6
2008 98.9 95.6 97.9 97.6
2009 98.8 95.8 97.3 97.4
2010 97.4 95.7 97.2 96.8
2011 97.1 93.4 96.3 95.7
2012 99.3 95.8 97.2 97.6
MPRE National Examinee Counts, 2003–2012a,b
MPRE National Mean Scaled Scores, 2003–2012a,b
0
5,000
10,000
15,000
20,000
25,000
2003 2004 2005 2006 2007 2008 2009 2010 2011 2012
Year
MPR
E E
xam
inee
Cou
ntMarch ExamAugust ExamNovember Exam
Number of Examinees
Mar. Aug. Nov. Year Total
2003 19,611 15,372 21,870 56,853
2004 18,972 15,082 23,775 57,829
2005 19,869 15,703 21,716 57,288
2006 21,684 15,986 23,308 60,978
2007 21,724 17,107 23,404 62,235
2008 20,288 16,536 23,568 60,392
2009 21,755 18,085 22,483 62,323
2010 22,478 18,641 23,345 64,464
2011 22,136 19,773 24,731 66,6402012 24,280 19,028 23,191 66,499
aThe values reflect data from scores available electronically; across administrations an insignificant number of score records were hand scored for vari-ous reasons including irregularities. bThe values for November 2012 include records from 840 examinees who sat for the alternative administration offered in response to test center closures associated with Hurricane Sandy.

2012 Statistics
The Bar Examiner, March 201338
The National Conference of Bar Examiners has produced the Multistate Essay Examination (MEE)
since 1988. In 2012, the MEE was used in 27 jurisdictions.
NCBE offers nine 30-minute questions per administration. User jurisdictions may elect which of
the nine questions they wish to use. (Jurisdictions that administer the Uniform Bar Examination
[UBE] use a common set of six MEE questions as part of their bar examinations.)
The purpose of the MEE is to test the examinee’s ability to (1) identify legal issues raised by a
hypothetical factual situation; (2) separate material which is relevant from that which is not; (3)
present a reasoned analysis of the relevant issues in a clear, concise, and well-organized composi-
tion; and (4) demonstrate an understanding of the fundamental legal principles relevant to the
probable solution of the issues raised by the factual situation. The primary distinction between the
MEE and the Multistate Bar Examination (MBE) is that the MEE requires the examinee to demon-
strate an ability to communicate effectively in writing.
Areas of law that may be covered on the MEE include the following: Business Associations (Agency
and Partnership; Corporations and Limited Liability Companies), Conflict of Laws, Constitutional
Law, Contracts, Criminal Law and Procedure, Evidence, Family Law, Federal Civil Procedure,
Real Property, Torts, Trusts and Estates (Decedents’ Estates; Trusts and Future Interests), and
Uniform Commercial Code (Negotiable Instruments and Bank Deposits and Collections; Secured
Transactions). Some questions may include issues in more than one area of law. The particular
areas covered vary from exam to exam. Each jurisdiction determines its own policy with regard
to the relative weight given to the MEE and other scores. (Jurisdictions that administer the UBE
weight the MEE component 30%.)

392012 Statistics
Jurisdictions Using the MEE in 2012
Key for Jurisdictions Using the MEE in 2012
Gray shading indicates jurisdictions using the MEE. Jurisdictions not shown on the map that are included in this category: the District of Columbia, Guam, Northern Mariana Islands, and Palau.
No shading indicates jurisdictions not using the MEE. Jurisdictions not shown on the map that are included in this category: Puerto Rico and Virgin Islands.

2012 Statistics
The Bar Examiner, March 201340
The National Conference of Bar Examiners has produced the Multistate Performance Test (MPT)
since 1997. In 2012, the MPT was used in 36 jurisdictions.
NCBE offers two 90-minute MPT items per administration. A jurisdiction may select one or both
items to include as part of its bar examination. (Jurisdictions that administer the Uniform Bar
Examination [UBE] use two MPTs as part of their bar examinations.)
The MPT is designed to test an examinee’s ability to use fundamental lawyering skills in a realis-
tic situation. Each test evaluates an examinee’s ability to complete a task that a beginning lawyer
should be able to accomplish. The MPT requires examinees to (1) sort detailed factual materials
and separate relevant from irrelevant facts; (2) analyze statutory, case, and administrative materi-
als for applicable principles of law; (3) apply the relevant law to the relevant facts in a manner
likely to resolve a client’s problem; (4) identify and resolve ethical dilemmas, when present; (5)
communicate effectively in writing; and (6) complete a lawyering task within time constraints.
Each jurisdiction determines its own policy with regard to the relative weight given to the MPT
and other scores. (Jurisdictions that administer the UBE weight the MPT component 20%.)

412012 Statistics
Jurisdictions Using the MPT in 2012
Key for Jurisdictions Using the MPT in 2012
Gray shading indicates jurisdictions using the MPT. Jurisdictions not shown on the map that are included in this category: the District of Columbia, Guam, and Northern Mariana Islands.
No shading indicates jurisdictions not using the MPT. Jurisdictions not shown on the map that are included in this category: Palau, Puerto Rico, and Virgin Islands.