4. resultsshodhganga.inflibnet.ac.in/bitstream/10603/43243/11/11...activity units (au/ml) log...
TRANSCRIPT

Results
111
4. RESULTS
4.1 SCREENING FOR BACTERIOCIN PRODUCING BACTERIA FROM
MARINE SEDIMENT AND WATER SAMPLES
4.1.1 ISOLATION OF BACTERIA
One hundred and twelve isolates were obtained from the sediment and
water samples collected from different locations. These isolates were screened
first using disc diffusion assay (culture supernatant used) to short list bacteria
capable of inhibiting the growth of test organisms, as this indicated their ability to
produce antagonistic molecules.
4.1.2 PRIMARY SCREENING FOR BACTERIOCIN PRODUCING
BACTERIA
The primary screening helped to segregate seventeen of the hundred and
twelve isolates that produced some antibacterial compounds (Table 4.1). While
sixteen isolates inhibited the growth of Bacillus cereus, representative of Gram
positive test organism, one isolate inhibited the growth of Escherichia coli,
representing Gram negative test organism.
4.1.3 SECONDARY SCREENING FOR BACTERIOCIN PRODUCING
BACTERIA
Secondary screening was performed by testing the antibacterial activity of
the acetone precipitated protein fraction and that of the ammonium sulphate
precipitate. Acetone precipitation of culture supernatant of the seventeen isolates
yielded protein concentrates, whose antibacterial activity was checked by disc
diffusion assay against B. cereus and E. coli. Out of the seventeen isolates
screened, five isolates (viz. BTFK101, BTHT8, BTKM4, BTEK16 and BTSB22)
showed antimicrobial activity against B. cereus. No activity was observed against
the Gram negative test bacteria.

Results
112
Table 4.1 Primary screening by disc diffusion method for bacteriocin
production
Isolate number B. cereus E. coli
BTFK101 + -
BTFK103 + -
BTFK105 + -
BTFK108 + -
BTEK2 + -
BTEK4 + -
BTEK7 + -
BTEK8 + -
BTEK16 + -
BTEK22 + -
BTSB3 - +
BTSB14 + -
BTSB22 + -
BTKM2 + -
BTKM4 + -
BTHT5 + -
BTHT8 + -
+: growth inhibition of the test organism
- : no growth inhibition of the test organism

Results
113
Ammonium sulphate precipitation (0-30%, 30-60% and 60-90%) of the culture
supernatant of the above five isolates was carried out. The protein precipitated in
the 30-60% fraction inhibited the growth of six Gram positive test organisms
namely B. cereus, B. circulans, B. pumilus, B. coagulans, Cl. perfringens and S.
aureus (Table 4.2; Fig. 4.2). However Gram negative organisms were not
inhibited.
Comparing Bacteriocin Producers
Strains
BTFK 101 BTHT 8 BTKM 4 BTEK 16 BTSB 22
Activity U
nits (
AU
/mL
)
0
500
1000
1500
2000
2500
3000
3500
Lo
g s
pe
cific
activity
0
1
2
3
4
5
Activity Units (AU/mL)
Log specific activity (AU/mg)
Fig: 4.1 Critical dilution assay for quantitative estimation of antibacterial
activity of five isolates
The quantitative estimation of antibacterial activity of the five isolates
(ammonium sulphate fraction) was determined by the critical dilution assay (Fig:
4.1). Two isolates BTFK101 and BTHT8 exhibited high activity of 1600AU/mL
and 3200AU/mL respectively. These two isolates were selected for further study.

Results
114
Table 4.2 Secondary screening for bacteriocin production by disc diffusion
method (Antibacterial activity of ammonium sulphate precipitated
protein fraction)
+ : growth inhibited; _ : growth not inhibited
Strains
Test organisms
BTFK101 BTHT8 BTKM4 BTEK16 BTSB22
Pseudomonas aeruginosa _ _ _ _ _
Salmonella Typhimurium _ _ _ _ _
Escherichia coli _ _ _ _ _
Salmonella Abony _ _ _ _ _
Klebsiella pneumoniae _ _ _ _ _
Proteus vulgaris _ _ _ _ _
Clostridium perfringens + + + + +
Staphylococcus aureus + + + + +
B. cereus + + + + +
B. circulans + + + + +
B. coagulans + + + + +
B. macerans _ _ _ _ _
B. pumilus + + + + +
Vibrio cholerae _ _ _ _ _
V. parahaemolyticus _ _ _ _ _
V. alginolyticus _ _ _ _ _
V. vulnificus _ _ _ _ _
V. proteolyticus _ _ _ _ _
V. harveyi _ _ _ _ _
V. furnisii _ _ _ _ _

Results
115
Fig: 4.2 Antimicrobial activity of BTFK101 and BTHT8 (ammonium sulphate
fraction) against six test organisms by disc diffusion assay
4.2 CHARACTERIZATION OF THE BACTERIOCIN PRODUCERS
Characterization of the bacteriocin producing bacteria included molecular
identification using 16S ribotyping, plasmid isolation, antibiotic susceptibility
study, hemolytic activity and growth curve studies of the strains.
4.2.1 IDENTIFICATION OF THE ISOLATES SELECTED AFTER
SECONDARY SCREENING
The five isolates which showed antibacterial activity after acetone
precipitation were identified upto the molecular level by16S ribotyping.
Chromosomal DNA was isolated, purified and quantified. The agarose gel
in which electrophoresis of genomic DNA isolated from the five bacteriocin
producing isolates was performed is represented in fig. 4.3.

Results
116
Fig: 4.3 Agarose gel electrophoresis of genomic DNA isolated from
bacteriocin producing isolates; Lane 2- Lambda DNA / EcoR1/Hind III/ Double
digest, Lane 4- DNA of BTFK101, Lane 5- DNA of BTHT8, Lane 6- DNA of
BTKM4, Lane 7- DNA of BTEK16, Lane 8- DNA of BTSB22
Fig: 4.4 Agarose gel showing amplified 16S rRNA gene from bacteriocin
producing isolates; Lane 1 - 16 S rRNA gene amplicons of BTFK101; Lane 2- 16
S rRNA gene amplicons of BTHT8, Lane 3- 16 S rRNA gene amplicons of
BTKM4, Lane 4- 16 S rRNA gene amplicons of BTEK16, Lane 5- 16 S rRNA
gene amplicons of BTSB22, Lane 6- 1kb ladder.
This was followed by amplification of the 16S rRNA gene (~1.5kbsize) using
PCR. The agarose gel containing amplified 16S rRNA gene of the bacteriocin
producing isolates is represented in fig. 4.4. The amplicons were sequenced and
1 2 3 4 5 6 7 8

Results
117
analysed by BLAST in NCBI database to reveal the identity of the isolates. The
sequence analysis showed that the 16S rRNA gene sequences retrieved from the
five isolates, showed maximum sequence similarity with two species of Bacillus
namely B. subtilis and B. licheniformis after BLAST.
The sequences were submitted to GenBank and accession numbers were
obtained.
1. BTFK101: Bacillus subtilis (Accession no. HM030818)
2. BTHT8 : Bacillus licheniformis (Accession no. HM030819)
3. BTKM4 : Bacillus licheniformis (Accession no. HM030820)
4. BTEK16 : Bacillus licheniformis (Accession no. HM030821)
5. BTSB22 : Bacillus subtilis (Accession no. HM030822)
4.2.2 MULTIPLE SEQUENCE ALIGNMENT AND PHYLOGENETIC
TREE CONSTRUCTION
Based on the 16S rRNA gene sequences, the relatedness of the five
isolates were studied by constructing a phylogenetic tree as depicted in fig. 4.5.
From the phylogenetic tree, it can be observed that the two B. subtilis strains
grouped together and the three B. licheniformis strains also grouped together. All
the five isolates grouped together and form a single clade as they are related.
Fig: 4.5 Phylogenetic relationship of five bacteriocin producers based on 16S
rDNA sequences. The number at the nodes of the phylogenetic tree are
percentages indicating the levels of bootstrap support based on neighbour- joining

Results
118
analysis of 1000 resampled data set. Staphylococcus aureus was used as the
outgroup.
All further studies were conducted on the two selected strains, B. subtilis
strain BTFK101 and B. licheniformis strain BTHT8.
4.2.3 PLASMID DNA ISOLATION
Plasmid DNA was not obtained from both BTFK101 and BTHT8, despite
the use of several protocols. This indicates that the strains do not harbour
plasmids. This confirmed that the bacteriocins produced by these strains are not
encoded by plasmid borne genes. They are encoded by the chromosomal genes.
4.2.4 HEMOLYTIC ACTIVITY
Strains BTHT8 and BTFK101 did not show hemolytic activity on blood
agar plates. This point to their non- pathogenic nature. Most pathogenic strains
possess hemolytic activity.
4.2.5 ANTIBIOTIC SUSCEPTIBILITY TEST
Eleven antibiotics were tested to study the antibiotic susceptibility of the
two selected strains. Of the antibiotics tested (Table 4.3), BTFK101 was resistant
only to cefixime. It was sensitive to all the other ten antibiotics tested viz.
ampicillin, azithromycin, chloramphenicol, cefuroxime, ceftriaxone, ciprofloxacin,
gentamicin, nalidixic acid, tetracycline and trimethoprim. BTHT8 was found
sensitive to ciprofloxacin, gentamicin and trimethoprim; resistant to ampicillin,
azithromycin, cefixime and cefuroxime; intermediate to chloramphenicol,
ceftriaxone, nalidixic acid and tetracycline.

Results
119
Table 4.3 Antibiogram of B. subtilis strain BTFK101and B. licheniformis
strain BTHT8
R-Resistant; I- Intermediate; S- Sensitive
4.2.6 GROWTH CURVE AND BACTERIOCIN PRODUCTION
The growth curve of B. subtilis strain BTFK101 and bacteriocin
production is represented in fig. 4.6. The figure clearly shows that the organism
entered the exponential phase after 1-2 h and reached stationary phase at about 12
h. It is also clear from the figure that bacteriocin production by BTFK101 started
at early exponential phase (after 7 h) and the production peaked as the organism
entered the stationary phase (at about 12 h) showing 1600AU/mL activity.
The growth curve and bacteriocin production of B. licheniformis strain
BTHT8 is represented in fig. 4.7. It was observed that in this case also,
bacteriocin production started at the early exponential phase and the production
reached its peak at the stationary phase (at about 13-14 h), when production in
terms of activity was 6400AU/mL.
Antibiotic Concentration
per disc (µg/disc)
Range R I S
BTFK101 BTHT8
Ampicillin 5 ≤11 12-14 ≥15 S R
Azithromycin 15 ≤13 14-17 ≥18 S R
Chloramphenicol 30 ≤12 13-17 ≥18 S I
Cefixime 5 ≤15 15-17 ≥18 R R
Cefuroxime 30 ≤14 15-17 ≥18 S R
Ceftriaxone 15 ≤13 14-20 ≥21 S I
Ciprofloxacin 5 ≤15 16-20 ≥21 S S
Gentamicin 10 ≤12 13-14 ≥15 S S
Nalidixic acid 30 ≤13 14-18 ≥19 S I
Tetracycline 30 ≤14 15-18 ≥19 S I
Trimethoprim 5 ≤10 11-15 ≥16 S S

Results
120
Fig: 4.6 Growth curve of B. subtilis strain BTFK101 and bacteriocin
production
Fig: 4.7 Growth curve of B. licheniformis strain BTHT8 and bacteriocin
production
Time (h)
0 2 4 6 8 10 12 14 16
OD
at
60
0 n
m
0.0
0.2
0.4
0.6
0.8
1.0
1.2
1.4
1.6
1.8
2.0
Activity
un
it (
AU
/mL
)
0
200
400
600
800
1000
1200
1400
1600
1800
OD at 600 nmActivity unit (AU/mL)
Time(h)
0 2 4 6 8 10 12 14 16
OD
at
60
0n
m
0.0
0.2
0.4
0.6
0.8
1.0
1.2
1.4
1.6
1.8
Activity u
nits (
AU
/mL
)
0
1000
2000
3000
4000
5000
6000
7000
OD at 600nm
Activity units (AU/mL)
Results
121
4.3 BACTERIOCIN PRODUCTION BY BACILLUS LICHENIFORMIS
STRAIN BTHT8 AND BACILLUS SUBTILIS STRAIN BTFK101:
OPTIMIZATION OF BIOPROCESS VARIABLES BY ‘ONE-FACTOR
AT-A-TIME METHOD’
In order to achieve maximum production under laboratory conditions, the
bioprocess variables were optimized. Eleven factors were taken into account viz.
different media, sodium chloride concentration, carbon source, inorganic nitrogen
source, organic nitrogen source, initial pH of the media, inoculum concentration,
incubation temperature, surfactant concentration, incubation period and agitation.
4.3.1 Optimization of different media for bacteriocin production
The effect of eight different media on bacteriocin production by BTFK101
and BTHT8 were studied and the results depicted in fig. 4.8 & 4.9 respectively.
Zobell marine broth was observed to be the best media for bacteriocin production
by both the strains. No bacteriocin production was attained when lactose broth was
used for BTFK101. Lactose broth and Mueller – Hinton broth did not promote
bacteriocin production in the case of BTHT8. The media composition of minimal
media can be altered as it is a defined media and also in both the strains
bacteriocin production was observed when minimal media was used. Hence
minimal medium was used in the study of optimization of bioprocess variables for
bacteriocin production by BTFK101 and BTHT8.

Results
122
BTFK101
Various Media
NB ZB LB SCD BHIMiniM MH LacB
Activity U
nits (
AU
/mL
)
0
200
400
600
800
1000
1200
1400
1600
1800
Lo
g s
pe
cific
activity
0
1
2
3
4
5
Activity Units (AU/mL)
Log specific activity (AU/mg)
Fig: 4.8 Optimization of different media for bacteriocin production by
B. subtilis strain BTFK101; NB- Nutrient broth, ZB- Zobell Marine broth, LB-
Luria Bertani broth, SCD- Soyabean casein digest medium, BH- Brain heart
infusion broth, Mini M- Minimal media, MH- Mueller Hinton broth, LacB-
Lactose broth
BTHT8
Various Media
NB ZB LB SCD BHIMiniM LacB MH
Acitvity U
nits (
AU
/mL)
0
500
1000
1500
2000
2500
3000
3500
Lo
g s
pe
cific
activity
0
1
2
3
4
5
Acitvity Units (AU/mL)
Log specific Activity (AU/mg)
Fig: 4.9 Optimization of different media for bacteriocin production by
B. licheniformis strain BTHT8; NB- Nutrient broth, ZB- Zobell Marine broth, LB-
Luria Bertani broth, SCD- Soyabean casein digest medium, BH- Brain heart
infusion broth, Mini M- Minimal media, MH- Mueller Hinton broth, LacB-
Lactose broth

Results
123
4.3.2 Optimization of sodium chloride concentration (NaCl) for bacteriocin
production In the case of BTFK101 (Fig. 4.10), maximum antibacterial activity
(400AU/mL) was obtained when sodium chloride was supplied at a range of 0.5 -
2%. Specific activity was a little higher (log10 2.87 ± 0.005 AU/mg protein) when
1.5% NaCl was provided. So this concentration of sodium chloride was considered
optimum for bacteriocin production by BTFK101. As the concentration of sodium
chloride increased, the production of bacteriocin decreased.
BTFK101
NaCl concentration (%)
0.5 1.0 1.5 2.0 2.5 3.0 3.5
Activity U
nits (
AU
/mL
)
0
100
200
300
400
500
Lo
g s
pecific
activity
0
1
2
3
4
5
Activity Units (AU/mL)
Log specitic Activity (AU/mg)
Fig: 4.10 Optimization of sodium chloride concentration for bacteriocin
production by B. subtilis strain BTFK101

Results
124
Fig: 4.11 Optimization of sodium chloride concentration for bacteriocin
production by B. licheniformis strain BTHT8
In the case of strain BTHT8 (Fig. 4.11), bacteriocin production reached its
peak (400AU/mL) with 1% NaCl concentration in the medium. Further increase in
NaCl concentration reduced bacteriocin production, which stopped completely
when NaCl was supplied at 2.5% or above.
4.3.3 Optimization of carbon sources for bacteriocin production
The results of optimization of different carbon sources for bacteriocin
production by strains BTFK101 and BTHT8 are depicted in fig. 4.12 and fig. 4.13
respectively. For BTFK101 (Fig. 4.12) maximum bacteriocin production of
800AU/mL was obtained when 1% pectin was supplied as the carbon source.
Glucose, mannitol, sucrose and starch also supported bacteriocin production when
used as sole carbon source but the production was only 400AU/mL. No production
was observed when lactose was used as the sole carbon source.
BTHT8
NaCl Concentration (%)
0.5 1.0 1.5 2.0 2.5 3.0 3.5
Activity U
nits (
AU
/mL)
0
100
200
300
400
500
Log S
pecific
Activity
0.0
0.5
1.0
1.5
2.0
2.5
3.0
3.5
Activity Units (AU/mL)
Log specific activity (AU/mg)

Results
125
BTFK101
Carbon Sources
Glucose Mannitol Sucrose Starch Pectin Lactose
Activity U
nits (
AU
/mL)
0
200
400
600
800
1000
Log s
pecific
activity
0
1
2
3
4
5
Activity Units (AU/mL)
Log specific activity (AU/mg)
Fig: 4.12 Optimization of carbon sources for bacteriocin production by
B. subtilis strain BTFK101
In the case of strain BTHT8 (Fig. 4.13), maximum specific activity (log10
2.94 ± 0.001 AU/mg protein) was obtained with glucose as sole source of carbon
although sucrose, starch and pectin also gave same rate of bacteriocin production
(400AU/mL). Therefore glucose can be considered as the best carbon source.
There was no bacteriocin production when lactose and mannitol were incorporated
as carbon source.

Results
126
BTHT8
Carbon Sources
Glucose Sucrose Starch Pectin Lactose Mannitol
Activity U
nits (
AU
/mL
)
0
100
200
300
400
500
Lo
g s
pe
cific
activity
0
1
2
3
4
5
Activity Units (AU/mL)
Log specific activity (AU/mg)
Fig: 4.13 Optimization of carbon sources for bacteriocin production by
B. licheniformis strain BTHT8
4.3.4 Optimization of inorganic nitrogen sources for bacteriocin production
Five different inorganic nitrogen sources were incorporated in the media,
for optimizing the inorganic nitrogen source for bacteriocin production by the
strains. In the case of BTFK101 (Fig. 4.14), maximum production of 800AU/mL
was obtained when ammonium sulphate was used as inorganic nitrogen source.
When ammonium nitrate, ammonium chloride, ammonium phosphate and urea
were used, bacteriocin production of 400AU/mL was obtained. Specific activity
was highest when ammonium chloride (log10 4.2 ± 0.03 AU/mg protein) was
incorporated. When activity is taken into account, ammonium sulphate is the best
inorganic nitrogen source for bacteriocin production.

Results
127
BTFK101
Inorganic Nitrogen Sources
Amm. Nitrate
Amm. Chloride
Amm. Phosphate
Amm. Sulphate Urea
Activity U
nits (
AU
/mL)
0
200
400
600
800
1000
Log s
pecific
activity
0
1
2
3
4
5
Activity Units (AU/mL)
Log specific activity (AU/mg)
Fig: 4.14 Optimization of inorganic nitrogen sources for bacteriocin
production by B. subtilis strain BTFK101
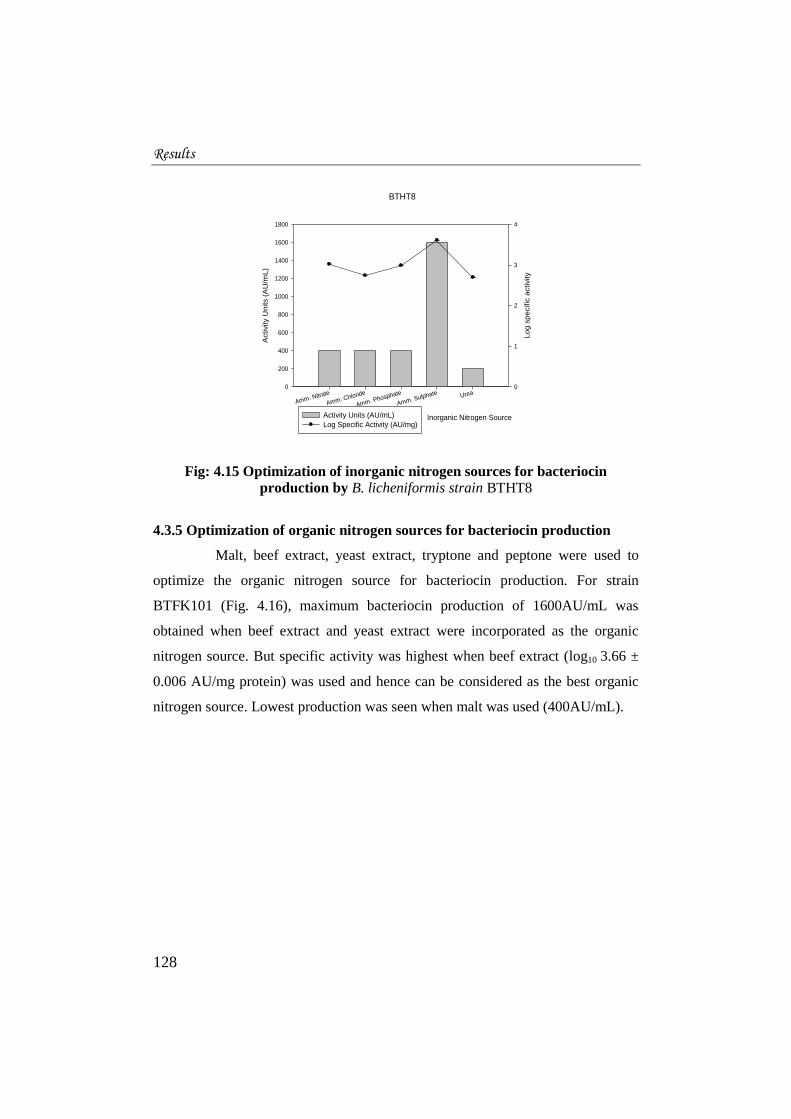
In the case of strain BTHT8 (Fig. 4.15), ammonium sulphate was
observed to be the best inorganic nitrogen source for bacteriocin production as it
helped to obtain highest activity of 1600AU/mL. The specific activity was also
highest for ammonium sulphate with log10 3.61 ± 0.001 AU/mg protein.
Production was lowest when urea was supplied as the nitrogen source.
Results
128
BTHT8
Inorganic Nitrogen Source
Amm. Nitrate
Amm. Chloride
Amm. Phosphate
Amm. Sulphate Urea
Activity U
nits (
AU
/mL)
0
200
400
600
800
1000
1200
1400
1600
1800
Lo
g s
pecific
activity
0
1
2
3
4
Activity Units (AU/mL)
Log Specific Activity (AU/mg)
Fig: 4.15 Optimization of inorganic nitrogen sources for bacteriocin
production by B. licheniformis strain BTHT8
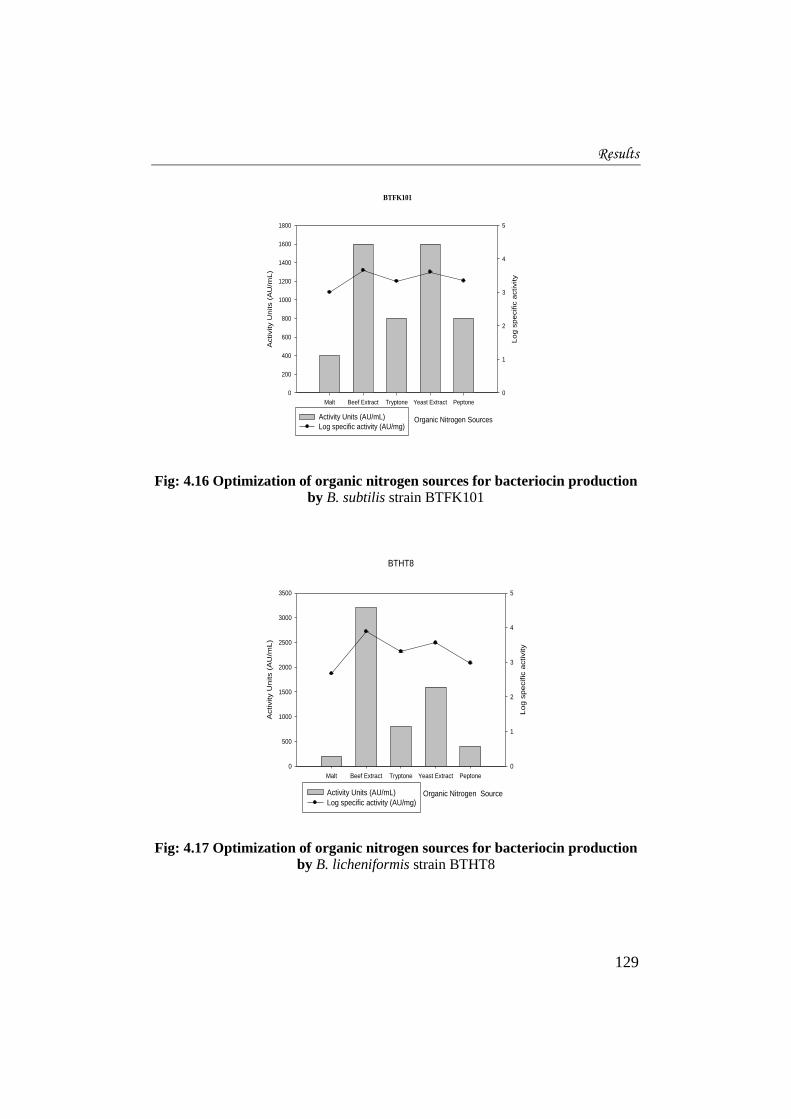
4.3.5 Optimization of organic nitrogen sources for bacteriocin production
Malt, beef extract, yeast extract, tryptone and peptone were used to
optimize the organic nitrogen source for bacteriocin production. For strain
BTFK101 (Fig. 4.16), maximum bacteriocin production of 1600AU/mL was
obtained when beef extract and yeast extract were incorporated as the organic
nitrogen source. But specific activity was highest when beef extract (log10 3.66 ±
0.006 AU/mg protein) was used and hence can be considered as the best organic
nitrogen source. Lowest production was seen when malt was used (400AU/mL).
Results
129
BTFK101
Organic Nitrogen Sources
Malt Beef Extract Tryptone Yeast Extract Peptone
Activity U
nits (
AU
/mL)
0
200
400
600
800
1000
1200
1400
1600
1800
Lo
g s
pe
cific
activity
0
1
2
3
4
5
Activity Units (AU/mL)
Log specific activity (AU/mg)
Fig: 4.16 Optimization of organic nitrogen sources for bacteriocin production
by B. subtilis strain BTFK101
BTHT8
Organic Nitrogen Source
Malt Beef Extract Tryptone Yeast Extract Peptone
Activity U
nits (
AU
/mL)
0
500
1000
1500
2000
2500
3000
3500
Log s
pecific
activity
0
1
2
3
4
5
Activity Units (AU/mL)
Log specific activity (AU/mg)
Fig: 4.17 Optimization of organic nitrogen sources for bacteriocin production
by B. licheniformis strain BTHT8

Results
130
For strain BTHT8 (Fig.4.17), production peaked when beef extract was
used as the organic nitrogen source. Activity was estimated to be 3200AU/mL.
Specific activity was also highest when beef extract was used (log10 3.88 ± 0.003
AU/mg protein). Lowest production was observed with malt (200AU/mL). Thus
beef extract could be the best organic nitrogen source for bacteriocin production
4.3.6 Optimization of inoculum concentration for bacteriocin production
The concentration of inoculum required for maximum bacteriocin
production was studied and the results are depicted in fig. 4.18 & 4.19.
BTFK101
Inoculum Concentration (%)
2 4 6 8 10
Activity U
nits (
AU
/mL
)
0
200
400
600
800
1000
1200
1400
1600
1800
Lo
g s
pe
cific
activity
0
1
2
3
4
5
Activity Units (AU/mL)
Log specific activity (AU/mg)
Fig: 4.18 Optimization of inoculum concentration for bacteriocin production
by B. subtilis strain BTFK101
In the case of BTFK101 (Fig. 4.18), maximum production was obtained
when concentration of inoculum in the range of 6- 10% was used. However,
specific activity was highest (log10 3.66 ± 0.01 AU/mg protein) when the media
was inoculated with 10% inoculum. Therefore for maximum bacteriocin
production by BTFK101, optimum inoculum concentration was determined as
Results
131
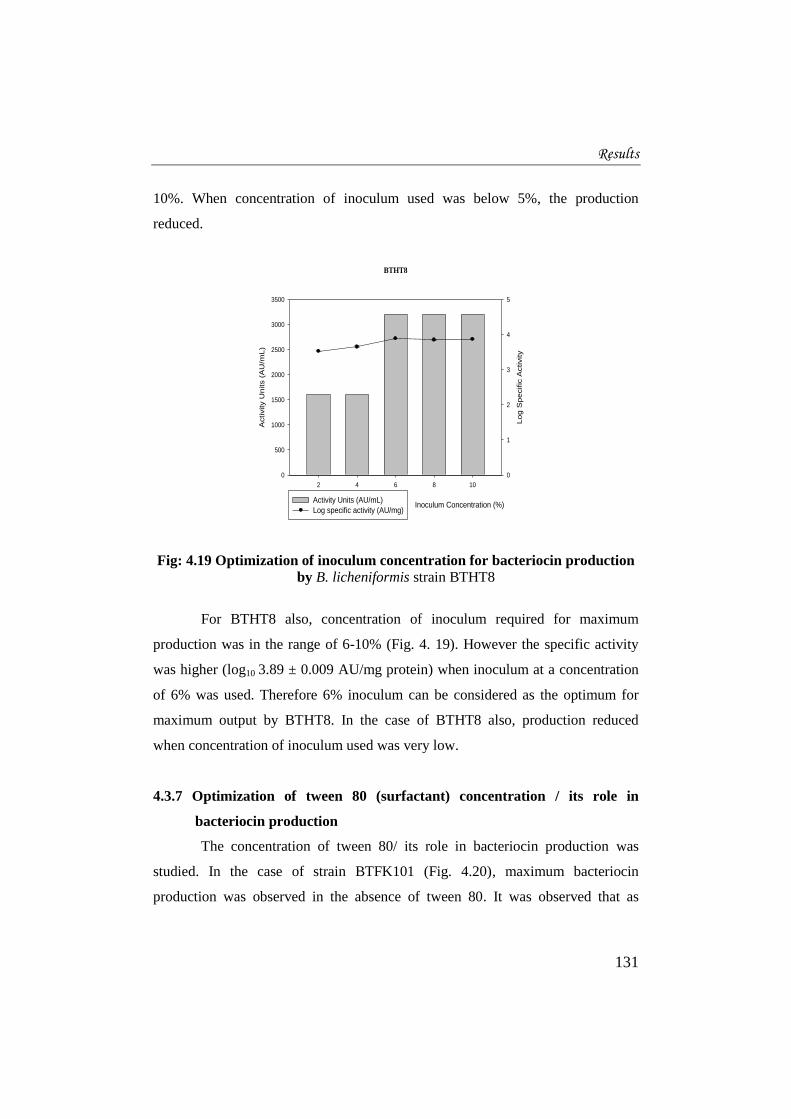
10%. When concentration of inoculum used was below 5%, the production
reduced.
Fig: 4.19 Optimization of inoculum concentration for bacteriocin production
by B. licheniformis strain BTHT8
For BTHT8 also, concentration of inoculum required for maximum
production was in the range of 6-10% (Fig. 4. 19). However the specific activity
was higher (log10 3.89 ± 0.009 AU/mg protein) when inoculum at a concentration
of 6% was used. Therefore 6% inoculum can be considered as the optimum for
maximum output by BTHT8. In the case of BTHT8 also, production reduced
when concentration of inoculum used was very low.
4.3.7 Optimization of tween 80 (surfactant) concentration / its role in
bacteriocin production
The concentration of tween 80/ its role in bacteriocin production was
studied. In the case of strain BTFK101 (Fig. 4.20), maximum bacteriocin
production was observed in the absence of tween 80. It was observed that as
BTHT8
Inoculum Concentration (%)
2 4 6 8 10
Activity U
nits (
AU
/mL
)
0
500
1000
1500
2000
2500
3000
3500
Lo
g S
pe
cific
Activity
0
1
2
3
4
5
Activity Units (AU/mL)
Log specific activity (AU/mg)

Results
132
concentration of tween 80 added in the media increased, production reduced.
Although the production remained at its maximal level at low concentrations of
tween 80, the specific activity was found to be reduced. This indicated that
incorporation of the surfactant had a negative impact on the production.
BTFK101
Tween 80 concentration (%)
0.0 0.1 0.2 0.3 0.4 0.5
Activity U
nits (
AU
/mL
)
0
200
400
600
800
1000
1200
1400
1600
1800
Lo
g s
pe
cific
activity
0
1
2
3
4
5
Activity Units (AU/mL)
Log specific activity (AU/mg)
Fig: 4. 20 Optimization of tween 80 concentation for bacteriocin production
by B. subtilis strain BTFK101
But for BTHT8 (Fig. 4.21), the surfactant had a positive impact on the
bacteriocin production. Addition of 0.1% tween 80 in the media doubled the
production when compared to the one in which no surfactant was added. But when
the surfactant concentration was raised to 0.5%, the production decreased.

Results
133
Fig: 4.21 Optimization of tween 80 concentation for bacteriocin production
by Bacillus licheniformis strain BTHT8
4.3.8 Optimization of initial pH of the media for bacteriocin production
Initial pH of the media had a significant role in bacteriocin production by
both the strains.
BTFK101
pH
4 5 6 7 8 9 10
Activity U
nits (
AU
/mL)
0
200
400
600
800
1000
1200
1400
1600
1800
Log s
pecific
activity
0
1
2
3
4
5
Activity Units (AU/mL)
Log specific activity (AU/mg)
Fig: 4.22 Optimization of initial pH of the media for bacteriocin production
by B. subtilis strain BTFK101
BTHT8
Tween 80 concentration (%)
0.0 0.1 0.2 0.3 0.4 0.5
Activity U
nits (
AU
/mL
)
0
500
1000
1500
2000
2500
3000
3500
Lo
g S
pe
cific
Activity
0
1
2
3
4
5
Activity Units (AU/mL)
Log specific activity (AU/mg)
Results
134
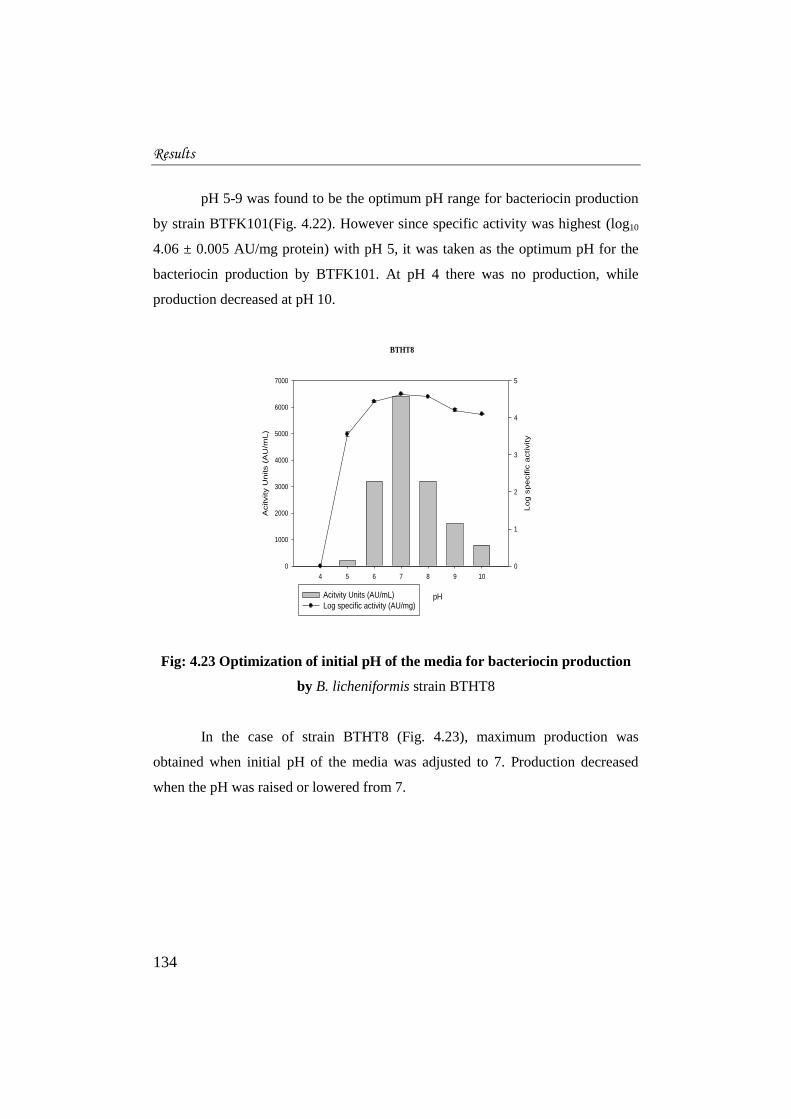
pH 5-9 was found to be the optimum pH range for bacteriocin production
by strain BTFK101(Fig. 4.22). However since specific activity was highest (log10
4.06 ± 0.005 AU/mg protein) with pH 5, it was taken as the optimum pH for the
bacteriocin production by BTFK101. At pH 4 there was no production, while
production decreased at pH 10.
BTHT8
pH
4 5 6 7 8 9 10
Acitvity U
nits (
AU
/mL)
0
1000
2000
3000
4000
5000
6000
7000
Lo
g s
pecific
activity
0
1
2
3
4
5
Acitvity Units (AU/mL)
Log specific activity (AU/mg)
Fig: 4.23 Optimization of initial pH of the media for bacteriocin production
by B. licheniformis strain BTHT8
In the case of strain BTHT8 (Fig. 4.23), maximum production was
obtained when initial pH of the media was adjusted to 7. Production decreased
when the pH was raised or lowered from 7.

Results
135
4.3.9 Optimization of incubation temperature for bacteriocin production
The optimum incubation temperature for bacteriocin production was
studied by taking into account the temperature range 20 - 60oC. The optimum
incubation temperature for bacteriocin production by strain BTFK101 was
determined to be 30oC (Fig. 4.24). Production decreased as incubation temperature
was increased. Specific activity was also highest at 30oC. In the case of BTHT8
also (Fig. 4.25), 30oC was found to be the optimum temperature for maximum
bacteriocin production.
BTFK101
Temperature (oC)
20 30 40 50 60
Activity U
nits (
AU
/mL)
0
200
400
600
800
1000
1200
1400
1600
1800
Log s
pecific
activity
0
1
2
3
4
5
Activity Units (AU/mL)
Log specific activity (AU/mg)
Fig: 4.24 Optimization of incubation temperature for bacteriocin production
by B. subtilis strain BTFK101

Results
136
BTHT8
Temperature (oC)
20 30 40 50 60
Activity U
nits (
AU
/mL)
0
1000
2000
3000
4000
5000
6000
7000
Log s
pecific
activity
0
1
2
3
4
5
6
Activity Units (AU/mL)
Log specific activity (AU/mg)
Fig: 4.25 Optimization of incubation temperature for bacteriocin production
by B. licheniformis strain BTHT8
4.3.10 Optimization of incubation period for bacteriocin production
The incubation period required for maximum bacteriocin production was
studied by incubating the cultures upto 60 h and sampling at 6 h interval. Although
the bacteriocin production by strain BTFK101 started when the culture was
incubated for 6 h (Fig. 4.26), maximum production (3200AU/mL) was observed at
about 12 h. There was no further increase in production when the incubation
period was prolonged. It was noted that the production decreased with increase in
incubation period. No bacteriocin production was noted after 30 h.
In the case of BTHT8 (Fig. 4.27) also, production started at 6 h of
incubation but it took 18 h to reach its maximum. The production decreased and
remained in a stationary mode after 30 h.

Results
137
BTFK101
Inubation Period (h)
0 10 20 30 40 50 60
Activity U
nits (
AU
/mL
)
0
500
1000
1500
2000
2500
3000
3500
Lo
g s
pe
cific
activity
0
1
2
3
4
5
Activity Units (AU/mL)
Log specific activity (Au/mg)
Fig: 4.26 Optimization of incubation period for bacteriocin production by B.
subtilis strain BTFK101
BTHT8
Incubation Period (h)
0 10 20 30 40 50 60
Activity U
nits (
AU
/mL
)
0
1000
2000
3000
4000
5000
6000
7000
Lo
g s
pe
cific
activity
0
1
2
3
4
5
6
Activity Units (AU/mL)
Log specific activity (AU/mg)
Fig: 4.27 Optimization of incubation period for bacteriocin production by
B. licheniformis strain BTHT8

Results
138
4.3.11 Optimization of agitation for bacteriocin production
Agitation plays a major role in bacteriocin production as it allows aeration
during production. In strain BTFK101 (Fig. 4.28), maximum production of
3200AU/mL was obtained when the culture was incubated with an agitation of
125 rpm. The bacteriocin production was very low (400AU/mL) when the culture
was kept stationary.
BTFK101
Agitation (rpm)
0 50 100 150
Activity U
nits (
AU
/mL)
0
500
1000
1500
2000
2500
3000
3500
Log s
pecific
activity
0
1
2
3
4
5
Activity Units (AU/mL)
Log specific activity (AU/mg)
Fig: 4.28 Optimization of agitation speed for bacteriocin production by
B. subtilis strain BTFK101
In the case of strain BTHT8 (Fig. 4.29) maximum bacteriocin production
of 6400AU/mL was attained when the culture was incubated with an agitation of
100 rpm. Production was very low (only 200AU/mL) when the culture was
incubated without shaking.

Results
139
BTHT8
Agitation (rpm)
0 50 100 150
Activity U
nits(A
U/m
L)
0
1000
2000
3000
4000
5000
6000
7000
Log s
pecific
activity
0
1
2
3
4
5
6
Activity Units(AU/mL)
Log specific activity (AU/mg)
Fig: 4.29 Optimization of agitation speed for bacteriocin production by B. licheniformis strain BTHT8
The bioprocess variables for bacteriocin production were optimised by
one factor-at-a-time method. Eleven factors were taken into account. Optimization
of various media revealed Zobell marine broth as the best medium. So this media
was used for production and purification. For optimization of various bioprocess
variables minimal media was used. Production was found to be best when sodium
chloride was supplied at a concentration of 1.5% and 1% in the media for
BTFK101 and BTHT8 respectively. Pectin was the best carbon source for
BTFK101 whereas it was glucose for BTHT8. Ammonium sulphate was the best
inorganic nitrogen source for both the strains whereas beef extract proved to be the
best organic nitrogen source. 10% inoculum (OD600=1) was required for BTFK101
whereas only 6% inoculum was required for BTHT8 respectively to get maximum
production. Tween 80 (surfactant) reduced the bacteriocin production by
BTFK101 whereas addition of 0.1% tween 80 in the media promoted production
of bacteriocin by BTHT8. Studies on initial pH of the media used for production

Results
140
helped to understand that for BTFK101, the initial pH of the media must be 5 and
for BTHT8 it must be 7 in order to get maximum production. Best incubation
temperature was determined as 30oC for both the strains. Production reached its
peak at about 12 h for BTFK101 but it took about 18 h for BTHT8 to get
maximum production. The production was very low when the culture was kept
stationary but when agitation at a speed of 125 rpm and 100 rpm was provided
maximum bacteriocin yield was obtained from BTFK101 and BTHT8
respectively.
4.4 PURIFICATION OF THE BACTERIOCINS
The bacteriocin from B. subtilis strain BTFK101 was designated as BS101
and that from B. licheniformis strain BTHT8 was designated as BL8. The crude
culture supernatant was concentrated and fractionated using ammonium sulphate
precipitation. Only the 30- 60% fraction of ammonium sulphate precipitation
showed antimicrobial activity. Therefore only this fraction was collected further.
There was much increase in activity after this concentration step. This process was
followed by gel filtration chromatography using sephadex G-25 column. The
specific activity increased gradually after each purification process. The details of
purification involved in BS101 and BL8 are depicted in table 4.4 and table 4.5
respectively.
Results
141
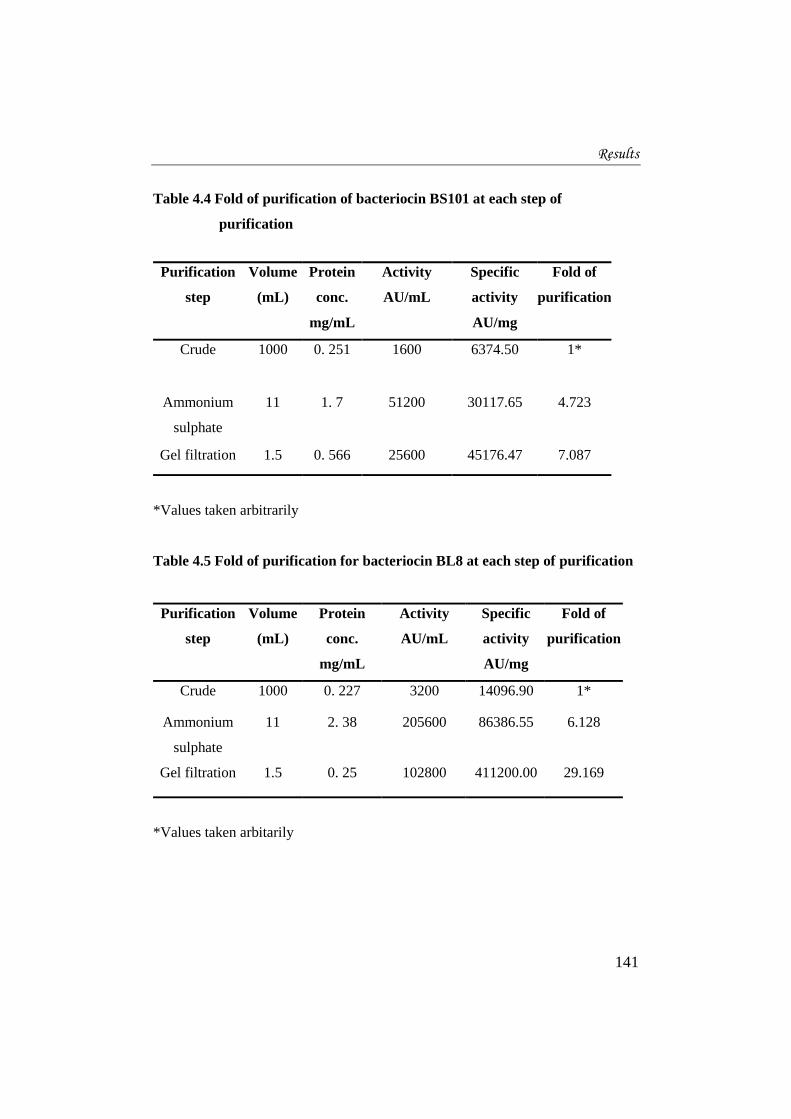
Table 4.4 Fold of purification of bacteriocin BS101 at each step of
purification
*Values taken arbitrarily
Table 4.5 Fold of purification for bacteriocin BL8 at each step of purification
Purification
step
Volume
(mL)
Protein
conc.
mg/mL
Activity
AU/mL
Specific
activity
AU/mg
Fold of
purification
Crude 1000 0. 227 3200 14096.90 1*
Ammonium
sulphate
11 2. 38 205600 86386.55 6.128
Gel filtration 1.5 0. 25 102800 411200.00 29.169
*Values taken arbitarily
Purification
step
Volume
(mL)
Protein
conc.
mg/mL
Activity
AU/mL
Specific
activity
AU/mg
Fold of
purification
Crude 1000 0. 251 1600 6374.50 1*
Ammonium
sulphate
11 1. 7 51200 30117.65 4.723
Gel filtration 1.5 0. 566 25600 45176.47 7.087

Results
142
4.5 CHARACTERIZATION OF THE BACTERIOCINS
4.5.1 SDS- PAGE
Glycine SDS- PAGE and tricine SDS-PAGE were performed to check
purity of the sample after each stage of purification. When ammonium sulphate
fraction (30-60%) of the BS101 and BL8 were loaded onto tricine SDS-PAGE, a
large number of bands were observed (Fig. 4.30). The protein band inhibiting the
growth of test organisms was determined using the method of overlaying the gel
with test organisms (zymogram). This is shown in fig. 4.31. From this, it was
confirmed that the bacteriocins produced by the two strains are low molecular
weight peptides, as they gave clearing zone near the dye front which is formed by
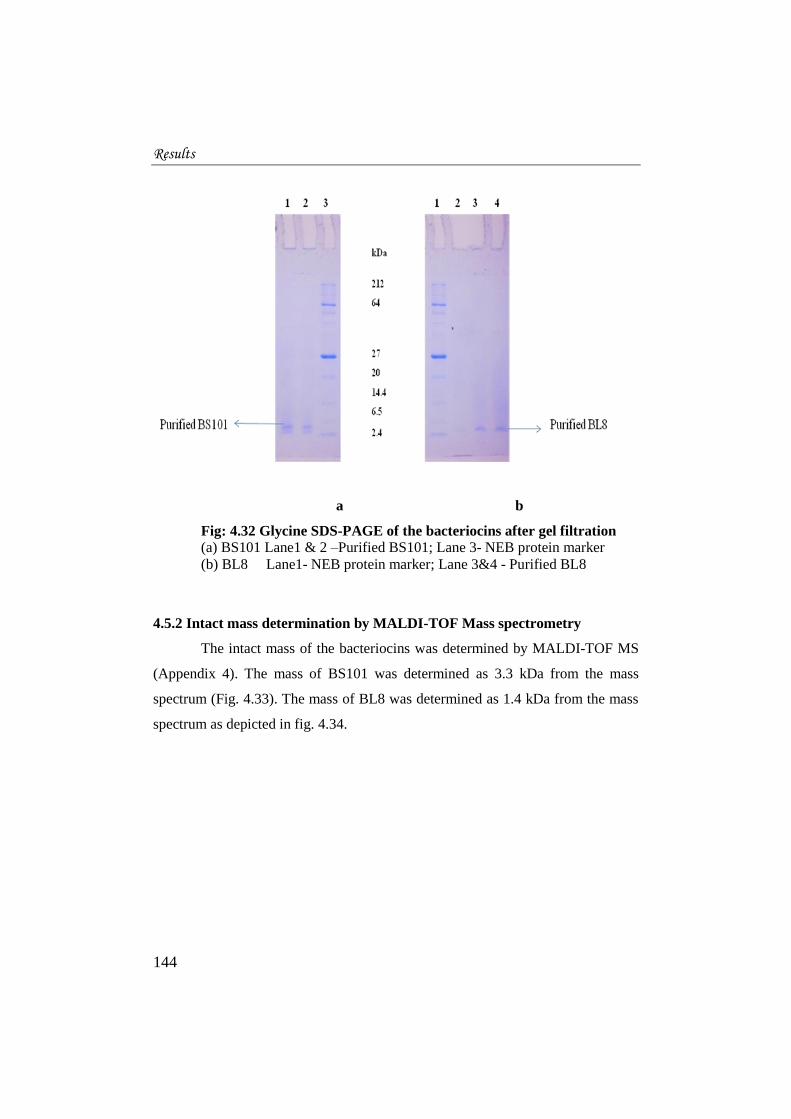
inhibition of test organisms. After purification of the bacteriocins by gel filtration,
single bands were obtained near the dye front which is depicted in the fig. 4.32.
This infers complete purification of the bacteriocins which was in line with 2.4
kDa band (lowermost band) of NEB protein marker.
Fig: 4.30 Tricine SDS-PAGE of bacteriocins BS101 and BL8 partially
purified by ammonium sulphate fractionation; Lane 1- BS101; Lane 2- GeNei
Protein marker (Medium range); Lane 3- BL8

Results
143
A 1 2 3 4 B
(I) (II)
Fig: 4.31 Tricine SDS PAGE of (30-60%) ammonium sulphate fraction of the
bacteriocins BS101 (I) and BL8 (II) and the overlay assay on gel to determine
the protein band with antibacterial activity. Lane-1 BS101; lane-2 &3 GeNei
protein marker; lane-4 BL8; lane A (BS101) & lane B (BL8) indicating clearing
zone formed by growth inhibition of test organism (S. aureus) due to the
corresponding bacteriocin bands
Results
144
a b
Fig: 4.32 Glycine SDS-PAGE of the bacteriocins after gel filtration
(a) BS101 Lane1 & 2 –Purified BS101; Lane 3- NEB protein marker
(b) BL8 Lane1- NEB protein marker; Lane 3&4 - Purified BL8
4.5.2 Intact mass determination by MALDI-TOF Mass spectrometry
The intact mass of the bacteriocins was determined by MALDI-TOF MS
(Appendix 4). The mass of BS101 was determined as 3.3 kDa from the mass
spectrum (Fig. 4.33). The mass of BL8 was determined as 1.4 kDa from the mass
spectrum as depicted in fig. 4.34.

Results
145
Fig: 4.33 Mass spectrum of bacteriocin BS101 obtained by MALDI-TOF MS
Fig: 4.34 Mass spectrum of bacteriocin BL8 obtained by MALDI-TOF MS
(Smitha & Sarita, 2013)
4.5.3 Isoelectric Focusing (IEF)
Isoelectric focusing was carried out in pre-casted IPG strips. After IEF,
the strips were Coomassie stained. The bacteriocins were visualized as blue
coloured bands on the strip. The 7cm IPG strip was equally divided into seven

Results
146
points of pH. From the position of the bands, the isoelectric point (pI) was
calculated. The pI of BS101was determined as 6.3 and that of BL8 was 5.7 (Fig.
4.35).
(a)
(b)
Fig: 4.35 IPG strips Coomassie stained after IEF; (a) IPG strip loaded with
BS101 (b) IPG strip loaded with BL8
4.5.4 N-terminal aminoacid sequence analysis
The N-terminal amino acid sequence was determined by automated
Edman degradation. N- terminal amino acid analysis of BL8 revealed a 13 amino
acid sequence stretch (Appendix 4). In amino acid position 4, 5 and 8 Edman
degradation gave blank signals which are observed when amino acid cysteine is
present. So these three positions are assumed to contain cysteine and the sequence
is as follows: NH2-Ser-Trp-Ser-Cys-Cys-Gly-Asn-Cys-Ser-Ile-Ser-Gly-Ser-
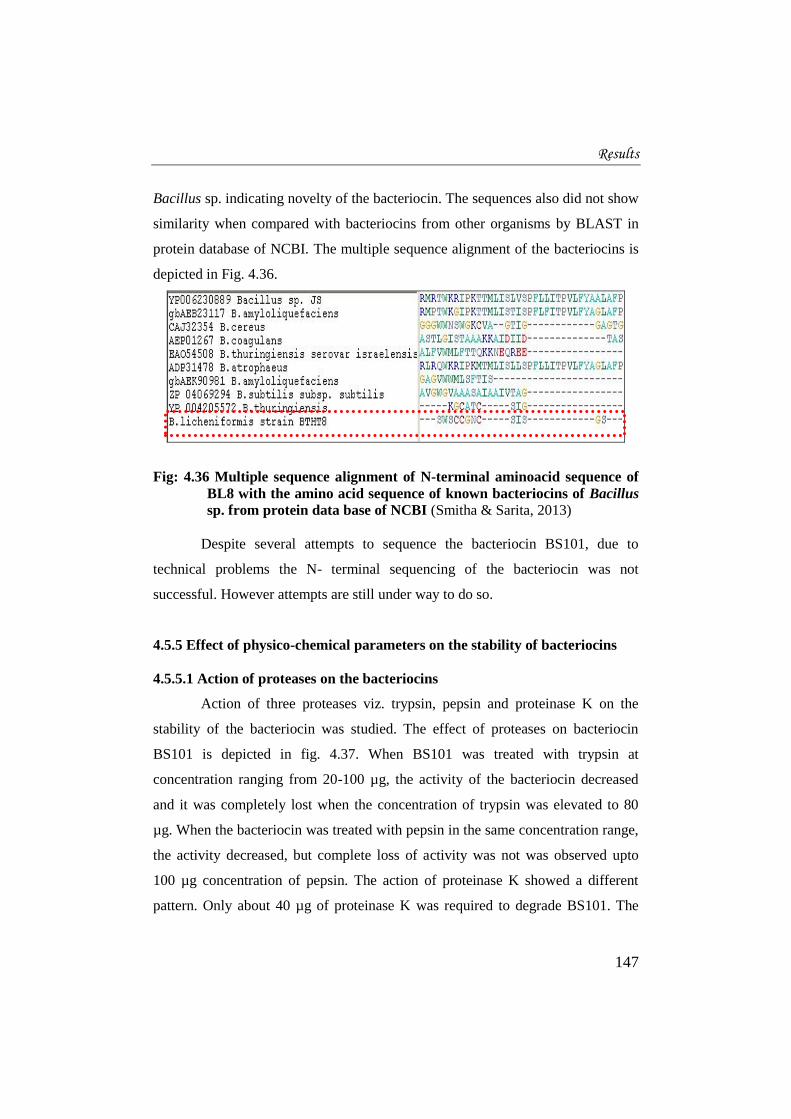
COOH. The sequence obtained was compared to the sequences of bacteriocins
from Bacillus sp. retrieved from the protein database of NCBI by multiple
sequence alignment using ClustalW. N- terminal amino acid sequences of BL8
showed no significant similarity with the sequences of bacteriocins of other
Band of BL8 resolved at pI- 5.7
Band of BS101 resolved at pI- 6.3
Results
147
Bacillus sp. indicating novelty of the bacteriocin. The sequences also did not show
similarity when compared with bacteriocins from other organisms by BLAST in
protein database of NCBI. The multiple sequence alignment of the bacteriocins is
depicted in Fig. 4.36.
Fig: 4.36 Multiple sequence alignment of N-terminal aminoacid sequence of
BL8 with the amino acid sequence of known bacteriocins of Bacillus
sp. from protein data base of NCBI (Smitha & Sarita, 2013)
Despite several attempts to sequence the bacteriocin BS101, due to
technical problems the N- terminal sequencing of the bacteriocin was not
successful. However attempts are still under way to do so.
4.5.5 Effect of physico-chemical parameters on the stability of bacteriocins
4.5.5.1 Action of proteases on the bacteriocins
Action of three proteases viz. trypsin, pepsin and proteinase K on the
stability of the bacteriocin was studied. The effect of proteases on bacteriocin
BS101 is depicted in fig. 4.37. When BS101 was treated with trypsin at
concentration ranging from 20-100 µg, the activity of the bacteriocin decreased
and it was completely lost when the concentration of trypsin was elevated to 80
µg. When the bacteriocin was treated with pepsin in the same concentration range,
the activity decreased, but complete loss of activity was not was observed upto
100 µg concentration of pepsin. The action of proteinase K showed a different
pattern. Only about 40 µg of proteinase K was required to degrade BS101. The

Results
148
activity was completely lost when the bacteriocin was treated with 40 µg
proteinase K.
BS101
Protease Conc (in microgram)
Control 20 40 60 80 100
Activity u
nits(A
U/m
L)
0
200
400
600
800
1000
1200
1400
1600
1800
Trypsin
Pepsin
ProteinaseK
Fig: 4.37 Action of proteases like trypsin, pepsin and proteinase K on BS101
Fig: 4.38 Action of proteases like trypsin, pepsin and proteinase K on BL8
BL8
Protease conc (in microgram)
Control 20 40 60 80 100
Activity u
nits (
AU
/mL)
0
500
1000
1500
2000
2500
3000
3500
Trypsin
Pepsin
ProteinaseK

Results
149
The effect of the proteases on BL8 is represented in fig. 4.38. Even very
small concentrations of pepsin and proteinase K degraded BL8. The action of BL8
was completely lost when it was treated with proteinase K at concentration of 20
µg. Only 40 µg of pepsin was required to degrade BL8. The action of trypsin on
BL8 was very different when compared to that of BS101. Trypsin did not
completely inhibit the action of BL8 even at a concentration of 100 µg.
4.5.5.2 Effect of temperature on the stability of bacteriocins
The effect of temperature ranging from 20-100oC on bacteriocin stability
was studied. Fig. 4.39 depicts the effect of temperature on the stability of BS101.
It was noticed that the bacteriocin started degrading and the activity reduced when
BS101 was kept at 40oC for 1 h. The antibacterial activity was completely lost
when BS101 was incubated at a temperature of 50oC and above for 1 h.
Fig: 4.39 Effect of temperature on the stability of BS101
BS101
Temperature (oC)
0 20 40 60 80 100 120
Activity U
nits (
AU
/mL
)
0
200
400
600
800
1000
1200
1400
1600
1800
Activity Units (AU/mL)

Results
150
The effect of temperature on the stability of BL8 is depicted in fig. 4.40.
When compared to BS101, it was noticed that BL8 is more thermostable. The
activity of BL8 was reduced only when it was incubated at 50oC for one hour. It
was stable at 40oC. The activity was completely lost at 60
oC and above.
BL8
Temperature (oC)
0 20 40 60 80 100 120
Activity U
nits (
AU
/mL)
0
500
1000
1500
2000
2500
3000
3500
Activity Units (AU/mL)
Fig: 4.40 Effect of temperature on the stability of BL8
4.5.5.3 Effect of pH on the stability of bacteriocins
In order to study the effect of pH on BS101 and BL8, the bacteriocins
were treated with buffers having different pH in the range of 2-13. The effect of
pH on the stability of bacteriocins is depicted in fig. 4.41 and 4.42. The
bacteriocins were found to be very stable even at very low pH. But they were very
unstable in alkaline pH range. For both BS101 and BL8, pH above 8 inhibited the
antimicrobial action of the bacteriocins.

Results
151
Fig: 4.41 Effect of pH on the stability of BS101
BL8
pH
Control 2 3 4 5 6 7 8 9 10 11 12 13
Activity U
ntis (
AU
/mL)
0
500
1000
1500
2000
2500
3000
3500
Activity Untis (AU/mL)
Fig: 4.42 Effect of pH on the stability of BL8
BS101
pH
Control 2 3 4 5 6 7 8 9 10 11 12 13
Activity U
ntis (
AU
/mL
)
0
200
400
600
800
1000
1200
1400
1600
1800
Activity Untis (AU/mL)

Results
152
In the case of BS101, there was complete loss of activity when the
bacteriocin was treated with buffers having pH 9 and above. For BL8, complete
loss of activity occured only at pH 12. But we can see drastic reduction in activity
from pH 9 onwards. The activity of both the bacteriocins was not affected in the
pH range of 2-8.
4.5.5.4 Effect of detergents on the stability of bacteriocins
Stability of the two bacteriocins when treated with non-ionic detergents
like tween 20, tween 80 and triton X 100 was tested and it was found that the
bacteriocins were stable when exposed to these detergents or they did not reduce
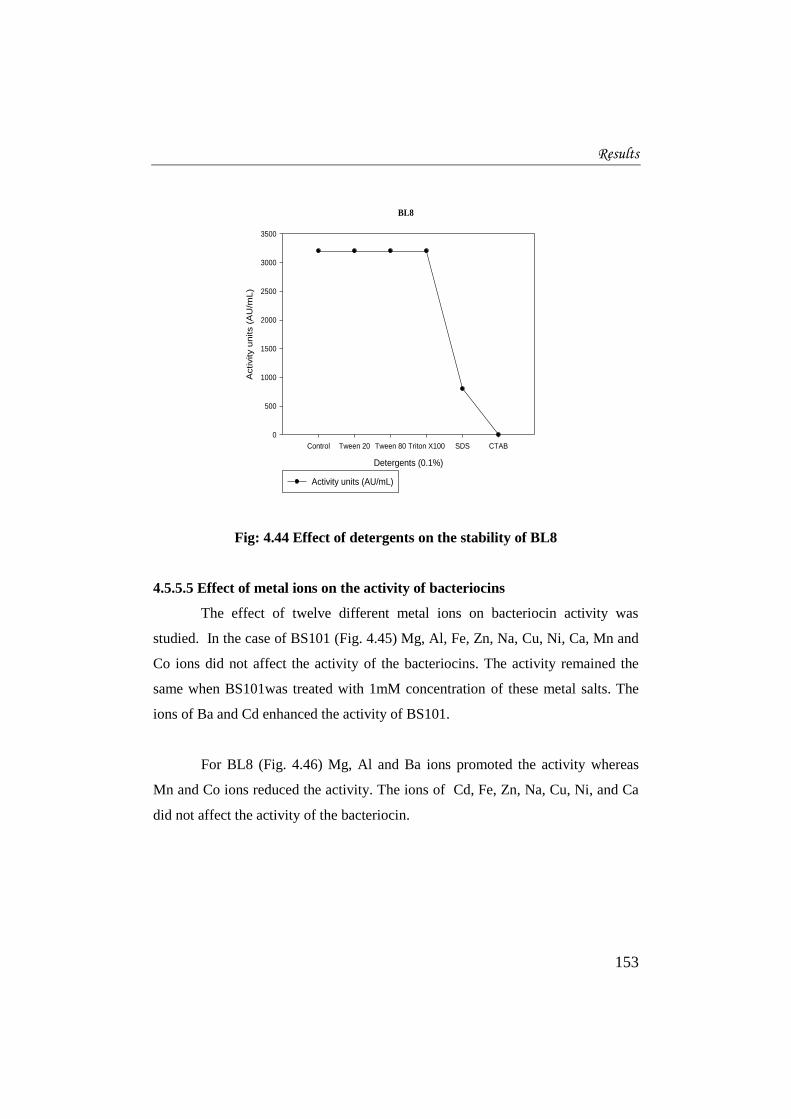
the activity of the bacteriocins (Fig. 4.43 and 4.44 respectively). But the ionic
detergent SDS reduced the activity of both BS101 and BL8. CTAB had very
prominent effect. It completely inactivated the two bacteriocins.
Fig: 4.43 Effect of detergents on the stability of BS101
BS101
Detergents (0.1%)
Control Tween 20 Tween 80 Triton X100 SDS CTAB
Activity U
nits (
AU
/mL)
0
200
400
600
800
1000
1200
1400
1600
1800
Activity Units (AU/ mL)
Results
153
BL8
Detergents (0.1%)
Control Tween 20 Tween 80 Triton X100 SDS CTAB
Activity u
nits (
AU
/mL
)
0
500
1000
1500
2000
2500
3000
3500
Activity units (AU/mL)
Fig: 4.44 Effect of detergents on the stability of BL8
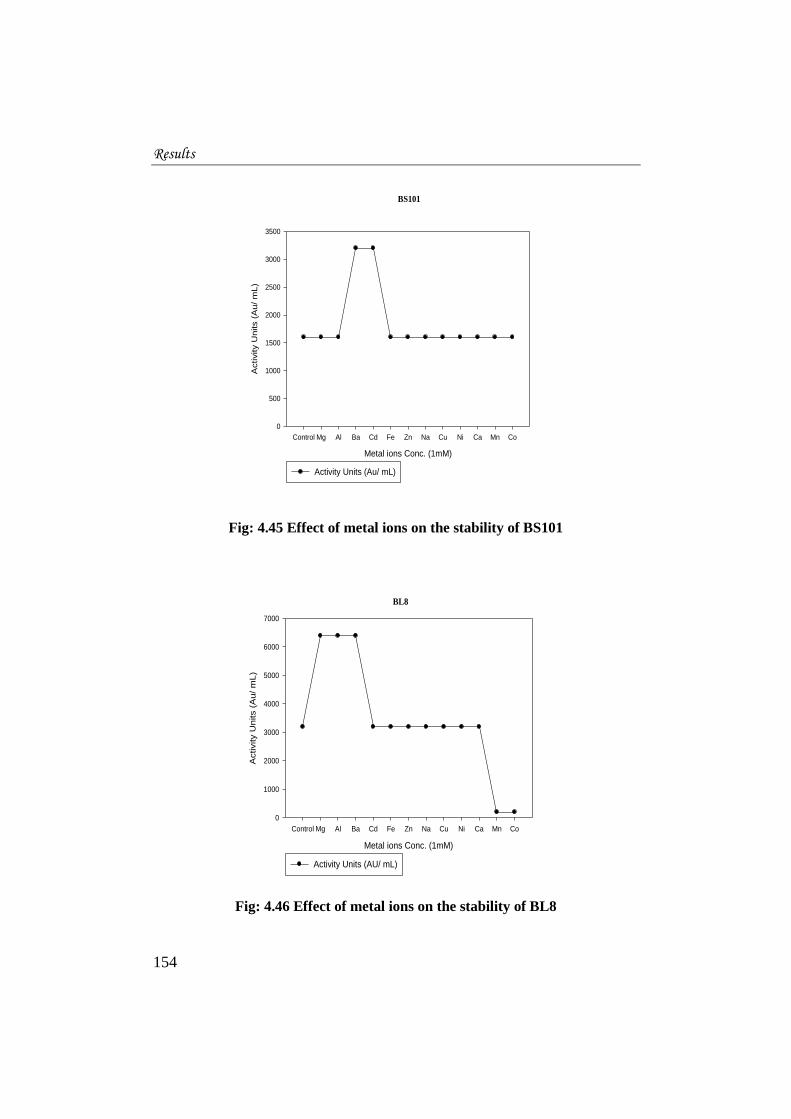
4.5.5.5 Effect of metal ions on the activity of bacteriocins
The effect of twelve different metal ions on bacteriocin activity was
studied. In the case of BS101 (Fig. 4.45) Mg, Al, Fe, Zn, Na, Cu, Ni, Ca, Mn and
Co ions did not affect the activity of the bacteriocins. The activity remained the
same when BS101was treated with 1mM concentration of these metal salts. The
ions of Ba and Cd enhanced the activity of BS101.
For BL8 (Fig. 4.46) Mg, Al and Ba ions promoted the activity whereas
Mn and Co ions reduced the activity. The ions of Cd, Fe, Zn, Na, Cu, Ni, and Ca
did not affect the activity of the bacteriocin.
Results
154
BS101
Metal ions Conc. (1mM)
Control Mg Al Ba Cd Fe Zn Na Cu Ni Ca Mn Co
Activity U
nits (
Au/
mL)
0
500
1000
1500
2000
2500
3000
3500
Activity Units (Au/ mL)
Fig: 4.45 Effect of metal ions on the stability of BS101
Fig: 4.46 Effect of metal ions on the stability of BL8
BL8
Metal ions Conc. (1mM)
Control Mg Al Ba Cd Fe Zn Na Cu Ni Ca Mn Co
Activity U
nits (
Au
/ m
L)
0
1000
2000
3000
4000
5000
6000
7000
Activity Units (AU/ mL)
Results
155
4.5.5.6 Effect of reducing agents on the stability of bacteriocins
The effect of two reducing agents, DTT and β- mercaptoethanol on the
stability of the bacteriocins was tested. For BS101, the DTT at a concentration
range of 1-10 mM was used and β- mercaptoethanol was used in the range of 10-
100 mM concentration. BS101 remained stable when exposed upto 8 mM DTT.
Above this concentration the activity reduced rapidly (Fig 4.47a). β -
mercaptoethanol did not affect the activity of BS101 upto 60 mM concentration,
but the activity reduced when exposed to concentration of 70 mM and above (Fig
4.47 b).
In the case of BL8, the concentration of DTT tested was in the range of
10-100 mM. β- mercaptoethanol was also taken at higher concentrations of 100-
1000 mM (Fig. 4.48 a & b). The activity of BL8 was reduced to half when
exposed to DTT at a concentration of 20 mM and above. The activity was not
completely lost even when exposed to 100 mM concentration. Similarly, the effect
of β- mercaptoethanol on the stability of BL8 was also studied and found that the
activity reduced when the bacteriocin was treated with β- mercaptoethanol at a
concentration of 200 mM and above. Complete activity loss was not observed
even at 1000 mM concentration.

Results
156
a
BS101
DTT (mM)
0 2 4 6 8 10 12
Activity U
nits (
AU
/mL
)
0
200
400
600
800
1000
1200
1400
1600
1800
Activity Units (AU/mL)
b
Beta-mercaptoethamol (mM)
0 20 40 60 80 100 120
Activity U
nits (
AU
/mL
)
600
800
1000
1200
1400
1600
1800
Activity Units (AU/mL)
Fig: 4.47 Effect of reducing agents on the stability of BS101 (a) Effect of DTT
(b) Effect of β -mercaptoethanol

Results
157
a
BL8
DTT Concentration (in mM)
0 20 40 60 80 100 120
Activity U
nits (
AU
/mL)
500
1000
1500
2000
2500
3000
3500
Activity units (AU/mL)
b
Beta-mercaptoethanol concentration (mM)
0 200 400 600 800 1000 1200
Activity U
nits (
AU
/mL
)
0
500
1000
1500
2000
2500
3000
3500
Activity Units (AU/mL)
Fig: 4.48 Effect of reducing agents on the stability of BL8 (a) Effect of DTT
(b) Effect of β- mercaptoethanol
Results
158
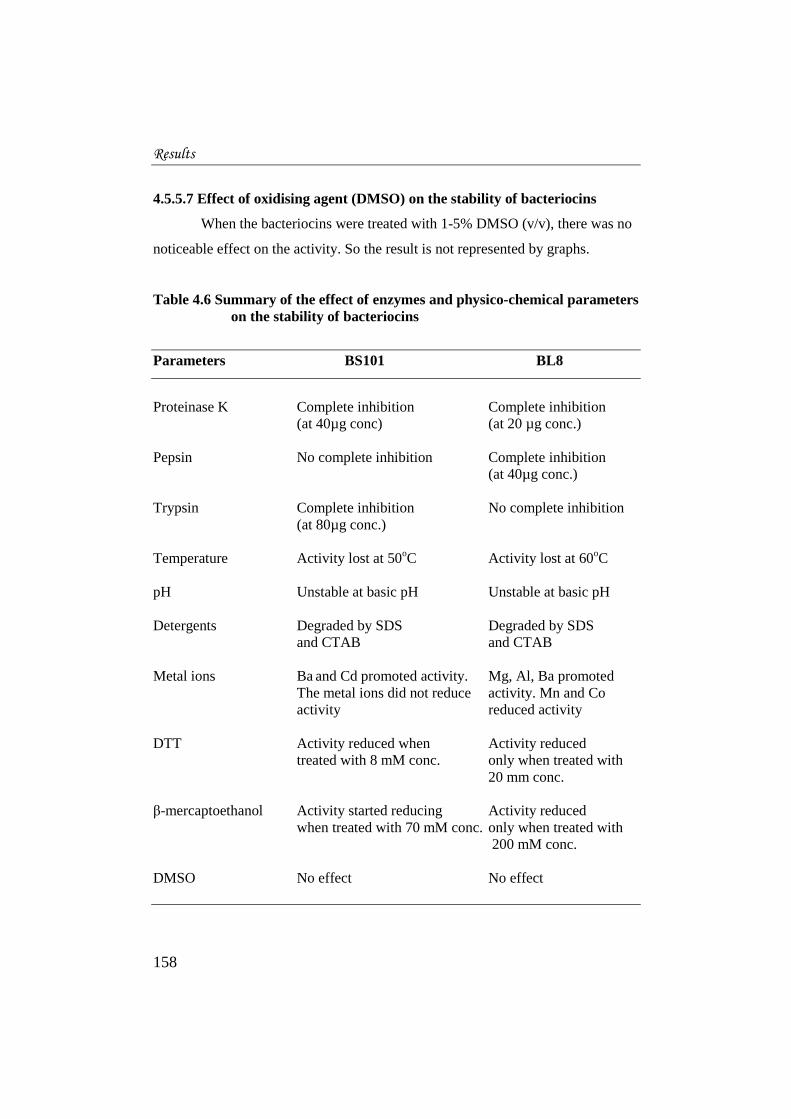
4.5.5.7 Effect of oxidising agent (DMSO) on the stability of bacteriocins
When the bacteriocins were treated with 1-5% DMSO (v/v), there was no
noticeable effect on the activity. So the result is not represented by graphs.
Table 4.6 Summary of the effect of enzymes and physico-chemical parameters
on the stability of bacteriocins
Parameters BS101 BL8
Proteinase K Complete inhibition Complete inhibition
(at 40µg conc) (at 20 µg conc.)
Pepsin No complete inhibition Complete inhibition
(at 40µg conc.)
Trypsin Complete inhibition No complete inhibition
(at 80µg conc.)
Temperature Activity lost at 50oC Activity lost at 60
oC
pH Unstable at basic pH Unstable at basic pH
Detergents Degraded by SDS Degraded by SDS
and CTAB and CTAB
Metal ions Ba and Cd promoted activity. Mg, Al, Ba promoted
The metal ions did not reduce activity. Mn and Co
activity reduced activity
DTT Activity reduced when Activity reduced
treated with 8 mM conc. only when treated with
20 mm conc.
β-mercaptoethanol Activity started reducing Activity reduced
when treated with 70 mM conc. only when treated with
200 mM conc.
DMSO No effect No effect

Results
159
4.5.6 Minimum Inhibitory Concentration (MIC)
Minimum concentration of bacteriocins required to inhibit the growth of
test organisms (S. aureus) was determined using microtitre plate assay
incorporating resazurin. The microtitre well with highest dilution of the
bacteriocins that inhibited the growth of test organisms remained blue. The well
having bacteriocin concentration that does not inhibit the growth of test organisms
turned pink. The protein concentration in the well was calculated by dividing the
total protein content of purified bacteriocin in the first well with that of the
dilution factor of the well (Fig. 4.49) and expressed in µg/mL. This value is
considered as the MIC of the bacteriocin. Here, the total protein content of BS101
taken was 28.5 µg (50 µL purified BS101 having protein concentration of 570
µg/mL) and the dilution factor was found to be 4 and the MIC for BS101 was
determined as 42.75 µg/mL. The total protein content of BL8 was 12.5 µg (50 µL
purified BL8 having protein concentration of 250 µg/mL) and the dilution factor
was found to be 4, the MIC was calculated as 18.75 µg/mL for BL8.
Fig: 4.49 Microtitre plate showing colour change of resazurin from
blue to pink in the presence of living cells
4.5.7 Growth inhibition assay to test bacteriostatic/ bactericidal activity of the
bacteriocins
From the experiment (Fig. 4.50) it was observed that the optical density
(OD600) of the four test organisms viz. B. coagulans, B. circulans, B. cereus and
S. aureus did not increase drastically when the bacteriocins (at a concentration of
BL8
BS101

Results
160
BS101: 34 µg/mL; BL8: 47.5 µg/mL) were added into the growth media at the
time of their inoculation. This indicates that the growth of these test organisms
was inhibited. But in the control, there was prominent growth and hike in OD600
after six hours of inoculation. If we take B. pumilus and Cl. perfringens, it was
observed that the growth was controlled to a certain extent but was not completely
inhibited. From the experiment it was concluded that both the bacteriocins are
bacteriocidal to B. coagulans, B. circulans, B. cereus and S. aureus whereas they
are bacteriostatic to B. pumilus and Cl. perfringens.
Fig: 4.50 Variation in OD600 when the test organisms were inoculated in
media supplemented with BS101 and BL8
4.6 APPLICATION STUDIES
4.6.1 Bacteriocins for the control of biofilm formation
In vitro biofilm formation by the six test organisms under study was
experimentally tested initially and the result is depicted in fig. 4.51. 2AC was
calculated to be 0.024 ± 0.002 and 4AC was calculated as 0.048 ± 0.002. The

Results
161
OD570 of Cl. perfringens was 0.0386 ± 0.002 and that of B. cereus was 0.045 ±
0.001 and hence categorised as moderate biofilm producers as OD570 was in
between 2AC and 4AC. The other four test organisms were not very good biofilm
formers. Next experiment was conducted to determine the ability of the
bacteriocins, BS101 and BL8 to control biofilm formation by these two top most
biofilm producers in this study. When the bacteriocins were added in the test, they
inhibited the biofilm formation by Cl. perfringens and B. cereus (Fig. 4.52). When
BS101 was applied the OD570 of Cl. perfringens and B. cereus was reduced to
0.009 and 0.008 ± 0.001 respectively. When BL8 was incorporated, the OD570 of
Cl. perfringens and B. cereus was reduced to 0.013 ± 0.001 and 0.007 ± 0.001
respectively. Thus it was experimentally proved that the bacteriocins perform very
well in the control of biofilm formation.
Fig: 4.51 In vitro biofilm formation by the six test organisms

Results
162
Fig: 4.52 Control of biofilm formation by the bacteriocins
4.6.2 Bacteriocins for the control of microflora of sea foods
BS101 and BL8 were also tested for their ability to control microflora in
sea foods. Bacteriocins were found to be very efficient in controlling the
microflora of sea foods like prawns and anchovies. The bacterial count in
untreated anchovies was found to be 172 ± 12.02 x10⁵
CFU/mL. The microbial
count was reduced to 90 ± 4.24 x10⁵
CFU/mL and 94 ± 3.53 x10⁵
CFU/mL when
the sample was treated with BS101 and BL8 respectively (Fig. 4.53). The bacterial
count in untreated prawn was 842 ± 19.79 x10⁵ CFU/mL. The microbial count was
reduced to 176 ± 23.33 x10⁵
CFU/mL and 111 ± 7.77 x10⁵
CFU/mL when the
sample was treated with BS101 and BL8 respectively. This drastic decrease in the
microbial count of sea food samples treated with the bacteriocins indicates their
ability to control the microflora of sea foods, supporting their application in
biopreservation.

Results
163
Fig: 4.53 Control of microflora of prawns and anchovies by the
bacteriocins
4.6.3 Bioassay using model organism Caenorhabditis elegans: Pathogenesis
and prophylaxis using the bacteriocins
The nematode Caenorhabditis elegans was used as a model system to
study the pathogenesis of S. aureus and B. circulans and to confirm the ability of
the bacteriocins BS101 and BL8 to confer protection against the bacterial
infection. It was observed that the bacteriocin BL8 had a positive influence in
increasing the life span of the infected worms. The figures (4.54 and 4.55)
represent the percentage mortality of C. elegans over a span of 10 days when
exposed to the pathogens S. aureus and B. circulans and the influence of the
bacteriocins in maintaining the life span of worms to near normal levels when
compared to the untreated (control) worms fed on E. coli OP50.

Results
164
Fig: 4.54 Variation in TD50 of C. elegans infected with S. aureus in the
presence and absence of bacteriocins
The time required for the death of 50% of the nematodes (TD50) was
calculated from the results obtained using the PRISM (version 5.04) computer
program. TD50 was calculated in three independent experiments and values were
represented in mean ± standard error. The time required for 50% of nematodes to
die when fed on an E. coli OP50 lawn was 8.950 ± 0.236 days. TD50 of the
nematodes when infected with the known pathogen S. aureus was 7.932 ± 0.173
days, while it was 7.932 ± 0. 113 days when the nematodes were fed with B.
circulans, indicating the pathogenicity of these test organisms.
Days
0 1 2 3 4 5 6 7 8 9 10 11
Perc
enta
ge o
f dead n
em
ato
des
0
10
20
30
40
50
60
70
80
90
100
110
E. coli OP 50
S.aureus
S.aureus + BL8
S.aureus + BS101

Results
165
Fig: 4.55 Variation in TD50 of C. elegans infected with B. circulans in the
presence and absence of bacteriocins
The outcome of the bacteriocin prophylaxis experiments was promising in
the case of BL8. When the bacteriocin was applied, its ability to control the
infection helped in reducing the mortality rate of infected worms. TD50 of worms
infected with B. circulans followed by the treatment with BL8 was increased to
9.488 ± 0.231 days and TD50 of worms infected with S. aureus in presence of BL8
was calculated as 8.751 ± 0.169 days which denotes control of bacterial infection
in the worms and thus increase in their life span.
The outcome of the bioassay was not so promising in the case of BS101.
The TD50 of worms infected with B. circulans and S. aureus in the presence of
BS101 was lower, illustrating its inability to reduce infection in live organisms.
TD50 of worms infected with B. circulans in presence of BS101 was calculated as
Days
0 1 2 3 4 5 6 7 8 9 10 11
Perc
enta
ge o
f nem
ato
des d
ead
0
10
20
30
40
50
60
70
80
90
100
110
E.coli OP50
B.circulans
B.circulans+BL8
B.circulans+BS101

Results
166
7.69 ± 0.30 days and TD50 of worms infected with S. aureus in the presence of
BL8 was calculated as 6.989 ± 0.13 days.
Thus two low molecular weight bacteriocins from B. subtilis strain
BTFK101 and B. licheniformis strain BTHT8, isolated from the marine sediment
were characterized in the present study. They were observed to exhibit an ability
to participate in prophylaxis, biofilm control and also in sea food preservation.