4-b geotechnical progress report: conveyance
TRANSCRIPT

FINALENVIRONMENTALIMPACT STATEMENT
BrightwaterRegional WastewaterTreatment System
APPENDICES
4-BGEOTECHNICAL PROGRESS
REPORT: CONVEYANCE

Final
Appendix 4-BGeotechnical Progress Report:
Conveyance
August 2003
Prepared for King County byCDMBellevue, WA
For more information:Brightwater Project201 South Jackson Street, Suite 503Seattle, WA 98104-3855206-684-6799 or toll free 1-888-707-8571
Alternative formats available upon requestby calling 206-684-1280 or 711 (TTY)

Final Geotechnical Progress Report: Conveyance
Geotechnical Services i August 2003 Brightwater Conveyance System
CONTENTS
CONTENTS ..................................................................................................................... I
LIST OF TABLES........................................................................................................... III
LIST OF FIGURES......................................................................................................... III
1.0 INTRODUCTION....................................................................................................... 1 1.1 Site and Project Description .............................................................................................1
1.2 Purpose and Scope..........................................................................................................2
1.3 Report Layout...................................................................................................................2
1.4 Limitations ........................................................................................................................2
2.0 SUBSURFACE EXPLORATION PROGRAM............................................................ 4 2.1 Soil Classification System.................................................................................................5
2.2 Geologic Units and Description.........................................................................................5
2.3 Land Based Explorations..................................................................................................5
2.3.1 Land Drilling Procedures...........................................................................................5 2.3.2 Soil Sampling............................................................................................................6
2.4 Outfall Explorations ..........................................................................................................7
3.0 HYDROGEOLOGIC TESTING.................................................................................. 8 3.1 Observation Wells and Vibrating Wire Piezometers..........................................................8
3.1.1 Standpipe Piezometers.............................................................................................8 3.1.2 Vibrating Wire Piezometers.......................................................................................8
3.2 Well Development ............................................................................................................9
3.3 Water Level Monitoring.....................................................................................................9

Final Geotechnical Progress Report: Conveyance
Geotechnical Services ii August 2003 Brightwater Conveyance System
4.0 GEOTECHNICAL LABORATORY TESTING .......................................................... 10
4.1 Index Tests.....................................................................................................................10
4.1.1 Water Content.........................................................................................................10 4.1.2 Unit Weight .............................................................................................................10 4.1.3 Grain Size Distribution ............................................................................................10 4.1.4 Atterberg Limits.......................................................................................................10
4.2 Strength Testing .............................................................................................................11
5.0 GAS MEASUREMENTS ......................................................................................... 12
5.1 During Drilling.................................................................................................................12
5.2 Prior to Well Installation..................................................................................................12
5.3 Completed Observation Wells ........................................................................................12
6.0 REFERENCES........................................................................................................ 14

Final Geotechnical Progress Report: Conveyance
Geotechnical Services iii August 2003 Brightwater Conveyance System
LIST OF TABLES
Table 1. Description of Geologic Units in the Brightwater Area
Table 2. Summary of Borings
Table 3a. Summary of Piezometer Installation and Water Level Data
Table 3b. Summary of Well Installation and Water Level Data
Table 4. Summary of Index Testing Results
Table 5. Summary of Unconfined Compressive Strength Testing
Table 6. Summary of Gas Monitoring Data
LIST OF FIGURES
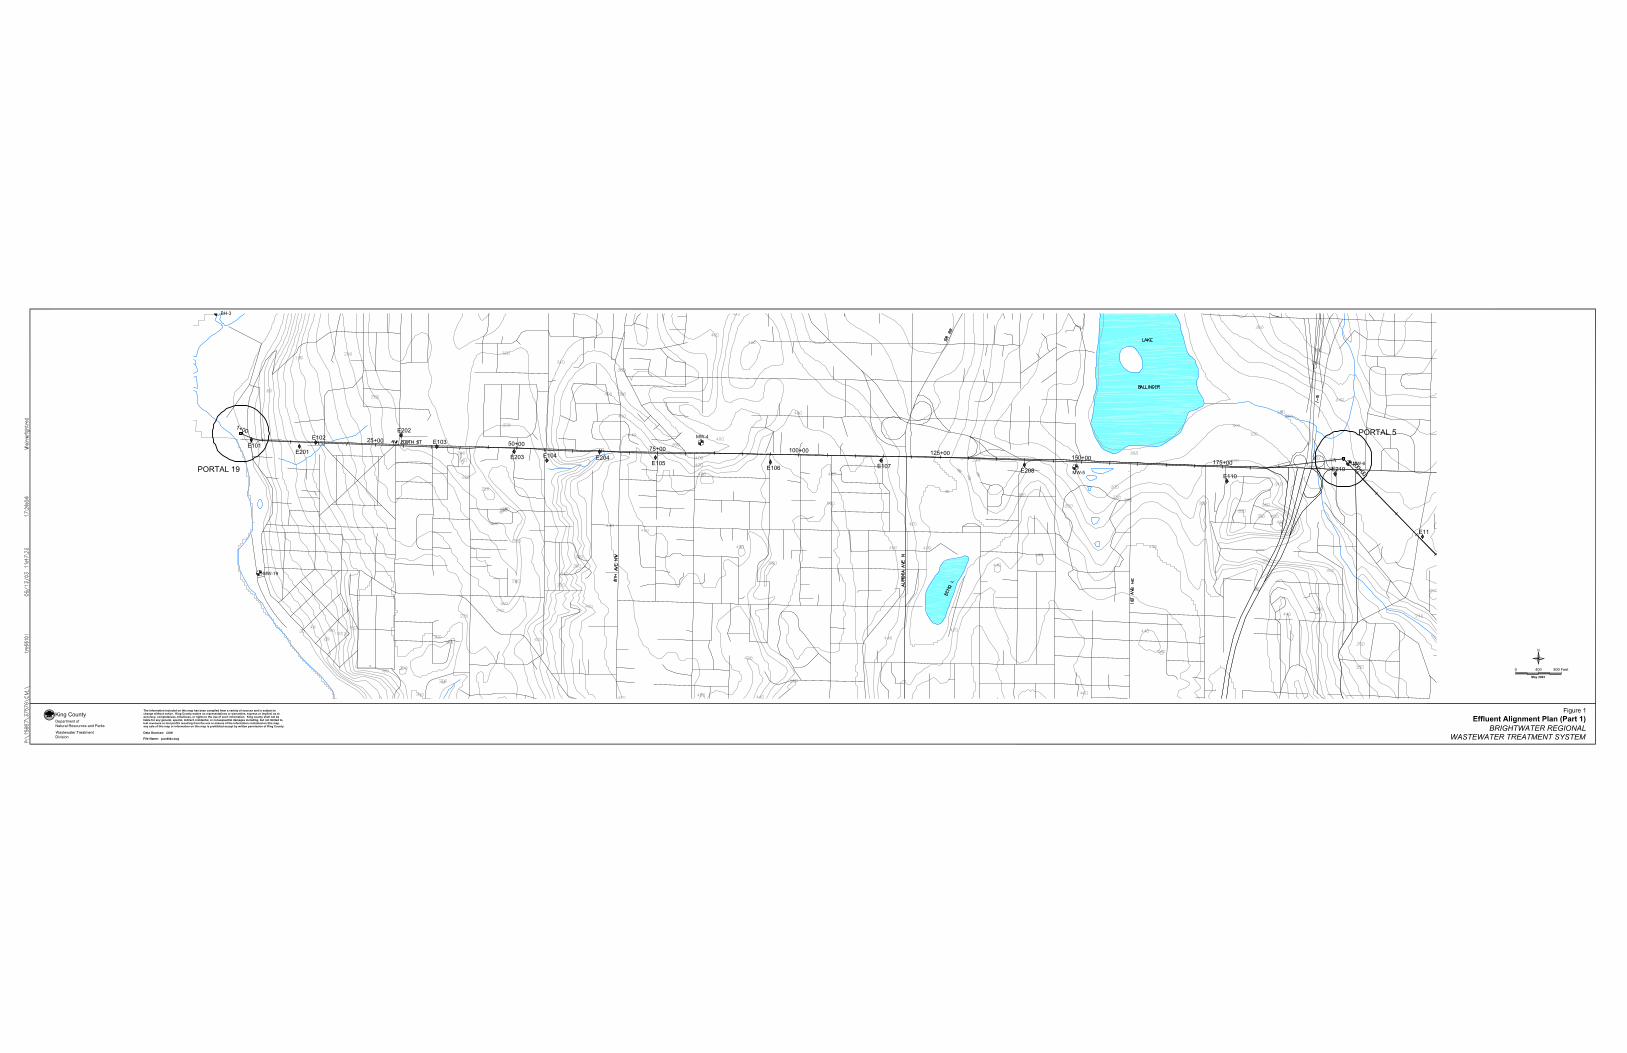
Figure 1. Effluent Alignment Plan (Part 1)
Figure 2. Effluent Alignment Plan (Part 2)
Figure 3. Combined Alignment Plan
Figure 4. Influent Alignment
Figure 5. Effluent Alignment Subsurface Profile (Part 1)
Figure 6. Effluent Alignment Subsurface Profile (Part 2)
Figure 8. Combined Alignment Subsurface Profile
Figure 9. Influent Alignment Subsurface Profile
Figure 10. Soil Classification System

Final Geotechnical Progress Report: Conveyance
Geotechnical Services 1 August 2003 Brightwater Conveyance System
1.0 INTRODUCTION King County has prepared a Draft Environmental Impact Statement (Draft EIS) and Final Environmental Impact Statement (Final EIS) on the Brightwater Regional Wastewater Treatment System. The Final EIS is intended to provide decision-makers, regulatory agencies and the public with information regarding the probable significant adverse impacts of the Brightwater proposal and identify alternatives and reasonable mitigation measures.
King County Executive Ron Sims has identified a preferred alternative, which is outlined in the Final EIS. This preferred alternative is for public information only, and is not intended in any way to prejudge the County's final decision, which will be made following the issuance of the Final EIS with accompanying technical appendices, comments on the Draft EIS and responses from King County, and additional supporting information. After issuance of the Final EIS, the King County Executive will select final locations for a treatment plant, marine outfall and associated conveyances.
The County Executive authorized the preparation of a set of Technical Reports, in support of the Final EIS. These reports represent a substantial volume of additional investigation on the identified Brightwater alternatives, as appropriate, to identify probable significant adverse environmental impacts as required by the State Environmental Policy Act (SEPA). The collection of pertinent information and evaluation of impacts and mitigation measures on the Brightwater proposal is an ongoing process. The Final EIS incorporates this updated information and additional analysis of the probable significant adverse environmental impacts of the Brightwater alternatives, along with identification of reasonable mitigation measures. Additional evaluation will continue as part of meeting federal, state and local permitting requirements.
Thus, the readers of this Technical Report should take into account the preliminary nature of the data contained herein, as well as the fact that new information relating to Brightwater may become available as the permit process gets underway. It is released at this time as part of King County's commitment to share information with the public as it is being developed.
1.1 Site and Project Description
The proposed Brightwater conveyance system includes influent and effluent pipelines primarily constructed in tunnels. The system also includes access portals and associated support facilities. The influent pipeline will carry untreated wastewater to the plant for treatment. The effluent pipeline will carry treated wastewater from the plant to Puget Sound for discharge. A separate pipeline will transport treated effluent to the Woodinville and Redmond areas for reuse.
The preferred conveyance system alignment consists of the Route 9 - 195th Street alignment as shown on Figures 1 through 4. The effluent pipeline alignment and primary construction portals are shown on Figures 1 through 3. The influent pipeline alignment and primary construction portals are shown starting on Figure 4 and finishing on Figure 3. The influent and effluent pipelines will be combined in one tunnel from portal 44 to the treatment plant (Figure 3).

Final Geotechnical Progress Report: Conveyance
Geotechnical Services 2 August 2003 Brightwater Conveyance System
Wastewater would flow by gravity through the influent and effluent lines. Alternative pipeline depths within the range of 50 to 400 feet are being considered as shown on Figures 5 through 8. The final pipeline depth interval will be selected during the design phase for the selected alternative.
Several types of permanent facilities would be constructed at primary portal sites. These include hydraulic control structures, a dechlorination facility, and chemical injection / odor control facilities.
1.2 Purpose and Scope
This Geotechnical Progress Report (GPR) describes the procedures and presents the results of the field exploration program and geotechnical laboratory testing. This report addresses all elements of the Brightwater Conveyance project for the preferred alignment, including the effluent pipeline, influent pipeline, portals, marine outfall, and connecting pipelines and structures. The purpose of this report is to provide a summary of current data and data acquisition procedures for inclusion in the FEIS. Since all of the boring logs are currently being edited to reflect new data from on-going laboratory testing, the boring logs or any interpretive profiles are not included.
1.3 Report Layout
This GPR report is divided into six sections, which describe the data acquisition procedures and results: The sections include:
1) Introduction – Description of the project, purpose and scope of this report, and limitations of this report;
2) Subsurface Exploration Program – Land based and over-water exploration procedures and data;
3) Hydrogeologic Testing – Groundwater measurement procedures and data;
4) Geotechnical Laboratory Testing – Soil testing results and procedures;
5) Gas Monitoring - .Gas monitoring procedures used during drilling and after completion of groundwater well installation.
6) References – Standard references cited in this report.
1.4 Limitations
This report has been prepared for the exclusive use of King County Waste Water Treatment Division and its consultants for The Brightwater Conveyance Project only. The data presented in this report are based on subsurface conditions encountered at the time of our study and our

Final Geotechnical Progress Report: Conveyance
Geotechnical Services 3 August 2003 Brightwater Conveyance System
experience and engineering judgment. CDM cannot be held responsible for the interpretation by others of the data contained herein.
Within the limitations of scope, schedule, and budget, our services have been performed in a manner consistent with that level of care and skill ordinarily exercised by members of the profession currently practicing under similar conditions in the area. No other warranty, express or implied, is made.

Final Geotechnical Progress Report: Conveyance
Geotechnical Services 4 August 2003 Brightwater Conveyance System
2.0 SUBSURFACE EXPLORATION PROGRAM The field exploration program for the Brightwater Conveyance project started on January 31, 2003. A total of 58 borings have been completed for the effluent and influent pipeline and tunnel portals. Explorations are planned for connecting pipelines and structures, but have not been started at this time. The locations of completed explorations are shown on Figures 1 through 4.
In-situ testing data include groundwater monitoring and gas measurements. At some locations initial groundwater monitoring data was obtained from observation wells that have not yet been developed. One of the on-going field activities is the development of all observation wells along the alignment and confirmation of the previous groundwater readings. Additional proposed in-situ testing consisting of groundwater pumping tests, slug tests, cone penetrometer testing, pressuremeter testing, and downhole seismic testing has not started at this time.
Over-water explorations completed at this time for the marine outfall portion of the Brightwater Conveyance project include geophysical surveys, and mini cone penetrometer testing. Additional explorations consisting of mini cone penetrometer tests, gravity cores, and overwater borings along the preferred alignment are planned for the summer of 2003.
Laboratory testing has been completed to classify soils and identify geologic units. The majority of the testing has consisted of index tests and geologic tests. More extensive soil testing consisting of additional index testing, geologic testing and strength and deformation testing will be performed once the vertical tunnel alignment has been determined.
The project geodetic (horizontal) datum is the North American Datum of 1983, adjusted for HPGN in 1991 (NAD83/91). All coordinates are based on the Washington North Zone of the State Plane Coordinate System (SPCS83) and are in U.S. Survey Feet.
The Brightwater Project vertical datum is METRO Datum. However, all elevations used for the exploration program are based on the North American Vertical Datum of 1988 (NAVD88) and are in feet. For conversion, METRO Datum = NAVD88 + 96.28 feet. The bathymetric vertical datum is Mean Lower Low Water (MLLW) and all water depths are in feet. For conversion, MLLW = NAVD88 + 2.29 feet, or MLLW = Metro Datum - 93.99 feet.
Borings were originally located in the field using hand-held GPS and the elevations estimated based on locating the coordinates on project aerial mapping. Initially approximately 20 borings were surveyed for location and elevation and these were used to verify the accuracy of this preliminary field location method. Upon completion of the field exploration program all boring locations will be field located by survey.

Final Geotechnical Progress Report: Conveyance
Geotechnical Services 5 August 2003 Brightwater Conveyance System
2.1 Soil Classification System
Soil samples recovered from the borings were classified in general accordance with the American Society for Testing Materials (ASTM) D2488, Standard Recommended Practice for Description of Soils (Visual Manual Method) and ASTM D2487, Standard Test Method for Classification of Soils for Engineering Purposes. Soils are described in accordance with King County WTD procedures. The classification system is summarized on Figure 9.
2.2 Geologic Units and Description
The geologic unit nomenclature used for this project is based on criteria developed by the Seattle-Area Geologic Mapping Program (SGMP) and King County WTD. The list of geologic units used for this project is presented in Table 1. The assigning of a geologic unit to a particular grouping of soil types was based on our interpretation of the depositional environment, stratigraphic relationships, and engineering properties.
2.3 Land Based Explorations
Table 2 provides a summary of the borings, including location, date completed, drilling subcontractor, drilling method or methods, surface elevation and boring depth. All of the explorations were continuously observed by a member of the CDM design team. The following sections provide a description of the drilling and sampling procedures used for this project.
2.3.1 Land Drilling Procedures Drilling was performed by several contractors using four different drilling methods, including hollow-stem auger, mud rotary, rotosonic coring, and wireline coring. To date all drill rigs used for this project were truck mounted. At some drilling locations due to difficult soil and groundwater conditions a combination of drilling methods was used to advance the boring.
2.3.1.1 Auger Drilling Hollow-stem auger (HSA) drilling was performed at selected boring locations where the depth of the boring was generally less than 100 ft. The HSA method consists of advancing continuous-flight-augers into the soil by rotation. As the augers are advanced, soil cuttings from the borehole move upward along the exterior flights of the augers to the surface. A plug at the end of the drilling rods is maintained in the lead (lowest) auger section to prevent soil cuttings from entering the hollow-stem of the auger. Samples are obtained by pulling the drill rods from the auger-cased hole, removing the plug from the ends of the rods, attaching the sampler to the end of the rods and lowering the sampler to the bottom of the hole and hammering the sampler into the ground. Drive sampling methods are described in Section 2.3.2.1.
Difficulties were encountered in maintaining hole stability and in obtaining good quality samples because of the high groundwater conditions, artesian conditions and gravels and cobbles. As a result, this method of drilling was abandoned early in the exploration program.

Final Geotechnical Progress Report: Conveyance
Geotechnical Services 6 August 2003 Brightwater Conveyance System
2.3.1.2 Mud-Rotary Drilling The mud rotary method consists of drilling an approximately 6-inch diameter borehole in the ground using a tricone roller bit and drilling mud (either a bentonite-based or a polymer-based fluid) to wash the soil cuttings from the borehole, cool the bit, and to maintain borehole stability. The tricone bit is used to advance the borehole. Drilling mud is pump from the mud tub at the surface, down the drill rods and out through the bit. The drilling mud carries soil cuttings up the annular space between the drill rods and the borehole wall back to the mud tank at the surface. Cuttings carried by the drilling mud are allowed to settle out in the mud tank and the drilling fluid is recirculated back down the borehole. The borehole is cased if borehole stability becomes a problem. Samples are obtained by pulling the drill rods and drill bit from the hole. At shallow depths, the drill bit at the end of the rods is replaced with a sampler and lowered to the bottom of the hole. At deeper depths, the sampler is attached to a wire line-operated hammer and lowered to the bottom of the hole.
2.3.1.3 Rotosonic Drilling The rotosonic method consists of advancing a steel casing into the ground by applying high-frequency vibrations to the top of the casing. Down pressure and rotation are also used to advance the casing. Nearly continuous soil samples are obtained. As the casing is advanced, a core of soil enters the 4- or 6-inch outside diameter (O.D.) core barrel. The core barrel is periodically retrieved to the surface and soil samples are extracted from the core barrel by vibrating the contents of the casing into a plastic bag.
2.3.1.4 Wireline Drilling The wireline method consists of drilling an approximately 6-inch diameter hole in the ground by rotary coring of the soil. This is method utilizes a PQ wireline core system similar to a rock coring system, and a drilling fluid (either a bentonite-based or polymer-based slurry) to wash excess cuttings to the ground surface and maintain hole stability. A continuous soil core sample will generally be obtained throughout the boring depth; however, discrete drive samples may be obtained by removing the inner core barrel and driving a sampler into the undisturbed ground.
2.3.2 Soil Sampling The following soil sampling procedures were used for this exploration program.
2.3.2.1 Drive Samples Driven soil samples were obtained at selected depths from the HSA borings and mud rotary borings using a 2.42-inch I.D., 3.25-inch O.D., ring-lined, split-barrel sampler. For shallow sampling depths, the sampler was placed at the end of drill rods and lowered to the bottom of the borehole. The sampler was then driven 18 inches (or a portion thereof) into the relatively undisturbed soil below the bottom of the borehole with either a 300-pound or 140-pound auto-release hammer. At deeper depths, the sampler was attached to either a 300-pound or 140-pound hammer suspended on a wireline and lowered to the bottom of the hole. In all cases these samples are considered to be disturbed samples relative to their quality for laboratory testing.

Final Geotechnical Progress Report: Conveyance
Geotechnical Services 7 August 2003 Brightwater Conveyance System
The number of blows to advance the sampler the last 12 inches (or portion thereof) of the 18-inch drive is recorded on the boring log at the depth the sample was taken. This blow count is not the “standard penetration resistance (N)”, which applies only to a 2-inch O.D., split-spoon sampler attached at the end of drill rods, driven with a 140 pound hammer, but provides a relative indication of soil density or consistency.
2.3.2.2 Thin Wall Tube Sampling In selected mud rotary and wireline borings, tube samples were obtained using a hydraulically advanced thin-walled sampler, a Pitcher Barrel sampler, or a geo-barrel sampler. The location and types of the tube samples will be identified on the final boring logs.
2.3.2.3 Core Samples Nearly continuous soil core samples were obtained using the rotosonic drilling and wireline drilling methods. Samples from the rotosonic borings were obtained using vibration and rotating the core barrel Rotosonic drilling results in some disturbance to the core. Observed core recovery in excess of the drilled length was evidence of this disturbance. During drilling of cohesive soils with the rotosonic method, some of the energy of drilling was transmitted into the core as heat, occasionally resulting in hot samples that may not contain representative moisture content. This soil condition was noted on the logs.
2.4 Outfall Explorations
Over-water explorations completed at this time for the marine outfall portion of the Brightwater Conveyance project consist of a bathymetric survey, side scan sonar, sub-bottom profiling, and single channel shallow seismic profiler survey. These geophysical surveys were conducted in two phases from February 25 and 26, 2003 and from April 21 to 22, 2003. The Final Outfall Geophysical Survey report is presented as FEIS Appendix 4C.
The first phase consisted of sidescan sonar imagery, bathymetry, and sub-bottom profile data. The survey area encompassed outfall Zone 7S and included a rectangular area extending about 7,000 ft along the shoreline and extending from the 50-ft water depth seaward for about 7,500 ft.
The second phase of the marine geophysical survey was a high-resolution survey to augment the first phase bathymetric and sub-bottom information. The survey system consisted of a high-resolution echo sounder, a 3.5 kHz sub-bottom profiler system, a shallow seismic profiler system and an integrated navigation and positioning system.

Final Geotechnical Progress Report: Conveyance
Geotechnical Services 8 August 2003 Brightwater Conveyance System
3.0 HYDROGEOLOGIC TESTING Standpipe and vibrating-wire pressure transducer piezometers (VWPs) were installed in boreholes along the alignment to measure groundwater levels, to be used in conjunction with slug and aquifer tests, and to collect groundwater quality data. Slug test and aquifer testing has not been started at this time. This section details the procedures followed in installing these piezometers in addition to the monitoring and testing data collected from the installations.
The following subsections present the general steps followed for installation of standpipes and VWPs, and development of observation wells. These methods are in general accordance with Washington Administrative Code 173-160, which regulates the installation of wells.
3.1 Observation Wells and Vibrating Wire Piezometers
Piezometer installations consist of both cased standpipes and vibrating wire transducers. Tables 3a and 3b summarize piezometer installation locations and depths. The number of piezometers installed varies by location from none to three per borehole. Nested installations never included more than a single standpipe piezometer, but at specific locations consisted of multiple grouted-in-place vibrating wire transducers.
3.1.1 Standpipe Piezometers Standpipe piezometers were consistently constructed using 2-inch-diameter PVC with machine-slotted screen (both schedule 40 and schedule 80). Screen sections are 10 feet in length, except in one instance, where 20 feet was used to improve the connection between the well and the adjacent water-bearing soils. When a drilled borehole reached its target depth, drilling fluid (if used) was flushed from the borehole with clean water. As needed based on targeted piezometer depth, bentonite chips were then poured down the borehole to abandon the bottom of the borehole to a depth of 2 to 5 feet below the bottom of the screen. Two-twelve silica sand was then poured onto the top of the chips until the bottom of the screen target was reached. A threaded end cap was attached to the bottom of the screen, which was then lowered down the borehole attached to 20-foot-lengths of blank riser. Sand was then poured slowly around the PVC to extend the filter pack 2 to 5 feet above the top of the screen. A bentonite grout/cement mix was then tremied down on top of a roughly 2-foot layer of bentonite chips used to seal off the filter pack. After the borehole was grouted to surface, the PVC was cut to ground level and covered with a slip cap before a monument was installed.
3.1.2 Vibrating Wire Piezometers Vibrating wire pressure transducer piezometers were installed for hydraulic monitoring, typically in areas with fine-grained soil or potential flowing artesian conditions. Each VWP installation began with the field calibration of the instrument. When one or two VWPs were installed in a borehole without a standpipe, the VWPs were taped to a 1-inch-diameter schedule 10 tremie pipe to secure their depth in the well. The tremie pipe was then lowered down the hole and the well was grouted from bottom to top through the tremie pipe. When VWPs were installed above the

Final Geotechnical Progress Report: Conveyance
Geotechnical Services 9 August 2003 Brightwater Conveyance System
screened interval of a standpipe piezometer, the instruments were taped directly to the outside of the 2-inch-diameter PVC and lowered into place.
3.2 Well Development
All standpipe piezometers are being developed to remove sediment and residual drilling fluid from the PVC and filter pack and to improve hydraulic connection with the adjacent formation. Development of each well is presently being performed by the driller who installed the well and under the observation of a CDM design team geotechnical engineer or geologist. This procedure will continue for all wells installed for this project. When particularly dirty wells are encountered, a WaTerra foot-valve pump may be used to remove accumulated sediment from the well casing. Bleach will be poured down the standpipe and allowed to react for a period of 24 hours in cases where polymer drill fluid remains in the well. In holes with minor sediment accumulations, air jetting or a submersible pump may be used to purge the casing. Generally, a minimum of three casing volumes of water will be removed from each standpipe, or until conductivity, turbidity, temperature and pH stabilize (+/- 10%). Purge water will be controlled at the wellhead and, if allowable, will be discharged to a nearby sanitary sewer or removed in secure drums.
3.3 Water Level Monitoring
Water level monitoring is performed either by continuous recording using electronic data loggers or by scheduled manual measurements. All completed pre-design piezometers in addition to piezometers completed at the exploration locations for this program are included in this monitoring program. Water level data is summarized in Tables 3a and 3b.
Rounds of manual measurements were made approximately every two weeks. These data were collected to assess groundwater head distribution and to understand long-term groundwater variations and trends. Methane and barometric pressure readings were also recorded at standpipes in conjunction with the manual measurements.
As of June 10, 2003, 26 data loggers were in use. Each data logger was left in-place for a maximum duration of two weeks to record water pressures every 15 minutes. In situations where it was advantageous to have near-continuous data from a standpipe, a VWP was submerged below the water surface with a data logger attached to record measurements. At the on-set of monitoring, particular attention was given to the western-most wells in an effort to better understand hydraulic head beneath the upland area in addition to the degree of hydraulic connection between water-bearing zones and tidal fluctuations in Puget Sound.

Final Geotechnical Progress Report: Conveyance
Geotechnical Services 10 August 2003 Brightwater Conveyance System
4.0 GEOTECHNICAL LABORATORY TESTING Geotechnical laboratory testing was performed on selected samples obtained from the borings. Current laboratory testing included index tests to classify soil into similar geologic groups and to characterize the engineering properties of each geologic unit. The following sections describe the geotechnical laboratory testing program completed to date.
4.1 Index Tests
Classification and index testing was completed on selected samples. Index testing included visual classification, moisture content, unit weight, grain size distribution, and Atterberg limits tests. The following provides a brief description of the index testing program. Results of the index testing are summarized in Table 4.
4.1.1 Water Content Water contents were determined on selected samples for the explorations and were completed in accordance with ASTM D 2216-98, Test Method for Laboratory Determination of Water Content of Soil and Rock.
4.1.2 Unit Weight The moist and dry unit weight of was determined for selected drive samples from the borings in general accordance with ASTM D2937-94, Standard Test method for Density of Soil in place by the Drive Cylinder Method, modified for a ring sampler. The physical dimensions of the soil sample were measured, weighed, and the moist unit weight calculated. The sample was then oven dried and the water content was determined in accordance with ASTM D 2216-98, and the dry unit weight was calculated.
4.1.3 Grain Size Distribution Grain size distribution of selected samples from the borings was determined in general accordance with ASTM D 422-63 (reapproved 1998), Standard Test Method for Particle-Size Analyses of Soils.
4.1.4 Atterberg Limits Soil plasticity was determined for selected fine-grained samples from the borings by performing Atterberg Limit tests. The tests were performed in general accordance with ASTM D 4318-98, Standard Test Method for Liquid Limit, Plastic Limit, and Plasticity Index of Soils. Atterberg limits include the Liquid Limit (LL), the Plastic Limit (PL) and the Plasticity Index (PI=LL-PL).

Final Geotechnical Progress Report: Conveyance
Geotechnical Services 11 August 2003 Brightwater Conveyance System
4.2 Strength Testing
Unconfined compression testing was completed on selected samples form the borings to determine the strength of selected soil samples. The tests were performed on selected, relatively, undisturbed fine-grained soil from the borings. Testing was in general accordance with ASTM D 2166-98, Unconfined Compressive Strength of Cohesive Soil. The sample was placed in a deformation-controlled load frame, with top and bottom platens. The sample was compressed at a constant rate of 0.1 to 0.02 inches per minute while measuring the applied load with a proving ring. The UC strengths are summarized in Table 5.

Final Geotechnical Progress Report: Conveyance
Geotechnical Services 12 August 2003 Brightwater Conveyance System
5.0 GAS MEASUREMENTS Field screening was performed to determine if methane was present in the boreholes during drilling, prior to well installation, and after well installation. The results are summarized in Table 6.
5.1 During Drilling
The following procedures were used to monitor methane and hydrogen sulfide gas.
At the end of the day, seal the casing with a casing plug (i.e., sewer plug) or, use a cutoff Tedlar bag with sample port built in to the bag.
At the beginning of the following day, have 4-gas meter running and calibrated prior to removing the plug or piercing the film. Place intake hose into casing and monitor levels of methane, hydrogen sulfide, carbon dioxide, and oxygen for a minimum of two minutes or until levels have stabilized. Record levels on the Field Screening Data Sheet (attached).
Continue to monitor periodically while in zones of suspected methane and/or hydrogen sulfide sources (organic rich recent alluvial deposits and Pre-Vashon interglacial units). Conduct monitoring at casing breaks during drilling.
Collect samples of granular and/or organic-rich soils in a Ziploc bag to monitor headspace. Select samples that are permeable or have a high organic content and can be broken apart in the sealed Ziploc bag. Wait 10 minutes for gases to diffuse into the bag headspace and measure with the 4-gas meter.
Periodically monitor the drilling fluid returns for odor (if applicable). If an indication of gas is present, monitor using the 4-gas meter.
5.2 Prior to Well Installation
Prior to well installation, the headspace inside of the casing was monitored using the 4-gas meter. Cover the hole as described in step one above, for about 5 minutes and then proceed to monitor and record results as described in step two above.
5.3 Completed Observation Wells
Gas monitoring was conducted at the time water levels were measured. Gas concentrations were measured first upon arrival by connecting the hose, opening the sampling port on well cap and recording measurements on to the Field Screening Data Sheet. Monitoring will continue at each well as long as methane is detected, or for a minimum of 4 consecutive rounds of measurements if no methane has been detected.

Final Geotechnical Progress Report: Conveyance
Geotechnical Services 13 August 2003 Brightwater Conveyance System
Wells that produce positive methane results during monitoring will be sampled using a passive diffusion bag sampler (PDBS). The PDBS is a low-density polyethylene semi-permeable membrane, filled with deionized water, which can be placed into the well for a period of two to three weeks. Volatile organic compounds in groundwater diffuse across the membrane and dissolve.

Final Geotechnical Progress Report: Conveyance
Geotechnical Services 14 August 2003 Brightwater Conveyance System
6.0 REFERENCES American Society for Testing Materials, 2001, Annual Book of ASTM Standards, Section Four, v. 04.08, Soil and Rock (I): D 420-D 5779:
D 2487-00, Standard Practice for Classification of Soils for Engineering Purposes (Unified Soil Classification System).
D 2488-00, Standard Practice for Description and Identification of Soils (Visual Manual Procedure).
D2216-98, Test Method for Laboratory Determination of Water Content of Soil and Rock.
D2937-94, Standard Test Method for Density of Soil In Place by the Drive Cylinder Method.
D422-63, Standard Test Method for Particle-Size Analyses of Soils.
D4318-98, Standard Test Method for Liquid Limit, Plastic Limit, and Plasticity Index of Soils.
D2166-98, Unconfined Compressive Strength of Cohesive Soil.
King County, 2001. Marine Geophysical Investigation, Marine Outfall Siting Study. Seattle, Washington.
King County, 2002a. Interim Geotechnical Data Report, Brightwater Project Conveyance System, Seattle, Washington.
King County, 2002b. Brightwater Marine Outfall Conveyance System, Interim Conceptual Geotechnical Assessment. Seattle, Washington.
King County, 2002c. Brightwater Regional Wastewater Treatment System Draft Environmental Impact Statement. Seattle, Washington.
Washington Administrative Code 173-160.
Final Geotechnical Progress Report: Conveyance
Geotechnical Services 15 August 2003 Brightwater Conveyance System
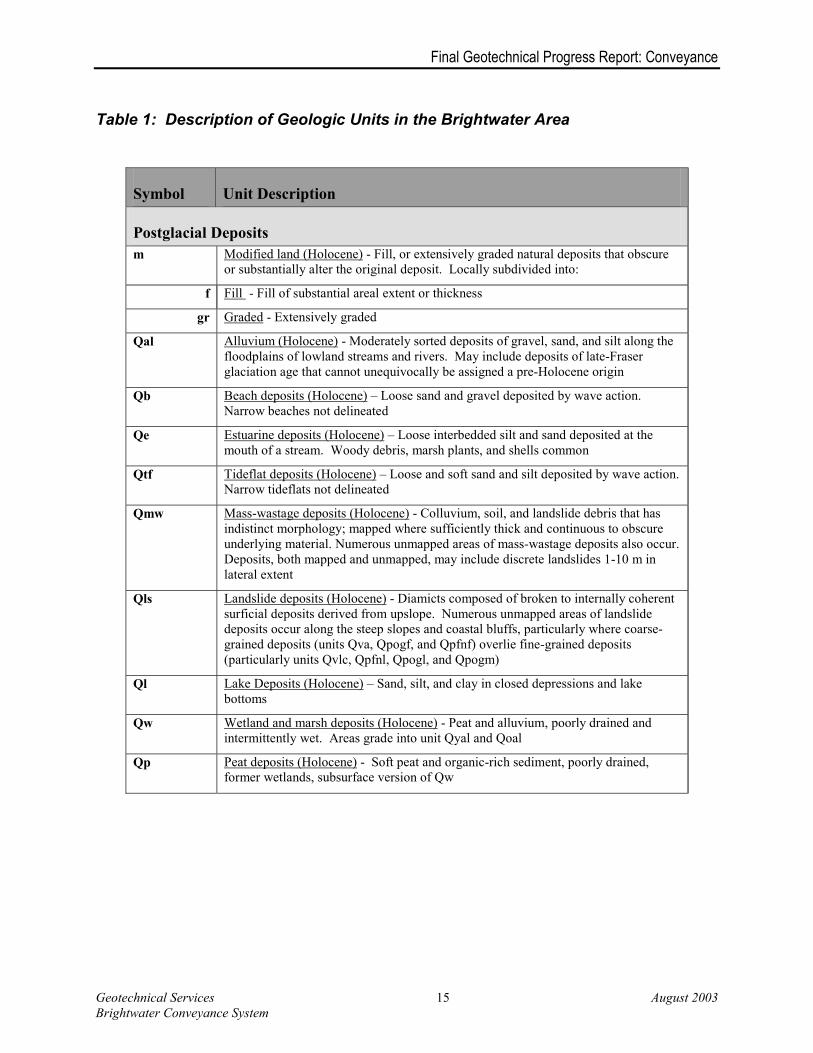
Table 1: Description of Geologic Units in the Brightwater Area
Symbol Unit Description
Postglacial Deposits m Modified land (Holocene) - Fill, or extensively graded natural deposits that obscure
or substantially alter the original deposit. Locally subdivided into:
f Fill - Fill of substantial areal extent or thickness
gr Graded - Extensively graded
Qal Alluvium (Holocene) - Moderately sorted deposits of gravel, sand, and silt along the floodplains of lowland streams and rivers. May include deposits of late-Fraser glaciation age that cannot unequivocally be assigned a pre-Holocene origin
Qb Beach deposits (Holocene) – Loose sand and gravel deposited by wave action. Narrow beaches not delineated
Qe Estuarine deposits (Holocene) – Loose interbedded silt and sand deposited at the mouth of a stream. Woody debris, marsh plants, and shells common
Qtf Tideflat deposits (Holocene) – Loose and soft sand and silt deposited by wave action. Narrow tideflats not delineated
Qmw Mass-wastage deposits (Holocene) - Colluvium, soil, and landslide debris that has indistinct morphology; mapped where sufficiently thick and continuous to obscure underlying material. Numerous unmapped areas of mass-wastage deposits also occur. Deposits, both mapped and unmapped, may include discrete landslides 1-10 m in lateral extent
Qls Landslide deposits (Holocene) - Diamicts composed of broken to internally coherent surficial deposits derived from upslope. Numerous unmapped areas of landslide deposits occur along the steep slopes and coastal bluffs, particularly where coarse-grained deposits (units Qva, Qpogf, and Qpfnf) overlie fine-grained deposits (particularly units Qvlc, Qpfnl, Qpogl, and Qpogm)
Ql Lake Deposits (Holocene) – Sand, silt, and clay in closed depressions and lake bottoms
Qw Wetland and marsh deposits (Holocene) - Peat and alluvium, poorly drained and intermittently wet. Areas grade into unit Qyal and Qoal
Qp Peat deposits (Holocene) - Soft peat and organic-rich sediment, poorly drained, former wetlands, subsurface version of Qw

Final Geotechnical Progress Report: Conveyance
Geotechnical Services 16 August 2003 Brightwater Conveyance System
Table 1: Description of Geologic Units in the Brightwater Area (continued)
Symbol Unit Description
Glacial Deposits of Fraser Glaciation Age Qv Deposits of the Vashon stade of the Fraser glaciation of Armstrong and others (1965)
(Pleistocene) - Consists of:
Qvr Recessional outwash deposits - Stratified sand and gravel, moderately sorted to well sorted, and less common silty sand and silt. Exposed primarily in broad outwash channels, which generally carried glacial meltwater that drained southward away from the ice margin during retreat. Deposits less than about 1 m thick not shown on map. Typically contains northern provenance lithologies. Locally subdivided into:
Qvrf Recessional fluvial deposits - Predominantly sand and gravel
Qvrl Recessional lacustrine deposits – Fine-grained sand, silt, and clay deposited in slack water environments during ice recession
Qvi Ice-contact deposits - Deposits similar in texture to unit Qvr but locally containing a much higher percentage of silt intermixed with lenses and pods of sand, gravel and till. Normally consolidated. Commonly with steeply dipping beds
Qvit Subaerial till – Diamict, similar to Qvt, but has not been overridden by the Vashon glacier and therefore is not as compact as Qvt. This unit tends to be discontinuous over short lateral distances and is often gradational with Qvi and Qvr
Qvt Subglacial till - Basal till. Compact diamict containing subrounded to well-rounded clasts, glacially transported and deposited. Generally forms an undulating surface. A few meters to a few tens of meters thick. Also found sporadically within areas mapped as unit Qvi. Subglacial till may be lodgement, or subglacial melt-out in origin; but in any case has been overridden. Locally subdivided into:
Qvtl Subglacial lodgment till - Dense, overridden, homogenous, matrix-supported gravelly, sandy silt with cobbles. Interlayed or intermixed with sand, silt, and/or gravel lenses.
Qvtm Subglacial meltout till - Dense, overridden, heterogeneous deposit of till interlayed or intermixed with sand, silt, and/or gravel lenses. Till tends to be sandy rather than silty
Qva Advance outwash deposits - Well-bedded sand and gravel deposited by streams and rivers issuing from the front of the advancing ice sheet. Generally unoxidized; almost devoid of silt or clay, except near the base of the unit where Qva is sometimes transitional with Qvlc when present
Qvlc Lawton Clay - Laminated to massive silt, clayey silt, and silty clay deposited in lowland or proglacial lakes. Marks transition from nonglacial to glacial time although unequivocal evidence for glacial or nonglacial origin may be absent. May include top of Qob where conformable

Final Geotechnical Progress Report: Conveyance
Geotechnical Services 17 August 2003 Brightwater Conveyance System
Table 1: Description of Geologic Units in the Brightwater Area (continued)
Symbol Unit Description
Pre-Fraser Glacial and Non-glacial Deposits of Known Age Qob Olympia beds (Pleistocene) - Sand, silt (locally organic-rich), peat, and tephra, thinly
interbedded. May contain diatomaceous layers. Discontinuous. Sand and gravel clast lithology varies depending on source area, from volcanic to reworked northern lithologies
Qpd Possession Drift (Pleistocene)
Qwb Whidbey Formation (Pleistocene)
Qdb Double Bluff Drift (Pleistocene)
Pre-Fraser Sedimentary Deposits of Unknown Origin Qpf Sedimentary deposits of pre-Fraser glaciation age (Pleistocene) - Unoxidized to
moderately oxidized sand and gravel, lacustrine sediments, and unoxidized to strongly oxidized diamict composed of silty matrix and rounded gravel clasts. Glacial or nonglacial origin uncertain. Locally subdivided into:
Qpfl Lacustrine deposits of pre-Fraser glaciation age (Pleistocene) - Origin indeterminable
Qpff Fluvial deposits of pre-Fraser glaciation age (Pleistocene) – Origin indeterminable
Qpon Nonglacial sedimentary deposits of pre-Olympia interglaciation age (Pleistocene)
Pre-Fraser Nonglacial Deposits
Qpfn Nonglacial sedimentary deposits of pre-Fraser glaciation age (Pleistocene) - Sediment of inferred nonglacial origin, based on the presence of peat, paleosols, and tephra layers; or a southern Cascade Range provenance for sedimentary clasts. Further subdivision by age not yet established. Locally subdivided into:
Qpfnl Lacustrine deposits - Deposits similar in texture to Ql. May include interbeds of Qpfnf, Qpfnp, and organic-rich sediments
Qpfnf Fluvial deposits – Deposits similar in texture to Qal. May include interbeds of Qpfnl and scattered to abundant organics
Qpfnb Beach deposits – Deposits similar in texture to Qb.
Qpfnp Wetland deposits – Deposits similar in texture to Qp. May include interbedded fluvial and lacustrine deposits

Final Geotechnical Progress Report: Conveyance
Geotechnical Services 18 August 2003 Brightwater Conveyance System
Table 1: Description of Geologic Units in the Brightwater Area (continued)
Symbol Unit Description
Pre-Fraser Sedimentary Deposits of Unknown Origin (Continued) Pre-Olympia Glacial Deposits
Qpog Glacial sedimentary deposits of pre-Olympia interglaciation age (Pleistocene) - Sediment of inferred glacial (northern) origin, based on the presence of clasts or mineral grains requiring southward ice-sheet transport. Locally subdivided into:
Qpogm Glaciomarine drift - Diamict of highly variable composition, similar in texture to Qvt and Qvlc, deposited in a marine environment from floating ice and debris flows from the ice or recently deposited drift, may contain lenses of glaciofluvial deposits and scattered marine shells
Qpogt Glacial till - Similar in texture to Qvt, Qvtl, and Qvtm
Qpogf Glacial outwash – Similar in texture to Qva and Qvrf. May occur as thin lenses or interbeds within other glacial deposits
Qpogl Glaciolacustrine deposits - Similar in texture to Qvlc
Qpogd Glacial diamict deposits – Matrix supported diamict containing variable amounts of subrounded to well-rounded sand and gravel clasts, glacially transported and deposited in a fine-grained matrix. May occur as lenses within glaciomarine or glaciolacustrine deposits

Final Geotechnical Progress Report: Conveyance
Geotechnical Services 19 August 2003 Brightwater Conveyance System
Table 2: Summary of Borings
Drilling Methodd GW Monitoringe
Boring Number Date Completed
Boring Depth (feet)
Ground Surface
Elevation (feet)a
Northing (feet)b
Easting (feet)b
Drilling Contractorc
HS
MR
WL
RS
OW
VWP
E-101 03/20/2003 140.0 35.0 287,665 1,256,910 CDI X X X E-102 03/06/2003 270.0 195.0 287,620 1,258,050 GDI X X X E-103 03/15/2003 380.0 307.0 287,570 1,259,950 GDI X X X X E-104 04/15/2003 361.5 310.0 287,302 1,262,140 CDI X X E-105 03/03/2003 535.0 454.0 287,354 1,264,060 CDI X E-106 04/22/2003 566.0 486.0 287,270 1,266,094 CDI X X E-107 03/24/2003 548.0 453.0 287,302 1,268,050 CDI X X E-110 04/04/2003 436.0 348.0 286,935 1,274,170 CDI X X X E-111 03/10/2003 385.0 298.0 285,951 1,277,630 CDI X X X E-112 02/28/2003 297.5 215.0 284,594 1,279,060 CDI X X X E-113 03/17/2003 277.0 198.0 284,411 1,281,040 CDI X X E-114 02/24/2003 374.0 296.0 284,375 1,282,590 GDI X X X E-115 02/25/2003 447.0 526.0 284,402 1,285,250 CDI X E-116 02/18/2003 305.0 229.0 284,351 1,287,950 CDI X X X E-117 02/24/2003 341.0 271.0 283,937 1,291,180 CDI X X X E-118 02/08/2003 177.5 107.0 284,071 1,292,310 CDI X X X E-119 02/10/2003 137.5 71.0 283,873 1,294,780 CDI X X E-120 02/03/2003 133.5 67.0 283,829 1,296,040 CDI X X X E-121 04/02/2003 329.0 267.0 283,891 1,299,316 GDI X X X E-122 04/02/2003 167.5 107.0 283,565 1,301,567 CDI X X E-123 03/26/2003 285.8 226.0 283,564 1,303,259 GDI X X E-124 03/28/2003 346.0 289.0 283,440 1,304,620 CDI X X E-125 04/03/2003 116.0 62.0 283,592 1,306,600 CDI X X

Final Geotechnical Progress Report: Conveyance
Geotechnical Services 20 August 2003 Brightwater Conveyance System
Table 2: Summary of Borings (continued)
Drilling Methodd GW Monitoringe
Boring Number Date Completed
Boring Depth (feet)
Ground Surface
Elevation (feet)a
Northing (feet)b
Easting (feet)b
Drilling Contractorc
HS
MR
WL
RS
OW
VWP
E-126 03/26/3003 86.5 30.0 283,449 1,309,290 GDI X X E-201 04/22/2003 242.0 166.4 287,552 1,257,758 CDI X X E-202 05/02/2003 361.0 304.7 287,747 1,259,559 GDI X X E-203 04/28/2003 360.0 298.0 287,457 1,261,560 GDI X X X E-204 05/02/2003 475.0 423.2 287,450 1,263,071 CDI X X E-206 05/06/2003 493.0 480.0 287,120 1,267,325 CDI X X X E-208 05/06/2003 425.0 358.0 287,222 1,270,587 CDI X X X E-210 05/15/2003 340.0 307.8 287,264 1,275,617 CDI X X X E-212 04/28/2003 315.0 269.1 285,118 1,278,053 CDI X X E-213 04/29/2003 278.0 227.2 284,370 1,279,990 CDI X X E-215 04/10/2003 361.0 314.4 284,020 1,286,617 CDI X X E-216 04/10/2003 338.0 294.4 283,937 1,289,596 CDI X X X E-217 04/24/2003 310.0 322.0 283,916 1,290,354 CDI X X E-218 04/16/2003 110.0 69.3 283,858 1,294,034 CDI X X E-219 05/19/2003 320.0 264.4 283,906 1,298,111 CDI X X X E-220 05/05/2003 290.0 234.7 283,888 1,299,977 CDI X X E-224 05/12/2003 100.0 33.4 283,618 1,308,052 GDI X X E-303 05/30/2003 160.0 189.0 284,291 1,281,409 CDI X X E-304 05/14/2003 295.0 243.6 284,243 1,282,100 CDI X X E-323 05/13/2003 330.0 272.6 283,800 1,298,604 CDI X E-339 05/14/2003 270.0 200.1 283,266 1,312,794 CSI X X X E-340 05/22/2003 240.0 168.5 283,254 1,313,340 CDI X X E-341 05/27/2003 220.0 152.5 283,241 1,313,657 CDI X X

Final Geotechnical Progress Report: Conveyance
Geotechnical Services 21 August 2003 Brightwater Conveyance System
Table 2: Summary of Borings (continued)
Drilling Methodd GW Monitoringe
Boring Number Date Completed
Boring Depth (feet)
Ground Surface
Elevation (feet)a
Northing (feet)b
Easting (feet)b
Drilling Contractorc
HS
MR
WL
RS
OW
VWP
E-343 05/10/2003 180.0 114.9 283,279 1,314,600 CDI X X E-349 05/07/2003 200.0 135.4 285,443 1,315,649 CDI X X E-362 05/14/2003 105.0 60.0 280,256 1,296,061 GDI X X E-363 05/22/2003 110.0 60.5 281,172 1,296,011 GDI X X E-364 05/21/2003 115.0 65.1 282,275 1,296,148 GDI X X N-153 02/05/2003 89.5 32.0 279,804 1,291,340 CDI X X N-154 02/07/2003 115.6 52.8 278,662 1,296,030 CDI X X N-253 05/08/2003 76.5 38.7 279,372 1,292,580 GDI X X N-254 05/09/2003 76.0 34.0 278,892 1,294,419 GDI X X N-255 05/13/2003 105.0 57.0 279,887 1,296,046 GDI X X N-256 05/15/2003 105.0 57.1 280,672 1,295,992 GDI X X N-257 05/16/2003 115.0 65.0 281,760 1,296,115 GDI X X N-258 05/19/2003 120.0 66.1 282,666 1,296,155 GDI X X
Notes: a) Vertical datum = NAVD 88, Feet. b) Horizontal datum = NAD83/91, Washington North Zone, U.S. Survey Feet. c) CDI = Cascade Drilling, Inc.; GDI = Gregory Drilling, Inc., CSI = Crux Subsurface Inc. d) HS = Hollow-Stem Auger, MR = Mud Rotary, WL = Wireline, RS = Rotosonic e) OW = Observation Well, VWP = Vibrating Wire Piezometer

Final Geotechnical Progress Report: Conveyance
Geotechnical Services 22 August 2003 Brightwater Conveyance System
Table 3a: Summary of Piezometer Installation and Water Level Data
Date of Water Level Reading Groundwater Range
Boring Number
Ground Surface
Elev. (ft)
VWP Depth
(ft)
VWP Elev. (ft) 2/3/03 3/10/03 3/27/03 3/28/03 4/1/03 4/8/03 4/9/03 4/22/03 5/6/03 5/9/03 5/20/03
Lowest Elev. (ft)
Highest
Elev. (ft)
Range
(ft)
E-102 194.8 260 -65.2 8.5 8.3 8.2 8.5 8.5 6.2 5.6 5.6 8.5 3.0 E-103 307.0 153 154 253.8 254.0 254.3 253.8 254.3 0.5
E-104 (S) 304.9 275 29.9 72.6 72.6 72.7 72.6 72.7 0.1 E-104 (D) 304.9 361 -56.1 16.5 13.8 12.5 12.5 16.5 4.0 E-107 (S) 452.6 371 81.6 228.7 228.7 228.3 228.3 227.8 227.9 227.8 228.7 0.9 E-107 (D) 452.6 511 -58.4 230.1 229.7 229.0 228.7 228.3 228.2 228.2 230.1 1.9 E-110 (S) 348.1 319 29.1 201.7 201.1 201.0 201.0 201.7 0.7 E-110 (D) 348.1 393 -44.9 177.5 176.8 176.6 176.6 177.5 0.9
E-111 298.1 130 168.1 263.0 263.1 262.8 262.8 262.8 262.9 262.8 263.1 0.3 E-112 214.7 255 -40.3 211.0 209.4 208.4 208.3 207.7 207.4 207.2 207.2 211.0 3.9
E-113 (S) 198.4 78 120.4 222.7 221.8 222.2 221.7 221.7 221.7 222.7 1.0 E-113 (D) 198.4 179 19.4 204.6 203.9 204.1 203.8 203.6 203.6 204.6 1.0
E-114 296.1 332.0 -35.9 206.6 206.8 206.3 206.1 206.1 206.2 206.1 206.8 0.7 E-116 229.4 68.0 161.4 219.3 221.1 220.5 220.1 219.5 219.0 219.0 221.1 2.2 E-117 270.9 210.5 60.4 137.2 137.8 137.6 137.6 137.7 137.8 137.2 137.8 0.7 E-118 107.2 140.0 -32.8 105.3 123.3 124.1 123.7 123.6 123.5 123.5 105.3 124.1 18.9
E-119 (S) 71.1 71.0 0.1 79.0 79.2 78.8 78.7 78.6 78.6 79.2 0.6 E-119 (D) 71.1 117.0 -45.9 85.5 85.9 85.6 85.7 85.6 85.5 85.9 0.3
E-120 66.7 64.5 2.2 68.1 69.2 68.5 68.7 68.4 68.2 68.3 68.1 69.2 1.1 E-121 266.9 161 105.9 184.8 185.1 185.2 185.5 184.8 185.5 0.7
E-122 (S) 115.0 58 57 135.3 127.2 121.3 119.7 119.7 135.3 15.7 E-122 (D) 115.0 140 -25 117.3 117.8 117.2 116.6 116.6 117.8 1.2
E-123 225.7 246 -20.3 188.5 188.5 188.5 NA E-125 (S) 62.0 25 37 48.1 48.0 48.0 48.1 0.1 E-125 (D) 62.0 78 -16 56.3 56.9 56.3 56.9 0.5
E-126 34.0 74 -40 21.7 21.6 21.8 22.3 21.6 22.3 0.7 E-130 227.3 288.0 -60.7 134.8 135.3 134.9 134.4 134.3 134.3 135.3 1.1

Final Geotechnical Progress Report: Conveyance
Geotechnical Services 23 August 2003 Brightwater Conveyance System
Table 3a: Summary of Piezometer Installation and Water Level Data (continued)
Date of Water Level Reading Groundwater Range
Boring Number
Ground Surface
Elev. (ft)
VWP Depth
(ft)
VWP Elev. (ft) 2/3/03 3/10/03 3/27/03 3/28/03 4/1/03 4/8/03 4/9/03 4/22/03 5/6/03 5/9/03 5/20/03
Lowest Elev. (ft)
Highest
Elev. (ft)
Range
(ft)
E-203 298.0 298.0 3.8 2.8 2.8 3.8 1.0 E-204 423.2 423.2 70.2 70.2 70.2 NA E-206 480.1 480.1 218.8 218.8 218.8 NA E-208 357.6 357.6 146.0 146.0 146.0 NA
E-210 (S) 306.5 197 109.5 247.1 247.1 247.1 NA E-210 (D) 306.5 327 -20.5 154.0 154.0 154.0 NA
E-212 269.1 192 77.1 262.0 364.1 262.0 364.1 102.2 E-213 227.2 85 142.2 237.4 236.6 236.6 237.4 0.8
E-215 (S) 314.4 314.4 230.7 224.3 231.0 224.3 231.0 6.7 E-215 (D) 314.4 314.4 163.7 169.4 162.7 162.7 169.4 6.8
E-216 294.4 294.4 121.9 121.9 121.9 121.9 121.9 0.0 E-304 (S) 243.6 245.4 245.4 245.4 NA E-304 (D) 208.3 208.3 208.3 NA E-339 (S) 200.0 75.2 75.2 75.2 NA E-339 (D) 106.5 106.5 106.5 NA
N-152 70.8 65 5.8 58.1 59.1 58.6 58.6 58.4 58.2 58.1 59.1 1.1 N-154 52.8 115 -62.2 37.4 38.4 37.8 37.3 37.1 37.1 38.4 1.3 N-256 57.1 57.145 37.2 37.2 37.2 NA
N-258 66.1 66.138 66.9 66.9 66.9 NA
(S) Shallower Installation (D) Deeper Installation

Final Geotechnical Progress Report: Conveyance
Geotechnical Services 24 August 2003 Brightwater Conveyance System
Table 3b: Summary of Well Installation and Water Level Data
Date of Water Level Reading Groundwater Range
Boring Number
Ground Surface Elev. (ft)
Depth to Bottom
of Screen
(ft) 3/3/03 3/10/03 3/27/03 3/28/03 4/1/03 4/8/03 4/9/03 4/22/03 5/6/03 5/20/03
Lowest Elev. (ft)
Highest Elev. (ft)
Range (ft)
E-101 35.0 131 8.4 7.7 5.6 5.6 8.4 2.8
E-102 194.8 195 59.7 60.0 60.2 60.1 60.2 59.7 60.2 0.5
E-103 307.0 340 122.3 104.3 94.3 94.3 122.3 28.0
E-106 485.5 429 156.1 157.1 156.1 157.1 1.0
E-110 348.1 200 249.7 245.2 245.2 249.7 4.5
E-111 298.1 353 174.7 177.0 177.3 177.2 174.7 177.3 2.6
E-112 214.7 95 217.9 223.9 221.6 222.4 217.9 223.9 6.0
E-114 296.1 190 259.5 255.0 262.3 257.8 256.0 255.3 255.3 255.0 262.3 7.3
E-116 229.4 243.5 124.1 124.4 124.8 124.8 124.9 124.9 124.1 124.9 0.8
E-117 270.9 282.5 135.9 136.1 136.4 136.4 136.4 135.9 136.4 0.5
E-118 107.2 97 107.2 107.2 107.2 107.2 NA
E-120 66.7 132.5 66.7 69.5 66.7 69.5 2.8
E-121 266.9 281 117.3 117.3 117.1 117.1 117.3 0.3
E-123 225.7 126 143.7 143.7 143.7 NA
E-126 34.0 30 27.6 27.6 27.5 27.5 27.6 0.1
E-129 260.4 285 130.5 130.9 130.2 130.1 130.4 130.1 130.9 0.8
E-130 227.3 160 148.3 - 148.3 148.3 NA
E-201 166.5 235 8.3 8.3 8.3 NA
E-202 309.1 340 33.0 33.0 33.0 NA
E-203 298.0 133 269.7 269.2 269.2 269.7 0.5
E-206 471.8 406 248.8 248.8 248.8 NA
E-208 357.6 252 225.7 225.7 225.7 NA

Final Geotechnical Progress Report: Conveyance
Geotechnical Services 25 August 2003 Brightwater Conveyance System
Table 3b: Summary of Well Installation and Water Level Data (continued)
Date of Water Level Reading Groundwater Range
Boring Number
Ground Surface Elev. (ft)
Depth to Bottom
of Screen
(ft) 3/3/03 3/10/03 3/27/03 3/28/03 4/1/03 4/8/03 4/9/03 4/22/03 5/6/03 5/20/03
Lowest Elev. (ft)
Highest Elev. (ft)
Range (ft)
E-216 297.0 222 141.0 141.3 141.0 141.0 141.3 0.4
E-217 322.6 290 244.4 244.4 244.4
E-218 63.9 89 79.4 79.4 79.4 79.4 NA
E-219 264.4 240 193.7 193.7 193.7 NA
E-220 234.7 243 119.0 119.0 119.0 NA
E-343 114.9 69 163.2 163.2 163.2 NA
E-349 135.4 75 122.1 122.1 122.1 NA
E-362 60.0 90 44.9 44.9 44.9 NA
N-153 35.5 89.5 25.3 26.0 26.1 26.2 26.1 25.3 26.2 0.9
N-253 38.7 48 21.8 21.8 21.8 NA
N-254 34.0 44 19.3 19.3 19.3 NA

Final Geotechnical Progress Report: Conveyance
Geotechnical Services 26 August 2003 Brightwater Conveyance System
Table 4: Summary of Index Testing Results
Boring Number
Top Depth(feet)
Water Content
(%)
Dry Density
(pcf)
Wet Density
(pcf) %
Gravel%
Sand%
FinesLiquid Limit,
LL
Plastic Limit,
PL
Plasticity Index
PI
E-101 20 18.7 3.3 86.2 10.5 E-101 40 30 60 10 E-101 55 23.3 41.5 E-101 70 22.3 32.6 E-101 80 8.3 58.9 38.1 3 E-101 107.1 11.1 33.9 59.8 6.4 E-101 139 13.4 3.5 84.9 11.6 E-102 190 17.9 1.7 88.7 9.6 E-102 225 16.9 0.8 87.5 11.7 E-102 235 22.4 55.7 E-103 160 25.5 82.9 E-103 325 10 4.1 87.2 8.7 E-103 361 24.5 72.7 E-104 231 26.5 47.9 29.2 18.7 E-105 324 32.1 50.3 26.5 23.8 E-105 351 21.9 36.5 28.9 7.6 E-105 367 25.3 E-105 383 34 77.7 32.2 45.5 E-105 404 21.4 E-105 413 12.9 50 E-105 425 17.9 0.3 52.7 47 E-105 431 16.3 48.3 E-105 461 14.7 0.4 87.3 12.3 E-105 502 17.6 0.5 78.8 20.8 E-107 335 35.1 68.6 33.9 34.7 E-107 353 16.7 28.1 20.6 7.5 E-107 380 19.7 0.9 92.4 6.7 E-107 382 20.3 0 28.7 71.3 E-107 389 19.4 E-107 398.5 17.5 0.6 92 7.4 E-107 434 18.1 7.1 E-107 478 20.6 0 93.8 6.2 E-107 508 18.3 0 87.9 12.1 E-107 541.5 20.9 0 96.6 3.4 E-110 218 31.9 85.2 E-110 229 26.8 51.8 26.2 25.6 E-110 260 13.6 128.8 146.3 E-110 287 31.5 45.8 22.7 23.1 E-110 315 34.3 E-110 318.5 33.4 E-110 322 20.8 E-111 80.5 21.4 E-111 131.5 19.7

Final Geotechnical Progress Report: Conveyance
Geotechnical Services 27 August 2003 Brightwater Conveyance System
Table 4: Summary of Index Testing Results (continued)
Boring Number
Top Depth(feet)
Water Content
(%)
Dry Density
(pcf)
Wet Density
(pcf) %
Gravel%
Sand%
FinesLiquid Limit,
LL
Plastic Limit,
PL
Plasticity Index
PI
E-111 137 12.2 E-111 233 29.1 E-111 322.5 35.2 E-112 33.5 28.4 E-112 35 21.2 E-112 45 20.9 E-112 61 26 E-112 65 18.6 E-112 71 26.8 E-112 75 18.2 E-112 81.5 27.7 E-112 85 0.6 E-112 86 12 E-112 95 8.4 E-112 98.5 11.7 E-112 100 13.2 E-112 110 14.4 E-112 120 12.8 E-112 125 14.2 72.5 27.2 45.3 E-112 131 10 E-112 135 12.4 E-112 140 8.8 E-112 140.1 21.7 E-112 140.6 12.8 E-112 145 10.3 E-112 146.5 30.9 E-112 150 9.2 E-112 155 17.3 E-112 165 8.8 E-112 175 13.4 E-112 182 20.2 E-112 185 17 E-112 189.5 16.9 E-112 192.5 13.1 E-112 197.5 18.4 43.3 19.4 23.9 E-112 202 15.6 E-112 212.5 16 E-112 213.5 26.9 E-112 215 22.8 E-112 226 32.3 E-112 232.5 31.3 70.9 28.4 42.5 E-112 256.5 30.4 E-112 263.5 29.7

Final Geotechnical Progress Report: Conveyance
Geotechnical Services 28 August 2003 Brightwater Conveyance System
Table 4: Summary of Index Testing Results (continued)
Boring Number
Top Depth(feet)
Water Content
(%)
Dry Density
(pcf)
Wet Density
(pcf) %
Gravel%
Sand%
FinesLiquid Limit,
LL
Plastic Limit,
PL
Plasticity Index
PI
E-112 265 30.3 46.7 24.9 21.8 E-112 276 25.6 E-112 284 27.8 E-112 285 29.7 E-112 288 26.6 E-112 296 28.1 E-113 28 6.9 4.6 58.6 36.9 E-113 45 8 12.6 48.4 39.1 E-113 72.5 7.1 14 53.8 32.3 E-113 77 11.2 35.2 E-113 99 9.2 16.3 59.2 24.6 E-113 112 14.9 E-113 121.5 16.9 E-113 127 11.7 E-113 132.5 19.2 E-113 137 26.3 E-113 188 16.1 E-113 192 13.5 38.6 24.4 14.2 E-113 197 14.3 34.2 18.2 16 E-113 202 14.3 E-113 207 13.5 E-113 212 13.5 E-113 217 15.7 30.3 18.3 12 E-113 220 14.2 E-113 222 13.3 E-113 225 15.3 E-113 227 14.5 E-113 230 14.3 E-113 232 14.1 E-113 236 14.3 E-113 239 24.1 62.8 24 38.8 E-113 243 26.3 E-113 248 13.7 E-113 253.5 23.8 E-113 255.5 24.7 E-113 258 23.3 47 22.5 24.5 E-113 263 23.3 E-113 269 23.8 E-113 274 32.8 53.3 24.9 28.4 E-113 275 23.4 E-114 60 17.4 E-114 80 15.6 E-114 100 21.3

Final Geotechnical Progress Report: Conveyance
Geotechnical Services 29 August 2003 Brightwater Conveyance System
Table 4: Summary of Index Testing Results (continued)
Boring Number
Top Depth(feet)
Water Content
(%)
Dry Density
(pcf)
Wet Density
(pcf) %
Gravel%
Sand%
FinesLiquid Limit,
LL
Plastic Limit,
PL
Plasticity Index
PI
E-114 120 16.6 E-114 140 14.9 55.6 E-114 145 19.2 E-114 175 20.9 40.9 E-114 185 16.8 4.8 E-114 200 10.3 128.9 142.2 27.1 18.2 8.9 E-114 205 15.5 E-114 210 13.1 E-114 215 16.5 E-114 220 11.7 122.1 136.5 E-114 225 22.4 E-114 230 20.5 E-114 235 24.5 46.7 22 24.7 E-114 240 24.9 E-114 260 17.2 109.5 128.3 E-114 265 22 E-114 270 24.9 E-114 275 25.3 E-114 280 16.4 109.9 128.0 E-114 290 27.8 E-114 300 41 E-114 305 28.8 72.8 25.3 47.5 E-114 310 16 110.4 128.0 E-114 315 20.3 64.3 24.8 39.5 E-114 322.5 23.6 89.5 110.6 E-114 327 25.2 E-114 332.5 19 E-114 335 14.5 E-114 337.5 19.6 E-114 342.5 16.8 E-114 345 13.2 E-114 347.5 13.7 E-114 350 17.9 29.3 17.1 12.2 E-114 357.5 17.1 E-114 367.5 21.8 99.4 E-114 372.5 19 E-115 126.5 7.5 0 89.5 10.5 E-115 213 22.9 E-115 221 24.5 41.4 25.7 15.7 E-115 229 23.8 E-115 233 35.5 53.7 32.3 21.4 E-115 246 29.4 E-115 254 34.6 50.8 25.5 25.3

Final Geotechnical Progress Report: Conveyance
Geotechnical Services 30 August 2003 Brightwater Conveyance System
Table 4: Summary of Index Testing Results (continued)
Boring Number
Top Depth(feet)
Water Content
(%)
Dry Density
(pcf)
Wet Density
(pcf) %
Gravel%
Sand%
FinesLiquid Limit,
LL
Plastic Limit,
PL
Plasticity Index
PI
E-115 259 25.4 E-115 269 26 34.4 19.1 15.3 E-115 279 38.8 E-115 284 24.7 E-115 294 21.2 E-115 300 26 E-115 319 15.8 0 92.3 7.7 E-115 394 6.8 26.3 66.1 7.6 E-115 411 4.9 70.9 21.2 8 E-115 434 7.2 43.6 43.3 13.1 E-116 20 12.5 18.5 55.2 26.3 E-116 37 12 E-116 51.5 13.5 E-116 70 15.6 E-116 78 16.4 E-116 90 27.7 63.4 26.5 36.9 E-116 100 19.2 E-116 110 29.8 E-116 120 19.2 39.1 21 18.1 E-116 130 18.6 E-116 140 17.2 E-116 155 21.5 55.7 22.9 32.8 E-116 162 33.1 E-116 170 28.2 35 16.5 18.5 E-116 180 31.7 76.9 30.3 46.6 E-116 185 18.3 E-116 196 18.5 56.1 21.6 34.5 E-116 207 30.3 59.3 28.4 30.9 E-116 230 27.4 E-116 242 20.3 1.9 72.1 26 E-116 260 19.9 31.2 22.1 9.1 E-116 268 20.1 25.6 20.5 5.1 E-117 183 6.1 38 52.9 9.2 E-117 208 3.1 69.7 26.5 3.8 E-117 228 29.3 36.3 26.3 10 E-117 258 8.1 12.9 38.8 48.3 E-117 275 18.7 0 87 13 E-117 306.5 E-117 313 22.3 32.6 23 9.6 E-118 16.8 13.5 E-118 22 18.4 E-118 28 19 E-118 38 22.9

Final Geotechnical Progress Report: Conveyance
Geotechnical Services 31 August 2003 Brightwater Conveyance System
Table 4: Summary of Index Testing Results (continued)
Boring Number
Top Depth(feet)
Water Content
(%)
Dry Density
(pcf)
Wet Density
(pcf) %
Gravel%
Sand%
FinesLiquid Limit,
LL
Plastic Limit,
PL
Plasticity Index
PI
E-118 40 21 E-118 48 20.2 E-118 55 9.5 E-118 56.5 9.5 32.5 23.1 9.4 E-118 73.5 15.5 0.8 87.1 12.1 E-118 83 15.6 43.9 24.8 19.1 E-118 95 21.4 E-118 100 22.7 45.1 24.2 20.9 E-118 101 24.5 51 27.5 23.5 E-118 106.5 28.5 45.6 24.1 21.5 E-118 112 28.4 43.6 24.4 19.2 E-118 126 0.4 66.5 31.6 2 E-118 138 10.7 E-118 150 5.1 38.9 37 24.1 E-118 153 9 E-118 158 19 E-118 161 9.1 27.9 48.7 23.5 E-118 167.5 11.9 18.7 67.1 14.3 E-118 170 15.6 E-119 44 8.6 19.1 43.1 37.9 E-119 65 10.1 5 36.3 58.7 E-119 73.5 13.7 0.7 20.2 79.1 E-119 76 11.9 E-119 83 15.1 E-119 93.5 10.5 8.3 38 53.8 E-119 108 21.6 E-119 113 20.5 E-119 128 5.9 41.6 51.6 6.9 E-120 10 10.1 121.5 133.8 E-120 15 8.9 124.0 135.1 E-120 20 11.6 121.9 136.0 E-120 25 10.8 E-120 30 10.6 17.6 64.8 17.5 E-120 35 13.5 E-120 40 15.1 110.8 127.5 E-120 45 20.9 E-120 50 23.6 E-120 55 14.1 109.5 125.0 E-120 60 18.5 E-120 62.5 21.3 E-120 65 18.9 E-120 70 22.3 0.2 59.6 40.3 E-120 75 21.4

Final Geotechnical Progress Report: Conveyance
Geotechnical Services 32 August 2003 Brightwater Conveyance System
Table 4: Summary of Index Testing Results (continued)
Boring Number
Top Depth(feet)
Water Content
(%)
Dry Density
(pcf)
Wet Density
(pcf) %
Gravel%
Sand%
FinesLiquid Limit,
LL
Plastic Limit,
PL
Plasticity Index
PI
E-120 80 11.1 E-120 82.5 23.1 E-120 87.5 20.6 1.4 84.7 13.9 E-120 92.5 22.2 E-120 97.5 20.1 0.5 84.2 15.3 E-120 102.5 18.4 0.3 97.5 2.2 E-120 107.5 5 E-120 115 1.7 E-120 117.5 8.7 42.6 53.4 4 E-120 127.5 19 E-120 132.5 24 E-121 275 20.7 46.9 E-121 282 25.1 60.2 30.7 29.5 E-121 299 28.6 53.5 24.2 29.3 E-122 118 19.7 45.7 19.8 25.9 E-122 128 20.7 49.8 20.8 29 E-122 131 22.5 46.8 20.2 26.6 E-122 136 21.9 0.2 96 3.8 E-122 146 22 39.3 17.3 22 E-122 155 27.5 59.6 24 35.6 E-123 140 8.8 51.4 44 4.6 E-123 230 13.5 40.6 18.2 22.4 E-123 265 17.8 0 86.6 13.4 E-124 269 14.6 43.8 17.1 39.1 E-124 279 10.2 29.5 E-124 285 14 7.7 16.7 75.6 E-124 295 20.4 E-124 309 14.9 41.8 21 20.8 E-124 317 29.3 0 0 E-124 326 19.8 30.6 16.4 14.2 E-124 337.5 14 43.8 E-125 54 4.3 44.5 37.2 18.4 E-125 60 7.4 30.2 43.1 26.8 E-125 74 10.7 41 54.5 4.5 E-125 79 7 52 37.9 10.2 E-125 86 22.9 26.1 19.1 7 E-125 92 20.7 55.7 E-125 110 18.4 98.3 E-130 45 20.6 E-130 65 24.4 E-130 85 19.9 E-130 100 22.5 E-130 120 13.8

Final Geotechnical Progress Report: Conveyance
Geotechnical Services 33 August 2003 Brightwater Conveyance System
Table 4: Summary of Index Testing Results (continued)
Boring Number
Top Depth(feet)
Water Content
(%)
Dry Density
(pcf)
Wet Density
(pcf) %
Gravel%
Sand%
FinesLiquid Limit,
LL
Plastic Limit,
PL
Plasticity Index
PI
E-130 137.5 25.5 E-130 140 32.7 E-130 150 23.6 E-130 155 21.6 6.6 E-130 175 23.9 E-130 195 21.4 E-130 200 24.1 49 E-130 205 25 E-130 220 24.1 E-130 230 15.3 E-130 245 24.2 E-130 250 25.8 E-130 252.5 25.1 E-130 255 24.4 44.2 22.8 21.4 E-130 265 25.7 E-130 275 23.4 42.7 23.6 19.1 E-130 290.5 24.7 E-130 295 22 37.7 20.4 17.3 N-151 47 23.4 0 97.9 2.2 N-151 79 21.7 0 66.9 33.1 N-151 88 23.6 0.1 49 50.9 N-151 95 10.4 30.5 66.8 2.7 N-152 10 13.7 119.1 135.4 N-152 30 9.1 111.4 121.5 N-152 50 2.4 N-152 77 19.5 32 18.7 13.3 N-152 83 24 N-152 95 25.6 N-152 115 9.8 N-153 11.5 9.9 40.2 56.1 3.7 N-153 20 15.9 N-153 25 20.3 N-153 37.5 25.5 0 61.1 38.9 N-153 42.5 25.3 N-153 52.5 22.3 N-153 57.5 5.5 62.6 36.4 1 N-153 62.5 12 31.3 60.8 8 N-153 77.5 3 0 53.3 46.7 N-154 40 9 25.8 51.4 22.8 N-154 50 6.3 N-154 57.3 15 19.8 55.5 24.7 N-154 70 7.4 N-154 85 21.5 0 19.1 80.9

Final Geotechnical Progress Report: Conveyance
Geotechnical Services 34 August 2003 Brightwater Conveyance System
Table 4: Summary of Index Testing Results (continued)
Boring Number
Top Depth(feet)
Water Content
(%)
Dry Density
(pcf)
Wet Density
(pcf) %
Gravel%
Sand%
FinesLiquid Limit,
LL
Plastic Limit,
PL
Plasticity Index
PI
N-154 87.5 18.3 0 89.5 10.6 N-154 105 19.6 0.4 91.9 7.8 E-201 22 22.9 E-201 27 26.3 E-201 34 31.4 E-201 38 21.6 E-201 45 28.4 E-201 53 35.9 E-201 75 24.6 E-201 94 22.5 E-201 97 29.4 E-201 105 34.7 E-201 119 24 E-201 192 17.3 E-201 195 56 E-201 199 22.7 E-201 202 22.5 E-201 208 26.3 E-201 216 21.3 E-203 140 21.5 100.3 121.9 E-203 160 18.8 101.1 120.4 E-203 180 17.3 106.9 125.4 E-203 202 51 E-203 210 28 E-203 220 36.4 E-203 230 27.8 E-203 240 27.2 E-215 235 27.7 47.9 24.4 E-215 235.5 8.8 E-215 240 21 48.5 23.8 24.7 E-215 244 19.9 E-215 249 25.4 E-215 256 17.3 E-215 263 16.8 E-215 267 17.3 E-215 271 20.8 E-215 278 22.2 E-215 282 21.1 67.9 E-215 283 23.3 E-215 288 20.6 E-215 291 26.4 49.8 26.2 23.6 E-215 292 25.9 E-215 298 21.9

Final Geotechnical Progress Report: Conveyance
Geotechnical Services 35 August 2003 Brightwater Conveyance System
Table 4: Summary of Index Testing Results (continued)
Boring Number
Top Depth(feet)
Water Content
(%)
Dry Density
(pcf)
Wet Density
(pcf) %
Gravel%
Sand%
FinesLiquid Limit,
LL
Plastic Limit,
PL
Plasticity Index
PI
E-215 303 16.8 E-215 306 30.4 E-215 310 32.8 59.9 31.8 28.1 E-215 311 28.4 E-215 316 33.9 E-215 324 29.8 E-215 327 32.7 E-215 331 31.8 E-215 335 29.4 48.8 26.8 22 E-215 339 34.3 E-215 342 34.3 E-215 345 30.3 E-215 351 28.5 E-215 357 27.4 E-216 188 24.4 E-216 190 35.8 E-216 196 41.6 E-216 255 26.1 E-216 303 24.7 E-216 310 26.5 E-216 315 21 E-216 323 24.1 E-216 335 25.1 E-217 56 24.9 E-217 96 28.6 E-217 116 37.4 E-217 236 25.1

Final Geotechnical Progress Report: Conveyance
Geotechnical Services 36 August 2003 Brightwater Conveyance System
Table 5: Summary of Unconfined Compressive Strength Testing
Boring Number Sample Depth (feet BGS)
Unconfined Compressive Strength (psf)
Strain at Failure (%)
Failure Plane Angle (Degrees from Horizontal)
E-110 260 11,531 3.11 50
E-112 232.5 4,650 2.3 37
E-112 265 5,529 5.3 70/75
E-114 235 15,983 7.6 55
E-114 315 9,256 14.9 60
E-114 352.5 10,701 7.4 75
E-114 367.5 2,640 3.4 70
E-118 101 9,704 5.19 85
E-130 195 3,021 6.1 70
E-130 205 6,453 5.7 NR
E-130 255 11,602 10.2 70
E-130 275 11,978 9.2 65
E-130 290.5 1,609 4.6 46/72
E-223 200.0 9,400 3.14 65
E-223 200.5 4,775 2.84 80
E-322 286.4 11,302 1.7 80
E-322 287.4 18,791 3.0 80
E-322 288.2 21,881 2.6 80

Final Geotechnical Progress Report: Conveyance
Geotechnical Services 37 August 2003 Brightwater Conveyance System
Table 6: Summary of Gas Monitoring Data
Boring Number Date Time
Boring Depth
(ft)
Casing Depth
(ft)
Top of Screen Depth
Bottom of
Screen Depth
(ft)
Sample Type Methane (% ) CO (%) O2 (%) H2S
(ppm)
E-101 05/06/2003 NR 140 0 121 131 Standpipe 0.1 NR NR NR E-101 05/20/2003 NR 140 0 121 131 Standpipe 0.1 NR NR NR E-102 05/06/2003 NR 270 0 185 195 Standpipe 0.1 NR NR NR E-102 05/20/2003 NR 270 0 185 195 Standpipe 0.2 NR NR NR E-103 05/06/2003 NR 380 0 320 340 Standpipe 0.1 NR NR NR E-103 05/20/2003 NR 380 0 320 340 Standpipe 0.1 NR NR NR E-106 05/06/2003 NR 566 0 419 429 Standpipe 0.0 NR NR NR E-106 05/20/2003 NR 566 0 419 429 Standpipe 0.2 NR NR NR E-110 04/22/2003 NR 438 0 190 200 Standpipe 0.1 NR NR NR E-110 05/06/2003 NR 438 0 190 200 Standpipe 0.2 NR NR NR E-110 05/20/2003 NR 438 0 190 200 Standpipe 0.2 NR NR NR E-111 04/22/2003 NR 385 0 343 353 Standpipe 0.1 NR NR NR E-111 05/06/2003 NR 385 0 343 353 Standpipe 0.2 NR NR NR E-111 05/20/2003 NR 385 0 343 353 Standpipe 0.2 NR NR NR E-114 04/22/2003 NR 374 0 180 190 Standpipe 2.6 NR NR NR E-114 05/06/2003 NR 374 0 180 190 Standpipe 2.2 NR NR NR E-114 05/20/2003 NR 374 0 180 190 Standpipe 0.2 NR NR NR E-116 04/22/2003 NR 305 0 233.5 243.5 Standpipe 0.1 NR NR NR E-116 05/06/2003 NR 305 0 233.5 243.5 Standpipe 0.1 NR NR NR E-116 05/20/2003 NR 305 0 233.5 243.5 Standpipe 0.1 NR NR NR E-117 04/22/2003 NR 341 0 272.5 282.5 Standpipe 0.1 NR NR NR E-117 05/06/2003 NR 341 0 272.5 282.5 Standpipe 0.1 NR NR NR E-121 04/22/2003 NR 329 0 271 281 Standpipe 0.2 NR NR NR E-121 05/06/2003 NR 329 0 271 281 Standpipe 0.0 NR NR NR E-121 05/20/2003 NR 329 0 271 281 Standpipe 0.1 NR NR NR E-123 05/20/2003 NR 286 0 116 126 Standpipe 0.2 NR NR NR

Final Geotechnical Progress Report: Conveyance
Geotechnical Services 38 August 2003 Brightwater Conveyance System
Table 6: Summary of Gas Monitoring Data (continued)
Boring Number Date Time
Boring Depth
(ft)
Casing Depth
(ft)
Top of Screen Depth
Bottom of
Screen Depth
(ft)
Sample Type Methane (% ) CO (%) O2 (%) H2S
(ppm)
E-126 04/22/2003 NR 86 0 20 126 Standpipe 0.2 NR NR NR E-126 05/06/2003 NR 86 0 20 126 Standpipe 0.0 NR NR NR E-126 05/20/2003 NR 86 0 20 126 Standpipe 0.2 NR NR NR E-129 04/22/2003 NR 335 0 275 285 Standpipe 0.1 NR NR NR E-129 05/06/2003 NR 335 0 275 285 Standpipe 0.1 NR NR NR E-129 05/20/2003 NR 335 0 275 285 Standpipe 0.2 NR NR NR E-201 05/20/2003 NR 242 0 225 235 Standpipe 0.1 NR NR NR E-202 05/20/2003 NR 361 0 330 340 Standpipe 0.1 NR NR NR E-203 05/06/2003 NR 360 0 123 133 Standpipe 0.0 NR NR NR E-203 05/20/2003 NR 360 0 123 133 Standpipe 0.2 NR NR NR E-206 05/20/2003 NR 493 0 396 406 Standpipe 0.2 NR NR NR E-208 05/20/2003 NR 425 0 242 252 Standpipe 0.2 NR NR NR E-216 04/22/2003 NR 338 0 212 222 Standpipe 0.1 NR NR NR E-216 05/06/2003 NR 338 0 212 222 Standpipe 0.1 NR NR NR E-216 05/20/2003 NR 338 0 212 222 Standpipe 0.1 NR NR NR E-217 05/06/2003 NR 310 0 280 290 Standpipe 0.1 NR NR NR E-217 05/20/2003 NR 310 0 280 290 Standpipe 0.1 NR NR NR E-219 05/20/2003 NR 320 0 229 239 Standpipe 0.1 NR NR NR E-220 05/20/2003 NR 290 0 233 243 Standpipe 0.2 NR NR NR E-311 06/04/2003 15:28 20 20 No Well No Well Bag/Soil 0 0 0 0 E-311 06/04/2003 15:33 59.3 59.3 No Well No Well Casing Break 0.1 0 19.6 0 E-311 06/04/2003 15:57 64.3 64.3 No Well No Well Casing Break 0.25 0 0 0 E-311 06/04/2003 15:59 64.3 64.3 No Well No Well Casing Break 0 0 0 0 E-311 06/05/2003 10:45 102.1 No Well No Well ? 0 0 20.8 0 E-311 06/05/2003 10:45 102.1 No Well No Well ? 0 0 20.9 0 E-311 06/05/2003 11:30 112.1 No Well No Well ? 0 0 20.8 0

Final Geotechnical Progress Report: Conveyance
Geotechnical Services 39 August 2003 Brightwater Conveyance System
Table 6: Summary of Gas Monitoring Data (continued)
Boring Number Date Time
Boring Depth
(ft)
Casing Depth
(ft)
Top of Screen Depth
Bottom of
Screen Depth
(ft)
Sample Type Methane (% ) CO (%) O2 (%) H2S
(ppm)
E-311 06/05/2003 12:32 66.1 63.6 No Well No Well Casing Break 0.75 0 19.6 0 E-311 06/05/2003 12:38 66.1 63.6 No Well No Well Casing Break 0.3 0 20.6 0 E-311 06/05/2003 13:18 67.1 63.6 No Well No Well Casing Break 0 0 20.7 0 E-311 06/05/2003 13:20 117.1 No Well No Well ? 0 0 20.8 0 E-311 06/05/2003 13:57 67.1 63.6 No Well No Well Casing Break 0.4 0 0 0 E-311 06/05/2003 14:42 72.1 63.6 No Well No Well ? 0 0 0 0 E-311 06/05/2003 14:42 72.1 63.6 No Well No Well ? 1.25 0 0 0
E-311 06/05/2003 15:25 92.1 No Well No Well Bagged Sample 0 0 20.8 0
E-311 06/05/2003 15:25 119.3 No Well No Well Bagged Sample 0 0 20.8 0
E-311 06/06/2003 7:40 77.1 63.6 No Well No Well Tedlar Bag 0.4 0 19.8 0 E-311 06/06/2003 8:04 77.1 63.6 No Well No Well Casing Break 0 0 19.4 0 E-311 06/06/2003 8:04 77.1 63.6 No Well No Well Casing Break 0.3 0 NR 0 E-311 06/06/2003 8:04 77.1 63.6 No Well No Well Casing Break 2.25 0 19.2 0 E-311 06/06/2003 8:04 77.1 63.6 No Well No Well Casing Break 2 0 0 0 E-311 06/06/2003 8:28 82.1 63.6 No Well No Well Casing Break 0 0 20.8 0 E-311 06/06/2003 8:28 82.1 63.6 No Well No Well Casing Break 0 0 20.6 0 E-311 06/06/2003 9:02 87.1 63.6 No Well No Well Casing Break 0 0 0 0 E-311 06/06/2003 9:02 87.1 63.6 No Well No Well Casing Break 0 0 0 0 E-343 05/20/2003 NR 180 0 59 69 ? 0.3 E-349 05/20/2003 NR 200 0 65 75 ? 0.2 E-362 05/20/2003 NR 105 0 80 90 ? 0.1 N-153 05/06/2003 NR 89.5 0 79 89 ? 0.0
NOTES: NR - Not read a) Assumes methane LEL equal to 5% methane by volume
1+00
25+00 50+0075+00 100+00 125+00
150+00175+00 200+00
BH-3
MW-4
MW-5
MW-6
MW-19
E101E201
E102E202
E103
E203 E104 E204E105
E106 E107E208
E110E210
E111
PORTAL 5
PORTAL 19
N
Figure 1
BRIGHTWATER REGIONALWASTEWATER TREATMENT SYSTEM
King County
Wastewater TreatmentDivision
Department ofNatural Resources and Parks
0 400 800 Feet
May 2003
Effluent Alignment Plan (Part 1)The information included on this map has been compiled from a variety of sources and is subject to change without notice. King County makes no representations or warranties, express or implied, as to accuracy, completeness, timeliness, or rights to the use of such infromation. King county shall not be liable for any general, special, indirect, incidental, or consequential damages including, but not limited to, lost revenues or lost profits resulring from the use or misuse of the information contained on this map.any sale of this map or information on this map is prohibited except by written permission of King County.
Data Sources: CDM
File Name: plan800a.dwg

400+
00
413+
80.78
175+00 200+00
225+00
250+00275+00
300+00325+00
350+00 375+00400+00
425+00
MW-6
MW-7
MW-14
MW-15
E110E210
E111
E212
E112
E213
E113E303
E304
E114 E115
E215
E116
E216 E217 E117
E118
E218 E119 E120
E323E121
E364
N258
PORTAL 44
PORTAL 5
Figure 2
BRIGHTWATER REGIONALWASTEWATER TREATMENT SYSTEM
King County
Wastewater TreatmentDivision
Department ofNatural Resources and Parks
Effluent Alignment Plan (Part 2)The information included on this map has been compiled from a variety of sources and is subject to change without notice. King County makes no representations or warranties, express or implied, as to accuracy, completeness, timeliness, or rights to the use of such infromation. King county shall not be liable for any general, special, indirect, incidental, or consequential damages including, but not limited to, lost revenues or lost profits resulring from the use or misuse of the information contained on this map.any sale of this map or information on this map is prohibited except by written permission of King County.
Data Sources: CDM
File Name: prof800a.dwg
May 2003
800 Feet4000
N

+00
413+
80.78 425+00
450+00475+00 500+00
525+00550+00 575+00
600+
00
625+
00
650+
00
671+47.81
9
E365
E320E321
E322
E323E324
E325
E326
E327E328
E329 E330
E331E332
E333
E334
E335
E336 E337
E338
E339
E340
E341
E342
E343
E344
E345
E346
E347
E348
E349
E350
E351
E352
E353
E354
E355
E356
E357
E358
E120
E121 E122
E123E124
E125
E127
E128
E129
E130
E131
E219 E220
E221
E222E223
E224
N258
SB1
MW-15
MW-17
MW-18
E225
E226
PORTAL 41
PORTAL 44
Figure 3
BRIGHTWATER REGIONALWASTEWATER TREATMENT SYSTEM
King County
Wastewater TreatmentDivision
Department ofNatural Resources and Parks
Combined Alignment Plan
May 2003
800 Feet4000
N
plan800d.dwgFile Name:
CDMData Sources:
The information included on this map has been compiled from a variety of sources and is subject to change without notice. King County makes no representations or warranties, express or implied, as to accuracy, completeness, timeliness, or rights to the use of such infromation. King county shall not be liable for any general, special, indirect, incidental, or consequential damages including, but not limited to, lost revenues or lost profits resulring from the use or misuse of the information contained on this map.any sale of this map or information on this map is prohibited except by written permission of King County.

320+48 325+00
350+00
375+
0040
0+00
413+
80.78
350+00 375+00400+00
425+00
E312 E313E314 E315 E316 E317 E318 E319
E365
E320E321
E322
E323
E364
E363
E362
E117E118
E119 E120
E121
N155
N154
N153
E216 E217 E218
E219
N254
N253
N252
N255
N256
N257
N258
E417
E418
E419 E420E421
E422
MW-12
MW-14
PORTAL 44
Figure 4
BRIGHTWATER REGIONALWASTEWATER TREATMENT SYSTEM
King County
Wastewater TreatmentDivision
Department ofNatural Resources and Parks
Influent Alignment Plan
May 2003
800 Feet4000
N
plan800a.dwgFile Name:
CDMData Sources:
The information included on this map has been compiled from a variety of sources and is subject to change without notice. King County makes no representations or warranties, express or implied, as to accuracy, completeness, timeliness, or rights to the use of such infromation. King county shall not be liable for any general, special, indirect, incidental, or consequential damages including, but not limited to, lost revenues or lost profits resulring from the use or misuse of the information contained on this map. any sale of this map or information on this map is prohibited except by written permission of King County.

PO
RT
AL
19
PO
RT
AL
5
0+00 20+00 40+00-100
0
100
200
500
400
300
60+00 80+00 100+00 120+00-100
300
400
500
200
100
0
220+00200+00180+00160+00140+00
Figure 5Effluent Alignment Subsurface Profile (Part 1)
BRIGHTWATER REGIONALWASTEWATER TREATMENT SYSTEM
King County
Wastewater TreatmentDivision
Department ofNatural Resources and Parks
The information included on this map has been compiled from a variety of sources and is subject to change without notice. King County makes no representations or warranties, express or implied, as to accuracy, completeness, timeliness, or rights to the use of such infromation. King county shall not be liable for any general, special, indirect, incidental, or consequential damages including, but not limited to, lost revenues or lost profits resulring from the use or misuse of the information contained on this map.any sale of this map or information on this map is prohibited except by written permission of King County.
Data Sources: CDM
File Name: prof800a.dwg
SMSCSWSPSW-SMSW-SCSP-SMSP-SCSC-SM
SOIL CLASSIFICATION LEGEND
GWGW-GMGPGW-GCGP-GMGP-GCGMGCGC-GM
CLCHCL-MLMLMH

PO
RT
AL
5
PO
RT
AL
44
180+00 200+00 220+00-100
0
100
200
500
400
300
240+00 260+00 280+00 300+00-100
300
400
500
200
100
0
400+00380+00360+00340+00320+00
Figure 6
BRIGHTWATER REGIONALWASTEWATER TREATMENT SYSTEM
King County
Wastewater TreatmentDivision
Department ofNatural Resources and Parks
420+00 440+00
Effluent Alignment Subsurface Profile (Part 2)
prof800a.dwgFile Name:
CDMData Sources:
The information included on this map has been compiled from a variety of sources and is subject to change without notice. King County makes no representations or warranties, express or implied, as to accuracy, completeness, timeliness, or rights to the use of such infromation. King county shall not be liable for any general, special, indirect, incidental, or consequential damages including, but not limited to, lost revenues or lost profits resulring from the use or misuse of the information contained on this map.any sale of this map or information on this map is prohibited except by written permission of King County.
CLCHCL-MLMLMH
GWGW-GMGPGW-GCGP-GMGP-GCGMGCGC-GM
SOIL CLASSIFICATION LEGEND
SMSCSWSPSW-SMSW-SCSP-SMSP-SCSC-SM

PO
RT
AL
44
PO
RT
AL
41
RO
UT
E 9
SIT
E
420+00 440+00 460+00-100
0
100
200
500
400
300
480+00 500+00 520+00 540+00 640+00620+00600+00580+00560+00
Figure 7
BRIGHTWATER REGIONALWASTEWATER TREATMENT SYSTEM
King County
Wastewater TreatmentDivision
Department ofNatural Resources and Parks
660+00
Combined Alignment Subsurface ProfileThe information included on this map has been compiled from a variety of sources and is subject to change without notice. King County makes no representations or warranties, express or implied, as to accuracy, completeness, timeliness, or rights to the use of such infromation. King county shall not be liable for any general, special, indirect, incidental, or consequential damages including, but not limited to, lost revenues or lost profits resulring from the use or misuse of the information contained on this map.any sale of this map or information on this map is prohibited except by written permission of King County.
Data Sources: CDM
File Name: prof800a.dwg
-100
0
100
200
300
400
500
CLCHCL-MLMLMH
GWGW-GMGPGW-GCGP-GMGP-GCGMGCGC-GM
SOIL CLASSIFICATION LEGEND
SMSCSWSPSW-SMSW-SCSP-SMSP-SCSC-SM

440+00420+00320+00 360+00 400+00300+00 340+00 380+00
0
100
200
300
-100
-200
PO
RT
AL
11
PO
RT
AL
44
-100
300
200
100
0
Figure 8
BRIGHTWATER REGIONALWASTEWATER TREATMENT SYSTEM
King County
Wastewater TreatmentDivision
Department ofNatural Resources and Parks
-200
Influent Alignment Subsurface ProfileThe information included on this map has been compiled from a variety of sources and is subject to change without notice. King County makes no representations or warranties, express or implied, as to accuracy, completeness, timeliness, or rights to the use of such infromation. King county shall not be liable for any general, special, indirect, incidental, or consequential damages including, but not limited to, lost revenues or lost profits resulring from the use or misuse of the information contained on this map.any sale of this map or information on this map is prohibited except by written permission of King County.
Data Sources: CDM
File Name: prof800a.dwg
CLCHCL-MLMLMH
GWGW-GMGPGW-GCGP-GMGP-GCGMGCGC-GM
SOIL CLASSIFICATION LEGEND
SMSCSWSPSW-SMSW-SCSP-SMSP-SCSC-SM

WASTEWATER TREATMENT SYSTEM
Soil Classification SystemDepartment ofNatural Resources and Parks
Wastewater TreatmentDivision
King County
BRIGHTWATER REGIONAL
Figure 9