4 global overview of deep-water exploration and...
TRANSCRIPT

Global Overview of Deep-water Exploration and ProductionCopyright ©2007 by The American Association of Petroleum Geologists. DOI: 10.1306/1240888St56285
�
Executive SummaryExploration and production (E&P) in deep water (500–2000 m [1640–6560 ft]) and ultra-deep-water (>2000 m [>6560 ft])
settings have expanded greatly during the past 20 years, to the point at which they are now major components of the petroleum industry’s upstream budgets. Most exploration and production activity has concentrated in only three areas of the world: the north-ern Gulf of Mexico, offshore Brazil, and offshore West Africa, although activity is increasing in several new areas. Globally, deep water remains an immature frontier, with many deep-water sedimentary basins being only lightly explored. Although deep-water discoveries account for less than 5% of the current worldwide oil-equivalent resources, the amount is increasing rapidly. Importantly, these resources are primarily oil; gas exploration is immature, reflecting infrastructure and economic limitations. There have been at least 42 giant fields (>500 million BOE) discovered in deep water.
By year end 2003, approximately 78 billion BOE of total resources had been discovered in deep water from 18 basins on six continents. This total consists of 48 BBO and condensate and 174 TCFG. Deep water contains 85% of the reserves and ultra-deep water has 15%. The immaturity of the play is illustrated by the fact that >50% of the reserves have been discovered since 1995, with 31% being developed and 5% produced. The exploration success ratio, particularly in basins such as the northern Gulf of Mexico and offshore West Africa, has been increasing. Most of these successes are in settings with younger (Cenozoic, mostly Neogene) sandstone reservoirs with direct hydrocarbon indicators (DHIs). However, there is an increasing number of reservoirs without DHIs (generally reservoirs that are slightly older, deeper, and/or with diminished seismic attributes).
Geologic setting and structure are major controls on the occurrence and volumes of hydrocarbons in deep water. Most of the reserves occur in basins with mobile substrates (salt or shale) in confined basins. The sedimentary loading leads to stacking of reservoirs and numerous structural and stratigraphic opportunities for the trapping of petroleum. Most of the traps are combined structural and stratigraphic. In addition, there are numerous migration pathways and source rocks in these types of basins. Adequate seals are commonly present in these clay-dominated, siliciclastic depositional systems.
Deep-water exploration and production, although relatively immature, has considerable potential. Five trends that will drive deep-water development include: 1) continued exploration in established trends; 2) exploration in new basins lacking updip produc-tion as well as new trends in unconfined basins, contractional margins, pre-Cenozoic targets, non-deep-water settings, and non-DHI settings; 3) increased focus on gas production; 4) drilling in deeper settings like ultra-deep water; and 5) taking advantage of politi-cally favorable opportunities.
4 Global Overview of Deep-water Exploration and ProductionPaul Weimer1 and Henry S. Pettingill2
1University of Colorado, Boulder, Colorado, USA 2Noble Energy, Houston, Texas, USA
Figure 1. Total discovered deep-water (>500 m [>1650 ft]) recoverable resources per region, announced as of November 2003 (BBOE = billion bar-rels oil equivalents). Major prospective deep- and ultra-deep-water basins are also shown. Green = oil; red = gas. Updated from Weimer and Pettingill (2004). NWS = northwest shelf; ZOCA = zone of cooperation area.
Figure 2. Exploration success rates in the six primary deep-water regions of the world and the global average. Green = oil; red = gas. Data from Harper (1997) and Weimer and Pettingill (2004).
Table 1. Resource summary from major producing regions.
Region Total
deep-waterresources
Number of discoveries
Average discovery size*
Largest discovery Reservoir age
Campos Basin, Brazil 15.9 MMBOE 45 385 MMBOE 3200 MMBOE RoncadorCretaceous, Paleogene, Miocene
U.S. Gulf of Mexico 15.5 MMBOE 160+ 119 MMBOE 1000 MMBOE Thunderhorse Pleistocene
Lower Congo, Angola/Congo
10.6 MMBOE 49 216 MMBOE 975 MMBOE DaliaPaleogene, Neocene
Niger Delta, Nigeria/Eq. Guinea
8.6 MMBOE 34 308 MMBOE 880 MMBOE Agbami Neogene
Borneo (Mahakam and Baram), Indonesia/Malaysia
3.9 MMBOE 20 <305 MMBOE 550 MMBOE Kikeh Neogene
NW Shelf, Australia 60.1 TCFE 15 4.6 TCFE 20.0 TCFE JanszJurassic, Cretaceous
Nile Delta, Egypt 21.0 TCFE 23 0.9 TCFE 4.0 TCFE Simian Neogene
mid-Norway (More and Voring)
15.3 TCFE 4 n.m. 13.9 TCFE Ormen LangeCretaceous, Paleocene
• published discoveries only
n.m. = not meaningful (only 2 discoveries with resources disclosed)
TCFE = trillion cubic feet equivalent; MMBOE = million barrels oil equivalent; BBOE = billion garrels oil equivalent.
Studies 56 CH004_v2.indd 7 10/29/2007 10:03:54 AM
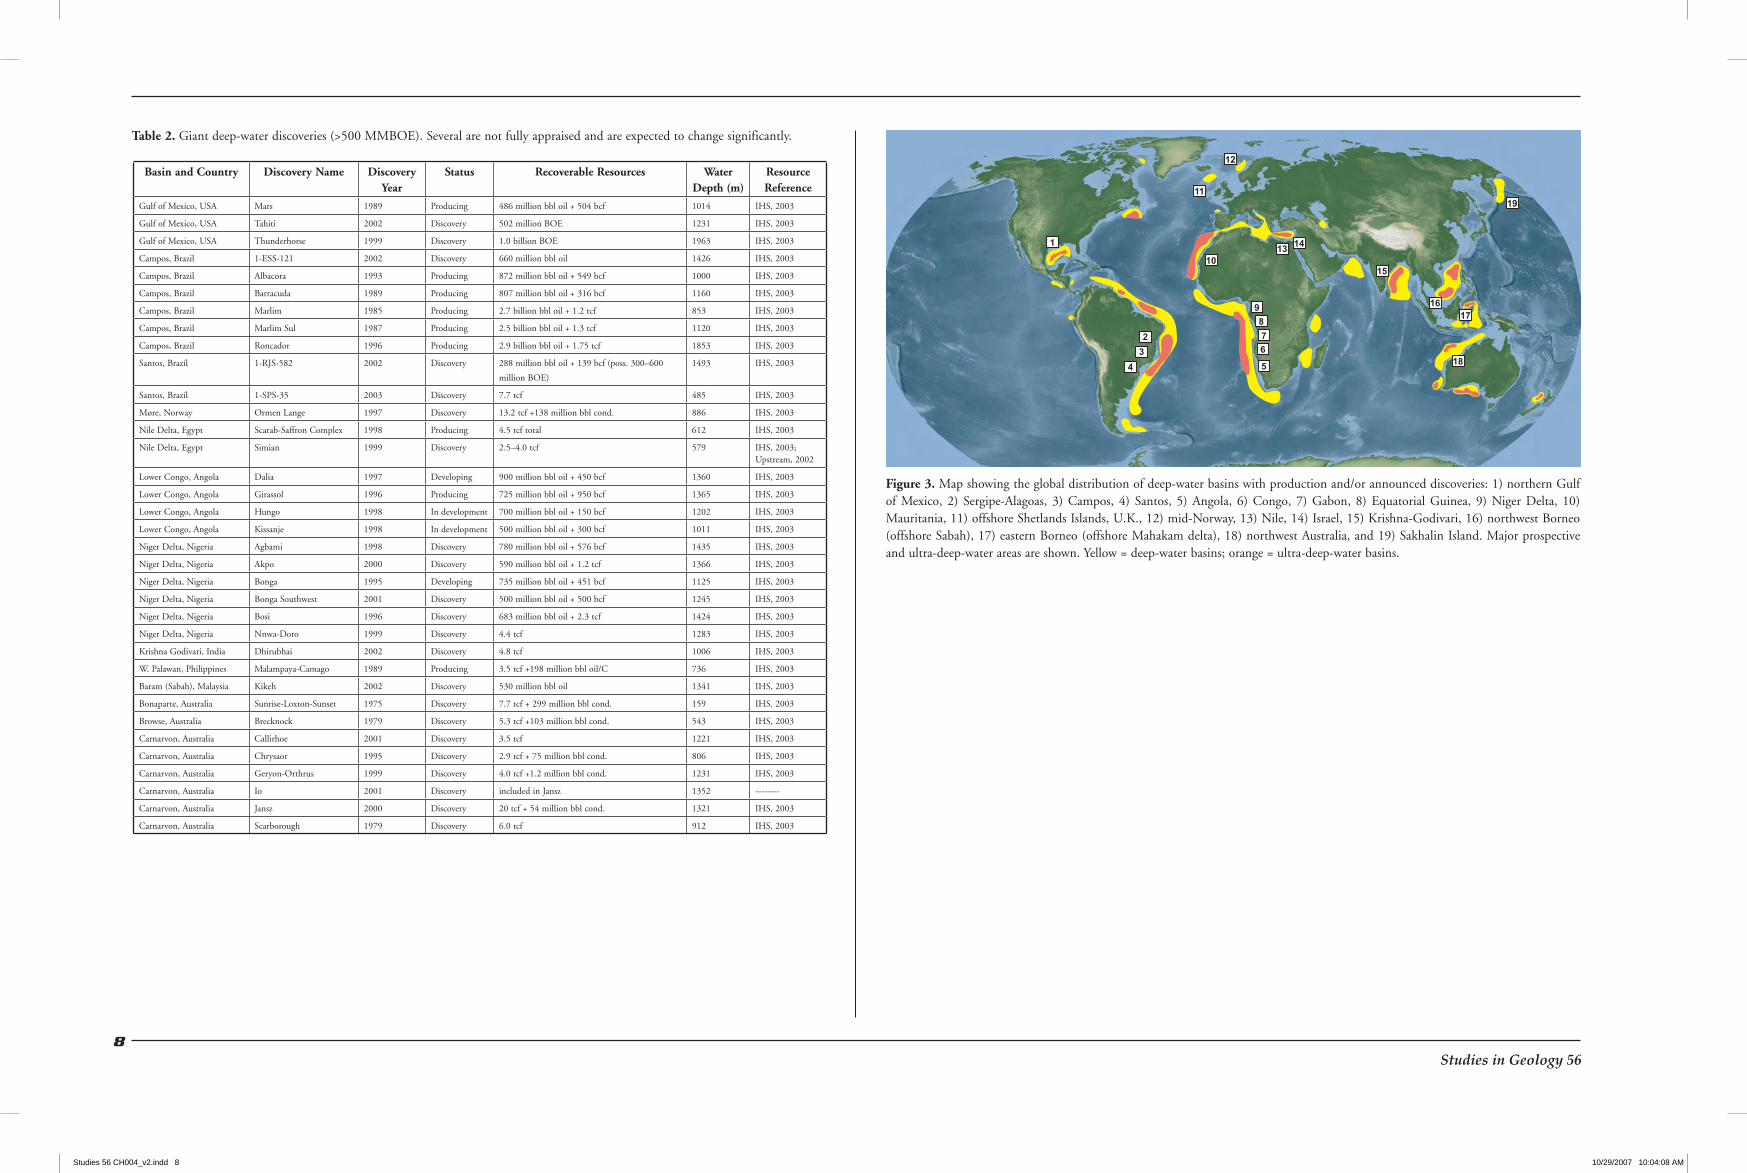
Figure 3. Map showing the global distribution of deep-water basins with production and/or announced discoveries: 1) northern Gulf of Mexico, 2) Sergipe-Alagoas, 3) Campos, 4) Santos, 5) Angola, 6) Congo, 7) Gabon, 8) Equatorial Guinea, 9) Niger Delta, 10) Mauritania, 11) offshore Shetlands Islands, U.K., 12) mid-Norway, 13) Nile, 14) Israel, 15) Krishna-Godivari, 16) northwest Borneo (offshore Sabah), 17) eastern Borneo (offshore Mahakam delta), 18) northwest Australia, and 19) Sakhalin Island. Major prospective and ultra-deep-water areas are shown. Yellow = deep-water basins; orange = ultra-deep-water basins.
� Studies in Geology 56
Table 2. Giant deep-water discoveries (>500 MMBOE). Several are not fully appraised and are expected to change significantly.
Basin and Country Discovery Name Discovery Year
Status Recoverable Resources Water Depth (m)
Resource Reference
Gulf of Mexico, USA Mars 1989 Producing 486 million bbl oil + 504 bcf 1014 IHS, 2003
Gulf of Mexico, USA Tahiti 2002 Discovery 502 million BOE 1231 IHS, 2003
Gulf of Mexico, USA Thunderhorse 1999 Discovery 1.0 billion BOE 1963 IHS, 2003
Campos, Brazil 1-ESS-121 2002 Discovery 660 million bbl oil 1426 IHS, 2003
Campos, Brazil Albacora 1993 Producing 872 million bbl oil + 549 bcf 1000 IHS, 2003
Campos, Brazil Barracuda 1989 Producing 807 million bbl oil + 316 bcf 1160 IHS, 2003
Campos, Brazil Marlim 1985 Producing 2.7 billion bbl oil + 1.2 tcf 853 IHS, 2003
Campos, Brazil Marlim Sul 1987 Producing 2.5 billion bbl oil + 1.3 tcf 1120 IHS, 2003
Campos, Brazil Roncador 1996 Producing 2.9 billion bbl oil + 1.75 tcf 1853 IHS, 2003
Santos, Brazil 1-RJS-582 2002 Discovery 288 million bbl oil + 139 bcf (poss. 300–600
million BOE)
1493 IHS, 2003
Santos, Brazil 1-SPS-35 2003 Discovery 7.7 tcf 485 IHS, 2003
Møre, Norway Ormen Lange 1997 Discovery 13.2 tcf +138 million bbl cond. 886 IHS, 2003
Nile Delta, Egypt Scarab-Saffron Complex 1998 Producing 4.5 tcf total 612 IHS, 2003
Nile Delta, Egypt Simian 1999 Discovery 2.5–4.0 tcf 579 IHS, 2003; Upstream, 2002
Lower Congo, Angola Dalia 1997 Developing 900 million bbl oil + 450 bcf 1360 IHS, 2003
Lower Congo, Angola Girassol 1996 Producing 725 million bbl oil + 950 bcf 1365 IHS, 2003
Lower Congo, Angola Hungo 1998 In development 700 million bbl oil + 150 bcf 1202 IHS, 2003
Lower Congo, Angola Kissanje 1998 In development 500 million bbl oil + 300 bcf 1011 IHS, 2003
Niger Delta, Nigeria Agbami 1998 Discovery 780 million bbl oil + 576 bcf 1435 IHS, 2003
Niger Delta, Nigeria Akpo 2000 Discovery 590 million bbl oil + 1.2 tcf 1366 IHS, 2003
Niger Delta, Nigeria Bonga 1995 Developing 735 million bbl oil + 451 bcf 1125 IHS, 2003
Niger Delta, Nigeria Bonga Southwest 2001 Discovery 500 million bbl oil + 500 bcf 1245 IHS, 2003
Niger Delta, Nigeria Bosi 1996 Discovery 683 million bbl oil + 2.3 tcf 1424 IHS, 2003
Niger Delta, Nigeria Nnwa-Doro 1999 Discovery 4.4 tcf 1283 IHS, 2003
Krishna Godivari, India Dhirubhai 2002 Discovery 4.8 tcf 1006 IHS, 2003
W. Palawan, Philippines Malampaya-Camago 1989 Producing 3.5 tcf +198 million bbl oil/C 736 IHS, 2003
Baram (Sabah), Malaysia Kikeh 2002 Discovery 530 million bbl oil 1341 IHS, 2003
Bonaparte, Australia Sunrise-Loxton-Sunset 1975 Discovery 7.7 tcf + 299 million bbl cond. 159 IHS, 2003
Browse, Australia Brecknock 1979 Discovery 5.3 tcf +103 million bbl cond. 543 IHS, 2003
Carnarvon, Australia Callirhoe 2001 Discovery 3.5 tcf 1221 IHS, 2003
Carnarvon, Australia Chrysaor 1995 Discovery 2.9 tcf + 75 million bbl cond. 806 IHS, 2003
Carnarvon, Australia Geryon-Orthrus 1999 Discovery 4.0 tcf +1.2 million bbl cond. 1231 IHS, 2003
Carnarvon, Australia Io 2001 Discovery included in Jansz 1352 --------
Carnarvon, Australia Jansz 2000 Discovery 20 tcf + 54 million bbl cond. 1321 IHS, 2003
Carnarvon, Australia Scarborough 1979 Discovery 6.0 tcf 912 IHS, 2003
Studies 56 CH004_v2.indd 8 10/29/2007 10:04:08 AM

Global Overview of Deep-water Exploration and Production�
Setting, structure, trap style, age, lithology, and source rock
Figure 4. Schematic cross sections illustrating the dif-ferent petroleum systems for deep-water settings. Each section shows the relationship of source rocks with structural styles, stratigraphic fill, and migration path-ways. 1. Rift source rocks (often lacustrine) A) with salt deformation: Campos and Santos Basins (Brazil) and Lower Congo Basin (offshore Angola), B) base-ment blocks: northwest Australia, west of Shetlands, and mid-Norway. 2. Marine source rocks A) early divergent margins: northern Gulf of Mexico, lower Congo and Nile, B) Cenozoic divergent margin: Niger Delta, northwest Borneo. 3. Active margins: Apennine foredeep, Kutei Basin (Mahakam Delta). 4. Biogenic gas: Nile Delta, northern Gulf of Mexico. Inset chart illustrates the relative amount of discovered resources versus source rock. After Pettingill and Weimer (2001).
Figure 5. Discovered resources versus deep-water basin setting. Classification of mobile substrate and unconfined turbidite settings is adapted from Worrall et al. (1999, 2001). Additional frontier settings are added here, with corresponding reserves from this study. Note that “con-fined” and “unconfined” are end mem-bers, and basins may evolve from one to the other end member or vary spatially between end members. A portion (0.03%) of the confined resources are actually in a low-confinement setting (e.g., Marlim and Albacore Fields, Campos Basin, Bra-zil), as shown on the chart. After Weimer and Pettingill (2004).
Figure 6. A) Schematic diagrams showing different trap styles for the deep-water settings. B) Discovered deep-water resources versus the trap categories. As observations are preliminary, total resources with published trap information are 28 BBOE (about one-third of the resources discovered). C) Classifica-tion of trap type employed in this study. As defined by this classification scheme, structural traps have only structural elements (faults, dip-closure, or diapir interface), whereas pure stratigraphic traps depend solely on reservoir discontinuity. Combination traps, however, exist only if both types of elements are in place.
Studies 56 CH004_v2.indd 9 10/29/2007 10:04:20 AM
10 Studies in Geology 56
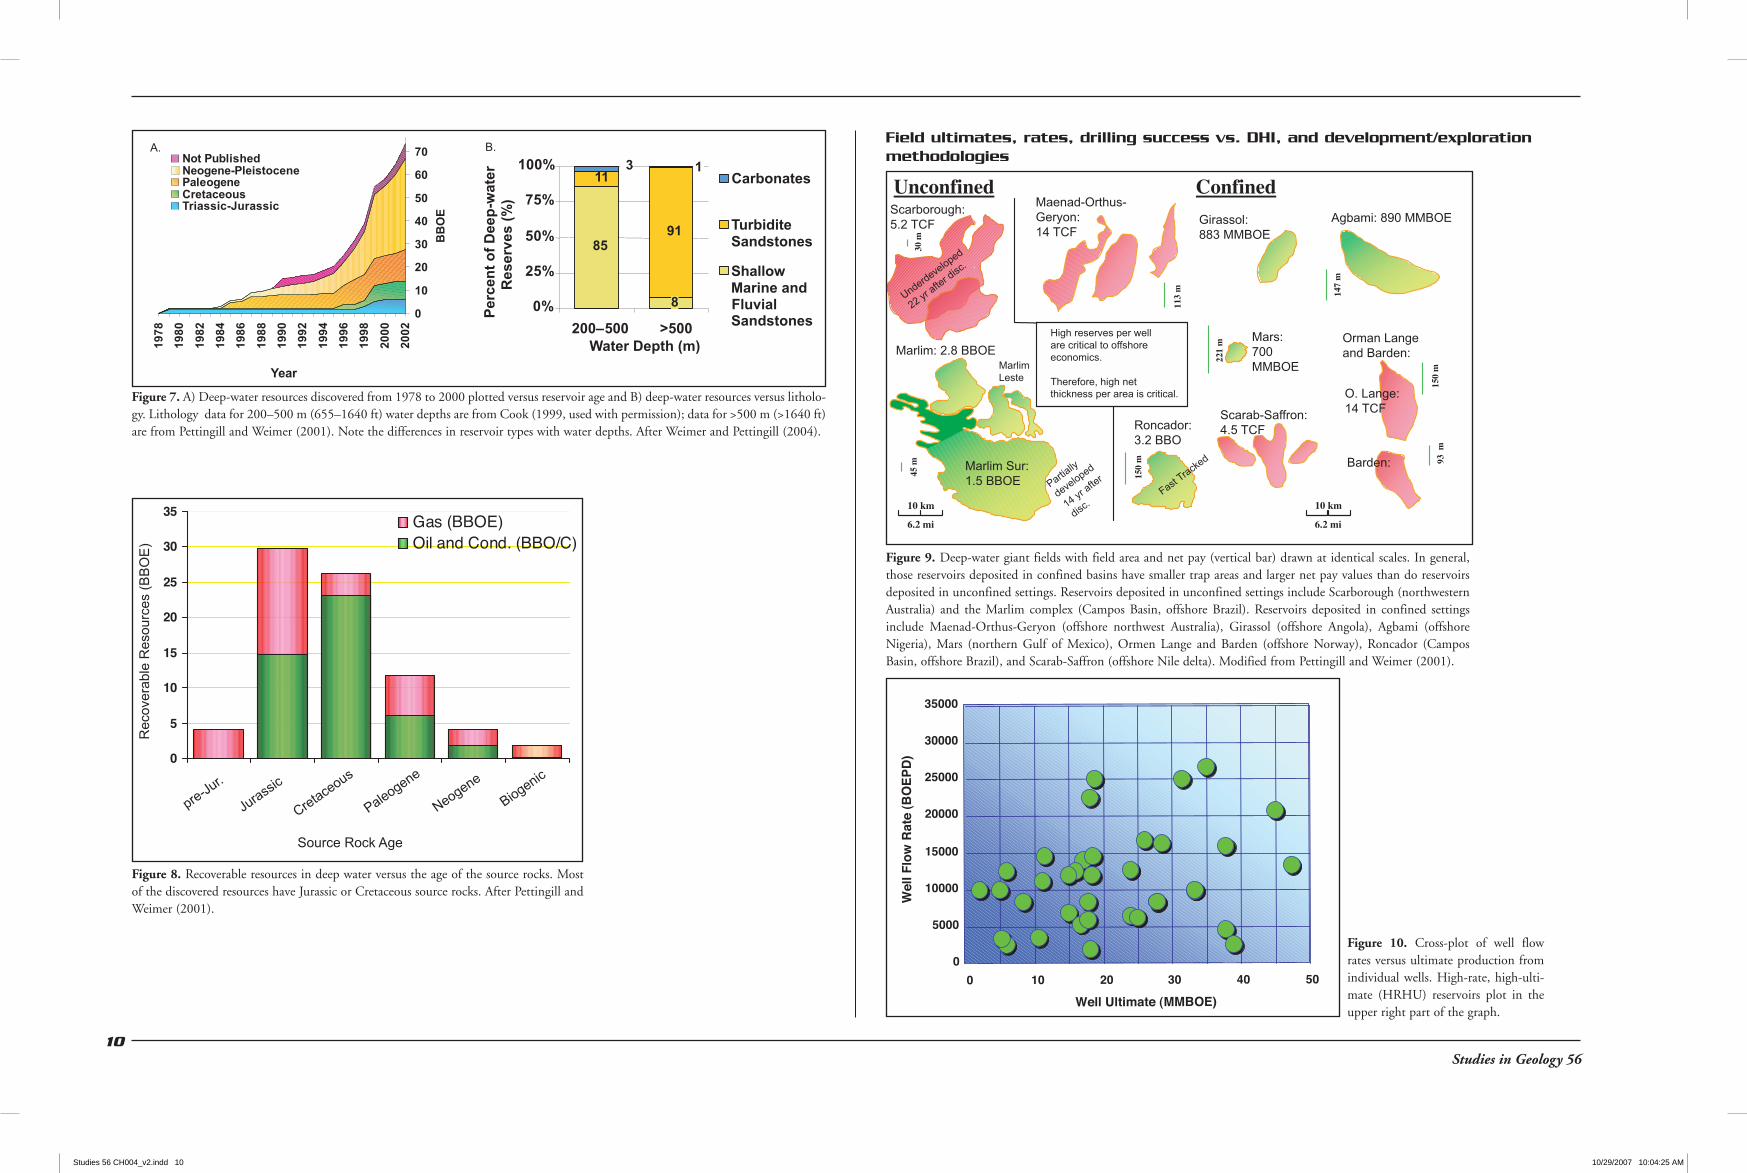
Field ultimates, rates, drilling success vs. DHI, and development/exploration methodologies
Figure 9. Deep-water giant fields with field area and net pay (vertical bar) drawn at identical scales. In general, those reservoirs deposited in confined basins have smaller trap areas and larger net pay values than do reservoirs deposited in unconfined settings. Reservoirs deposited in unconfined settings include Scarborough (northwestern Australia) and the Marlim complex (Campos Basin, offshore Brazil). Reservoirs deposited in confined settings include Maenad-Orthus-Geryon (offshore northwest Australia), Girassol (offshore Angola), Agbami (offshore Nigeria), Mars (northern Gulf of Mexico), Ormen Lange and Barden (offshore Norway), Roncador (Campos Basin, offshore Brazil), and Scarab-Saffron (offshore Nile delta). Modified from Pettingill and Weimer (2001).
Figure 10. Cross-plot of well flow rates versus ultimate production from individual wells. High-rate, high-ulti-mate (HRHU) reservoirs plot in the upper right part of the graph.
Figure 7. A) Deep-water resources discovered from 1978 to 2000 plotted versus reservoir age and B) deep-water resources versus litholo-gy. Lithology data for 200–500 m (655–1640 ft) water depths are from Cook (1999, used with permission); data for >500 m (>1640 ft) are from Pettingill and Weimer (2001). Note the differences in reservoir types with water depths. After Weimer and Pettingill (2004).
Figure 8. Recoverable resources in deep water versus the age of the source rocks. Most of the discovered resources have Jurassic or Cretaceous source rocks. After Pettingill and Weimer (2001).
Studies 56 CH004_v2.indd 10 10/29/2007 10:04:25 AM
Global Overview of Deep-water Exploration and Production11
ReferencesCook, L., 1999, Deep-water — A global perspective: AAPG International Conference, Extended Abstracts with Program, p. 133.Harper, F., 1997, Oil and gas beyond the continental shelf: Integrated Coastal Zone Management Exclusive Economic Zone, Edition
1.Pettingill, H. S., and P. Weimer, 2001, Global deep water exploration: Past, present and future frontiers, in R. H. Fillon, N. C. Rosen, P.
Weimer, A. Lowrie, H. W. Pettingill, R. L. Phair, H. H. Roberts, and B. Van Hoorn, eds., Petroleum systems of deepwater basins: Global and Gulf and Mexico experience: Gulf Coast Section–SEPM Bob F. Perkins 21st Annual Research Conference, p. 1–22.
Weimer, P., and H. W. Pettingill, 2004, Global overview to deepwater exploration and production, Chapter 2, Petroleum systems of deepwater settings: Society of Exploration Geophysicists/European Association of Geoscientists & Engineers Distinguished Instruc-tor Short Course Lecture notes, p. 2-1–2-39.
Worrall, D. M., B. E. Prather, and J. Straccia, 1999, Frontier deep-water basins: What’s next?: AAPG International Conference and Exhibition, Extended Abstracts with Program, p. 514.
Worrall, D. M., M. W. Bourque, and D. R. Steele, 2001, Exploration in deep water basins . . . where next? in R. H. Fillon, N. C. Rosen, P. Weimer, A. Lowrie, H. W. Pettingill, R. L. Phair, H. H. Roberts, and B. Van Hoorn, eds., Petroleum systems of deepwater basins: Global and Gulf and Mexico experience: Gulf Coast Section–SEPM Bob F. Perkins 21st Annual Research Conference, p. 273.
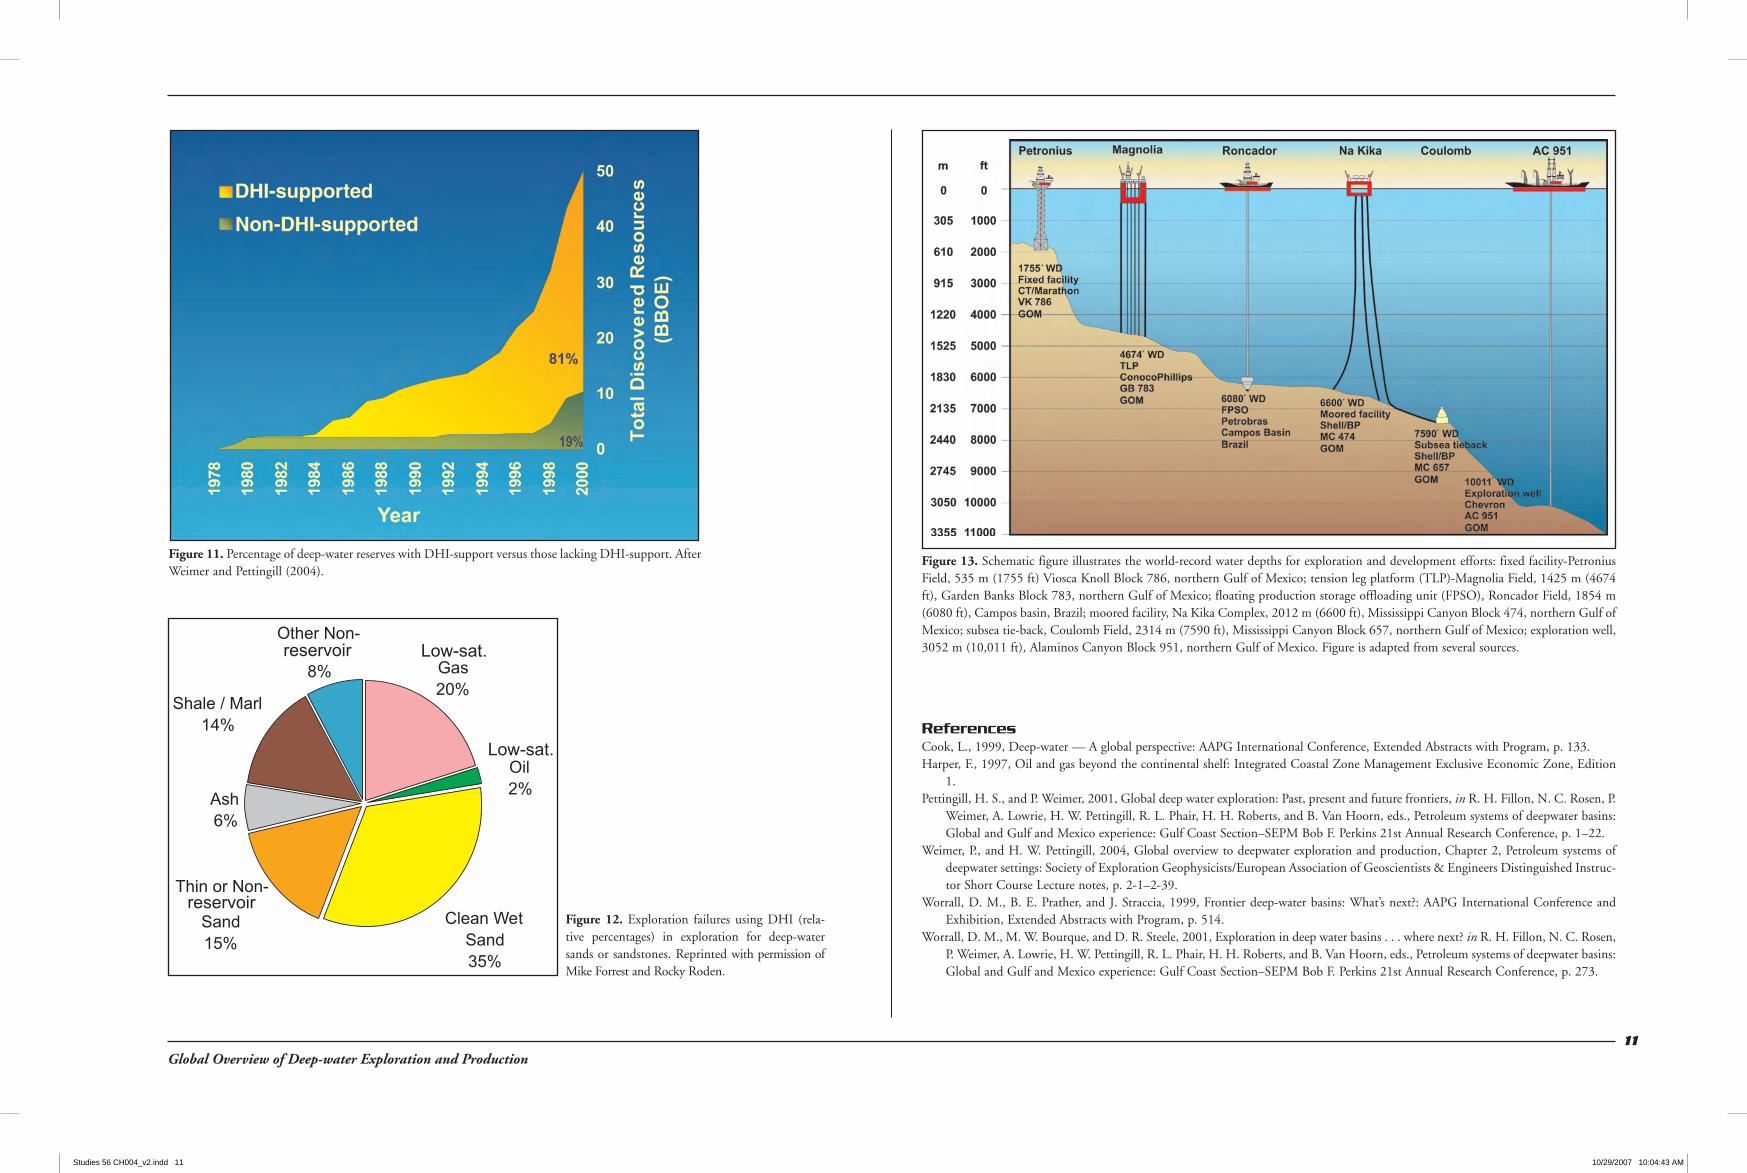
Figure 11. Percentage of deep-water reserves with DHI-support versus those lacking DHI-support. After Weimer and Pettingill (2004).
Figure 12. Exploration failures using DHI (rela-tive percentages) in exploration for deep-water sands or sandstones. Reprinted with permission of Mike Forrest and Rocky Roden.
Figure 13. Schematic figure illustrates the world-record water depths for exploration and development efforts: fixed facility-Petronius Field, 535 m (1755 ft) Viosca Knoll Block 786, northern Gulf of Mexico; tension leg platform (TLP)-Magnolia Field, 1425 m (4674 ft), Garden Banks Block 783, northern Gulf of Mexico; floating production storage offloading unit (FPSO), Roncador Field, 1854 m (6080 ft), Campos basin, Brazil; moored facility, Na Kika Complex, 2012 m (6600 ft), Mississippi Canyon Block 474, northern Gulf of Mexico; subsea tie-back, Coulomb Field, 2314 m (7590 ft), Mississippi Canyon Block 657, northern Gulf of Mexico; exploration well, 3052 m (10,011 ft), Alaminos Canyon Block 951, northern Gulf of Mexico. Figure is adapted from several sources.
Studies 56 CH004_v2.indd 11 10/29/2007 10:04:43 AM