4. hortflora full pdf vol 1(4) oct-dec 2012
TRANSCRIPT


Volume 1 (4) October-December 2012

HORTFLORA RESEARCH SPECTRUM ISSN : 2250-2823
Volume 1(4), October-December, 2012
Contents
1. Standardization of in-situ Moisture Conservation Methodfor Establishment of Aonla Orchards on Sloppy DegradedWastelands
R.S. Negi, B.S. Baghel, A.K. Gupta and Y.K. Singh 289-294
2. Perennial Chillies Germplasm Identified and Exploredfrom Bihar
Anil Kumar Singh, Vijai Kumar Umrao and ManojKumar Sinha
295-299
3. Foliar Application of Potassium, Calcium, Zinc and Boron Enhanced Yield, Quality and Shelf Life of Mango
Arvind Bhatt, N.K. Mishra, D.S. Mishra and C.P. Singh 300-305
4. Studies on the Extent of Genetic Contamination in SeedProduction of Exerted Stigma Tomato (Solanumlycopersicum L.)
Rajinder Singh, Dilbagh Singh and J.S. Kanwar 306-311
5. Vegetable Type Pigeonpea Germplasm Identified andExlored from Vaishali District of Bihar
Anil Kumar Singh 312-317
6. Qualitative Effect of Wrapping and Cushioning Materialon Guava Fruits During Storage
Deepak Chandra and Rajesh Kumar 318-322
7. Effect of Various Mulch Materials and Spacing onGrowth, Yield and Quality of Strawberry
Priyamvada Sonkar, R.B. Ram and M.L. Meena 323-327
8. Studies on Seed Vigour Deterioration in Pea (Pisumsativum L.)
Ishrat Ahmad Lone, S.D. Tyagi, D.K. Bahuguna, RajeevKumar and Nitin Kumar
328-333
9. Effect of Foliar Spray of Zinc, Calcium and Boron onSpike Production of Gladiolus cv. Eurovision
Prashant Katiyar, O.P. Chaturvedi and DheerendraKatiyar
334-338
10. Path Coefficient Analysis for Seedling Vigour in Radish(Raphanus sativus L.) Genotypes
Dilbag Singh and Rajinder Singh 339-343
11. Effect of Post Harvest Calcium Treatments on Shelf Lifeof Guava cv. Sardar
Rajesh Kumar, Shant Lal and K.K. Mishra 344-347
12. Effect of Nitrogen and Phosphorus with Nitrogen Sourceson Vegetative Attributes of Tuberose
A.P.S. Gangwar, J.P. Singh, V.K. Umrao and I.P. Singh 348-353
13. Correlation Coefficient Studies in Ashwagandha(Withania somnifera Dunal) cv. Jawahar-20
Vijai Kumar, Naresh Kumar and M.C. Singh 354-357
14. Integrated Response of Inorganic and Bio-Fertilizers onYield and Yield Attributes of Turmeric
Arun Pratap Singh, R.P. Singh, Jagdish Singh andS.K. Shahi
358-361
15. Effect of Environmental Factors on Phytophthora BlightDevelopment of Colocasia
R.C. Shakywar and S.P. Pathak 362-366
16. Effect of Chemical and Bio-Fertilizers on Quality ofOnion
Yogita and R.B. Ram 367-370
17. Management of Phomopsis Leaf Blight of BrinjalThrough Different Fungicides and Biopesticide
Ramesh Singh, P.C. Singh, Dinesh Kumar andN.S. Sachan
371-374
18. Chironjee : A Promising Tree Fruits of Dry Subtropics P.S. Chauhan, Jitendra Singh and Kavita A. 375-379
19. Effect of AgNO3 and 8-HQC on Vase Life of Cut Rose Satish Chand, Vijai Kumar and Jitendra Kumar 380-382
20. Morphological Markers for Identification of Populusdeltoides Clones in Nursery
Manoj Kumar Singh 383-384

STAN DARD IZA TION OF IN-SITU MOIS TURE CON SER VA TION
METHOD FOR ES TAB LISH MENT OF AONLA OR CHARDS ON
SLOPPY DE GRADED WASTE LANDS
R.S. Negi1, B.S. Baghel2, A.K. Gupta3 and Y.K. Singh4
1Deendayal Re search In sti tute, Krishi Vigyan Kendra, Satna (MP)-485 3312Col lege of Hor ti cul ture, JNKVV, Mandsour (MP)3,4Mahatma Gan dhi Chitrakoot Gramodaya Vishwavidyalaya, Chitrakoot.
E-mail: [email protected]
AB STRACT: A study was car ried out in Krishi Vigyan Kendra, Deendayal Re search In sti tute,Satna for two con sec u tive years to eval u ate the ef fect of var i ous in-situ mois ture con ser va tionmea sures on es tab lish ment and growth of aonla (Emblica officinalis) in sloppy de graded lands.In-situ mois ture con ser va tion mea sures in cluded for the study were prep a ra tion of cir cu lar ringba sin + mulch ing the ba sin with black poly thene, stag gered con tour trench ing (45 cm width and 3 m length) on up per side of the plant ba sin, place ment of one sub merged pitcher in one side of the plant for rain wa ter har vest ing, set ting the seed ling in a de pres sion of 1 m width and 15 cm deep,sur rounded by a ring-shaped ridge with 25 cm width and 15 cm height and a 30 cm open ing onthe higher side to har vest rain wa ter + fill ing the de pres sion with straw + mulch ing with blackpoly thene and con trol (no mi cro- catch ment or mulch). The re sults re vealed that all the in-situmois ture con ser va tion meth ods showed im prove ments in sur vival, es tab lish ment and growth ofaonla plants. How ever, prep a ra tion of mi cro catch ment area of one me ter width sur rounded byring shaped ridge of 25 cm width and 15 cm height and hav ing a 30 cm open ing at the higher side and mulch ing in de pressed area with straw and cover with black poly thene was found to be themost ef fec tive mois ture con ser va tion method in in creas ing the sur vival and growth of aonlaseed lings/budlings among all the con ser va tion treat ments.
Keywords: Aonla, in-situ mois ture con ser va tion, laterite soil, stag gered con tour trench ing.
The con cept of re ha bil i ta tion of waste/for estlands through plan ta tions of eco nomic plants onde graded soils for meet ing the ever in creas ingde mands of food, fruits, fod der and fuel, has gained wide spread at ten tion in In dia. In re cent years, theCen tral Gov ern ment of India, as well as some stategov ern ments, has ex pressed their sup port forbring ing de graded lands, which can not be used forfood pro duc tion, un der fruit cul ti va tion. In dia hasvast tracts of waste lands, which have been ly ingbar ren for ages. Most of these lands are suit able forgrow ing trees and thus could be put to so ciallypro duc tive uses (Balooni and Singh, 1). How ever,the ma jor con straint on the pace of ex pan sion ofre ha bil i ta tion programmes is the non-avail abil ity of suit able lo ca tion spe cific tech nol o gies. Sev eralwork ers have em pha sized the need for de vel op ment of re ha bil i ta tion tech nol ogy in or der to pre ventgood land from de grad ing into waste lands, and it
has been re ported that waste and de graded for estlands can be eco nom i cally uti lized for grow ingcer tain eco nomic plants by em ploy ing suit abletech nol o gies. Hegde (3) re ported that soil and wa ter con ser va tion mea sures and grow ing trees couldef fec tively re ha bil i tate such sloppy waste lands.Sim i larly, at tempt s to re ha bil i tate de graded lands in the west ern Hi ma la yas, Khybri et al. (4) found thatin-situ mois ture con ser va tion tech niques along with use of grasses, plan ta tion of fuel, fod der and fruittrees were quite ef fec tive in re ha bil i tat ing de nudedlands. Singh (8) stud ied the per for mance of cer tainfruit trees on waste lands in the Bundelkhand re gion and found that the abun dant hilly waste landsavail able in the re gion could be suc cess fullyde vel oped for the plan ta tion of fruits.Tyagi andYadava (9), while work ing on re ha bil i ta tion ofwaste lands, ob served that waste lands can bere ha bil i tated to a greater ex tent by em ploy ingsuit able soil-wa ter con ser va tion mea sures; plant ing
HortFlora Research Spectrum, 1(4): 289-294 (2012) ISSN : 2250-2823
Received : 06.9.2012 Accepted : 29.9.2012

290 Negi et al.
of fruit, fod der and fuel tree spe cies, and graft ing of im proved va ri et ies of fruits on na tive root stocks.Pareek et al. (7) sug gested the re quire ment of soiland wa ter con ser va tion treat ments for pro duc tion of hor ti cul tural crops on un du lat ing hilly lands and
de graded for est lands.
The aonla (Emblica officinalis Gaertn) is oneof the most im por tant mi nor fruits that has brightpros pects for ex tend ing its cul ti va tion, es pe cially in waste/forestlands where the cul ti va tion of othercrops is ar du ous and less prof it able. Dur ing there cent years, this crop is fast gain ing ground onac count of its drought har di ness, high me dic i naland nu tri tional value, non-per ish able na ture of thefruit, readily avail able mar ket and highre mu ner a tion. Due to its in creas ing de mand inAyurvedic med i cines, an ex pan sion of the areaun der its cul ti va tion has be come nec es sary to meetthe de mands of phar ma ceu ti cal com pa nies.Keep ing in view the di verse me dic i nal use of aonlaand its in creas ing com mer cial sig nif i cance in thecoun try, there is an ur gent need to give im me di ateat ten tion to wards prob lems and pros pects in itscul ti va tion. How ever, the great est bot tle neck in itsex pan sion is the poor sur viv abil ity of plants onwaste/forestland. The poor es tab lish ment of plantsaf ter trans plant ing is a ma jor prob lem in theex pan sion of area un der cul ti va tion as heavymor tal ity (up to 50 %) oc curs af ter trans plant ingfrom nurs ery to field at dis tant places. Al though,aonla is a drought hardy fruit crop, yet the plantsre quire wa ter ing dur ing the ini tial stage of or chardes tab lish ment (Pareek, 6). But pro vid ing ir ri ga tionis nei ther prac ti cal nor eco nom i cal in the sloppywaste lands. Har vest ing of rain wa ter and in-situmois ture con ser va tion is the only vi a ble al ter na tiveto ar ti fi cial ir ri ga tion. Sci en tific in for ma tion toes tab lish a stan dard method of rain wa ter har vest ing tech nol ogy for aonla is in ad e quate, es pe cially forthe sloppy lands. There fore, an ex per i ment was laid out to study the ef fect of dif fer ent mod els of rainwa ter har vest ing on plant sur vival and growthra tios.
MA TE RI ALS AND METH ODS
The ex per i ment was con ducted dur ing two
con sec u tive years of 2005-06 and 2006-07 atin struc tional farm of Krishi Vigyan Kendra, Satnaon sloppy waste lands with five in-situ mois turecon ser va tion meth ods. The ex per i ment was laid out in a Ran dom ized Block De sign with threerep li ca tions and 20 plants in each rep li ca tion. Theex per i ment site was cleared off all theshrubs/bushes in the month of May dur ing both theyears. Pits of 90 x 90 x 90 m3 size were dug outdur ing May. The pits were filled with a mix ture ofgood soil and FYM in the ra tio of 1:1. Ex per i mentwas laid out in a tri an gu lar sys tem at a plant ingdis tance of 5x5m. The seeds ex tracted fromma tured desi aonla af ter treat ment withcarbendazim (0.25%) were sown in poly thene bags(25x10 cm size) filled with a mix ture con tain ingsoil, sand and FYM in equal pro por tion for rais ingseed lings/rootstocks in the last week of June. 2-3healthy seeds were sown in each polybag. Af terger mi na tion only one healthy seed ling was re tained per poly bag. Af ter one month the seed lings raisedin polybags were trans planted in pits sub jected todif fer ent in-situ mois ture con ser va tion mea sures.These trans planted seed lings were patch bud dedwith NA-7 dur ing the last week of June in thefol low ing year. The ob ser va tions on seed lingsgrowth (height and di am e ter), sur vival, time takenfor ini ti a tion of bud sprout, time taken forcom ple tion of 50% buds sprout ing, per cent budsprout ing and sur vival of budlings were re corded.The data on seed lings height and di am e ter werere corded at monthly in ter val af ter trans plant ingun til June of the fol low ing year (the time ofper form ing bud ding op er a tions). The height wasmea sured from the sur face of soil to the ter mi nalbud of the main axis, and ex pressed as av er ageheight per seed ling in cm. The di am e ter wasre corded at a height of 5 cm from the ground levelwith the help of a slide ver nier cal i per, and wasex pressed as av er age di am e ter per seed ling in cm.The num ber of seed lings sur viv ing in eachtreat ment un til June of the fol low ing year wascon sid ered as sur vival of seed lings. The data onbud sprout were re corded daily af ter one week ofbud ding. The num ber of buds sprouted in each
treat ment were counted and ex pressed inper cent age on the ba sis of the num ber of budssprouted out of the seed lings bud ded. The pe riodfrom the date of bud ding/graft ing to the sprout ingof first bud was con sid ered as the time taken forini ti a tion of bud sprout and the pe riod from the date of bud ding/graft ing to the sprout ing of 50% budswas con sid ered as the time taken for com ple tion of50 per cent bud sprout ing. The num ber of budlings
sur viv ing in each treat ment un til 24 weeks af terbud ding were con sid ered as bud sur vival andex pressed in per cent age. The data in per cent agewere trans formed to arc sine val ues for cal cu lat ingthe anal y sis of vari ance. The de tails of treat ments
used are given in Ta ble 1.
RE SULTS AND DIS CUS SION
Seed ling Growth
The data on the ef fect of dif fer ent in-situ soilmois ture con ser va tion treat ments on plant growthand sur vival over the years are pre sented in Ta ble 2. The pooled anal y sis of vari ance for plant height,di am e ter and sur vival per cent age re vealedsig nif i cant dif fer ences among dif fer ent soilmois ture con ser va tion meth ods, and stronglyin di cated the sig nif i cance of rain wa ter har vest ingand in-situ mois ture con ser va tion The re sults of thepres ent stud ies re vealed that rain wa ter har vest ingand in-situ mois ture con ser va tion is a must forbetter es tab lish ment and de vel op ment of aonlaseed lings/budlings par tic u larly in sloppy de gradedsoils, as the growth and sur vival of aonla plants was mark edly im proved when the seed lings/budlingswere sub jected to dif fer ent in-situ mois ture
con ser va tion meth ods.
In the pres ent stud ies, the seed ling growth interms of height and di am e ter was in flu encedsig nif i cantly by dif fer ent in-situ mois turecon ser va tion treat ments. Among all the treat ments,trans plant ing of seed lings in pit de pres sion (T4)re sulted in the max i mum seed ling height (89.54cm) and di am e ter (1.11 cm), which wassig nif i cantly greater than the other treat ments. Thenext best treat ment in re spect of seed ling growthwas in-situ mois ture con ser va tion by stag geredtrench + straw mulch ing (81.24 and 1.05 cm) andsub merged pitcher (77.23 and 1.02 cm). Thecon trol plants re corded sig nif i cantly low est plantheight (66.44 cm) and di am e ter (0.96 cm). Thedif fer ence in the re sponse of growth pa ram e ters tovar i ous in-situ mois ture con ser va tion treat mentswas purely due to dif fer ences in the mois turehold ing and re tain ing ef fi ciency of treat ments.Better growth of the seed lings planted in a pitde pres sion may be due to more soil mois ture
Standardization of in-situ moisture conservation method for eastablishment of Aonla orchards 291
Ta ble 1: Treat ment de tails and spec i fi ca tion of in-situ mois ture con ser va tion mea sures.
Treatments Specifications
T1 : Polythene mulching Preparation of circular ring, and mulching the basin with black polythene.
T2 : Trench + straw mulching Staggered trenches of 3m length, 0.45 m width and depth across the slope wereprepared in a aligned contour. Half of the trench was filled with straw and the plantswere planted on the downstream side of the trench bund.
T3 : Submerged pitcher Placement of one submerged pitcher on upper side of the plant for rainwaterharvesting.
T4 : Pit depression Seedlings were set in a depression of 1 m width and 15 cm depth, surrounded by aring-shaped ridge with 25 cm width and 15 cm height and a 30 cm opening on thehigher side to harvest rainwater. The depression was filled with straw and coveredwith black polythene as mulch.
T5 : Control Control (no micro-catchments and no mulch).
292 Negi et al.
avail able for lon ger pe ri ods. These find ings are incon for mity with the re sults of Ghosh et al. (2),where they also noted better growth of the aonla
plants in pit like de pres sions.
The data fur ther re vealed that the trend inin crease in seed ling’s height and di am e ter inre sponse to dif fer ent in-situ mois ture con ser va tiontech niques was al most sim i lar dur ing both the years
of in ves ti ga tions.
Seed ling Sur vival
An other ben e fi cial ef fect of in-situ mois turecon ser va tion was sig nif i cant im prove ment in plantsur vival. All the treat ments ex cept poly thenemulch ing re corded sig nif i cantly higher plantsur vival per cent age over the con trol. Thetreat ments, plant ing the seed lings in pit de pres sion,and just be low the stag gered con tour trench, werefound to be more ef fec tive in in creas ing thesur vival per cent age of seed lings than othertreat ments. The treat ment es tab lish ing seed lings inpit de pres sion (T4), re corded the mean max i mumplant sur vival (93.75 per cent), which wassta tis ti cally at par with stag gered trench + strawmulch ing (89.38 per cent). The low est plantsur vival was re corded un der poly thene mulch ing
(69.38 per cent), which was at par with con trol.
These re sults are in con for mity with thefind ings of Manivannan and Desai (5), who alsore corded the max i mum sur vival of plants (89.4 percent) with stag gered con tour trench ing method ofrain wa ter har vest ing, as against 52 per cent un dercon trol and ob served that the treat ments whichen hanced growth also im proved the sur vival rate of
the plants.
Bud Sprout and Bud Sur vival
The data on the ef fect of dif fer ent rain wa terhar vest ing and mois ture con ser va tion tech niqueson bud sprout ing and bud sur vival per cent age arepre sented in Ta ble 3. The bud sprout ing and budsur vival per cent age were in flu enced sig nif i cantlyby the dif fer ent meth ods of soil mois turecon ser va tion. The max i mum sprout ing (83.75 percent) as well as bud sur vival (80.82 per cent) wasre corded in seed lings set in pit de pres sion, fol lowed by seed lings planted just be low the stag geredtrench and sub merged pitcher meth ods of mois turecon ser va tion. These ob ser va tions thus in di cate thatthe sur vival of budlings can be im proved greatly byem ploy ing in-situ mois ture con ser va tion meth ods.These ob ser va tions are in con for mity with thefind ings of Manivannan and Desai (5), whore ported that bud sprout ing and sur vival of plants
was im proved by mois ture con ser va tion meth ods.
Ta ble 2: Ef fect of in-situ mois ture con ser va tion meth ods on height, di am e ter and per cent sur vival of Aonla seed lings.
Treatment Seedling Height (cm) Seedling Diameter(cm) Survival (%)
2005-06 2006-07 Mean 2005-06 2006-07 Mean 2005-06 2006-07 Mean
T1 : Polythene mulching
68.92 74.04 71.48 0.92 0.98 0.95 73.75
(59.18)
76.25
(60.83)
75.00
(60.00)
T2 : Trench + straw mulching
75.74 86.74 81.24 0.99 1.09 1.05 87.50
(69.29)
91.25
(72.79)
89.38
(70.98)
T3 : Submerged pitcher
71.97 82.50 77.23 0.95 1.08 1.02 87.50
(69.29)
87.50
(69.29)
87.50
(69.29)
T4 : Pit depression 84.67 94.41 89.54 1.04 1.17 1.11 92.50
(74.11)
95.00
(77.08)
93.75
(75.52)
T5 : Control 64.73 68.16 66.44 0.85 0.96 0.91 68.75
(56.01)
70.00
(56.79)
69.38
(56.40)
CD (P=0.05) 4.64 3.51 2.49 0.11 0.06 0.06 6.98 7.95 5.11

The data fur ther re veal that the trend in budsprout ing and bud sur vival per cent age in re sponseto the dif fer ent rain wa ter har vest ing and in-situmois ture con ser va tion meth ods was sim i lar dur ing
the two years.
Time taken for Ini ti a tion of Bud Sprout ing and
50 per cent Sprout ing of Bud
The data per tain ing to the ef fect of dif fer entin-situ mois ture con ser va tion treat ments on thetime taken for ini ti a tion of bud sprout ing arepre sented in Ta ble 4. In the pres ent stud ies, in-situmois ture con ser va tion meth ods were ob served tocause ear lier ini ti a tion and ear lier com ple tion of 50% bud sprout ing as com pared to the con trol. Themin i mum time for ini ti a tion of bud sprout ing (14.0days) was taken by plant ing the seed lings in pitde pres sion (T4) fol lowed by plant ing seed lings justbe low the stag gered trench. The treat ment whichre sulted in ear lier ini ti a tion of bud sprout ing alsocaused ear lier com ple tion of bud sprout ing. Themean min i mum time of 24.01 and 24.08 days forsprout ing of 50 per cent buds were taken un der the plant set in de pres sion (T4) and stag gered trench +straw mulch ing (T2), re spec tively. The ear lier budsprout ing and rel a tively higher bud suc cess inseed lings planted in pit de pres sion and just be lowthe stag gered trench may be at trib uted to better sap
flow in these seed lings, which en ables the bud toheal quickly and make a strong un ion. Rel a tivelylower bud ding suc cess and de layed bud burst incon trol may be at trib uted to de creased sap flow andless seed ling di am e ter, which must have ul ti matelyin ter fered with the pro cess of bud un ion and its
heal ing.
CON CLU SION
From the re sults of these stud ies, it may becon cluded that in-situ mois ture con ser va tion ismust for better es tab lish ment and de vel op ment ofaonla plants on de graded sloppy lands, as theseed ling growth in terms of height and di am e ter,sur vival per cent age of seed lings, bud sprout andsur vival per cent age of budlings were sig nif i cantlyim proved when the plants were sub jected todif fer ent in-situ mois ture con ser va tion meth ods.Among the dif fer ent meth ods of in-situ mois turecon ser va tion, the treat ment of plant ing one monthold poly thene raised seed lings in a pit de pres sion of 1 m width and 15 cm deep, sur rounded by aring-shaped ridge with 25 cm width and 15 cmheight and a 30 cm open ing on the higher side tohar vest rain wa ter and fill ing the de pres sion withstraw and cov er ing the pit with black poly theneand per form ing patch bud ding next year dur ingend of June, which re sulted in max i mum seed ling
Standardization of in-situ moisture conservation method for eastablishment of Aonla orchards 293
Ta ble 3: Ef fect of in-situ mois ture con ser va tion meth ods on bud sprout ing and bud sur vival in Aonla.
Treatment Bud Sprouting (%) Bud Survival (%)
2006 2007 Mean 2006 2007 Mean
T1 : Polythene mulching 77.50
(61.68)
67.50
(55.24)
72.50
(58.37)
58.48
(49.88)
63.10
(52.59)
60.79
(51.23)
T2 : Trench + straw mulching 82.50
(65.27)
72.50
(58.37)
77.50
(61.68)
69.45
(56.45)
75.89
(60.59)
72.67
(58.48)
T3 : Submerged pitcher 85.00
(67.21)
70.00
(56.79)
77.50
(61.68)
71.53
(57.75)
72.77
(58.54)
72.15
(58.15)
T4 : Pit depression 90.00
(71.57)
77.50
(61.68)
83.75
(66.23)
78.27
(62.21)
83.38
(65.94)
80.82
(64.03)
T5 : Control 70.00
(56.79)
55.00
(47.87)
62.50
(52.24)
53.57
(47.05)
55.00
(47.86)
54.29
(47.46)
CD (P=0.05) 10.59 6.53 5.03 7.73 7.89 5.09

294 Negi et al.
growth and plant sur vival found to be the best in-situ mois ture con ser va tion method and may be rec om mended for re ha bil i ta tion of de graded sloppy
lands.
REF ER ENCES
1. Balooni, K. and Singh, K. (2003). In sti tu tional
fi nanc ing of for estry programmes in clud ing
af for es ta tion of waste lands in In dia: some is sues
and op tions. RAP Pub li ca tion, 14: 213-227.
2. Ghosh,S.N., Mathew, B. and Manna, S. (2002).
Ef fect of in-situ mois ture con ser va tion on
growth, yield and fruit qual ity of aonla at ini tial
stage. In dian J. Soil Cons., 30 (3): 290-293.
3. Hegde, N.G. (1987). Hand book of waste lands
de vel op ment. pp. 102.
4. Khybri, M.L., Puri, D.N. and Arora, Y.K.
(1988). Tech nol ogy de vel oped for de nuded
lands in the West ern Hi ma la yan and Val ley
Re gions. Waste lands de vel op ment and their
uti li za tion, 184-193.
5. Manivannan, S. and Desai, A.R. (2007). Ef fect
of in-situ mois ture con ser va tion prac tices on
run off, soil loss and ini tial growth of ca shew
(Anacardium occidentale). In dian J. Soil Cons.,
35(2): 147-150.
6. Pareek, O.P. (1993). Wa ter man age ment in fruit
crops. In: Ad vances in Hor ti cul ture Vol. 2, Fruit
crops Eds. K.L. Chadha and O.P. Pareek,
Malhotra Pub lish ing House, New Delhi, pp.
725-762.
7. Pareek, O.P., Sharma, B.D. and Sharma, Suneel
(1998). Waste land Hor ti cul ture, pp. 136.
8. Singh, R. (1990). Land-use planning: an inter-
regional analysis in Uttar Pradesh. Land use
planning: an inter regional analysis in Uttar
Pradesh, pp. 106.
9. Tyagi, R.K. and Yadava, R.B. (1997). Land use,
crop ping pat tern and soil fer til ity changes in
re la tion to in te grated de vel op ment of
waste lands in Ambabai vil lage of Jhansi. Range
Man ag. and Agro for., 18(1): 17-24.
Ta ble 4: Ef fect of in-situ mois ture con ser va tion meth ods on time taken for sprout ing of buds in Aonla.
Treatment Time taken for initiation ofbud sprout
Days taken for 50% sproutingof buds
2006 2007 Mean 2006 2007 Mean
T1 : Polythene mulching 14.75 16.25 15.50 25.13 26.55 25.84
T2 : Trench + straw mulching 12.75 16.00 14.38 22.45 25.70 24.08
T3 : Submerged pitcher 13.00 15.75 14.38 22.75 25.78 24.26
T4 : Pit depression 12.50 15.50 14.00 22.53 25.50 24.01
T5 : Control 16.00 16.75 16.38 25.48 27.05 26.26
CD (P=0.05) NS NS NS 2.48 NS NS

PE REN NIAL CHIL LIES GERMPLASM IDEN TI FIED AND EX PLORED
FROM BIHAR
Anil Kumar Singh, Vijai Kumar Umrao¹ and Manoj Kumar Sinha
ICAR Re search Com plex for East ern Re gion Patna-800 014 Bihar
¹De part ment of Hor ti cul ture, Ch. Shivnath Singh Shandilya (P.G.) Col lege, Machhra,Meerut-250 106 (U.P.)
ABSTRACT: Qual ity seeds are the in dis pens able ma te rial for suc cess ful crop pro duc tion.Germplasm re source con tains unique traits/genes that can be uti lized for fur ther cropim prove ment. Ex plo ra tion for col lec tion of germplasm is the quick est and sim plest method forac quir ing the de sired one. Pe ren nial type of chil lies has been iden ti fied and ex plored fromWALMI Re search farm of ICAR Re search Com plex for East ern Re gion Patna (Bihar). Thisunique germplasm has been en tered in the sev enth suc ces sive years of suc cess ful fruit ing. Such dis tinc tive ge no type could be a great value for kitchen gar den pur pose, par tic u larly in theera of nu cleus fam ily. Such prom is ing and unique germplasm can be uti lized by chil lies worker intheir re spec tive on go ing/en su ing crop im prove ment programme to re in force ment food andnu tri tional se cu rity of coun try by ef fi cient uti li za tion.
Keywords: Ex plo ra tion, germplasm, chil lies, pe ren nial, veg e ta ble.
Chillies (Capsicum annuum L.), belongs tothe Hungarian world of plants confined in thefamily Solanaceae, belongs to the genus Capsicumwith chromosome number of 24 (Ashokkumar etal., 4; and Brian et al., 8). Chillies peppers havebeen a part of the human diet in the Americas sinceat least 7500 BC. Chillies peppers originated inSouth and Central America, where they were usedby the native inhabitants for thousands of years.There is archaeological evidence at sites located insouth-western Ecuador that chillies pepperswere domesticated more than 6000 years ago(BBC, 5). A chilli is one of the first cultivated crops in the Central and South Americas (Bosland, 6) that is self-pollinating. From South and CentralAmerica, it travelled to Europe after Columbus’svoyage to Mexico in 1492 and later on spread to allover world (McClung, 12 and Pickersgill, 14). It isrich source of vitamin A and C (ascorbic acid).Vitamin C was first isolated from chillies plant. It is one of the most valuable commercial annual spicecrop grown in India. Presently, India is the largestproducer of chilli in the world owing to theavailability of improved varieties (Dash et al., 9). In India chilli is grown over an area of 7.67 lakhhectares with the production of 12.03 lakh tonnesand productivity of 1568 kg dry chilli per hectare,
(Anonymous, 2). Presently huge number of chilliesvarieties available varying in their pungency rightfrom mild sweet peppers, to the viciously hot.Hotness of the chilli is measured in Scoville units.A relatively mild pepper, such as the Jalapenocommonly found in Salsas, measures around 5000Scoville units, depending on individual variety andgrowing conditions (Basland and Vostava, 7). Thehottest peppers, like the Habanero and Serrano,measure between 80,000 and 300,000 Scovilleunits (Kosuge et al., 11 and Tembhurne and Rao,18). Chillies, in general behave like annual and forcommercial cultivation, it is grown as annual cropin all over the world. Though, life cycle of chilli isbasically governed by the climatic condition. If it is grown in temperate climate it is essentially annualin nature, whereas, if it is grown in tropicalcondition especially in most areas of north of theequator, plants may behave like perennial, thoughthey are grown as annuals plants. Though somemarked as annuals can be grown as perennialsindoors or in greenhouses (Aguilar-Meléndez, 1;and Pickersgill, 13 and 15). Though perennialbehaviour of chillies is reported by several workersbut its economical sustainability was not muchstudied due very easy in propagation throughseedling raising. This peculiarity was the main
HortFlora Research Spectrum, 1(4): 295-299 (2012) ISSN : 2250-2823
Received : 05.9.2012 Accepted : 29.9.2012

296 Singh et al.
focal point to undertake study on its perennialbehavioural study.
MA TE RI ALS AND METH ODS
An ex traor di nary plant type of chilli wasiden ti fied at the re search farm WALMI, of ICARRe search com plex for East ern Re gion Patna andthis dis tinct plant type was marked for reg u lar visit.The source of this unique germplasm was a farmstaff, who pro cured lo cal chil lies sap ling from lo cal mar ket for his kitchen gar den pur pose. Ac tu ally this plant was a sec ond gen er a tion plant trans plantedfrom the seed ling raised from the crop al readyhar vested from kitchen gar den. Ini tially up to 3years gen eral ward and watch was main tained bythe farm worker who used to pick chil lies fruits fortheir con sump tion pur pose dur ing their lunch. Ingen eral chil lies are cul ti vated as an nual forcom mer cial pur pose, across the globe. How everpe ren nial na ture is re ported in this ge nus, thoughthis phe nom e non is lim ited to the trop ics es pe cially
places near to equa tor (Jovicich and Cantliffe, 10;and Aguilar-Meléndez, 1). Since, 2-3 fruit ingsea sons is of ten, but ob vi ously, when this plant didnot shown any symp toms re gard ing com ple tion ofits lifecycle, we started tak ing care in a cav a lierfash ion, up to 4 years. Since, 5th year on wards,reg u lar train ing and prun ing was tak ing place (Fig.1 and Fig. 2a, 2b). Reg u lar, wa ter ing and weed ingwas car ried out, re quired dose of NPK and FYMwas sup ple ment to main tain un in ter rupted sup plyof es sen tial nu tri ent on reg u lar ba sis. Urea wassup ple ment at 25 days in ter vals, whereas P and Kwas sup ple mented at the in ter val of six month only.No ma jor in ci dence of pests and dis eases wereno ticed, though profilecting mea sure was takenwell in ad vance to avoid any such in ci dence. Yearly soil sam ple were ana lysed to know the soil healthsta tus. Since the soil is sandy loam in tex ture, FYMhas been added reg u larly. Train ing and prun ing ofthe plant was done in a such way that at least onebranch is al ways main tained at lower level near theground and other non pro duc tive were kept out
Fig. 1. Full and closeup view of six year old chilli plant.

(Ara et al., 3). Plant is still ac tive and bear ing fruitson reg u lar ba sis. Since 2009, when pe ren nial na ture was con firmed, data were re corded for growth,de vel op ment yield at trib utes and chil lies yieldreg u larly and com puted on yearly ba sis. It worth tomen tion here that data for first and sec ond year wasgen er ated by rais ing crop from seed har vested fromthis plant and the plant was main tained for twoyears.
RE SULTS AND DIS CUS SION
Visual observation was taken place for initialperiod of three years, and when it was come to thenotice that this plant is behaving like perennial andcompleted successfully three years of fruiting onregular basis. It was observed that plant behave like indeterminate growth habit. It is worth tomentioned that this plant by and large its phenology does not influenced by the seasons, temperatureand photoperiod. Seem to be photo-thermalinsensitive plant. It is but obvious that performanceof plant little bit slowdown during extreme cold and
hotter months of the years especially duringscratchy wind during mid May to mid June.
Data recorded during all the six years (Table1) reveals that plant height of this chilli plantincreased with the advancement of the age. At theend of first year it attains the height of 38.6cm only. Plant achieved its height of 148.2 cm at the end ofsix year. Annual fruit production by the plant wasincreased with the age. Minimum (336 fruits) wasrecorded for first year and maximum (1117 fruits)for the sixth year production. Likewise green fruitsyield was also followed the similar trend. At theend of first year green fruits yield was recorded1077g only which increased with age andmaximum 3607g was recorded at the end of sixthyear. It was recorded that fruit length was notinfluenced by the age of plant, though it wascategorized as medium size (Table 1). Similarlysingle fruit weight also did not influenced muchwith passing of time (age). Fruit length and singlefruit weight did not influenced by the age, thismight be due to traits is highly associated withgenotype, not much influenced by the age orenvironment confirming to findings of Singh andBhatt (17).
To know the changes in soil fertility status,soil samples were taken at regular interval startingfrom June, 2007 and latest by June, 2012. Soilsamples were analysed to workout initial and finalsoil fertility status to know the nutrient dynamic insoil of the perennial chilli plant (Ryan et al., 16).Data (Table 4), represent initial and final soilproperties physical parameters viz., sand, silt andclay composition of soil was not much influencedby the chilli. Bulk density of soil also did notchange. However, other parameter related to soilfertility gets influenced. N, P and K were improved significantly (Table 2). Since chilli is endowedwith professed root system, encourage morerhizospher microbial activities, substantial nutrientbuild-up was noticed. Above results indicate thatchillies plants can be grown easily without
impairing the fertility status of soils.
Perennial chillies germplasm identified and explored from Bihar 297
Fig. 2a. Chillies fruit.
Fig. 2b. Closeup of fruiting twig.

298 Singh et al.
CON CLU SION
Unique germplasm, ex plo ra tion for col lec tionof de sired traits not only strengthen and di ver sifythe gene pool of par tic u lar crop, but also proves aquick est as well as sim plest method of achiev ingob jec tive of cre at ing vari abil ity. Ex plo ra tion for
col lec tion should be an in te gral part of any plantgermplasm aug men ta tion programme. Bi en nialna ture is of ten but a pe ren nial chilli is not abusi ness as usual phe nom e non. Suc cess ful fruit ingfor six years and en tered in to sev enth year is not anor mal and sim ple event. This plant type isdef i nitely car ry ing /con tain ing some unique gene
Ta ble 1: Growth, yield at trib utes and yields of yield of chil lies plant dur ing dif fer ent years.
Years Plant
height (cm)
Fruit
length (cm)
Fruit (No/plant)
Single fruit
weight (g)
Green fruitsyield (g/
plant)
Ist 38.6 7.53 336 3.21 1077
2nd 69.5 7.38 526 3.21 1689
3rd 91.2 7.56 774 3.11 2408
4th 115.3 7.43 921 3.16 2910
5th 129.6 7.31 1115 3.09 3445
6th 148.2 7.44 1117 3.23 3607
CD (P=0.05) 14.9 NS 57.4 NS 201.3
Ta ble 2: Physiochemical prop er ties of chilli soil.
Value Sand(%)
Silt(%)
Clay(%)
SoilpH
Organic carbon
(%)
BulkDensity
(m m3)
ElectricalConduc-
tivity
(dSm-1)
NO3
(ppm)Available
Phos-phorus
(ppm)
Exchange-
able
Potassium
(ppm)
Initial 33.1 36.4 30.5 7.4 0.61 1.42 0.17 113.7 12.1 87.8
Final 32.5 36.3 31.2 7.1 0.68 1.40 0.15 131.9 13.4 97.3
Fig. 3a. One year old chilli plant Fig. 3b. Two year old chilli plant.

and ex press ing their po ten tial for reg u lar fruit ing.This ge no type be haves like photo and ther malin sen si tive line. Such po ten tial germplasm shouldbe de pos ited in Na tional Gene Bank for safecon ser va tion and na tion wide uses in cropim prove ment programme.
Ac knowl edge ment:
As sis tance re ceived by cen tral lab fa cil ity atICAR Re search Com plex for East ern Re gion Patnafor reg u lar anal y sis of soil sam ples is dulyac knowl edged.
REF ER ENCES
1. Aguilar-Meléndez, A. (2006). Ethnobotanicaland mo lec u lar data re veal the com plex ity of thedo mes ti ca tion of chil lies (Cap si cum annuum L.) in Mex ico. Ph.D. dis ser ta tion, Uni ver sity ofCal i for nia, Riv er side, Cal i for nia, USA.
2. Anon y mous (2012). De part ment of Ag ri cul tureand Co op er a tion, Min is try of Ag ri cul ture, Govt. of In dia http://www.agricoop.nic.in.
3. Ara, N., Bashar M.K., Be gum S, Kakon S.S.(2007). Ef fect of spac ing and stem prun ing onthe growth and yield of to mato. Int. J. Sus tain.Crop Prod., 2(3): 35-39.
4. Ashokkumar, G., Ponnuswami, V. and BiniSundar, S.T. (2012). Ef fects of in ducedchlorophyll mu ta tion, mutagenic ef fi ciency andef fec tive ness of gamma rays and EMS inpaparika (Cap si cum annuum L.) cv. BydagiKaddi. In dian J. Hort., 69(1): 60-64.
5. BBC News On line (2007). Chil lies heatedan cient cui sine. Fri day, 16 Feb ru ary. Avail ablefrom: http://news.bbc.co.uk/2/hi/americas/6367299.
6. Bosland, P.W. (1996). Capsicums: Innovativeuses of an ancient crop. ‘‘p. 479-487. In: J.Janick (ed.), Progress in new crops. ASHSPress, Arlington.
7. Bosland, P.W. and Vostava, E.J. (2000).Pep pers: veg e ta ble and spice cap si cum. CABIpub lish ing, New York, USA.
8. Brian M. Walsh and Sara B. Hoot, (2001).Phylo gen etic re la tion ships of Cap si cum(solanaceae) us ing DNA se quences from twononcoding re gions: the chloroplast
atpB-rbclspacer re gion and nu clear waxy introns.Int. J. Plant Sci., 162(6):1409–1418.
9. Dash, S.S., Kumar, S., and Singh, J.N. (2001).Cytomorphological char ac ter iza tion of anu clear male ster ile line of chilli pep per(Cap si cum annuum L.). Cytologia, 66(4),365-371.
10. Jovicich, E and Cantliffe D.L. (2002). Span ishpep per on trel lis sys tem and high plant den sitycan in crease fruit yield, fruit qual ity and re ducela bour in a hy dro ponic pas sive ven ti latedgreen house. Acta Hort., 588: 255- 261.
11. Kosuge, S, Inagaki, Y., Okumura H. (1961).Stud ies on the pun gent prin ci ples of red pep per.Part VIII. On the chem i cal con sti tu tions of thepun gent prin ci ples. Nip pon Nogei KagakuKaishi. J. Agric. Chem. Soc., 35: 923–927.
12. McClung de Tapia E. (1992). The or i gins ofag ri cul ture in Mesoamerica and Cen tralAmer ica. In Cow an C. W., Wat son P. J. (eds.),The or i gins of ag ri cul ture: An in ter nalper spec tive, 143–171. Smith so nian In sti tu tionPress, Wash ing ton, D.C., USA.
13. Pickersgill, B. (1971). Re la tion ships be tweenweedy and cul ti vated forms in some spe cies ofchili peppers (Cap si cum). Evo lu tion,25: 683–691.
14. Pickersgill, B. (1984). Mi gra tion of chilepep pers, Cap si cum sp., in theAmer i cas. In Stone D. (ed.), Pre-Co lum bianplant mi gra tion, 105–123. Har vard Uni ver sityPress, Cam bridge, Mas sa chu setts, USA.
15. Pickersgill, B. (1988). The ge nus Cap si cum: Amultidisciplinary ap proach to the tax on omy ofcul ti vated and wild plants. BiologischesZentralblatt., 107:381–389.
16. Ryan, J. Estefan G. and Rashid, A. (2001). Soiland Plant Anal y sis: Lab o ra tory Mannual. Int.Cen tre Agri. Res. in Dry Ar eas (ICARDA)Alep po. 172p.
17. Singh, A.K. and Bhatt B.P. (2012). Faba bean:Unique germplasm ex plored and iden ti fied.HortFlora Re s. Spec t. 1 (3): 267-269.
18. Tembhurne, B.V. and Rao S.K. (2012).Heterosis and combining ability in CMS basedhybrid chilli (Capsicum annuum L.) J. Agric.Sci., 4 (10):89-96.
Perennial chilliles germplasm identified and explored from Bihar 299

FO LIAR AP PLI CA TION OF PO TAS SIUM, CAL CIUM, ZINC AND BO RON
EN HANCED YIELD, QUAL ITY AND SHELF LIFE OF MANGO
Arvind Bhatt, N.K. Mishra, D.S. Mishra and C.P. Singh
De part ment of Hor ti cul ture, Col lege of Ag ri cul ture, G.B. Pant Uni ver sity of Ag ri cul ture andTech nol ogy, Pantnagar 263 145 (US Nagar, Uttarakhand)
AB STRACT: Mango, the na tional fruit of In dia, has de vel oped its own im por tance all over theworld. Be ing a use ful and de li cious fruit, it is the part of cul ture and re li gion since long time, andnow, it is rec og nized as one of the best fruits in the world mar ket. Cal cium and po tas siumamongst ma jor nu tri ents as well as zinc, bo ron amongst mi cro nu tri ents have been found to playa ma jor role in main te nance of mango fruit qual ity. More over, for rapid re sponse and cor rec tionof de fi cien cies of min eral nu tri ents, fo liar spray of nu tri ents es pe cially Ca, B, Zn and K have been used sin gly or in com bi na tion. The ex per i ment was con ducted on mango cv. Dashehari atHor ti cul ture Re search Cen tre, Patharchatta, G.B. Pant Univesity of Ag ri cul ture and Tech nol ogy,Pantnagar. The ex per i ment in volved the pre-har vest fo liar spray of nu tri ents at ‘mar vel stage’ ofmango fruits. The treat ments in cluded [email protected]%, Bo [email protected]%, K2SO4 @ 0.5%, Ca(NO3)[email protected]%, [email protected]%, [email protected]% and con trol. The re sults ob tained in di cated that thetrees sprayed with 0.5% bo rax showed max i mum fruit yield, fruit weight, fruit vol ume, T.S.S.,re duc ing sugar, non re duc ing sugar and ascor bic acid con tent, how ever, this treat ment found tobe at par with 1% Ca(NO3)2. While with re gard to main te nance of post har vest fruit qual ity inmango, the min i mum phys i o log i cal loss in weight was re ported in 1.0% Ca(NO3)2 fol lowed byCaCl2 (1.2%) up to the end of 12th day. Other qual ity pa ram e ters like fruit TSS, sugar andascor bic acid con tent were best main tained by bo rax, cal cium and po tas sium treat ments.
Keywords: Fo liar ap pli ca tion, Ca, B, Zn, K, mango, qual ity, shelf life.
Mango is the na tional fruit of In dia and is thema jor fruit of Asia. It has de vel oped its ownim por tance all over the world. Be ing a use ful andde li cious fruit, it is the part of cul ture and re li gionsince long time. From an cient time, it has been thefa vour ite of the kings and com mon ers be cause of its nu tri tive value, taste, at trac tive fra grance andhealth pro mot ing qual i ties and now, it is rec og nized as one of the best fruits in the world mar ket.Cal cium is an im por tant nu tri ent, plays a cru cialrole in sev eral phys i o log i cal func tions viz., fruitfirm ness re ten tion, pro tect ing the plant againstsa lin ity stress, cal lus fri a bil ity and so maticembryogenesis. Romero et al. (18) found that theap pli ca tion of cal cium as pre-har vest sprayin creased fruit qual ity of mango fruit. Singh et al.(22) re ported that the Cal cium ni trate at lowercon cen tra tion i.e. 1.0% showed ben e fi cial ef fects in pro long ing the stor age life of guava fruits. Bo ronalso af fects fruit ma tu rity and qual ity. Ac cord ing toChap man et al. (6), the fruits from the bo ronde fi cient pa paya plants ripen un evenly and have
low sugar con tent. Aly and Isamail (1) re ported that bo ron as pre har vest spray has ben e fi cial ef fect onqual ity of guava fruits. More over, for rapidre sponse and cor rec tion of de fi cien cies of min eralnu tri ents, fo liar feeding of nu tri ents es pe cially Ca,B, Zn, and K, sin gly or in com bi na tion, is ben e fi cial for ac cel er at ing de vel op ment of growth char ac ters,
flow er ing, fruit ing, qual ity and shelf life of fruits.
MA TE RI ALS AND METH ODS
The pres ent in ves ti ga tion was car ried out at
Hor ti cul ture Re search Cen tre, Patharchatta of G.B.
Pant Uni ver sity of Ag ri cul ture and Tech nol ogy,
Pantnagar dur ing 2008 (Jan u ary to July). The
pre-har vest fo liar spray of nu tri ents on 6 years old
trees of mango cv. Dashehari was done at mar vel
stage of fruits, planted at a dis tance of 10x10m. The
ex per i ment was con sisted of eight treat ments viz.
T1-1.2% CaCl2, T2-0.5% Bo rax, T3-0.5% K2SO4, T4
-1.0% Ca(NO3)2, T5-0.5% ZnSO4, T6-0.3% ZnCl2,
and T7-con trol with three rep li ca tions in ran dom ize
block de sign. There was sin gle tree per treat ment
HortFlora Research Spectrum, 1(4): 300-305 (2012) ISSN : 2250-2823
Received : 14.6.2012 Accepted : 04.8.2012

per rep li ca tion. The fruits were har vested at ma ture
stage and five fruits were taken from each tree for
re cord ing data on phys i cal and chem i cal at trib utes
of fruits. Phys i o log i cal loss in fruit weight (PLW)
and chem i cal at trib utes were re corded at ev ery 2
days in ter val up to the end of shelf life at am bi ent
stor age. The T.S.S. of fruit was re corded at room
tem per a ture us ing hand refractometer and it was
ex pressed in °Brix and chem i cal qual ity at trib utes
were de ter mined as per stan dard pro ce dure
decribed in AOAC (2).
RE SULTS AND DIS CUS SION
Ef fect on fruit weight, fruit vol ume and fruit yield
The data pre sented in Ta ble 1 re vealed thatsig nif i cantly higher fruit weight (167.29 g) andfruit vol ume (164.52 ml) were ob served with thetreat ment of 0.5% bo rax which was foundsta tis ti cally at par with treat ment 1.0% Ca(NO3)2
(163.41g and 160.11ml) and 1.2% CaCl2 (157.86gand 154.84 ml), while min i mum (143.99 and139.04 ml) was in con trol. Ap pre cia ble im prove -ment in fruit weight by bo rax ap pli ca tion has beenalso re ported by Dutta et al. (8) in li tchi and Dutta(7) in mango cv. Himsagar. The in crease in fruitweight with the sprays of bo rax was might be due to the in volve ment in hor monal me tab o lism, in creasein cell di vi sion and expension of cell. Bo ron is alsoknown to stim u late rapid mo bi li za tion of wa ter and
sugar in the fruit.
The max i mum fruit yield (28.52 kg/tree) wasre corded with the treat ment of 0.5% bo rax ascom pared to other treat ments and min i mum incon trol. Bhatia et al. (5) re ported max i mum fruitweight and con se quently the yield of guava withthe ap pli ca tion of 1.0% H3BO3. In crease in fruitweight, fruit vol ume and fruit yield in mango cv.Dashehari as pre-har vest ap pli ca tion of 0.5% bo raxwas re ported by Gaya (9). The sig nif i cant in creasein yield by bo ron ap pli ca tion may be ac cred ited tothe pos i tive ef fect of bo ron on in creas ing the ratesof car bo hy drate and RNA me tab o lism (Parr and
Loughman, 16).
Ef fect on T.S.S., re duc ing sugar, non re duc ing
sugar and ascor bic acid
A perusal of Ta ble 2 showed that fo liar spraysof nu tri ents had sig nif i cant ef fect on TSS con tent of mango fruits for dif fer ent treat ments. Max i mumT.S.S con tent (17.8 °B) was re corded in 0.5%bo rax, whereas, it was found min i mum in con trol(14.65 °B). Sim i lar re sults have also been ob tainedby Dutta (7) in guava and Gaya (9) in mango. Thein crease in T.S.S. up to cer tain pe riod sig ni fied thepe riod of ac tive syn the sis of car bo hy drates in fruits, while de clin ing trend in T.S.S fol lowed there af ter,in di cated the deg ra da tion and fer men ta tion ofsug ars sig nal ing the on set of se nes cence stage
(Ryall and Pentzer, 19).
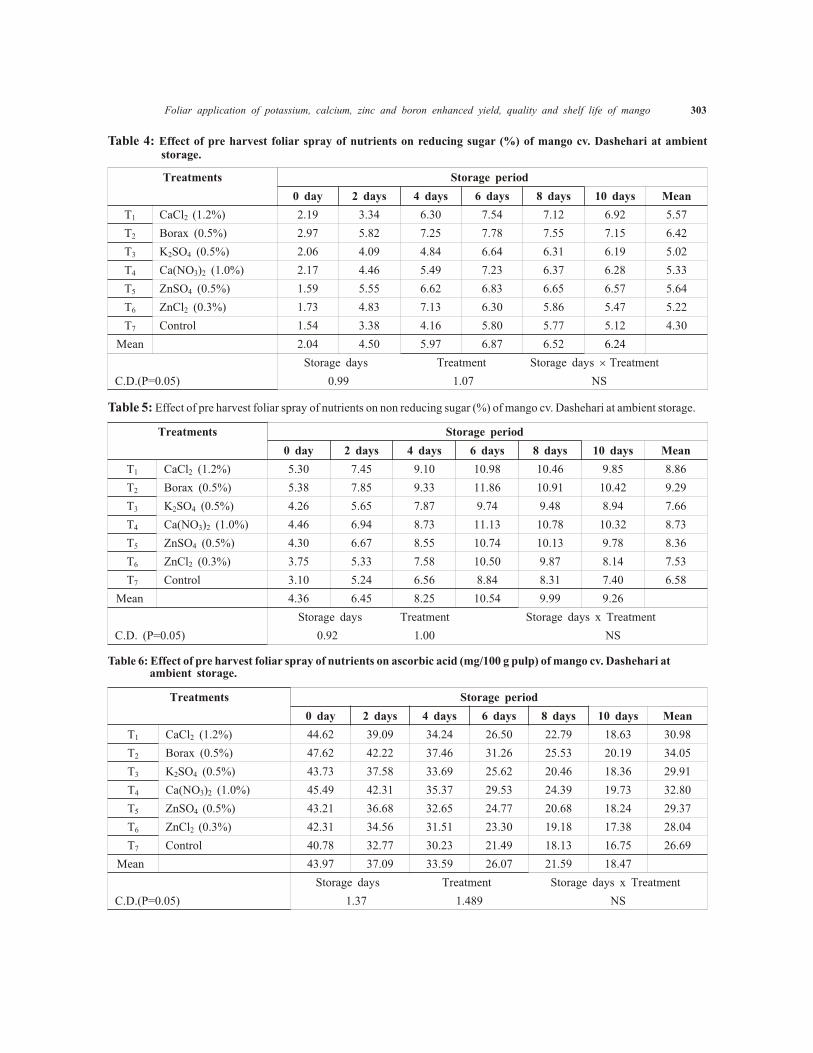
Data in di cate the max i mum re duc ing sugarcon tent (6.42 per cent) in treat ment with 0.5%bo rax which was found sta tis ti cally at par with0.5% ZnSO4 (5.64 per cent) and 1.2% CaCl2 (5.5per cent), re spec tively (Ta ble 3) and min i mum incon trol (4.30 per cent). Sim i lar re sults have beenob tained by Gaya (9). Kahlon and Uppal (11)sug gested that con ver sion of starches andpoly sac cha rides into sim ple sugar with thead vance ment of stor age was re spon si ble for thein crease of re duc ing sugar, and on ward de cline wasdue to the uti li za tion of sugar in evapo-
tran spi ra tion and other bio chem i cal ac tiv i ties.
Non re duc ing sugar was re ported to bemax i mum (9.29 per cent) in fruits treated with 0.5% bo rax which was found sta tis ti cally at par with1.2% CaCl2 (8.86 per cent), 1.0% Ca (NO3)2 (8.73per cent) and 0.5% ZnSO4 (8.36 per cent) whereas,it was found to be min i mum (6.58 per cent) incon trol (Table 4). These re sults elu ci dated thefind ings of Babu and Singh (3) and Dutta (7). It was ob served that the pro por tion of re duc ing sugarcon tent was less as com pared to non re duc ing sugar both at ripe and at the end of shelf life supporting
the findings of Sudhavani and Ravisankar (23).
It is re vealed from the Ta ble 5 that
sig nif i cantly max i mum ascor bic acid con tent
(34.05 mg/100g pulp) was re corded in 0.5% bo rax
Foliar application of potassium, calcium, zinc and boron enhanced yield, quality and shelf life of mango 301
302 Bhatt et al.
Ta ble 1: Ef fect of pre har vest fo liar spray of nu tri ents on fruit yield and phys i cal qual ity at trib utes of mango cv. Dashehari.
Treatment Fruit weight (g) Fruit volume (ml) Fruit yield (Kg/Tree)
T1-CaCl2 (1.2%) 157.86 154.84 25.73
T2-Borax (0.5%) 167.29 164.52 28.52
T3-K2SO4 (0.5%) 149.74 144.03 23.86
T4-Ca(NO3)2 (1.0%) 163.41 160.11 26.67
T5-ZnSO4 (0.5%) 154.72 149.06 24.22
T6-ZnCl2 (0.3%) 147.95 143.12 22.54
T7-Control 143.99 139.04 20.95
C.D. (P = 0.05) 11.73 12.32 1.06
Ta ble 2: Ef fect of pre har vest fo liar spray of nu tri ents on PLW of mango cv. Dashehari at am bi ent stor age.
Treatments Initial fruit
weight(g)
Physiological loss in weight (%) at different storage period (days)
3
days
4
days
6
days
8
days
10
days
12days
Mean
T1 CaCl2 (1.2%) 160.44 5.67 9.26 11.73 18.42 25.59 30.33 16.83
T2 Borax (0.5%) 183.96 5.92 10.27 14.22 22.12 27.48 34.62 19.11
T3 K2SO4 (0.5%) 154.05 6.32 8.76 12.65 17.87 26.28 32.75 17.44
T4 Ca(NO3)2 (1.0%) 175.39. 5.40 8.60 11.61 17.36 25.12 30.22 16.39
T5 ZnSO4 (0.5%) 146.98 6.42 10.41 14.51 20.17 26.73 33.46 18.62
T6 ZnCl2 (0.3%) 138.08 6.77 10.71 14.77 19.30 27.84 33.87 18.88
T7 Control 125.14 7.50 11.77 15.23 22.81 28.43 36.36 20.35
Mean — 6.29 9.97 13.53 19.72 26.78 33.09
Storage days Treatment Storage days x Treatment
C.D. (P=0.05) 0.79 0.85 NS
Ta ble 3: Ef fect of pre har vest fo liar spray of nu tri ents on TSS (°Brix) of mango cv. Dashehari at am bi ent tem per a ture.
Treatments Storage period
0 day 2 days 4 days 6 days 8 days 10 days Mean
T1 CaCl2 (1.2%) 9.53 12.67 17.60 20.27 19.23 18.67 16.32
T2 Borax (0.5%) 11.40 15.40 18.73 21.67 20.03 19.57 17.80
T3 K2SO4 (0.5%) 9.33 12.40 15.70 18.60 17.50 16.67 15.03
T4 Ca(NO3)2 (1.0%) 10.20 13.80 16.53 19.87 18.27 17.80 16.07
T5 ZnSO4 (0.5%) 8.40 14.04 18.23 20.03 19.80 18.00 16.47
T6 ZnCl2 (0.3%) 8.16 13.57 17.30 19.30 18.17 17.40 15.65
T7 Control 7.47 12.00 16.30 18.17 17.40 16.56 14.65
Mean 9.21 13.46 17.20 19.70 18.62 17.80
Storage days Treatment Storage days x Treatment
C.D.(P=0.05) 1.07 1.15 NS
Foliar application of potassium, calcium, zinc and boron enhanced yield, quality and shelf life of mango 303
T able 4: Ef fect of pre har vest fo liar spray of nu tri ents on re duc ing sugar (%) of mango cv. Dashehari at am bi ent storage.
Treatments Storage period
0 day 2 days 4 days 6 days 8 days 10 days Mean
T1 CaCl2 (1.2%) 2.19 3.34 6.30 7.54 7.12 6.92 5.57
T2 Borax (0.5%) 2.97 5.82 7.25 7.78 7.55 7.15 6.42
T3 K2SO4 (0.5%) 2.06 4.09 4.84 6.64 6.31 6.19 5.02
T4 Ca(NO3)2 (1.0%) 2.17 4.46 5.49 7.23 6.37 6.28 5.33
T5 ZnSO4 (0.5%) 1.59 5.55 6.62 6.83 6.65 6.57 5.64
T6 ZnCl2 (0.3%) 1.73 4.83 7.13 6.30 5.86 5.47 5.22
T7 Control 1.54 3.38 4.16 5.80 5.77 5.12 4.30
Mean 2.04 4.50 5.97 6.87 6.52 6.24
Storage days Treatment Storage days ́ Treatment
C.D.(P=0.05) 0.99 1.07 NS
Ta ble 5: Ef fect of pre har vest fo liar spray of nu tri ents on non re duc ing sugar (%) of mango cv. Dashehari at am bi ent storage.
Treatments Storage period
0 day 2 days 4 days 6 days 8 days 10 days Mean
T1 CaCl2 (1.2%) 5.30 7.45 9.10 10.98 10.46 9.85 8.86
T2 Borax (0.5%) 5.38 7.85 9.33 11.86 10.91 10.42 9.29
T3 K2SO4 (0.5%) 4.26 5.65 7.87 9.74 9.48 8.94 7.66
T4 Ca(NO3)2 (1.0%) 4.46 6.94 8.73 11.13 10.78 10.32 8.73
T5 ZnSO4 (0.5%) 4.30 6.67 8.55 10.74 10.13 9.78 8.36
T6 ZnCl2 (0.3%) 3.75 5.33 7.58 10.50 9.87 8.14 7.53
T7 Control 3.10 5.24 6.56 8.84 8.31 7.40 6.58
Mean 4.36 6.45 8.25 10.54 9.99 9.26
Storage days Treatment Storage days x Treatment
C.D. (P=0.05) 0.92 1.00 NS
Ta ble 6: Ef fect of pre har vest fo liar spray of nu tri ents on ascor bic acid (mg/100 g pulp) of mango cv. Dashehari at am bi ent storage.
Treatments Storage period
0 day 2 days 4 days 6 days 8 days 10 days Mean
T1 CaCl2 (1.2%) 44.62 39.09 34.24 26.50 22.79 18.63 30.98
T2 Borax (0.5%) 47.62 42.22 37.46 31.26 25.53 20.19 34.05
T3 K2SO4 (0.5%) 43.73 37.58 33.69 25.62 20.46 18.36 29.91
T4 Ca(NO3)2 (1.0%) 45.49 42.31 35.37 29.53 24.39 19.73 32.80
T5 ZnSO4 (0.5%) 43.21 36.68 32.65 24.77 20.68 18.24 29.37
T6 ZnCl2 (0.3%) 42.31 34.56 31.51 23.30 19.18 17.38 28.04
T7 Control 40.78 32.77 30.23 21.49 18.13 16.75 26.69
Mean 43.97 37.09 33.59 26.07 21.59 18.47
Storage days Treatment Storage days x Treatment
C.D.(P=0.05) 1.37 1.489 NS

304 Bhatt et al.
which was found sta tis ti cally at par with 1.0%
Ca(NO3)2 (32.80 mg/100g pulp), whereas it was
found to be min i mum (26.69 mg/100g pulp) in
con trol. Higher level of ascor bic acid by
ap pli ca tion of bo ron was due to higher con tent of
ascor bic acid as syn the sized from sugar. Al most
sim i lar re sults were also re ported by Kar et al. (2) in
pine ap ple. Losses in ascor bic acid con tent of
fruits were di rectly pro por tional to the length of
stor age pe riod. Mapson (14) sug gested that loss
in ascor bic acid on pro longed stor age is
at trib uted to the rapid con ver sion of L-ascor bic
acid into dehydro-ascor bic acid in pres ence of
ascorbinase en zyme.
Ef fect on phys i o log i cal loss in weight
The data pre sented in Ta ble 6 clearly re vealed
that min i mum loss in weight (16.39 per cent) was
re corded in treat ment with 1.0% Ca(NO3)2 which
was sta tis ti cally at par with 1.2% CaCl2 (16.83 per
cent PLW), while the max i mum loss in weight
(20.35 per cent) was re ported in con trol. Sim i lar
re sults have also been ob tained by Roychaudhary et
al. (17) in guava, Saha et al. (20) in li tchi and Gaya
(9) in mango cv. Dashehari. The in crease in
evapo-tran spi ra tion changes with prog ress of
stor age pe riod might be re spon si ble for high PLW
of fruits as re ported by Khader et al. (13). The
de crease in weight loss by the ap pli ca tion of
cal cium may be due to its role in the main te nance of
fruit firm ness, re tar da tion of re spi ra tory rates as
well as tran spi ra tion and de layed se nes cence
(Bangirth et al., 4; Jones et al., 10; Mika, 15; Singh
et al., 21).
The pre-har vest fo liar spray of nu tri ents at
mar vel stage of fruits found to be ef fec tive for
in crease in yield, qual ity and shelf life of mango cv.
Dashehari. How ever, spray of bo rax @ 0.5% was
ef fec tive for yield and qual ity, while Ca(NO3)2 @
1.0% was ef fec tive for shelf life of shelf life of
mango fruits.
REF ER ENCES
1. Aly, E.Z. and Isamail, H.A. (2000). Effect of
preharvest GA3, CaCl2 and boron treatments on
quality and enzymatic browning in Balady
guava fruits. Ann. Agric. Sci., 38 (2):
1101-1108.
2. A.O.A.C. (1980). Of fi cial Methods of Anal y sis.
As so ci a tion of Of fi cial An a lyt i cal Chem ist,
Benjaminn Frank lin Sta tion, Wash ing ton, D.C.
3. Babu, N. and Singh, A.R. (2001). Ef fect of
fo liar ap pli ca tion of bo ron, zinc and cop per on
chem i cal char ac ter is tics of li tchi (Li tchi
chinensis Sonn.) fruits. Bioved., 12 (1-2): 45-48.
4. Bangirth, P., Dilley, D.R. and Dewey, D.H.
(1972). Ef fect of post har vest cal cium treat ment
on in ter nal break down and res pi ra tion of ap ple
fruits. J. Amer. Soc. Hort. Sci., 97: 679-682.
5. Bhatia, S.K., Yadav, S., Ahlawat, V.P. and
Dahiya, S.S. (2001). Effect of foliar application
of nutrients on the yield and fruit quality of
winter season guava cv. L-49. Haryana J.
Hortic. Sci., 30 (1/2): 6-7.
6. Chap man, H.D., Glennil, J.D., Aquilizan, F.A.
and Paxton, B.F. (1978). Bo ron de fi ciency in
pa payas. Quansland Agr. J. 104: 31-34.
7. Dutta P. (2004). Effect of foliar application on
panicle growth, fruit retention and physico-
chemical characters of mango cv. Himsagar.
Indian J. Hort., 61(30): 265-266.
8. Dutta, P., Banik, A. and Dhua, R.S. (2000).
Ef fect of dif fer ent con cen tra tions of bo ron on
fruit set, fruit re ten tion and fruit qual ity of li tchi
cv. Bombai. In dian Hor t., 57 (4): 287-290.
9. Gaya (2008). Ef fect of pre har vest fo liar spray
of nu tri ents on fruit qual ity and shelf life of
mango cv. Dashehari. M.Sc. The sis, G.B. Pant
Univ. of Agric. & Tech., Pantnagar.
10. Jones, R., Wyn, G. and Lunt, O.R. (1970). The
func tion of cal cium in plant. Bot. Re view, 36:
407-423.
11. Kahlon, P.S. and Uppal, R.S. (2005). Effect of
post harvest treatments on shelf life of mango
cv. Chausa. Haryana J. Hortic. Sci., 34(1-2) :
51-53.

12. Kar, P.L., Sema, A., Maiti, C.S. and Singh, A.K.
(2002). Ef fect of zinc and bo ron on fruit and
qual ity traits in pine ap ple (Annanas comosum
L.). South In dian Hor t ., 50(1-3): 44-49.
13. Khader, S.E.S.A., Singh, B.P. and Khan, S.A.
(1988). Ef fect of GA3 as post har vest treat ment
of mango fruits on rip en ing, am y lase and
peroxidase ac tiv ity dur ing stor age, Scientia
Hort., 36: 261-266.
14. Mapson, L.W. (1970). Vi ta mins in fruits.
Sta bil ity of L-ascor bic acid. (In) Bio chem is try
of fruits and their prod ucts, Vol. 1, pp. 376-377
HUME, A.C. (Ed). Acad. Press, Lon don.
15. Mika, A. (1983). Stud ies on cal cium pen e tra tion
in to ap ple fruits af ter post har vest treat ment
with cal cium chlo ride. Acta Hort., 138: 15-21.
16. Parr, A.J. and Loughman, B.C. (1983). Bo ron
and mem brane func tions in plants. In ‘Met als’
and micro nut ri ents: up take and uti li za tion by
plants Annu. Proc. Phytochem. Soc. Eur. No. 21;
D.A. Roff and W.S. pierpoint, eds. Ac a demic
Press, Lon don. pp. 87-107.
17. Roychaudhary, R., Kabier, J., Dutta, P. and
Dhua, R.S. (1992). Effect of calcium on fruit
quality of guava. Indian J. Hort. 49(1): 27-30.
18. Romero, N.R., Saucedo, C., Gar cia, P.; Al ca zar,
J.; Hernandez, V.M. and Sanudo, R. (2006).
Fo liar ap pli ca tion of cal cium: Phys i ol ogy and
fruit qual ity of Haden mango. Terra, 24 (4):
521-527.
19. Ryall, A.L. and Pentzer, W.T. (1974). Han dling
and trans por ta tion and stor age of fruits and
veg e ta bles. The AVI Pub lish ing Com pany, Inc.,
Westport, Con nect i cut.
20. Saha, D.P., Sharma, R.K. and Maurya, K.R.
(1998). Influence of pre harvest spray of
calcium salts on chemical composition of litchi
(Litchi chinensis) fruits during storage. J.
Applied Biol., 8 (1): 62-66.
21. Singh, B.P., Gupta, O.P. and Chauhan, K.S.
(1982). Ef fect of pre har vest spray of cal cium
ni trate on the stor age life of peach. In dian J.
Agri. Sci., 52(4): 235-239.
22. Singh, R., Chaturvedi, O.P., Gaur, G.S. and
Singh, G. (2007). Ef fect of pre har vest spray of
zinc, cal cium and bo ron on the stor age be hav ior
of guava fruits cv. Allahabad safeda. Acta Hort.,
735: 633-638.
23. Sudhavani, V. and Ravishanker, C. (2002).
Effect of pre harvest spray on the shelf life and
quality of mango fruits under cold storage.
South Indian Hort., 50 (1-3): 173-177.
Foliar application of potassium, calcium, zinc and boron enhanced yield, quality and shelf life of mango 305

STUD IES ON THE EX TENT OF GE NETIC CON TAM I NA TION IN SEED
PRO DUC TION OF EX ERTED STIGMA TO MATO (Solanum lycopersicum L)
Rajinder Singh, Dilbagh Singh and J.S. Kanwar
De part ment of Veg e ta ble Crops, Punjab Ag ri cul tural Uni ver sity, Ludhiana-141 004, Punjab
E-mail: [email protected]
AB STRACT: Stud ies were con ducted at the ex per i men tal farm of Punjab Ag ri cul tural Uni ver sity, Ludhiana, dur ing Rabi sea son for three years, 2006 to 2010 to stan dard ize the min i mumiso la tion dis tance re quired for main tain ing ge netic pu rity in hy brid seed pro duc tion of ex ertedstigma (re ces sive) to mato un der open field con di tions. The ex erted stigma seed par ent withre ces sive po tato leaved seed ling marker was sown at 25 m, 50 m, 75 m, 100m, 150m, 200m and 250m dis tance away from nor mal stigma (in serted) con tam i na tor par ent cv. Cas tle Rock hav ingdom i nant cut leaf seed ling marker. The pooled data of three years in di cated that the high estper cent age of ge netic con tam i na tion of 9.26% was re corded at a dis tance of 25 m from thecon tam i na tor (Cas tle Rock). It was also ob served that there was a grad ual re duc tion incon tam i na tion level with in creas ing dis tance at 100m iso la tion dis tance of 2.56% al though it wasnot within the pre scribed max i mum per mis si ble limit of ge netic con tam i na tion (1 and 2% forfoun da tion and cer ti fied seed, re spec tively). There was zero ge netic con tam i na tion at the high est iso la tion dis tance of 150 m. In the pres ent study, in the iso la tion dis tances stud ied un til 100m, the level of con tam i na tion was well above the per mis si ble min i mum seed cer tif i ca tion stan dards (98% ge netic pu rity for cer ti fied seed). How ever, based on the pres ent study, the iso la tion dis tancere quired for main te nance of ge netic pu rity of to mato us ing ex erted stigma seed par ent for hy bridseed pro duc tion un der open field con di tions of Punjab is 150m as against the rec om mendediso la tion of 25m and 100m for pro duc tion of cer ti fied seeds of open pol li nated seeds and hy bridseeds, re spec tively.
Keywords: To mato, ge netic pu rity, iso la tion, con tam i na tion, seed pro duc tion.
Tomato (Solanium lycopersicum L) is an
important vegetable crop cultivated worldwide
owing to its economic significance. In ndia, tomato
occupies an area of 6,34,400 ha with a production
of 1,24,33,200 mt and a productivity of 19.6 mt/ha
(Annon., 1). The projected hybrid seed requirement
for regular tomatoes for next five years is 35 t
(Annon., 2). Increasing demand for hybrid seeds
could stress commercial hybrid seed production
abilities (Cheema and Dhaliwal, 6). The impurity of
the pollen source by natural crossing could lower
the genetic purity of open pollinated and hybrid
seeds (Liu et. al., 9). Hence, maintenance of genetic
purity in seed production is of critical importance
as low genetic purity see would cause heavy loss
for the seed producers. Tomato is >99% self
pollinated (Groenewegen et. al., 7). The flowers of
most commercial cultivars have a short style that
places the stigma inside the anther tube assuring
self pollination and virtually eliminating the
opportunity for outcrossing. On the contrary,
although tomato is a self pollinated crop, natural
cross pollination of 5% has been reported
(Veerarahavathatham et al., 12).
An isolation distance of l00 m is required for
certified seeds between two tomato varieties to
prevent out crossing in hybrid seed production
under open field conditions (Tunwar and Singh,
11). In any seed production programme, isolation
between two varieties is a pre·requisite to prevent
either mechanical mixture/cross pollination for the
production of breeder/foundation/ or certified
seeds.
Under normal conditions, most tomatoes have
a natural cross-pollination rate of about 2 to 5%.
Under some conditions though, this may be as high
as 50%. The incidence depends on the types of
HortFlora Research Spectrum, 1(4): 306-311 (2012) ISSN : 2250-2823
Received : 28.6.2012 Accepted : 21.7.2012

Studies on the extent of genetic contamination in seed production of exerted stigma tomato 307
insects active in the area, the existence and types of
inter-planted crops, the wind, the blossom
structure, and the blossom timing of the varieties
involved. The prescribed isolation distance for
minimum seed certification standards of genetic
purity in tomato is 50m and 25m for foundation and
certified seed respectively for open pollinated seed.
In the earlier studies on isolation in potato leaved
forms tomato, which is often a self pollinated crop,
there was no out crossing beyond 33m and 40-50m
safe isolation was recommended for open
pollinated seed production (Veeraraghavathatham
et al., 12). Some tomato varieties have exerted
stigma which means that the stigma is positioned
outside of the anther cone and it is more susceptible
to foreign pollen. In hybrid seed production of
tomato exerted stigma types with seedling markers
are used to avoid emasculation in crossing. Similar
reports of advantages of exerted style for tomato
hybrid seed production were also reported
(Atanassova, 5; Kilchieilchevsky and Dodrodkin,
8). However, in exerted stigma types used as seed
parent for hybrid seed production, slightly higher
level of cross pollination is expected due to
exposure of stigma for insect or bee pollination.
Under natural conditions, cross pollination up to
5.56% has been reported (Veeraraghavathatham et.
al., 12) and the pollinating insects are bees (Quiros
and Marcias, 10). Growing different tomato
varieties in the vicinity would enhance the chance
of contamination. The prescribed minimum seed
certification standards for open pollinated seed
production of tomato, in general, is 50m and 25m
isolation distance for foundation and certified seeds
production, respectively (Tunwar and Singh, 11).
Also, if a high proportion of natural crossing occurs
in exerted stigma types of tomato, it necessitates is
lation between tomato varieties for maintenance of
genetic purity. However, the isolation distance
varie with the many factors such as crop, breeding
behaviour, season, adjacent crops grown, natural
pollina rs, wind breaks, barriers and geographical
location of seed plot, etc., Further, there are no
systematic stu res on the isolation distance required
for maintaining genetic purity of exerted stigma
types of tomato unde Indian conditions.
Hence, objective of the present study was to
determine the extent of genetic contamination in
exerted stigma to ato under natural crossing and to
standardize the minimum isolation distance
required for maintaining gen tic purity in seed
production of exerted stigma (recessive) tomato
under open field conditions.
MATERIALS AND METHODS
Field experiments were conducted at Punjab
Agricultural University, Ludhiana in the Rabi
season of 2006, 2007 and 2008 to facilitate natural
out crossing between exerted stigma seed parent
(stigma exertion above anther cone of 2mm) with
recessive potato leaved seedling marker and normal
inserted stigma pollen parent cv. Castle Rock with
dominant cut leaved seedling marker. Adequate
precautionary measures were taken to ensure that
only the exerted stigma type and the contaminator
parent cv. Castle Rock were allowed for natural
crossing and no other tomato varieties were grown
adjacent until 200 m isolation from seed parent so
as to avoid any other cross pollination from other
varieties. The exerted stigma seed parent with
recessive potato leaved seedling marker was sown
at different isolation distances 25m, 50m, 75m,
100m, 150m, 200m and 250m distance away from
normal stigma (inserted) contaminator cv. Castle
Rock having dominant cut leaf seedling marker.
The plot size of seed parent and pollen parent was
25 m2 each. There were no border rows surrounding
the seed parent. The spacing adopted between row
to row and plant to plant was 120 cm ́ 30 cm. The
crop was sown in a randomised block design with
four replications per treatment. These maximum
distances covered in the present study are even
more than the prescribed isolation distance of 100m

308 Singh et al.
for certified seed production of hybrid seeds. It was
ensured that there were no physical barriers upto
250 m to facilitate natural outcrossing. The tomato
seed crop was raised using the recommended
package of practices. The adjacent crops near the
experimental plot were onion and wheat during all
the years. The flowering in male parent was early
by five days compared to seed parent. Continuous
flowering occurred during the months of
March-April in all the years. Observations were
recorded for per cent fruitset on natural crossing.
The weather data pertaining to the months of
flowering in the months of March and April of all
three years have been presented (Table 1) which
could also contribute to natural crossing.
The naturally crossed fruits of tomato were
collected at various isolation distances from 25m,
50m,75m ,100m, 150m, 200m and 250m from the
contaminant plot of Castle Rock and seeds were
extracted and evaluated for genetic purity by
conducting grow-out tests (GOT) in nursery in
2008, 2009 and 2010. The presence of seedling
markers facilitate easy identification of crossed and
selfed seeds in each progeny after each season
following standard procedures (Agarwal, 3) of 100
plants per replication and four replications in each
treatment were maintained in grow out tests.
The seeds were extracted from naturally
crossed fruits in various isolation distances and
sown to determine the extent of genetic
contamination in the progenies. The extent of
genetic contamination by natural crossing in seed
crop was recorded based on the number of
seedlings with cut leaf marker in the progeny which
were contaminated seeds and expressed as genetic
contamination percentage. The remaining seedlings
with potato leaf marker were selfed.
Statistical analysis of data was done using
Analysis of variance (ANOVA) for various
isolation distances after data were subjected to
angular transformation.
RESULTS AND DISCUSSION
The pooled data of three crops from the years
2006 to 20l0 on per cent fruit set and frequency of
contaminants, extent of genetic contamination in
the progeny of seed crop (exerted stigma type with
potato leaf seedling marker) at various isolation
distances from the contaminator, Castle Rock
(normal inserted stigma with cut leaf seedling
marker) are given in Table 2 and Table 3,
respectively.
The pooled data of effect of isolation distances
on per cent fruit set in exerted stigma tomato types
due to natural crossing indicated that there existed
significant differences due to isolation distances.
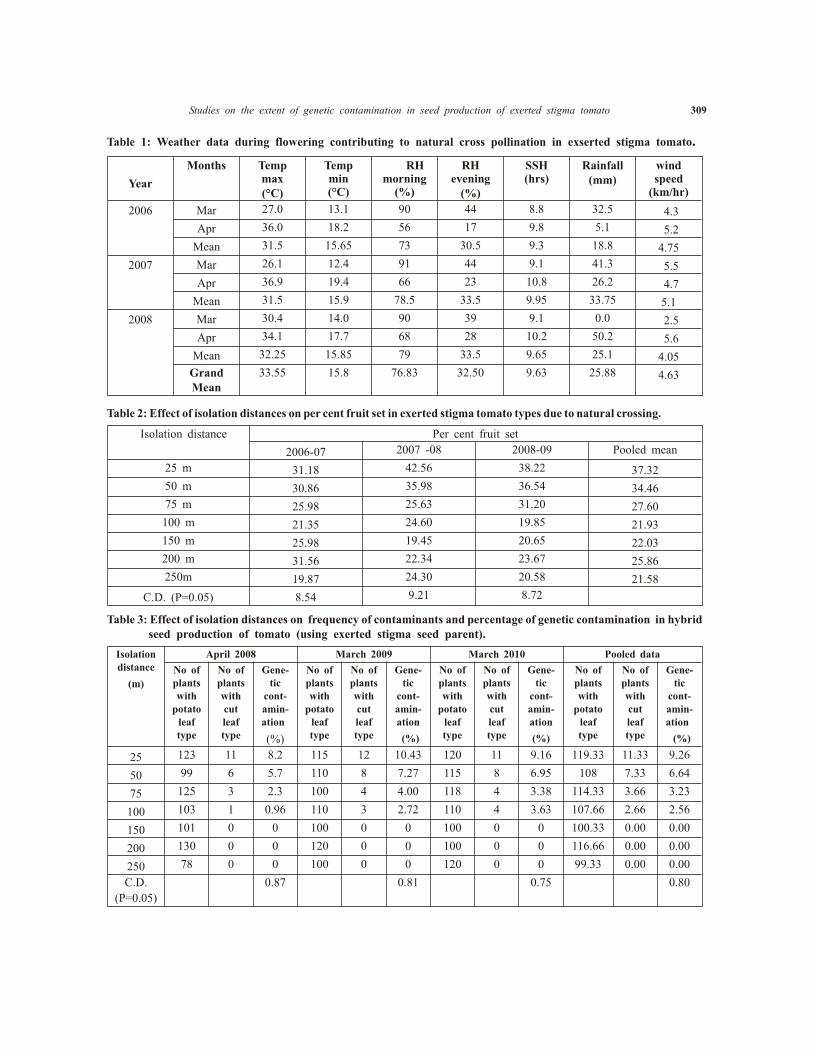
The per cent fruit set was highest at shortest
isolation distances from pollen parent compared to
longest isolation distances. The highest per cent
fruit set was highest at shortest isolation distance.
The highest per cent fruit set was recorded at 25m
isolation from pollen parent of 37.32% followed by
50m isolation (34.46%). The lowest per cent fruit
set was recorded at 250m isolation of 21.58%. The
highest per cent fruit set at 25m could be attributed
to higher natural outcrossing at shortest isolation
distance from seed parent.
Results indicated that the genetic
contamination in the progeny of seed crop (exerted
stigma type with potato leaf seedling marker)
decreased with increasing isolation distance from
the contaminator. Based on pooled data of three
years, highest percentage of genetic contamination/
outcrossing of 9.26% occurred at an isolation of
25m from the pollen parent and decreased
continuously at 6.64, 3.23 and 2.56% at larger
isolation distances of 50, 75 and l00m, respectively.
The lowest genetic contamination of 2.56% was
recorded at the highest isolation distance of l00m
isolation distance although it is not under the
Studies on the extent of genetic contamination in seed production of exerted stigma tomato 309
Ta ble 1: Weather data dur ing flow er ing con trib ut ing to nat u ral cross pol li na tion in exserted stigma to mato.
Year
Months Tempmax(°C)
Tempmin (°C)
RHmorning
(%)
RHevening
(%)
SSH(hrs)
Rainfall(mm)
windspeed
(km/hr)
2006 Mar 27.0 13.1 90 44 8.8 32.5 4.3
Apr 36.0 18.2 56 17 9.8 5.1 5.2
Mean 31.5 15.65 73 30.5 9.3 18.8 4.75
2007 Mar 26.1 12.4 91 44 9.1 41.3 5.5
Apr 36.9 19.4 66 23 10.8 26.2 4.7
Mean 31.5 15.9 78.5 33.5 9.95 33.75 5.1
2008 Mar 30.4 14.0 90 39 9.1 0.0 2.5
Apr 34.1 17.7 68 28 10.2 50.2 5.6
Mean 32.25 15.85 79 33.5 9.65 25.1 4.05
GrandMean
33.55 15.8 76.83 32.50 9.63 25.88 4.63
Ta ble 2: Ef fect of iso la tion dis tances on per cent fruit set in ex erted stigma to mato types due to nat u ral cross ing.
Isolation distance Per cent fruit set
2006-07 2007 -08 2008-09 Pooled mean
25 m 31.18 42.56 38.22 37.32
50 m 30.86 35.98 36.54 34.46
75 m 25.98 25.63 31.20 27.60
100 m 21.35 24.60 19.85 21.93
150 m 25.98 19.45 20.65 22.03
200 m 31.56 22.34 23.67 25.86
250m 19.87 24.30 20.58 21.58
C.D. (P=0.05) 8.54 9.21 8.72
Ta ble 3: Ef fect of iso la tion dis tances on fre quency of con tam i nants and per cent age of ge netic con tam i na tion in hy brid seed pro duc tion of to mato (us ing ex erted stigma seed par ent).
Isolation distance
(m)
April 2008 March 2009 March 2010 Pooled data
No of plants with
potato leaftype
No of plants withcutleaftype
Gene-tic
cont-amin-ation
(%)
No of plants with
potato leaftype
No of plants withcutleaftype
Gene-tic
cont-amin-ation
(%)
No of plants with
potato leaftype
No of plants withcutleaftype
Gene-tic
cont-amin-ation
(%)
No ofplantswith
potatoleaftype
No of plants withcutleaftype
Gene-tic
cont-amin-ation
(%)
25 123 11 8.2 115 12 10.43 120 11 9.16 119.33 11.33 9.26
50 99 6 5.7 110 8 7.27 115 8 6.95 108 7.33 6.64
75 125 3 2.3 100 4 4.00 118 4 3.38 114.33 3.66 3.23
100 103 1 0.96 110 3 2.72 110 4 3.63 107.66 2.66 2.56
150 101 0 0 100 0 0 100 0 0 100.33 0.00 0.00
200 130 0 0 120 0 0 100 0 0 116.66 0.00 0.00
250 78 0 0 100 0 0 120 0 0 99.33 0.00 0.00
C.D.
(P=0.05)
0.87 0.81 0.75 0.80

310 Singh et al.
prescribed maximum permissible limit of genetic
contamination. There was completely no genetic
contamination at isolation distance of and beyond
150m.
Statistical analysis of percentage of genetic
contamination revealed that there were significant
differences among the various isolation distances
studied for the extent of genetic contamination in
the three years. The present study revealed that as
the isolation distance increased from 25m to l00m,
per cent contamination in the progeny of seeds crop
(exerted stigma type with potato leaf seedling
marker) decreased. The minimum genetic purity
standards for Foundation and Certified seeds are 99
and 98 per cent, respectively. Self-pollinated
vegetable seed crops exhibit lesser degree of
variation as compared to cross-pollinated
vegetables. However, genetic contamination even
in self pollinated vegetables like tomato affects in
such a way that any specific character bred into a
variety is likely to be lost because of genetic
contamination (Arya, 4).
In the present study, significant differences
existed between the different isolation distances
studied as the level of contamination is well above
the permissible minimum seed certification
standard, it is risky to reduce the prescribed
isolation distance of certified seeds to l00m in
exerted stigma potato leaved tomato forms for
hybrid seed production. The higher levels of
genetic contamination until 100m isolation could
be attributed to a relative abundance of natural
pollinators on long exerted stigma tomato types
under the conditions of Punjab. The occurrence of
natural pollinators i.e., honey bee species, Apis
mellifera were observed in morning hours (7-10
am). The natural crossing would have been oured
due to t e foraging bees on exerted stigma from the
adjacent crops near the experimental plot of onion d
wheat during all the years. Also the mean maximum
temperature of 33.5°C, maximum sunshine hours of
9.63 and wind speed of 4.63 km/hour would have
favoured anther dehiscence and pollen dispersal by
bees in the location. The present findings of genetic
contamination until l00m isolation distance are in
contrast to Veeraraghavathalam et. al. (12) who
reported that the safe isolation distance in potato
leaved tomato was 40-50m at Coimbatore, Tamil
Nadu conditions. There was zero genetic
contamination at the highest isolation distance of
150 m.
The prescribed isolation distance for certified
seed production of tomato for open pollinated and
hybrid seeds is 25 and 100 m, respectively.
However, the prescribed isolation distance would
drastically affect the genetic purity in exerted
stigma tomato under conditions of Punjab
Agricultural University, Ludhiana. Hence,the
minimum isolation distance required to be
maintained for tomato open pollinated seed and
hybrid seed production using exerted stigma Ex-3
as seed parent (without emasculation) is 150 m
under Punjab Agricultural University, Ludhiana
conditions.
REF ER ENCES
1. Annonymous (2010). Indian Hort. Databse :
www.nhb.gov.in.
2. Annonymous (2010). National SeedAssociation of India. and www.nsai.co.in.
3. Agarwal, P.K. (1993). Handbook of Seed
Testing. Ministry of Agriculture. GOI. NewDelhi. 1-130.
4. Arya, Prem Singh (1999). Veg e ta ble seed
pro duc tion-prin ci ples. Kalyani Publishers.78-82.
5. Atanassova, B. (1999). Func tional male ste ril ity
(ps-2) in to mato (Lycopersicon esculentum
Mill) and its ap pli ca tion in breed ing and hy brid seed pro duc tion. Euphytica, 107:13-21.
6. Cheema, D.S. and Dhaliwal, M.S. (2005).Hy brid to mato breed ing. J. New Seeds, 6
(2-3):1-14.
7. Groenewegen, C., G. King and George, B.F.
(1994). Nat u ral cross pol li na tion inCal i for nia com mer cial to mato fields. Hort.Sci ., 29:1088.
8. Kilcheilchevsky, A. and Dodrodkin, M. (2000).
Use of func tional male ste ril ity in seed
pro duc tion of to mato hy brids. Acta Physio-
logiae–Plantarum, 22(3) :232-234.
9. Liu, L.W., X.L. Hou, Y.Q. Gong, Y.M. Zhang,
K.R. Wang and J.F. Zheng. (2004).Ap pli ca tion of mo lec u lar marker in va ri etyiden ti fi ca tion and ge netic pu rity test ing inveg e ta ble crops. Mol. Plant Breed., 2:563-568.
10. Quiros, C.F. and A. Marcias, A. (1978). Natural
cross pollination and pollinator bees of thetomato in Celaya, Central Mexico. Hort.Sci. 13(3):290-291.
11. Tunwar, N.S. and Singh, S.V. (1988). Indian
minimum seed certification standards, Central Seed Certification Board, New Delhi.
12. Veeraraghavathatham, D., Auxcilia, J., Shoba,
N. and Veena Amarnath. (2005). Stud ies onnat u ral cross pol li na tion in to mato(Lycopersicon esculentum Mill). Crop Re s.,29(1):169-170.
Studies on the extent of genetic contamination in seed production of exerted stigma tomato 311

VEG E TA BLE TYPE PIGEONPEA GERMPLASM IDEN TI FIED AND
EX PLORED FROM VAISHALI DIS TRICT OF BIHAR
Anil Kumar Singh
ICAR Re search Com plex for East ern Re gion, Patna-800 014 Bihar
AB STRACT: Ge netic re sources are the ba sic ma te rial for any crop im prove ment programme,ob vi ously be cause they con tain some unique traits/gene. Ex plo ra tion for col lec tion of germplasm is the quick est and sim plest method for ac quir ing the de sired one. In dian is world’s big gest home of veg e tar ian in hab it ants and le gumes are main source of pro tein in their diet, pods arecon sumed fresh, or pro cessed as veg e ta ble ei ther dried seed are used as dal or va ri ety ofprep a ra tion. A veg e ta ble type pi geon pea of pe ren nial na ture has been iden ti fied and ex ploredfrom Vaishali dis trict of Bihar. Such pro mis ing and unique germplasm could be uti lized by pi geonpea workers in their re spec tive crop im prove ment programme to re in force ment food andnu tri tional se cu rity of coun try by ef fi cient uti li za tion.
Keywords: Ex plo ra tion, germplasm, pi geon pea, pe ren nial, veg e ta ble.
India is world’s largest homeland ofvegetarian population and world leader in pulsesproduction and impart to provide proteinsupplements. Indian pulse production has beenstruck in between 14 and 15 Mt since mid-nineties,resulting in poor consumption (33 g/capita/day)during 2010 (Ali and Gupta, 1). Pigeonpea(Cajanus cajan (L.) Millspaugh) is a leguminousshrub that can attain heights of 5 m. It is anephemeral perennial (short lived) and is invariablycultivated as annual crop, except in backyard forvegetable purpose. The centre of its origin is theeastern part of peninsular India, including the stateof Orissa, where the closest wild relatives (Cajanuscajanifolia) occur in tropical deciduous woodlands. The crop is known to be grown in 22 countries butit is cultivated in large areas only in a few countries(Saxena et al., 5). Pigeonpea cultivars are grown for vegetable purpose, in the same way as a normalpigeonpea crop, however pods are harvested at themilking to dough stage of its development. Themain stream accepted vegetable pigeon peavarieties should have long pods with large sweetseeds, which can easily be separate from the podshell. In India, most of consumers prefer greenpodded pigeonpea for vegetable purpose. Theseusually charge a higher price than stripped ones, orpods of other colours (Saxena et al., 7; and Singh etal., 8).
Considerable diversity exists also in case of
vegetable pigeonpea. Important growth anddevelopment traits (determinate/non-determinate),along with the nature of branching play animperative role in determining its plant type. Fewgenotypes are erect and compact with narrowbranching while in others the angle of branchesopen giving the appearance of semi-spread orspreading plants. Substantial variation is observedfor plant height. In conventional germplasm thesetwo characters have a considerable range with astrong environmental effect, depending on theplanting time (Wallis et al., 11; and Saxena et al.,6). In vegetable type genotype of pigeonpea normal sugar levels are around 5.0%; but researchers atICRISAT have identified varieties, such as ICP7035, with a sugar content as high as 8.8% (Saxenaet al., 3; and Saxena et al., 4). Pigeonpea grown for domestic use in backyards are maintained up to 3-4years and attain a plant height of well over 3 m. The plants start flowering at the onset of short days andimmature pods. However, optimum plantpopulation of 250,000 – 325,000 plants /ha is quitegood for early maturing vegetable type varietieswhereas in contrast to long duration non-determinate types, which require 45,000–52,000plants/ ha for optimum yields, since pigeonpea isknown to be highly sensitive to environmentalfactors (Saxena et al., 4). Keeping view the abovefacts this work was taken on priority. As Singh andBhatt (9) explained exploration for collection of
HortFlora Research Spectrum, 1(4): 312-317 (2012) ISSN : 2250-2823
Received : 10.9.2012 Accepted : 29.9.2012

germplasm is one of the best, simplest and quickestmethods of enriching of gene pool of any cropcommodity.
MA TE RI ALS AND METH ODS
One unique accession was identified and
marked for regular visit. This germplasm was
marked while author was on visit to review the
progress of an ongoing research project. This
unique pigeon pea was spotted and marked by me
in the month of July 2010, I enquired to the farmers
about the plant and other related information. He
was unable to satisfy me, he simply told me, that
since this is rice field, I never grown pigeon pea.
Vegetable type pigeonpea germplasm identified and explored from Vaishali district of Bihar 313
Fig. 1: Perennial and vegetable pigeon pea at pre-flowering stage and along with bunch of pods during first year.
Ta ble 1: Di ver sity in veg e ta ble type pigeonpea germplasm of dif fer ent re gions.
Region No. of
accessions
Days to Plantheight
(cm)
Seeds
pod-1
Pods
plant-1
Podlength
(cm)
flower mature
Eastern Africa 106 117 – 229 166 – 270 130 – 270 5.4 – 6.7 26 – 406 5 – 12
Southern Africa 17 131 – 194 163 – 260 185 – 260 5.4 – 6.1 33 – 154 5 – 11
Central Africa 4 141 – 166 215 – 232 200 – 230 5.4 – 5.6 74 – 130 7 –9
Western Africa 13 142 – 156 194 – 218 170 – 250 5.4 – 5.6 67 – 246 7 – 10
Central America 26 106 – 151 167 – 202 85 – 240 5.4 – 7.2 19 – 160 7 – 11
South America 16 132 – 158 182 – 230 100 – 285 5.4 – 6.1 27 – 420 5 – 11
South Asia 39 80 – 175 133 – 235 85 – 230 5.4 – 7.2 55 – 830 3 – 9
South-east Asia 8 134 – 201 190 – 264 140 – 210 5.4 – 5.9 24 – 119 5 – 9
Europe 2 156 – 174 222 – 237 210 – 260 5.4 – 5.8 137 9
Total 231 80 – 229 133 – 270 85 – 285 5.4 – 7.2 19 – 830 3 – 11
Source: Adopted from Saxena et al. (4).

314 Singh
He told one interested thing , that due to creation of
pond some cow dung is used and this pigeon pea
seeds may me brought along with cow dung to this
place, and get germinated before time on the bank
of the pond, an at 4-5- feet elevation (Fig.1 and 2). I
requested him to kindly protect this plant and have
some watch and ward. I was in touch with farmer to
know the growth and development and phenology
of this unique plant type. Every time during our
visit to the project site, I discussed with concerned
farmers about the progress of the pigeon pea plant.
Being legume, gifted with the unique ability of
indeterminate growth habit, vegetative and
reproductive growth was taken place simult-
aneously after initial thrust. June germinated
plants, comes in to reproductive phase in second
week of November. Anthesis, first flowerings starts
in the second week of November and behaves like
perennial and continued to month of March next
year. Data were recorded for growth and
development. Since the size of pod and seed was
amazing and was easy to peal with sweet in nature,
encourage to further study for its suitability towards
vegetable type. Accordingly, observations were
taken and simultaneously data were recorded on
growth and development yield attributes and pod
yield.
RE SULTS AND DIS CUS SION
Tax on omy and clas si fi ca tion of ex plored
pigeonpea
The great bot a nist Linnaeus (1753) gavepigeonpea its first bi no mial no men cla ture – Cytisus cajan. Van der Maesen (10) re ported that the firstsci en tific name of pigeonpea was given by Bauhinand Cherler dur ing 1650- 1651 and they called itAr bor trifolia in dica (Thora Paerou), which means‘com mon dal’ in the Malayalam lan guage of In dia.Van der Maesen (10) has writ ten an ex cel lentmono graph on this as pect and at pres ent thefol low ing tax o nom i cal clas si fi ca tion is glob allyac cepted. Based on var i ous mor pho log i cal,cy to log i cal, chem i cal and hy brid iza tion data, Vander Maesen (10) merged ge nus Atylosia, the near est wild rel a tive of pi geon pea, with ge nus Cajanus.Con se quently, ge nus Cajanus now has 32 spe ciesand pi geon pea (Cajanus cajan) is the lone
cul ti vated spe cies of the Cajaninae sub-tribe.
Or der: Fabales
Tribe: Phaseoleae
Sub-tribe: Cajaninae
Fam ily: Leguminosae
Ge nus: Cajanus
Species: cajan
Fig. 2 : Perennial and vegetable piegeon pea along with bunch of pods during subsequent year.
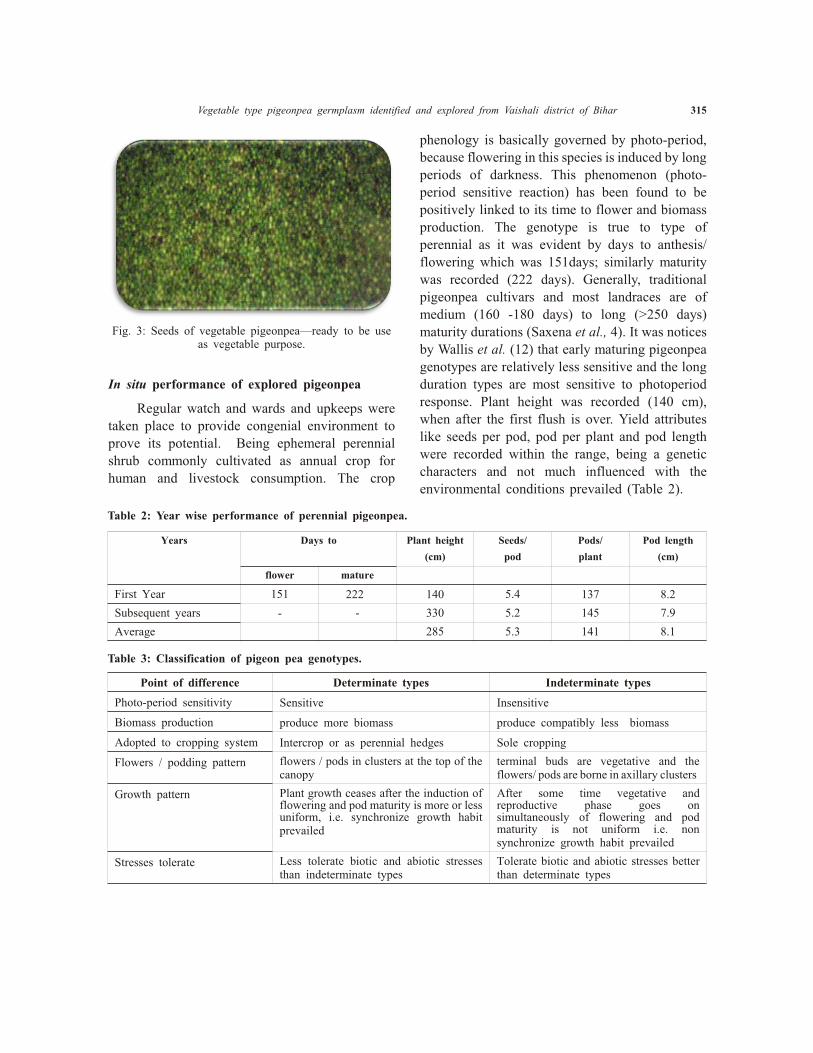
In situ per for mance of ex plored pigeonpea
Regular watch and wards and upkeeps weretaken place to provide congenial environment toprove its potential. Being ephemeral perennialshrub commonly cultivated as annual crop forhuman and livestock consumption. The crop
phenology is basically governed by photo-period,because flowering in this species is induced by long periods of darkness. This phenomenon (photo-period sensitive reaction) has been found to bepositively linked to its time to flower and biomassproduction. The genotype is true to type ofperennial as it was evident by days to anthesis/flowering which was 151days; similarly maturitywas recorded (222 days). Generally, traditionalpigeonpea cultivars and most landraces are ofmedium (160 -180 days) to long (>250 days)maturity durations (Saxena et al., 4). It was noticesby Wallis et al. (12) that early maturing pigeonpeagenotypes are relatively less sensitive and the longduration types are most sensitive to photoperiodresponse. Plant height was recorded (140 cm),when after the first flush is over. Yield attributeslike seeds per pod, pod per plant and pod lengthwere recorded within the range, being a geneticcharacters and not much influenced with theenvironmental conditions prevailed (Table 2).
Vegetable type pigeonpea germplasm identified and explored from Vaishali district of Bihar 315
Fig. 3: Seeds of vegetable pigeonpea—ready to be useas vegetable purpose.
Ta ble 2: Year wise per for mance of pe ren nial pigeonpea.
Years Days to Plant height
(cm)
Seeds/
pod
Pods/
plant
Pod length
(cm)
flower mature
First Year 151 222 140 5.4 137 8.2
Subsequent years - - 330 5.2 145 7.9
Average 285 5.3 141 8.1
Ta ble 3: Clas si fi ca tion of pi geon pea ge no types.
Point of difference Determinate types Indeterminate types
Photo-period sensitivity Sensitive Insensitive
Biomass production produce more biomass produce compatibly less biomass
Adopted to cropping system Intercrop or as perennial hedges Sole cropping
Flowers / podding pattern flowers / pods in clusters at the top of thecanopy
terminal buds are vegetative and theflowers/ pods are borne in axillary clusters
Growth pattern Plant growth ceases after the induction offlowering and pod maturity is more or lessuniform, i.e. synchronize growth habitprevailed
After some time vegetative andreproductive phase goes onsimultaneously of flowering and podmaturity is not uniform i.e. nonsynchronize growth habit prevailed
Stresses tolerate Less tolerate biotic and abiotic stressesthan indeterminate types
Tolerate biotic and abiotic stresses betterthan determinate types
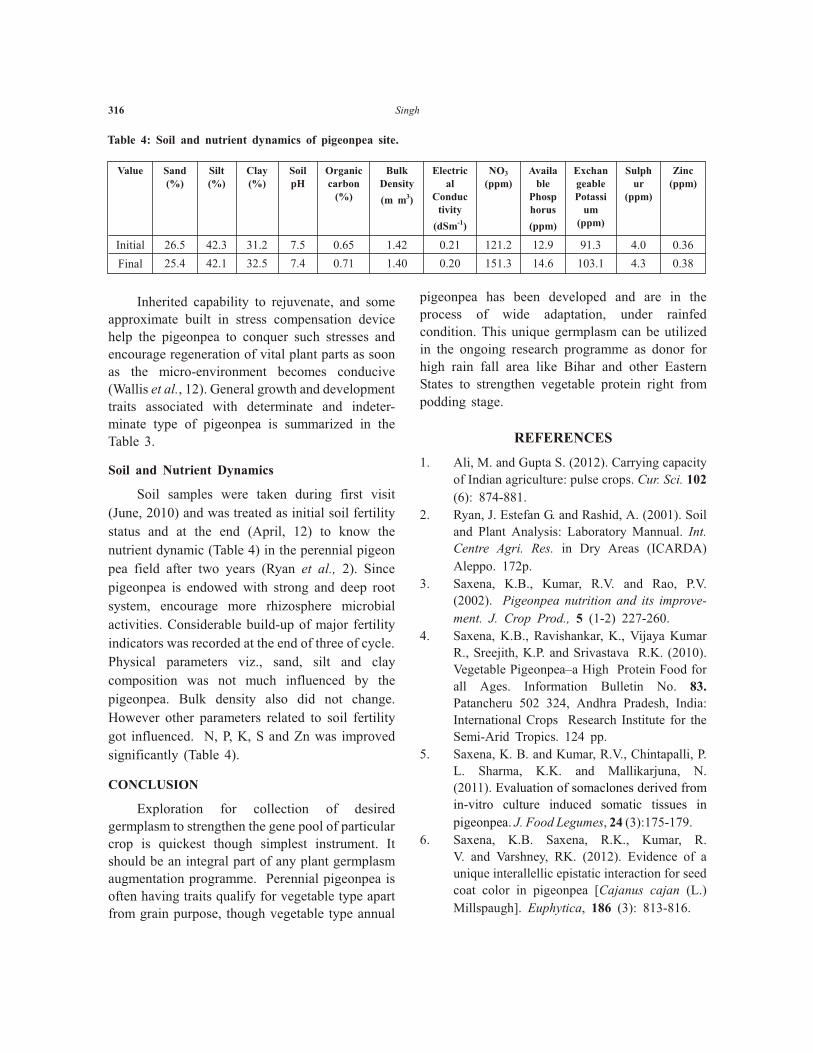
316 Singh
Inherited capability to rejuvenate, and someapproximate built in stress compensation devicehelp the pigeonpea to conquer such stresses andencourage regeneration of vital plant parts as soonas the micro-environment becomes conducive(Wallis et al., 12). General growth and development traits associated with determinate and indeter-minate type of pigeonpea is summarized in theTable 3.
Soil and N utri ent Dy namics
Soil samples were taken during first visit
(June, 2010) and was treated as initial soil fertility
status and at the end (April, 12) to know the
nutrient dynamic (Table 4) in the perennial pigeon
pea field after two years (Ryan et al., 2). Since
pigeonpea is endowed with strong and deep root
system, encourage more rhizosphere microbial
activities. Considerable build-up of major fertility
indicators was recorded at the end of three of cycle.
Physical parameters viz., sand, silt and clay
composition was not much influenced by the
pigeonpea. Bulk density also did not change.
However other parameters related to soil fertility
got influenced. N, P, K, S and Zn was improved
significantly (Table 4).
CONCLUSION
Ex plo ra tion for col lec tion of de siredgermplasm to strengthen the gene pool of par tic u lar crop is quick est though sim plest in stru ment. Itshould be an in te gral part of any plant germplasmaug men ta tion programme. Pe ren nial pigeonpea isof ten hav ing traits qual ify for veg e ta ble type apartfrom grain pur pose, though veg e ta ble type an nual
pigeonpea has been de vel oped and are in thepro cess of wide ad ap ta tion, un der rainfedcon di tion. This unique germplasm can be uti lizedin the on go ing re search programme as do nor forhigh rain fall area like Bihar and other East ernStates to strengthen veg e ta ble pro tein right from
podding stage.
REF ER ENCES
1. Ali, M. and Gupta S. (2012). Car ry ing ca pac ity
of In dian ag ri cul ture: pulse crops. Cur. Sci. 102
(6): 874-881.
2. Ryan, J. Estefan G. and Rashid, A. (2001). Soil
and Plant Anal y sis: Lab o ra tory Mannual. Int.
Cen tre Agri. Res. in Dry Ar eas (ICARDA)
Alep po. 172p.
3. Saxena, K.B., Kumar, R.V. and Rao, P.V.
(2002). Pigeonpea nutrition and its improve-
ment. J. Crop Pro d., 5 (1-2) 227-260.
4. Saxena, K.B., Ravishankar, K., Vijaya Kumar
R., Sreejith, K.P. and Srivastava R.K. (2010).
Veg e ta ble Pigeonpea–a High Pro tein Food for
all Ages. In for ma tion Bul le tin No. 83.
Patancheru 502 324, Andhra Pradesh, In dia:
In ter na tional Crops Re search In sti tute for the
Semi-Arid Trop ics. 124 pp.
5. Saxena, K. B. and Kumar, R.V., Chintapalli, P.
L. Sharma, K.K. and Mallikarjuna, N.
(2011). Evaluation of somaclones derived from
in-vitro culture induced somatic tissues in
pigeonpea. J. Food Le gumes, 24 (3):175-179.
6. Saxena, K.B. Saxena, R.K., Kumar, R.
V. and Varshney, RK. (2012). Evidence of a
unique interallellic epistatic interaction for seed
coat color in pigeonpea [Cajanus cajan (L.)
Millspaugh]. Euphytica, 186 (3): 813-816.
Ta ble 4: Soil and nu tri ent dy namics of pigeonpea site.
Value Sand(%)
Silt(%)
Clay(%)
SoilpH
Organic carbon
(%)
BulkDensity
(m m3)
Electrical
Conductivity
(dSm-1)
NO3
(ppm)Availa
blePhosphorus
(ppm)
ExchangeablePotassi
um(ppm)
Sulphur
(ppm)
Zinc(ppm)
Initial 26.5 42.3 31.2 7.5 0.65 1.42 0.21 121.2 12.9 91.3 4.0 0.36
Final 25.4 42.1 32.5 7.4 0.71 1.40 0.20 151.3 14.6 103.1 4.3 0.38
7. Saxena, N.P., Gowda, C.L.L., Kumar, R. V.,
Mula, M., Sul tana, R., Vales, I., Nadarajan,
N. Li, Z. Xiaxao, Z. and Kyu, K.L. (2010).
Hybrid breeding in grain legumes—a success
story of pigeonpea. In: CLAN Meet ing,
No vem ber 26-28, 2010, Teh ran, Iran.
8. Singh, U., Rao, P.V., Saxena, K.B. and Singh L.
(1991). Chem i cal changes at dif fer ent stages of
seed de vel op ment in veg e ta ble pigeonpeas
(Cajanus cajan). J. Sci . Food and Ag ri .,
57(1):49-54.
9. Singh, A. K. and Bhatt B. P. (2012). Faba bean:
Unique germplasm ex plored and iden ti fied.
HortFlora Re s., Spec trum, 1 (3): 267-269.
10. Van der Maeson, L. J. G. (1995). Pigeonpea
Cajanus cajan, pp. 251–5 in Smartt, J. and
Simmonds, N. W. (eds.), Evo lu tion of Crop
Plants. Essex: Longman.
11. Wallis, E.S., Faris, D.G., Elliot R. and Byth, D.
E. (1986). Va ri etal im prove ment of pigeonpea
for small holder live stock pro duc tion sys tems.
Work shop on Crop-Live stock Sys tems Res.,
Khon Kaen, Thai land, July 7-11, 1986. IRRI,
Los Banos, Phil ip pines.
12. Wallis, E.S., Byth, D.E. and Saxena, K.B.
(1981). Flowering responses of thirty-seven
early maturing lines of pigeonpea. Pages
143-150 in International Workshop on
Pigeonpeas, Vol 2, 15-19 December 1980,
ICRISAT, Patancheru, Andhra Pradesh, India.
Patancheru 502 324, Andhra Pradesh, India:
International Crops Research Institute for the
Semi-Arid Tropics.
Vegetable type pigeonpea germplasm identified and explored from Vaishali district of Bihar 317

QUAL I TA TIVE EF FECT OF WRAP PING AND CUSH ION ING MA TE RI -
ALS ON GUAVA FRUITS DUR ING STOR AGE
Deepak Chandra and Rajesh Kumar
De part ment of Hor ti cul ture, G.B.Pant Uni ver sity of Ag ri cul ture and Tech nol ogy, Pantnagar 263145,Uttarakhand, In dia
Email. [email protected]
AB STRACT : The aim of the pres ent study was to in ves ti gate the ef fect of wrap ping andcush ion ing ma te ri als on guava (Psidium guajava L.) fruits dur ing stor age. Fruits were packed indif fer ent wrap ping and cush ion ing ma te ri als viz. Tis sue pa per, Cling wrap, Ba nana leaves andTeak leaves as wrap ping ma te ri als, Neem leaves, Rice straw and Bam boo leaves as cush ion ingma te ri als and con trol. All the treat ments were kept at controlled room tem per a ture (25±2°C),rel a tive hu mid ity (85±5%) in cor ru gated fi bre board (CFB) boxes. The ef fec tive ness of thetreat ments was as sessed in terms of its im pact on fruit ap pear ance, weight loss, to tal sol u blesol ids (TSS), titratable acid ity, ascor bic acid con tents and to tal sug ars. It was found thatwrap ping of fruits with cling wrap showed better re sult for most of the pa ram e ters rat ing fol lowedby wrap ping with teak leaves. In organoleptic rat ings fruits wrapped in teak leaves showed better re sult while poor rat ing was re corded in cling wraps.
Keywords: Cush ion ing, guava, organoleptic, qual ity wrap ping, stor age.
Guava (Psidium guajava L.) is one of themost im por tant fruit crops of trop i cal andsub-trop i cal re gions of In dia. It is one of thecom mon est fruits liked by poor and the rich peo ple.
The whole fruit is ed ible along with skin. Dueto high cal o rific value guava fruits have achievedfame as “Poor man’s Ap ple” in In dia (Singh, 10).Guava tree are very hardy, long lived/ pro lificbearer and need com par a tively less at ten tion whichmakes its cul ti va tion more re mu ner a tive (Tyagi and Patel, 12). In dia has great po ten tial to pro duce high qual ity guava fruits and to ex port them to othercoun tries how ever its mar ket abil ity is still lim itedto lo cal mar ket. This is due to the del i cate na ture offruit, poor han dling prac tices and in ad e quatestor age fa cil i ties. There fore, proper han dlingtech nique and con trol of the rip en ing pro cess arecru cial for the better shelf life of guava fruits. Useof proper pack ag ing ma te rial is a vi tal com po nentof post har vest man age ment. The ef fi ciency ofdif fer ent wrap ping and cush ion ing ma te ri als var iesfrom fruit to fruit. There fore, se lec tion of suit ablepack ag ing ma te rial is of prime im por tance forbetter shelf life of fruits. The pres ent in ves ti ga tionwas car ried out on win ter guava fruits to study the
ef fect of var i ous wrap ping and cush ion ingma te ri als on shelf life of guava.
MA TE RI ALS AND METH ODS
Pres ent stud ies were car ried out in PostGrad u ate Lab o ra tory of De part ment ofHor ti cul ture, Gobind Ballabh Pant Uni ver sity ofAg ri cul ture and Tech nol ogy, Pantnagar dur ingOc to ber and No vem ber 2010. Fully ma ture fruits of guava cv. Pant Prabhat at green col our werehar vested. These fruits were packed in cor ru gatedfi bre board boxes (CFB). Fruits were wrapped intis sue pa per, cling wrap, ba nana leaves and teakleaves. Cush ion ing was done by keep ing thecush ion ing ma te ri als be tween the two rows of fruits in side the CFB boxes. Neem leaves, rice straw andbam boo leaves were used as cush ion ing ma te ri als(Fig. 1). Ob ser va tions for all the pa ram e ters werere corded af ter 4th and 7th day of stor age. Per centloss in weight was de ter mined by cal cu lat ingdif fer ence be tween ini tials weight and weight af terstor age and this value is changed into per cent age.TSS was re corded with the help of handrefrectometer at room tem per a ture. Acid ity andascor bic acid were de ter mined by titrametricmeth ods as de scribed by A.O.A.C. (1) andRanganna (7). To tal sugar and pec tin con tent were
HortFlora Research Spectrum, 1(4): 318-322 (2012) ISSN : 2250-2823
Received : 23.7.2012 Accepted : 18.8.2012

de ter mined by method as de scribed by Rangana(1986). TSS: ac ids ra tio was cal cu lated by di vid ingT.S.S. by acid per cent. Organoleptic rat ing wasdone by a panel of four judges tak ing intocon sid er ation tex ture, ap pear ance and taste. Thedata was ana lysed sta tis ti cally us ing com pletelyran dom ised de sign (CRD) and crit i cal dif fer ence(C.D.) was cal cu lated at 5 per cent. The per centdata were trans formed an gu larly when ever seemedfit.
RE SULTS AND DIS CUS SION
Per cent loss in weight (PLW) in creased within creas ing pe riod of stor age in all the treat ments.Fruits wrapped in cling wrap showed min i mumPLW whereas un treated fruits showed max i mumPLW af ter seven days of stor age. Like wise it wasmin i mum when rice straw was used as cush ion ingma te rial (Fig. 1). The loss in fruit weight might bedue to the fact that wrap ping ma te ri als are known to re tard the rate of res pi ra tion, tran spi ra tion andmain tain ing fruit firm ness. These re sults are inclose con for mity with the find ing of Baviskar et al.(3) as they re ported max i mum per cent loss in fruitweight from con trol fruits while poly thene packedfruits showed min i mum loss in weight of guavafruits. Pres ent find ing re vealed that the ed iblequal ity of guava fruits was de creas ing withincreasing stor age pe riod. Pec tin re ten tion was alsohigher in cling wrap af ter 7 days of stor age whenneem leaves were used as cush ion ing ma te rial (Fig.2). The re duc tion in pec tin con tent dur ing stor agemight be due to deg ra da tion of in sol u bleprotopectin by the en zymes such as pec tin methylesterase (PME) en zyme and ac tiv ity of en zymein creased as rip en ing ad vanced in guava. Thesefind ings are in ac cor dance with the re sults ofChaitanya (4) in guava as he re ported min i mumre ten tion of pec tin from un wrapped fruits.
There was sig nif i cant ef fect of wrap ping andcush ion ing on TSS (Ta ble 1). Fruit wrapped incling wrap showed the re duced rate of in crease inTSS. This might be mainly due to slow con ver sionof starch into sug ars. Max i mum in crease in TSSwas ob served in cush ion ing of fruits with Neem
leaves fol lowed by wrap ping of fruits with Teakleaves. It might be due to quick con ver sion ofstarch into sugar. TSS con tent of guava fruitsin creased ini tially up to 4th day of stor age andde creased` there af ter. In crease in to tal sol u blesol ids dur ing stor age may be due to the break downof com plex poly mers into sim ple sub stances byhydrolytic en zymes which might be fur therme tab o lized dur ing res pi ra tion and thus the levelgot de creased dur ing sub se quent stor age. Sharma et al. (8) also found sim i lar re sults as they re portedthat news pa per packed fruits of guava cv. Sardarre corded the max i mum in crease in TSS. Wrap pingand cush ion ing ma te ri als had no sig nif i cant ef fecton acid ity (Ta ble 1). Acid ity of the fruits de creasedcon tin u ously in stor age at room tem per a ture.Max i mum acid ity was found when fruits werehar vested. These find ings are in close con for mitywith Agarwal et al. (2) as they re ported thattitratable acid ity de creased with ad vanc ingma tu rity. The de crease in acid ity dur ing stor agemight be due to con ver sion of ac ids into salts andsug ars by the en zymes par tic u larly invertase.
To tal sug ars con tent of guava fruit in creasedwith high rate up to 4th day of stor age and then ratewas de creased there af ter (Ta ble 2). The in crease into tal sugar dur ing stor age might be be cause of anin crease in re duc ing sug ars and non-re duc ingsug ars re sult ing con ver sion of starch into sim ple
Qualitative effect of wrapping and cushioning materials on guava fruits during storage 319
Fig. 1: Effect of wrapping and cushioning material onloss in fruit weight.

320 Chandra and Kumar
Ta ble 1: Ef fect of dif fer ent wrap ping and cush ion ing ma te ri als on TSS and acid ity in stored guava.
Treatment TSS Acidity (%)
At harvest After 4days
After 7days
At harvest After 4days
After 7days
Wrapping material
Tissue paper 10.66 12.80 12.80 0.210
(2.521)
0.093
(1.740)
0.018
(1.870)
Cling wrap 10.20 11.16 12.20 0.180
(2.460)
0.130
(2.120)
0.114
(1.932)
Banana leaves 13.27 13.26 12.13 0.150
(2.192)
0.091
(1.720)
0.087
(1.660)
Teak leaves 10.63 12,30 13.26 0.210
(2.530)
0.125
(2.011)
0.104
(1.844)
Cushioning material
Neem leaves 13.13 12.93 14.53 0.180
(2.454)
0.102
(1.820)
0.102
(1.820)
Rice straw 12.93 13.50 13.16 0.190
(2.563)
0.098
(1.772)
0.101
(1.832)
Bamboo leaves 12.26 14.00 13.27 0.170
(2.250)
0.117
(1.950)
0.093
(1.730)
Control 12.67 13.80 12.13 0.150
(2.233)
0.082
(1.640)
0.075
(1.550)
C.D. (P=0.05) 1.79 0.41 0.82 NS NS NS
Note: Val ues in pa ren the ses are an gu larly trans formed.Ta ble 2: Ef fect of dif fer ent wrap ping and cush ion ing ma te ri als on to tal sugar and TSS: acid ra tio.
Treatment Total Sugar TSS/Acid ratio
At harvest After 4days
After 7days
At harvest After 4days
After 7days
Wrapping material
Tissue paper 6.42
(14.67)
10.23
(18.56)
12.51
(20.71)
55.61 135.09 116.80
Cling wrap 6.23
(14.66)
12.27
(20.56)
12.65
(20.83)
55.32 91.32 100.78
Banana leaves 6.02
(14.21)
13.39
(21.46)
13.41
(21.48)
91.62 148.05 146.66
Teak leaves 5.90
(14.06)
12.40
(20.62)
13.40
(21.47)
54.94 110.82 117.98
Cushioning material
Neem leaves 6.56
(14.89)
12.70
(20.88)
12.91
(21.07)
70.89 130.96 127.72
Rice straw 6.03
(14.22)
12.77
(20.94)
13.25
(21.34)
65.04 150.61 115.07
Bamboo leaves 6.17
(14.39)
12.69
(20.85)
13.70
(21.75)
80.63 120.19 131.79
Control 6.97
(15.31)
14.03
(22.00)
14.67
(22.52)
84.08 169.05 159.03
C.D. (P=0.05) 0.18 0.76 1.00 NS NS NS
Note: Values in parentheses are angularly transformed.

sugar and later on re duc tion in rate was due touti li za tion of sugar in the pro cess of res pi ra tion.These re sults are in close con for mity with thefind ings of Parihar and Kumar (6) as they re portedthat to tal sug ars were in creased with the in crease ofstor age pe riod in guava. TSS: acid ra tio wasin creased in fruit dur ing stor age (Ta ble 2). It mightbe due to the fact that in crease in TSS was theredur ing stor age while acid ity de creased (Agarwal etal., 2).
Fruits wrapped in cling wrap re tained highercon tent of ascor bic acid dur ing stor age af ter sevendays of stor age like wise when bam boo leaves usedas cush ion ing ma te rial showed max i mum re ten tion
of ascor bic acid (Ta ble 3). Cling wrap prob a blyre tard sev eral rip en ing pro cesses and hence the rateof con ver sion of L-ascor bic acid into dehydroascor bic acid is slowed down. The loss in ascor bicacid con tent of fruit dur ing pro longed stor age ismainly due to ox i da tion of L-ascor bic acid intodehydro ascor bic acid by the en zyme ascorbinase.Gupta and Jawandha (5) and Srivastava et al. (11)also found de creas ing trend of ascor bic acid dur ingstor age of peach and guava fruits, respectively. Theorganoleptic qual ity was better in wrapped fruits ascom pare to un wrapped con trol fruits ex cept clingwrapped fruits which showed poor organolepticrat ing dur ing stor age (Ta ble 3). Sim i lar re sults were also re corded by Siddiqui and Gupta (9) as theyre ported that the organoleptic qual ity was better inwrapped guava fruits as com pare to un wrappedcon trol fruits ex cept poly thene wrapped fruitswhich showed poor organoleptic rat ing through outthe stor age.
On the ba sis of above re sults, it can becon cluded that for most of pa ram e ters cling wrapshowed good re sults closely fol lowed by Teak leafwrap ping. Fruits wrapped in ba nana leaves showedgrowth of fun gus in some fruits. Ef fect of dif fer entcush ion ing ma te ri als on phys i cal and chem i calpa ram e ters are sat is fac tory up to some ex tent.
Qualitative effect of wrapping and cushioning materials on guava fruits during storage 321
Ta ble 3: Ef fect of dif fer ent wrap ping and cush ion ing ma te ri als on ascor bic acid and organoleptic rat ing.
Treatment Ascorbic Acid Organoleptic rating
At harvest After 4days
After 7days
At harvest After 4days
After 7days
Wrapping material
Tissue paper 159.48 48.34 27.75 7.20 6.25 4.70
Cling wrap 164.88 81.05 49.83 7.13 5.84 4.20
Banana leaves 147.24 40.45 23.64 6.95 6.06 4.29
Teak leaves 168.12 45.38 29.04 7.05 6.78 4.45
Cushioning material
Neem leaves 169.20 36.01 19.46 6.75 6.25 4.04
Rice straw 177.84 38.98 21.39 6.61 5.83 3.49
Bamboo leaves 147.29 45.88 27.15 6.92 5.80 3.67
Control 172.26 27.15 18.04 7.52 6.20 3.69
C.D.(P=0.05) 15.18 15.12 13.06 0.51 0.99 0.37
Fig. 2: Effect of wrapping and cushioning material onpectin content.

322 Chandra and Kumar
Fruits with out wrap ping and cush ion ing (con trol)had poor phys i cal and chem i cal prop er ties. Inorganoleptic rat ings fruits wrapped in Teak leavesshowed best re sults while poor rat ing was re cordedin Cling wrap ping.
In overall cling wrap was considered as a good wrapping material for guava fruits followed bywrapping with Teak leaves. Among the naturallyavailable materials Teak leaves showed best results.
REF ER ENCES
1. A.O.A.C. (1980). Of fi cial Meth ods of Anal y sis.
13th ed. As so ci a tion of Of fi cial An a lyt i cal
Chem ist, Wash ing ton, D,C.
2. Agarwal, R., Parihar, P., Mandhyan, B.L. and
Jain, D.K. (2002). Physico-chem i cal changes
dur ing rip en ing of guava fruit. J. Food Sci. and
Tech., 39 (1): 94-95.
3. Baviskar, M.R., Waskar, D.P. and Kaulgud,
S.N. (1995). Ef fect of var i ous post-har vest
treat ments on shelf life and qual ity of ber fruit.
In dian J. Hort., 52(1): 37-45.
4. Chaitanya, C.G. (1984). Ef fect of fo liar sprays
of zinc and bo ron on yield and post har vest
qual ity of guava fruits (Psidium guajava L.) cv.
Lucknow-49 (Sardar). The sis, MSc. Ag.
(Hor ti cul ture), G. B. Pant Uni ver sity of
Ag ri cul ture and Tech nol ogy, Pantnagar, 107p.
5. Gupta, N. and Jawandha, S.K. (2012). Effect of
different packagings on quality of peaches
during storage. HortFlora Res. Spectrum, 1(2):
117-121.
6. Parihar, P. and Kumar, S. (2007). Shelf life
stud ies on guava fruits un der dif fer ent
pack ag ing ma te ri als. In dian J. Agri. Biochem.,
20 (1): 27-29.
7. Ranganna, S. (1986). Hand book of Anal y sis and
Qual ity Con trol for Fruits and Veg e ta ble
Prod ucts. 2nd ed. Tata McGraw Hill Pub lish ing
Co. Ltd., New Delhi, pp.1-24.
8. Sharma, R.K., Kumar, J., Singh, R.N. and
Goyal, R.K. 2002. Ef fect of anti-se nes cence
reg u la tors on shelf life of win ter guava.
Haryana J. Hortic. Sci., 31 (1&2): 40-41.
9. Siddiqui, S. and Gupta, O.P. 1997. Ef fect of
in di vid ual fruit wrap ping by dif fer ent ma te ri als
on the shelf-life of guava cv. Allahabad Safeda.
Haryana J. Hortic. Sci., 26, (1&2): 102-104.
10. Singh, G. 2005. Strat e gies for im proved
pro duc tion in guava (Psidium guajava L.)
Souvnir First In ter na tional Guava Sym po sium
(29-39) Dec. 5-8, CISH, Lucknow.
11. Srivastava, H.C., Kapoor, N.S., Dalal, V.B.,
Subramanyam, H.S., Danza, S.D. and Rao, K.S.
(1962). Stor age be hav ior of skin coated guava
un der mod i fied at mo sphere. Food Sci., 11:
244-248.
12. Tyagi, S. K. and Patel, R. M. (2004). Effect of
growth regulators on rooting of air layering of
guava (Psidium guajava L.). The Orissa J.
Hort., 4: 23-27.

EF FECT OF VAR I OUS MULCH MA TE RI ALS AND SPAC ING ON
GROWTH, YIELD AND QUAL ITY OF STRAW BERRY
Priyamvada Sonkar, R.B. Ram and M.L. Meena
De part ment of Ap plied Plant Sci ence (Hor ti cul ture), Babasaheb Bhimrao Ambedkar Uni ver sity,
(A Cen tral Uni ver sity), Vidya Vihar, Rae Bareli Road, Lucknow-226 025
AB STRACT: An ex per i ment was con ducted at the Hor ti cul tural Re search Farm of BabasahebBhimrao Ambedkar Uni ver sity, Lucknow. The ex per i ment was per formed to find out the mostsuit able mulch ing ma te rial and an ideal spac ing for straw berry cul ti va tion un der Lucknowcon di tions. The ex per i ment was laid out in a Fac to rial Ran dom ized Block De sign with threerep li ca tions. The treat ments com prised of six mulch ing ma te ri als viz. paddy straw, dry grass(Saccharum spp.), dry leaves (dry neem leaves), red poly eth yl ene, green poly eth yl ene andtrans par ent poly eth yl ene) with two spac ings (30 x 15 cm and 30 x 30 cm). On the ba sis of thesta tis ti cal data, it is con cluded that spac ing of 30 x 30 cm with green poly eth yl ene mulch wasfound to be the best in terms of plant growth viz. plant height, spread of plants, num ber of leavesand leaf area. Sim i larly, spac ing of 30 x 15 cm with green poly eth yl ene mulch sig nif i cantlyin flu enced num ber of flow ers, fruit length and fruit width, yield and qual ity. How ever, there was
slight dif fer ence in qual ity pa ram e ters among dif fer ent treat ments.
Keywords: Straw berry, mulch ing ma te ri als, spac ing, growth, fruit qual ity.
Straw berry (Fragaria x ananassa Duch.) isone of the most fas ci nat ing fruit of the world be ingrich source of vi ta mins, min er als and tan ta liz ingfla vour and aroma. Though, it is mi nor fruit oftem per ate re gions, due to the ad vent of day neu tralcultivars, it can be grown prof it ably even in trop i cal and sub trop i cal re gions (Ram et al., 7). Re cently,straw berry has be come the fa vour ite fruit cropamong the grow ers, es pe cially near towns andcit ies. Be cause of its re mu ner a tive prices; the areaun der this crop is in creas ing rap idly (Singh andAsrey, 9). It is amongst the ten fruit crops, whichgive quicker and very high re turns per unit area onthe cap i tal in ter ests, as a crop ready for har vest ingwithin six months of plant ing (Sharma and Sharma12). How ever, pres ently farm ers grow straw berrywith out main tain ing proper plant ing space.Con se quent upon this, high per cent age of un dersized, un mar ket able fruit and in ci dence of pest anddis eases have been no ticed which is a bot tle neckfor ob tain ing good re turns. Higher plant pop u la tionper unit area has gen er ally tended to in crease thefruit yield upto 27% in straw berry. There aremea ger at tempts on mor pho log i cal, phenologicaland yield at trib utes un der dif fer ent spac ings.Fur ther, straw berry is one of the crop among the
other crops that re sponse dras ti cally to the in creaseof soil tem per a ture/ light reflectance pro duced withthe use of mulches. Gutal et al. (5) ob served that the use of plas tic mulches in ag ri cul ture helped toin crease the pro duc tion per unit area for all types ofcrops as poly eth yl ene mulch films in crease soiltem per a ture 5-7 °C fa cil i tat ing faster ger mi na tionand better root pro lif er a tion, in ad di tion to check ing weed growth, pre serv ing the soil struc ture,re tain ing soil mois ture and in creas ing CO2 con tents around the plants. Con sid er ing these facts, thesys tem atic stud ies were con ducted to stan dard izethe ap pro pri ate mulch ma te rial and spac ing forqual ity and higher yield of straw berry fruits un derLucknow con di tions.
MA TE RI ALS AND METH ODS
Field ex per i ment was con ducted dur ing2008-2009 at the Hor ti cul tural Re search Farm ofthe Babasaheb Bhimrao Ambedkar Uni ver sity,Lucknow in a Fac to rial Ran dom ized Block De signwith three rep li ca tions. Treat ment com bi na tionscon sist ing of six mulch ing ma te ri als viz. paddystraw, dry grass (Saccharum spp.), dry leaves (dryneem leaves), red poly eth yl ene, green poly eth yl ene and trans par ent poly eth yl ene) and two spac ings i.e.30 x 15 cm and 30 x 30 cm. Healthy and
HortFlora Research Spectrum, 1(4): 323-327 (2012) ISSN : 2250-2823
Received : 24.2.2012 Revised : 6.5.2012 Accepted : 18.5.2012

dis ease-free run ners of Chan dler straw berry werepro cured from Dr. Y. S. Parmar Uni ver sity ofAg ri cul ture and For estry, So lan, H. P. in the monthof Oc to ber, 2008. Be fore plant ing they wereplanted in shade house for proper ac cli ma ti za tionaf ter which they trans planted in well-pre pared bedsun der open field con di tions. Trans plant ing wasdone at the last week of Oc to ber. Red poly eth yl enesheet, green poly eth yl ene sheet and trans par entpoly eth yl ene sheet were used and spread over thebeds. Cor re spond ing to the po si tion of plant,in ci sions were given on mulch and the plant stemswere taken out through the slits to keep the fo liageun cov ered. Paddy straw, dry grass and dry leaveswere spread over the plots evenly in dif fer enttreat ments to main tain a mulch thick ness of about10 cm. All the nec es sary cul tural prac tices andplant pro tec tion mea sures were fol lowed uni formlyfor all the plots and treat ments dur ing theex per i men ta tion pe riod. Ob ser va tions werere corded on the height of plant (cm), spread ofplants (cm), num ber of leaves (cm), num ber offlow ers per plant, fruit length (cm), fruit breadth(cm), fruit weight (g), yield per plant (g). To talSol u ble Sol ids (°Brix) of the berry was de ter minedwith the help of Hand Refractometer. The titrableacid ity (%) and ascor bic acid (mg/100g) werede ter mined as per stan dard pro ce dures of Ranganna (8).
RE SULTS AND DIS CUS SION
On the ba sis of the ob ser va tions and datare corded it was found that the veg e ta tive growth,yield at trib utes and qual ity pa ram e ters weresig nif i cantly af fected by mulch ing and spac ings,re spec tively. Data clearly re vealed that themax i mum veg e ta tive growth viz. plant height,spread of plants (east-west and north-south),num ber of leaves and leaf area were ob served ingreen poly eth yl ene mulch fol lowed by red andtrans par ent poly eth yl ene mulch with the widerspac ing of 30 x 30 cm over the other treat ments(Ta ble 1). The better re sponse in plant growthpa ram e ters might be be cause of suit able con di tionsfound un der the green poly eth yl ene mulch which is
the com bi na tion of the prop er ties of clear and blackmulches. With clear mulch, all wave lengths ofra di a tion (light) are trans mit ted through the mulch.The long wave lengths (in fra-red ra di a tion) arecon verted to heat un der the clear film and pro videthe great est amount of soil warm ing. How ever,photosynthetic ac tive ra di a tion (PAR) is alsotrans mit ted and re spon si ble for the vig or ous weedgrowth un der clear mulch. Al though, black mulchblocks PAR, weeds do not grow un der neath. There fore, it si mul ta neously gen er ated al most asmuch heat as clear mulch and sup pressed weedslike black mulch. The plants grown un der thehigher den si ties pro duced fewer crowns and leavesas re ported by Wright and Sandrang, 18. Thepres ent re sults are in con for mity of the find ing of(Tarara, 15). How ever, 30 x 30 cm (plant to plantspac ing) pro vided better space for the rootdis tri bu tion. It also in di cated a shift in the mostfa vour able en vi ron ment in root growth con sists ofop ti mal mois ture avail abil ity. This lead to in creaseroot ac tiv i ties which might have been re sulted inbetter nu tri ent up take, sub se quently better drymat ter for ma tion and gas ex change. These re sultsare also sup ported by Goulart and Funt (4) andSharma and Yamdagni (10).
Data pre sented in Ta ble 2 clearly in di cated the in flu ence of var i ous treat ments and re flected thatthe max i mum num ber of flowers were ob served ingreen poly eth yl ene with 30 x 15 cm. This might bebe cause the green poly eth yl ene with 30 x 15 cmspac ing cre ates a better mi cro cli mate and made thefield weed free. Whereas, the red and trans par entpoly eth yl ene mulch were not suc cess in con trol lingthe weed pop u la tion in the field that re sulted inab sorb ing the most of the PAR by the weeds(John son and Fennimore, 6). And also it might bebe cause closer spac ing pro vided enoughcom pe ti tion to re duce vig or ous veg e ta tive growth(Wright and Sandrang, 18). They also stated thatthe me dium den sity pro duced the great est num berof flow ers per in flo res cence. Uselis (17) re portedthat wider spac ing re duced the to tal num ber ofin flo res cen ces as ob served in the pres entin ves ti ga tion. Slight en hance ment in in creased fruit
324 Sonkar et al.

Effect of various mulch materials and spacing on growth, yield and quality of strawberry 325
Ta ble 1: Ef fect of mulch ing and spac ing and their in ter ac tion on plant growth and flow ers of straw berry cv. Chan dler.
Treatments Plant height(cm)
Plant spredE-W (cm)
Plant spreadN-S (cm)
No. of leavesper plant
Leaf area(cm2)
Spacing
Mulching
S1 S2 S1 S2 S1 S2 S1 S2 S1 S2
M1 9.01 10.49 14.31 18.23 14.89 18.91 6.66 83.55 30.58 53.24
M2 7.76 10.12 12.52 17.63 13.09 18.32 6.10 7.86 28.59 38.27
M3 7.13 9.28 11.70 17.45 12.29 18.64 5.46 7.61 18.24 36.43
M4 10.68 12.46 15.28 20.87 16.23 20.82 6.93 10.76 26.80 62.43
M5 11.23 14.94 17.35 23.75 17.82 24.32 6.93 12.37 38.20 62.89
M6 10.47 11.49 14.36 18.56 16.14 19.53 6.89 10.03 21.32 58.81
CD (P=0.05)Mulching 0.86 0.94 0.98 0.75 2.37
Spacing 0.49 0.54 0.57 0.43 1.37
Interaction 1.21 1.33 1.39 1.06 3.36
Where, M1 = Paddy straw; M2 = Dry grass, M3 = Dry leaves; M4 = Red polyethylene; M5 = Green polyethylene, and M6 = Transparent polyethylene; S1 = 30 ´ 15 cm and S2 = 30 ´ 30 cm.
Ta ble 2: Ef fect of mulch ing and spac ing and their in ter ac tion on flow ers, fruit growth and yield of straw berry.
Treatments No. of flowersper plant
Fruit length
(cm)
Fruit breadth
(cm)
Fruit weight(g)
Yield/plant (g)
SpacingMulching
S1 S2 S1 S2 S1 S2 S1 S2 S1 S2
M1 16.29 15.20 3.96 4.43 2.99 3.73 10.31 10.55 137.84 123.75
M2 16.02 15.16 3.94 4.21 2.90 3.57 9.67 10.34 121.55 102.88
M3 15.34 14.56 3.79 4.03 2.44 3.56 8.00 9.83 93.76 97.61
M4 18.18 17.75 4.62 4.71 3.92 4.11 11.23 11.25 161.60 148.61
M5 19.52 18.69 4.67 5.10 3.92 4.68 12.18 12.65 188.18 165.71
M6 18.88 18.00 4.47 4.70 3.82 4.10 11.89 12.07 168.24 157.03
CD (P=0.05)Mulching 1.35 0.38 0.15 0.78 9.28
Spacing 0.78 0.21 0.08 0.45 6.35
Interaction 1.90 0.52 0.21 1.11 13.10
Where, M1 = Paddy straw; M2 = Dry grass; M3 = Dry leaves; M4 = Red polyethylene; M5 = Green polyethylene and
M6 = Transparent polyethylene; S1 = 30 x 15 cm and S2 = 30 x 30 cm.
Ta ble 3: Ef fect of mulch ing and spac ing and their in ter ac tion on fruit qual ity pa ram e ters of straw berry cv. Chan dler.
Treatments TSS (°Brix) Acidity (%) Ascorbic acid (mg/100g) Spacing
Mulching
S1 S2 S1 S2 S1 S2
M1 9.83 9.78 0.70 0.71 64.44 55.12
M2 8.96 9.67 0.73 0.71 59.81 49.81
M3 8.70 9.18 0.72 0.72 59.31 52.20
M4 10.42 10.45 0.69 0.65 63.89 71.93
M5 9.88 10.02 0.70 0.61 78.46 77.89
M6 11.23 11.48 0.61 0.61 64.11 76.47
C.D.(P = 0.05)Mulching 0.17 0.04 0.14Spacing 0.10 0.02 0.09
Interaction 0.25 0.05 0.19
Where, M1 =Paddy straw; M2 =Dry grass; M3 =Dry leaves; M4 = Red polyethylene; M5 = Green polyethylene and, M6 = Transparent polyethylene; S1 = 30 ´ 15 cm and S2 = 30 ´ 30 cm.

length, fruit width, fruit weight and yield was found in green poly eth yl ene. Same trend of fruit size(length and width) and weight was sig nif i cantlyre flected in wider spac ing (30 x 30 cm). How ever,closer spac ing also re vealed good per for mance. Per haps it was be cause of the spac ing sys tem. Wider spac ing get suf fi cient light and nu tri entswhich re sulted to in crease the size and weight.Al though, the closer spac ing ac com mo date morenum ber of plants than wider spac ing re sults inover lap ping of leaves (shelf shad ing) to theirad ja cent plants and in ter min gled of roots thatin creased com pe ti tion for the avail able re sources(wa ter, light and nu tri ents). Ahmad (1) stated thatmore space avail able for up take of all the nu tri entsto the fruits where they acted as sink for stor ing thenu tri ent and fi nally translocated to fruits which arethe source of sink. These ab sorbed nu tri ents mighthave been uti lized by the fruits as a re sult of whichthere was in crease in size and weight of fruit.Badiyala and Joolka (4) have also ob served thatwider spac ing have better sized fruits. On thecon trast, Ram et al. (7) reg is tered that the fruit size(fruit length and width) was in creased as spac ingde creased. Sim i lar re sult for fruit weight wasob tained by Ahmad (1). Fruit yield sig nif i cantlyhigher at 30 x 15 cm plant to plant spac ing with outmuch af fect ing fruit qual ity. Sim i lar re sults onin creased yield with closer spac ing have also beenre ported by Ram et al. (7) and Sharma (11).
It is ob vi ous from the data (Ta ble 3) that fruit
qual ity was sig nif i cantly af fected by mulch ing and
spac ings. Better fruit qual ity viz., TSS (°Brix),
acid ity (%) and ascor bic acid (mg/100g) of
straw berry were found in green poly eth yl ene mulch
which was at par with trans par ent poly eth yl ene
mulch. This might be be cause of in crease in
tem per a ture un der neath the green poly eth yl ene
mulch. The re sult was sup ported by Singh et al.
(13) and Tang et al. (14). Spac ing wise qual ity
at trib utes like TSS (°Brix), acid ity (%) and ascor bic
acid (mg/100g) were found to be in 30 x 30 cm
en hanced with lit tle or neg li gi ble dif fer ence in the
spac ing of 30 x 15 cm (plant to plant). The re sult
was in con so nance with Tripathi et al. (16) who
re ported that the TSS (°Brix), acid ity (%) and
ascor bic acid (mg/100g) were found higher in
wider spac ing of 40 x 70 cm. It was pos si ble that
more light ex po sure and greater ac cu mu la tion of
photosynthates might have con trib uted to an
in crease in vi ta min C (ascor bic acid) con tent in
berry. Awasthi and Badiyala (2) re ported that TSS
and to tal sug ars were sig nif i cantly higher in wider
spac ing than closer spac ing.
Among all the mulch ma te ri als, poly eth yl eneper formed better than the or ganic mulches i. e.straw mulch, grass mulch and leaf mulch. Thismight be due the fast evap o ra tion from the or ganicmulches, less sup pres sion of weeds and lowtem per a ture un der or ganic mulches. Sim i lar re sultwas also sup ported by Tang et al. (14).
From the above dis cus sion it is there fore,sug gested that the green poly eth yl ene mulch withthe spac ing 30 x 15 cm (plant to plant) suit able forhigh yield with out af fect ing the fruit qual ity un derthe Lucknow con di tions.
AC KNOWL EDGE MENT
Au thors are grate ful to Dr. K. Kumar, Head ofDe part ment, Dr. Y. S. Parmar Uni ver sity ofHor ti cul ture and For estry, So lan, H. P. for
pro vid ing re search ma te ri als.
REF ER ENCES
1. Ahmad, M. F. (2009). Ef fect of plant ing den sity
on growth and yield of straw berry. In dian J.
Hort., 66 (1): 132-134.
2. Awasthi, R. P. and Badiyala, S. D. (1993).
Spac ing and per for mance in some cultivars.
In dian J. Hort., 40(1/2): 29-34.
3. Badiyala, S. D. and Joolka, N. K.(1983). Ef fect
of dif fer ent spac ing on the per for mance of
straw berry cv, Tioga. Haryana J. Hort Sci.,
12(3/4): 165-167.
4. Goulart, L. Barbara and Funt, Rich ard C.
(1986). In flu ence of raised beds and plant
spac ing on growth and yield of straw berry. J.
Amer. Hort. Sci. 111(2): 176-181.
326 Sonkar et al.

5. Gutal, G. B., Bhifare, R. M. and Take, R. L.
(1992). Mulch ing ef fect on yield of to mato crop.
Ex per i . Agri., 23: 325-332.
6. John son, Mark S. and Fennimore, Ste ven A.
(2005). Weed and crop re sponse to polyethylene
plas tic mulches in straw berry pro duc tion.
HortScience, 40(5): 1371-1375.
7. Ram, R. B., Maurya, D., Dwivedi, D. H., and
Chaturvedi, S. K. (2009). Ef fect of dif fer ent
spac ings on growth, flow er ing, fruit ing, yield
and qual ity of straw berry (Fragaria x ananassa
Duch.) cv. Chan dler. Adv. Plant Sci., 22(2):
517-519.
8. Ranganna, S. (2007). Hand book of anal y sis and
qual ity con trol for fruit and veg e ta ble prod ucts.
Tata Mc Graw Hill Pub lish ing Co. New Delhi.
9. Singh, R. and Asrey, R. (2005). Growth,
ear li ness and fruit yield of mi cro-ir ri gated
straw berry as af fected by plant ing time and
mulch ing in semi arid re gions. In dian J. Hort.,
62(2): 148-151.
10. Sharma, R. M. and Yamdagni, R. (2000).
Mod ern straw berry cul ti va tion. Kalyani
Pub lish ers, New Delhi. pp: 27-28.
11. Sharma, V. K. (2009). Ef fect of mulch ing and
row spac ing on growth and yield of straw berry.
In dian J. Hort., 66(2): 271-273.
12. Sharma, V. P. and Sharma, R. R. (2004). The
Straw berry. In dian Coun cil of Ag ri cul tural
Re search, New Delhi.
13. Singh, A.K., Singh, S.K., Pandey, A.K., Rajan,
K and Kumar, A. (2012). Ef fect of drip
ir ri ga tion and poly thene mulch an pro duc tiv ity
of and qual ity of straw berry (Fragaria ´
annanasa). HortFlora Res. Spect., 1(2) :
131-144.
14. Tang, L., Yang, X. and Han , X. (1984). The
ef fect of mulch ing with sil ver re flex film in
ap ple or chard. Scientia Agri. Sinica, 5: 259-260.
15. Tarara, Julie M. (2000). Mi cro cli mate
mod i fi ca tion with plas tic mulch. HortScience,
35(2): 169-179.
16. Tripathi, V. K., Dwivedi, M. P., Sharma, R. M.
and Agrahari, P. R. (2000). Ef fect of plant ing
date and spac ing on yield and qual ity of
Chan dler straw berry (Fragaria ´ ananassa
Duch.). Haryana J. Hortic. Sci. 29(3/4):
185-186.
17. Uselis, N. (2000). Com par i son of straw berry
plant ing schemes. Sodininkyste-ir-Darzuin-
kyrte. 19(2): 11-12.
18. Wright, C. J. and Sandrang, A. K. (1993).
Density effects on vegetative growth and
reproductive development in strawberry cv.
Hapil. J. Hort. Sci., 68(2): 231-236.
Effect of various mulch materials and spacing on growth, yield and quality of strawberry 327
STUD IES ON SEED VIG OUR DE TE RI O RA TION IN PEA (Pisum sativum L.)
Ishrat Ahmad Lone, S.D. Tyagi, D.K. Bahuguna¹, Rajeev Kumar² and Nitin Kumar²
De part ment of Ag ri cul tural Bot any, Kisan (P.G) Col lege Simbhaoli, Panchsheel Nagar (U.P).
¹De part ment of Seed Sci ence and Tech nol ogy, Ch. Charan Singh Uni ver sity, Meerut, 250 004 In dia
²De part ment of Ag ri cul tural Bot any, CSSS (P.G.) Col lege Machhra, Meerut
AB STRACT: Seed vigour eval u a tion was con ducted on ten pea ac ces sions to study their levelof de te ri o ra tion at vary ing tem per a ture and time du ra tions. The ac ces sions were sub jected todif fer ent tem per a ture (30°C and 45°C) and stor age du ra tions (48 hours and 72 hours) dur ingac cel er ated age ing. Ob ser va tions were re corded for seed vigour in terms of ger mi na tionper cent age, ger mi na tion in dex, vigour in dex I, vigour in dex II and elec tro lyte leak age.Ger mi na tion per cent age and vigor in dex was greatly af fected af ter sub ject ing to large du ra tionsof time at high tem per a ture. The higher tem per a ture (45°C) af ter 72 hours in duced moreelec tro lyte leak age from the some ac ces sions. The re sults re vealed that vigour level of seedde te ri o rates af ter stor age at high tem per a ture. Sig nif i cant va ri etal dif fer ences were ob served inac ces sions in terms of their in her ent ca pac i ties to with stand higher tem per a ture treat ments bothaf ter 48 hours and 72 hours. The rate of seed de te ri o ra tion was faster in some ac ces sions as
com pared to other.
Keywords: Seed treat ment, cor re la tion, ac cel er ated age ing, vig our in dex, seed leak age.
Pulses on ac count of their sig nif i cantcon tri bu tion in bal anc ing the nu tri tion and health of man and an i mals and due to the stra te gic po si tion in the biospectrum of the earth can not be over looked.They are only the rich est source of pro tein inag ri cul tural crop gal axy and have been trulyre ferred as “Unique Jew els” for In dian crophus bandry (Swaminathan, 13). The pea has anim por tant sta tus among plants in gen eral andamong pulses in par tic u lar due to its pe cu liarqual i ties and ex ten sive hu man con sump tion. Alarge amount of qual ity pea seed is re quired forsow ing to en sure suc cess ful crop es tab lish ment, but non avail abil ity of such seeds is a lim it ing fac tor inboost ing In dia’s pea pro duc tion. High seed andseed ling vigour is re quired for a good standes tab lish ment and suc cess ful crop per for mance inpea. Va ri et ies with high seed ling vigour are alsoneeded for better com pet i tive abil ity against weeds. Vig or ous seeds will pro duce ex cel lent emer genceand stand in proper soil en vi ron ment. It canim prove the chances for sat is fac tory emer gence.Vigor is of ten im plied when dis cuss ing seed qual ity and most grow ers have to use the terms and qual ityand vigour in ter change ably. Seeds vigourcom prises those prop er ties, which de ter mine the
po ten tial for rapid uni form emer gence andde vel op ment of nor mal seed lings un der a widerange of field con di tions (ASPB, 4). The rapid andsyn chro nous ger mi na tion rate as well as good fieldes tab lish ment will be char ac ter is tic of vig or ous
seeds.
The vigour lev els of seeds get de creased rightfrom the seed is pro duced on the mother plant. Thede te ri o ra tion of stored seed is a nat u ralphe nom e non and the seeds tend to loose vi a bil ityand vigour even un der ideal stor age con di tions.(Bhatti and Sato, 5). The rate of seed de te ri o ra tionvar ies greatly from one spe cies to an other and evenamong va ri et ies of the same spe cies. Theper for mance ca pa bil i ties of many seeds de te ri o ratedue to vari a tions in tem per a ture, rel a tive hu mid ityand mois ture con tent in stor age (Ab dul-Baki, 1).An or ga ni za tion of cel lu lar mem branes is at its peak by the time a seed reaches phys i o log i cal ma tu rity(Ab dul-Baki, 1). Seeds un dergo a struc turaldis or ga ni za tion pro cess dur ing the dry ing pe riodbe fore har vest, the lower the wa ter con tent, thegreater the dis or ga ni za tion. The de gree of cellmem brane leak age in re sponse to age ing can bemea sured inn terms of rate of seed elec tro lyte
leak age (Larson, 11; Khan et al., 10).
HortFlora Research Spectrum, 1(4): 328-333 (2012) ISSN : 2250-2823
Received : 19.3.2012 Revised : 18.7.2012 Accepted : 04.8.2012

Seed age ing is an im por tant pa ram e ter toassess/es ti mate the seed vigour. Ac cel er ated age ing is a good vigour test for var i ous crop seedsin clud ing pea (Tyagi, 14). Seeds sub jected toac cel er ated age ing lost vigour sooner than vi a bil ity(Gorecki, 7). The ac cel er ated age ing test is rapid,in ex pen sive, sim ple and use ful for many spe cies. Ithas also shown a good cor re la tion with standes tab lish ment in pea (Caldwell, 6). Keep ing theabove points in view, the pres ent in ves ti ga tion wascon ducted to study the be hav iour of var i ous pea(Pisum sativum L.) va ri et ies to vary ing stor agepe ri ods through the tech nique of ac cel er ated
age ing.
MA TE RI ALS AND METH ODS
Ten ge no types/ac ces sions of pea (Pisumsativum L.) were pro cured from the ge netic stock of Di vi sion of Germplasm Col lec tion and Eval u a tion,Na tional Bu reau of Plant Ge netic Re sources, NewDelhi. The ac ces sions so col lected were raised atex per i men tal farm of De part ment of Ge net ics andPlant Breed ing, Kisan PG Col lege SimbhaoliPanchsheel Nagar UP dur ing 2010 to in crease thenum ber of seeds. The seeds so col lected weresub jected to a vigour stud ies in the Seed Test ingLab o ra tory of De part ment of Seed Sci ence andTech nol ogy, Ch. Charan Singh Uni ver sity, MeerutIn dia dur ing Jan.–Feb., 2010. The tests werecon ducted as per the rec om men da tions of AOSA
(3).
Seeds were eval u ated for seed ger mi na tion,vigour in dex I, vigour in dex II and elec tro lyteleak age be fore sub ject ing to ac cel er ated age ing.Seeds from each ac ces sion were sub jected toac cel er ated age ing treat ment at 100% rel a tivehu mid ity at two dif fer ent tem per a ture (30°C and45°C) in a con trolled cham ber for 48 hours and 72hours. For ger mi na tion and vigour tests fol low ing
vigour tests were per formed.
1. Germination Test: Germination test wasconducted using between paper (BP) method ofgermination and twenty five seeds per replicationwere sown on paper towel. Germination test was
conducted according to the International SeedTesting Association rules (Anonymous, 2). Seedswere placed on the surface of double sheets ofpaper towel which were moistened with distilledwater. The seeds were covered with other sheet ofpaper towel. The sheets were rolled and placedvertically in a plastic beaker, covered withpolythene bags and placed at 30°C temperature in agerminator. Germination data were recorded fromday one (D1) to day six (D6). Final count was madeat 6th day. Germination was interpreted as thepercentage of seeds producing normal seedlings
(Anonymous, 2).
Germination percentage
=No of normal seedlings
Total no of seeds planted100´
2. Germination Index: To calculate thegermination index, the number of normal seedlingswas counted from D1 to D6 and the germinationindex was calculated for each replicate according to
following formula suggested by Magurie (12).
SGI =Number of normal seedlings
Days of I count+ ..... +
st
Number of normal seedlings
Days of final count
The high value for this pa ram e ter de notes high
speed of ger mi na tion and con se quently high vigour.
3. Vigour In dex I and Vigour In dex II: Theger mi na tion per cent age ob tained in the ger mi na tion test was used to cal cu late vigour in dex. The vigourin dex was cal cu lated adopt ing the method of Ab dul
Baki (1).
Vigour In dex I = Ger mi na tion per cent age xav er age seed ling length
Vigour In dex II = Ger mi na tion per cent age x
Seed ling dry weight
4. Elec tri cal Con duc tiv ity Test: The seedma te rial used for this test was first sub jected toac cel er ated age ing at 100% rel a tive hu mid ity and at two tem per a ture re gimes of 30°C and 45°C.
Studies on seed vigour deterioration in pea (Pisum sativum L.) 329

330 Lone et al.
Sev enty five seeds in three rep li ca tions of 25 seedseach were counted and weighed and placed in aglass flask con tain ing 100ml of deionized wa ter.The flasks were cov ered with alu mi num foil topre vent con tam i na tion and were shaken in ter -mit tently. The flasks were kept at 30°C for 20 hours (Hampton and Tekrony, 8). The exudates socol lected were fil tered and con duc tiv itymea sure ments were taken us ing por ta blecon duc tiv ity me ter (Model LT-17). The av er ageval ues ob tained from each ac ces sion were
ex pressed as µ/cm/g.
RE SULTS AND DIS CUS SION
The re sults of pres ent in ves ti ga tion showedthe vary ing re ac tion of dif fer ent ac ces sions to the
ac cel er ated age ing con di tions.
1. Ger mi na tion Per cent age: The ger mi na -tion per cent age of the accessions (Table 1) un dernor mal con di tions ranged from 60.02% (DMR-11)to 89.95% (NBP-82). Un der ac cel er ated age ingcon di tions the va ri et ies be haved pos i tively totem per a ture and time fluc tu a tions. The meanger mi na tion of va ri et ies ranged 53.2% to 88.4%.The in ter ac tion be tween ac ces sions andtem per a ture was sig nif i cant. The ac ces sions such as EC-342007 and DMR-7 lost the ger mi na tion ofseeds faster than NBP-82, NBP-72 and EC-501259un der both tem per a ture and time du ra tions. Are duc tion of only 1% was re corded in ac ces sionNBP-82. The re sults showed that va ri etaldif fer ences in ger mi na tion per cent age were pres entin pea ac ces sions. The re sults also showed that therate of de te ri o ra tion var ies with the ac ces sions andsome of the ac ces sions showed faster de te ri o ra tionas com pared to oth ers. It can be thus con cluded that knowl edge is thus im por tant for pre dict ing stor agecon di tions. Iqbal and Smith (9) re ported the sim i larre sults while study ing the ac cel er ated age ing in
pea.
2. Ger mi na tion In dex: The ac ces sionsex hib ited dif fer ent re sponses to ger mi na tion in dex.The tem per a ture and time du ra tions dur ing age ingpro cess had a pos i tive ef fect on ger mi na tion in dex.
Un der nor mal con di tions, the mean value ofger mi na tion in dex var ied from 8.46 to 15.06 (Ta ble1). The ac ces sion num ber IC-208375 had thehigh est value (15.06) and low est value was
re corded in IC-424895.
The in ter ac tion be tween ac ces sions andtem per a ture was found sig nif i cant. The ac ces sionIC-208375 again showed a low est re duc tion inger mi na tion in dex as com pared to other ac ces sions, such as NBP-60 that re corded a high est re duc tion at both tem per a tures of 30°C and 45°C (as 8.24 and8.10). The ac ces sion DMR-7, NBP-611 andDMR-11 showed a large de cline in ger mi na tionin dex un der both time du ra tions. The in ter ac tionbe tween ac ces sions and time du ra tions was leastvis i ble in NBP-82, IC-208375 and IC-424815.NBP-82 showed a slight de crease in ger mi na tionin dex in ac cor dance with high ger mi na tionper cent age. The ger mi na tion in dex was higher inthe va ri et ies ex hib it ing greater ger mi na tion
per cent age.
3. Vigour In dex I and Vigour In dex II:Dif fer ent tem per a ture and stor age con di tionssig nif i cantly af fected vigour in dex I and vigourin dex II.NBP-82 ex hib ited vigor in dex I andEC-342007 pos sessed low est vigour in dex I. Un der the nor mal con di tions IC-208375 pos sessed high est val ues of vigour in dex II and IC-424895 showedlow est val ues of vigour in dex II. This vari a tion invigour in dex could be at trib uted to va ri etal
dif fer ences.
The in ter ac tion of ac ces sions with vary ingtem per a ture and time du ra tions was sig nif i cant(Ta ble 2). NBP-82 pos sessed high est vigour in dex I and vigour in dex II at 30°C, while as EC-342007ex hib ited low est vigor in dex val ues at the sametem per a ture. DMR-11 was most highly af fected bytime du ra tions of 72 hours at 45°C, whileIC-208375 was least af fected by tem per a ture at45°C. In gen eral a de crease in vigour in dex val ues(vigour in dex I and vigour in dex II) was found in all ac ces sions with in crease in tem per a ture from30°C-45°C. Re duc tion in shoot length at higher
tem per a ture in pea have also reported.

Studies on seed vigour deterioration in pea (Pisum sativum L.) 331
Ta ble 1: Ac ces sion means for dif fer ent seed vigour pa ram e ters.
Name ofAccession
Germinationpercentage
Germinationindex
Vigour index I Vigour index II Electricalconductivity
(µ/g)
EC-342007 68.58 9.83 558.79 2276.96 23.43
DMR-11 60.02 9.49 658.61 3014.38 13.63
IC-424895 80.58 8.46 967.21 1491.01 28.20
EC-501259 83.16 14.26 745.35 3174.52 9.43
DMR-7 77.0 9.80 779.53 3031.16 22.10
IC-208375 88.0 15.06 2458.64 4643.29 6.63
NBP-72 80.50 10.11 1436.01 3263.36 16.06
NBP-61 70.83 12.60 2248.83 3725.61 16.90
NBP-82 89.75 14.3 2833.23 4193.96 5.43
NBP-60 85.08 11.27 1577.51 1902.86 19.23
Ta ble 2: Ac ces sion means for dif fer ent seed vigour pa ram e ters as af fected by ac cel er ated age ing treat ments.
Name ofAccession
Storageduration(hours)
Germination percentage
Germination index
Vigour index I Vigour index II Electrical
conductivity(µ/g)
30°C 45°C 30°C 45°C 30°C 45°C 30°C 45°C 30°C 45°C
EC-342007 48 67.5 65.3 9.20 9.00 496.30 430.33 2024.90 1982.84 24.52 30.35
72 63.3 56.5 8.43 8.44 505.30 410.80 1824.56 1776.56 26.02 36.30
DMR-11 48 59.3 57.4 8.22 8.00 633.20 612.14 2929.40 2820.44 18.00 19.24
72 55.4 53.2 7.49 7.12 523.82 499.24 2680.00 2630.32 22.46 25.28
IC-424895 48 79.3 79.00 8.12 7.32 950.43 930.21 1472.62 1405.42 28.50 42.90
72 78.2 77.6 7.81 7.00 942.70 908.40 1470.66 1382.49 29.23 44.22
EC-501259 48 81.2 79.4 13.98 13.23 732.21 721.23 3036.22 3006.80 10.22 11.92
72 78.4 77.10 12.42 12.22 703.80 688.00 2921.29 2918.20 10.88 14.00
DMR-7 48 72.4 70.2 8.24 8.00 703.42 682.82 2916.25 2820.36 28.20 32.30
72 68.3 66.8 7.33 6.54 700.00 650.40 2728.80 2634.90 27.29 38.82
IC-208375 48 86.4 84.3 15.00 14.66 2444.12 2382.90 4572.10 4458.88 6.92 7.37
72 80.4 75.9 13.92 13.84 2377.42 2365.81 4492.16 4332.40 7.52 8.22
NBP-72 48 78.4 77.0 10.02 9.23 1410.22 1392.23 3122.80 3025.28 17.16 20.25
72 76.3 73.2 10.00 8.80 1402.82 1352.36 3003.22 2916.19 21.40 23.94
NBP-61 48 65.4 63.8 12.40 12.36 2120.72 2022.30 3521.20 3329.92 17.49 20.20
72 58.4 53.7 11.90 11.00 1924.80 1812.16 2822.50 2677.55 22.84 25.28
NBP-82 48 88.4 87.5 14.11 13.80 2742.70 2692.91 4052.66 4009.22 6.00 6.25
72 85.9 80.8 12.96 10.32 2703.81 2680.06 3922.82 3836.41 6.08 6.40
NBP-60 48 80.4 80.2 10.23 9.22 1421.52 1388.46 1898.22 1830.38 20.28 22.80
72 80.4 77.4 8.24 8.10 1416.21 1384.33 1822.30 1725.20 21.92 24.28

332 Lone et al.
4. Elec tro lyte Leak age: Va ri etal means forelec tro lyte leak age was sig nif i cantly af fected bydif fer ent tem per a ture and stor age du ra tions (Ta ble2). Un der the nor mal con di tions NBP-82 pos sessedlower seed leak ages and there fore high vigour,how ever the high est seed leak age was found inIC-424895 and was hence re ported to be of low est
vigour cat e gory among ac ces sions un der study.
The in ter ac tion be tween elec tro lyte leak age
and tem per a ture was highly sig nif i cant. A
sig nif i cant pos i tive in ter ac tion was also re ported
be tween time du ra tions and elec tro lyte leak age.
NBP-82 was least af fected by tem per a ture
treat ments both at 30°C and 45°C and only <2%
in crease was found in seed exudates read ings by
con duc tiv ity me ter. The ac ces sion DMR-7 was
high est af fected by higher tem per a ture treat ments
both at 48 hour and 72 hour du ra tions. An in crease
of >16µ/g was re corded in DMR-7 at 45°C
tem per a ture af ter 72 hours. In gen eral all the
ac ces sions re sponded pos i tively to the vary ing
tem per a ture and time pe riod du ra tions dur ing
ac cel er ated age ing treat ments. At 30°C tem per a ture
and 48 hours du ra tion, high est elec tro lyte leak age
was re corded in IC-424895, while NBP-82
pos sessed low est leak age. The ac ces sion NBP-82
was again least af fected at 45°C tem per a ture af ter
72 hours while DMR-7 showed high est elec tro lyte
leak age among the ac ces sions. NBP-82 and
IC-208375 main tained low est leak age when
sub jected to vary ing tem per a ture at 48 hours and 72
hours, de pict ing spe cific ge no type po ten tials.
The re sults of this in ves ti ga tion re vealed thatthe rate of seed de te ri o ra tion in creased with thein crease in stor age pe ri ods and stor agetem per a tures. Sig nif i cant dif fer ences in rate ofde te ri o ra tion were ob served among ac ces sions.Seeds of some ac ces sions de te ri o rated faster thanoth ers un der sim i lar stor age con di tions. Theknowl edge of dif fer ences in rate of seedsde te ri o ra tion in dif fer ent ge no types may be veryuse ful to pre dict seed vigor af ter long term stor age.It is thus rec om mended that the ger mi na tion test of
the var i ous ge no types should be con ducted atreg u lar in ter vals for the seeds that are be ing storedun der or di nary stor age con di tions. Such va ri et iesthat show the high est de te ri o ra tion dur ing test ingmay be re ju ve nated in the field to ob tain fresh seedwith higher vigor lev els. This would cer tainly saver the germplasm of seed banks from abruptde te ri o ra tion and can be saved for lon ger timepe ri ods. In this way, it could be en sured that thegermplasm ma te rial ly ing in the seed banks hashigh vigour per cent age.
It is fur ther rec om mended that the de tailedstudy should be un der taken to know the prob a blecause of rapid seed de te ri o ra tion in dif fer entva ri et ies of the same spe cies. The in for ma tion socol lected would en able us to gen er ate such stor agecon di tions that would have low est lim it ing ef fecton the vigor of the seeds. In this way, thegermplasm eval u a tion for stor age life may be better un der stood.
Ac knowl edge ments: Thanks are due toDe part ment of Sci ence and Tech nol ogy, Govt. ofIn dia for of fer ing IN SPIRE Fel low ship un derAORC scheme. The au thor is also highly thank fulto Co or di na tor, Deptt of Seed Sci ence andTech nol ogy, Ch Charan Singh Uni ver sity, Meerutfor pro vid ing fa cil i ties and whole hearted
co op er a tion.
REF ER ENCES
1. Ab dul-Baki A.A. (1980). Bio chem i cal as pects
of seed vigour. Hort. Sci., 15 765-771
2. Anon y mous (1983). In ter na tional Seed Test ing
As so ci a tion. In ter na tional rules for seed test ing.
3. AOSA (1983). Seed Vigor Test ing Hand book.
Con tri bu tion No. 32 to the Hand book on Seed
Test ing pp. 93.
4. ASPB (2003). Reg u la tions on the sale of
plant ing seed in Ar kan sas. Ar kan sas state plant
board, Box 1069, lit tle rock, Ar kan sas-72203
5. Bhatti, M.S. and Sato, H. (1997). Vi a bil ity
test ing. An nual re port, Plant Ge netic re sources
In sti tute, Nat. Agric. Res. cen ter, Islamabad
Pa ki stan.
6. Caldwell W.P. (1960). Lab o ra tory eval u a tion of
vigour of gar den peas. Pro ceed ings of
As so ci a tion of Of fi cial Seed An a lysts, 60:
130-136.
7. Gorecki, R.J., Midhalczyk, D.J. and Esashi, Y.
(1992). Com par a tive stud ies on the an aer o bic
rep a ra tion in dif fer ently aged pea and cocklebur
seeds. Acta Physiol. Plant, 14: 19-27
8. Hampton J.G. and Tekrony D.M. (1995).
Hand book of vigour test meth ods. 3ed. Zu rich:
ISTA 1995,pp 117
9. Iqbal T.M.T. and Smith, M.L. (1996).
Phys i o log i cal changes of pea seed qual ity due to
age ing. Ann. Bangla. Agric., 6: 27-34
10. Khan, N.M., Qasim, M., Iqbal, M.J., Naeem, A.
and Abbas, M. (2003). Ef fect of ac cel er ated
age ing on vi a bil ity, vigor and chro mo somal
dam age in pea. (Pisum sativum L.) seeds.
Pa ki stan J. Agric. Sci. 40:50-54.
11. Larson, L.A. (1968). The ef fect of soak ing pea
seeds with or with out seed coats on seed ling
growth. Plant Physiol., 43: 255-259
12. Magurie, J.D. (1962). Speed of ger mi na tion-aid
in se lec tion and eval u a tion for seed ling
emer gence and vigor. Crop Sci. 2: 176-177
13. Swaminathnan, M.S. (1981). Im prove ment of
pro duc tiv ity and nodulation in pulse crops.
Chal lenges ahead. Pulse News Let ter, 1: 1-2.
14. Tyagi, C.S. (1992). Evaluation of storability of
soybean seed. Seeds and Farms, 18:8-11
Studies on seed vigour deterioration in pea (Pisum sativum L.) 333

EF FECT OF FO LIAR SPRAY OF ZINC, CAL CIUM AND BO RON ON
SPIKE PRO DUC TION OF GLAD I O LUS CV. EUROVISION
Prashant Katiyar1, O.P. Chaturvedi1 and Dheerendra Katiyar2
1De part ment of Hor ti cul ture; 2De part ment of Veg e ta ble Sci ence
Chandra Shekhar Azad Uni ver sity of Ag ri cul ture and Tech nol ogy, Kanpur
AB STRACT: The ex per i ment was car ried out on spike pro duc tion in glad i o lus with fo liarap pli ca tion of zinc, cal cium and bo ron, con ducted in Hor ti cul ture Gar den of Chandra ShekharAzad Uni ver sity of Ag ri cul ture and Tech nol ogy Kanpur in Ran dom ized Block De sign with fourrep li ca tions. The ex per i men tal plots were 32 with 8 treat ments and two lev els of each of zinc,cal cium and bo ron treated by zinc sul phate 0.5%, cal cium sul phate 0.75% and bo rax 0.2%,re spec tively. The re sults obtained revealed that the fo liar spray of zinc at 0.5% to glad i o lus plant
was most ef fec tive to in flu ence the veg e ta tive growth and size of spike.
Keywords : Zinc, calcium, bo ron, glad i o lus, spike.
Glad i o lus, called as sword lily, be longs to thefam ily Iridaceae and sub-fam ily Irioideae.Glad i o lus is a beau ti ful or na men tal bul bous plant,grown for its be witch ing and glam or ous flow ers.Glad i o lus is grown on her ba ceous bor der, bed,rock ery, pot and also for cut flow ers. It is grown insev eral states of In dia and suc cess fully grown inplains as well as in hills. Light sandy soil with 6-7pH and sunny weather is most con ge nial for itsgrowth and de vel op ment. Among micro nut ri entsre quired in small amount, bo ron is nec es sary forcar bo hy drate trans port within the plant (Gauch andDugger, 3) and most of ab sorbed by the plants inundissociated bo ric acid (H3BO3). Zinc is es sen tialfor car bon di ox ide evo lu tion and uti li za tion ofcar bo hy drate and phos pho rus me tab o lism andsyn the sis of RNA. Cal cium is the chief con stit u entof plants as cal cium pectate of mid dle lamella ofcell wall and is there fore an im por tant part of ofplant struc ture. Cal cium is in volved in for ma tion ofcell mem brane (Hew itt, 4). In our coun try not much work has been done on pro duc tion of spike ofglad i o lus with fo liar spray of zinc, cal cium andbo ron. Most of the in for ma tion are avail able basedon the work car ried out in the for eign coun tries butthose rec om men da tions can not be help full as suchun der our agro-cli ma tic con di tion. Hence thecul tural man age ment and tech nique for qual ityflower spike pro duc tion need to be de vel oped andstan dard ized. Keep ing in view of the above facts, a
field trial was con ducted to in ves ti gate the ef fect ofzinc, cal cium and bo ron on pro duc tion of spike in
glad i o lus.
MA TE RI ALS AND METH ODS
The ex per i ment was laid out at Hor ti cul tureGar den of C.S.A. Uni ver sity of Ag ri cul ture andTech nol ogy Kanpur, where cli ma tic con di tion issemi-arid and sub-trop i cal with hot dry sum mer and cold win ter. Ran dom ized block de sign with fourrep li ca tion was se lected for eight treat mentcom bi na tions, two lev els of each of zinc (0, 0.5%),cal cium (0, 0.75%) and bo ron (0, 0.2%) weretreated by zinc sul phate 0.5%, cal cium suphate0.75% and borax 0.2%, re spec tively. The plant ingof corms were done on Ist No vem ber 2006. Firstir ri ga tion at the time of land prep a ra tion and reg u lar ir ri ga tion was car ried at an in ter val of 15 days. Fiveweed ings and six hoe ings dur ing crop ping pe riodwere done and earthing was done when the plantwas erect at 20-22 cm height. The ni tro gen,phos pho rus and pot ash were ap plied at the rate of160, 80, 80 kg/ha, re spec tively. Ni tro gen wasap plied in two splits of 80 kg/ha each, first at thetime of soil prep a ra tion and sec ond at six leavesstage. FYM was also added equal y to each plot. The ob ser va tions on each treat ment were re corded on
the growth and flow er ing char ac ters.
RE SULTS AND DIS CUS SION
The field trial was mainly aimed to test the
HortFlora Research Spectrum, 1(4): 334-338 (2012) ISSN : 2250-2823
Received : 01.6.2012 Accepted : 04.8.2012

ef fect of zinc, cal cium and bo ron on growth,flow er ing and pro duc tion of spike of glad i o lus.Cal cium is the chief con stit u ent of plant, as cal cium pectate is pres ent in mid dle lamella of cell wall. It is es sen tial for me tab o lism, ni trate as sim i la tion,bind ing of nu cleic acid with pro tein and is in volved in the for ma tion of cell mem branes. Bo ron isnec es sary for car bo hy drate trans port within theplant. It is in volved in cel lu lar dif fer en ti a tion andde vel op ment, ni tro gen me tab o lism, fer til iza tion,ac tive salt ab sorp tion, harmone me tab o lism, wa terre la tion and pho to syn the sis. Zinc is in volved in thesyn the sis of auxin and it is es sen tial for car bondi ox ide evo lu tion and uti li za tion of car bo hy drateand phos pho rus me tab o lism. Glad i o lus be ing amono cot y le don ous plant has no cam bium invas cu lar bun dles and the vas cu lar bun dles werescat tered among the tis sue un sys tem at i cally. So that no sec ond ary growth oc curs in this plant andmostly it grows with out branch ing. There fore,spray ing of zinc, cal cium and bo ron were sprayed
sep a rately.
The plant height was not sig nif i cantly af fected by spray ing of cal cium. The dala (Ta ble 1)in di cated that the max i mum height (81.70cm) wasattained with the ap pli ca tion of zinc. The rea son for in crease in height of glad i o lus might be due toin creased syn the sis of auxin and uti li za tion ofcar bo hy drate in im prov ing plant height. Similarfind ing was also ob served by Chaturvedi et al. (1)
in glad i o lus.
The length of leaf (57.73 cm) was in creasedsig nif i cantly with the ap pli ca tion of zinc thancal cium and bo ron. It has been found to play a rolein co ag u lat ing the auxin con cen tra tion and ni tro gen me tab o lism, which might have in creased the lengthof leaf in glad i o lus plant. It has also been ob servedby Sharova et al. (6) and Singh and Tiwari (7). Theap pli ca tion of zinc in creased the width of leaf from2.50 cm to 2.85 cm, which was in similar toSharova et al. (6) in glad i o lus and Singh and Tiwari
(7) in on ion.
The ap pli ca tion of bo ron in creased the num ber of leaves per plant from 7.96 to 8.44 and
ap pli ca tion of zinc from 7.66 to 8.74, though theap pli ca tion of cal cium was not sig nif i cant but inpres ence of zinc in creased the num ber of leaves perplant up to 9.99. this in di cated sig nif i cantin ter ac tion of cal cium and zinc. The find ings areagreed with the find ing of Chaturvedi et al. (1) andSingh et al. (8) in glad i o lus. The plants treated withcal cium and zinc ex hib ited more thick ness i.e. 1.49cm and 1.52 cm, re spec tively. How ever, bo ron anddif fer ent in ter ac tions could not in crease thispa ram e ter. This find ing is sup ported by Makory etal. (5) in on ion. The width of plant at bot tom wassig nif i cantly af fected by the fer til iza tion with
cal cium and zinc.
The qual ity of glad i o lus spike is mostlyrec og nized by its length and thick ness. Length ofspike is di rectly re lated to nu tri tional sta tus ofplant. The ap pli ca tion of cal cium and zincin creased the length of spike sig nif i cantlysup ported by Chaturvedi et al. (1). The thick ness ofspike was ob served max i mum with ap pli ca tion ofzinc fol lowed by cal cium and bo ron. Bo ron was not found sig nif i cant sup ported by Fernandes and Lima Filho (2). Rachis is flower bear ing place of thespike which length was in creased by bo ron andcal cium ap pli ca tion. Lon gest rachis was pro ducedwith cal cium fol lowed by bo ron, and zinc could not af fect it sig nif i cantly, which is in support ofFernandes and Filho (2). Num ber of flo rets perspike is also a pa ram e ter for judg ment of qual ity ofspike. Flo rets al ways face in one di rec tion and assuch more num ber of flo rets per spike en hance thebeauty of the spike. The spray of bo ron and cal cium had im proved the num ber of flo rets per spikesig nif i cantly. The width and length of flo ret wassig nif i cantly af fected by ap pli ca tion of bo ron andzinc but cal cium could not af fect this trait. This
find ing is in con so nance with Chaturvedi et al. (1).
Keep ing in view the re sults sum ma rized above it may be con cluded that the fo liar spray ing of zincat 0.5% to glad i o lus plants was ef fec tive inin flu enc ing most of pa ram e ters par tic u larly the size of spike and flo ret fol lowed by cal cium @ 0.75%ap pli ca tion.
Effect of foliar spray of zinc, calcium and boron on spike production of gladiolus 335

336 Katiyar et al..s
u l o idalg
ni noi tc
u dor
p eki
ps no
no rob
dna
mui clac ,c
niz fo yar
ps railof fo tce ffE :1 el
baT
aC
× B )a(
B ×
nZ )
b(n
Z × a
C )c(
)mc( t
hgieh t
nalP
B
aC
aC
0a
C1
naeM
nZ B
B0
B1
naeM
aC
n
Z
nZ
0n
Z1
naeM
B0
10.0870.08
40.08n
Z0
88.8729.08
09.97a
C0
88.9726.18
57.08
B1
05.1826.18
65.18n
Z1
02.1891.28
07.18a
C1
29.9777.18
58.08
naeM
57.0858.08
08.08nae
M40.08
65.1808.08
naeM
09.9707.18
08.08
)mc( fael fo
htgne
L
B0
75.6526.65
06.65n
Z0
85.5527.55
56.55a
C0
26.5596.75
56.65
B1
37.6538.65
87.65n
Z1
16.7558.75
37.75a
C1
86.5577.75
37.65
naeM
56.6537.65
96.65nae
M06.65
87.6596.65
naeM
56.5537.75
96.65
)mc( fael fo
htdi
W
B0
85.266.2
26.2n
Z0
54.245.2
05.2a
C0
74.208.2
46.2
B1
96.267.2
27.2n
Z1
97.209.2
58.2a
C1
35.298.2
17.2
naeM
46.217.2
76.2nae
M26.2
27.276.2
naeM
05.258.2
76.2
tnal
p rep sevael fo re
bm
uN
B0
39.789.7
69.7n
Z0
34.798.7
66.7a
C0
46.717.8
81.8
B1
24.854.8
44.8n
Z1
84.899.8
47.8a
C1
76.767.8
22.8
naeM
81.822.8
02.8nae
M69.7
44.802.8
naeM
66.747.8
02.8
)mc( t
nalp fo sse
nkci
hT
B0
04.184.1
44.10n
Z73.1
93.183.1
aC
043.1
84.114.1
B1
24.105.1
64.11n
Z15.1
35.125.1
aC
134.1
65.194.1
naeM
14.194.1
54.1nae
M44.1
64.154.1
naeM
83.125.1
54.1
)mc( t
nalp fo
htdi
W
B0
25.255.2
45.2n
Z0
15.225.2
15.2a
C0
94.285.2
45.2
B1
55.285.2
65.2n
Z1
75.216.2
95.2a
C1
35.206.2
75.2
naeM
45.275.2
55.2nae
M45.2
65.255.2
naeM
15.295.2
55.2
)sya
d( gni
daeh fo
noitaru
D
B0
04.8630.66
22.76n
Z0
67.7670.56
71.66a
C0
61.8680.86
21.86
B1
58.7602.26
20.56n
Z1
71.7679.46
70.66a
C1
71.4660.46
21.46
nae
M2
1.8
621.46
21.66n
aeM
17.
76
20.5621.66
nae
M7
1.6
670.66
21.66
.....dt
no
C

Effect of foliar spray of zinc, calcium and boron on spike production of gladiolus 337:1 el
baT
…dtnoC
aC
× B )a(
B ×
nZ )
b(n
Z × a
C )c(
B
aC
aC
0a
C1
naeM
nZ B
B0
B1
naeM
a
C nZ
nZ
0n
Z1
naeM
)mc( e
kips fo
htgne
L
B0
00.5533.65
66.55n
Z0
56.4577.45
17.45a
C0
92.4515.55
09.45
B1
08.4565.65
86.55n
Z1
86.6595.65
46.65a
C1
31.5567.75
44.65
naeM
09.4544.65
76.55nae
M66.55
86.5576.55
naeM
17.4546.65
76.55
)mc( e
kips fo sse
nkci
hT
B0
17.057.0
37.0n
Z0
07.017.0
07.0a
C0
86.057.0
27.0
B1
27.077.0
57.0n
Z1
77.087.0
87.0a
C1
27.008.0
67.0
naeM
27.067.0
47.0nae
M37.0
57.047.0
naeM
07.087.0
47.0
)mc( si
hcar fo htg
neL
B0
53.7448.94
95.84n
Z0
94.8483.05
44.94a
C0
81.8454.84
23.84
B1
82.9427.15
05.05n
Z1
07.8426.05
66.94a
C1
96.0578.05
87.05
naeM
23.8487.05
55.94nae
M95.84
05.0555.94
naeM
44.9466.94
55.94
eki
ps rep sterolf fo re
bm
uN
B0
73.5170.81
27.61n
Z0
06.6191.81
93.71a
C0
70.9152.61
61.61
B1
59.6145.91
52.81n
Z1
48.6113.81
75.71a
C1
27.8198.81
18.81
naeM
61.6118.81
84.71nae
M27.61
52.8184.71
naeM
93.7175.71
84.71
)mc( terolf fo
htdi
W
B0
76.757.7
17.7n
Z0
44.787.7
16.7a
C0
85.770.8
38.7
B1
89.700.8
99.7n
Z1
89.702.8
90.8a
C1
46.711.8
88.7
naeM
38.788.7
58.7nae
M17.7
99.758.7
naeM
16.790.8
58.7
)mc( terolf fo
htgne
L
B0
25.886.8
06.8n
Z0
83.849.8
66.8a
C0
36.840.9
38.8
B1
51.912.9
81.9n
Z1
28.824.9
21.9a
C1
96.802.9
59.8
naeM
38.859.8
09.8nae
M06.8
81.909.8
naeM
66.821.9
09.8
)sya
d( tnal
p no e
kips fo
ytivegno
L
B0
61.4199.61
85.51n
Z0
65.5116.61
80.61a
C0
76.4137.41
07.41
B1
42.5170.81
56.61n
Z1
06.5107.61
51.61a
C1
94.7175.71
35.71
naeM
07.4135.71
11.61nae
M85.51
56.6111.61
naeM
80.6151.61
11.61
338 Katiyar et al.
REF ER ENCES
1. Chaturvedi, O.P., Shukla, L.N. and Singh, A.R.
(1986). Ef fect of Agromin on growth and
flow er ing of glad i o lus. Prog. Hort., 18 : 3-4,
196-199.
2. Fernandes, P.D. and Lima, Filho, S.A. (1974).
The ef fect of lime on glad i o lus. Cientifica, 1 (1)
: 33-41.
3. Gauch, H.G. and Dugger, W.M. (1953). The role
of bo ron in the tanslocation of su crose. Plant
Physiol., 28 : 457.
4. Hew itt, E.J. (1963). The es sen tial nu tri ent
el e ments: re quire ments and in ter ac tions in
plants. In F.C. Stew ard, ed. Plant Phys i ol ogy.
New York: Ac a demic Press.
5. Makory, B.S., Koriem, S.O. and Barilious, S.I.
(1994). Re sponse of on ion from set to var i ous
con cen tra tions of salts in ir ri ga tion wa ter.
In dian J. Agril. Sci., 25 (4) : 215-223.
6. Sharova, N.L., Rhybak, Yu. G. and Ma rina, N.E.
(1977). De vel op ment of glad i oli un der the
in flu ence of microelements. Vyrashchivanie.
Tsvetochno Dekorat. Rast. Moldavii., 11-17.
7. Singh, D.D. and Tiwari, R.S. (1995). Effect of
micronutrients on growth and yield of onion
(Allium cepa L.) variety Pusa Red. Recent Hort.
2 (2) : 70-77.
8. Singh, J.P., Kumar, K. and Katiyar, P.N. (2012).
Effect of zinc, iron and copper on yield
parameters of gladiolus HortFlora Res. Spect.,
1(1) : 64-68.

PATH CO EF FI CIENT ANAL Y SIS FOR SEED LING VIG OUR IN RAD ISH
(Raphanus sativus L.) GE NO TYPES
Dilbag Singh and Rajinder Singh
De part ment of Veg e ta ble Sci ence, Punjab Ag ri cul tural Uni ver sity, Ludhiana, Punjab, In dia, 141 004
E-mail: [email protected]
AB STRACT: The field study was con ducted dur ing 2010 and 2011 to as sess the ge neticvari abil ity, inter re la tion ships and di rect and in di rect ef fects of com po nent traits on seed lingvig our in rad ish. High PCV val ues were ob tained in FW (32.68%), SVI I (32.43%) andger mi na tion % (30.84%). Mag ni tude of heritability was high est for SVI II (92.00%) fol lowed byger mi na tion (89.45%), 100 SW (84.90%), ASL (83.16%) and SVI I (79.27%). SVI II showedpos i tive and highly sig nif i cant as so ci a tion with ger mi na tion %,ASL, seed ling FW, DW, 100 SWand SVI I. Path anal y sis in di cated pos i tive di rect ef fect of SVI I, shoot length and 100 seedweight on seed ling vig our in dex II of dif fer ent rad ish ge no types. The seed ling vig our in dex I,shoot length, 100 seed weight and ger mi na tion % ex hib ited strong pos i tive cor re la tion andpos i tive or neg a tive di rect ef fects on seed ling vig our in dex II emerged as im por tant com po nentscon trib ut ing to seed ling vig our. There fore, se lec tion pri mar ily based on these traits may lead toiden ti fi ca tion and de vel op ment of ge no types hav ing better field emer gence and seed linges tab lish ment.
Keywords: Rad ish, ger mi na tion, heritability, path co ef fi cient, vig our index.
Seed is the sin gle most im por tant fac tor insuc cess ful, uni form and high yield ing crop. Goodseed qual ity en sures high seed ling vigour, bettercrop es tab lish ment and more bio mass. Seed vigor is the cu mu la tive im pact of com plex ge netic and ecophys i o log i cal fac tors on the growth andde vel op ment of en do sperm and em bryo (Sun et al,16). “Seed vigour com prises those prop er ties which de ter mine the po ten tial for rapid, uni formemer gence and de vel op ment of nor mal seed lingsun der a wide range of field con di tions” (AOSA, 2).Quicker and uni form ger mi na tion fa cil i tatessu pe rior crop yields, whereas slow and non uni form ger mi na tion due to low seed vig our de creases cropyields (Basra et al, 3). Seed vig our de ter mines theabil ity of the plants to emerge through soil andgrow vigourously un der var ied en vi ron men talcon di tions (TeKrony and Egli, 17). Seed ling vig our is de ter mined by var i ous seed and phys i o log i calpa ram e ters like seed weight or size, ger mi na tion,seed ling dry weight and vig our in di ces (Awan et al,4). The fac tors are of im mense im por tance in caseseed vig our is used as se lec tion cri te rion in cropim prove ment (Ev ans and Bhatt, 6). In for ma tion onchar ac ter as so ci a tion re spon si ble for seed ling
vig our among these traits is very lim ited in rad ish.Since, rad ish is a short du ra tion, quick grow ingcrop and de pend ing upon cultivars and sea sonreach mar ket able ma tu rity in 30-45 days af tersow ing. True es ti ma tion of seed ling vig our and itsas so ci a tion with con trib ut ing char ac ters is veryim por tant to raise quick, vig or ous and uni form crop stand. There fore, a pre lim i nary study wascon ducted to es ti mate the ge netic vari abil ity, interre la tion ship and di rect and in di rect ef fects ofcom po nent traits on seed ling vig our in rad ish forse lec tion of ge no types hav ing su pe riores tab lish ment un der field conditions.
MA TE RI ALS AND METH ODS
The ex per i ment was con ducted at theVeg e ta ble Re search Farm, Punjab Ag ri cul turalUni ver sity, Ludhiana dur ing the win ter sea son of2010 and 2011. The ex per i ment was laid out in aran dom ized block de sign rep li cated thrice. Plant ing ma te rial con sisted of six ge no types of rad ish(Raphanus sativus L.) with three of themcom mer cial cultivars (viz. Punjab Pasand, PunjabSafed and Pusa Chetki) and three ad vanced linesde vel oped at PAU, Ludhiana (RL 2210, RL 9-1 andRL-25). 200 seeds of each ge no type were sown on
HortFlora Research Spectrum, 1(4): 339-343 (2012) ISSN : 2250-2823
Received : 05.7.2012 Accepted : 06.8.2012

340 Singh and Singh
ridges in the first week of Oc to ber each year.Be tween ridges and plant spac ing were main tainedat 45 cm and 7.5 cm, re spec tively. Af ter one weekof ger mi na tion twenty ran domly se lected seed lingsfrom each treat ment were up rooted and washedcare fully to re move soil par ti cles. Data werere corded ac cord ing to rules es tab lished by ISTA(8) on ger mi na tion (%), seed ling shoot length (cm),seed ling root length (cm), seed ling fresh weight (g), seed ling dry weight (g), 100 seed weight (g) and seed ling vig our in di ces I and II. The ger mi na tionwas cal cu lated as per num ber of seed lings ob tainedaf ter one week of sow ing to the num ber of seedssown. For de ter min ing seed ling dry weight tenran domly se lected nor mal seed lings were dried at110°C for 17 hours and weighed. For 100 seedweight, 100 seeds were ran domly se lected fromeach ge no type and weighed on elec tronic bal ance.Vig our in di ces were cal cu lated us ing the for mulagiven by Ab dul-Baki and An der son (1). The pathanal y sis of di rect and in di rect ef fects for seed lingvig our was cal cu lated as sug gested by Dewey and
Lu (5).
RE SULTS AND DIS CUS SION
Mean per for mance of ge no types (Ta ble 1)showed sig nif i cant ex is tence of vari a tion forvar i ous pa ram e ters ex cept av er age seed ling rootlength (Singh et al., 15). High est ger mi na tion wasre corded in Punjab Pasand (93.67%) and low est inPunjab Safed (71.67%) af ter one week of sow ing.Seed ling shoot length (ASL) was max i mum forPunjab Pasand (13 cm) fol lowed by RL-2210(12.3cm) which was sta tis ti cally at par and was least inRL-25 (8.6 cm). ARL (seed ling root length) wasnon sig nif i cant among all the ge no types. PunjabPasand also ex hib ited sig nif i cantly high val ues forFW (fresh weight, 9.8 g), seed vig our in dex I (SVI1, 1218.37), seed vig our in dex 2 (SVI 2, 61.16) and100 seed weight (1.06 g). RL-22 was sta tis ti cally atpar with Punjab Pasand in FW, DW, vig our index 2and 100 seed weight. RL-25 re corded low est val ues for DW (0.41), seed ling vig our in dex 1 (661.3),seed ling vig our in dex 2 (31.55) and 100 seedweight (0.88). Vari abil ity among the char ac ters can
well be mea sured by the range and genotypicco ef fi cient of vari a tion. In most of the traitsdif fer ence be tween phenotypic (PCV) andgenotypic co ef fi cients of vari a tion (GCV) was nottoo high in di cat ing less im pact of en vi ron men talfluc tu a tions (Rahman et al., 13). High GCV andPCV val ues sug gest that di rect se lec tion of thesetraits can be more ben e fi cial. Phenotypicco ef fi cients of vari a tions were high est in FW(32.68%), fol lowed by SVI I (32.43%),ger mi na tion (30.84%), SVI II (27.04 %) and it wasleast for 100 SW (7.97%).
High mag ni tude of heritability was ob servedfor all the traits ex cept for SRL (28.87%).Heritability es ti mates were high est for SVI 2(92.00%) fol lowed by ger mi na tion (89.45%), 100SW (84.90%), SSL (83.16%), FW (80.62%) andSVI 1(79.22%), de pict ing that se lec tion for thesechar ac ters can be ef fec tive for im prov ing seed lingvig our in rad ish (Saeidi, 14). High heritability andPCV val ues for FW, SVI I, SVI II and fi nalger mi na tion % show dom i nant ef fect of genes andthus bear sig nif i cant ef fect on de ter min ing ge neticvari abil ity among rad ish ge no types (Malik et al.,11).
Seed vig our is of ut most im por tance in earlycrop es tab lish ment and growth. Cor re la tionco ef fi cient (Ta ble 2) for seed ling vig our in dex IIshowed sig nif i cantly high and pos i tive cor re la tionwith ger mi na tion, shoot length, fresh and dryweight, 100 seed weight and vig our in dex I.Ge no types show ing better vig our and shoot lengthwould lead to better field per for mance. (Kamoshitaet al., 9). Fur ther genotypic cor re la tion co ef fi cientswere gen er ally higher than phenotypic cor re la tionco ef fi cients im ply ing strong as so ci a tion be tweentwo char ac ters at genotypic level. From 100 seedweight, re sults also showed that bolder the seedhigher the vig our in dex (Willenborg, 18).Ger mi na tion ex hib ited sig nif i cant and pos i tivecor re la tion with all the traits ex cept root length,in di cat ing de pend ence upon these traits on fi nalseed ling num ber (Munir et al., 12). How ever, rootlength showed sig nif i cantly neg a tive cor re la tion

Path coefficient analysis for seedling vigour in radish genotypes 341
Ta ble 1: Means, range, phenotypic and genotypic co ef fi cients (PCV and GCV) of vari a tion, heritability and ge neticad vance of var i ous seed ling char ac ters in dif fer ent ge no types of rad ish.
Genotype Germ.(%)
ASL(cm)
ARL(cm)
FW(g)
DW(g)
100 SW(g)
SVI I SVI II
Punjab Pasand 93.67 13.00 5.57 9.80 0.65 1.06 1218.37 61.16
RL 9-1 73.67 9.40 5.30 6.29 0.45 0.90 694.77 33.27
Pusa Chetki 73.00 11.30 4.93 8.35 0.57 0.96 825.40 41.77
RL 2210 79.67 12.30 4.67 9.78 0.69 1.03 980.80 54.85
PP x AR 77.00 8.60 4.93 5.49 0.41 0.88 661.73 31.55
Punjab Safed 71.67 9.33 5.87 4.55 0.45 0.92 669.30 32.03
C.D.(P=0.05) 4.99 1.42 NS 1.92 0.15 3.10 117.06 11.40
Mean 78.11 10.65 5.21 7.37 0.49 0.95 841.72 42.43
Range 73.67-91.67 8.6-13 4.66-5.86 4.55-9.8 0.41-0.69 0.87-1.06 661.73-1218.36
31.54-61.16
PCV 30.84 17.91 11.92 32.68 25.69 7.97 32.43 27.04
GCV 29.25 16.33 6.41 29.34 19.97 7.34 28.87 25.94
h2 % 89.45 83.16 28.87 80.62 60.42 84.90 79.22 92.00
Ger mi na tion—Germ. Av er age Shoot Length—ASL, Av er age Root Length—ARL, Fresh Weight—FW, DryWeight—DW, 100 Seed Weight—100 SW, Seed Vig our In dex I—SVI I, Seed Vig our In dex II—SVI II,Phenotypic co ef fi cient of vari a tion (PCV), Genotypic co ef fi cient of vari a tion (GCV), Heritability in broad sense(h2)Ta ble 2: Genotypic (G) and phenotypic (P) cor re la tions among dif fer ent seed ling char ac ters in rad ish.
Character Germ ASL ARL FW DW 100 SW SVI 1 SVI II
Germ. G P
1.000
1.000
0.738**
0.662**
0.261
-0.060
0.710**
0.604*
1.703**
0.491
0.805**
0.697**
0.879**
0.941**
0.908**
0.789**
ASL G
P
1.000
1.000
-0.278
-0.055
0.918**
0.900**
0.910**
0.886**
0.805**
0.795**
0.829**
0.769**
0.892**
0.835**
ARL G P
1.000
1.000
-0.731**
-0.152
-0.708**
0.005
-0.089
-0.023
-0.335
0.003
-0.010
-0.045
FWGP
1.000
1.000
0.892**
0.815**
0.915**
0.811**
0.905**
0.849**
0.747**
0.841**
DW G
P
1.000
1.000
0.809**
0.697**
0.879**
0.754**
0.908**
0.881**
100 SW G
P
1.000
1.000
0.895**
0.867**
0.924**
0.905**
SVI 1 G
P
1.000
1.000
0.910**
0.898**
*P=0.05, **P=0.01
Ger mi na tion— Germ., Av er age Shoot Length—ASL, Av er age Root Length—ARL, Fresh Weight—FW,
Dry Weight—DW, 100 Seed Weight—100 SW, Seed Vig our In dex I—SVI I, Seed Vig our In dex II—SVI II

342 Singh and Singh
with fresh weight and dry weight. The cor re la tionma trix of com po nent seed ling traits showed thatim prov ing ger mi na tion, seed ling length, freshweight and 100 seed weight would im prove theseed vig our in dex and thereby better fieldes tab lish ment (Lafond and Baker, 10).
Cor re la tion es ti mates give broader in di ca tionof in ter re la tion ship be tween com po nent traitswhich could be mis lead ing due to mu tualcan cel la tion of ef fects of com po nent char ac ters.But path co ef fi cient anal y sis pro vides forpar ti tion ing of re la tion ships into spe cific di rect andin di rect ef fects de pict ing the rel a tive in flu ence ofeach of the causal fac tors in de ter min ing theseed ling vig our (Guler et al., 7). Path co ef fi cientanal y sis tak ing seed ling vig our in dex II asde pend ent vari able re vealed that seed ling vig ourin dex I, shoot length and 100 seed weight ex hib itedstrong pos i tive di rect ef fect with SVI II with mi norpos i tive con tri bu tion from ger mi na tion %.Cor re la tion and path anal y sis in di cated ma jorpos i tive re la tion ship and con tri bu tion of SVI I,ASL and 100 SW, thereby im ply ing that these could be ex ploited for se lec tion of ge no types with highseed ling vig our (Singh et al, 15). DW thoughhav ing sig nif i cant pos i tive cor re la tion hadsig nif i cant neg a tive di rect ef fect on seed lingvig our. FW ex erted small neg a tive di rect ef fect but
great in di rect ef fect via DW and 100 SW onseed ling vigour.
The re sults from the pres ent study in di catedhigh heritability for ger mi na tion %, ASL, 100 SWFW, DW and SVI I. These char ac ters also ex hib ited pos i tive or neg a tive di rect ef fect on seed ling vig our in dex II. There fore, em pha sis should be laid thesecom po nent traits while se lect ing ge no types withhigh seed ling vig our in dex for crop im prove ment.
REF ER ENCES
1. Ab dul Baki, A. A. and An der son J D. (1973).
Vig our de ter mi na tion in soy bean by mul ti ple
cri te ria. Crop Sci., 13:630-637.
2. As so ci a tion of Of fi cial Seed Anal y sis (1983).
Seed vig our test ing hand book. 32. Assoc. Off.
Seed Anal., Spring field, IL.
3. Basra, S.M.A., Zia, M.N., Mehmood, T., Afzal,
I. and Ahmed, N. (2002). Com par i son of
dif fer ent in vig o ra tion tech niques in wheat
(Triticum aestivum L.) seeds. Pa ki stan J. Arid
Agric., 5:11-16.
4. Awan,S.I., Niaz, S., Malik, M.F.A. and Ali, S.
(2007). Anal y sis of vari abil ity and re la tion ship
among seed ling traits and plant height in
semi-dwarf wheat (Triticum aestivum L.).
J.Agri. Soc. Sci., 3 (2):59-62.
5. Dewey, D.R. and Lu, K.H. (1959). A cor re la tion
and path anal y sis of com po nents of crested
Ta ble 3: Di rect and in di rect ef fects of com po nent traits on seed vig our in rad ish.
Trait Directeffect
Germ. ASL ARL SFW SDW 100SW
SVI I Correlation
Germ. G 0.035 0.539 -0.001 -0.015 -0.594 -0.070 0.921 0.815**
ASL G 0.730 0.026 0.001 -0.020 -0.753 0.095 0.812 0.891**
ARL G -0.003 0.009 -0.203 0.015 0.598 0.008 -0.414 -0.010
FW G -0.021 0.025 0.716 0.002 -0.704 -0.103 0.932 0.847**
DW G -0.844 0.025 0.755 0.002 -0.033 0.076 0.927 0.908**
100SW
G 0.100 0.031 0.727 0.001 -0.020 -0.808 0.896 0.927**
SVI I G 0.918 0.028 0.730 0.001 -0.020 -0.842 0.095 0.910**
ASL- Average shoot length, ARL- Average root length, FW- Seedling fresh weight, DW- Seedling dry weight,Germ.-Germination,SVI I-Seed vigour index I,SW-Seed weight, SVI II-Seed vigour index II.

wheat grass seed pro duc tion. Agron. J., 51
(6):515-518
6. Ev ans, L.E. and Bhatt, G.M. (1977). In flu ence
of seed size, pro tein con tent and cultivar on
early seed ling vigor in wheat. Can. J. Plant Sci.
57:929-935.
7. Guler, M., Adak, M.S. and Ulukan, H. (2001).
De ter min ing re la tion ships among yield and
some yield com po nents us ing path co ef fi cient
anal y sis in chick pea (Cicer arietinum L.). Eur.
J. Agron., 14:161-166.
8. ISTA (1999). In ter na tional Rules for Seed
Test ing. Seed Sci . and Tech ., 27: 25-30.
9. Kamoshita, A.,Babu, R.C., Bhoopathi,N.M. and
Fukai,S.(2006). Phenotypic and genotypic
anal y sis of drought re sis tance tarits for
de vel op ment of rice cultivars adapted to rainfed
en vi ron ments. Field Crop Res., 109:1-23.
10. Lafond,G.P.and Baker, R.J.(1986). Ef fect of
ge no type and seed size on speed of meergence
and seed ling vigor in nine spring wheat
cultivars. Crop Sci., 26:341-346.
11. Malik, M.A., Khan, A.S., Saifullah, M.A.,
Khan, B.R.and Mahmood, S.M. (2000). Study
of cor re la tion among mor pho log i cal pa ram e ters
in dif fer ent va ri et ies/ac ces sions of Bras sica
spe cies. Pak. J. Biol. Sci., 3:1180-1182.
12. Munir,H., Basra, S.M.A., Cheema, M.A. and
Wahid, A.(2011). Phenotypic flex i bil ity in
ex otic quinoa (Chenodpodium quinoa Willd.)
germplasm for seed ling vig our and vi a bil ity.
Pak. J. Agric Sci., 48(4):255-261.
13. Rahman, M.A., Hossain, M.D., Is lam,M.S.,
Biswas, D.K. and Ahiduzzaman, M.(2002).
Ge netic vari abil ity, heritability and path
anal y sis in snake gourd (Trichosanthes anguina
L.). Pak. J. Biol. Sci., 5(3):284-286.
14. Saeidi, G. (2008). Ge netic vari a tion and
heritability for ger mi na tion, seed vig our and
field emer gence in brown and yel low seeded
ge no types of flax. Int. J. Plant Prod., 2
(1):15-21.
15. Singh, T.P., Pandey, U.K., Sharma, A.P. and
Yadav, R.S. (2000). Char ac ter as so ci a tion and
pah anal y sis for seed ling vig our in dex in wheat
un der dif fer ent tem per a tures. Agric. Sci. Di gest,
20(4):222-224.
16. Sun, Q., Wang, J. and Sun, B. (2007). Ad vances
on seed vigor phys i o log i cal and ge netic
mech a nisms. Agric. Sci. China., 6
(9):1060-1066.
17. TeKrony, D.M. and Egli, D.B.(1991).
Re la tion ship of seed vigor to crop yield: A
re view. Crop Sci., 31:816-822.
18. Willenborg, C.J., Wilderman, J.C., Miller, A.K.,
Rossnagel, B.G. and Shirtliffe, S.J. (2005).Oat
germination characterstics differ among
genotypes, seed sizes and osmotic potentials.
Crop Sci., 45:2023-2029.
Path coefficient analysis for seedling vigour in radish genotypes 343

EF FECT OF POST HAR VEST CAL CIUM TREAT MENTS ON SHELF LIFE
OF GUAVA CV. SARDAR
Rajesh Kumar, Shant Lal and K.K. Misra
De part ment of Hor ti cul ture, Col lege of Ag ri cul ture, G. B. Pant Uni ver sity of Ag ri cul ture andTech nol ogy, Pantnagar-263 145, U.S. Nagar (Uttarakhand)
Email: kamboj783@ya hoo.com
AB STRACT: The search for tech niques that ex tend shelf life of guava (Psidium guajava) fruits,and re duce its postharvest losses is de sir able. The ob jec tive of this work was to eval u ate theef fects of con cen tra tions of com pet i tive eth yl ene an tag o nist cal cium salts on con ser va tion of‘Sardar’ guava fruits. Treat ments con sisted of 0.5%, 1% Cal cium Ni trate, 1%, 2% Cal ciumChlo ride and 0.5%, 1% Cal cium Sul phate for 12 days fol lowed by stor age at room tem per a ture.The ap pli ca tion of 1% cal cium chlo ride for 12 days was ef fi cient in de lay ing loss of skin color andin keep ing fruit firm at room tem per a ture stor age. The cal cium ni trate at 1% con cen tra tion wasef fi cient in de lay ing skin colour loss only when fruits were stored at 25°C. The ef fect of cal ciumni trate was quite sig nif i cant on the re duc tion of ac cept abil ity in both the year. The prod uct was
ef fi cient in de lay ing the rip en ing of fruits and the cal cium chlo ride 1% showed the best ef fect.
Keywords: Psidium guajava, cal cium salts, postharvest, shelf life.
Guava is a highly per ish able fruit that showsin tense met a bolic ac tiv ity. Guava fruit be comesfully ripe be tween three and five days at roomtem per a ture. Due to such perishability, the con trolof fruit rip en ing is fun da men tal for in creas ing shelflife af ter har vest. The main fac tors de pre ci at ingpostharvest qual ity in guava are fast loss of greencolor, ex ces sive soft en ing, high rot in ci dence andloss of tur gid ity. Stor age un der low tem per a tureshas been con sid ered the most ef fi cient method tomain tain qual ity of most fruits due to its ef fects onre duc ing res pi ra tion rate, tran spi ra tion, eth yl enepro duc tion, rip en ing, se nes cence and rotde vel op ment. In cli mac teric fruits, like most guavava ri et ies, the re duc tion of tem per a ture de lays thecli mac teric peak and, con se quently, rip en ing. There cent find ing that cal cium salts in ter feres witheth yl ene link to its bind ing site rep re sents a newand pow er ful tool for postharvest man age ment ofcli mac teric fruits. It has been dem on strated that thein hi bi tion of the eth yl ene ac tion de lays rip en ingand se nes cence in sev eral spe cies of fruits, such ascus tard ap ple, guava, pa paya, peach, ap ple,av o cado, ba nana, straw berry and to mato. Pre vi ousfind ing re vealed that post-har vest treat of var i ouscal cium com pounds and pack ag ing ma te rial haveen hanced their shelf life, reducedment the spoil age
and im proved the fruit qual ity by de lay ing the on set of se nes cence dur ing stor age. Keep ing in view theim por tance on crop, a study was car ried out tostudy the ef fect of these com pounds on stor age lifeof guava cv. Sardar.
MA TE RI ALS AND METH ODS
Healthy, firm, ma ture and uni form sized fruitsof guava cv. Sardar were pro cured from aHor ti cul ture Re search Cen tre, Pattharchata onDe cem ber 2007 and De cem ber 2008. The anal y siscar ried out at post har vest lab o ra tory of theDe part ment of Hor ti cul ture, Col lege ofAg ri cul ture, G.B. Pant Uni ver sity of Ag ri cul tureand Tech nol ogy, Pantnagar. The se lected fruitswere cleaned, dried and treated dip method withCa(NO3)2 (0.5% & 1%), CaCl2 (1% & 2%) andCaSO4 (0.5% & 1%) and sub se quently packed innews pa per and stored at room tem per a ture(28-33°C) and 85-90% rel a tive hu mid ity. Therewere seven treat ments rep li cated thrice in acom pletely ran dom ized de sign (CRD). Fruitsam ples, each com pris ing of 5 fruits, were drawnfrom each treat ment at the time of stor age andsub se quently af ter 0, 3, 6, 9 and 12 days of stor agefor physico-chem i cals anal y sis. The fruits wereeval u ated for pal at abil ity rat ing by a panel of 7judges on a score card (10 points). Re duc ing sugar,
HortFlora Research Spectrum, 1(4): 344-347 (2012) ISSN : 2250-2823
Received : 24.7.2012 Accepted : 18.8.2012
nonreducing sugar and pec tin were analysed byfol low ing stan dard pro ce dures sug gested byRanganna (8).
RE SULTS AND DISCUSSION
Data de picted in Ta ble 1 showed thatpack ag ing ma te rial, stor age pe riod, chem i cals andtheir in ter ac tion had sig nif i cant ef fect on re duc ingsugar of fruit dur ing both the years. Max i mumre duc ing sugar (3.18 % and 3.55 %) was found inwrapped fruits as com pared to un wrapped fruitsdur ing both the years. With re spect to stor agepe riod, max i mum re duc ing sugar (3.42%) wasob tained at 6th day of stor age in first year, whereas,high est (3.83 per cent) re duc ing sugar was found insec ond year at 3rd day of stor age. On the other hand, min i mum re duc ing sugar (2.91% and 3.05%) wasfound at 12th days of stor age dur ing both the years,re spec tively. Dif fer ent chem i cals sig nif i cantlyaf fected the re duc ing sugar con tent of fruits.High est re duc ing sugar (3.21% and 3.58%) wasob tained with cal cium chlo ride (1%) and low est(3.08% and 3.44%) was found in con trol dur ingboth the years, re spec tively. The pres ent stud iesin di cated that af ter an ini tial rise, the per cent age ofre duc ing sugar de creased dur ing stor age in am bi ent tem per a ture. The ini tial in crease in re duc ing sug arsmight be due to the con ver sion of starch intore duc ing sugar and later on re duc tion couldpos si bly might be due to uti li za tion of sugar in thepro cess of res pi ra tion. The per cent age of re duc ingsugar in creased slowly dur ing stor age pe riod upto6th day and de clined there af ter. The high est con tent of re duc ing sugar was ob tained in the wrappedfruits kept in pa per box. The in crease in re duc ingsugar might be due to in creased rate of starchdeg ra da tion by a am y lase ac tiv ity (Hiwale andSingh, 7). In gen eral, af ter 6th day of stor age,re duc ing sugar de creased in all the treat mentsin clud ing con trol.
Con ver sion of starch and poly sac cha rides into sim ple sugar with the ad vance ment of stor age wasre spon si ble for the in crease of re duc ing sugar andon ward de cline was due to the uti li za tion of sugarin evapo-tran spi ra tion and other bio chem i cal
ac tiv i ties. Data pre sented in Ta ble 1 showed thatpack ag ing ma te rial, stor age pe riod and chem i calsand their in ter ac tion had sig nif i cant ef fect onnon-re duc ing sugar con tent of fruits dur ing both the years. Max i mum non-re duc ing sugar was found inwrapped fruits dur ing both the years. In case ofstor age pe riod, max i mum non-re duc ing sugar(4.08%) was re corded at 9th day of fruit stor age infirst year, whereas, in sec ond year non-re duc ingsugar was high est (3.66%) at 6th day of stor age.Min i mum non-re duc ing sugar (3.61 and 3.53%)was found at 12th days of stor age dur ing both theyears. With re spect of chem i cals, high estnon-re duc ing sugar (4.06% and 3.67%) wasob tained in cal cium chlo ride 1% while min i mumnon-re duc ing sugar was found in con trol dur ingboth the years. Per cent age of non-re duc ing sugar of guava fruit in creased up to 9th day of stor age atroom tem per a ture. This in crease in sugar in thebe gin ning of stor age is mainly due to the hy dro ly sis of starch. These re sults are in line of the re sultsre ported by Biale (2) in mango fruit dur ing stor age.Fruit treated with cal cium com pound as posthar vest treat ments re tained higher per cent age ofnon-re duc ing sugar dur ing stor age. Highper cent age of non-re duc ing sugar was found inwrapped fruits kept in pa per boxs. The in crease inthe non-re duc ing sugar might be due to thehy dro ly sis of starch and con ver sion in the pec tinsub stances from wa ter in sol u ble to wa ter sol u blefrac tions. These re sults are in ac cor dance with thefind ings of Chahal and Bal (3), Chundawat et al.(5), Hiwale and Singh (7) and Singh et al. (11).
It is ev i dent from the data pre sented in Ta ble 2that pack ag ing ma te rial, stor age pe riod andchem i cals had sig nif i cant ef fect on pec tin con tentof the fruits in both the years of the in ves ti ga tion. In first year, max i mum pec tin con tent was ob tained inwrapped fruits and min i mum pec tin con tent wasfound in un wrapped fruits. Sim i lar trend wasob served in sec ond year. Stor age pe riod also hadpro nounced ef fect on pec tin con tent of the fruits. Itwas found max i mum at the day of har vest (zeroday) and min i mum at 12th day of stor age. Sim i larpat tern was ob tained dur ing sec ond year. Pec tin
Effect of post harvest calcium treatments on shelf life of guava 345
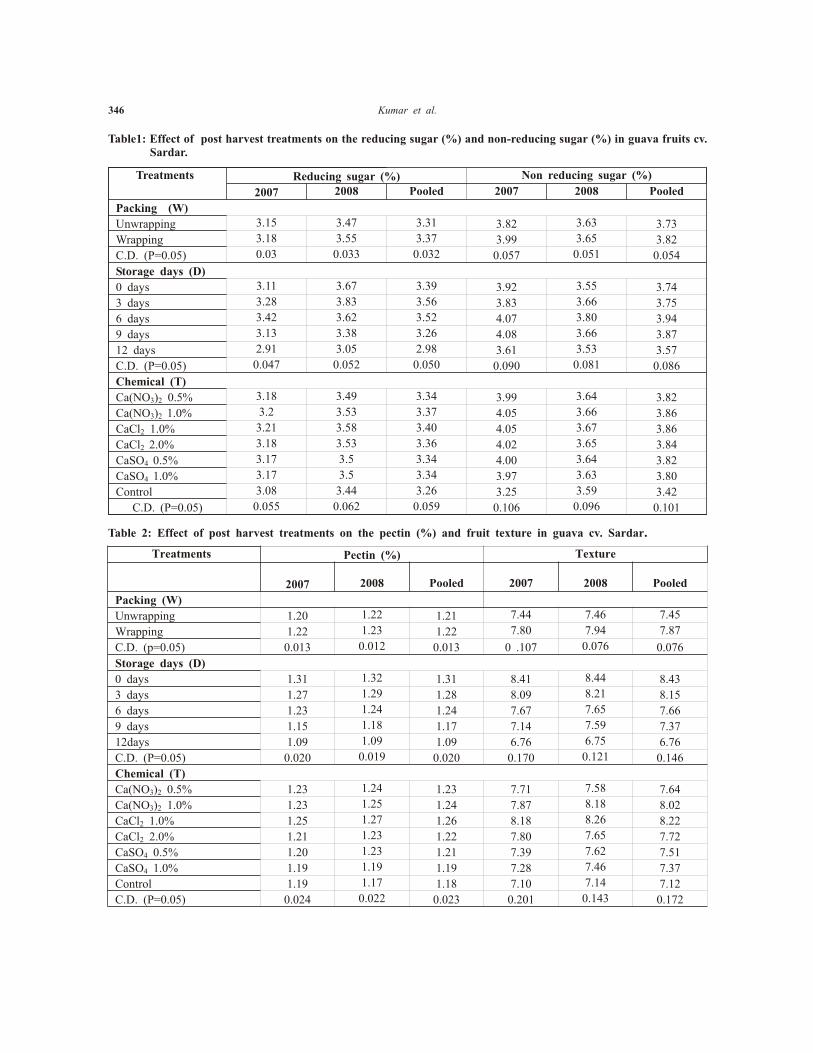
346 Kumar et al.
Table1: Ef fect of post har vest treat ments on the re duc ing sugar (%) and non-re duc ing sugar (%) in guava fruits cv. Sardar.
Treatments Reducing sugar (%) Non reducing sugar (%)
2007 2008 Pooled 2007 2008 Pooled
Packing (W)
Unwrapping 3.15 3.47 3.31 3.82 3.63 3.73
Wrapping 3.18 3.55 3.37 3.99 3.65 3.82
C.D. (P=0.05) 0.03 0.033 0.032 0.057 0.051 0.054
Storage days (D)
0 days 3.11 3.67 3.39 3.92 3.55 3.74
3 days 3.28 3.83 3.56 3.83 3.66 3.75
6 days 3.42 3.62 3.52 4.07 3.80 3.94
9 days 3.13 3.38 3.26 4.08 3.66 3.87
12 days 2.91 3.05 2.98 3.61 3.53 3.57
C.D. (P=0.05) 0.047 0.052 0.050 0.090 0.081 0.086
Chemical (T)
Ca(NO3)2 0.5% 3.18 3.49 3.34 3.99 3.64 3.82
Ca(NO3)2 1.0% 3.2 3.53 3.37 4.05 3.66 3.86
CaCl2 1.0% 3.21 3.58 3.40 4.05 3.67 3.86
CaCl2 2.0% 3.18 3.53 3.36 4.02 3.65 3.84
CaSO4 0.5% 3.17 3.5 3.34 4.00 3.64 3.82
CaSO4 1.0% 3.17 3.5 3.34 3.97 3.63 3.80
Control 3.08 3.44 3.26 3.25 3.59 3.42
C.D. (P=0.05) 0.055 0.062 0.059 0.106 0.096 0.101
Ta ble 2: Ef fect of post har vest treat ments on the pec tin (%) and fruit tex ture in guava cv. Sardar.
Treatments Pectin (%) Texture
2007 2008 Pooled 2007 2008 Pooled
Packing (W)
Unwrapping 1.20 1.22 1.21 7.44 7.46 7.45
Wrapping 1.22 1.23 1.22 7.80 7.94 7.87
C.D. (p=0.05) 0.013 0.012 0.013 0 .107 0.076 0.076
Storage days (D)
0 days 1.31 1.32 1.31 8.41 8.44 8.43
3 days 1.27 1.29 1.28 8.09 8.21 8.15
6 days 1.23 1.24 1.24 7.67 7.65 7.66
9 days 1.15 1.18 1.17 7.14 7.59 7.37
12days 1.09 1.09 1.09 6.76 6.75 6.76
C.D. (P=0.05) 0.020 0.019 0.020 0.170 0.121 0.146
Chemical (T)
Ca(NO3)2 0.5% 1.23 1.24 1.23 7.71 7.58 7.64
Ca(NO3)2 1.0% 1.23 1.25 1.24 7.87 8.18 8.02
CaCl2 1.0% 1.25 1.27 1.26 8.18 8.26 8.22
CaCl2 2.0% 1.21 1.23 1.22 7.80 7.65 7.72
CaSO4 0.5% 1.20 1.23 1.21 7.39 7.62 7.51
CaSO4 1.0% 1.19 1.19 1.19 7.28 7.46 7.37
Control 1.19 1.17 1.18 7.10 7.14 7.12
C.D. (P=0.05) 0.024 0.022 0.023 0.201 0.143 0.172

con tent was sig nif i cantly af fected by dif fer entchem i cals dur ing both the years. Max i mum pec tincon tent was found in cal cium chlo ride 1% andmin i mum pec tin con tent was found with con troldur ing both the years. A sig nif i cant de crease inpec tin con tent was ob served with the ad vance mentof stor age pe riod dur ing both the years. Max i mumpec tin per cent age was ob served in cal cium chlo ride (1%) fol lowed by cal cium ni trate (1%). Fruitfirm ness is closely re lated with the pec tin con tentof the fruit. Pec tin con tent of the guava fruitde creased pro gres sively dur ing stor age. There duc tion in pec tin con tent dur ing stor age might bedue to deg ra da tion of in sol u ble protopectin by theen zymes. These find ing are in line with find ings ofBhattacharya and Ghosh (1) in ba nana and Seipp(9) in ap ple fruits. Cal cium chlo ride (1%) main tainthe fruit firm ness by re tard ing break down of pec tindur ing stor age, hence the level was higher un derthese treat ments. Higher re ten tion of pec tinfol low ing cal cium chlo ride (1%) treat ment hasbeen re ported by Singh (10) in guava fruits. Low est pec tin con tent was found in wrapped fruits kept inpa per boxes dur ing both the years in stor age. Itmight be due to the soft ness oc cur ring in fresh fruits af ter ma tu rity at the peak of rip en ing which isgen er ally as so ci ated with fairly nar row ing down offirm ness. Pec tin methyl esterase (PME) en zymeac tiv ity in creased as rip en ing ad vanced in guava.These find ings are in ac cor dance with the re sults ofChaitanya (4) in guava. Data pre sented in Ta ble 2showed that pack ag ing ma te rial, stor age pe riod,chem i cals and their in ter ac tion had sig nif i cantef fect on the tex ture of fruits dur ing both the years.Min i mum tex ture change was ob tained in wrappedfruits dur ing both the years. With re spect of stor agepe ri ods, min i mum tex ture change was ob served atday of har vest and max i mum tex ture change wasob tained at 12th day of stor age. Dif fer ent chem i calshad sig nif i cant ef fect on fruit tex ture. Low esttex ture change was found in cal cium chlo ride 1%dur ing both the years. Min i mum tex ture changedur ing stor age was found with wrapped fruits keptin pa per box in both the years. The re duc tion inmois ture in fruits caus ing shrink age, dull ness inskin and loss of tur gid ity ob served in con trol fruits.On the other hand wrapped fruits kept in pa per box
main tained tur gid ity, gloss i ness and smooth skin offruits. These re sults are in cor rob o ra tion with theDhoot et al. (6) in guava.
REFERANCES
1. Bhattacharya, G.C. and Ghosh, J.J. (1972).Rel a tive changes in vi ta min C and proto pec tincon tent of ba nana at dif fer ent stages of ma tu rityand stor age con di tions. Sci . and Cul t., 38:216-218.
2. Biale, J.B. (1960). The post har vestbio chem is try of trop i cal and sub-trop i cal fruits.Ad v. Food Re s., 10: 293.
3. Chahal, T.S. and Bal, J.S. (2012). Effect of prehonest treatments of calcium salts on harvestmaturity in Kinnow mandarin. HortFlora Res.Spect. 1(2): 153-157.
4. Chaitanya, C.G. (1984). Ef fect of fo liar spraysof zinc and bo ron on yield and post har vestqual ity of guava fruits (Psidium guajava L.) cv.Lucknow-49 (Sardar). The sis, MSc. Ag. (Hor ti -cul ture), G.B. Pant Uni ver sity of Ag ri cul tureand Tech nol ogy, Pantnagar, 107p.
5. Chundawat, B.S., Singh, J.P., Kainsa, R.L. andGupta, O.P. (1976). Ef fect of pack ing andstor age pe riod on the qual ity of fruits. HaryanaJ. Hor ti c. Sci ., 5 (3&4): 130-136.
6. Dhoot, L.R., Desai, U.T. and Rane, D.A. (1984). Stud ies on the shelf-life of guava fruits withpoly thene pack ag ing and chem i cal treat ments.J. Maharashtra Ag ri c. Uni v., 9(2): 185-188.
7. Hiwale, S.S. and Singh, S.P. (2003). Pro long ingthe shelf life of guava (Psidium guajava L.).In dian J. Hor t ., 60(1): 1-9.
8. Ranganna, S. (1991). Hand book of Anal y sis and Qual ity Con trol for Fruits and Veg e ta bleProd ucts. 3rd ed. Tata McGraw Hill Pub lish ingCo. Ltd., New Delhi, pp.1-24.
9. Seipp, D. (1978). Pec tin de com po si tion in earlyand late rip en ing ap ple cultivars. Gartenbauwissenchaft, 43: 222-230.
10. Singh, K. (1980). Ef fect of var i ous chem i cals aspre and post har vest ap pli ca tion on shelf life ofguava at var i ous tem per a tures. Ph.D. The sis,Chaudhary Charan Singh Haryana Ag ri cul tureUni ver sity Hisar, Haryana, In dia, 184 p.
11. Singh, S., Brahmachari, V.S. and Jha, K.K.(1998). Effect of calcium and polythenewrapping on storage life of mango. Indian J.Hort., 55(3): 218-222.
Effect of post harvest calcium treatments on shelf life of guava 347
EF FECT OF NI TRO GEN AND PHOS PHO RUS WITH NI TRO GEN
SOURCES ON VEG E TA TIVE AT TRIB UTES OF TUBEROSE
A.P.S. Gangwar, J.P. Singh, V.K. Umrao¹ and I.P. Singh
De part ment of Hor ti cul ture, C.S.Azad Uni ver sity of Ag ri cul ture & Tech nol ogy, Kanpur-2
¹Pres ent ad dress: Ch. Shivnath Singh Shandilya (P.G.) Col lege, Machhra, Meerut
E-mail: [email protected]
AB STRACT: An ex per i ment was laid out dur ing two con sec u tive years in Hor ti cul ture gar den of C. S. Azad Uni ver sity of Agri. and Tech., Kanpur. There were three ni tro gen sources viz. Urea,Am mo nium Sul phate, Cal cium Am mo nium Ni trate; four lev els of each of ni tro gen (0, 50,100 and150kg/ha) and phos pho rus (0,100,200 and 300 kg/ha), with a total of forty treat ments. There sults showed that there were no sig nif i cant dif fer ences ob served due to ni tro gen sources inre spect of sprout ing of bulbs. In creas ing doses of phos pho rus caused rel a tively early sprout ingdur ing both the years of study. Phos pho rus ap plied @ 200kg/ha ex pressed tall est plant dur ingboth the years of study. Num ber of leaves per plant im proved un der am mo nium sul phatefol lowed by cal cium am mo nium ni trate. Phos pho rus @ 200kg/ha pro duced max i mum num ber ofleaves dur ing both years. Ap pli ca tion of 150kg N/ha or 200 kg phos pho rus ex pressed high est
leaf area fol lowed by 100 kg N/ha.
Keywords: Tuberose, ni tro gen, phos pho rus, leaf size, leaf area.
Tuberose (Polianthes tuberosa Linn.), a na tive of Maxico, be longs to the fam ily Amaryllidaceae. It is cul ti vated on large scale in France, It aly, SouthAf rica, and North Carolina, U.S.A. and manytrop i cal and sub-trop i cal ar eas in clud ing In dia. Thechief cen ters of its pro duc tion in In dia are Maharashtra, West Ben gal, Tamil Nadu and Karnataka. It is, how ever, well adopted to NorthIn dian cli ma tic con di tions yet its grow well in Uttar Pradesh. The tuberose oc cu pies very se lec tive andspe cial po si tion among the or na men tal bul bousplants to flower lov ing peo ple be cause of itspret ti ness el e gance and pleas antly sweet fra grance.It has great eco nomic po ten tial for cut flower trade
and es sen tial oil in dus tries.
MA TE RI ALS AND METH ODS
The pres ent in ves ti ga tions en ti tled “Ef fect ofni trog e nous and phos pho rus fer til iz ers withni tro gen sources on veg e ta tive at trib utes oftuberose (Polianthes tuberosa Linn.)” werecon ducted un der the eco-edaphic con di tionspre vail ing at Hor ti cul ture Gar den of ChandraShekhar Azad Uni ver sity of Ag ri cul ture andTech nol ogy, Kanpur (U.P.), In dia dur ing the two
consicutive years-1998-99 and 1999-2000.Uni form and healthy bulbs of tuberose cv. Dou blehav ing 2.5-3.0 cm di am e ter were pro cured fromN.B.R.I. Lucknow. In or der to as sess to ex actna ture and com po si tion of soil, sam ples up to 20 cm depth were col lected and an a lyzed in theDe part ment of Ag ri cul ture Chem is try and SoilSci ence for physio-chem i cal com po nents. Theex per i men tal field was given a preplantingir ri ga tion and at the proper field con di tions, it waspre pared by giv ing two cross-ploughings. Theclods crushed with the help of disc har row and soilwas fi nally lev elled and brought to a good tilth with re mov ing the stubbles, weeds etc. The re quireddose of Ni tro gen 50,100,150 kg/ha, and phos pho rus 100,200,300 kg/ha as per treat ments were ap plied.K2O @ 200 kg/ha and F.Y.M @ 40 tonnes/ha wereap plied as rec om men da tion. The sources ofni tro gen were Urea, Am mo nium Sul phate andCal cium Am mo nium Ni trate. Phos pho rus andpot ash were ap plied in form of sin glesuperphosphate and muriate of pot ash, re spec tively. Full dose of phos pho rus and pot ash with half doseof ni tro gen were ap plied as basal dress ing andre main ing half dose of N was ap plied as split dosesat 60 and 90 days af ter plant ing. All the
HortFlora Research Spectrum, 1(4): 348-353 (2012) ISSN : 2250-2823
Received : 26.8.2012 Accepted : 21.9.2012
rec om mended cul tural and plant pro tec tionmea sures were ap plied. The ex per i ments were laidout by fol low ing Fac to rial Ran dom ized BlockDe sign in both con sec u tive years of ex per i men ta -tion with three rep li ca tions. Thus, 120 plots(1.0x1.0m size) were used for 40 treat mentcom bi na tions. Ex per i ments were an a lyzed throughcom puter as sug gested by Panse and Sukhatme (7).Days to sprout ing was ob served by keep ing acon stant watch in dif fer ent treat ments dur ing boththe years of ex per i men ta tion and in dicted in thenum ber of days. Plant height was mea sured withhelp of me ter scale and num ber of leaves wascounted in sam pled plants. Leaf area (cm2) wasmea sured by tak ing length and width of lon gest leaf from the base and mul ti ply ing by ad just ment fac tor0.62 as sug gested by Barbieri et al. (1).
RE SULTS AND DIS CUS SION
Ef fect on days to sprout ing of tuberose bulbs
Sprout ing of tuberose bulbs as in flu enced by
dif fer ent fac tors viz. N sources, and level of N and
P was ob served af ter plant ing of bulbs dur ing both
the years of study. The mean val ues pre sented in
Ta ble 1 clearly re vealed that sources of N
fer til iza tion failed to ex ert sig nif i cant vari a tion on
the days re quired for sprout ing of tuberose bulbs
un der both years tri als. Ap pli ca tion of 150kg N/ha
has tened the sprout ing of bulbs sig nif i cantly dur ing
first year but in the sec ond year it was
non-sig nif i cant re quir ing 9.16 and 9.50 days
re spec tively against 9.95 and 9.88 days un der
con trol. Among the three doses of N, 50kg
treat ment de layed the sprout ing (10.47 and 9.77
days) mark edly dur ing both years.
In creas ing dose of P en hanced in ear liersprout ing of bulbs dur ing both the years.Phos pho rus ap pli ca tion @ 300kg/ha took min i mum pe riod i.e. 9.66 and 9.37 days against max i mumnoted un der its con trol (10.67 and 10.14 days). AllP lev els caused sig nif i cantly ear lier sprout ing when com pared with con trol bar ring 100kg dose dur ingthe sec ond year of in ves ti ga tion.
In ter ac tion be tween phos pho rous and sourceof ni tro gen was found non sig nif i cant, onlynu mer i cal vari a tions on the sprout ing of tuberosebulbs were seen. Ap pli ca tion of 300 kg/hain ter act ing with CAN caused con sid er ably ear li est(9.63 and 9.30 days) sprout ing when com paredwith P0S1 (urea with out P) which took max i mumdu ra tion (11.0 and 10.37 days) in this re gard dur ingboth the years of study. The min i mum 9.50 and 9.34 days re quired for sprout ing for P3N3 againstmax i mum pe riod re quired by P0N1 (11.20 and10.42 days).The in ter ac tion of S × N did not af fectthis pa ram e ter sig nif i cantly. How ever, sprout ingwas has tened by S3N3 (9.30 and 9.41 days)nu mer i cally dur ing both the years of studycon firm ing to the re ports of Mukhopadhyay et al.(5). Other in ter ac tion ef fect i.e. P×S and P× N werealso found non-sig nif i cant dur ing both years ofin ves ti ga tion. The in ter ac tion among P×S×N didnot bring sig nif i cant dif fer ence in this re gard.Treated plants showed early sprout ing whencom pared with con trol in the first year but the trendwas con tra dic tory dur ing sec ond year of study.
Ef fect on height of tuberose plant
It is ev i dent from mean val ues (Ta ble 2) thatap pli ca tion of am mo nium sul phate, re main ing atpar with cal cium am mo nium ni trate, proved moreef fec tive in in creas ing the plant height than ureadur ing both years. In this way urea provedrel a tively less ef fec tive for in creas ing height ofplant. Ammonoum sul phate pro duced 46.39 and48.25 cm tall plants fol lowed by CAN (45.92 and47.79 cm) and urea (45.1 and 45.79 cm).
Among the dose of ni tro gen nu tri tion, thehigh est one i.e. 150 kg ex celled the rest of dosecaus ing 47.14 and 48.82 cm height fol lowed by 100 kg (45.96 and 47.19 cm) and 50 kg (44.31 and45.81) dur ing cor re spond ing years of study.Ap pli ca tion of phos pho rus also caused sig nif i cantal ter ations and P2 (200kg/ha) proved sig nif i cantlymore su pe rior than rest of dose bar ring 100 kg and300 kg/ha (P1 and P3) dur ing sec ond year of study.The plants un der P con trols re mained dwarf un der
Effect of nitrogen and phosphorus with nitrogen sources on vegetative attributes of tuberose 349

350 Gangwar et al.
Table 1: Effect of nitrogenous and phosphorus fertilizers on the days to sprouting of bulb in tuberose cv. ‘Double’.1998-1999
P P S´ P N´ Treated vs. control MeanS 1 S 2 S 3 N1 N2 N3 Treated Control (N0)
P0 11.00 10.49 10.52 11.20 10.86 9.96 10.67 10.66 10.67P1 10.18 9.96 10.19 10.43 10.31 9.60 10.11 10.10 10.11P2 9.93 9.84 9.85 10.18 10.06 9.38 9.87 9.80 9.87P3 9.77 9.78 9.63 10.06 9.54 9.50 9.70 9.24 9.66
Mean 10.20 10.02 10.05 10.47 10.19 9.16 10.09 9.95N1 10.22 10.25 10.71N2 10.29 10.14 10.14N3 10.10 9.44 9.30 S N P P ´ S P ´ N S ´ N T vs Cont.
S ´ N C.D. (P=0.05) NS 0.46 0.53 NS NS NS NS
1999-2000
P P S´ P N´ Treated vs. control MeanS 1 S 2 S 3 N1 N2 N3 Treated Control (N0)
P0 10.37 10.20 9.81 10.42 10.26 9.69 10.13 10.32 10.14P1 9.36 9.70 9.90 9.77 9.67 9.52 9.65 10.30 9.72P2 9.30 9.56 9.60 9.53 9.50 9.43 9.49 9.60 9.50P3 9.34 9.50 9.30 9.36 9.44 9.34 9.38 9.32 9.37
Mean 9.59 9.74 9.65 9.77 9.22 9.50 9.66 9.88N1 9.59 10.98 9.65N2 9.58 9.67 9.91N3 9.61 9.48 9.41 S N P P ´ S P ´ N S ´ N T vs Cont.
S ´ N C.D. (P=0.05) NS NS 0.43 NS NS NS NS
Table 2: Effect of nitrogenous and phosphorus fertilizers on the plant height (cm) in tuberose cv. ‘Double’.1998-1999
P P S´ P N´ Treated vs. control MeanS 1 S 2 S 3 N1 N2 N3 Treated Control (N0)
P0 43.23 45.06 44.48 42.59 44.46 45.71 44.25 37.83 43.6P1 45.08 46.70 45.90 44.40 46.17 47.12 45.90 42.26 45.5P2 46.91 48.35 47.48 46.16 47.76 48.83 47.58 43.71 47.1P3 45.17 45.33 45.84 44.09 45.46 46.90 45.48 43.28 45.2
Mean 45.10 46.39 45.92 44.31 45.96 47.14 45.00 41.77N1 43.29 44.97 44.66N2 45.24 46.45 46.19N3 46.76 47.74 46.92 S N P P ´ S P ´ N S ´ N T vs Cont.
S ´ N C.D. (P=0.05) 0.97 0.97 1.12 NS NS NS 1.26
1999-2000
P P S´ P N´ Treated vs. control MeanS 1 S 2 S 3 N1 N2 N3 Treated Control (N0)
P0 44.99 47.05 46.21 44.43 46.43 47.39 46.08 39.21 45.4P1 45.78 48.59 47.85 46.12 47.29 48.80 47.40 43.70 47.0P2 46.42 49.57 49.50 46.80 48.21 50.47 48.49 44.19 48.0P3 45.98 47.79 47.59 45.90 46.84 48.63 47.12 46.80 47.0
Mean 45.79 48.25 47.79 45.81 47.19 48.82 47.28 43.48N1 44.42 46.71 46.32N2 45.42 48.17 47.96N3 47.51 49.87 49.09 S N P P ´ S P ´ N S ´ N T vs Cont.
S ´ N C.D. (P=0.05) 1.40 1.40 1.62 NS NS NS 1.81
Effect of nitrogen and phosphorus with nitrogen sources on vegetative attributes of tuberose 351
Table 3: Effect of nitrogenous and phosphorus fertilizers on the number of leaves per plant in tuberose cv. ‘Double’.1998-1999
P P S´ P N´ Treated vs. control MeanS 1 S 2 S 3 N1 N2 N3 Treated Control (N0)
P0 36.96 39.58 38.08 35.71 38.50 40.42 38.21 27.68 37.19P1 38.66 41.36 40.73 38.48 40.51 41.76 40.25 35.24 39.71P2 39.94 41.79 41.07 39.74 40.89 42.18 40.94 37.50 40.50P3 39.44 41.29 40.67 39.33 40.69 41.18 40.46 36.33 40.0
Mean 38.75 41.00 40.14 38.36 40.15 41.39 39.96 34.18N1 37.39 39.36 38.33N2 38.74 41.15 40.56N3 40.13 42.50 41.53 S N P P ´ S P ´ N S ´ N T vs Cont.
S ´ N C.D. (P=0.05) 1.23 1.23 1.42 NS NS NS 1.59
1999-2000
P P S´ P N´ Treated vs. control MeanS 1 S 2 S 3 N1 N2 N3 Treated Control (N0)
P0 38.45 39.46 39.01 36.02 38.94 41.97 38.98 39.33 38.0P1 40.17 42.44 41.22 38.68 41.28 43.87 41.28 36.66 40.8P2 41.29 42.60 42.10 40.63 41.96 43.40 42.00 38.93 41.69P3 40.60 41.80 40.66 39.94 40.84 42.27 41.03 38.13 40.73
Mean 40.13 41.58 40.75 38.82 40.76 42.88 40.82 35.76N1 38.05 39.55 38.91N2 40.44 41.39 40.44N3 41.94 43.79 42.90 S N P P ´ S P ´ N S ´ N T vs Cont.
S ´ N C.D. (P=0.05) 0.97 0.97 1.13 NS NS NS 1.26
Table 4: Effect of nitrogenous and phosphorus fertilizers on the leaf area (cm2) in tuberose cv. ‘Double’. 1998-1999
P P S´ P N´ Treated vs. control MeanS 1 S 2 S 3 N1 N2 N3 Treated Control (N0)
P0 46.24 48.00 48.81 44.50 47.83 51.63 47.98 36.12 46.80P1 48.44 50.72 50.85 47.20 49.67 53.14 50.00 42.53 49.26P2 50.28 52.88 52.60 49.34 51.90 54.51 51.92 46.42 51.37P3 50.90 52.44 52.11 48.92 52.14 54.38 51.81 45.32 51.16
Mean 48.96 51.23 51.09 47.49 50.38 53.42 50.43 42.59N1 46.32 47.78 48.37N2 49.01 51.06 51.08N3 51.56 54.86 53.83 S N P P ´ S P ´ N S ´ N T vs Cont.
S ´ N C.D. (P=0.05) 0.96 0.96 1.10 NS NS NS 1.24
1999-2000
P P S´ P N´ Treated vs. control MeanS 1 S 2 S 3 N1 N2 N3 Treated Control (N0)
P0 47.02 50.04 49.30 45.66 49.11 51.60 48.79 38.24 47.73P1 49.36 52.42 52.54 48.15 51.75 54.41 51.44 42.24 50.62P2 51.67 54.65 53.71 50.67 53.71 55.64 53.34 47.11 52.72P3 51.98 53.61 52.76 50.24 52.84 55.26 52.78 44.27 51/93
Mean 50.01 52.68 52.08 48.68 51.85 54.23 51.59 43.21N1 47.32 40.77 48.95N2 50.39 52.61 52.55N3 52.31 55.65 54.73 S N P P ´ S P ´ N S ´ N T vs Cont.
S ´ N C.D. (P=0.05) 0.99 0.99 1.14 NS NS NS 1.28

352 Gangwar et al.
both years con di tions. The re sults are in con for mity with El-Khateep et al. (2) and Nair et al. (6).
The first or der in ter ac tion i.e. P × S, P × N andS × N re main ing non sig nif i cant dur ing both yearsof study in creased the height of tuberose plantsnu mer i cally un der P2S2 (48.35, 49.57 cm), P2 N3
(48.83, 50.47 cm) and S2 N3 (47.74, 49.87 cm),re spec tively. Among the sec ond or der in ter ac tionsP2S2N3 max i mized the height of tuberose plants butthe dif fer ences re mained non sig nif i cant dur ingboth the years of study. Treated vs. con trol plantsshowed sig nif i cant vari a tions on the height oftuberose plants dur ing both the years of study andtreated ones at tained the height of 45.00 and 47.28cm, whereas, the con trol plants ex pressed 41.77and 43.48 cm height.
Ef fect on num ber of leaves per plant
Am mo nium sul phate proved sig nif i cantlysu pe rior (Ta ble 3) than other ni tro gen sources i.e.urea and CAN dur ing both the years ofin ves ti ga tion (41.0 and 41.58 leaves dur ing firstand sec ond year, re spec tively) bar ring CAN dur ingsec ond year of in ves ti ga tion where it was ob servedto be sta tis ti cally at par with am mo nium sul phate.How ever, urea ob served to be less ef fec tivere gard ing 38.75 and 40.13 leaves per plant. Ap pli ca tion of 150 kg/ha proved more ef fec tive(41.39 and 42.88 leaves) and pro ducedsig nif i cantly greater num ber of leaves fol lowed by100 kg and 50 kg/ha (40.15, 38.36 and 40.76, 38.82 leaves, re spec tively).
In ter ac tions be tween P×S, P×N and S×Nim proved the num ber of leaves per plantnu mer i cally dur ing both the years of trial re cord ing41.79, 42.60, 42.18, 43.40 and 42.50, 43.79 leavesper plant un der P2 S2 , P2N3 and S2 N3 treat mentsdur ing first and sec ond year of in ves ti ga tion,re spec tively. The sec ond or der in ter ac tion failed toex ert sig nif i cant in flu ence on the leaf count dur ingboth years. The com par i son of treated plants withcon trol re vealed sig nif i cant vari a tion in in creas ingthe num ber of leaves per plant in the for mer (39.96and 40.82) dur ing both the years.
Ef fect on the leaf area
In creas ing dose of ni tro gen in ducedsig nif i cantly greater leaf area (Ta ble 4).Ap pli ca tion of 150 kg N/ha ex pressed 53.42 and54.23 cm2 leaf area fol lowed by 100 kg N/hare veal ing 50.38 and 51.85 cm2 area un der both theyear of study, re spec tively. Ap pli ca tion ofphos pho rus through super phos phate @200 kg/hain duced sig nif i cantly high est leaf area com paredwith its con trol as well as 100 kg dose dur ing boththe years. Ap pli ca tion of 200 kg/ha when com pared with 300 kg/ha level showed sta tis ti cally sim i larleaf area un der both the year’s tri als. The high estval ues were how ever, re corded to be 51.37 and52.72 cm2 un der 200 kg/ha dose against the low est46.80 cm2 and 47.73 cm2 noted un der con trol.
The in ter ac tive ef fect of P ×S, P×N and S×Nre main ing non sig nif i cant im proved the leaf areafur ther ex press ing max i mum val ues un der P2 S2
(52.88, 54.65 cm2), P2 N3 (54.51, 55.64 cm2) and S2
N3 (54.86, 55.65 cm2) dur ing the cor re spond ingyears of study. The sec ond or der in ter ac tions didnot bring sig nif i cant vari a tions in this re gard dur ing both the years of ex per i men ta tion. Treated plantswhen com pared with con trol re vealed sig nif i cantin crease in leaf area in tuberose ex press ing 50.43,51.59 and 42.59,43.21 cm2 val ues dur ing first andsec ond year of in ves ti ga tion, re spec tively. Thepres ent find ings are in agree ment with the re portsof Fernadez et al. (3) and EI-Khateep et al. (2) inglad i o lus Mukhopadhyay et al. (5) and Nair et al.(6) in tuberose and Sang (9) in dahlia who notedsig nif i cant im prove ment in the growth pa ram e tersof bul bous ornamentals. But Hober (4) and Preeti-Hatibarua et al. (8) found cal cium am mo niumni trate to be more ef fec tive in chry san the mum andglad i o lus, re spec tively.
REF ER ENCES
1. Barbieri, G., Pascale, S.D., Andria, R.D., Mori,
M. and Pascale, S. (1994). Es ti mat ing glad i o lus
leaf area by lin ear mea sure ments. Adv. in Hort.
Sci., 8(2):85-90.

2. El-Khateep, M.A., El-Leithy, A.S. and Badawy,
E.M. (1991). Ef fect of ni tro gen and po tas sium
fer til iza tion on growth, flow er ing and chem i cal
com po si tion of Free sia hy brid cv. Aurosia. Bull.
Fac ulty Agric. Univ., Cario, 42(4):131-1342.
3. Fernadez, P.D., Haag, H.P. and Oliviera, G.D.
(1974). Min er als nu tri tion of ornamentals
plants va ri et ies. Stud ies on fer til iza tion with
ni tro gen on glad i o lus cv. Peru. Anais da Escola
su pe rior de Ag ri cul ture Luiz de Queiroz,
31:621-634.
4. Hober, Z. (1970). Ab sorp tion of ni tro gen,
phos pho rus and po tas sium by chry san the mum
cv.Picardy un der dif fer ent soil mois ture
con di tion. Bivl. Inst.Hodowli Akalimate rose,
No. 3-4:107-113.
5. Mukhopadhyay, A., Sujatha, K. and Singh, K.P.
(1986). In flu ence of dif fer ent sources of
ni tro gen on growth and flow er ing of tuberose
cv. ‘Sin gle’. South In dian Hort., 34(6):435-436.
6. Nair, S.A., Attri, B.L. and Sharma, T.V.R.S.
(2000). Ef fect of N and P on growth and
flow er ing of tuberose. J. Trop i cal Agri., 38
(1/2): 66-68.
7. Panse, V.G. and Sukhatme P.V. (1978).
Sta tis ti cal Method for Ag ri cul tural Work ers.
ICAR, New Delhi pp. 156-165
8. Preeti-Hatibarua, Misra, R.L. and Hatibarua, P.
(1999). Ef fect of ni tro gen sources on veg e ta tive
and flo ral char ac ters of glad i o lus cv.
Dhanvantari. J. Orna. Hort. New Se ries,
2(2):111-114.
9. Sang, C.G. (1974). Studies on effect of nitrogen
forms on plant growth, flowering on tuberous
root formation in cutting of Dahlia. J. Koream
Soc. Hort. Sci., 15(2):178-186.
Effect of nitrogen and phosphorus with nitrogen sources on vegetative attributes of tuberose 353

COR RE LA TION CO EF FI CIENT STUD IES IN ASHWAGANDHA (Withania
somnifera Dunal) cv. JAWAHAR-20
Vijai Kumar, Naresh Kumar and M.C. Singh¹
Ch. Shivnath Singh Shandilya P.G. Col lege, Machhra, Meerut-250 106 U.P.
¹Di vi sion of Flori cul ture & Land scap ing, IARI, Pusa Cam pus, New Delhi
Email:[email protected]
ABSTARCT: In an ex per i ment con ducted on ashwagandha (Withania somnifera Dunal), tostudy the re sponse of dif fer ent or ganic amend ments with or ganic ma nure (FYM) andbio-fer til iz ers in re la tion to plant growth, root yield and qual ity pa ram e ters. It was found that theseed lings (5-7 leaf stage) in oc u lated with Azospirillum @ 105 or 106 CFU re sulted a sig nif i cantin crease in plant growth and bio mass yield which ex hib ited a pos i tive as so ci a tion among them incon trib ut ing the root yield and qual ity traits. The max i mum and pos i tive cor re la tion (0.884) wasob served be tween the to tal al ka loid and withanaloid con tent fol lowed by fresh root weight perplant (g) and fresh root yield per ha (0.831) and be tween plant height and num ber of leaves perplant (0.777). The as so ci a tion of the plant height also ex hib ited a highly sig nif i cant cor re la tionwith stem di am e ter (0.659), al ka loid (0.777) and withanaloid (0.668) con tent in the roots. Thenum ber of leaves per plant had highly sig nif i cant and pos i tive cor re la tion (1.99) with plant can opy fol lowed by al ka loid (0.755) and withanaloid (0.774) con tents. The fresh root weight per plantex erted the pos i tive and sig nif i cant ef fect of high mag ni tude (0.831) and fresh root yield (kg) perplot. Dry root weight per plant could es tab lished a sig nif i cant and pos i tive as so ci a tion (0.514)with dry root yield (kg) per ha. The to tal al ka loid con tent in the roots wit nessed a highly sig nif i cant and pos i tive cor re la tion with plant height (0.777), num ber of leaves per plant (0.755) fol lowed by pos i tive and sig nif i cant as so ci a tion with stem di am e ter (0.573), num ber of ber ries per plant(0.554) and fresh root yield (kg) per plot (0.485). Withanaloid con tent (%) wit nessed a highlysig nif i cant and pos i tive cor re la tion with plant height (0.668), num ber of leaves per plant (0.754)and al ka loid con tent (0.884). Whereas a sig nif i cant and pos i tive cor re la tion ex hib ited with stemdi am e ter (0.581).
Keywords: Withania, cor re la tion, root yield, al ka loid and withanaloid.
Ashwagandha is a pe ren nial shrub and growsnat u rally un der sub trop i cal dry cli mate in welldrained, sandy loam or light red soils hav ing ph of7.5 to 8.0 with an av er age rain fall of 600-750 mm.It is been grown on large scale in dry part of thecoun try as a me dic i nal plant, es pe cially on mar ginal lands in sev eral dis tricts of Madhya Pradesh,cov er ing an area of more than 4000 hect ares(Nigam, 4) and its cul ti va tion has ex tended inre cent years, to Kota in Rajasthan, foot-hills ofPunjab and Himachal Pradesh and Tarai re gions ofUttarakhand and Uttar Pradesh. Com mer cialcul ti va tion, be ing on pri or ity for high re turns needsa sus tained and ag ro nomic pack age for pro duc tionof eco nom i cally safe raw ma te rial forphar ma ceu ti cal in dus try on large scale. Ow ing tothe in creased de mand for or ganic and safe prod ucts
of ashwagandha roots, leaves and seeds used infor mu la tion of var i ous Ayurvedic and Unanimed i cines, there is pru dent need to cul ti vate thiscrop by safe ap pli ca tion of bio-or ganic nu tri tionfrom vermi-com post and FYM along with aben e fi cial free-liv ing soil bac te ria usu ally ap pliedas plant growth pro mot ing Rhizobacteria or PGPRin the for mu la tion as strains of Azospirillum, which lives in close as so ci a tion of plant roots and en hance plant growth by its abil ity to fix at mo sphericni tro gen, pro duc tion of indole ace tic acid,siderophore, ni trate and sin gle mol e cules re sult ingin an in creased min eral up take in the plant roots as
sug gested by Bashan and Holguin (1).
There fore, the de vel op ment of a re li able toolto es tab lish an as so ci a tion re sult ing through asym bi otic as so ci a tion as ben e fi cial bi o log i calmodel be tween them and de pend ent plant growth
HortFlora Research Spectrum, 1(4): 354-357 (2012) ISSN : 2250-2823
Received : 22.4.2012 Accepted : 08.8.2012

char ac ters on root and root qual ity traits in fu tureag ri cul tural pro duc tion as stud ied by Misra et al.(3). There fore, the pres ent ex per i ment wascon ducted to see and eval u ate a re sponse ofbio-or ganic nu tri tion through a ap pli ca tion ofFYM, Vermi-com post and Azospirillum inAshwagandha (Withania somnifera Dunal.) and anas so ci a tion of plant growth, seed, root yield andqual ity pa ram e ters was worked out to es tab lish are la tion ship as a re sponse and fea si bil ity of safe and bio-or ganic ap pli ca tion in cul ti va tion of this
me dic i nal plant for com merce.
MA TE RI ALS AND METH ODS
The present experiment was carried out at theexperimental fields of Ch. Shivnath SinghShandilya P.G. College, Machhra, Meerut (U.P)during the two consecutive years viz. 2005-06 and2006-07 on perennial crop of Ashwagandha(Withania somnifera) cv. Jawahar-20 under thefield conditions using of FYM (Farm YardManure), Vermi-compost and Azospirillum. Theexperiment was laid out in the factorial RBDreplicated thrice. Bio-organic nutrition was appliedto beds in experimental field in combinations,comprising of FYM, viz. 0 kg/plot (F0), 2 kg/plot(F1) or 3 kg/plot (F3) and Vermi-compost 0 kg/plot(V0), 2 kg/plot (V1) or 3 kg/plot (V2) andAzospirillum 0 CFU/plot (AZ0). The chemicalanalysis was done in the laboratory of Medicinaland Plants under Council of Scientific andIndustrial Research (CSIR), New Delhi. Theaverage data for I year, II year were pooled andanalyzed for ANOVA and interactions among thetreatments as per the methods suggested by Panseand Sukhatme (5). Further, genotypic association of all the yield contributing characters with root yieldand quality was worked out as path coefficient
analysis suggested by Dewey and Lu (2).
RE SULTS AND DIS CUS SION
The cor re la tions ex isted be tween the plantgrowth, root yield and qual ity com po nents (Ta ble1) were ana lysed to study the as so ci a tion amongthem re vealed that a strong as so ci a tion was
ex hib ited. The max i mum and pos i tive cor re la tion(0.884) was ob served be tween the to tal al ka loidand withanaloid con tent fol lowed by fresh rootweight per plant (g) and fresh root yield per ha(0.831) and be tween plant height and num ber ofleaves per plant (0.777). The as so ci a tion of theplant height also ex hib ited a highly sig nif i cantcor re la tion with stem di am e ter (0.659), al ka loid(0.777) and withanaloid (0.668) con tent in theroots. How ever, a sig nif i cant value of co ef fi cientswas also re corded with num ber of ber ries per plant(0.500) and fresh root yield (kg) per plot. The stemdi am e ter had sig nif i cant and pos i tive cor re la tionwith plant can opy (0.507), fresh root weight perplant (0.525), al ka loid (0.573) and withanaloid(0.581) con tent. The num ber of leaves per plant had highly sig nif i cant and pos i tive cor re la tion (1.99)with plant can opy fol lowed by al ka loid (0.755) andwithanaloid (0.774) con tents and sig nif i cantcor re la tion with num ber of ber ries per plant (0.549) and fresh root yield (0.593) per plot. The num ber of branches per plant wit nessed pos i tive andsig nif i cant cor re la tion with leaf area (0.511), dryroot per plant (0.486), dry weight per plant (0.479)and fresh (0.481) and dry root yield per kg/ha(0.513). Plant can opy ex hib ited pos i tive andsig nif i cant cor re la tion (0.542) with a sin glechar ac ter, namely fresh root weight per plant whereas the other co ef fi cients among them weremod er ate and of low mag ni tude. The in di vid ual leaf area ex hib ited a sig nif i cant and pos i tive cor re la tionwith fresh (0.530) and dry (0.492) weight of rootsper plant. Num ber of ber ries per plant wit nessedpos i tive and highly sig nif i cant (0.705) cor re la tionwith fresh root yield per kg per plot fol lowed by asig nif i cant and pos i tive as so ci a tion with al ka loid
con tent (0.554) in the roots.
The num ber of pri mary roots per plantex hib ited a sig nif i cant and pos i tive as so ci a tion(0.580) with sec ond ary root length per plant. Thefresh root weight per plant ex erted the pos i tive andsig nif i cant ef fect of high mag ni tude (0.831) andfresh root yield (kg) per plot. Dry root weight perplant could es tab lished a sig nif i cant and pos i tiveas so ci a tion (0.514) with dry root yield (kg) per ha.
Correlation coefficient studies in ashwagandha (Withania somnifera Dunal) 355

356 Kumar et al..st
ne mtaert rez ili tref oi
b tn ere ffi
d y
b dec
n eul f
ni sa ah
dnaga
whsa
ni stne
no p
moc yt ila
uq
dna
dleiy ,
htworg t
nalp e
ht gno
ma stnei ci ff eoc
noi ta le rroC :1 el
baT
.S
.o
N
23
45
67
89
01
11
21
31
41
51
61
71
81
91
02
12
1**
56.
0**777.0
74
3.0
62
1.0
22
1.0
*005.03
22.
0-1
11.
0-7
30.
09
70.
04
31.
04
82.
00
21.
0*654.0
35
0.0-
35
1.0
13
3.0
72
4.0
**777.0**866.0
2—
01
4.0
20
4.0
*705.07
43.
02
23.
08
71.
05
40.
0-0
11.
01
72.
07
62.
0*525.0
85
1.0
64
2.0
42
0.0
83
3.0
17
2.0
45
3.0
*3
75.
0*185.0
3—
70
0.0-
** 99.14
60.
0-*945.0
12
3.0-
82
0.0-
30
1.0-
24
1.0-
07
0.0
30
0.0-
38
0.0
*395.09
80.
0-1
71.
0-3
42.
01
32.
0**557.0
**457.0
4-
—4
22.
0*115.0
96
1.0
51
0.0-
21
1.0-
17
0.0
69
2.0`
95
1.0-
*684.0*974.0
60
0.0-
84
0.0-
*184.0*
31
5.0
14
2.0
52
2.0
55
1.0
5—
80
3.0
70
0.0-
97
1.0
06
2.0
68
1.0
51
3.0
23
1.0
*245.04
71.
03
81.
02
41.
02
64.
04
31.
0-5
01.
08
00.
0-8
90.
0
6-
—3
40.
05
71.
06
92.
04
53.
00
90.
0-8
22.
0*035.0
*294.03
51.
06
83.
02
72.
06
02.
08
30.
03
40.
02
80.
0
7-
—8
03.
0-6
40.
07
32.
05
81.
0-0
62.
04
30.
05
01.
0**507.0
73
1.0-
85
0.0-
23
3.0
39
1.0
*4
55.
09
04.
0
8-
—6
72.
07
13.
0-7
71.
08
80.
06
72.
01
90.
02
00.
07
14.
02
72.
07
50.
05
41.
0-3
11.
0-5
20.
0-
9-
—7
50.
07
00.
02
53.
04
23.
02
41.
00
02.
01
80.
06
11.
02
00.
05
10.
09
60.
08
20.
0
01
-—
93
0.0-
*0
85.
03
70.
04
52.
03
50.
04
00.
08
40.
08
30.
01
21.
01
70.
0-6
62.
0-
11
-—
27
2.0
21
2.0
47
1.0
28
2.0-
69
0.0-
70
3.0
55
4.0
44
1.0
54
0.0
91
0.0
21
—6
90.
08
81.
03
61.
05
02.
02
40.
09
23.
05
91.
02
02.
05
40.
0
31
-—
94
3.0
45
2.0
01
1.0
**138.07
71.
06
83.
04
61.
08
41.
0
41
-—
40
1.0
44
2.0
17
1.0
*4
15.
01
03.
0-8
00.
05
10.
0
51
-—
13
2.0
77
1.0
57
1.0
67
0.0
*5
84.
05
54.
0
61
—8
40.
00
61.
09
73.
0-6
52.
0-2
70.
0-
71
-—
15
1.0
34
4.0
97
0.0
31
0.0
81
-—
93
1.0
77
2.0
56
2.0
91
-—
81
4.0
92
2.0
02
-—
**488.0
)50.0 =
P ta tnacifingis ylhgih era **
yb dna tnacifingis era * yb detoned seulav eht( 936.0
=** dna 074.0 = * .1
.2 )mc( thgieh tnal
P.3 )
mc( re t em aid
metS
.4 tnalp/sevael fo re bmu
N tnalp/sehcnarb fo re b
muN
.5 mc(
yp onac tnalP
2 .6 )
mc( aera faeL
2 .7 )
.8 .tnalp/sei rreb fo re bmu
Nyrreb/sdees fo re b
muN
.9 .11 stoor
yra mirp fo re
bmu
N .01 )mc( htgnel toor nia
M .21 tnalp/toor
yr adn oces fo re bmu
N )
mc( htgnel toor yr adn oce
S .31
.41 )g( tnalp rep thgiew toor hser
F .51 tnalp/)g( thgie
w toor yr
D .61 tolp/)g
K( dleiy toor hser
Ftolp/)g
K( dleiy toor
yrD
.71 .81 ah/)g
K( dleiy toor hser
F .91 ah/)g
K( dleiy toor
yrD
oi tar thgiew toor
yrD
& hserF
.02)
%( tne tnoC dio la kl
A la toT
.12 tnetnoc diolanahti
W

The max i mum and pos i tive cor re la tion (0.884) wasob served be tween the to tal al ka loid andwithanaloid con tent fol lowed by fresh root weightper plant (g) and fresh root yield per ha (0.831) andbe tween plant height and num ber of leaves perplant (0.777). The as so ci a tion of the plant heightalso ex hib ited a highly sig nif i cant cor re la tion withstem di am e ter (0.659), al ka loid (0.777) andwithanaloid (0.668) con tent in the roots. Thenum ber of leaves per plant had highly sig nif i cantand pos i tive cor re la tion (1.99) with plant can opyfol lowed by al ka loid (0.755) and withanaloid(0.774) con tents. The fresh root weight per plantex erted the pos i tive and sig nif i cant ef fect of highmag ni tude (0.831) and fresh root yield (kg) perplot. Dry root weight per plant could es tab lished asig nif i cant and pos i tive as so ci a tion (0.514) withdry root yield (kg) per ha. The to tal al ka loid con tent in the roots wit nessed a highly sig nif i cant andpos i tive cor re la tion with plant height (0.777),num ber of leaves per plant (0.755) fol lowed by pos i tive and sig nif i cant as so ci a tion with stemdi am e ter (0.573), num ber of ber ries per plant(0.554) and fresh root yield (kg) per plot (0.485).Withanaloid con tent (%) wit nessed a highlysig nif i cant and pos i tive cor re la tion with plantheight (0.668), num ber of leaves per plant (0.754)and al ka loid con tent (0.884). Whereas a sig nif i cantand pos i tive cor re la tion ex hib ited with stemdi am e ter (0.581).These find ings are in close
con for mity with by Singh et al. (6).
The as so ci a tion be tween in de pend entchar ac ters in re spect to the fresh root yield, al ka loid and withanolid con tent co-ex isted in a sig nif i cantand pos i tive as so ci a tion ex cept with a few of thembut ex hib it ing a re la tion ship of a very lowmag ni tude. Num ber of seeds/berry, num ber ofpri mary roots and dry root yield per plot hadneg a tive cor re la tion (-0.025, -0.266 and -0.073re spec tively) with a very low mag ni tude amongthem. How ever the other neg a tive and pos i tivecor re la tions ob served and re corded be tweenvar i ous char ac ters were of very low mag ni tude
in di cated that an ap pli ca tion of bio-fer til iz ers vis avis an in creased dose has im proved the fresh rootyield and qual ity pa ram e ter in ashwagandha var.Jawhar-20 em ployed in the pres ent in ves ti ga tion.The dry root yield and chem i cals es ti matedwit nessed strong and pos i tive re la tion ship amongthem but a neg a tive with bio mass in fresh weight of plant and spread of the plant can opy with a lowermag ni tude. How ever, a pos i tive as so ci a tion withstrong and sig nif i cant mag ni tude was es tab lishedfor plant growth com po nents namely; stemdi am e ter (cm), leaf area (cm2) and main root lengthper plant. These find ings were in pace with those
re ported by Misra et al. (3).
REF ER ENCES
1. Bashan, Y. and Holguin, G. (1997). Azospirillum
plant re la tions en vi ron men tal and phys i o log i cal
ad vances (1990-1996). Can. J. Microbiol., 43:
103-121.
2. Dewey, D.R. and Lu (1959). A cor re la tion and
path co ef fi cient anal y sis of com po nents of
crested wheat grass seed pro duc tion. Agron. J.
51: 515-518.
3. Misra, H.O., Sharma, J.R., Lal, R.K. and
Sharma, S. (1998). Ge netic vari abil ity and path
anal y sis in asgandh (Withania somnifera). J.
Me di. and Ar o m. Plant Sci ., 20: 753-756.
4. Nigam, K.B., Rawat, G.B. and Prasad, Bhagwat
(1984). Ef fect of meth ods of sow ing, plant
den sity and fer til ity level on ashwagandha
(Withania somnifera Dunal). South In dian
Hor t ., 32(6): 356-359.
5. Panse, V.G. and Sukhatme, P.V. (1979).
Ge net ics and quan ti ta tive char ac ters in re la tions
to plant breed ing. In dian J. Ge net ., 17: 318-328.
6. Singh, A.K., Singh, H.P., Singh, S.P., Kalra, A.
(2008). Genetic variability and correlation
studies for selection criteria in Safed Musli
(Chlorophytum borivilianum, Santapau).
Communi. Biometry and Crop Sci., 3 (2):
67–71.
Correlation coefficient studies in ashwagandha (Withania somnifera Dunal) 357

IN TE GRATED RE SPONSE OF IN OR GANIC AND BIO-FER TIL IZ ERS ON
YIELD AND YIELD AT TRIB UTES OF TUR MERIC
Arun Pratap Singh, R.P. Singh, Jagdish Singh and S.K. Shahi
De part ment of Ag ri cul tural Chem is try and Soil Sci ence, Udai Pratap Au ton o mous Col lege,Varanasi, U.P.
E-mail: [email protected]
ABSTRACT: A field ex per i ment was con ducted to study the ef fect of in te gra tion of bio- andin or ganic fer til izers on yield and yield at trib utes of tur meric dur ing 2007-08 and 2008-09 at UdaiPratap Au ton o mous Col lege, Varanasi, U.P. The ex per i ment was laid out with thir teentreat ments con sisted of com bi na tion of two va ri ety of tur meric (V1 – Padrauna lo cal and V2 –NDH-18) rep li cated three times in a ran dom ized block de sign. The re sults in di cated thatap pli ca tion of T6 (NPK 180:90:90 kg per ha + Azotobactor chrococcum @ 2.5 kg per ha +Pseu do mo nas floriscence @ 2.5 kg per ha) sig nif i cantly in creased yield and all yield at trib utesover all treat ments, whereas treat ment T9 (50% R.D. of in or ganic ni tro gen + 50% R.D. ofin or ganic phos pho rus + 100% R.D. of pot ash + Azotobactor chrococcum @ 2.5 kg per ha +Pseu do mo nas floriscence @ 2.5 kg per ha + 50% ni tro gen through car pet waste) was closelyfol lowed by treat ment T6. In re spect of tur meric va ri ety , NDH-18 was found su pe rior over va ri etyPadrauna lo cal in all above con di tions. On the ba sis of per for mance treat ment T6 and T9 may beadopted for higher yield and sustainability.
Keywords : Tur meric, bio-fer til izer, in or ganic fer til izer, yield.
Tur meric (Curcuma longa L. Syn Curcumadomestica Val.) is a her ba ceous pe ren nial plantbe long ing to the fam ily Zingiberaceae. It is anan cient, most valu able, sa cred spice of In dia andcon tains ap pre cia ble quan ti ties of pro teins (6.3%),lipids (5.1%), car bo hy drates (69.4%) and fi bre(2.6%). Tur meric is rich in min er als likephos pho rus, cal cium, iron and vi ta min A. Tur mericis a hor ti cul tural root-crop that is im por tant notonly as a spice and cos metic, but also as a me dic i nal plant world wide (Hermann and Mar tin, 2; Osawa et al. 9; Nakamura et al. 8; Ishimine et al. 4; Hossainet al. 3). It is cul ti vated for its un der groundrhi zomes which is used as spice and con di ment, dye stuff and in drug and cos metic in dus try. It forms anim por tant adjuvant in In dian cu li nary as it tendscol our and ar o matic fla vour to var i ous dishes. It ismainly used as con di ment, in the prep a ra tion ofpick les and cur ries and as a colour ing agent intex tile, food and con fec tion ary in dus tries. Tur meric has lot of me dic i nal prop er ties, it has long beenused in In dia for the treat ment of sprains andin flam ma tory con di tions. The tur meric rhi zomecon tains a va ri ety of pig ments among which
‘curcumin’ is the ma jor pig ment re spon si ble forcol our and it var ies from 3.5 to 9.0 per cent indif fer ent va ri et ies. In dia is the larg est pro ducer,con sumer and ex porter of tumeric in the world. It isgrown in an area of 163 thou sand ha with anav er age pro duc tion of 552.3 thou sand tonnes(Kandiannan et al., 5). Con sid er ing the eco nomicim por tance of tur meric and en vi ron men talprob lems caused by chem i cals ap pli ca tion, it isim por tant to cul ti vate tur meric us ing or ganic andbio-fer til izers. Dif fer ent or ganic ma nures in flu encedif fer ently in terms of yield and qual ity of tur meric. Hence, it is nec es sary to know the best source ofor ganic ma nure which could help in in creas ing theyield and qual ity. In view of this back ground, thisstudy was aimed to eval u ate the ef fect of dif fer entbio-or ganic ma nures on tur meric yield.Biofertilizers like Azotobactor chrococcum andPseu do mo nas floriscence (PSB) ranks in up percat e gory. Azobobactor, a non sym bi otic N2 fix ingbac te ria, is ca pa ble to fix at mo spheric ni tro gen nonsym bi ot i cally, by which it can re place chem i calfer til izer at too much ex tent. While Pseu do mo nas is phos pho rus solublizing bac te ria, which solublizesex cess/un used phos pho rus in soil and pro vide the
HortFlora Research Spectrum, 1(4): 358-361 (2012) ISSN : 2250-2823
Received : 4.9.2012 Accepted : 25.9.2012

plant in sol u ble/avail able form. We know that ourplants use only 16-18% of ap plied phosphaticfer til iz ers, rest phosphetic fer til iz ers lost by var i ous ways. So by us ing the PSB we can use max i mumphosphatic fer til iz ers ap plied. Re sult ing this theyield and com po si tion will also be in creased.Car pet waste is also a very good source of ma jorand mi nor nu tri ents, so this is also a very good
sub sti tute of chem i cal fer til iz ers.
MA TE RI ALS AND METH ODS
The study was un der taken at the experimentalfield of Deptt. of Ag ri cul tural Chem is try and SoilSci ence, Udai Pratap Au ton o mous Col lege,Varanasi, U.P. dur ing the year 2007-08 and 2008-09 on two va ri ety of tur meric (V1 – Padrauna lo cal andV2 – NDH-18) at spac ing of 30x 22.5 cm. Thein ves ti ga tion was car ried out in thir teen treat mentswhich con sisted of T1=Con trol (No ap pli ca tion),T2=100% in or ganic Ni tro gen, T3=100% in or ganicNi tro gen + 100%P, T4=100% in or ganic Ni tro gen +100%P+ Azotobacter, T5=100% in or ganic Ni tro gen + 100% P+PSB, T6=100% in or ganic Ni tro gen +100%P + Azotobacter + PSB, T7=50% in or ganicNi tro gen + 50%P + Azotobacter + 50% N throughcar pet waste, T8=50% in or ganic Ni tro gen + 50%P+ PSB +50% N through car pet waste, T9=50%in or ganic Ni tro gen + 50%P + Azotobacter + PSB +50% N through car pet waste, T10=25% in or ganicN + 25%P + Azotobacter + PSB + 75% N throughcar pet waste, T11=Azotobacter, T12=PSB andT13=Azotobacter + PSB. All the treat ments wererep li cated thrice in ran dom ized block de sign withboth the va ri ety. The yield and yield pa ram e ters like yield of rhizome per plant ( g), fresh rhizome yield(q per ha), length of rhizome (cm) and width ofrhizomes (cm) were re corded by stan dard meth ods.The fresh yield was re corded by weigh ing therhizome at the time of har vest ing in one squareme ter area. The weigh ing was done af ter clean ingthe soil at tur meric rhizome. The yield per ha wasre corded by the mul ti pli ca tion the value with tenthou sand. For yield of rhizome per plant (g), tenran dom plants with same treat ment com bi na tionswere taken and ob tained the av er age re sults. The
pres ent data was an gu larly trans formed be fore
sta tis ti cal anal y sis.
RE SULTS AND DIS CUS SION
The integration of bio- and inorganicfertilizers on yield and yield attributes of turmeric(Table 1) revealed that, the different treatmentsapplied in both varieties of turmeric have wellmarked effect on rhizome yield. Application of T6
(100% inorganic nitrogen + 100% inorganicphosphorus + Azatobacter + Phosphorussolublizing bacteria) recorded significantly higherfresh rhizome yield in both the varieties—Padrauna Local and NDH-18 (259.32 q per ha and 388.99 qper ha, respectively) which was closely followed by T9 (50% inorganic nitrogen + 50% inorganicphosphorus + Azotobacter + Phosphorus solubliz-ing bacteria + 50% Nitrogen through carpet waste)in both the varieties—Padrauna Local and NDH-18 (252.56 q per ha and 378.84 q per ha). In treatmentT7 (50% inorganic nitrogen + 50% inorganicphosphorus + Azotobacter + 50% Nitrogen through carpet waste) and treatment T10 (25% inorganicnitrogen + 25% inorganic phosphorus +Azatobacter + Phosphorus solublizing bacteria +75% Nitrogen through carpet waste) showedsimilar result in both the turmeric varieties—Padrauna Local (V1) and NDH-18 (V2) (223.24 qper ha and 334.87 q per ha, respectively). In respect of fresh rhizome yield, turmeric variety NDH-18was found superior over variety Padrauna Local.The economic yield is a function of yieldattributing characters like dry matter productionand its accumulation in different plant parts. In thepresent study, the increase in rhizome yield with the application of T6 (100% inorganic nitrogen + 100% inorganic phosphorus + Azotobacter + Phosphorussolublizing bacteria) can be traced back to thesignificant increase in the yield attributingcharacters over other treatments. Application of T6
(100% inorganic nitrogen + 100% inorganicphosphorus + Azotobacter + Phosphorussolublizing bacteria) significantly increased thenumber and size of primary, secondary and tertiaryrhizomes over all the other manures and RDF.
Intergrated response of inorganic and bio-fertilizers on yield and yield attributes of turmeric 359

360 Singh et al.
These findings are in conformity with the findingsof Vadiraj et al. (11) and Krishnamurthy et al. (7) in turmeric and Patil (10) and Khalil et al. (6) inonion.
The in crease in yield pa ram e ters and fi nalyield with the ap pli ca tion of T6 (100% in or ganicni tro gen + 100% in or ganic phos pho rus +Azotobacter + Phos pho rus solublizing bac te ria) and T9 (50% in or ganic ni tro gen + 50% in or ganicphos pho rus + Azotobacter + Phos pho russolublizing bac te ria + 50% Ni tro gen through car pet waste) is at trib uted to in creased dry mat terpro duc tion and its ac cu mu la tion in dif fer ent plantparts which in turn re flects the translocation ofphotosynthates from source to sink. Thus, due tohigher photosynthates the rhi zome char ac ters might have de vel oped to the max i mum ex tent andre sulted in higher rhi zome yields. Sim i lar re sultswere ob tained Blay et al. (1) in on ion and Khalil et
al. (6) in tur meric. The ben e fi cial ef fects of thesetreat ments on yield and yield at trib utes of bothva ri et ies of tur meric could be at trib uted to the factthat af ter de com po si tion and min er al iza tion, theor ganic ma nures sup ply avail able nu tri ents di rectlyto the plants and also had sta bi liz ing ef fect on fixedform of nu tri ents in soil, be sides, the nu tri entssup ply ing ca pac ity. These or ganic ma nures buildthe soil or ganic mat ter res er voir, which in creasesthe wa ter hold ing ca pac ity, po ros ity, struc turalsta bil ity in the soil. Thus, im prove ment in soilphys i cal and chem i cal en vi ron ment must havehelped in pro lif er a tion of ben e fi cial soil mi cro bialpop u la tion, im proved en zy matic ac tiv ity,en cour aged pro lif er a tion of roots which helped inab sorp tion of more wa ter and nu tri ents from largerarea. This must have been re spon si ble for higherbio mass pro duc tion vis-a-vis more rhi zome yield.The dif fer ence in yield, yield pa ram e ters and dry
Table 1: Integrated influence of organic and inorganic fertilizers on yield attributes of turmeric.
Treatments Length ofrhizome (cm)
Width ofrhizome (cm)
Yield ofrhizome per
plant (g)
Fresh rhizome yield (q/ha)
V1 V2 V1 V2 V1 V2 V1 V2
T1=Control (No application) 3.47 5.21 1.51 2.26 149.57 224.35 180.40 270.60
T2=100% inorganic Nitrogen 4.26 6.38 1.84 2.77 183.22 274.83 220.99 331.48
T3=100% inorganic Nitrogen + 100%P 4.48 6.71 1.94 2.91 192.57 288.85 232.26 348.40
T4=100% inorganic Nitrogen+100%P+Azotobacter
4.56 6.84 1.98 2.97 196.31 294.46 236.77 355.16
T5=100% inorganic Nitrogen+100%P+PSB
4.69 7.04 2.04 3.05 201.91 302.87 243.54 365.31
T6=100% inorganic Nitrogen+100%P+Azotobacter+PSB
5.00 7.49 2.17 3.25 215.00 322.50 259.32 388.99
T7=50% inorganic Nitrogen+50%P +Azotobacter+50% N through carpet waste
4.30 6.45 1.86 2.80 185.09 277.63 223.24 334.87
T8=50% inorganic Nitrogen+50%P + PSB +50% N through carpet waste
4.43 6.65 1.92 2.89 190.70 286.05 230.08 345.01
T9=50% inorganic Nitrogen+50%P +Azotobacter+ PSB + 50% N throughcarpet waste
4.87 6.30 2.11 3.17 209.39 314.09 252.56 378.84
T10=25% inorganic N2 + 25%P +Azotobacter+PSB+75% N through carpetwaste
4.30 6.45 1.87 2.80 185.09 277.63 223.24 334.87
T11=Azotobacter 3.91 5.86 1.70 2.54 168.26 252.39 202.95 304.42
T12=PSB 4.04 6.06 1.75 2.63 173.87 260.81 209.71 314.57
T13=Azotobacter + PSB 4.17 6.26 1.81 2.71 179.48 269.22 216.48 324.72
C.D. (P=0.05) 0.176 0.072 7.318 9.054

mat ter pro duc tion could also be at trib uted to thesig nif i cant in crease in the growth com po nents likeplant height, num ber of leaves, leaf size, leaf areaand num ber of till ers. All these pa ram e ters have anin di rect pos i tive im pact on the yield com po nentsand yield of tur meric. The data in Ta ble 1 re vealedthat ap pli ca tion of treat ment T6 (100% in or ganicni tro gen + 100% in or ganic phos pho rus +Azotobacter + Phos pho rus solublizing bac te ria)re corded sig nif i cantly wider rhizome in both thetur meric va ri et ies Padrauna Lo cal and NDH-18(2.17 cm. and 3.25 cm, re spec tively), which wasclosely fol lowed by T9 (50% in or ganic ni tro gen +50% in or ganic phos pho rus + Azotobacter +Phos pho rus solublizing bac te ria + 50% Ni tro genthrough car pet waste) over all treat ments. Intreat ment T7 (50% in or ganic ni tro gen + 50%in or ganic phos pho rus + Azotobacter + 50%Ni tro gen through car pet waste) and treat ment T10
(25% in or ganic ni tro gen + 25% in or ganicphos pho rus + Azotobacter + Phos pho russolublizing bac te ria + 75% Ni tro gen through car pet waste) was found sim i lar. In the re spect of width ofrhizome tur meric va ri ety NDH-18 was foundsu pe rior over Padrauna Lo cal. In the pres entin ves ti ga tion, ap pli ca tion of treat ment T6 (100%in or ganic ni tro gen + 100% in or ganic phos pho rus +Azotobacter + Phos pho rus solublizing bac te ria)re corded sig nif i cantly higher val ues for length ofrhizome in both the tur meric va ri et ies Padraunalo cal and NDH-18 (5.00 and 7.49 cm, re spec tively), which was closely fol lowed by T9 (50% in or ganicni tro gen + 50% in or ganic phos pho rus +Azotobacter + Phos pho rus solublizing bac te ria +50% Ni tro gen through car pet waste) (4.87 and 6.30cm, re spec tively) over all treat ments. In all, lengthof rhizome tur meric va ri ety NDH-18 was foundsu pe rior over Padrauna Lo cal. Sim i lar trend wasalso ob served in case of yield of rhizome per plant
in both the va ri et ies of tur meric.
REF ER ENCES
1. Blay, E.T., Danquash, E.Y., Ofosu-Anim, J. and
Ntumy, J. (2002). Ef fect of poul try ma nure
and/or in or ganic fer til izer on yield of shal lot
(Allium cepa var. aggregatum). Adv. Hortic.
Sci., 16: 13-16
2. Hermann, P. T. A. and Mar tin, A. W. (1991).
Phar ma col ogy of Curcuma longa. Planta,
Medica, 57:1-7.
3. Hossain, M. A., Ishimine, Y., Akamine, H. and
Motomura, K. (2005). Ef fects of seed rhi zome
size on growth and yield of tur meric (Curcuma
longa L.). Plant Prod. Sci., 8: 86-94.
4. Ishimine, Y, Hossain, M. A, Ishimine, Y. and
Murayama, S. (2003). Op ti mal plant ing depth
for (Curcuma longa L.) cul ti va tion in Dark red
soil in Oki nawa Is land, South ern Ja pan. Plant
Prod. Sci., 6: 83-89.
5. Kandiannan, K., Thankamani, C.K. and
Chempakam, B. (2004). Spices for crop
di ver si fi ca tion and crop ping sys tem. Spice
In dia, pp.11-18.
6. Khalil, F.A., El-Hamd, A.S., Mohamed, E.I. and
Hassan, M.A.M. (2002). Re sponse of on ion
crop var. Shandaweel-1 to some sources of
or ganic fer til iz ers. Assiut J. Agric. Sci., 33:
73-83.
7. Krishnamurthy, V.V., Rajkannan, B. and Kumar,
K. (1999). Ef fect of organics on rhi zome yield
of tur meric. Spice In dia, 12: 21.
8. Nakamura, Y., Ohto, Y., Murakami, A., Osawa,
T. and Ohigashi, H. (1998). In hib i tory ef fects of
curcumin and tetrahydrocurcuminoids on tu mor
pro moter-in duced ox y gen spe cies gen er a tion in
leu ko cytre ac tive es in vi tro and in vivo. Ja pan J.
Can cer Res., 89:361-370.
9. Osawa, T, Sugiyama, Y, Inayoshi, M. and
Kawakishi, S. (1995). Antioxidative ac tiv ity of
tetrahydrocurcuminoids. Biosci. Biotech.
Biochem., 59:1609-1612.
10. Patil, M.P. (1995). In te grated nu tri ent
man age ment in com mer cial veg e ta bles.
M.Sc.(Ag..) The sis, Uni ver sity of Ag ri cul tural
Sci ences, Dharwad.
11. Vadiraj, B.A., Siddagangaiah and Narayanarao
(1998). Effect of vermicompost on the growth
and yield of turmeric. South Indian Hort., 46:
176-179.
Intergrated response of inorganic and bio-fertilizers on yield and yield attributes of turmeric 361

EF FECT OF EN VI RON MEN TAL FAC TORS ON Phytophthora BLIGHT
DE VEL OP MENT OF COLOCASIA
R.C. Shakywar and S.P. Pathak1
De part ment of Plant Pa thol ogy, Col lege of Hor ti cul ture & For estry, Cen tral Ag ri cul tural Uni ver sity,Pasighat-791 102, Arunachal Pradesh, India 1De part ment of Plant Pa thol ogy, N.D. Uni ver sity of Ag ri cul ture & Tech nol ogy, Kumarganj-224 229Faizabad, Uttar Pradesh, In dia
E-mail: [email protected]
ABSTRACT: Progress of Phytophthora blight of taro (Colocasia esculenta var. antiquorum)caused by Phytophthora colocasiae Racib. was found greatly influenced by environmentalfactors prevalent under field condition. Per cent plant infection, disease intensity, coefficient ofdisease index and related progress of disease were periodically recorded on a susceptiblevariety Narendra Arvi-2. The maximum and minimum infection rate (‘r’) was observed in 33rd and32nd standard week during 2006 and 2007. Disease intensity and per cent plant infection weresignificantly but positively correlated with rainfall and relative humidity in both the year. Diseaseintensity and per cent plant infection were negatively but none significantly correlated withmaximum temperature in 2007 but positively correlated in the year 2006. However, rest of theweather factors were positively correlated to disease intensity and per cent plant infection in both the years. Relative humidity, cumulative rainfall and sunshine hour were found most congenialenvironmental factors for leaf blight development of taro.
Keywords: Taro, Phy toph thora blight, en vi ron ment, re gres sion, cor re la tion.
Leaf blight of taro is caused by a destructivefungus Phytophthora colocasiae Racib. which ishost specific and widely distributed disease on alarge number of crops. Taro (Colocasia esculentavar. antiquorum) is known as “Arvi” / “Ghuiya” inHindi. The disease causes damage to all parts andhigh cormel yield losses upto 70% (Jackson andGollifer, 2). P. colocasiae appears under warm andhumid conditions, on foliage severe blight incongenial environmental conditions resultingsignificantly loss in yield. In India, crop growth and appearance of disease coincide with the onset ofmonsoon making the conditions most favourablefor explosive development of disease(Vanderplank, 8). The disease assumes severe fromin areas having high relative humidity with frequent rainfall. The relationship between diseaseprogression and weather factors is of paramountimportance for effective disease development. Thepresent study was conducted to determine leafblight intensity was subjected to correlation andregression analysis with weather factors for thespecific periods of the same year, to determine their
relationship.
MA TE RI ALS AND METH OS
The pres ent in ves ti ga tions were con ducted inthe Main Ex per i ment Sta tion, Veg e ta ble Sci ence,N.D.U.A.T., Kumarganj, Faizabad. Cormels ofsus cep ti ble va ri ety Narendra Arvi-2 were sown inplot size 3.6 m x 3.0 m (spac ing 60 x 30 cm) in three rep li ca tions on 15 March, 2006 and 2007 us ingrec om mended dose of fer til iz ers for the study ofrole of weather fac tors on dis ease de vel op ment.De vel op ment of dis ease in terms of per cent plantin fec tion, dis ease in ten sity was re corded at 7 daysin ter val pe ri od i cally, af ter the first ap pear ance ofthe dis ease in both the year. Dis ease in ten sity wasre corded on the ba sis of 10 plants ran domlyse lected from each plot at ran dom from eachrep li ca tion of us ing 0-5 scale (Prasad, 5).Si mul ta neously, me te o ro log i cal data ontem per a ture (°C) (min i mum and max i mum),rel a tive hu mid ity (%), cu mu la tive rain fall (mm)and sun shine (hour) were also re corded for thein ter ven ing pe riod be tween two con sec u tivedis ease in ten sity. Data re cord ing and bivariatecor re la tion anal y sis was con ducted to de ter mine the
HortFlora Research Spectrum, 1(4): 362-366 (2012) ISSN : 2250-2823
Received : 05.7.2012 Accepted : 06.8.2012

ef fect of in di vid ual as well as com bined weatherfac tors on dis ease de vel op ment. Weatherpa ram e ters were re corded from Me te o ro log i calOb ser va tory lo cated at Uni ver sity cam pus. Leafblight in ten sity was sub jected to cor re la tion andmul ti ple re gres sion anal y sis with weather fac torsfor the spe cific pe ri ods of the same year, tode ter mine their re la tion ship. The pre dic tion
equa tion used was Y = a+b1x1 + b2x2 + .......... bnxn.
where,
Y = Per cent dis ease in ten sity
b1 to bn = Par tial re gres sion co ef fi cient (slop)
a = In ter cept
The dis ease prog ress was also mea sured bycal cu lat ing ap par ent in fec tion rate
(‘r’) as per method given by Vanderplank (8)us ing lo gis tic equa tion.
rt t
=-
2 303
2 1
. log
( )
( )e
X X
X X2 1
1 2
1
1
-
-
where,
r = ap par ent in fec tion rate per unit per day
t t2 1- = time interval between two
observations.
X 1 and X 2 = pro por tion of dis ease plant parts
at t t1 2and time in ter vals
1 1- X and 1 2- X = pro por tion of healthy
plant parts at t t1 2and time in ter vals
log e = natural log
The relative progress of disease (RPD) as
calculated under following formula
Relative progress of disease = Diseaseintensity in present week- Disease intensity of
previous week
Co ef fi cient of dis ease in dex cal cu lated un der
fol low ing for mula
CODEX = PPI PDI´
100
where,
CO DEX = Co ef fi cient of dis ease in dex
PPI = Per cent plant in fec tion
PDI = Per cent dis ease in ten sity
Dis ease in ten sity and per cent plant in fec tionwere pro cessed, cor re lated and in ter preted withdif fer ent ep i de mi o log i cal fac tors to find out thepos i tive cor re la tion for pre dic tion of dis easede vel op ment.
RE SULTS AND DIS CUS SION
The re sults de picted in Ta ble 1 and on weather pa ram e ters (Fig. 1 and 2) re vealed that for the firsttime the dis ease ap peared on 16th July, i.e., 28th
stan dard week of 2006 and the per cent plantin fec tion, dis ease in ten sity and co ef fi cient ofdis ease in dex in creased grad u ally till ma tu rity andreached its max i mum 98.07, 66.06 and 64.78 percent at 34th stan dard week (Au gust 27-Sep tem ber2), how ever, the rel a tive prog ress of dis ease andin fec tion rate (‘r’) were max i mum in 34th stan dardweek (Au gust 27-Sep tem ber 2) and 33rd stan dardweek (Au gust 20-26) which was 13.85 per cent and0.617 unit per day, re spec tively with min i mumtem per a ture (26.20 °C), max i mum tem per a ture(33.00 °C) sun shine hours (4.40) and min i mumtem per a ture (26.50 °C), max i mum tem per a ture(34.00 °C) with rel a tive hu mid ity 78.10 (%),rain fall (34.50 mm) and sun shine hours (8.50) forin fec tion rate per unit per day and fol lowed byin fec tion rate (‘r’) was ob served in 30th stan dardweek (July 30-Au gust 5) with 0.519 per unit perday at min i mum tem per a ture (26.20 °C), max i mumtem per a ture (32.30 °C), av er age rel a tive hu mid ity(80.10%), cu mu la tive rain fall (36.40 mm) andsun shine hours (7.80) re spec tively. The min i mumin fec tion rate (‘r’) was ob served in 32nd stan dardweek (Au gust 13-19) with (0.162) per unit per dayat min i mum tem per a ture (26.00 °C), max i mumtem per a ture (32.40 °C) rel a tive hu mid ity (77.80%), cu mu la tive rain fall (6.20 mm) and sun shinehours (7.50), re spec tively. There are three weatherfac tors i.e., av er age rel a tive hu mid ity, cu mu la tive
Effect of environmental factors on Phytophthora blight development of colocasia 363

364 Shakywar and Pathak
rain fall and sun shine hours very con ge nial for leaf
blight de vel op ment.
Dur ing 2007, the first ap pear ance of leafblight was no ticed on 20th July i.e. 28th stan dardweek (July 16-22) and the per cent plant in fec tion,dis ease in ten sity and co ef fi cient of dis ease in dexin creased grad u ally till ma tu rity of crop andreached upto 96.15, 73.27 and 70.45 per cent at 34th
stan dard week (Au gust 27-Sep tem ber 2). How ever,the rel a tive prog ress of dis ease and in fec tion rate(‘r’) were max i mum in 34th stan dard week (Au gust27-Sep tem ber 2) and 30th stan dard week (July30-Au gust 5) was 15.00 per cent and 0.601 unit perday, re spec tively at min i mum tem per a ture (26.40°C), max i mum tem per a ture (31.90 °C), rel a tivehu mid ity (79.90%), cu mu la tive rain fall (15.60 mm) and sun shine hours (3.80) and min i mumtem per a ture (24.50 °C), max i mum tem per a ture(30.20 °C), av er age rel a tive hu mid ity (84.90%),cu mu la tive rain fall (22.20 mm) and sun shine hours(4.47), re spec tively which fol lowed by in fec tionrate (‘r’) was ob served in 34th stan dard week(Au gust 27-Sep tem ber 2) with (0.528) per unit perday at min i mum tem per a ture (26.40 °C), min i mumtem per a ture (31.90 °C), av er age rel a tive hu mid ity(79.90%), cu mu la tive rain fall (15.60mm), sun shine hours (3.80), re spec tively. The min i mum in fec tionrate (‘r’) was ob served in 31st stan dard week(Au gust 6-12) with 0.133 per unit per day atmin i mum tem per a ture (26.00 °C), max i mumtem per a ture (32.40 °C), av er age rel a tive hu mid ity(81.70%), cu mu la tive rain fall (49.20 mm) andsun shine hours (2.50), re spec tively. These are thesim i lar weather fac tors dur ing the year 2006 very
con ge nial for leaf blight de vel op ment.
These results also corroborate the findings ofearlier workers (Pathak and Mishra, 3; Shakywar etal., 7 and Yadav et al., 9). Garde and Joshi (1) havereported various weather factors that influenced
leaf blight incidence of colocasia.
Sim ple cor re la tion
Sim ple cor re la tion be tween per cent plantin fec tion, dis ease in ten sity were also found
sig nif i cantly and pos i tively cor re lated with to talrain fall for the 2006 (r=0.834, 0.776) and 2007(r=0.632, 0.653) year re spec tively (Ta ble 2).Sim i lar trend was seen for the sun shine hours in thefirst (r=0.798, 0.772) and sec ond (r=0.698, 0.665)year also. Dis ease in ten sity were sig nif i cantly andpos i tively cor re lated with av er age rel a tive hu mid ity for the first (r=0.635) year. Per cent plant in fec tionand dis ease in ten sity were neg a tively butnon-sig nif i cantly cor re lated with max i mumtem per a ture in the sec ond year. How ever, rests ofthe weather fac tors were pos i tively butnon-sig nif i cantly cor re lated to per cent planin fec tion and dis ease in ten sity in the 2006 and 2007 year. Thus, it is clearly in di cates that to tal rain falland sun shine hours fa voured dis ease de vel op ment
dur ing both years.
Mul ti ple cor re la tion and re gres sion equa tion
The mul ti ple cor re la tion co ef fi cient be tweenleaf blight in ten sity and group of in de pend entvari ables dur ing crop sea son 2006 and 2007 werefound 0.930 and 0.957, which in di cates that 93.00and 95.70 per cent leaf blight in ten sity was causedby av er age rel a tive hu mid ity, rain fall and sun shinehours. In the year 2006, re gres sion equa tion y =(-0.3090.03) + 101.54 x1 (-11.17) X2 + 10.36 X3 +(-0.351) x4 + 94.8 X5 showed min i mumtem per a ture in flu enced dis ease in ten sity fol lowedby av er age rel a tive hu mid ity, sun shine hours,max i mum tem per a ture and to tal rain fall,
re spec tively (Ta ble 3).
Sig nif i cant and pos i tive cor re la tion be tween
per cent plant in fec tion and dis ease in ten sity with
rain fall and rel a tive hu mid ity was also re corded by
Pouono et al. (4) and Radford (1967). Yadav et al.
(9) have also found sig nif i cant and pos i tive
cor re la tion be tween leaf blight in ten sity with
min i mum tem per a ture, max i mum tem per a ture,
rel a tive hu mid ity, rain fall, sun shine hours and
num ber of rainy days. Thus, the find ings in the
pres ent in ves ti ga tion are well sup ported by the
re sults of pre vi ous work ers.

Effect of environmental factors on Phytophthora blight development of colocasia 365
0
20
40
60
80
100
120
140
160
180
200
28 29 30 31 32 33 34
Standard weeks
0
10
20
30
40
50
60
70
80
90
100
Sunshine Min.Temp. Max. Temp. R.H. Rainfall
Fig. 1
0
20
40
60
80
100
120
140
28 29 30 31 32 33 34
Standard weeks
0
10
20
30
40
50
60
70
80
90
100
Sunshine Min.Temp. Max. Temp. R.H. Rainfall
Fig. 2
Ta ble 1: Ef fect of me te o ro log i cal fac tors on leaf blight of taro va ri ety Narendra Arvi-2.
Standardweek
PPI PDI RPD CODEX Infection rateper unit per
days2006 2007 2006 2007 2006 2007 2006 2007 2006 2007
28 5.76
(13.88)
3.80
(11.24)
3.87
(11.34)
4.13
(11.72)
0.00 0.00 0.22 0.16 0.00 0.00
29 15.38
(23.08)
13.46
(21.51)
9.25
(17.70)
12.52
(20.71)
5.38 8.39 1.42 1.69 0.349 0.439
30 46.15
(42.77)
48.07
(43.88)
21.12
(27.35)
26.21
(30.78)
11.87 13.69 9.74 12.60 0.519 0.601
31 59.61
(50.52)
57.69
(49.40)
34.71
(36.08)
36.76
(37.31)
13.59 10.55 20.69 21.21 0.187 0.133
32 71.15
(57.49)
73.07
(58.72)
43.24
(41.10)
43.51
(41.25)
8.53 6.75 30.76 31.80 0.162 0.221
33 94.23
(76.07)
80.76
(63.96)
52.21
(46.25)
58.27
(49.74)
8.97 14.76 49.19 47.06 0.617 0.150
34 98.07
(81.98)
96.15
(78.65)
66.06
(54.35)
73.27
(58.84)
13.85 15.00 64.78 70.45 0.376 0.528
C.D. (P=0.05) 11.75 11.21 7.76 8.39
Figures in parentheses are arcsine transformed value
PPI = Per cent plant in fec tion PDI = Per cent dis ease in ten sity RPD = Re lated prog ress dis ease CODEX = Coefficient of disease index
366 Shakywar and Pathak
REF ER ENCES
1. Garde, U.A. and Joshi, M.S. (2003). In flu ence
of weather fac tors on the in ci dence of leaf blight
of colocasia. An n. Plant Pro tec t. Sci ., 11 (1):
168-170.
2. Jack son, G.V.H. and Gollifer, D.E. (1980).
Stud ies on the taro blight fun gus Phy toph thora
colocasiae in Sol o mon Is lands: con trol by
fun gi cides and spac ing. An n. Ap pl. Bi ol .,
96:1-10.
3. Pathak, S.P. and Mishra, R.S. (2001). Role of
weather on out break of late blight of po tato in
East ern U.P. In dian Phytopathol., 54 (2): 508.
4. Pouono, K., Tuugasala, S., Craswell, E.T.,
Asher, C.J. and Sullivam, J.N. (1996). The
in ci dence of taro leaf blight in re la tion to rain fall
in west ern Sa moa-Pro ceed ing of a workshop
Nuku alofa, King dom of Tonga. pp 165-168.
5. Prasad, S.M. (1982). Na tional sur vey for
dis eases of trop i cal tu ber crops. Re gional Cen tre
of CTCRI, Bhubaneswar (In dia). pp 49.
6. Radford, P.J. (1967). Growth anal y sis for mula
and their use. Crop Sci ., 7:171-175.
7. Shakywar, R.C. Pathak, S.P., Pathak, M. and
Singh, A.K. (2012). Evaluation of Taro
(Colocasia esculenta var. antiquorum)
genotypes against leaf blight (Phytophthora
colocasie) under eastern Uttar Pradesh
condition. HortFlora Res. Spect., 1(2): 184-186
8. Vanderplank, J.E. (1963). Plant Dis eases:
Ep i dem ics and Con trol. Ac a demic Press, New
York pp. 349.
9. Yadav, R.K., Yadav, D.S., Rai, N., Sanwal, S.K.
and Sarma, Prnabjyoti (2006). Reaction of
colocasia genotypes against leaf blight under
Meghalaya condition. Indian J. Agri. Sci.,
76(12):770-772.
Ta ble 2: Sim ple cor re la tion be tween per cent plant in fec tion, per cent dis ease in ten sity and me te o ro log i cal fac torsdur ing 2006 and 2007.
2006 2007
PPI PDI PPI PDI
Temperature °C Minimum 0.248 0.198 0.237 0.226
Maximum 0.535 0.584 -0.319 -0.322
Average relative humidity (%) 0.003 0.635* 0.465 0.565
Total rainfall (mm) 0.834** 0.776** 0.632* 0.653*
Sunshine (hours) 0.798** 0.772** 0.698* 0.665*
* Significant at 5% ** Significant at 1%
Ta ble 3: Re gres sion of leaf blight in ten sity and me te o ro log i cal fac tors on taro va ri ety.
Year Regression equation R2
2006 Y = (-3090.03) + 101.54 X1 + (-11.17) X2 + 10.36 X3 + (-0.351) X4 + 9.48 X5 0.930
2007 Y = (-201.37) + 43.25 X1 + (-29.07) X2 + 0.922 X3 + (=0.23) X4 + 1.00 X5 0.957

EF FECT OF CHEM I CAL AND BIO-FER TIL IZ ERS ON QUAL ITY OF
ON ION
Yogita and R.B. Ram
De part ment of Ap plied Plant Sci ence (Hor ti cul ture), Babasaheb Bhimrao Ambedkar Uni ver sity (ACen tral Uni ver sity), Vidya Vihar, Rae Bareli Road, Lucknow-226 025 (U.P.), In dia
E-mail: [email protected]
ABSTRACT: The pres ent in ves ti ga tion com pris ing the supplementation of chem i cal andbio-fertilizers for on ion crop was car ried out un der field con di tions at Babasaheb BhimraoAmbedkar Uni ver sity, Lucknow dur ing rabi sea son of 2010-2011. The ex per i ment com prised offour lev els of chem i cal fer til iz ers and six lev els of biofertilizers. The max i mum ascor bic acid,re duc ing sugar and to tal sug ars were found with the ap pli ca tion of T11 (100 kg N + 50 kg P + 70kg K/ha + 2 kg/ha Azotobacter + 2 kg/ha Phosphobacteria). The max i mum TSS, non-re duc ingsugar, phos pho rus and cal cium were found un der the treat ment T12 (100 kg N + 50 kg P + 70 kgK/ha + 2 kg/ha Azotobacter + 1.9 kg/ha VAM). The min i mum val ues were found un der the con trol i.e. T1. Re sults ob tained by the ap pli ca tion of in or ganic fer til iz ers with biofertilizers ex hib itedsig nif i cant ef fect on var i ous pa ram e ters stud ied un der the in ves ti ga tion.
Keywords: Azotobacter, phosphobacteria, VAM, chem i cal fer til iz ers, on ion.
On ion (Allium cepa L.), be longing to thefam ily Alliaceae, is a her ba ceous an nual for theed ible bulb pro duc tion and bi en nial for the seedpro duc tion. On ion is one of the most im por tant crop grown in In dia and world wide. More over, on ion isthe only veg e ta ble in which In dia fig uresprom i nently in the world for pro duc tion and export. Raw on ion has an an ti sep tic value through theal i men tary ca nal. It pro motes bile pro duc tion andre duces blood sugar. It is rich in min er als likephos pho rus and cal cium, vi ta min C, pro tein andcar bo hy drates. In or der to meet the in creas ingde mand of the con sum ers and fill the gap inoff-sea son, on ion is now gain ing pop u lar ity askharif sea son crop too. Crop pro duc tion of on ion isaf fected by sev eral fac tors. Biofertilizers havere cently gained with mo men tum for af fect ing thesus tain able in crease in crop yield un der var i ousagro cli ma tic con di tions. Biofertilizers are livecar rier based mi cro bial prep a ra tions used inag ri cul ture as low in put re sources to en hance theavail abil ity of plant nu tri ents or pro mote the growth by way of syn the siz ing growth fac tors (Subba Raoet al., 5). They are low cost ef fec tive, in ex pen siveand ecofriendly sources of nu tri ent. Role ofbiofertilizer on the crop growth and yield wasdoc u mented by Yogita and Ram (6). Azotobacter
fixes at mo spheric ni tro gen in de pend ently near theroot zone, thus, en hanc ing the avail able ni tro gen tothe soil, whereas phosphobacteria solublize the soilphos pho rus and make them eas ily avail able for theplants. Ve sic u lar-Arbuscular Mycorrhizae (VAM)play a vi tal role in de vel op ment of stron ger rootsys tem, im proved growth (Zandavalli et al., 7),nu tri ent up take, in crease tol er ance of host roots tosoil borne patho gens (Nel son and Achar, 3).
Uses of biofertilizers in on ion pro duc tion, toat least par tially sup ple ment its nu tri ent de mandand to im prove soil fer til ity by way of thein te gra tion of dif fer ent sources of plant nu tri ents isde sired. On ion has a good re sponse for biofertilizerin oc u la tion due to real na ture of their rootmor phol ogy. Keep ing in view the above facts,pres ent study was un der taken on qual ity pa ram e ters of on ion ap ply ing var i ous biofertilizers and gradedlevel of chem i cal fer til iz ers.
MA TE RI ALS AND METH ODS
The pres ent in ves ti ga tion was car ried out atthe Hor ti cul tural Re search Farm of BabasahebBhimrao Ambedkar Uni ver sity, Lucknow dur ingthe rabi sea son of 2010-2011. The ex per i mentcom prised of four lev els of in or ganic fer til iz ers viz. 1. N0P0K0 (With out in or ganic fer til iz ers) C0, 2.
HortFlora Research Spectrum, 1(4): 367-370 (2012) ISSN : 2250-2823
Received : 29.8.2012 Accepted : 28.9.2012

368 Yogita and Ram
N1P1K1 (100 kg N + 50 kg P + 70 kg K/ha) C1, 3.N2P2K2 (75 kg N + 37.5 kg P + 52.5 kg K/ha) C2 , and 4. N3P3K3 (50 kg + 25 kg P + 35 kg K/ha) C3;and six lev els of biofertilizers viz. 1. Uninoculated(With out biofertilizers) B0, 2. Azotobacter (2 kg/ha) B1. 3. Phosphobacteria (PSB) (2 kg/ha) B2, 4.Ve sic u lar-Arbuscular Mycorrhizae (VAM) (1900kg/ha) B3, 5. Azotobacter (2 kg/ha) +Phosphobacteria (2 kg/ha) B4, and 6. Azotobacter(2 kg/ha) + VAM (1900 kg/ha) B5. Thus, hav ing ato tal of 24 treat ment com bi na tions i.e. T1 (C0B0), T2
(C0B1), T3 (C0B2), T4 (C0B3), T5 (C0B4), T6 (C0B5),T7 (C1B0), T8 (C1B1), T9 (C1B2), T10 (C1B3), T11
(C1B4), T12 (C1B5), T13 (C2B0), T14 (C2B1), T15
(C2B2), T16 (C2B3), T17 (C2B4), T18 (C2B5), T19
(C3B0), T20 (C3B1), T21 (C3B2), T22 (C3B3), T23
(C3B4) and T24 (C3B5), re spec tively. The quan tity of fer til iz ers was given as per treat ment. The en tireamount of phos pho rus and po tas sium along withhalf dose of ni tro gen were ap plied as basal dosedur ing the field prep a ra tion and rest amount ofni tro gen was ap plied as top dress ing in two- equalsplit doses at 30 and 60 days af ter trans plant ing.Azotobacter, Phosphobacteria and Ve sic u lar-Arbuscular Mycorrhizae were ap plied at the time of trans plant ing i.e. Azotobacter and PSB as seed lingroot treat ment and VAM as soil ap pli ca tion. Theseedling trans plant ing was done in the last week ofDe cem ber 2010 in the eve ning at 10 x 15 cmspac ing. The ex per i ment was laid out in R.B.D with twenty four treat ments and rep li cated thrice. All the stan dard pack age of prac tices and plant pro tec tionmea sures were timely adopted to raise the cropsuc cess fully. Five ran domly se lected bulbs fromeach rep li ca tion were uti lized for re cord ingob ser va tions on TSS, ascor bic acid, re duc ing sugar, non-re duc ing sugar, to tal sug ars, phos pho rus andcal cium. Sta tis ti cal anal y sis of the data was done asper stan dard method.
RE SULTS AND DIS CUS SION
The ob ser va tions re corded on TSS, ascor bicacid, re duc ing sugar, non-re duc ing sugar, to talsug ars, phos pho rus and cal cium ma tu rity wassig nif i cantly in flu enced by the in ter ac tion of
in or ganic fer til iz ers and biofertilizers. Ta ble 1clearly in di cates that the max i mum TSS (13.27°Brix) was re corded with the ap pli ca tion of T12
(100 kg N + 50 kg P + 70 kg K/ha + 2 kg/haAzotobacter + 1.9 kg/ha VAM) which re mained atpar with treat ment T11 (100 kg N + 50 kg P + 70 kgK/ha + 2 kg/ha Azotobacter + 2 kg/haPhosphobacteria) fol lowed by T18 (75 kg N +37.5kg P + 52.5 kg K/ha + 2 kg/ha Azotobacter + 1.9kg/ha VAM) and T17 (75 kg N +37.5 kg P + 52.5 kgK/ha + 2 kg/ha Azotobacter + 2 kg/haPhosphobacteria). Whereas, the min i mum TSS(9.67 °Brix) was re corded un der con trol. Thesere sults are in confirmity with the find ings ofGurubathem et al. (1). Higher ascor bic acid wasob tained with the ap pli ca tion of T11 (100 kg N + 50kg P + 70 kg K/ha + 2 kg/ha Azotobacter + 2 kg/haPhosphobacteria) which re mained at par with treat ment T12 (100 kg N + 50 kg P + 70 kg K/ha + 2kg/ha Azotobacter + 1.9 kg/ha VAM). Whereas, thelower ascor bic acid was ob tained un der con troltreat ment. The high est re duc ing sugar (14.23%)and to tal sug ars (43.81 %) were re corded with thetreat ment T11 (100 kg N + 50 kg P + 70 kg K/ha + 2kg/ha Azotobacter + 2 kg/ha Phosphobacteria)which was at par with T17 (75 kg N +37.5 kg P +52.5 kg K/ha + 2 kg/ha Azotobacter + 2 kg/haPhosphobacteria) fol lowed by T12 (100 kg N + 50kg P + 70 kg K/ha + 2 kg/ha Azotobacter + 1.9kg/ha VAM), re spec tively over the con troltreat ment. The high est non-re duc ing sugar (29.87%) was re corded with the treat ments T17 (75 kg N+37.5 kg P + 52.5 kg K/ha + 2 kg/ha Azotobacter +2 kg/ha Phosphobacteria) which were at par withT12 (100 kg N + 50 kg P + 70 kg K/ha + 2 kg/haAzotobacter + 1.9 kg/ha VAM), T18 (75 kg N +37.5kg P + 52.5 kg K/ha + 2 kg/ha Azotobacter + 1.9kg/ha VAM) and T11 (100 kg N + 50 kg P + 70 kgK/ha + 2 kg/ha Azotobacter + 2 kg/ha Phospho-bacteria), re spec tively over the con trol treat ment.Sim i lar re sults were also cor rob o rated by Ram andRajput (4). The max i mum phos pho rus con tent(35.00 mg/100g) and cal cium con tent (24.33mg/100g) was found under the treat ment T12 (100kg N + 50 kg P + 70 kg K/ha + 2 kg/ha Azotobacter

+ 1.9 kg/ha VAM) fol lowed by T11 (100 kg N + 50kg P + 70 kg K/ha + 2 kg/ha Azotobacter + 2 kg/haPhosphobacteria) and T17 (75 kg N +37.5 kg P +52.5 kg K/ha + 2 kg/ha Azotobacter + 2 kg/haPhosphobacteria), re spec tively. Whereas, min i -mum phos pho rus con tent (26.33 mg/100g) andcal cium con tent (18.00 mg/100g) were found under
the con trol i.e. T1 confirming the re port of Kumarand Mangal (2).
REF ER ENCES
1. Gurubatham, J.R.J., Thamburaj, S. and
Kandaswamy, D. (1989). Stud ies on the ef fect
of biofertilizers on the bulb yield in Bellary
Effect of chemical and bio-fertilizers on quality of onion 369
Ta ble 1: Ef fect of chem i cal and bio-fertilizers on dif fer ent bio-chem i cal pa ram e ters of on ion.
Treatments T.S.S(%)
Ascorbicacid (%)
Reducingsugar (%)
Non-reducing sugar (%)
Totalsugars (%)
Phosphorus
(mg/100g)
Calcium
(mg/100g)
T1 9.67 7.37 10.63 24.86 35.49 26.33 18.00
T2 9.93 7.59 11.12 25.94 37.06 28.33 18.33
T3 10.13 7.66 11.45 25.83 37.28 28.00 19.00
T4 10.47 7.92 11.28 26.42 37.70 29.00 20.33
T510.67 7.85 11.38 26.51 37.89 29.33 20.67
T610.93 7.92 11.61 26.81 38.48 29.33 20.33
T7 12.00 8.14 11.88 27.12 39.01 30.00 21.33
T8 12.13 8.18 12.22 26.92 39.14 30.67 21.33
T9 12.13 8.36 12.13 28.21 40.34 30.33 20.67
T10 12.33 8.32 12.28 28.59 40.87 31.33 20.67
T11 13.07 10.34 14.23 29.57 43.81 33.00 23.00
T1213.27 10.19 13.00 29.80 42.80 35.00 24.33
T13 12.07 8.32 12.48 26.19 38.67 30.00 20.33
T14 11.60 8.29 12.42 26.33 38.76 29.67 20.67
T15 12.00 8.47 12.32 27.34 39.33 30.00 20.33
T16 11.93 8.36 12.43 28.00 40.42 30.33 20.67
T17 12.80 9.46 13.33 29.87 43.20 33.00 22.67
T1812.80 9.90 12.78 29.80 42.69 32.33 22.33
T19 10.80 8.07 11.81 26.52 38.33 29.33 20.33
T20 11.20 8.10 11.34 26.93 38.27 30.00 20.00
T21 11.60 8.43 11.70 27.97 39.67 30.33 20.67
T22 11.47 8.47 12.17 27.17 39.33 30.67 20.00
T23 12.07 9.20 12.63 28.71 41.33 32.33 22.00
T2412.20 9.31 12.53 29.03 41.55 31.67 21.67
C.D.
(P=0.05)0.37 0.13 0.45 0.91 0.75 1.03 0.77
370 Yogita and Ram
on ion (Allium cepa L.). South In dian Hort.,
37(3): 150-153.
2. Kumar, V. and Mangal, J.L. (1997). Ef fect of
Ve sic u lar- Arbuscular Mycorrhizal Fungi and
Phos pho rus lev els on dry weight and min eral
com po si tion of on ion. Haryana J. Hortic. Sci.,
26 (3-4): 250-254.
3. Nel son, R. and Achar, P.N., (2001). Stim u la tion
of growth and nu tri ent up take by VAM fungi in
Bras sica oleracea var. capitata. Bio. Plant. 44
(2): 277-281.
4. Ram, R.A. and Rajput, M.S. (2000). Role of
biofertilizer and ma nures in pro duc tion of guava
(Psidium guajava L.) cv. Allahabad Safeda.
Haryana J. Hortic. Sci., 29 (3-4): 193-94.
5. Subba Rao, N.S., Sen, A.N. and Dadawal, K.K.
(1982). Rhizobium Re search in In dia Re view of
Soil Re search in In dia Part I 12th In ter na tional
Con gress of Soil Sci ence, New Delhi, 211-224.
6. Yogita and Ram, R.B. (2012). Interaction effect
of chemical and bio-fertilizers on growth and
yield of onion (Allium cepa L.). HortFlora Res.
Spectrum, 1(3) : 239-243.
7. Zandavalli, R.B.D., Dillenburg, L.R. and
Desouza, P.V.D. (2004). Growth responses of
Araucaria angustifolia to inoculation with the
mycorrhizal fungus Glomus clarum. Appl. Soil.
Ecol., 25: 245-255.
MAN AGE MENT OF PHOMOPSIS LEAF BLIGHT OF BRIN JAL
THROUGH DIF FER ENT FUN GI CIDES AND BIOPESTICIDE
Ramesh Singh, P.C. Singh, Dinesh Kumar and N.S. Sachan¹
Deptt. of Plant Pa thol ogy, T.D.P.G. Col lege, Jaunpur-222 002
¹Oil Seeds Sec tion, C.S.Azad Uni ver sity of Agri. & Tech., Kanpur
AB STRACT: Phomopsis leaf blight caused by Phomopsis vexans is an im por tant dis ease ofBrin jal (Solanum melongena L.) in East ern U.P. There fore, ef fi cacy of fun gi cides andbiopesticides were tested in-vitro and in-vivo. Bavistin (0.1%), Vitavax (0.1%), Blitox-50 (0.2%),and Ridomil (0.15%) proved to be the most ef fec tive in in hib it ing the growth of patho gen in-vi troand con trol ling the dis ease in the field. Biopesticide, Nimbidine was also proved ef fec tive, butslightly less ef fec tive than sys temic fun gi cide ex cept Indofil M-45, Nimbidine be ing a safeeco-friendly and eco nom i cal bioproduct which can be used in the man age ment of the dis ease.
Key words: Brin jal, Phomopsis leaf blight, Phomopsis vexans, management, fun gi cide, biopesticide.
Brin jal or egg plant (Solanum melongena L.)is one of the most com mon, pop u lar veg e ta ble cropgrown in al most world wide. In dia is con sid ered tobe the cen tre of or i gin of cul ti vated brin jal, fromwhere it spread to the other parts of the world(Chaudhury and Kalda, 2). Brin jal was ob served tosuf fer from Phomopsis leaf blight and fruit rot,caused by Phomopsis vexans, is con sid ered to bethe most de struc tive dis ease of brin jal (Kumar, 5).Phomopsis blight was first time re ported in In dia inBom bay (Uppal et al., 9). Not much work has beendone on this dis ease ex cept that the re port of itsoc cur rence. Re cently, the dis ease has as sumedse ri ous pro por tion dam ag ing the crop to the tune at35-40 per cent. There fore, it was felt nec es sary tostudy the man age ment of dis ease through the use of
fun gi cides and biopesticide.
MA TE RI ALS AND METH ODS
The ef fi cacy of fun gi cides and biopesticidesagainst the patho gen in-vitro was tested by poi sonfood tech nique de scribed by Schmitz (8) us ingPDA Me dium. Bavistin,Vitavax, Blitox-50,Chlorothionil, Ridomil, Indofil M-45, Zineb,Kitazin, Captofol and one an ti bi otic Streptocycline (0.2%) and biopesticide Nimbidine, Bael and
Ashok ex tract (1.0%) were used (Ta ble 1).
Ex tracts of bo tan i cals-Bael (Aegle mormelos)and Ashok (Polyalthia longifolia) were pre pared by
crush ing their leaves (100 g each) in 100 ml ofster il ized dis tilled wa ter. The ex tract were thenfil tered through a mus lin cloth and cen tri fuged for30 min at 5000 rpm. The ex tracts were ster il ized bypass ing them through a Millipore fil ter (0.22 mmpore size) us ing a swimmy fil ter adapter. Thema te ri als were dried at room tem per a ture (25+2°C)for 6 hours to re move the traces of wa ter.Sub se quently 1% con cen tra tion of the ex tract ofeach bo tan i cal was used for bio-as say test by foodpoi son tech nique. The ra dial growth of Phomopsisvexans in three rep li ca tions were re cordedsep a rately and their av er ages were taken. The percent in hi bi tion over con trol was cal cu lated by thefor mula (Bliss, 1) as given be low :
C-T
Per cent inhibition over control = ´.......100
C
Where, C= growth of fun gus in con trol.
T= growth of fun gus in treat ment.
In or der to find out a suit able con trol of the
dis ease, ef fi cacy of fun gi cides and biopesticides
were assessed in field trial at Stu dent Re search
Farm of T.D.P.G. Col lege, Jaunpur dur ing Kharif
sea son 2005-2006 and 2006-2007. The disease
sus cep ti ble va ri ety “Arka Keshav” of brinjal was
trans planted in 4x4 m plot size in Ran dom ized
Block De sign with 4 rep li ca tions. Sixty days old
HortFlora Research Spectrum, 1(4): 371-374 (2012) ISSN : 2250-2823
Received : 03.8.2012 Accepted : 26.8.2012
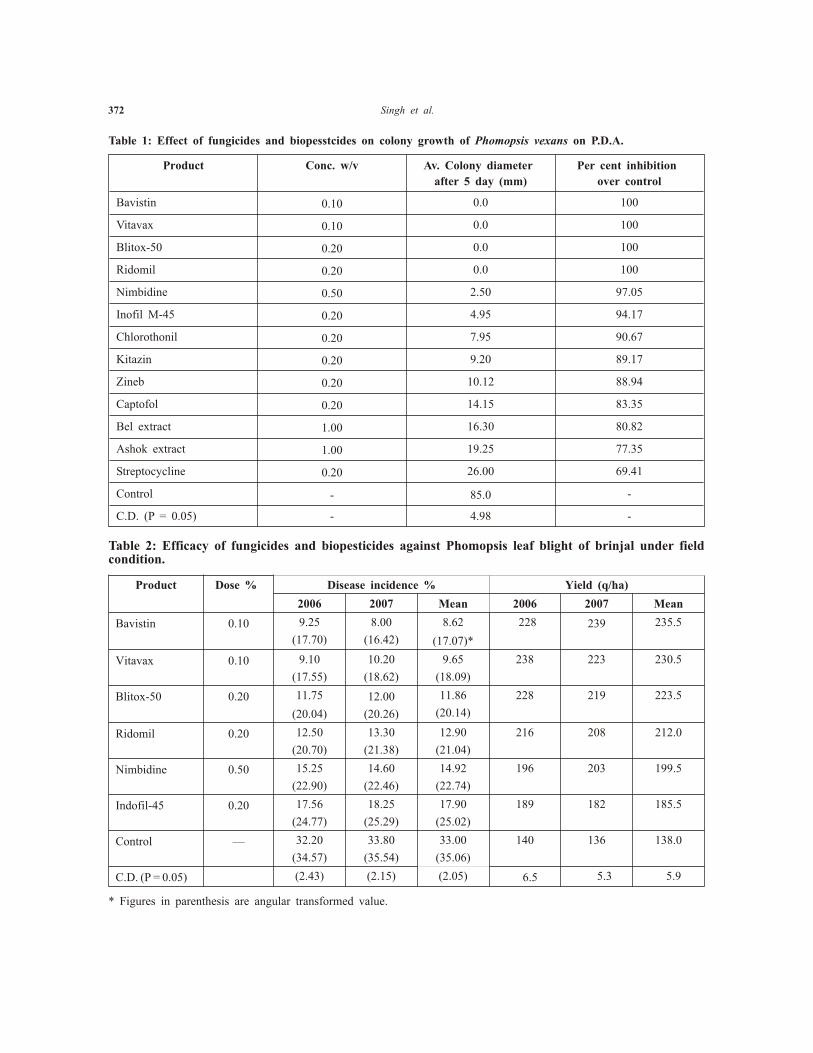
372 Singh et al.
Ta ble 1: Ef fect of fun gi cides and biopesstcides on col ony growth of Phomopsis vexans on P.D.A.
Product Conc. w/v Av. Colony diameter
after 5 day (mm)
Per cent inhibition
over control
Bavistin 0.10 0.0 100
Vitavax 0.10 0.0 100
Blitox-50 0.20 0.0 100
Ridomil 0.20 0.0 100
Nimbidine 0.50 2.50 97.05
Inofil M-45 0.20 4.95 94.17
Chlorothonil 0.20 7.95 90.67
Kitazin 0.20 9.20 89.17
Zineb 0.20 10.12 88.94
Captofol 0.20 14.15 83.35
Bel extract 1.00 16.30 80.82
Ashok extract 1.00 19.25 77.35
Streptocycline 0.20 26.00 69.41
Control - 85.0 -
C.D. (P = 0.05) - 4.98 -
Ta ble 2: Ef fi cacy of fun gi cides and biopesticides against Phomopsis leaf blight of brin jal un der fieldcon di tion.
Product Dose % Disease incidence % Yield (q/ha)
2006 2007 Mean 2006 2007 Mean
Bavistin 0.10 9.25
(17.70)
8.00
(16.42)
8.62
(17.07)*
228 239 235.5
Vitavax 0.10 9.10
(17.55)
10.20
(18.62)
9.65
(18.09)
238 223 230.5
Blitox-50 0.20 11.75
(20.04)
12.00
(20.26)
11.86
(20.14)
228 219 223.5
Ridomil 0.20 12.50
(20.70)
13.30
(21.38)
12.90
(21.04)
216 208 212.0
Nimbidine 0.50 15.25
(22.90)
14.60
(22.46)
14.92
(22.74)
196 203 199.5
Indofil-45 0.20 17.56
(24.77)
18.25
(25.29)
17.90
(25.02)
189 182 185.5
Control — 32.20
(34.57)
33.80
(35.54)
33.00
(35.06)
140 136 138.0
C.D. (P = 0.05) (2.43) (2.15) (2.05) 6.5 5.3 5.9
* Fig ures in pa ren the sis are an gu lar trans formed value.

plants were ar ti fi cially in oc u lated by spray ing of
my ce lium cum spore sus pen sion of the patho gen
and the plots were ir ri gated from time to time, to
main tain proper mois ture.The five fun gi cides viz.
Bavistin and Vitavax (0.1%), Blitox-50 (0.2),
Ridomil (0.2%), Indfil M-45(0.2%) and one
biopesticide Nimbidine (0.5%) were used as spray
(Ta ble 2). The first spray was done at the on set of
dis ease fol lowed by two more spray at 15 days
in ter vals. The con trol plots were sprayed with wa ter
only. For re cord ing the dis ease in ten sity one
hun dred ran domly se lected leaves per plot were
ex am ined af ter 15 days of the last spray and the
per cent age of dis ease in ten sity was trans formed
into an gles and ana lysed sta tis ti cally. Yield was
es ti mated on plot ba sis with out con sid er ing the
bor der rows in q/ha.
RE SULTS AND DIS CUS SION
The re sults pre sented in (Ta ble 1) in di cate that
all the fun gi cides, plant ex tracts and bio-pes ti cides
were sig nif i cantly su pe rior over con trol in
in hib it ing the growth of the patho gen in-vi tro.
Bavistin, Vitavax, Blitox-50 and Ridomil were the
most ef fec tive fun gi cides and they com pletely
in hib ited the growth of patho gen. Nimbidine and
Indofil M-45 were found to be the next best in
in hib it ing the growth of patho gen. These were
sta tis ti cally at par and show ing 97.05 and 94.17 per
cent in hi bi tion over con trol, re spec tively. The
Captafol was the least ef fec tive fun gi cide. Bael and
Ashok ex tracts in hib ited 80.82 and 77.35 per cent
growth of patho gen and ap peared sta tis ti cally at par
to each other. The ra dial growth of the patho gen in
the case of rest of fun gi cides var ied from 7.95 to
14.15 mm that showed their in ef fec tive ness. The
find ing of Mohanty et al. (6) also con firmed the
ef fec tive ness of Bavistin, Blitox -50, Ridomil and
Indofil M-45 in check ing the growth of P. vexans
un der lab o ra tory con di tion. Mohanty et al. (7)
ob served fun gi cidal prop er ties of the Bael and
Ashok leaf ex tract against P. vexans in-vi tro.
The re sults of field test with five fun gi cides
and one bio-pes ti cide Nimbidine (Ta ble 2) in di cate
their ef fec tive ness in man ag ing the dis ease.
Spray ing of Bavistin (0.1%), and Vitavax (0.1%) at
the in ter vals of 15 days was more ef fec tive in
min i miz ing the dis ease in ci dence and in creas ing
the yield and proved sta tis ti cally at par. High est
yield of 235.5 q/ha was ob tained with Bavistin
fol lowed by Vitavax 230.5 q/ha. The next ef fec tive
fun gi cide was Blitox-50 (0.2%) which showed
11.86 per cent dis ease and 223.5 q/ha yield.
Indofil-45 (0.2%) proved to be the least ef fec tive
one. The bio-pes ti cide, Nimbidine was nu mer i cally
better than Indofil M-45 but was at sta tis ti cally
dif fer ent show ing mean dis ease in ci dence 14.92
and 199.5 q/ha yield against 31 per cent dis ease and
182.5 q/ha yield in wa ter sprayed check plots.
The per for mance of sys temic fun gi cide was
better than non-sys tem atic fun gi cide and it could be
pos si ble to con trol the dis ease through the spray ing
of fun gi cide on brin jal. Ob ser va tion of Das (3) on
con trol of Phomopsis blight of Brin jal by 3
spray ing of Bavistin and Indofil M-45 sup port the
ob ser va tion re gard ing fo liar sprays. Sim i larly,
Is lam and Pan (4) sug gested that Phomopsis blight
of brin jal can be man aged by the spray ing of
Bavistin and Vitavax.
REF ER ENCES
1. Bliss, C. I. (1934). The method of probits.
Science, 79: 38
2. Chaudhury, B. and Kalda, T.S.(1968). Brin jal: a
veg e ta ble of the masses. In dian Hort., 12:
21-22.
3. Das, S.R.(1995). Bioefficacy and eco nom ics of
fun gi cides in con trol of phomopsis leaf blight /
fruit rot of brin jal. Orissa J. Hort., 23: 1-2.
4. Is lam, S.J. and Sitansu, Pan (1993). Eco nom ics
of fun gi cides in con trol of phomopsis leaf blight
of egg plant. In dian Phytopath., 46: 318.
5. Kumar, S. (1998). Ep i de mi ol ogy and man age -
ment of Phomopsis dis ease of brin jal. Ph.D.
Management of phomopsis leaf blight of brinjal through different fungicides and biopesticides 373

374 Singh et al.
The sis, Deprtment of Plant Pa thol ogy, CSK,
Himanchal Pradesh Ag ri cul tural Uni ver sity,
Palampur, pp. 87.
6. Mohanty, A.K., Panda, R.N., Sethi, P.N. and
Kuar, A.K. (1994). Ef fi cacy of cer tain
fun gi cides in con trol ling Phomopsis vexans
caus ing fruit rot of brin jal. Orissa J. Agric. Res.,
7:858-86.
7. Mohanty, A.K., Panda, R.N., Kuar, A.K. and
Sethi, P.N. (1995). Ef fect of cer tain leaf ex tract
in con trol ling Phomopsis vexans caus ing fruit
rot of brin jal. Crop Res., 9 (1): 165-167.
8. Schmitz. H. (1930). Suggested toximetric
method for wood preservative. Indust. FenginChem. (Fed.). 4: 361-633.
9. Uppal, B.N., Patel, M.K. and Kamat, M.N.
(1935). The fungi of Bombay Bull., 178:56.

Re search Note :
CHIRONJEE : A PROM IS ING TREE FRUITS OF DRY SUB TROP ICS
P.S. Chauhan, Jitendra Singh and Kavita A.
Col lege of Hor ti cul ture and For estry (MPUAT), Jhalarapatan, Jhalawar–326 023 (Raj)
Keywords : Chironjee, de cid u ous, dry sub trop ics, mi nor fruit.
Chironjee (Buchanania lanzan) is a com montree in dry de cid u ous for ests. It is en demic totrop i cal dry de cid u ous for est of In dia. In eng lishlan guage it is known as lit tle goose berry tree
(Janick and Paull, 3). It is also known as Cudappahal mond or almondette. Chironjee fruits arecon sid ered as one of the de li cious wild fruits. Itsseeds are ed ible and are re garded as sub sti tute foral mond nuts. These seeds, in many cases arerushed to gen er ate a pow der for fla vour ing or use as spice in many In dian dishes. Be sides, chironjeenuts are oc ca sion ally use ful to thicken sauces andstews. The ker nels have a pleas ant, sub acidicfla vour and are eaten raw or roasted. It is a highvalue mi nor fruit plant. How ever, it is yet con finedto the for est area as stray plan ta tion. The tribalscol lect chironjee fruits and sale them in lo calmar ket. For them it forms the back bone ofecon omy. In view of util ity and com mer cialde mand, the spe cies needs to bring un dercom mer cial farm ing.
Chironjee is re garded for its high value ker nel. It is a com mon sub sti tute of al mond amongst dryfruits. Its ker nel oil is use ful in cur ing glan du larswell ings of the neck. Chironjee paste is ex cel lentskin con di tioner. Be sides fruit, its bark finds uses in nat u ral var nish and is used for tan ning also. Gumexudates ob tained from tree trunk are used fordress ing tex tile. Gum is also use ful in treat ingdi ar rhoea, in ter cos tal and rheu matic pains. Leavesare used in the treat ment of skin dis eases. Fruits areused in treat ing cough and asthma. The leavespos sess cordiotonic prop er ties. Leaf pow der is acom mon cure for wounds. They con sti tute highclass feed for cat tle. The roots are ac rid, as trin gent,cool ing, depurative and con sti pat ing, and are use ful in treat ment of di ar rhoea. It is a good spe cies for
grow ing over bare hill slopes. The tree serves ashost of rear ing kusumi strain of lac.
Thus, chironjee has won der ful utilifariousat trib utes. In view of this, a de tail ac count ofchironjee cul ti va tion has been fur nished here un derto help fa vour its cul ti va tion be yond wildecosphere.
Chem i cal Com po si tion
Chironjee fruits as well as ker nel are verynu tri tious. Its fruits con tain 74.3 % mois ture, 2.2 %pro tein, 0.8 % fat, 1.5 % fi bre, 19.5 %car bo hy drate, 78 mg/100 g cal cium and 28 mg/100g phos pho rus. Its cal o rific value is 49 k-cal/100 g.Its ker nel con tains- mois ture 3 %, pro tein 19 %, fat59.1 %, car bo hy drate 12.1 %, min eral mat ter 3 %,fi bre 3.8 %, cal cium 279 mg /100 g, phos pho rus528 mg/100 g, iron 8.5 mg/ 100 g, thi a mine 0.69mg/100 g, ri bo fla vin 0.53 mg/100 g, ni a cin 1.5mg/100 g and vi ta min C 5 mg/100 g. The clorificvalue of ker nel is 650 k-cal/100g. The ker nel alsocon tains 34-47 % oil (Gopalan, 2).
Or i gin and Dis tri bu tion
Chironjee, orig i nated in the In diansub-con ti nent, is found grow ing nat u rally as wildstand in the trop i cal de cid u ous for ests of north,west ern and cen tral In dia mostly in the states ofMadhya Pradesh, Bihar, Orissa, Andhra Pradesh,Chhattisgarh, Jharkhand, Gujarat, Rajasthan andMaharashtra. This is found grow ing through outIn dia, Burma and Ne pal (Hemavathy andPrabhankar, 4). Its dis tri bu tion has been markedupto an el e va tion of 1200 m in sub trop ics and up to900 m in Sub-Hi ma la yas. Be sides In dia, the plantsare found dis trib uted in other trop i cal Asiancoun tries, Aus tra lia and pa cific is lands too. Aboutseven spe cies have been re ported from In dia ofwhich two yield ed ible fruits. It is a com mon
HortFlora Research Spectrum, 1(3): 375-379 (2012) ISSN : 2250-2823
Received : 18.4.2012 Accepted : 20.5.2012

as so ci ate of Sal (Shorea robusta), Teak (Tectonagrandis) Dhok/Kaldhi (Anogeissus pendula), Salai(Boswellia serrata) for ests and oc cu pies lower tomid dle can opy in dry de cid u ous for ests.
Tax on omy
Chironjee (Buchanania lanzan), be longs tofam ily Anacardiaceae, is a me dium-sizedde cid u ous tree, grow ing to about 50 ft tall. It bearsfruits each cotaining a sin gle seed, which is used asan ed ible nut. It has tickly leath ery leaves which are broadly ob long, with blunt tip and rounded base.Leaves have 10-20 pairs of straight, par al lel veins.The tree sheds its leaves for a very short pe rioddur ing May-June un der sub trop ics. Py ram i dalpan i cles of small bi sex ual green ish white flow ersap pear in aux il iary and ter mi nal pan i cles dur ingearly spring in Jan u ary-March. A sin gle pan i clebears about 3000 – 5000 flow ers. When buds startgrow ing ex ter nally, it takes about 18-28 days toanthesis. Fruit set is around 3 per cent. Fruits ripendur ing April and they con tinue to ripen till May. At rip en ing stage pericarp of fruits changes its col ourfrom green to dark tan. Fruits re main on the tree forquite lon ger. Fruits are drupe, ovoid or globose,black, 8-12 mm in di am e ter with hard stones.Un ripe fruit are green in col our.
Area and Pro duc tion
Chironjee is not cul ti vated as reg u larplan ta tion. It is found grow ing as stray plan ta tion in nat u ral hab i tat. How ever, its reg u lar plan ta tion isseen un der some bo tan i cal graden. Ex act sta tis ticsas re gard to area is not avail able. How ever, den sityof pop u la tion across var i ous for est range, gives anidea as re gard to plant stand and the pro duc tion. InLalitpur (U.P.) for est ranges the den sity ofChironjee plants re corded was 4.5 to 23.66 tree/ha.Tewari et al. (18) re ported rel a tively higher plantpop u la tion of Chironjee near wa ter sourses.Sim i larly, Prasad and Pandey (7) re ported a den sityof 4 to 23.66 tree/ha in teak dom i nant for est ofSeony (M.P.) and con cluded that the den sity ofplants was greatly in flu enced by its vi cin ity tohab i ta tion. Prasad and Bhatnagar (8) re ported that
in Madhya Pradesh and Chhattisgarh alone,Chironjee seeds to the tune of 1108 tonne/year were
col lected.
Soil and Cli mate
Chironjee is com monly grown in for est areamostly in eroded ra vine lands. It does n’t foundgrow ing in wa ter logged ar eas, but oc curs lo cally inclay soils. It pre fers soils which are neu tral inre ac tion and me dium to deep in depth. In its nat u ralhab i tat, it with stands ab so lute max i mum shadetem per a ture upto 45°C and min i mum 1°C. An nualpre cip i ta tion of 750 mm to 12150 mm suf fices theneed of crop. The plant pre fers dry sub-hu midcli mate. The plant is sus cep ti ble to frost in jury.
Spe cies and com mer cial va ri et ies
Seven spe cies of Buchanania have beenre ported in In dia of which two B. lanzan (Syn. B.latifolia) and B. axillaries (Syn. angustifolia)pro duce ed ible fruits. B. lanceolata is anen dan gered spe cies. It is found in the ev er greenfor ests of Kerala. B. platyneura is found inAndaman only. Other spe cies of the ge nus are B.lucida, B. glabra, B.accuminata. It is re ported thatthe fruits of B. platyneura are also ed ible. The B.exillaris are re ported to be dwarf in size andpro duces ex cel lent qual ity of ker nel.
Va ri ety
There is no iden ti fied cultivar of chironjee.At tempt is in prog ress to iden tify and re lease somehigh yield ing, dwarf and suit able se lec tions ofchironjee. As a part of im prove ment, col lec tion and eval u a tion, fif teen ge no types were eval u ated forvar i ous hor ti cul tural traits at Cen tral Hor ti cul turalEx per i ment Sta tion, Godhra (Gujarat) andCHESC-7 was found prom is ing. In this type, peakflow er ing was ob served dur ing first week ofFeb ru ary and fruit set was no ticed dur ing thirdweek of Feb ru ary. The fruit rip ened dur ing thirdweek of April.The fruit had 1.20 g fruit weight, 22% TSS, 13 % To tal sugar, 50 mg/ 100 g vi ta min C,0.12 g ker nel weight and 30.0 % ker nel pro tein(Singh et al., 12).
376 Chauhan et al.

Prop a ga tion
The tree is prop a gated from seeds whichre main en closed in side a hard shell. To get betterger mi na tion, the shell of the fruit should be cracked care fully .Fresh seeds give better ger mi na tion. Byus ing such seeds 70 % ger mi na tion has been
re ported (Srivastava, 14). Singh et al. (13) re portedthat one kg weight of chironjee con tains 4300-5300 seeds. The seeds have 55-65% germinability. Theseed is re cal ci trant in na ture and they lose vi a bil ity
soon even af ter 3 months of haresting. Fresh seeds give good ger mi na tion. Seed, ex posed to hot sun quickly lose vi a bil ity and ger mi na tion is low.Shukla and Solanki (9) re ported that 48-hour seedsoak ing in or di nary wa ter gave as high as 71 percent seed ger mi na tion, Me chan i cal break ing ofstony endocarp re sulted in 83 per cent ger mi na tion.How ever, me chan i cal break ing is time con sum ingand pos ses high risk of dam age to em bryo. Seed can be stored in air tight con tain ers upto one year.Choubey et al. (1) re ported best ger mi na tion with 1per cent HgCl treat ment.Veg e ta tive prop a ga tionthrough soft wood graft ing and chip bud ding issuc cess ful but rarely tried as no de mand of plantshas been gen er ated in want of com mer cialcul ti va tion.
Veg e ta tive prop a ga tion
Chironjee is hard to root. In a study, Singh etal. (11) re ported 67 per cent root ing in root cut tingsof Chironjee with 1600 ppm IAA treat ment. Bestroot ing was re ported from 1.5-3.5 mm thick roots.Air lay er ing and patch bud ding did n’t pro ducesuc cess ful re sults (Tewari and Bajpai, 15). Chipbud ding in the month of Au gust showed prom ise(Shukla et al., 10). Tewari et al. (19) re portedve neer graft ing suc cess ful for prop a gat ingchironjee in the month of Au gust -Sep tem ber.
Plant ing
Chironjee should be planted at a spac ing of8-10 metre. Seed lings tree may be planted at aspac ing of 10 x 10 m and those vege ta tivelyprpopagated ones at a spac ing of 8 x 8 m. Be foreplant ing the pit should re ceive 20 kg FYM, 300 g
super phos phate and 200 g muriate of pot ash.Plant ing on bar ren land leads to less sur vival ofplants (Prakash, 6; Tewari et al., 16).
Tree ar chi tec ture and Prun ing
Chironjee is not pruned reg u larly. It does n’ttol er ate the rig our of reg u lar prun ing. Whenpruned, gum ex u da tion starts. It fur ther re strictsprun ing. The spe cies is a mod er ate light de manderand hence does n’t re quire reg u lar prun ing.How ever, while prun ing dead, dam aged, dis easedand interlacerating branches should be re moved.The main stem of the plant should be main tainedfree of branches for about 60 cm from ground level. Above it 4-6 scaf fold branches scat tered in all fourdi rec tions are al lowed to grow.
Nutition and wa ter man age ment
There is need to stan dard ize nu tri tionalre quire ment of chironjee tree. How ever, Srivastava(14) ob served the use of 20-30 kg FYM and100-500 g urea ben e fi cial for the tree be foreflowerig stage. Af ter flow er ing stage the plantshould be fed with FYM 30 kg, N 400 g, P 400 gand K 600 g/plant. The plant is grown mostly asrainfed. How ever, for better growth reg u larir ri ga tion is re quired.
Har vest ing and Yield
The fruits of chironjee ma ture in 4- 5 months.They are har vested dur ing April- May. At the timeof maturiy fruits change their col our from green topur ple. Rip en ing starts from prox i mal end of fruit.As soon as one or two drupes change col our, thefruits are con sid ered ready to har vest. Man ualhar vest ing is done. The branches are shock to forcethe fruit to drop to col let the fruits. Fruit bear ingshoots (peduncle) is har vested with a sickleat tached to a long bam boo pole. If this is not donecare fully, there is dam age to the grow ing shoot ofplant and this is dam ag ing to chironjee.
Yield de pends upon growth of plant.Gen er ally, a full grown plant may pro duce 1.0 qfresh fruits with a bulk yield of 40 kg stones and 7-8 kg ker nels in a year. How ever, 3-4 kg ker nels per
Chironjee : A promising tree fruits of dry subtropics 377

plant per year is nor mally har vested (Tewari et al.,17). Chironjee has long ges ta tional pe riod. Ex actage of bear ing of Chironjee has yet not beenes tab lished. It is be lieved that it takes about 15-18years to come into bear ing.
Pro cess ing
Kumar et al. (5) has stan dard ized thetra di tional method for pro cess ing chironjee fruitsand ker nels. There are fol low ing three steps for itspro cess ing.
De-skin ning
The har vested nuts are soaked over night inwa ter. They are then rubbed with palm and withjute sack for large scale procesing. The wa tercon tain ing fine skin is de canted. To get clean nuts,they are washed in clean wa ter. The clean nuts aredried in sun for 2-3 days and stored for shell ing.
Shell ing
It is the pro cess of sep a rat ing ker nel fromhull. For small scale pro cess ing, the dried nuts arerubbed us ing stone slab on a rough stone sur face.The ker nels are then man u ally sep a rated. How ever,for large scale shell ing hor i zon tal stone un derrun ner or burr mill is used. The im pact and arasiveforces sep a rate coat from ker nel and split theker nel.
Grad ing
This is done to sep a rate ker nels from hullsand also to sep a rate ker nels of dif fer ent sizes. Theshelled or splitted keranels are passed through agrader. The grad ers are fit ted with three os cil lat ingscreens of var i ous sizes. The grader sep a rates thepro duce as per its open ing size.
REF ER ENCES
1. Choubey, Archana, Prasad, Ram, Choubey, O.P. and Pant, N.C. (1997). Some as pects ofger mi na tion stud ies in Buchanania lanzanSpreng. Seeds, J. Trop. For estry., 13 (11) :65-73.
2. Gopalan, C., Ramashastri, B.V., and
Balasubramaniam, S.C. (1982). Re port.
Na tional In sti tute of Nu tri tion, Hyderabad.
3. Janick, Jules and Rober, E. Paull (2006). The
En cy clo pe dia of fruits and nuts. CABI, UK, pp.
14-15
4. Hemavathy, J. and Prabhankar, J. V. (1988).
Lipid com po si tion of Chironjee ker nel. J. Food
Com pos. and Anal., 1 : 366-370.
5. Kumar, J., Vengaiah, P.C., Srivastav, P.P. and
Bhowmick, P.K. (2012). Chironji nut
(Buchanania lanzan) pro cess ing, pres ent
prac tices and scope. I. J. Tradit. Knowl., pp.
202-204.
6. Prakash, Ram (1998). Plan ta tion and Nurs ery
Tech nique of Fruit Trees. In ter na tional Book
Dis tri bu tion, Dehradun, p. 245.
7. Prasad, R. and Pandey, R.K. (1992) An
ob ser va tion on plant di ver sity of Sal and Teak
for ests in re la tion to in ten sity of bi otic im pact of
var i ous dis tances from hab i ta tion in Madhya
Pradesh – A Case Study. J. Trop. For estry, 8 (1) :
62-82.
8. Prasad, R. and Bhatnagar, P. (1993) Non-wood
for est prod uct and the in dig e nous fringe-
dwell ers in Madhya Pradesh. J. Trop. For estry,
9 (3) : 188-195.
9. Shukla, S.K., Solanki, K.R., Kumar, R.V. and
Dwivedi, R.P. (1999). Stud ies on air lay er ing in
Buchanania lanzan (Chironji) and Basia
latifolia (Mahua). An nual Re port, NRCAF,
Jhansi, p. 47.
10. Shukla, S.K. and Solanki, K.R. (2000). Stud ies
on seed ger mi na tion, plant sur vival and growth
of Chironjee (Buchanania lanzan Spreng.).
J.Trop. For estry, 16 : 44-49.
11. Singh, Jagdish, Banerjee, S.K. and Fran cis,
Al fred (2002). Vegetaive prop a ga tion of
Buchanania lanzan Spreng. root cut tings.
In dian For ester, 128 (6) : 700-704.
12. Singh, S., Singh, A.K. and Lata, K (2010).
Ex ploi ta tion of underexploited crops in
pre ci sion hor ti cul ture. In: Sou ve nir, NSPFH,
Dec. 28-29, 2010 held at CHF, Jhalawar, P. 29
13. Singh Jitendra, Chauhan, P. S. and Kavita, A.
(2012). Mor phol ogy and fea tures of seeds of
dif fer ent spe cies of dry de cid u ous for est of
378 Chauhan et al.

Malwa pla teau re gion. In dian For ester,
Dehradun.
14. Srivastava, S.S. (1996). Chironjee, In : Dryland
fruit cul ture (in hindi), Cen tral Book House,
Raipur, Chhatisgarh, p. 271.
15. Tewari R.K. and Bajpai, C.K. (2001).
Prop a ga tion of Chironjee (Buchanania lanzan
Spreng.) by chip bud ding. Agrofor. News let ter,
13 (1&2) : 1-2.
16. Tewari, R.K., Bajpai, C.K. and Chauhan, S.P.S.
(2000). Tane ki Motai Va Vritan Ke Phalao Ke
Adhar Par Chiroji Mein Paudh Ropan Ki Doori
Ka Nirdharan (Hindi). Agrofor. News let ter, 12
(1) : 10.
17. Tewari, R.K., Shukla, S.K., Solanki, K.R.,
Bajpai, C.K. and Chauhan, S.P.S. (2001).
Per for mance of Chironjee (Buchanania lanzan
Spreng) in Bundelkhand tract. Range
Managem. and Agrofor., 22 (2) : 255-257.
18. Tewari, R.K., Solanki, K.R., Kumar, R.V. and
Dwivedi, R.P. (2001). Stud ies on mi nor fruits
suit able for agro forest ry sys tems in semi-arid
Re gions. An nual Re port, NRCAF, Jhansi, pp.
20-21.
19. Tewari, R.K., Kumar. R.V. and Dwivedi R.P.
(2002). Do mes ti ca tion and stan dard iza tion of
prop a ga tion tech niques of mi nor fruit plants.
An nual Re port, NRCAF, Jhansi, p.16.
Chironjee : A promising tree fruits of dry subtropics 379

Re search Note :
EF FECT OF AgNO3 AND 8-HQC ON VASE LIFE OF CUT ROSES
Satish Chand, Vijai Kumar¹ and Jitendra Kumar
De part ment of Hor ti cul ture, C.C.S. Uni ver sity Cam pus, Meerut-250 004
Deptt. of Hor ti cul ture, CSSS (PG) Col lege, Machhra, Meerut
Keywords: Cut Rose, 8-HQC, AgNO3, vase life.
Flow ers form an in te gral part of our richher i tage and cul ture as we have tra di tion inflori cul ture. In the last two de cade with chang inglife styles and rapid ur ban iza tion, flori cul ture hasas sumed a def i nite com mer cial sta tus in In dia. InIn dia roses are grown for cut flow ers, mak inges sen tial oil, rose wa ter and gulkand. First Red andGrand Gala both are the im por tant cultivars of cutrose. 8-hydroxy quinoline ci trate (8-HQC) is a veryim por tant and ef fec tive ger mi cide used in flo ralin dus try (Butt, 1). Thus, in cor po rat ing 8-HQCei ther in vase so lu tion or as pulse would re strict themi cro bial growth and sub se quent vas cu larblock age and thus pro mote wa ter up take.
But very lit tle work has been done to pro longthe vase life of cut roses and still lot needs to bedone. None of the work ers has sug gested clear-cutrec om men da tion about chem i cals and theircon cen tra tion for adop tion to the vase life of cutroses. Keep ing the above fact in view, anin ves ti ga tion was car ried out to study “ef fect ofAgNO3 and 8-HQC on vase life of cut roses” dur ing July 2010 in the lab o ra tory of De part ment ofHor ti cul ture, Ch. Charan Singh Uni ver sityCam pus, Meerut (U.P.) In dia.
The cut flow ers hav ing 42-44 cm stem lengthwere har vested in the morn ing be tween 7.00 am to8.00 am at tight bud stage, when only one or twopet als had un folded, with the help of a clean andsharp secateur. The cut flow ers were then broughtto the lab o ra tory in a bucket con tain ing fresh tapwa ter. The stem ends were then re-cut to uni formlength of 40 cm each and re tained only fourup per most leaves.
Af ter re cord ing the fresh weight of each cutstem in the lab o ra tory the cut flow ers were kept in
50 ppm and 100 ppm so lu tion of AgNO3 and 100ppm and 200 ppm 8-HQC un der am bi ent con di tionof 32 ± 2°C tem per a ture and 50-75% rel a tivehu mid ity. There were ten treat ments in all, eachcultivar hav ing four and two was of con trol,rep li cated thrice in com pletely ran dom ized de sign(CRD) and the flow ers taken per rep li ca tion werefour and fi nally the vase life and qual ity of cut roses were eval u ated in the test tubes con tain ing of 150ml hold ing so lu tion.
Vase life in days was counted from the timewhen the cut flow ers were kept in vase tillse nes cence. The end of use ful vase life orse nes cence symp toms was marked ei ther byap pear ance of bent neck, blu ing of pet als in case ofthe flow ers, wilt ing, black en ing or dry ing of outerpet als or open ing at cen tre petal drop and col ourfad ing etc.
The use of 8-HQC is well known in cutflow ers as it acts as an bactericides for im prov ingthe vase life of cut rose, while AgNO3 which acts as an anti eth yl ene also helps in en hanc ing the flowerdi am e ter and vase life of cut roses. Treat ment withAgNO3 (50ppm) and 8-HQC (200 ppm)sig nif i cantly in creased the fresh weight of flow ersover the con trol (dis tilled wa ter). Higher gain infresh weight was as so ci ated with lon ger vase life.Ini tial in cre ment of fresh weight un til 3rd day af terhar vest was also ob served by Shiva andBhattacharjee (4). Puls ing or hold ing so lu tionin creases the to tal starch con tent of the pet als overthe un treated con trol as starch con tent waspos i tively as so ci ated with vase life as ob tained byMariam et al. (3). So lu tion con tain ing 8-HQClim its the num ber of bac te ria in stems. Sim i larly,ef fect of AgNO3, which is also an antiethyleneagent, en hance the flower di am e ter and wa ter
HortFlora Research Spectrum, 1(4): 380-382 (2012) ISSN : 2250-2823
Received : 12.4.2012 Revised : 18.8.2012 Accepted : 29.8.2012

up take of cut rose cv. ‘First Red’ and cv. ‘GrandGala.’
Doorn et al. (2) re ported en hance ment in vaselife of cut roses blooms treated with AgNO3 and8-HQC. Fur ther ex per i ment con ducted on rose cv.‘First Red’ and ‘Grand Gala’ pres ents en hancedwa ter up take and flower di am e ter over con trol. Inthe ex per i ment vase life of cut flower un derdif fer ent treat ments was de ter mined in vase hold ing so lu tion i.e., 50 ppm, 100 ppm, AgNO3 and 100ppm, 200 ppm 8-HQC.
The cut rose cv. First Red showed themax i mum di am e ter at 100 ppm 8-HQC, while as incv. Grand Gala 100 ppm AgNO3 showed max i mumflower di am e ter on 3rd day in vase. The max i mumvase life of cut roses cv. First Red and Grand Galawas re corded in 8-HQC at 200 ppm and 100ppm.The above find ings shows that the chem i calre sponse of AgNO3 was best for in creas ing thefresh weight of cut flow ers, while as the max i mumvase life of cut flow ers were re corded when treatedwith 8-HQC which act as bacteriocide andim proves the flower di am e ter, wa ter up take andvase life of cut rose flow ers. How ever, thecom par i son or va ri etal dif fer ence was found to bebest in cv. First Red in com par i son to cv. GrandGala in terms of its fresh weight (g), flowerdi am e ter (cm) and vase life.
From the re sults ob tained (Table 1) it can becon cluded that hold ing the cut rose cv. First Redand cv. Grand Gala in the so lu tion of 8-HQC at 200ppm was most ef fec tive in pro mot ing the freshweight and wa ter up take cut rose of flow ers.
The cut rose cv. First Red and Grand Galatreated with AgNO3 and 8-HQC at 100 ppm and200 ppm in creased the flower di am e ter, how ever,the max i mum flower di am e ter was re corded in cv.First Red at 100 ppm 8-HQC, while in cv. GrandGala max i mum di am e ter was re corded at 100 ppmAgNO3. The keep ing qual ity of cut rose, treatedwith AgNO3 and 8-HQC chem i cals showed betterre sults at 100 ppm 8-HQC in which max i mum vaselife was ob tained in cv. First Red and in also in cv.
Effect of AgNO3 and 8-HQC on vase life of cut roses 381O
NgA fo tce ff
E :1 el ba
T3
.sesor tuc fo efil esav
no C
QH-8
dna
taer
T- st
nem
necn
oC
-m
pp( s
noit
art)
)g( e
gn
ahc t
hgie
w hser
Frete
mai
d rew
olF
no )
mc( 3
dry
ad es
av
ni
lm( e
kat
pu ret
aW
))s
ya
d( efil esa
V
th
gieW
hserF
ecnecse
nes tA
ala
G d
nar
Gtsri
F
deR
dn
arG
ala
G
3 n
odr
ni y
ad
esa
v
ecnecse
nes tA
.vc
.vc
vc.
vc.
vc.
vc.
tsriF
deR
dn
arG
ala
G
tsriF
deR
dn
arG
ala
G
tsriF
deR
dn
arG
ala
G
tsriF
deR
dn
arG
ala
G
tsriF
deR
dn
arG
ala
G
tsriF
deR
dn
arG
ala
G
ON
gA
3T(
05
1 )
17.
41
5.6
13
8.1
+2
7.1
+4
6.0 -
37.
0 -9
1.8
56.
64
5.0
10
6.9
71.
11
53.
01
07.
80
6.7
T( 0
01
2)
23.
41
17.
61
54.
1 +
92.
2 +
30.
1 -2
6.0 -
29.
73
9.6
72.
88
7.8
38.
91
55.
21
23.
86
3.7
CQ
H-8
T 0
01
35
0.2
19
2.3
15
7.2
+0
3.2
+4
6.0 -
80.
1 -8
5.8
26.
63
5.2
12
2.1
15
4.9
15
2.7
19
7.9
98.
7
T 0
02
41
6.3
19
2.3
15
5.3
+0
4.2
+9
6.0 -
12.
1 -4
2.8
28.
66
8.1
23
7.2
11
5.7
25
2.7
15
5.9
05.
7
lort
no
CT reta
W dellitsi
D5
54.
11
2.5
11
4.2
+0
1.2
+4
4.1 -
99.
0 -7
2.6
87.
57
7.9
58.
84
1.9
12
0.0
15
3.5
52.
4
)5
0.0
=P(
D.C
32
1.0
57
2.0
37
0.0
SN
04
0.0
33
0.0
14
0.0
16
0.0
15
1.0
24
0.0
47
2.0
79
0.0
68
1.0
69
0.0

382 Chand et al.
Grand Gala in com par i son to con trol confirming toresults of Son et al. (5).
Form the ex per i men tal find ings, it wasob served that cv. First Red has more vase life incom par i son to cv. Grand Gala. It is con cluded fromin ves ti ga tion that 8-HQC en hances the freshweight, flower di am e ter, wa ter up take and vase life
of cut roses at 100 ppm and 200 ppm.
REF ER ENCES
1. Butt, S. J. (2005). Ex tend ing the vase life of
roses (Rosa hybrida) with dif fer ent
pre ser va tives. In ter na tional J. Agri. and Biol., 1
(7): 97-99.
2. Doorn, W.G., Van, Schurer, K. and Witte, Y., De
(1989). Role of en dog e nous becteria in vas cu lar
block age of cut rose flow ers. J. Plant Phys i ol .,
134 (3) : 375-381.
3. Mariam Mwangi, Chattergee, S.R.
Bhattacharjee S.K. and Mwangi, M. (2003).
Ef fects of precooling and puls ing on the
bio chem i cal changes dur ing se nes cence in
‘Gloden Gate’ cut rose pet als. In dian J. Hort., 60
(4) : 394-398.
4. Shiva, K.N. and Bhattacharjee, S.K. (2003).
Ef fect of chem i cal pre ser va tives on vase life of
cut rose. South In dian Hort., 51 (1/6) : 232-236.
5. Son, K.C., H.J. Byoun and Yoo, M.H. (2003)
Effect of pulsing with AgNO3 or STS on the
absorption and distribution of silver nitrate and
the vase life of cut rose ‘Red Sandra’. Acta
Hort., 624: 365-365.

Re search Note :
MOR PHO LOG I CAL MARK ERS FOR IDEN TI FI CA TION OF Populus
deltoides CLONES IN NURS ERY
Manoj Kumar Singh
De part ment of Ge net ics and Plant Breed ing, T.D.P.G. Col lege, Jaunpur
E-mail: [email protected]
Keywords: Populus deltoides, clone, mor pho log i cal marker.
Pop lar (Populus deltoides) is a multiutilitywood pro duc ing tree spe cies and has been widelyadopted un der agro-for estry sys tems be cause of itsfast growth, straight and clean bole and de cid u ousna ture. Many ge net i cally im proved pop lar cloneshave been de vel oped for grow ing in North-West ern part of In dia. How ever, there is prob lem todis tin guish these clones phenotypically be cause ofnar row ge netic base of par ents in breed ingpop u la tion and their mul ti pli ca tion. This prob lemof iden ti fi ca tion for pu rity of plant ing stockbe comes more im mense for a grower when hewishes to plant a spe cific clone. To over come theprob lem an endeavour was taken to es tab lishmor pho log i cal marker for iden ti fi ca tion of tenwidely grown clones of pop lar.
Ten pop lar clones namely G3, G48, S7C1,S7C4, S7C8, S7C20, L34, PP5, Fierelo and D121were planted in nurs ery block of Agro forest ryRe search Cen tre, Govind Ballabh Pant Uni ver sityof Ag ri cul ture and Tech nol ogy, Pantnagar, in aran dom ised block de sign with three rep li ca tions.Each rep li ca tion con tained two row of each clone at 80 cm apart and each row had ten plants at 60cmdis tance. Ob ser va tions were re corded forqual i ta tive (leaf shape, leaf pigmentation, leafserration, leaf tip type, ridge line, ridge shape) andquan ti ta tive (bud length, bud diameter, number ofbuds and internodal length) traits. Qual i ta tivechar ac ters : leaf shape was re corded on the ba sis ofcurve in leaf lamina and at tach ment of pet i ole onscale ‘A’-deep curve and ‘B’-light curve. Leafpig men ta tion was noted on scale ‘A’ (pig men ta tionon pet i ole and midrib), ‘B’ (pig men ta tion on pet i ole at the point of at tach ment of leaf lamina) and ‘C’
(no pig men ta tion). Leaf ser ra tion stud ied on scale‘A’ (full ser ra tion) and ‘B’ (par tial ser ra tion). Leaftip type was ob served on scale ‘A’-long tip and‘B’-small tip. Ridge line (bulg ing and length) wasre corded on scale very prom i nent prom i nent andless prom i nent. Ridge shape on the stem wasob served on scale ‘A’-big ridge and ‘B’-smallridge. Quan ti ta tive char ac ters namely bud length(mm), bud di am e ter (mm), num ber of buds in onemetre length at mid dle of stem and internodal length (cm) were re corded on five com pet i tiveplants in each rep li ca tion and av er aged.
Re sults on com par i son of var i ousmor pho log i cal char ac ters in ten prom i nent clonesare pres ented in Ta ble 1. Clone G3, S7C4, S7C8,L34 and D121 were showed sim i lar kind of leafshape ‘B’ while clones G48, S7C1, S7C20, PP5 and Fierelo showed ‘A’ type leaf shape. Clone S7C8and G3 had type ‘A’ and ‘B’ pig men ta tion,re spec tively, other clones showed no pig men ta tion.All stud ied clones showed sim i lar kind of leafser ra tion. A type of leaf tip was ob served in cloneG3, S7C4, S7C8, S7C20, L34 and PP5 while ‘B’type leaf tip was found in G48, S7C1, Fierelo andD121. Bud length ranged from 3.12 mm (Fierelo) to 3.80 mm (S7C4) and bud di am e ter var ied from2.95 mm (G48) to 4.08 mm (G3). Max i mumnum ber of buds per me tre stem length wereob served in G48 and S7C20 while min i mum budswere counted in D121. Sim i lar fash ion of ridgeshape was ob served in all the clones. Veryprom i nent ridge was found in clone S7C4 whileother clones have prom i nent ridge. Internodallength ranged from 3.38 cm in clone S7C1 to 4.25cm in clone L34. Sim i larly Sidhu et al. (2) ob served sig nif i cant mor pho log i cal dif fer ences for
HortFlora Research Spectrum, 1(4): 383-384 (2012) ISSN : 2250-2823
Received : 31.8.2012 Accepted : 27.9.2012

384 Singh
intermodal length, branch an gle, lenticels den sitylength of ridges, leaf length and width and pet i olelength among seven clones. Ge netic dif fer ences forleaf char ac ter is tics were also ob served by Guzina(1). Mor pho log i cal and phenological de scrip tion ofpop lar clones based on 64 char ac ters of young toadult tree was given by UPOV (3).
REF ER ENCES
1. Guzina, V. (1998). Eval u a tion of ge netic
vari abil ity of pop lars us ing poly mor phism of
isozymes and leaf size and shape pa ram e ters.
Topola, 153-154:35-40.
2. Sidhu, D.S., Kaur, S. and Dhanda, R.S. (1999).
Iden ti fi ca tion of Populus deltoides clones :
Phenotypic vari a tion in nurs ery. In Na tional
Sem i nar on Pop lar, 25-27 Nov., FRI, Dehradun.
P-34.
3. UPOV (1981). Guidelines for the conduct of
test for distinctness, homogeneity and stability
in Populus L. International Union for the
Protection of New Varieties of Plants. Geneva,
Switzerland.
Ta ble 1: Mor pho log i cal marker on the ba sis of leaf and stem char ac ter is tics of Populus deltoides in nurs ery.
Clone
Traits
G3 G48 S7C1 S7C4 S7C8 S7C20 L34 PP5 Fierelo D121
Leaf shape B A A B B A B A A B
Leaf pigmentation B C C C A C C C B C
Leaf serration A A A A A A A A A A
Leaf tip A B B A A A A A B B
Bud length (mm) 3.25 3.16 3.50 3.80 3.77 3.65 3.15 3.20 3.12 3.61
Bud diameter (mm) 4.08 2.91 3.85 3.95 4.06 4.05 3.50 3.45 3.38 3.94
No.of buds in 1 mstem at middle
21.40 22 21 23 20 22 21 18 20 17
Ridge shape same same same same same same same same same same
Ridge line Prom-inent
Prom-inent
VeryProm-inent
Prom-
inent
Prom-inent
Prom-
inent
Prom-inent
Prom-inent
Prom-inent
Prom-inent
Internodal Length (cm)
3.75 4.20 3.38 3.89 4.02 3.80 4.25 3.80 3.81 3.50

