4 individual-level prevention services (body section
TRANSCRIPT
794 Individual-level prevention services
4 i n d i v i d u a l - l e v e l P r e v e n t i o n s e r v i c e s
BackgroundAs the term suggests, individual-level prevention services and interventions are designed to result in changes to risk behaviour or biomedical risk factors directly in individuals. This is usually accomplished by the more traditional health service (that is, patient–doctor) approach rather than the policy and/or legislative approaches used for population-level prevention services. Individual-level prevention services can be monitored by counting the number of individuals receiving a particular service. However, there has been little direct monitoring of the prevention services that people have received.
Services that need to be monitored for individual-level prevention include GP services, community-based programs, medications and surgery. To determine in detail what requires monitoring in this area, relevant services were classified against two dimensions: the service or setting and the method (Table 4.1). The relevant services and settings are general practices, allied health (including pharmacies), private health insurance funds and hospitals. An ‘other’ category is included as there may also be other settings where prevention activities occur, such as in specialist practices and outpatient departments in hospitals; these are likely to be less relevant to the prevention of risk factors, but will be important for prevention of diseases and their complications. The main methods identified as important for individual-level services aimed at preventing risk factors are opportunistic screening (‘case-finding’) and health checks, lifestyle advice and education, referral, medications and surgery.
The main areas where information would have been useful for this report are detailed in the table. However, there are no readily available data sources for some of these, and limitations with some of the data sources that were available. The shaded sections are areas where some information has been able to be included in this chapter. There are also many other individual-level services for which data could not be included, mainly because no data were readily available, such as quit smoking, weight loss and healthy living programs. The two specialised treatment areas relevant to the risk factors in this report are for depression and excess alcohol use. As these are ‘diseases’ in their own right, most of the relevant services have not been included in this report. It is important to note, however, that there are a significant number of services in these areas. These are detailed in Mental health services in Australia 2005–06 (AIHW 2008g) and Alcohol and other drug treatment services in Australia 2006–07 (AIHW 2008b).

80 Prevention of cardiovascular disease, diabetes and chronic kidney disease
Table 4.1: Classification of individual-level services where monitoring is required
Methods
Service/setting
GP/primary care practices Allied health
Private health insurance funds
Hospitals: admitted patients Other
Opportunistic screening, health checks
For risk factors(section 1)
Community/health checks e.g. in workplaces
Lifestyle advice, education
For risk factors(section 2)
From dietitians, pharmacies etc.
To members Through formal programs e.g. QUITTo pregnant
women (re. low birthweight)
Referral To specialistsand others (section 2)
Treatment methods
• medications Prescribed totreat risk factors(section 3)
Dispensed(section 3)
Prescribed and dispensed
• surgery For obesity (section 4)
• specialised services
For depressionFor alcohol dependence
For depression For depressionFor alcohol dependence
For depressionFor alcohol dependence
Source: Categories adapted from Jorm et al. 2009.
This chapter provides national-level information about services provided to individuals in health care settings that are aimed at preventing risk factors for CVD, diabetes and CKD in people who do not have them, and improving or removing them in people who do have them. There are also current initiatives to encourage GPs and other health professionals to increase their focus on identifying and treating risk factors. These include programs and audits run by the National Prescribing Service (National Prescribing Service 2009) and the Australian Primary Care Collaboratives (Australian Primary Care Collaboratives 2009).
Health checks in primary careThrough Medicare, the Australian Government subsidises a range of health assessments that include components aimed at, either specifically or broadly, the prevention of risk factors associated with CVD, diabetes and CKD. This section provides information and statistics about these Medicare Benefits Schedule (MBS) health assessments (items 700, 702, 704, 706, 708, 709, 710, 711, 712, 713, 714, 716, 717, 718 and 719). Where possible, the MBS items are described in order of the life stage to which they relate. In total, there were 576,139 of these MBS health assessments provided in 2008–09.
814 Individual-level prevention services
Medicare Benefits Schedule health checks
Aboriginal and Torres Strait Islander Child Health Check
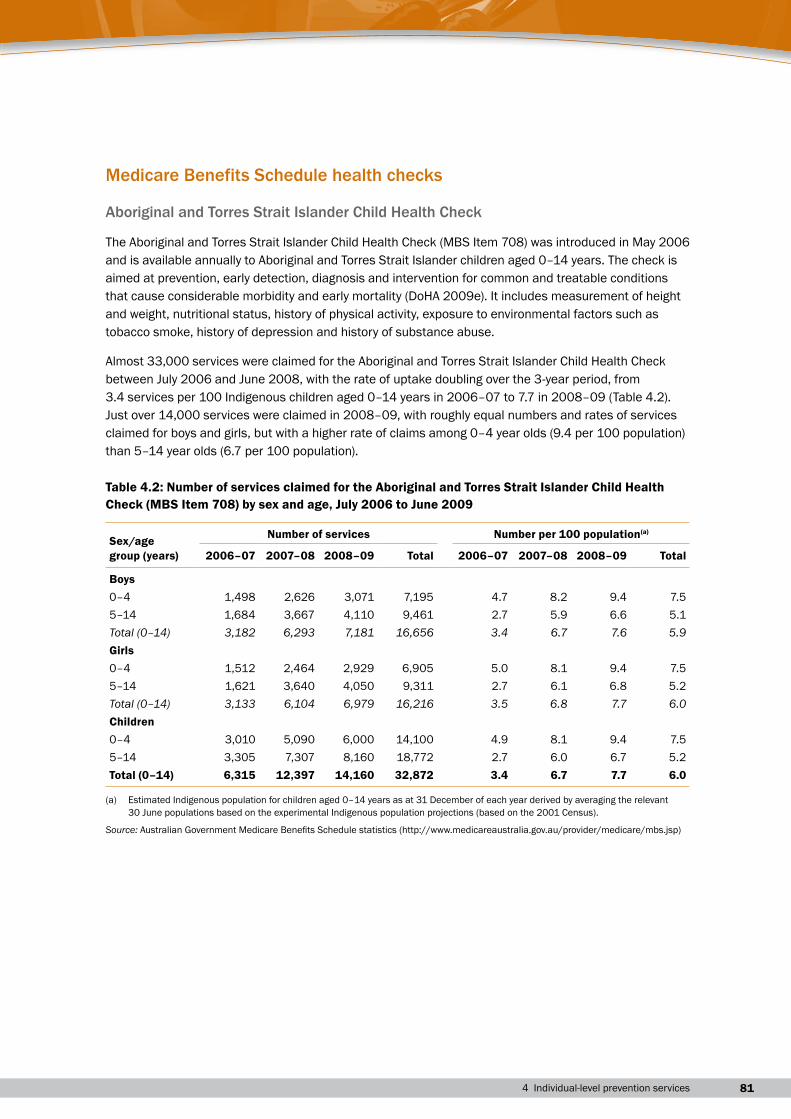
The Aboriginal and Torres Strait Islander Child Health Check (MBS Item 708) was introduced in May 2006 and is available annually to Aboriginal and Torres Strait Islander children aged 0–14 years. The check is aimed at prevention, early detection, diagnosis and intervention for common and treatable conditions that cause considerable morbidity and early mortality (DoHA 2009e). It includes measurement of height and weight, nutritional status, history of physical activity, exposure to environmental factors such as tobacco smoke, history of depression and history of substance abuse.
Almost 33,000 services were claimed for the Aboriginal and Torres Strait Islander Child Health Check between July 2006 and June 2008, with the rate of uptake doubling over the 3-year period, from 3.4 services per 100 Indigenous children aged 0–14 years in 2006–07 to 7.7 in 2008–09 (Table 4.2). Just over 14,000 services were claimed in 2008–09, with roughly equal numbers and rates of services claimed for boys and girls, but with a higher rate of claims among 0–4 year olds (9.4 per 100 population) than 5–14 year olds (6.7 per 100 population).
Table 4.2: Number of services claimed for the Aboriginal and Torres Strait Islander Child Health Check (MBS Item 708) by sex and age, July 2006 to June 2009
Sex/age group (years)
Number of services Number per 100 population(a)
2006–07 2007–08 2008–09 Total 2006–07 2007–08 2008–09 Total
Boys0–4 1,498 2,626 3,071 7,195 4.7 8.2 9.4 7.55–14 1,684 3,667 4,110 9,461 2.7 5.9 6.6 5.1Total (0–14) 3,182 6,293 7,181 16,656 3.4 6.7 7.6 5.9Girls0–4 1,512 2,464 2,929 6,905 5.0 8.1 9.4 7.55–14 1,621 3,640 4,050 9,311 2.7 6.1 6.8 5.2Total (0–14) 3,133 6,104 6,979 16,216 3.5 6.8 7.7 6.0Children0–4 3,010 5,090 6,000 14,100 4.9 8.1 9.4 7.55–14 3,305 7,307 8,160 18,772 2.7 6.0 6.7 5.2Total (0–14) 6,315 12,397 14,160 32,872 3.4 6.7 7.7 6.0
(a) Estimated Indigenous population for children aged 0–14 years as at 31 December of each year derived by averaging the relevant 30 June populations based on the experimental Indigenous population projections (based on the 2001 Census).
Source: Australian Government Medicare Benefits Schedule statistics (http://www.medicareaustralia.gov.au/provider/medicare/mbs.jsp)
82 Prevention of cardiovascular disease, diabetes and chronic kidney disease
Healthy Kids Check
The Healthy Kids Check (MBS items 709 and 711) was introduced on 1 July 2008. It aims to ensure that all 4-year old children in Australia have a basic health check before they start school; promote the early detection of lifestyle risk factors, delayed development and illness; and introduce guidance for healthy lifestyles and early intervention strategies (DoHA 2008e).
Children aged 3–5 years who are permanent residents of Australia or who are covered by a Reciprocal Health Care Agreement are eligible for the Healthy Kids Check. The health assessment includes the following components:
• the collection of information about family and environmental factors, medical and social history, and lifestyle risk factors
• an assessment of the patient’s health, based on the patient’s history, examinations and the results of any investigations
• referral or follow-up of any problems where appropriate
• provision of health advice and information to the patient’s parent or guardian, using the Department of Health and Ageing’s Get set 4 life—habits for healthy kids (DoHA 2008d) and other relevant information such as a parent-held child health record.
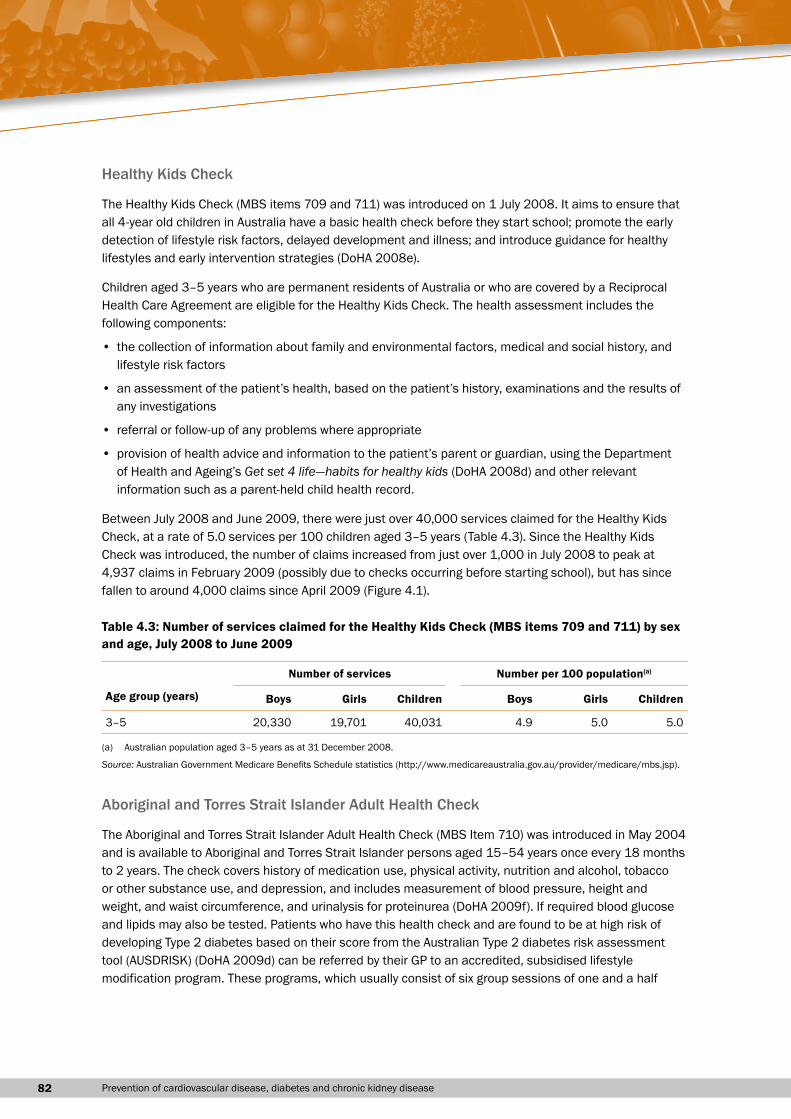
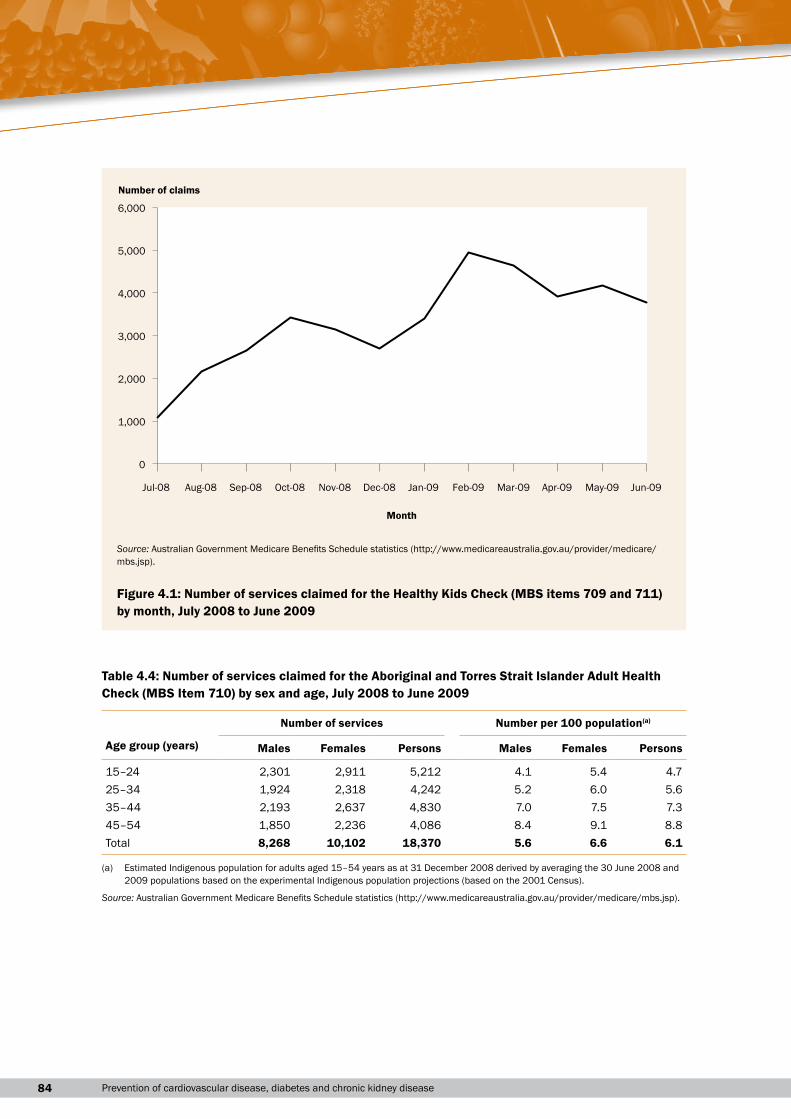
Between July 2008 and June 2009, there were just over 40,000 services claimed for the Healthy Kids Check, at a rate of 5.0 services per 100 children aged 3–5 years (Table 4.3). Since the Healthy Kids Check was introduced, the number of claims increased from just over 1,000 in July 2008 to peak at 4,937 claims in February 2009 (possibly due to checks occurring before starting school), but has since fallen to around 4,000 claims since April 2009 (Figure 4.1).
Table 4.3: Number of services claimed for the Healthy Kids Check (MBS items 709 and 711) by sex and age, July 2008 to June 2009
Number of services Number per 100 population(a)
Age group (years) Boys Girls Children Boys Girls Children
3–5 20,330 19,701 40,031 4.9 5.0 5.0
(a) Australian population aged 3–5 years as at 31 December 2008.
Source: Australian Government Medicare Benefits Schedule statistics (http://www.medicareaustralia.gov.au/provider/medicare/mbs.jsp).
Aboriginal and Torres Strait Islander Adult Health Check
The Aboriginal and Torres Strait Islander Adult Health Check (MBS Item 710) was introduced in May 2004 and is available to Aboriginal and Torres Strait Islander persons aged 15–54 years once every 18 months to 2 years. The check covers history of medication use, physical activity, nutrition and alcohol, tobacco or other substance use, and depression, and includes measurement of blood pressure, height and weight, and waist circumference, and urinalysis for proteinurea (DoHA 2009f). If required blood glucose and lipids may also be tested. Patients who have this health check and are found to be at high risk of developing Type 2 diabetes based on their score from the Australian Type 2 diabetes risk assessment tool (AUSDRISK) (DoHA 2009d) can be referred by their GP to an accredited, subsidised lifestyle modification program. These programs, which usually consist of six group sessions of one and a half
834 Individual-level prevention services
hours each with a maximum of 15 people in each session, provide information designed to help patients to undertake sustained lifestyle and behaviour change to reduce their risk of developing Type 2 diabetes (DoHA 2008j).
The AUSDRISK (DoHA 2009d) consists of a short list of questions that, when completed, provide a guide to a patient’s current level of risk of developing Type 2 diabetes over the next five 5 years (Box 4.1). Risk categories based on the AUSDRISK score are low risk (≤ 5)), intermediate risk (6–14) and high risk (≥ 15). More detail on the AUSDRISK is contained in the following section.
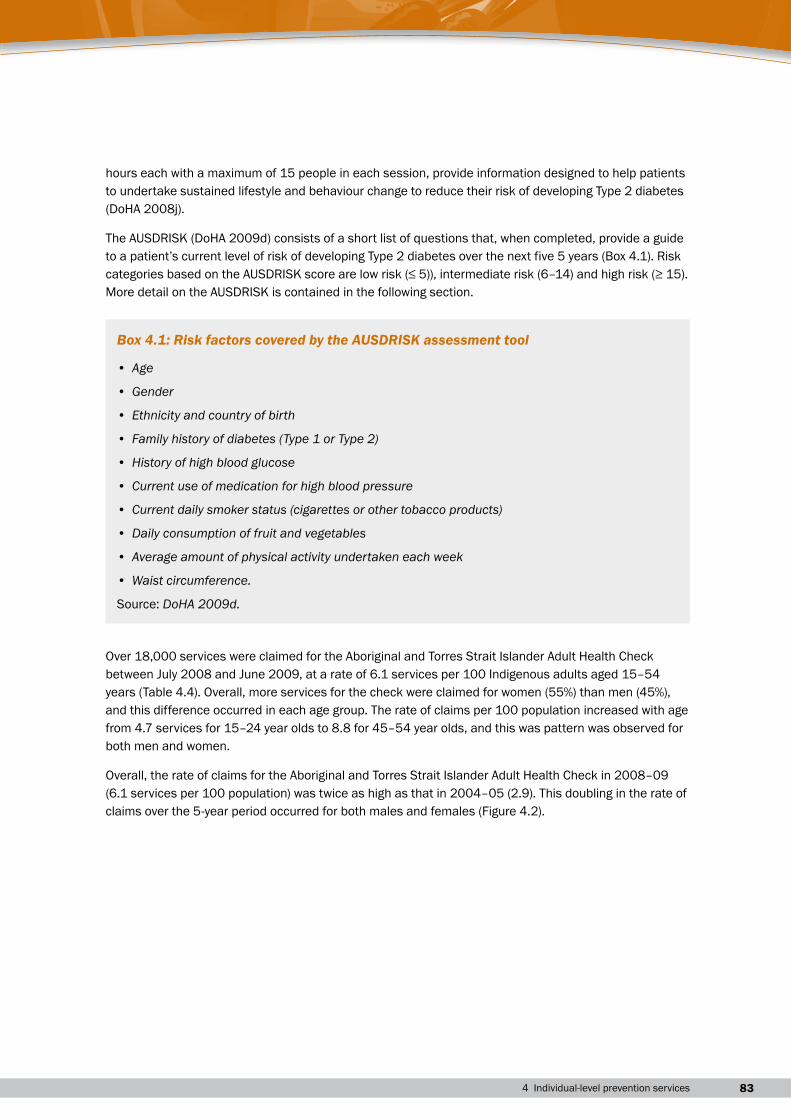
Box 4.1: risk factors covered by the ausdrisk assessment tool
• Age
• Gender
• Ethnicity and country of birth
• Family history of diabetes (Type 1 or Type 2)
• History of high blood glucose
• Current use of medication for high blood pressure
• Current daily smoker status (cigarettes or other tobacco products)
• Daily consumption of fruit and vegetables
• Average amount of physical activity undertaken each week
• Waist circumference.
Source: DoHA 2009d.
Over 18,000 services were claimed for the Aboriginal and Torres Strait Islander Adult Health Check between July 2008 and June 2009, at a rate of 6.1 services per 100 Indigenous adults aged 15–54 years (Table 4.4). Overall, more services for the check were claimed for women (55%) than men (45%), and this difference occurred in each age group. The rate of claims per 100 population increased with age from 4.7 services for 15–24 year olds to 8.8 for 45–54 year olds, and this was pattern was observed for both men and women.
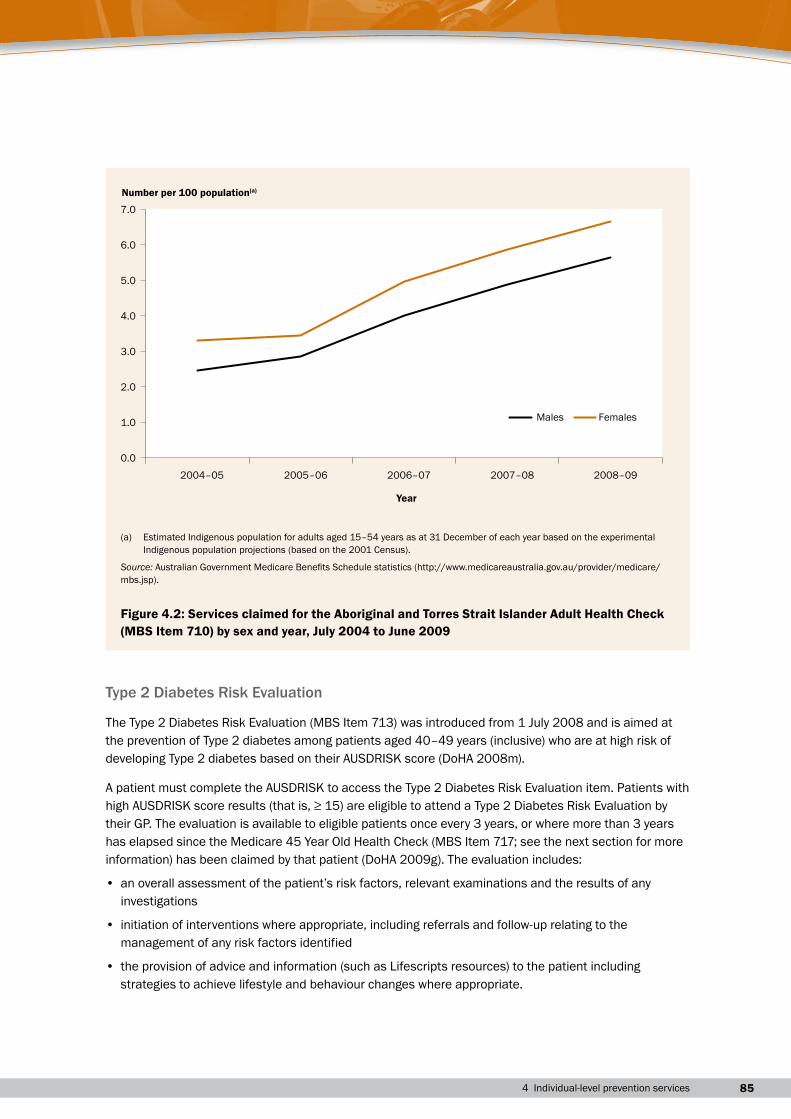
Overall, the rate of claims for the Aboriginal and Torres Strait Islander Adult Health Check in 2008–09 (6.1 services per 100 population) was twice as high as that in 2004–05 (2.9). This doubling in the rate of claims over the 5-year period occurred for both males and females (Figure 4.2).
84 Prevention of cardiovascular disease, diabetes and chronic kidney disease
Table 4.4: Number of services claimed for the Aboriginal and Torres Strait Islander Adult Health Check (MBS Item 710) by sex and age, July 2008 to June 2009
Number of services Number per 100 population(a)
Age group (years) Males Females Persons Males Females Persons
15–24 2,301 2,911 5,212 4.1 5.4 4.725–34 1,924 2,318 4,242 5.2 6.0 5.635–44 2,193 2,637 4,830 7.0 7.5 7.345–54 1,850 2,236 4,086 8.4 9.1 8.8Total 8,268 10,102 18,370 5.6 6.6 6.1
(a) Estimated Indigenous population for adults aged 15–54 years as at 31 December 2008 derived by averaging the 30 June 2008 and 2009 populations based on the experimental Indigenous population projections (based on the 2001 Census).
Source: Australian Government Medicare Benefits Schedule statistics (http://www.medicareaustralia.gov.au/provider/medicare/mbs.jsp).
0
1,000
2,000
3,000
4,000
5,000
6,000
Jul-08 Aug-08 Sep-08 Oct-08 Nov-08 Dec-08 Jan-09 Feb-09 Mar-09 Apr-09 May-09 Jun-09
Month
Number of claims
Source: Australian Government Medicare Benefits Schedule statistics (http://www.medicareaustralia.gov.au/provider/medicare/mbs.jsp).
Figure 4.1: Number of services claimed for the Healthy Kids Check (MBS items 709 and 711) by month, July 2008 to June 2009
854 Individual-level prevention services
Type 2 Diabetes Risk Evaluation
The Type 2 Diabetes Risk Evaluation (MBS Item 713) was introduced from 1 July 2008 and is aimed at the prevention of Type 2 diabetes among patients aged 40–49 years (inclusive) who are at high risk of developing Type 2 diabetes based on their AUSDRISK score (DoHA 2008m).
A patient must complete the AUSDRISK to access the Type 2 Diabetes Risk Evaluation item. Patients with high AUSDRISK score results (that is, ≥ 15) are eligible to attend a Type 2 Diabetes Risk Evaluation by their GP. The evaluation is available to eligible patients once every 3 years, or where more than 3 years has elapsed since the Medicare 45 Year Old Health Check (MBS Item 717; see the next section for more information) has been claimed by that patient (DoHA 2009g). The evaluation includes:
• an overall assessment of the patient’s risk factors, relevant examinations and the results of any investigations
• initiation of interventions where appropriate, including referrals and follow-up relating to the management of any risk factors identified
• the provision of advice and information (such as Lifescripts resources) to the patient including strategies to achieve lifestyle and behaviour changes where appropriate.
0.0
1.0
2.0
3.0
4.0
5.0
6.0
7.0
2004–05 2005–06 2006–07 2007–08 2008–09
Year
Number per 100 population(a)
Males Females
(a) Estimated Indigenous population for adults aged 15–54 years as at 31 December of each year based on the experimental Indigenous population projections (based on the 2001 Census).
Source: Australian Government Medicare Benefits Schedule statistics (http://www.medicareaustralia.gov.au/provider/medicare/mbs.jsp).
Figure 4.2: Services claimed for the Aboriginal and Torres Strait Islander Adult Health Check (MBS Item 710) by sex and year, July 2004 to June 2009
86 Prevention of cardiovascular disease, diabetes and chronic kidney disease
If appropriate, patients who have the Type 2 Diabetes Risk Evaluation may also be referred by their GP to an accredited, subsidised lifestyle modification program.
Patients with newly diagnosed or existing diabetes are not eligible to access the Type 2 Diabetes Risk Evaluation item.
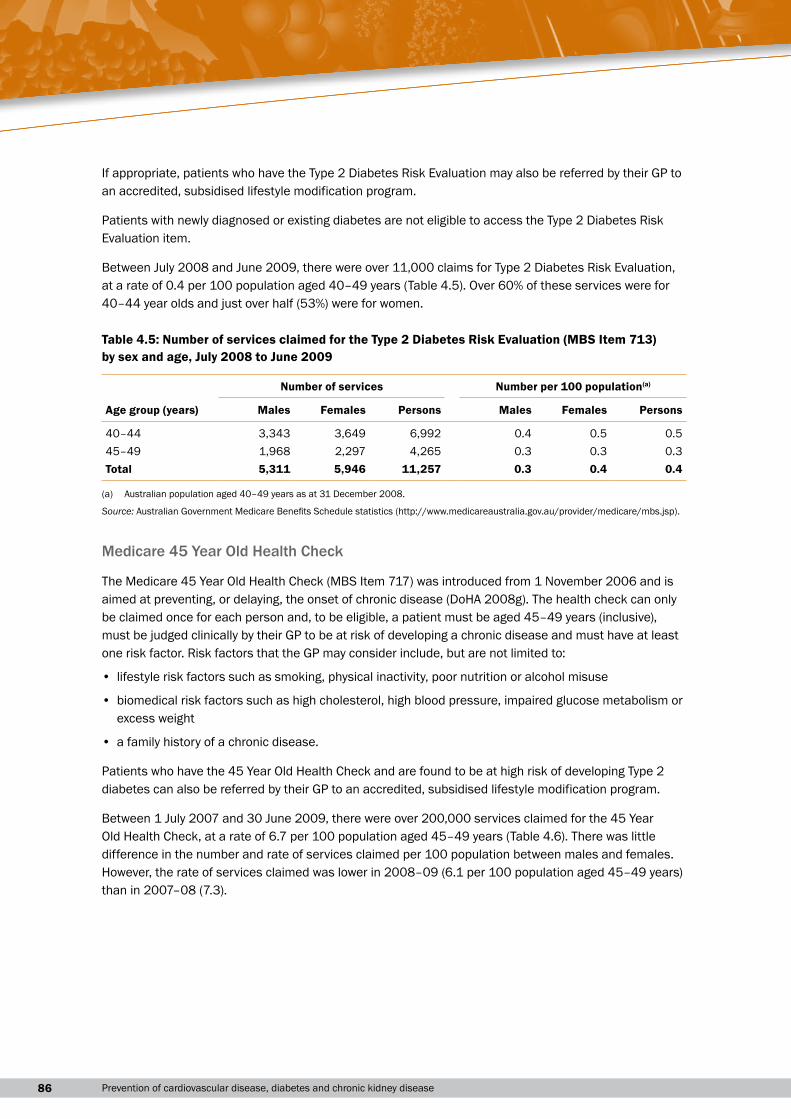
Between July 2008 and June 2009, there were over 11,000 claims for Type 2 Diabetes Risk Evaluation, at a rate of 0.4 per 100 population aged 40–49 years (Table 4.5). Over 60% of these services were for 40–44 year olds and just over half (53%) were for women.
Table 4.5: Number of services claimed for the Type 2 Diabetes Risk Evaluation (MBS Item 713) by sex and age, July 2008 to June 2009
Number of services Number per 100 population(a)
Age group (years) Males Females Persons Males Females Persons
40–44 3,343 3,649 6,992 0.4 0.5 0.545–49 1,968 2,297 4,265 0.3 0.3 0.3Total 5,311 5,946 11,257 0.3 0.4 0.4
(a) Australian population aged 40–49 years as at 31 December 2008.
Source: Australian Government Medicare Benefits Schedule statistics (http://www.medicareaustralia.gov.au/provider/medicare/mbs.jsp).
Medicare 45 Year Old Health Check
The Medicare 45 Year Old Health Check (MBS Item 717) was introduced from 1 November 2006 and is aimed at preventing, or delaying, the onset of chronic disease (DoHA 2008g). The health check can only be claimed once for each person and, to be eligible, a patient must be aged 45–49 years (inclusive), must be judged clinically by their GP to be at risk of developing a chronic disease and must have at least one risk factor. Risk factors that the GP may consider include, but are not limited to:
• lifestyle risk factors such as smoking, physical inactivity, poor nutrition or alcohol misuse
• biomedical risk factors such as high cholesterol, high blood pressure, impaired glucose metabolism or excess weight
• a family history of a chronic disease.
Patients who have the 45 Year Old Health Check and are found to be at high risk of developing Type 2 diabetes can also be referred by their GP to an accredited, subsidised lifestyle modification program.
Between 1 July 2007 and 30 June 2009, there were over 200,000 services claimed for the 45 Year Old Health Check, at a rate of 6.7 per 100 population aged 45–49 years (Table 4.6). There was little difference in the number and rate of services claimed per 100 population between males and females. However, the rate of services claimed was lower in 2008–09 (6.1 per 100 population aged 45–49 years) than in 2007–08 (7.3).
874 Individual-level prevention services
Table 4.6: Number of services claimed for the 45 Year Old Health Check (MBS Item 717) by sex and year, 45–49 year olds, July 2007 to June 2009
Number of services Number per 100 population(a)
Year Males Females Persons Males Females Persons
2007–08 56,163 55,421 111,584 7.4 7.1 7.32008–09 48,161 47,668 95,829 6.2 6.1 6.1Total 104,324 103,089 207,413 6.8 6.6 6.7
(a) Australian population aged 45–49 years as at 31 December 2008.
Source: Australian Government Medicare Benefits Schedule statistics (http://www.medicareaustralia.gov.au/provider/medicare/mbs.jsp).
Comprehensive Medical Assessment for Aged Care Residents
The Comprehensive Medical Assessment for Aged Care Residents (MBS Item 712) was introduced in July 2004 and is available to permanent residents of a residential aged care facility, regardless of age (DoHA 2008a). The assessments may include assessment of nutritional status, smoking and alcohol use, and cardiovascular risk factors. A Medicare rebate for this item can only be claimed once a year.
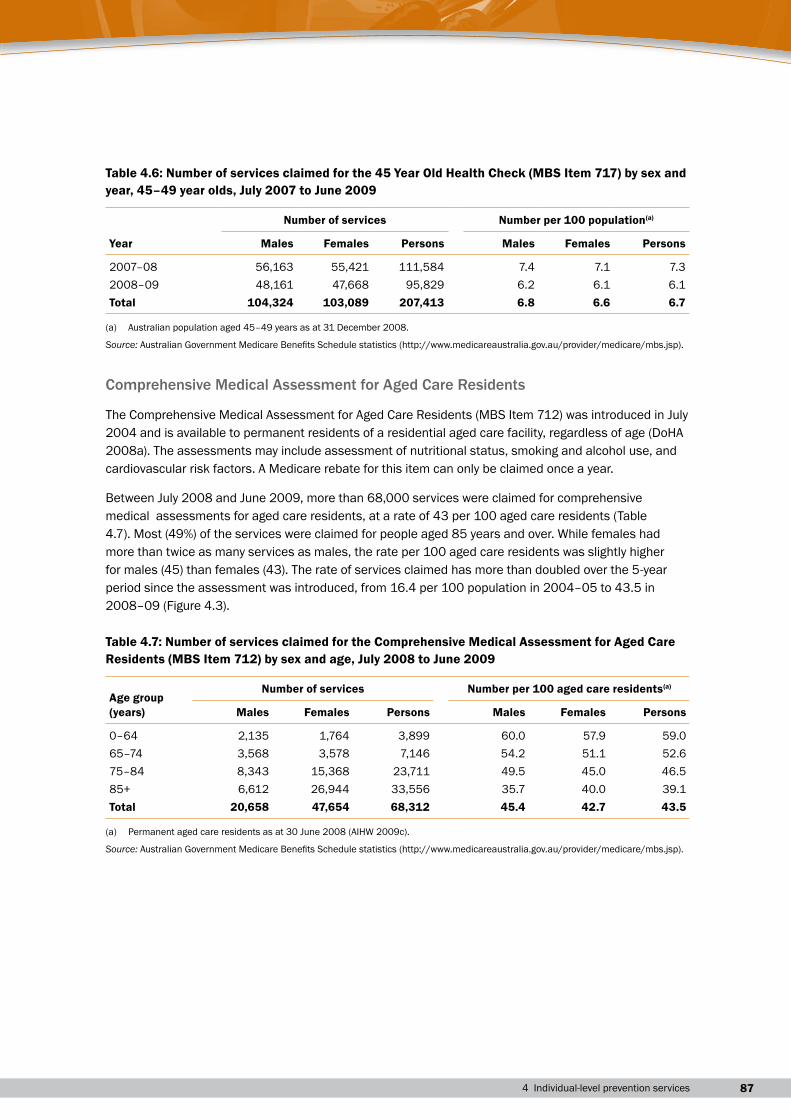
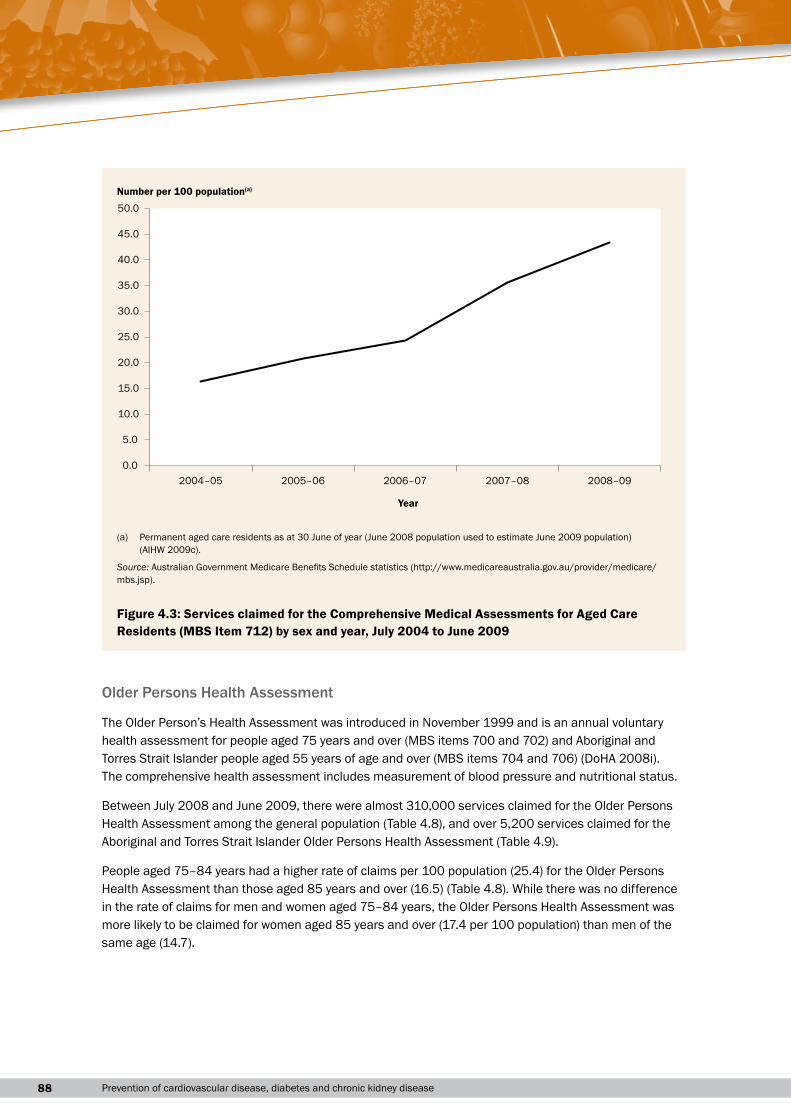
Between July 2008 and June 2009, more than 68,000 services were claimed for comprehensive medical assessments for aged care residents, at a rate of 43 per 100 aged care residents (Table 4.7). Most (49%) of the services were claimed for people aged 85 years and over. While females had more than twice as many services as males, the rate per 100 aged care residents was slightly higher for males (45) than females (43). The rate of services claimed has more than doubled over the 5-year period since the assessment was introduced, from 16.4 per 100 population in 2004–05 to 43.5 in 2008–09 (Figure 4.3).
Table 4.7: Number of services claimed for the Comprehensive Medical Assessment for Aged Care Residents (MBS Item 712) by sex and age, July 2008 to June 2009
Age group (years)
Number of services Number per 100 aged care residents(a)
Males Females Persons Males Females Persons
0–64 2,135 1,764 3,899 60.0 57.9 59.065–74 3,568 3,578 7,146 54.2 51.1 52.675–84 8,343 15,368 23,711 49.5 45.0 46.585+ 6,612 26,944 33,556 35.7 40.0 39.1Total 20,658 47,654 68,312 45.4 42.7 43.5
(a) Permanent aged care residents as at 30 June 2008 (AIHW 2009c).
Source: Australian Government Medicare Benefits Schedule statistics (http://www.medicareaustralia.gov.au/provider/medicare/mbs.jsp).
88 Prevention of cardiovascular disease, diabetes and chronic kidney disease
Older Persons Health Assessment
The Older Person’s Health Assessment was introduced in November 1999 and is an annual voluntary health assessment for people aged 75 years and over (MBS items 700 and 702) and Aboriginal and Torres Strait Islander people aged 55 years of age and over (MBS items 704 and 706) (DoHA 2008i). The comprehensive health assessment includes measurement of blood pressure and nutritional status.
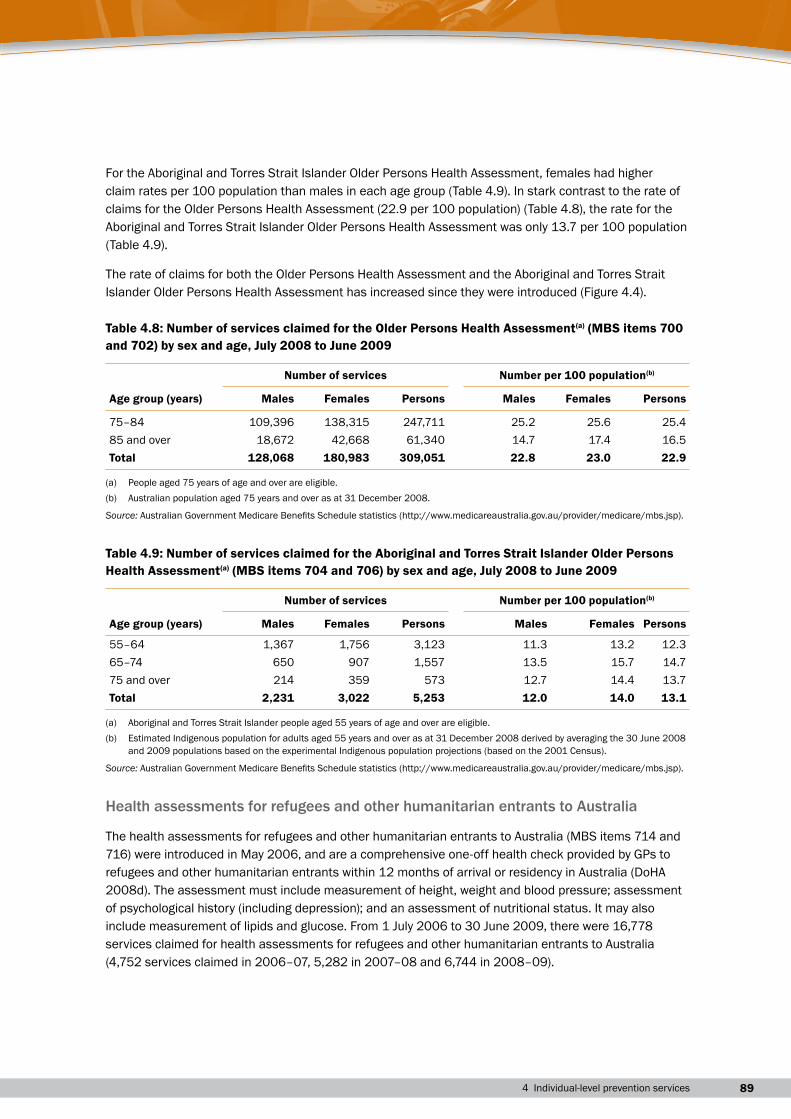
Between July 2008 and June 2009, there were almost 310,000 services claimed for the Older Persons Health Assessment among the general population (Table 4.8), and over 5,200 services claimed for the Aboriginal and Torres Strait Islander Older Persons Health Assessment (Table 4.9).
People aged 75–84 years had a higher rate of claims per 100 population (25.4) for the Older Persons Health Assessment than those aged 85 years and over (16.5) (Table 4.8). While there was no difference in the rate of claims for men and women aged 75–84 years, the Older Persons Health Assessment was more likely to be claimed for women aged 85 years and over (17.4 per 100 population) than men of the same age (14.7).
0.0
5.0
10.0
15.0
20.0
25.0
30.0
35.0
40.0
45.0
50.0
2004–05 2005–06 2006–07 2007–08 2008–09
Year
Number per 100 population(a)
(a) Permanent aged care residents as at 30 June of year (June 2008 population used to estimate June 2009 population) (AIHW 2009c).
Source: Australian Government Medicare Benefits Schedule statistics (http://www.medicareaustralia.gov.au/provider/medicare/mbs.jsp).
Figure 4.3: Services claimed for the Comprehensive Medical Assessments for Aged Care Residents (MBS Item 712) by sex and year, July 2004 to June 2009
894 Individual-level prevention services
For the Aboriginal and Torres Strait Islander Older Persons Health Assessment, females had higher claim rates per 100 population than males in each age group (Table 4.9). In stark contrast to the rate of claims for the Older Persons Health Assessment (22.9 per 100 population) (Table 4.8), the rate for the Aboriginal and Torres Strait Islander Older Persons Health Assessment was only 13.7 per 100 population (Table 4.9).
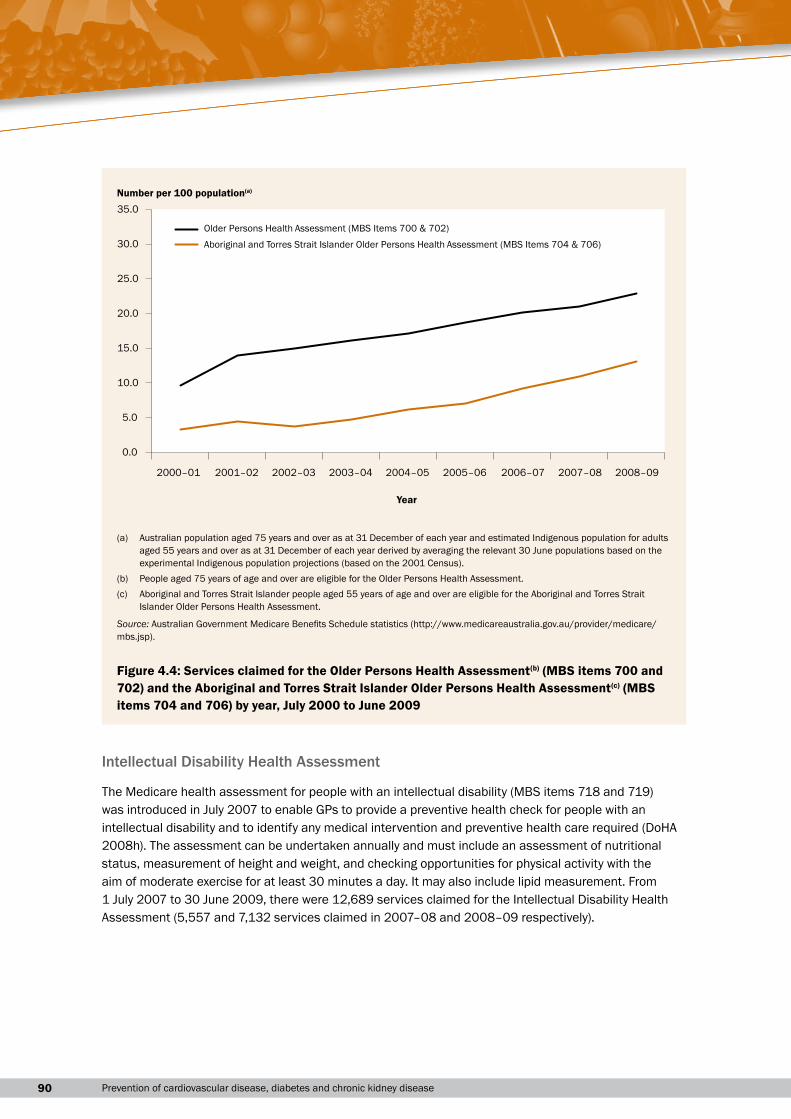
The rate of claims for both the Older Persons Health Assessment and the Aboriginal and Torres Strait Islander Older Persons Health Assessment has increased since they were introduced (Figure 4.4).
Table 4.8: Number of services claimed for the Older Persons Health Assessment(a) (MBS items 700 and 702) by sex and age, July 2008 to June 2009
Number of services Number per 100 population(b)
Age group (years) Males Females Persons Males Females Persons
75–84 109,396 138,315 247,711 25.2 25.6 25.485 and over 18,672 42,668 61,340 14.7 17.4 16.5Total 128,068 180,983 309,051 22.8 23.0 22.9
(a) People aged 75 years of age and over are eligible.(b) Australian population aged 75 years and over as at 31 December 2008.
Source: Australian Government Medicare Benefits Schedule statistics (http://www.medicareaustralia.gov.au/provider/medicare/mbs.jsp).
Table 4.9: Number of services claimed for the Aboriginal and Torres Strait Islander Older Persons Health Assessment(a) (MBS items 704 and 706) by sex and age, July 2008 to June 2009
Number of services Number per 100 population(b)
Age group (years) Males Females Persons Males Females Persons
55–64 1,367 1,756 3,123 11.3 13.2 12.365–74 650 907 1,557 13.5 15.7 14.775 and over 214 359 573 12.7 14.4 13.7Total 2,231 3,022 5,253 12.0 14.0 13.1
(a) Aboriginal and Torres Strait Islander people aged 55 years of age and over are eligible.(b) Estimated Indigenous population for adults aged 55 years and over as at 31 December 2008 derived by averaging the 30 June 2008
and 2009 populations based on the experimental Indigenous population projections (based on the 2001 Census).
Source: Australian Government Medicare Benefits Schedule statistics (http://www.medicareaustralia.gov.au/provider/medicare/mbs.jsp).
Health assessments for refugees and other humanitarian entrants to Australia
The health assessments for refugees and other humanitarian entrants to Australia (MBS items 714 and 716) were introduced in May 2006, and are a comprehensive one-off health check provided by GPs to refugees and other humanitarian entrants within 12 months of arrival or residency in Australia (DoHA 2008d). The assessment must include measurement of height, weight and blood pressure; assessment of psychological history (including depression); and an assessment of nutritional status. It may also include measurement of lipids and glucose. From 1 July 2006 to 30 June 2009, there were 16,778 services claimed for health assessments for refugees and other humanitarian entrants to Australia (4,752 services claimed in 2006–07, 5,282 in 2007–08 and 6,744 in 2008–09).
90 Prevention of cardiovascular disease, diabetes and chronic kidney disease
Intellectual Disability Health Assessment
The Medicare health assessment for people with an intellectual disability (MBS items 718 and 719) was introduced in July 2007 to enable GPs to provide a preventive health check for people with an intellectual disability and to identify any medical intervention and preventive health care required (DoHA 2008h). The assessment can be undertaken annually and must include an assessment of nutritional status, measurement of height and weight, and checking opportunities for physical activity with the aim of moderate exercise for at least 30 minutes a day. It may also include lipid measurement. From 1 July 2007 to 30 June 2009, there were 12,689 services claimed for the Intellectual Disability Health Assessment (5,557 and 7,132 services claimed in 2007–08 and 2008–09 respectively).
0.0
5.0
10.0
15.0
20.0
25.0
30.0
35.0
2000–01 2001–02 2002–03 2003–04 2004–05 2005–06 2006–07 2007–08 2008–09
Year
Older Persons Health Assessment (MBS Items 700 & 702)
Aboriginal and Torres Strait Islander Older Persons Health Assessment (MBS Items 704 & 706)
Number per 100 population(a)
(a) Australian population aged 75 years and over as at 31 December of each year and estimated Indigenous population for adults aged 55 years and over as at 31 December of each year derived by averaging the relevant 30 June populations based on the experimental Indigenous population projections (based on the 2001 Census).
(b) People aged 75 years of age and over are eligible for the Older Persons Health Assessment.(c) Aboriginal and Torres Strait Islander people aged 55 years of age and over are eligible for the Aboriginal and Torres Strait
Islander Older Persons Health Assessment.
Source: Australian Government Medicare Benefits Schedule statistics (http://www.medicareaustralia.gov.au/provider/medicare/mbs.jsp).
Figure 4.4: Services claimed for the Older Persons Health Assessment(b) (MBS items 700 and 702) and the Aboriginal and Torres Strait Islander Older Persons Health Assessment(c) (MBS items 704 and 706) by year, July 2000 to June 2009
914 Individual-level prevention services
Health advice and referrals
Health adviceData on clinical treatments provided by GPs to individuals for cardiovascular disease, diabetes, chronic kidney disease and their risk factors are available from the Bettering the Evaluation and Care of Health (BEACH) study. BEACH is a GP-based survey of patient encounters that collects information about the patient’s reasons for seeking care, the problems managed at the encounter, and treatments provided for each problem, including health advice and referrals, and medications prescribed (see Appendix for more information). The data reported here are for the period April 2007 to March 2008.
In addition to medications provided or prescribed at general practice encounters, the BEACH study allows GPs to record up to two other clinical or procedural treatments for each problem managed at an encounter. In 2007–08, there were 33,121 clinical treatments recorded, at a rate of 34.5 per 100 encounters. These treatments include general and specific advice, counselling or education, family planning and administrative processes (Britt et al. 2008a). Counselling about nutrition and weight was the most common preventive activity, accounting for 12.2% of all clinical treatments and provided at a rate of 4.2 per 100 encounters (Britt et al. 2008a). Counselling or advice for exercise, smoking, prevention, lifestyle and alcohol made up another 9.4% of all clinical treatments and, collectively, were provided at a rate of 3.2 per 100 encounters.
Referrals by general practitionersIn the BEACH survey, GPs are also able to record up to two new referrals per encounter to specialists, allied health professionals, hospitals for admission, emergency departments or other medical services such as hospital outpatient clinics and other GPs. In 2007–08, there were 12,008 referrals recorded, at a rate of 12.5 per 100 encounters (Britt et al. 2008a). Depression was the most common problem referred to an allied health service (12.1% of referrals to allied health services) and the seventh most common problem referred to a medical specialist (1.5% of referrals to a medical specialist). Obesity was the 10th most common problem referred to an allied health service, accounting for 1.7% of such referrals.
Medications in the community
Supply of prescription medicines in the communityInformation on the supply of prescription medicines in the community is available from the Australian Government Department of Health and Ageing (DoHA). The information is derived from prescriptions submitted for subsidy payment under the Pharmaceutical Benefits Scheme (PBS) or the Repatriation Pharmaceutical Benefits Scheme (RPBS), and from estimates of the use of non-subsidised prescription medicines, calculated from data collected by the Pharmacy Guild of Australia’s ongoing survey of community pharmacies (Box 4.2). Data are not available on the use of prescription medicines in public
92 Prevention of cardiovascular disease, diabetes and chronic kidney disease
hospitals and most private hospitals. Note that as a medicine may be used to treat more than one disease, and the condition for which the medicine is prescribed is not recorded, it is not possible to determine from these data sources the actual medicine use for specific conditions or purposes. The data does not include pharmaceuticals supplied under Section 100 of the National Health Act, which provides prescription medicines to Indigenous people living in remote areas.
Box 4.2: the Pharmaceutical Benefits scheme, the repatriation Pharmaceutical Benefits scheme and the Pharmacy guild survey
Pharmaceutical Benefits scheme
The PBS subsidises the cost of a wide range of prescription medicines, providing Australians with access to necessary and cost-effective medicines at an affordable price.
Australian residents and visitors from countries with reciprocal health care agreements are eligible for PBS benefits.
Patients are grouped into two classes: general and concessional. As at 1 January 2009, general patients paid the first $32.90 for each PBS prescription item. For concessional patients (people with low incomes and sickness beneficiaries who hold a health-care card), the payment was $5.30 per prescription item. These copayments are increased on 1 January each year, generally in line with increases in the consumer price index.
Individuals and families are protected from large overall expense for PBS-listed medicines by safety nets. For the calendar year beginning 1 January 2009, once a general patient and/or their immediate family has spent $1,264.90, the patient copayment decreases to the concessional rate of $5.30. Concessional patients are no longer required to pay the $5.30 copayment once their expenditure on PBS items exceeds $318.
Patients may be required to pay more than the standard copayment if a doctor prescribes a more expensive brand of an item, when there are cheaper, equivalent brands of that item listed on the PBS. These additional payments do not count towards the safety net.
repatriation Pharmaceutical Benefits scheme
The RPBS provides assistance to eligible war veterans and dependants. It is generally similar to the PBS for concessional beneficiaries, but covers a broader range of pharmaceuticals.
Pharmacy guild survey
This is an annual survey commissioned by the Drug Utilisation Sub-Committee of DoHA. The survey is conducted by the Pharmacy Guild of Australia to estimate the prescription volumes for drugs not subsidised by the PBS or the RPBS, that is, private prescriptions and PBS prescriptions priced under the general patient copayment. In 2007, total dispensing information was collected each month from 370 pharmacies that were members of the Pharmacy Guild.
Sources:AIHW2008c;DoHA2009c.
934 Individual-level prevention services
Box 4.3: defined daily dose per 1,000 population per day
Medicine use can be expressed as defined daily dose per 1,000 population per day (DDD/1,000/day). This is based on the assumed average dose per day of a medicine used for its main indication in adults. It gives an estimate of how many people per 1,000 population are taking the standard dose of the medicine each day, on average. The DDD enables valid comparisons between medicines, independent of differences in price, preparation and quantity per prescription. However, it has several limitations. As the DDD is based on international experience, it does not necessarily reflect the recommended or average prescribed dose in Australia. This measure assumes that the amount of medicine supplied is the same as the amount used, but this is not always the case. Note also that the DDD is calculated for the whole population, while medicine use may be concentrated in certain age groups or a particular sex.
Sources:AIHW:Senes&Penm2007;DoHA2009c.
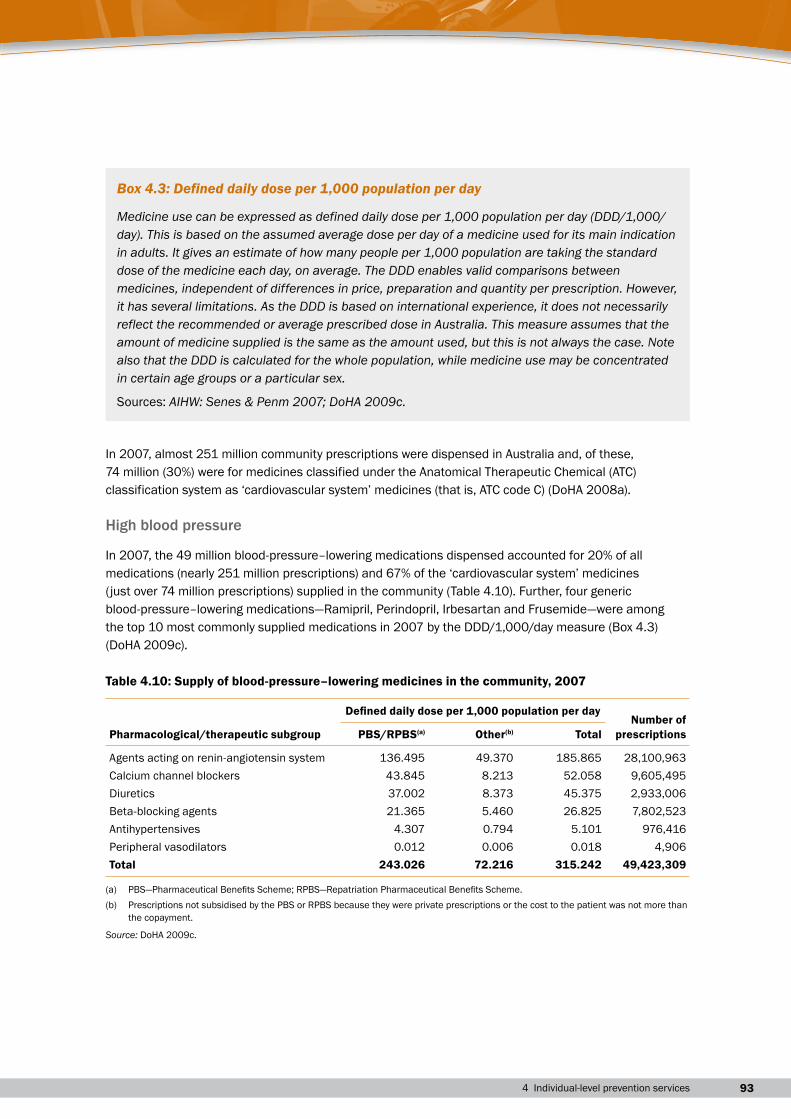
In 2007, almost 251 million community prescriptions were dispensed in Australia and, of these, 74 million (30%) were for medicines classified under the Anatomical Therapeutic Chemical (ATC) classification system as ‘cardiovascular system’ medicines (that is, ATC code C) (DoHA 2008a).
High blood pressure
In 2007, the 49 million blood-pressure–lowering medications dispensed accounted for 20% of all medications (nearly 251 million prescriptions) and 67% of the ‘cardiovascular system’ medicines (just over 74 million prescriptions) supplied in the community (Table 4.10). Further, four generic blood-pressure–lowering medications—Ramipril, Perindopril, Irbesartan and Frusemide—were among the top 10 most commonly supplied medications in 2007 by the DDD/1,000/day measure (Box 4.3) (DoHA 2009c).
Table 4.10: Supply of blood-pressure–lowering medicines in the community, 2007
Pharmacological/therapeutic subgroup
Defined daily dose per 1,000 population per dayNumber of
prescriptionsPBS/RPBS(a) Other(b) Total
Agents acting on renin-angiotensin system 136.495 49.370 185.865 28,100,963Calcium channel blockers 43.845 8.213 52.058 9,605,495Diuretics 37.002 8.373 45.375 2,933,006Beta-blocking agents 21.365 5.460 26.825 7,802,523Antihypertensives 4.307 0.794 5.101 976,416Peripheral vasodilators 0.012 0.006 0.018 4,906Total 243.026 72.216 315.242 49,423,309
(a) PBS—Pharmaceutical Benefits Scheme; RPBS—Repatriation Pharmaceutical Benefits Scheme.(b) Prescriptions not subsidised by the PBS or RPBS because they were private prescriptions or the cost to the patient was not more than
the copayment.
Source: DoHA 2009c.
94 Prevention of cardiovascular disease, diabetes and chronic kidney disease
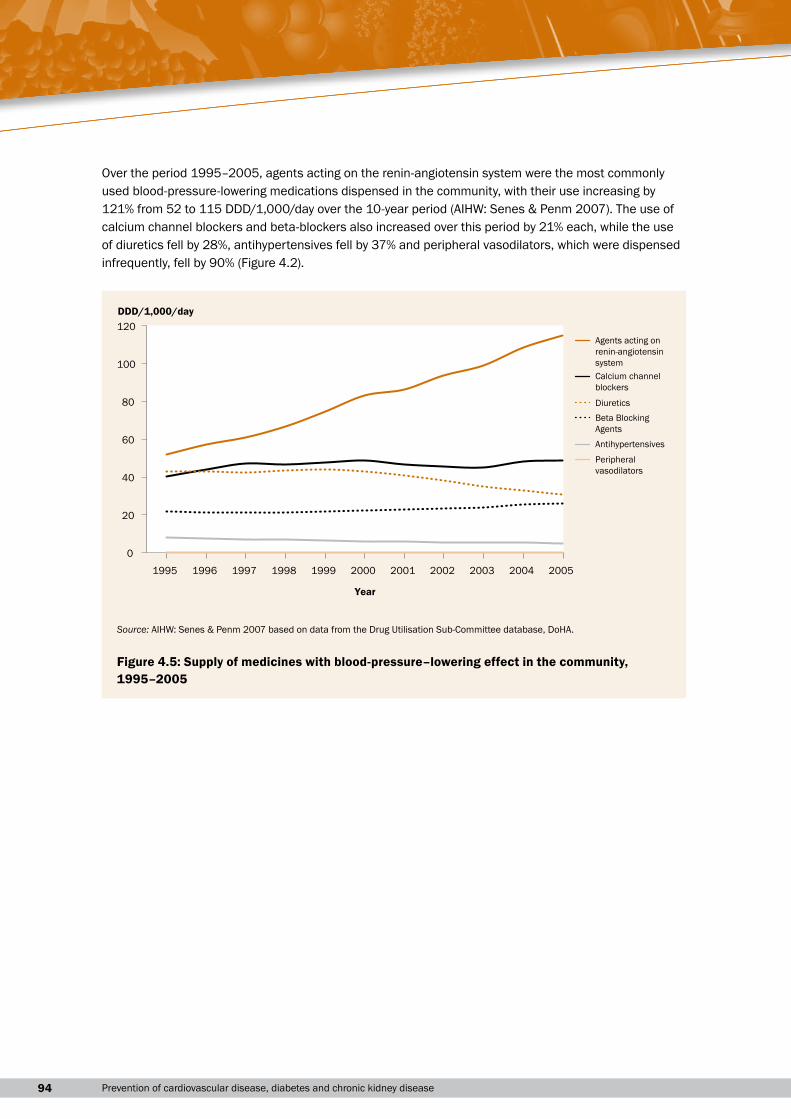
Over the period 1995–2005, agents acting on the renin-angiotensin system were the most commonly used blood-pressure-lowering medications dispensed in the community, with their use increasing by 121% from 52 to 115 DDD/1,000/day over the 10-year period (AIHW: Senes & Penm 2007). The use of calcium channel blockers and beta-blockers also increased over this period by 21% each, while the use of diuretics fell by 28%, antihypertensives fell by 37% and peripheral vasodilators, which were dispensed infrequently, fell by 90% (Figure 4.2).
0
20
40
60
80
100
120
1995 1996 1997 1998 1999 2000 2001 2002 2003 2004 2005
DDD/1,000/day
Year
Agents acting onrenin-angiotensinsystem Calcium channel blockers
Diuretics Beta BlockingAgents
Antihypertensives
Peripheralvasodilators
Source: AIHW: Senes & Penm 2007 based on data from the Drug Utilisation Sub-Committee database, DoHA.
Figure 4.5: Supply of medicines with blood-pressure–lowering effect in the community, 1995–2005
954 Individual-level prevention services
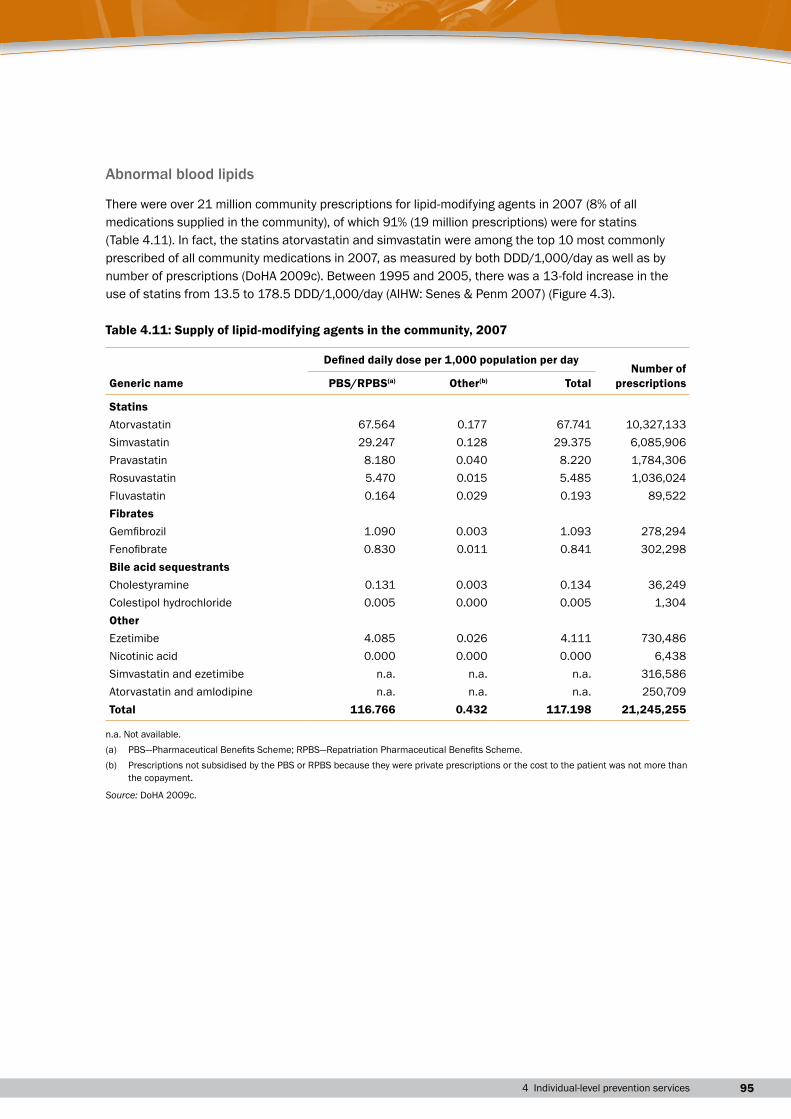
Abnormal blood lipids
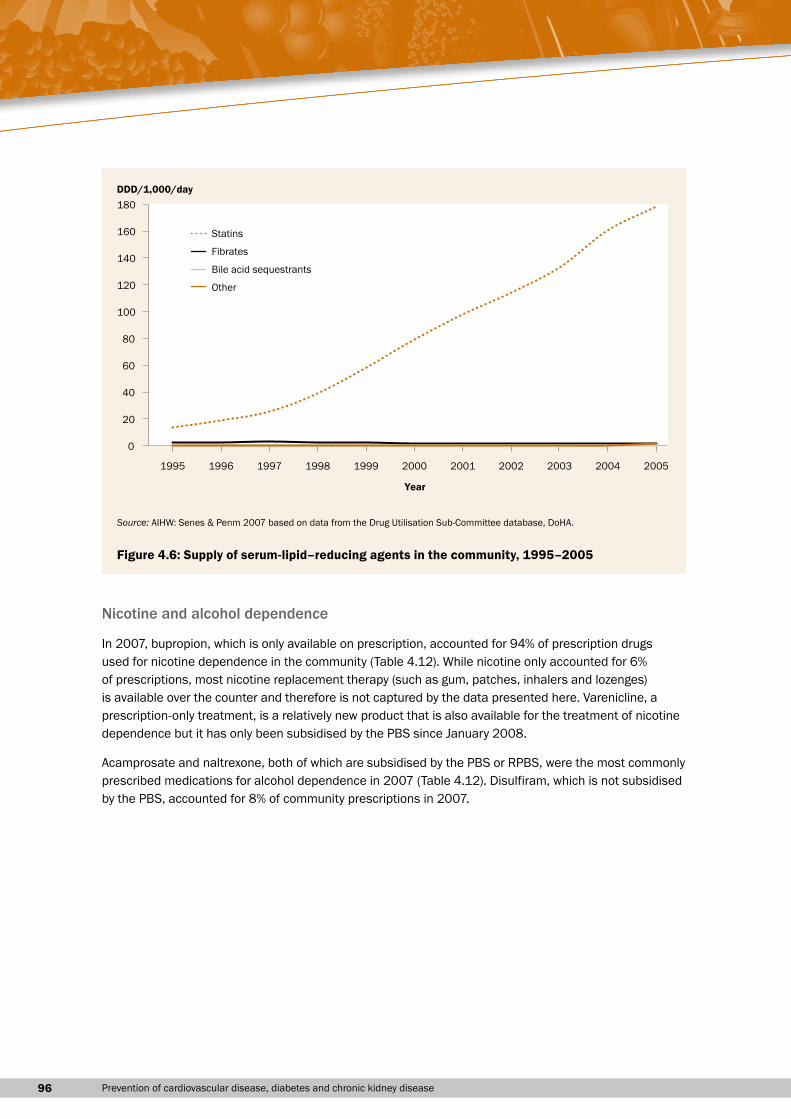
There were over 21 million community prescriptions for lipid-modifying agents in 2007 (8% of all medications supplied in the community), of which 91% (19 million prescriptions) were for statins (Table 4.11). In fact, the statins atorvastatin and simvastatin were among the top 10 most commonly prescribed of all community medications in 2007, as measured by both DDD/1,000/day as well as by number of prescriptions (DoHA 2009c). Between 1995 and 2005, there was a 13-fold increase in the use of statins from 13.5 to 178.5 DDD/1,000/day (AIHW: Senes & Penm 2007) (Figure 4.3).
Table 4.11: Supply of lipid-modifying agents in the community, 2007
Generic name
Defined daily dose per 1,000 population per dayNumber of
prescriptionsPBS/RPBS(a) Other(b) Total
StatinsAtorvastatin 67.564 0.177 67.741 10,327,133Simvastatin 29.247 0.128 29.375 6,085,906Pravastatin 8.180 0.040 8.220 1,784,306Rosuvastatin 5.470 0.015 5.485 1,036,024Fluvastatin 0.164 0.029 0.193 89,522FibratesGemfibrozil 1.090 0.003 1.093 278,294Fenofibrate 0.830 0.011 0.841 302,298Bile acid sequestrantsCholestyramine 0.131 0.003 0.134 36,249Colestipol hydrochloride 0.005 0.000 0.005 1,304OtherEzetimibe 4.085 0.026 4.111 730,486Nicotinic acid 0.000 0.000 0.000 6,438Simvastatin and ezetimibe n.a. n.a. n.a. 316,586Atorvastatin and amlodipine n.a. n.a. n.a. 250,709Total 116.766 0.432 117.198 21,245,255
n.a. Not available.(a) PBS—Pharmaceutical Benefits Scheme; RPBS—Repatriation Pharmaceutical Benefits Scheme.(b) Prescriptions not subsidised by the PBS or RPBS because they were private prescriptions or the cost to the patient was not more than
the copayment.
Source: DoHA 2009c.
96 Prevention of cardiovascular disease, diabetes and chronic kidney disease
Nicotine and alcohol dependence
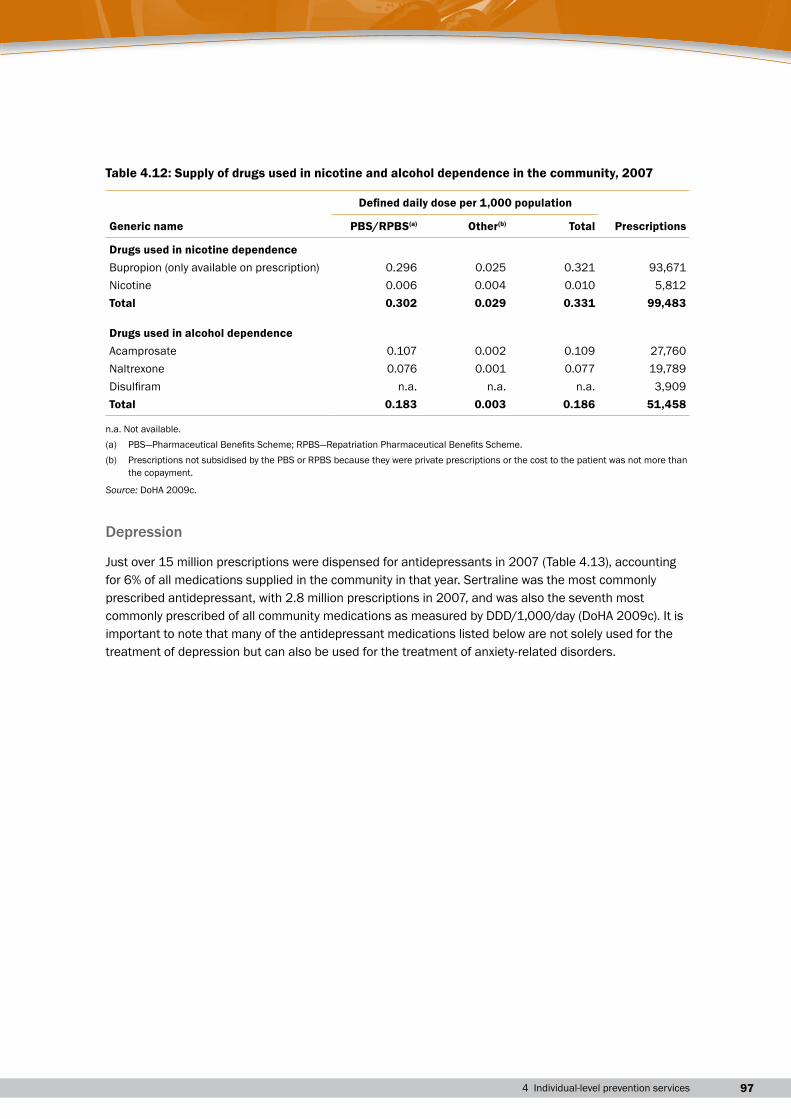
In 2007, bupropion, which is only available on prescription, accounted for 94% of prescription drugs used for nicotine dependence in the community (Table 4.12). While nicotine only accounted for 6% of prescriptions, most nicotine replacement therapy (such as gum, patches, inhalers and lozenges) is available over the counter and therefore is not captured by the data presented here. Varenicline, a prescription-only treatment, is a relatively new product that is also available for the treatment of nicotine dependence but it has only been subsidised by the PBS since January 2008.
Acamprosate and naltrexone, both of which are subsidised by the PBS or RPBS, were the most commonly prescribed medications for alcohol dependence in 2007 (Table 4.12). Disulfiram, which is not subsidised by the PBS, accounted for 8% of community prescriptions in 2007.
0
20
40
60
80
100
120
140
160
180
1995 1996 1997 1998 1999 2000 2001 2002 2003 2004 2005
DDD/1,000/day
Statins
Fibrates
Bile acid sequestrants
Other
Year
Source: AIHW: Senes & Penm 2007 based on data from the Drug Utilisation Sub-Committee database, DoHA.
Figure 4.6: Supply of serum-lipid–reducing agents in the community, 1995–2005
974 Individual-level prevention services
Table 4.12: Supply of drugs used in nicotine and alcohol dependence in the community, 2007
Generic name
Defined daily dose per 1,000 population
PrescriptionsPBS/RPBS(a) Other(b) Total
Drugs used in nicotine dependenceBupropion (only available on prescription) 0.296 0.025 0.321 93,671Nicotine 0.006 0.004 0.010 5,812Total 0.302 0.029 0.331 99,483
Drugs used in alcohol dependenceAcamprosate 0.107 0.002 0.109 27,760Naltrexone 0.076 0.001 0.077 19,789Disulfiram n.a. n.a. n.a. 3,909Total 0.183 0.003 0.186 51,458
n.a. Not available.(a) PBS—Pharmaceutical Benefits Scheme; RPBS—Repatriation Pharmaceutical Benefits Scheme.(b) Prescriptions not subsidised by the PBS or RPBS because they were private prescriptions or the cost to the patient was not more than
the copayment.
Source: DoHA 2009c.
Depression
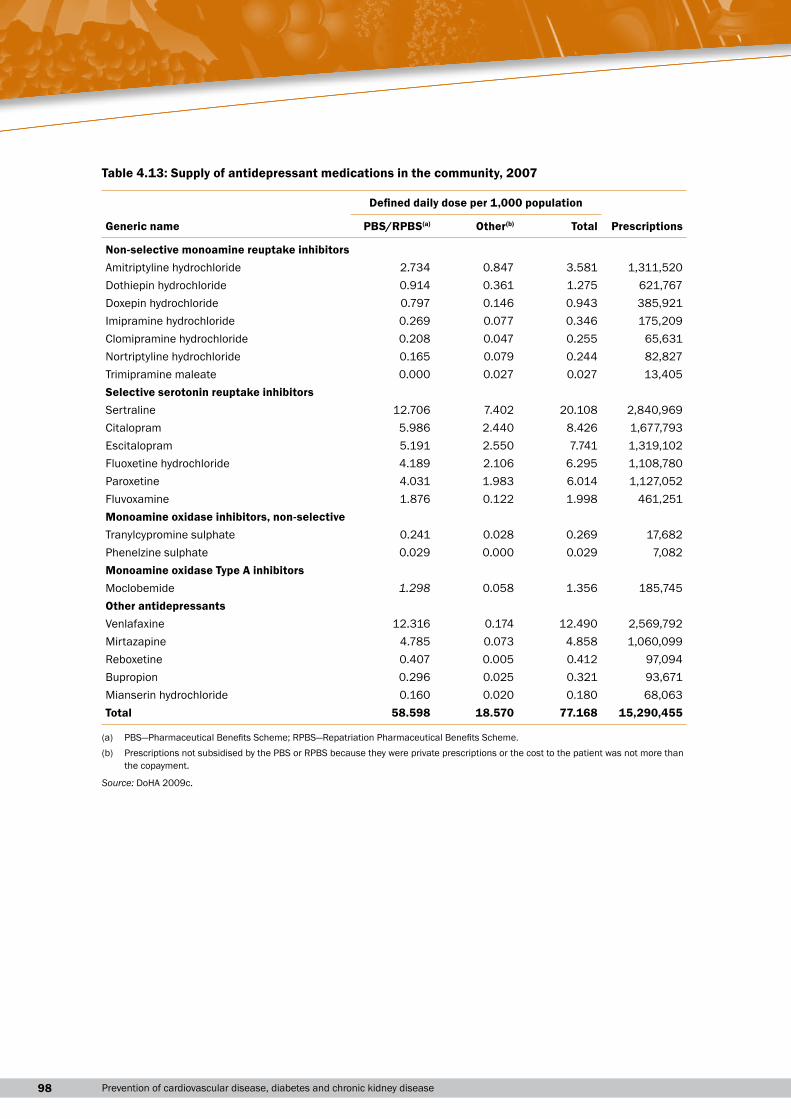
Just over 15 million prescriptions were dispensed for antidepressants in 2007 (Table 4.13), accounting for 6% of all medications supplied in the community in that year. Sertraline was the most commonly prescribed antidepressant, with 2.8 million prescriptions in 2007, and was also the seventh most commonly prescribed of all community medications as measured by DDD/1,000/day (DoHA 2009c). It is important to note that many of the antidepressant medications listed below are not solely used for the treatment of depression but can also be used for the treatment of anxiety-related disorders.
98 Prevention of cardiovascular disease, diabetes and chronic kidney disease
Table 4.13: Supply of antidepressant medications in the community, 2007
Generic name
Defined daily dose per 1,000 population
PrescriptionsPBS/RPBS(a) Other(b) Total
Non-selective monoamine reuptake inhibitorsAmitriptyline hydrochloride 2.734 0.847 3.581 1,311,520Dothiepin hydrochloride 0.914 0.361 1.275 621,767Doxepin hydrochloride 0.797 0.146 0.943 385,921Imipramine hydrochloride 0.269 0.077 0.346 175,209Clomipramine hydrochloride 0.208 0.047 0.255 65,631Nortriptyline hydrochloride 0.165 0.079 0.244 82,827Trimipramine maleate 0.000 0.027 0.027 13,405Selective serotonin reuptake inhibitorsSertraline 12.706 7.402 20.108 2,840,969Citalopram 5.986 2.440 8.426 1,677,793Escitalopram 5.191 2.550 7.741 1,319,102Fluoxetine hydrochloride 4.189 2.106 6.295 1,108,780Paroxetine 4.031 1.983 6.014 1,127,052Fluvoxamine 1.876 0.122 1.998 461,251Monoamine oxidase inhibitors, non-selectiveTranylcypromine sulphate 0.241 0.028 0.269 17,682Phenelzine sulphate 0.029 0.000 0.029 7,082Monoamine oxidase Type A inhibitorsMoclobemide 1.298 0.058 1.356 185,745Other antidepressantsVenlafaxine 12.316 0.174 12.490 2,569,792Mirtazapine 4.785 0.073 4.858 1,060,099Reboxetine 0.407 0.005 0.412 97,094Bupropion 0.296 0.025 0.321 93,671Mianserin hydrochloride 0.160 0.020 0.180 68,063Total 58.598 18.570 77.168 15,290,455
(a) PBS—Pharmaceutical Benefits Scheme; RPBS—Repatriation Pharmaceutical Benefits Scheme.(b) Prescriptions not subsidised by the PBS or RPBS because they were private prescriptions or the cost to the patient was not more than
the copayment.
Source: DoHA 2009c.
994 Individual-level prevention services
Medicines prescribed by general practitionersData on medicines that GPs prescribe or supply to treat risk factors for CVD, diabetes and CKD were sourced from the BEACH study for the period April 2007 to March 2008.
The scope of the information presented below overlaps with the previous section on medications supplied in the community. However, some prescribed medication may not be supplied (if the individual does not fill the prescription). Also note that the medications in the previous section will not all be prescribed by GPs—some will be prescribed by specialists, and some will be prescribed in hospital.
In 2007–08, high blood pressure was the problem most frequently managed by GPs, at a rate of 9.9 per 100 encounters and accounting for 6.5% of all problems managed (Britt et al. 2008a). The most commonly prescribed blood pressure medications in 2007–08 were agents acting on the renin-angiotensin system, which were prescribed at a rate of 6.6 prescriptions per 100 encounters and accounted for 8.1% of all prescriptions. The rate of prescribing of these medicines in general practice has increased significantly since 1998–99 (4.0 per 100 encounters). Calcium channel blockers were the second most commonly prescribed blood pressure medications in 2007–08 (2.1 per 100 encounters), although the rate of prescribing of calcium channel blockers has declined significantly since 1998–99 (2.7 per 100 encounters). Beta-blocking agents were prescribed at 1.7 per 100 encounters and diuretics at 1.3 per 100 encounters in 2007–08 (Britt et al. 2008a,b).
Depression was managed at a rate of 4.0 per 100 encounters in 2007–08 and accounted for 2.6% of all problems managed, making it the fifth most frequently managed problem in that year. Just over 4% of all prescriptions in 2007–08 were for antidepressants, which were prescribed at a rate of 3.4 prescriptions per 100 encounters. The most commonly prescribed antidepressant was sertraline (0.7% of all prescriptions; 18% of prescriptions for antidepressants; 0.6 prescriptions per 100 encounters) (Britt et al. 2008a).
Lipid disorders were the seventh most frequently managed problem in 2007–08 (2.4% of all problems managed; managed at a rate of 3.7 per 100 encounters). Serum-lipid–reducing agents were prescribed at 3.7 per 100 encounters in 2007–08, which represents a significant increase over the prescribing rate of 1.9 per 100 encounters for these medications in 1998–99 (Britt et al. 2008b). Atorvastatin and simvastatin were the most commonly prescribed serum-lipid–reducing agents in 2007–08 (3.2% of all prescriptions; 75% of all plain lipid-modifying agents) and were prescribed at a rate of 1.7 and 0.9 per 100 encounters respectively.
As an addition to the main BEACH survey, a substudy of 3,160 respondents from 112 GPs was conducted in 2007–08 and examined the management of high blood pressure and high blood cholesterol among general practice patients. Of the patients in the study, 35% had high blood pressure, high blood cholesterol or both conditions. Of the patients who provided information about current treatment, 86.1% were currently taking at least one medication for high blood pressure and/or high blood cholesterol, while 13.9% were not currently taking medication for either condition. Perindopril was the most commonly prescribed medication for high blood pressure, and atorvastatin was the most commonly prescribed medication for high blood cholesterol. Almost 86% of patients were being managed with medication alone, while another 8.7% of patients were managed with diet or exercise alone, and 5.1% were not being managed with either medication, or diet or exercise (SAND abstract number 113; Britt et al. 2008a) (see Appendix for more information about SAND).
100 Prevention of cardiovascular disease, diabetes and chronic kidney disease
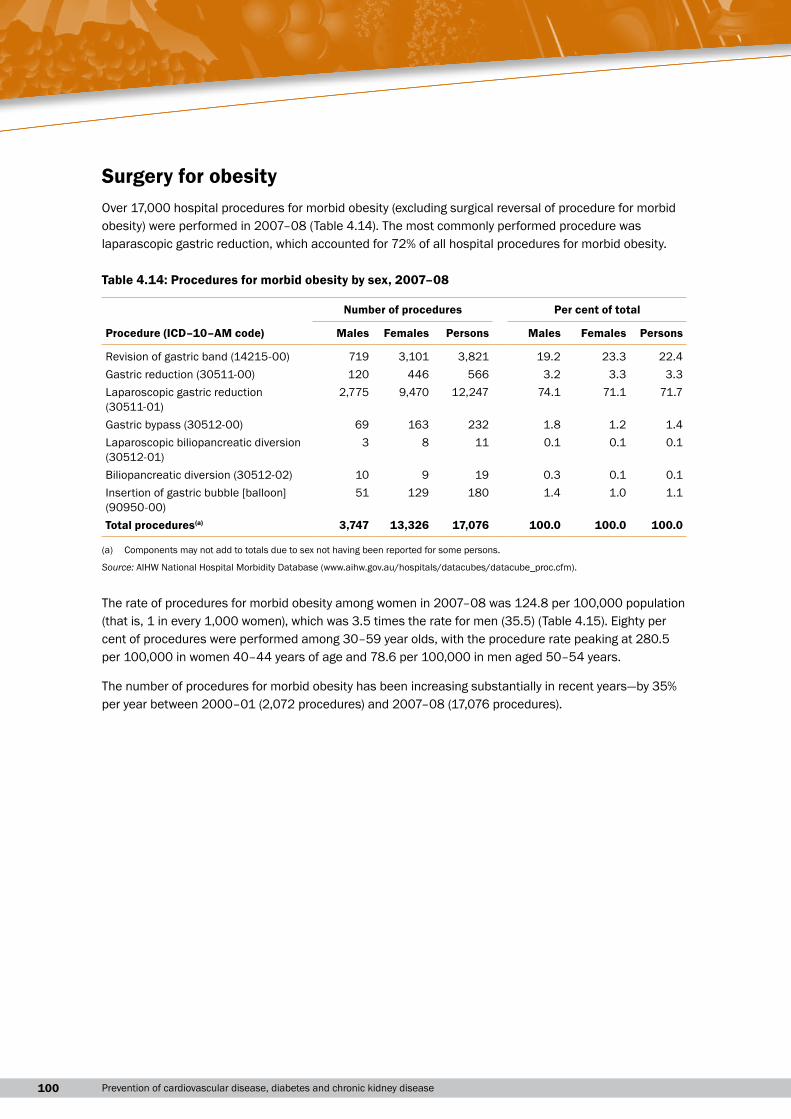
Surgery for obesityOver 17,000 hospital procedures for morbid obesity (excluding surgical reversal of procedure for morbid obesity) were performed in 2007–08 (Table 4.14). The most commonly performed procedure was laparascopic gastric reduction, which accounted for 72% of all hospital procedures for morbid obesity.
Table 4.14: Procedures for morbid obesity by sex, 2007–08
Number of procedures Per cent of total
Procedure (ICD–10–AM code) Males Females Persons Males Females Persons
Revision of gastric band (14215-00) 719 3,101 3,821 19.2 23.3 22.4Gastric reduction (30511-00) 120 446 566 3.2 3.3 3.3Laparoscopic gastric reduction (30511-01)
2,775 9,470 12,247 74.1 71.1 71.7
Gastric bypass (30512-00) 69 163 232 1.8 1.2 1.4Laparoscopic biliopancreatic diversion (30512-01)
3 8 11 0.1 0.1 0.1
Biliopancreatic diversion (30512-02) 10 9 19 0.3 0.1 0.1Insertion of gastric bubble [balloon] (90950-00)
51 129 180 1.4 1.0 1.1
Total procedures(a) 3,747 13,326 17,076 100.0 100.0 100.0
(a) Components may not add to totals due to sex not having been reported for some persons.
Source: AIHW National Hospital Morbidity Database (www.aihw.gov.au/hospitals/datacubes/datacube_proc.cfm).
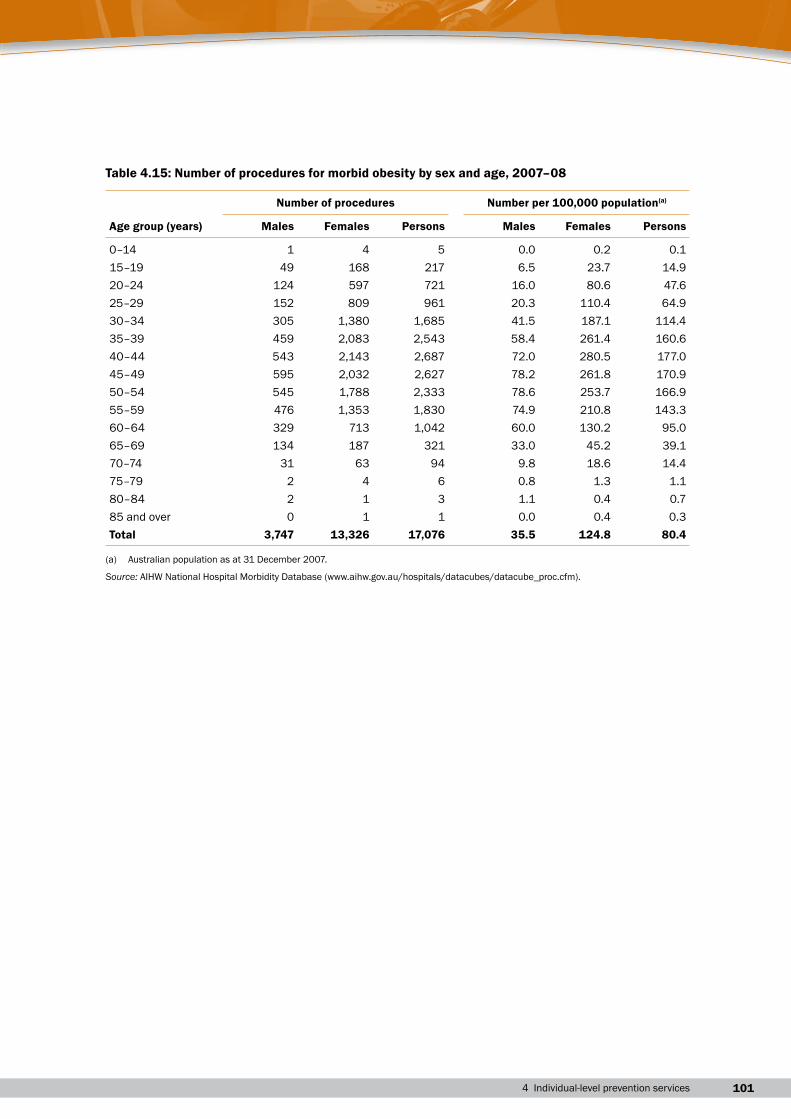
The rate of procedures for morbid obesity among women in 2007–08 was 124.8 per 100,000 population (that is, 1 in every 1,000 women), which was 3.5 times the rate for men (35.5) (Table 4.15). Eighty per cent of procedures were performed among 30–59 year olds, with the procedure rate peaking at 280.5 per 100,000 in women 40–44 years of age and 78.6 per 100,000 in men aged 50–54 years.
The number of procedures for morbid obesity has been increasing substantially in recent years—by 35% per year between 2000–01 (2,072 procedures) and 2007–08 (17,076 procedures).
1014 Individual-level prevention services
Table 4.15: Number of procedures for morbid obesity by sex and age, 2007–08
Number of procedures Number per 100,000 population(a)
Age group (years) Males Females Persons Males Females Persons
0–14 1 4 5 0.0 0.2 0.115–19 49 168 217 6.5 23.7 14.920–24 124 597 721 16.0 80.6 47.625–29 152 809 961 20.3 110.4 64.930–34 305 1,380 1,685 41.5 187.1 114.435–39 459 2,083 2,543 58.4 261.4 160.640–44 543 2,143 2,687 72.0 280.5 177.045–49 595 2,032 2,627 78.2 261.8 170.950–54 545 1,788 2,333 78.6 253.7 166.955–59 476 1,353 1,830 74.9 210.8 143.360–64 329 713 1,042 60.0 130.2 95.065–69 134 187 321 33.0 45.2 39.170–74 31 63 94 9.8 18.6 14.475–79 2 4 6 0.8 1.3 1.180–84 2 1 3 1.1 0.4 0.785 and over 0 1 1 0.0 0.4 0.3Total 3,747 13,326 17,076 35.5 124.8 80.4
(a) Australian population as at 31 December 2007.
Source: AIHW National Hospital Morbidity Database (www.aihw.gov.au/hospitals/datacubes/datacube_proc.cfm).

102 Prevention of cardiovascular disease, diabetes and chronic kidney disease