4 - new horizons for china petrochemical industry...pp an po phenol/aceton butanol/2-ethylhexanol...
TRANSCRIPT

New Horizons for China Petrochemical Industry
������ ����� �� � � � ���� � � ����������� ������
�������� �March 25th 2019
CONTENTS 1
2
3

B : C : C : A B FA C: B :
4
FF : / B
: : : :
:
B E :
&
E :
E G E
&
: C & &&
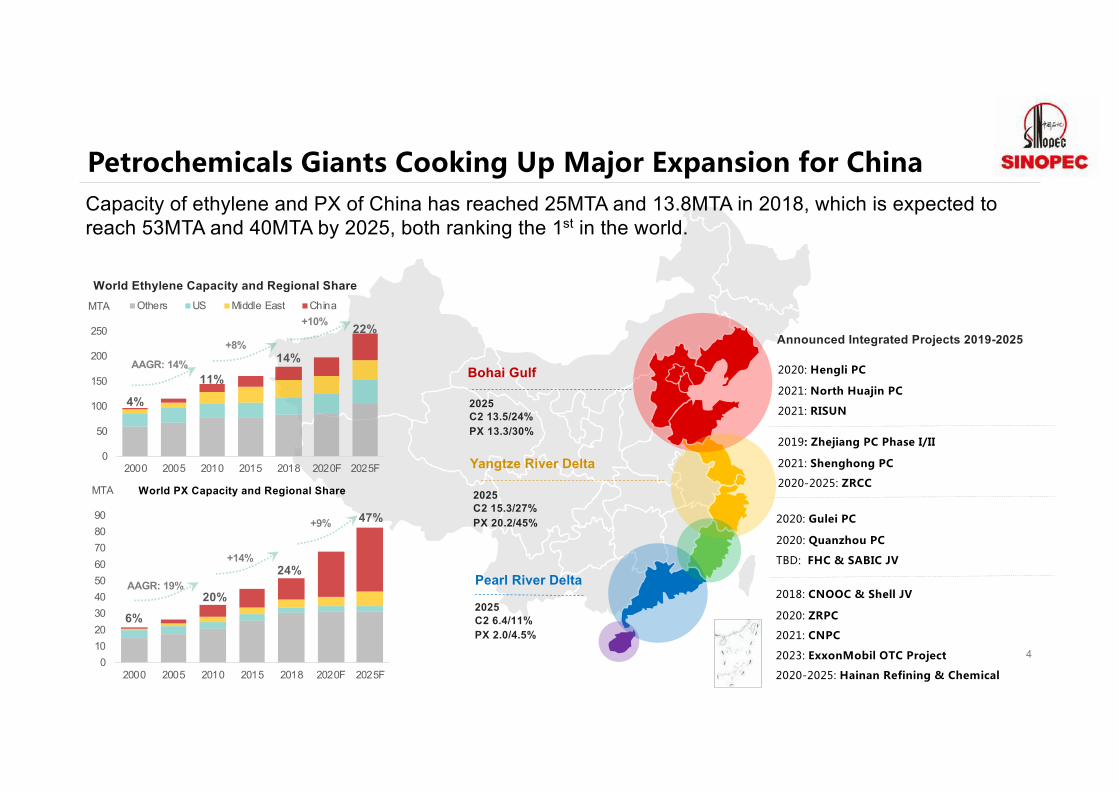
Bohai Gulf
Yangtze River Delta
Pearl River Delta
Announced Integrated Projects 2019-2025
2025C2 13.5/24%PX 13.3/30%
2025C2 15.3/27%PX 20.2/45%
2025C2 6.4/11%PX 2.0/4.5%
4%
11%14%
22%
0
50
100
150
200
250
2000 2005 2010 2015 2018 2020F 2025F
MTA Others US Middle East China
Capacity of ethylene and PX of China has reached 25MTA and 13.8MTA in 2018, which is expected to reach 53MTA and 40MTA by 2025, both ranking the 1st in the world.
+10%
AAGR: 14%
+8%
World Ethylene Capacity and Regional Share
6%20%
24%
47%
0102030405060708090
2000 2005 2010 2015 2018 2020F 2025F
MTA
AAGR: 19%
+14%
+9%
World PX Capacity and Regional Share
5
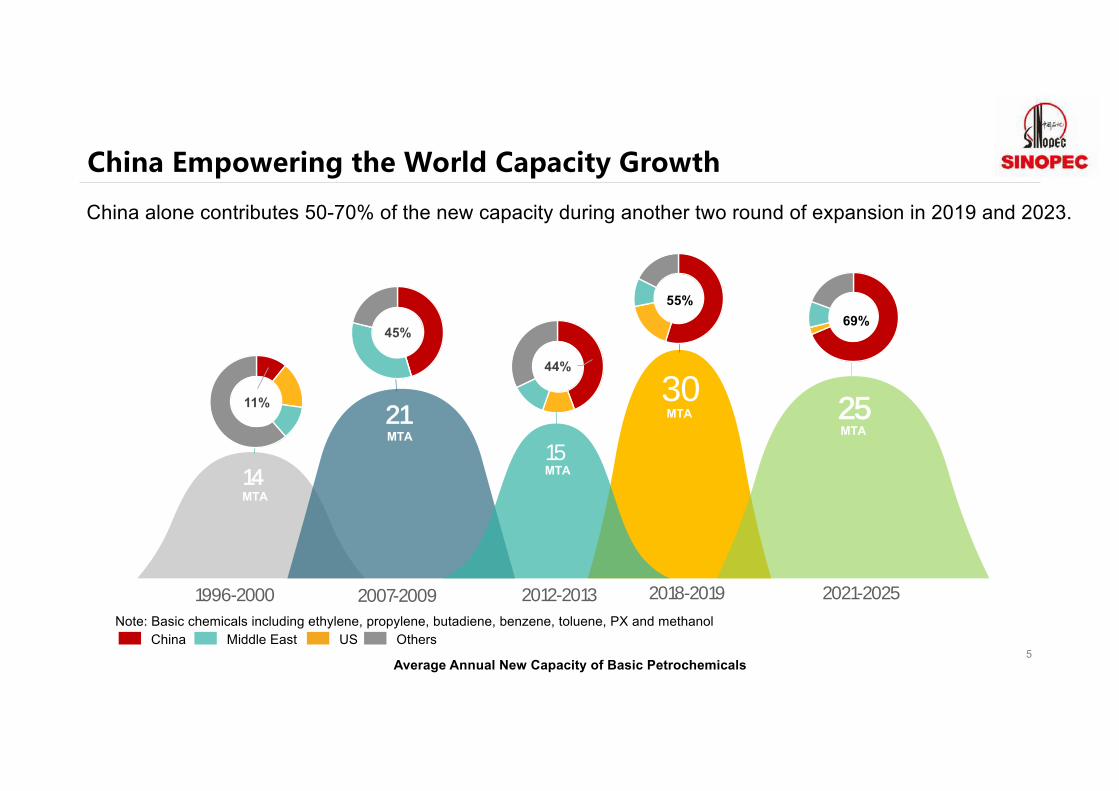
China alone contributes 50-70% of the new capacity during another two round of expansion in 2019 and 2023.
Average Annual New Capacity of Basic Petrochemicals
1996-2000 2007-2009 2012-2013 2018-2019 2021-2025Note: Basic chemicals including ethylene, propylene, butadiene, benzene, toluene, PX and methanol
MTA14
3021
1525
MTA
MTA
MTAMTA
11%
45%69%
55%
44%
China Middle East US Others
7
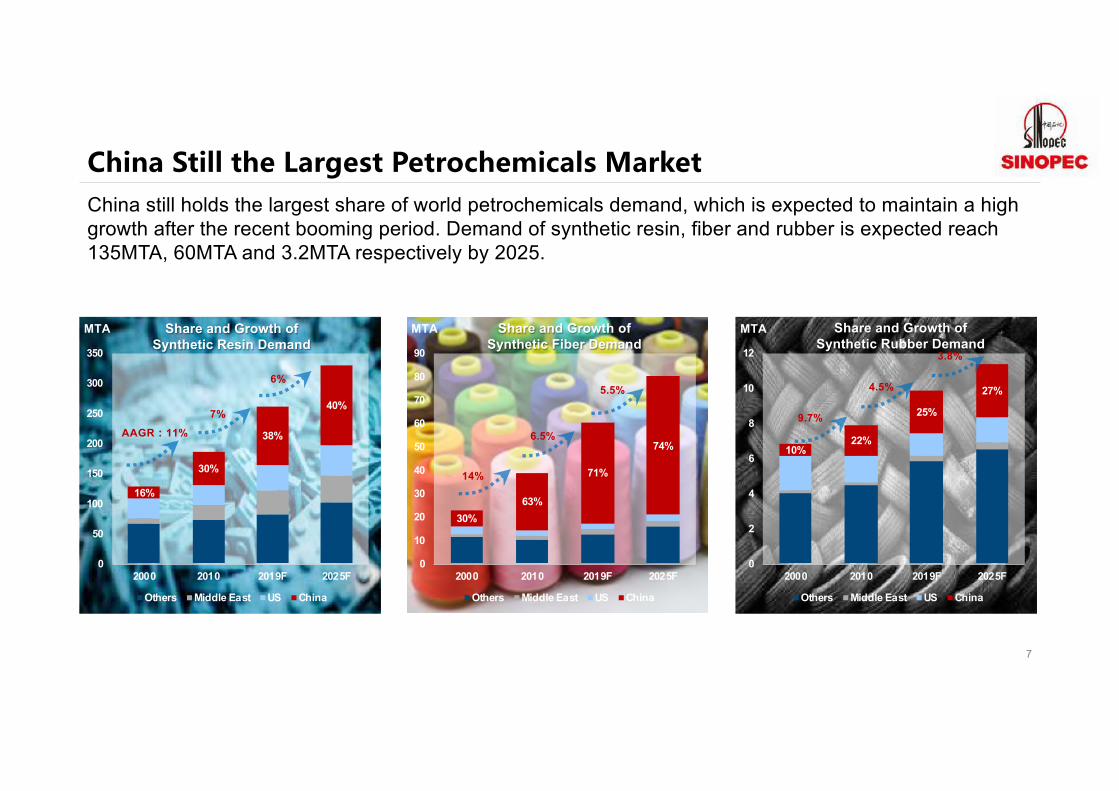
China still holds the largest share of world petrochemicals demand, which is expected to maintain a high growth after the recent booming period. Demand of synthetic resin, fiber and rubber is expected reach 135MTA, 60MTA and 3.2MTA respectively by 2025.
16%
30%
38%
40%
0
50
100
150
200
250
300
350
2000 2010 2019F 2025F
MTA
Others Middle East US China
AAGR 11%
7%
6%
Share and Growth of Synthetic Resin Demand
30%
63%
71%
74%
0
10
20
30
40
50
60
70
80
90
2000 2010 2019F 2025F
MTA
Others Middle East US China
Share and Growth of Synthetic Fiber Demand
14%
6.5%
5.5%
10%22%
25%
27%
0
2
4
6
8
10
12
2000 2010 2019F 2025F
MTA
Others Middle East US China
9.7%
4.5%
3.8%
Share and Growth of Synthetic Rubber Demand

8
World petrochemicals demand are recovering from years before, growth of which outruns the world GDP. China, as a key driver, is expects to hold 1% higher than the world average demand growth by 2025.
AAGR of World Synthetic Resin, Fiber and Rubber Demand
3.9%2011-2014 2015-2016
4.0%2017-2019 2020-2025
5.1% 4.2%2.6%2007-2010
5.1%4.8%5.2%
6.0%
8.0%China
World Avg.

China per capita consumption of petrochemicals is catching up with Japan and Europe in the coming years. But 43kg(in equivalent ethylene) still has a long way to go compared with South Korea(89-90kg) and U.S.(70-80kg).
9Consumption per capita of Equivalent Ethylene vs GDP per capita from 1990-2025
0
10
20
30
40
50
60
70
80
90
100
0 10000 20000 30000 40000 50000 60000 70000 80000
Kg per person
GDP per capita, $
China
South Korea
US
Japan
Europe2018
Aging Population VS Massive Urbanization
10
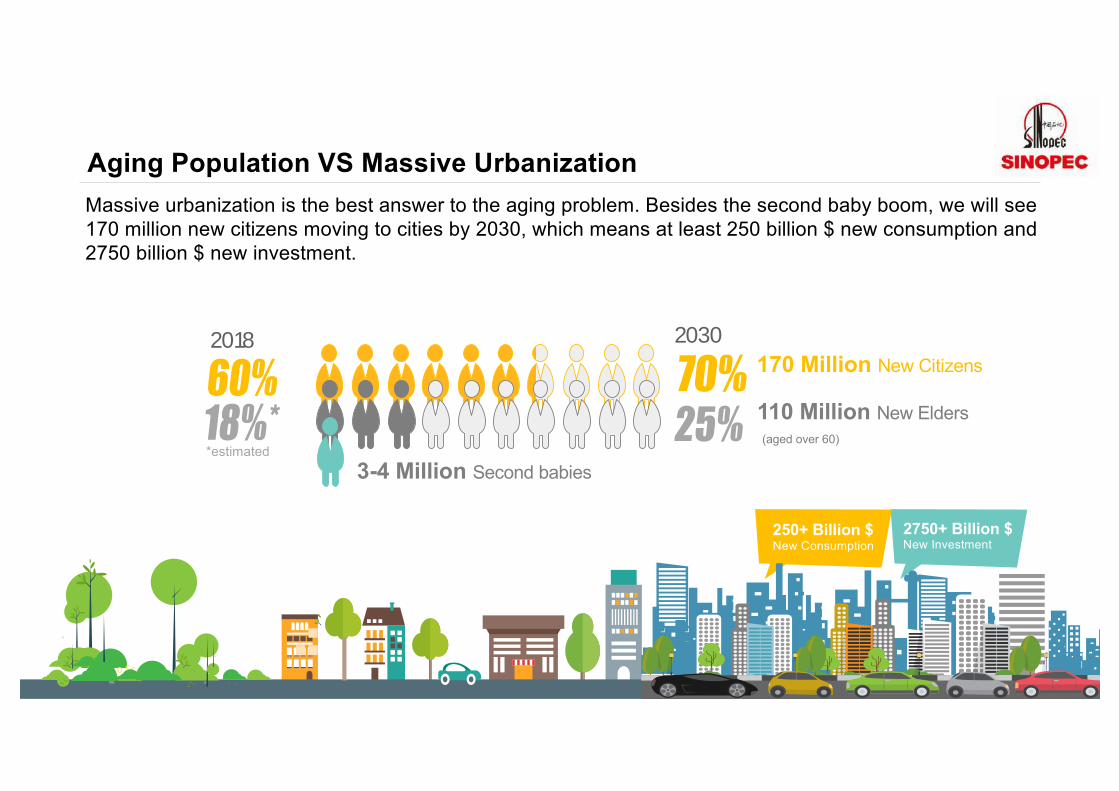
Massive urbanization is the best answer to the aging problem. Besides the second baby boom, we will see 170 million new citizens moving to cities by 2030, which means at least 250 billion $ new consumption and 2750 billion $ new investment.
250+ Billion $ New Consumption
2750+ Billion $ New Investment
2018 2030170 Million New Citizens
110 Million New Elders(aged over 60)
3-4 Million Second babies*estimated
Explosive Growth of E-commerce Boosting the Polymers Demand
11
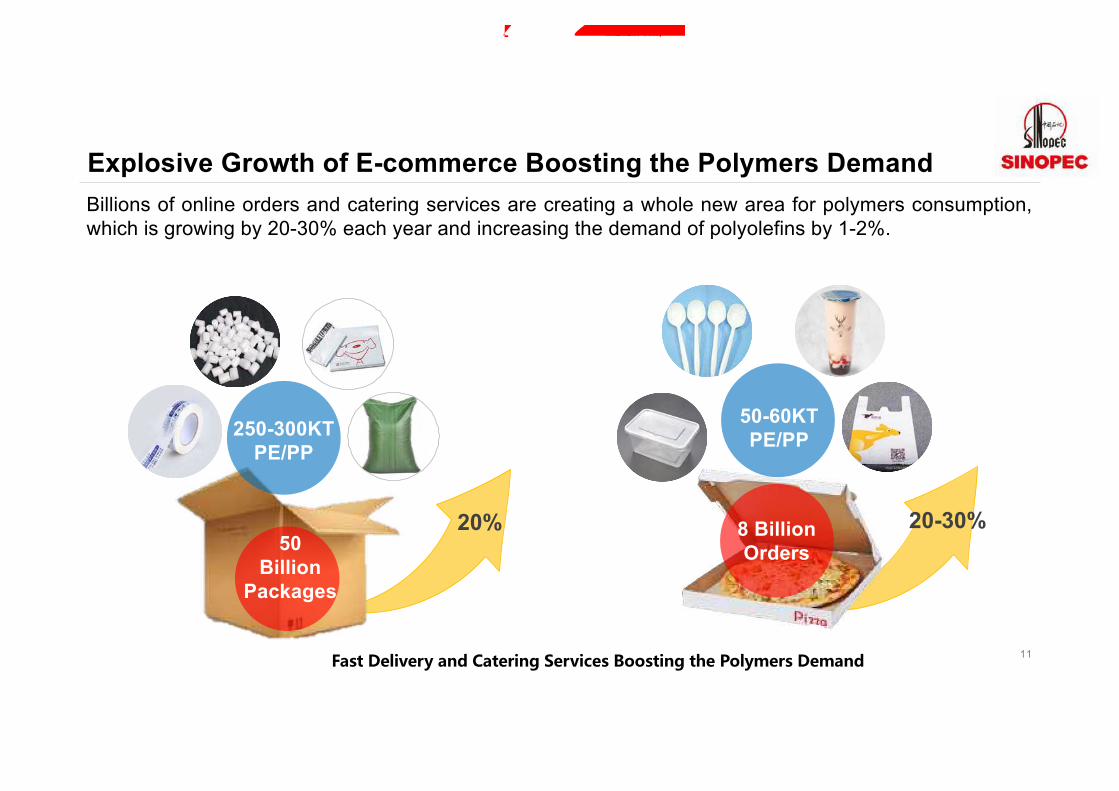
Billions of online orders and catering services are creating a whole new area for polymers consumption,which is growing by 20-30% each year and increasing the demand of polyolefins by 1-2%.
50Billion
Packages
250-300KTPE/PP
50-60KTPE/PP
20% 20-30%8 BillionOrders
更多行业精品报告,登陆东西智库(dx2025.com)下载
New Demand from Environmental Protection Business
12
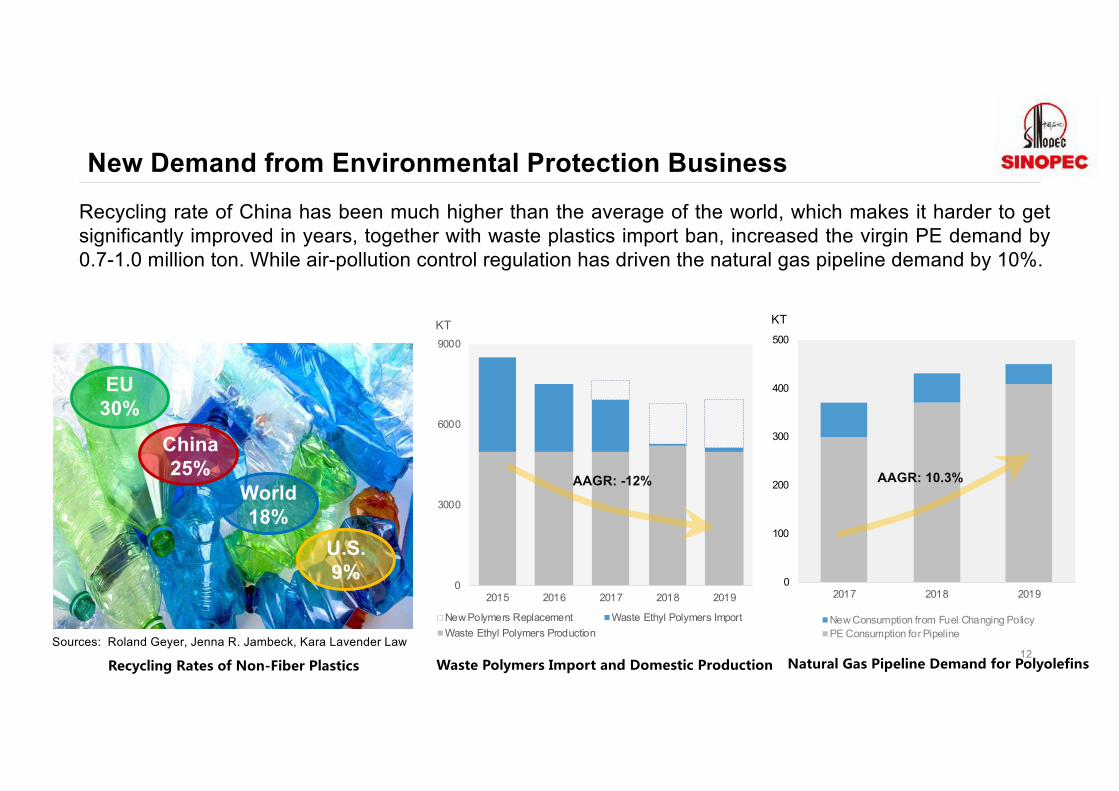
Recycling rate of China has been much higher than the average of the world, which makes it harder to getsignificantly improved in years, together with waste plastics import ban, increased the virgin PE demand by0.7-1.0 million ton. While air-pollution control regulation has driven the natural gas pipeline demand by 10%.
-
0
3000
6000
9000
2015 2016 2017 2018 2019
KT
New Polymers Replacement Waste Ethyl Polymers ImportWaste Ethyl Polymers Production
AAGR: -12%
0
100
200
300
400
500
2017 2018 2019
KT
New Consumption from Fuel Changing PolicyPE Consumption for Pipeline
- - - -
AAGR: 10.3%
- -
EU30%
China25%
World18%
U.S.9%
Sources: Roland Geyer, Jenna R. Jambeck, Kara Lavender Law

2015 2020 2025 2030
65
99
145
12%
10%
8.9%Billion $
A Prosperous Outlook for High Performance MaterialsConsumption upgrading promotes the high performance materials demand. A more than 10% growth will be expected in the coming years, and the revenue of this area will reach 145 billion $ by 2030, accounting for 40-50% of the world.
40
BatteryMaterials
ConstructionChemicals
EngineeringPlastics
MedicalPlastics
PackageMaterials
ElectronicMaterials
EVA &alpha-olefins
Liquid CrystalMaterials
High PerformancePlastics
Revenue of China High Performance Materials Industry
更多行业精品报告,登陆东西智库(dx2025.com)下载

C1/C2: Large Import Still ThereMethanol effective supply cannot fully meet the fast growing MTO and fuel demand, net export approaching 10 MT.Self-sufficiency of ethylene is rocketing, while more than 10MT of equivalent ethylene still has to be imported.
Note�Self-Sufficiency Rate=Production/Demand
0
20
40
60
80
100
120
2018 2019 2020 2025
MT
MTO Fuel Others Capcacity
88%
89%
88%
86%
Self-Sufficiency
0
10
20
30
40
50
60
70
2018 2019 2020 2025
MT
PE EG SM EO PVC Others Capcacity
Note�Ethylene Demand including derivatives demand(in ethylene)
51% 51%
58%
83%
Self-Sufficiency
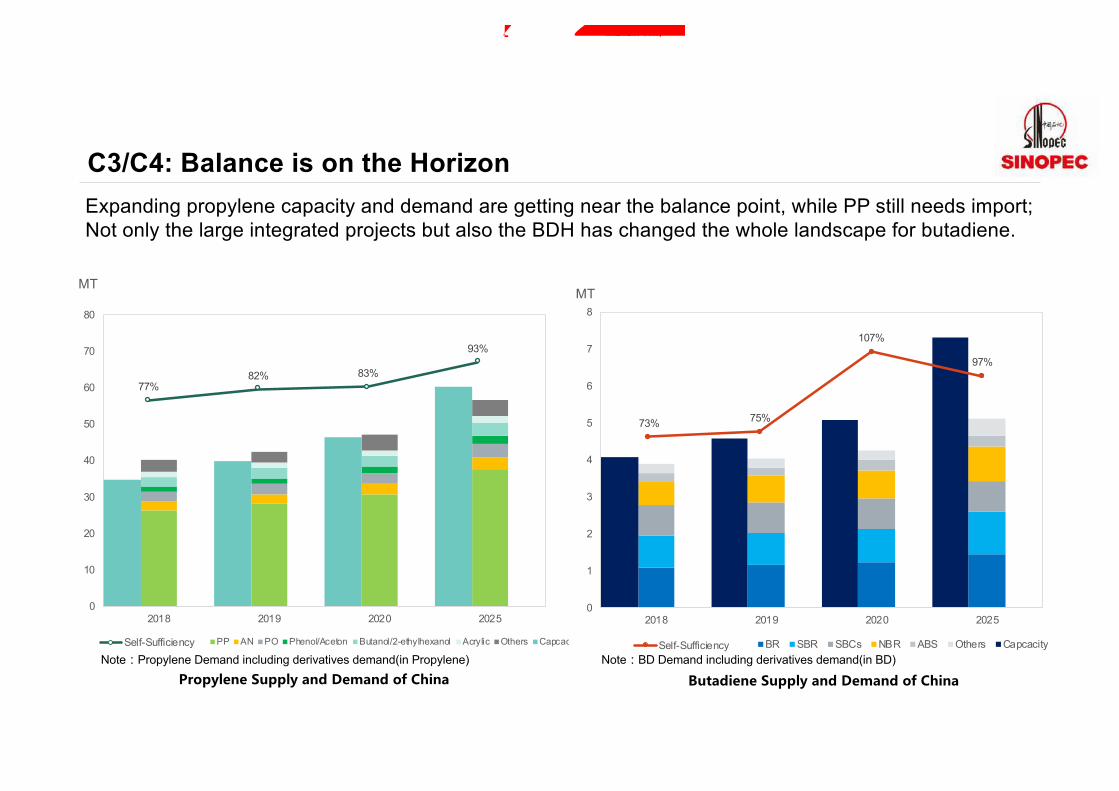
C3/C4: Balance is on the Horizon
0
10
20
30
40
50
60
70
80
2018 2019 2020 2025
MT
PP AN PO Phenol/Aceton Butanol/2-ethylhexanol Acrylic Others Capcacity
77%82% 83%
93%
Self-Sufficiency
Expanding propylene capacity and demand are getting near the balance point, while PP still needs import;Not only the large integrated projects but also the BDH has changed the whole landscape for butadiene.
0
1
2
3
4
5
6
7
8
2018 2019 2020 2025
MT
BR SBR SBCs NBR ABS Others Capcacity
73% 75%
107%
97%
Self-Sufficiency
Note�BD Demand including derivatives demand(in BD)Note�Propylene Demand including derivatives demand(in Propylene)
更多行业精品报告,登陆东西智库(dx2025.com)下载

Aromatics: Nearing the OvercapacityExtensive investment on PX has dramatically change the outlook for it, balanced or even overcapacity is expected by 2025. For benzene, import won’t be absent, but potential increase of the capacity utilization clouded the market.
40%
55%62%
103%
0%
20%
40%
60%
80%
100%
120%
0
10
20
30
40
50
60
2018 2019 2020 2025
MT
Capcacity Demand Self-Sufficiency(RHS)
0
5
10
15
20
25
30
35
2018 2019 2020 2025
MT
SM Nitrobenzene CPL Phenol Others Capcacity
82%
85%
90%
88%
Self-Sufficiency

Balance across the SpectrumPolymers supply still cannot meet the demand by 2025, while some, especially the aromatics, will be facing the overcapacity pressure.
Balance of China Major Petrochemicals in 2025
-20000
-15000
-10000
-5000
0
5000
10000
15000
20000
-100000
-75000
-50000
-25000
0
25000
50000
75000
100000
Met
hano
l
Ethy
lene
LDPE
HDPE
LLD
PE EG
Prop
ylen
e
PP AN PO
Acet
one
n-bu
tano
l
2-et
hylh
exan
ol
Buta
dien
e
BR SBR PX PTA
PET
Benz
ene
SM
Phen
ol
CPL
C1 C2 C3 C4 Aromatics
,000 ton Production Demand Balance(RHS)
更多行业精品报告,登陆东西智库(dx2025.com)下载
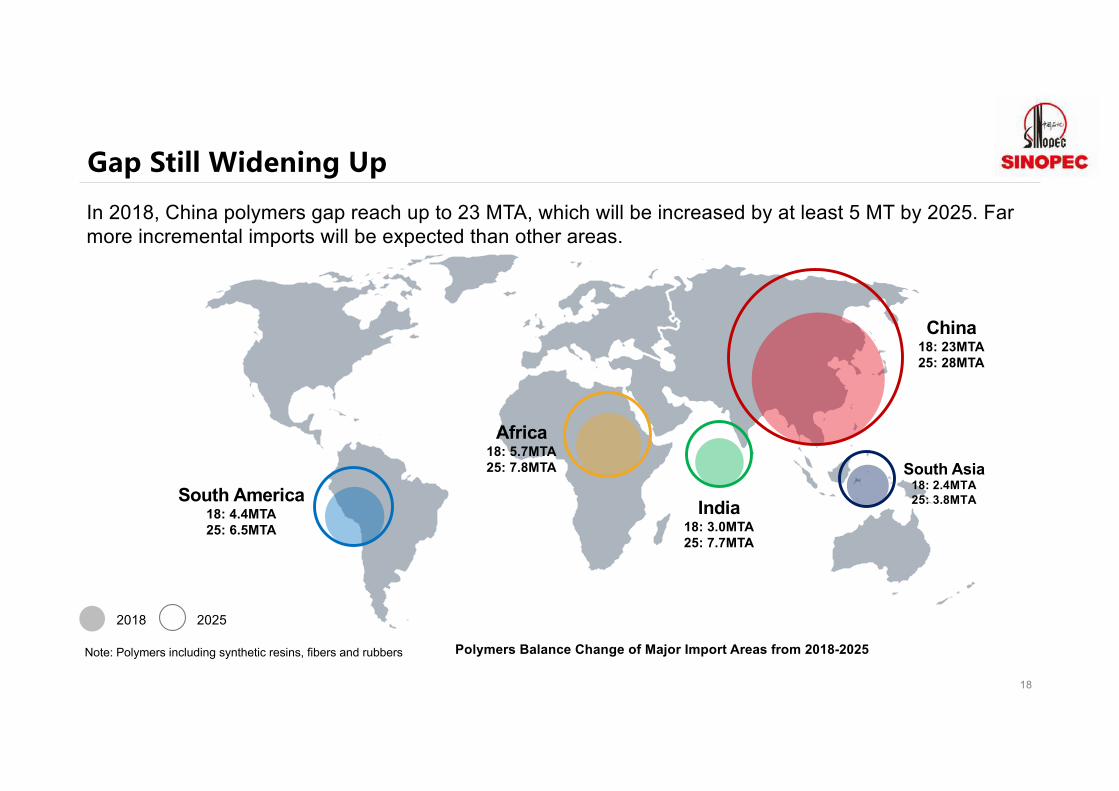
China18: 23MTA25: 28MTA
India18: 3.0MTA25: 7.7MTA
In 2018, China polymers gap reach up to 23 MTA, which will be increased by at least 5 MT by 2025. Far more incremental imports will be expected than other areas.
18
Polymers Balance Change of Major Import Areas from 2018-2025
Africa18: 5.7MTA25: 7.8MTA
South America18: 4.4MTA25: 6.5MTA
South Asia18: 2.4MTA25: 3.8MTA
2018 2025
Note: Polymers including synthetic resins, fibers and rubbers

更多行业精品报告,登陆东西智库(dx2025.com)下载

A Further Opening-up Market
20
A series of measures are implemented to reduce the market access barrier, which has attracted not only the domestic private investors but also the foreign investors, like Saudi Aramco, SABIC to join the game.
9%
11%
Private Investors
25%
Foreign Investors
13%
Ethylene Capacity Share 2018(inner circle) and 2025
Ethylene
26%
7%
Private Investors
50%
Foreign Investors
7%
PX Capacity Share 2018(inner circle) and 2025
PX
Remove restrictions on wholly foreign funded petrochemical companies
Remove restrictions on crude oil import of private companies
Introduce mixed ownership to SOEs
Implement negative list for market access
Cut items requiring government review by 30%
Cut taxes and administrative fees Lower the VAT from 17% to 13%

A More Diversified Market
21
In 2019, Zhejiang and Hengli PC will bring the aromatics version of OTC on board, and ExxonMobil will bring the olefins version to Huizhou, China years later. Meanwhile the first ethane VLEC will arrive in China and the first ACO unit gets into production.
China Ethylene Capacity Share by Process 2025 China Propylene Capacity Share by Process 2025
Ethylene-Based26%
Coal-based74%
Ethylene Glycol
China Ethylene Glycol Capacity Share by Process 2025
Naphtha Cracking
69%
ACO1%
DCC1%
MTO5%
CTO14%
Ethane Cracking
5%
LPG Cracking3%
OTC2%
Ethylene
FCC22%
Naphtha Cracking
37%
CTP3%
MTP1%
MTO5%
CTO15%
PDH17%
Propylene
0%
10%
20%
30%
40%
50%
60%
70%
80%
90%
100%
-200
-150
-100
-50
0
50
100
150
200
250
300
350
2000 2005 2010 2015 2020 2025 2030
Margin Index Self-sufficiency Index
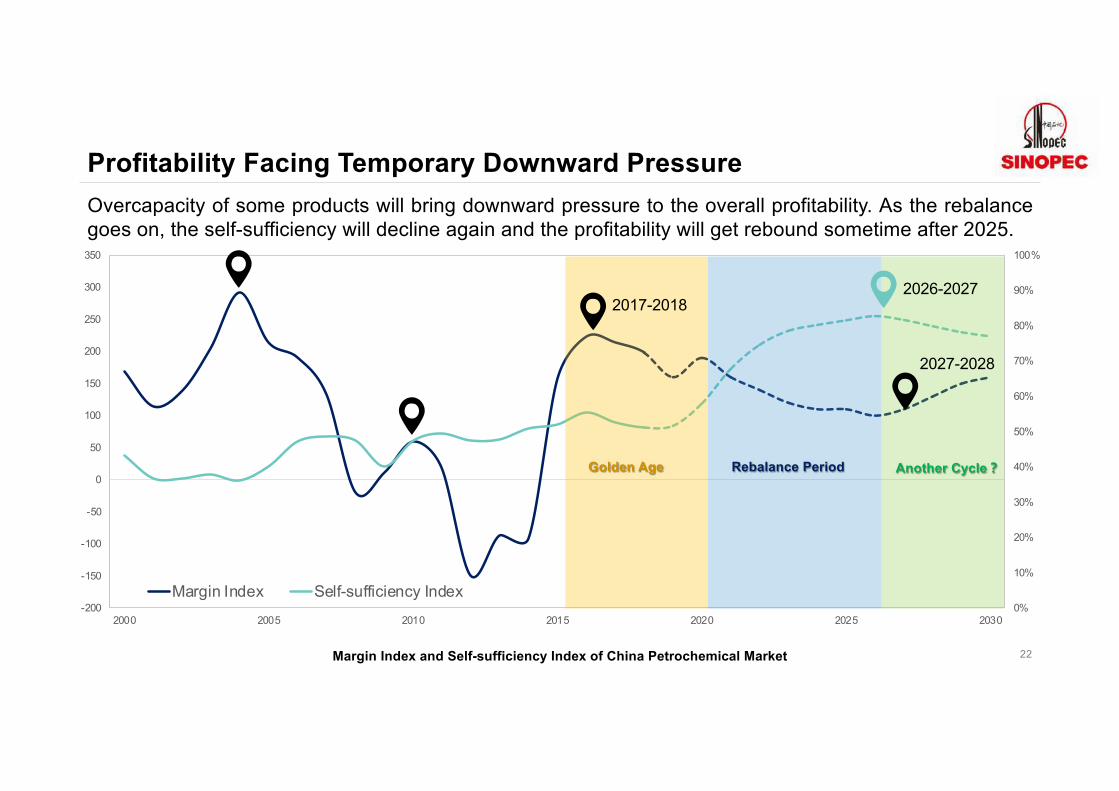
Profitability Facing Temporary Downward Pressure
22
Overcapacity of some products will bring downward pressure to the overall profitability. As the rebalance
goes on, the self-sufficiency will decline again and the profitability will get rebound sometime after 2025.
Margin Index and Self-sufficiency Index of China Petrochemical Market
2026-2027
2027-2028
2017-2018
Rebalance PeriodGolden Age Another Cycle�

Consolidation on the Way
23
Stricter environment regulations and fierce competition are forcing the disadvantages out of the games.Rapid decreasing small companies/units and climbing concentration ratio indicate the on-going consolidation.
concentration
ratio+27%
-18%
201525200
201624500
201723300 2018
21300
Numbers of enterprises above designated size
Takeaways
24
• As the largest producer and consumer, China petrochemical market to maintain a steady annualdemand growth of 6-7% and a capacity growth of 9-10% before 2025.
• Opportunities are emerging from massive urbanization, consumption upgrading, infrastructureconstruction, e-commerce, environmental protection business and further opening up.
• China will take more imports from the Middle East and U.S., as the polymers gap of China will bewidening up by 5 million tons by 2025.
• Steady economy and huge demand will help the market to get rebalanced quickly. And a rebound isexpected sometime after 2025.

Q&A
China Refining Industry Outlook
and Oil Demand Peak
March 25, 2019Xiaoming KE

CONTENTS 1
In the future: oil demand growth shifting from fuel-driven to petrochemical feedstock-driven
3 Transformation and upgrading of refining industry in China under a new round of investment
2
The refining industry in China ranking among the top in the world
The refining industry in China ranking among the top in the world
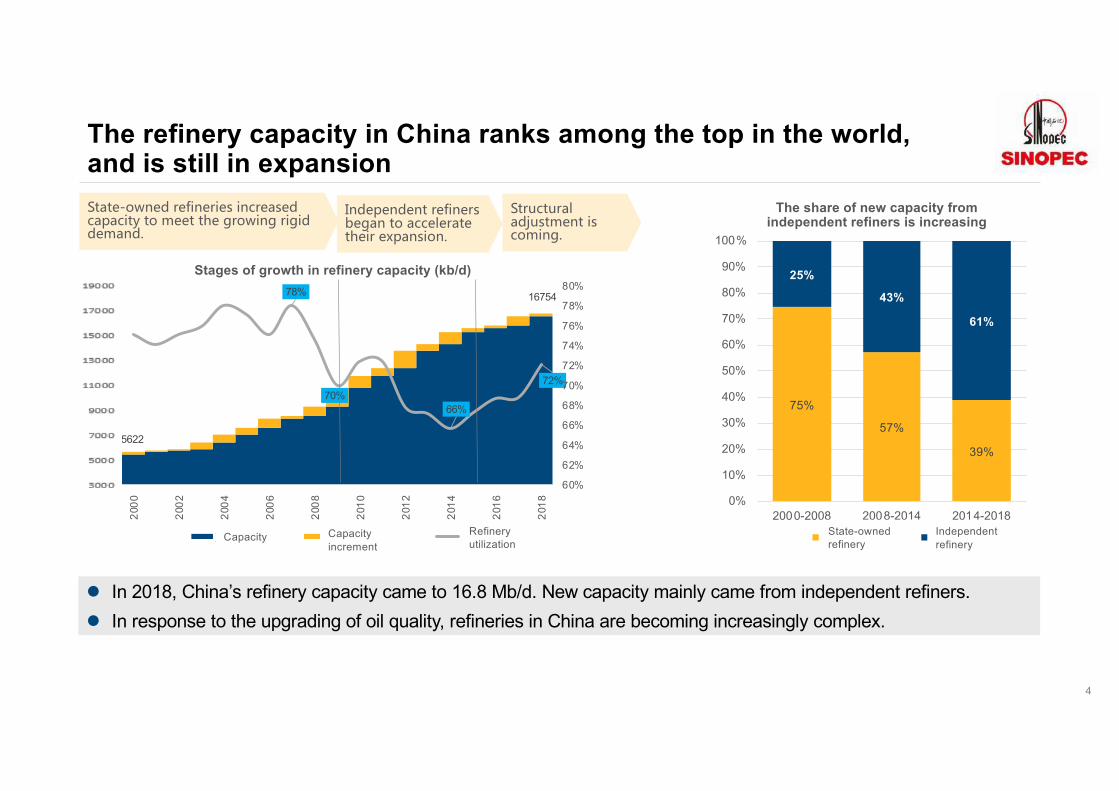
The refinery capacity in China ranks among the top in the world, and is still in expansion
4
-. - -
.-. - -
l In 2018, China’s refinery capacity came to 16.8 Mb/d. New capacity mainly came from independent refiners.l In response to the upgrading of oil quality, refineries in China are becoming increasingly complex.
75%
57%
39%
25%
43%
61%
0%
10%
20%
30%
40%
50%
60%
70%
80%
90%
100%
2000-2008 2008-2014 2014-2018
The share of new capacity from independent refiners is increasing
State-owned refinery
5622
1675478%
70%66%
72%
60%
62%
64%
66%
68%
70%
72%
74%
76%
78%
80%
15000
25000
35000
45000
55000
65000
75000
85000
95000
2000
2002
2004
2006
2008
2010
2012
2014
2016
2018
Stages of growth in refinery capacity (kb/d)
Capacity Capacity increment
Refinery utilization
Independent refinery
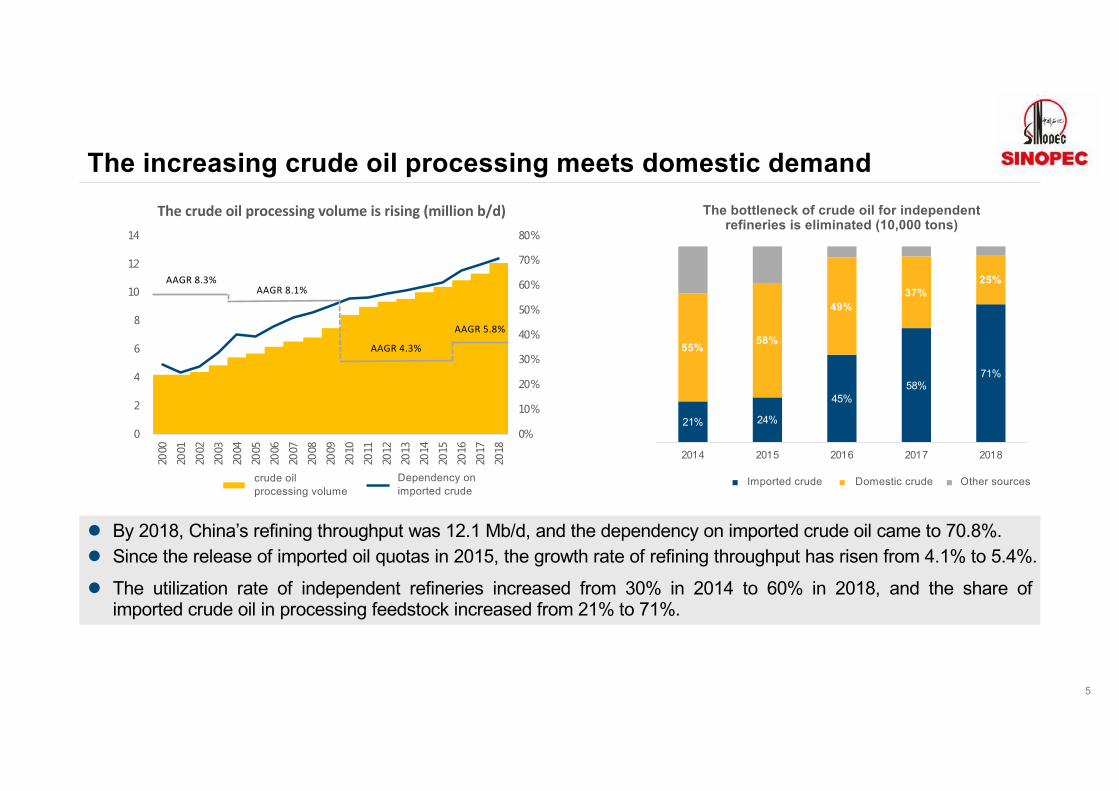
The increasing crude oil processing meets domestic demand
5
l By 2018, China’s refining throughput was 12.1 Mb/d, and the dependency on imported crude oil came to 70.8%.l Since the release of imported oil quotas in 2015, the growth rate of refining throughput has risen from 4.1% to 5.4%.
l The utilization rate of independent refineries increased from 30% in 2014 to 60% in 2018, and the share ofimported crude oil in processing feedstock increased from 21% to 71%.
%
The crude oil processing volume is rising (million b/d)
3 15 0 2
AAGR 8.3%AAGR 8.1%
AAGR 4.3%
AAGR 5.8%
crude oil processing volume
Dependency on imported crude
21% 24%
45%58%
71%
55% 58%
49%37%
25%
0%
10 %
20 %
30 %
40 %
50 %
60 %
70 %
80 %
90 %
10 0%
2014 2015 2016 2017 2018
The bottleneck of crude oil for independent refineries is eliminated (10,000 tons)
4 3 3Imported crude Domestic crude Other sources
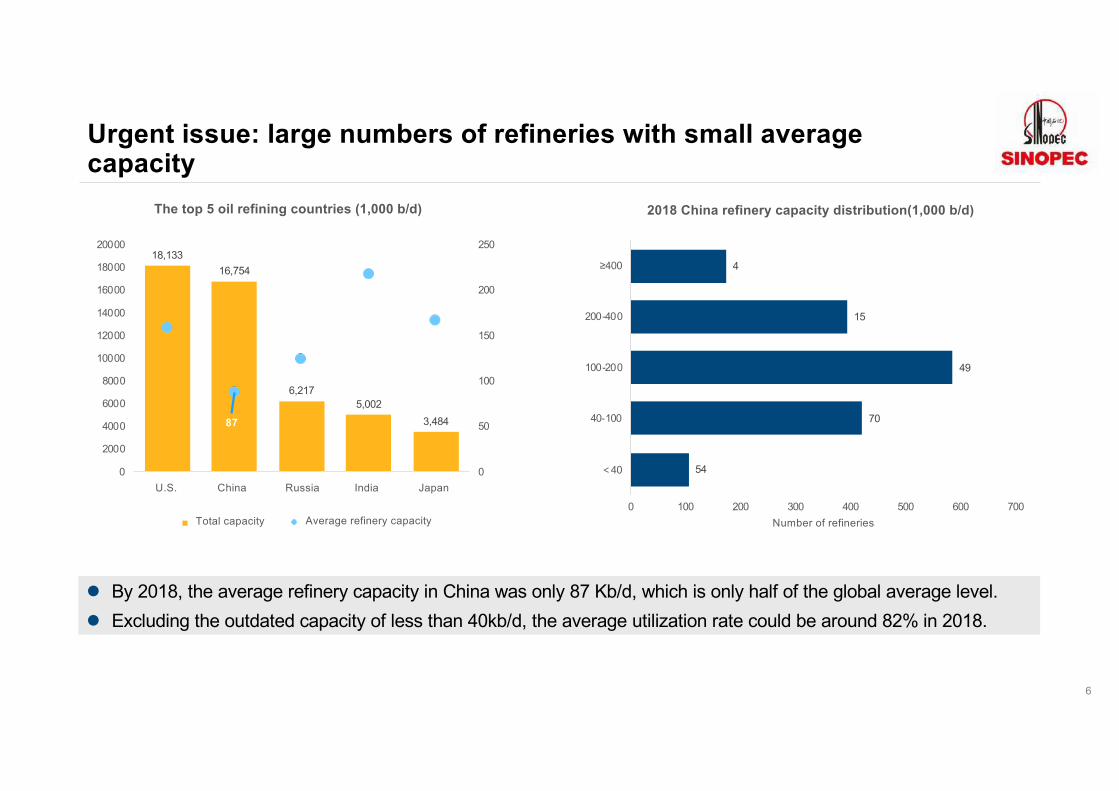
Urgent issue: large numbers of refineries with small average capacity
6
l By 2018, the average refinery capacity in China was only 87 Kb/d, which is only half of the global average level.l Excluding the outdated capacity of less than 40kb/d, the average utilization rate could be around 82% in 2018.
54
70
49
15
4
0 100 200 300 400 500 600 700
�40
40-100
100-200
200-400
≥400
Number of refineries
2018 China refinery capacity distribution(1,000 b/d)
18,133 16,754
6,217 5,002
3,484 87
0
50
100
150
200
250
0
2000
4000
6000
8000
10000
12000
14000
16000
18000
20000
�� �� �� �� �
The top 5 oil refining countries (1,000 b/d)
Total capacity Average refinery capacity
U.S. China Russia India Japan
In the future: Oil demand growth shifting from fuel-driven to petrochemical feedstock-driven
8
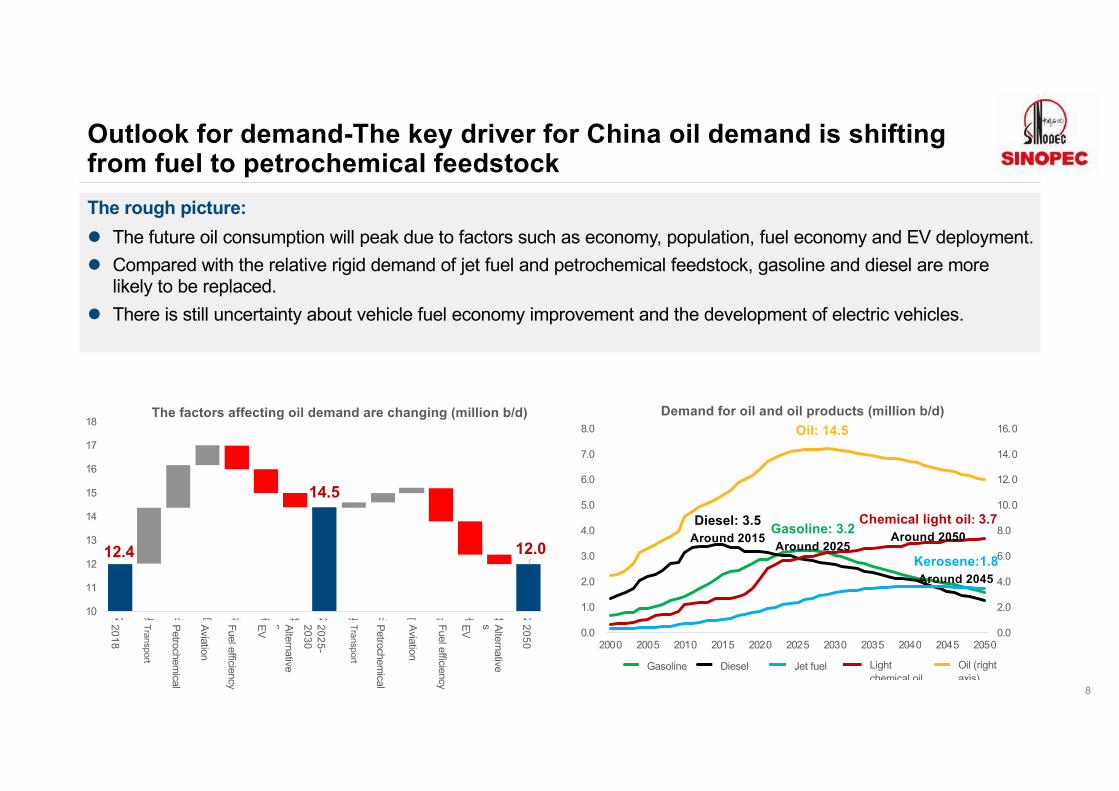
Outlook for demand-The key driver for China oil demand is shifting from fuel to petrochemical feedstockThe rough picture:l The future oil consumption will peak due to factors such as economy, population, fuel economy and EV deployment.
l Compared with the relative rigid demand of jet fuel and petrochemical feedstock, gasoline and diesel are more
likely to be replaced.
l There is still uncertainty about vehicle fuel economy improvement and the development of electric vehicles.
12.4
14.5
12.0
10
11
12
13
14
15
16
17
18
2018
�
��
��
��
���
����
�
2025-2
030
�
��
��
��
���
����
�
2050
�
The factors affecting oil demand are changing (million b/d)
20
18
Alte
rnativ
e
s Alte
rnativ
e
sTra
nsport
Petro
chem
ical
Avia
tion
Fuel e
fficie
ncy
EV
20
25
-
20
30
EV
Fuel e
fficie
ncy
Avia
tion
Petro
chem
ical
Tra
nsport
20
50
0.0
2.0
4.0
6.0
8.0
10.0
12.0
14.0
16.0
0.0
1.0
2.0
3.0
4.0
5.0
6.0
7.0
8.0
2000 2005 2010 2015 2020 2025 2030 2035 2040 2045 2050
Demand for oil and oil products (million b/d)
� � � ��� � -�
Chemical light oil: 3.7Around 2050
Diesel: 3.5Around 2015
Gasoline: 3.2Around 2025
Kerosene:1.8Around 2045
Oil: 14.5
Light
chemical oil
Oil (right
axis)
Gasoline Diesel Jet fuel
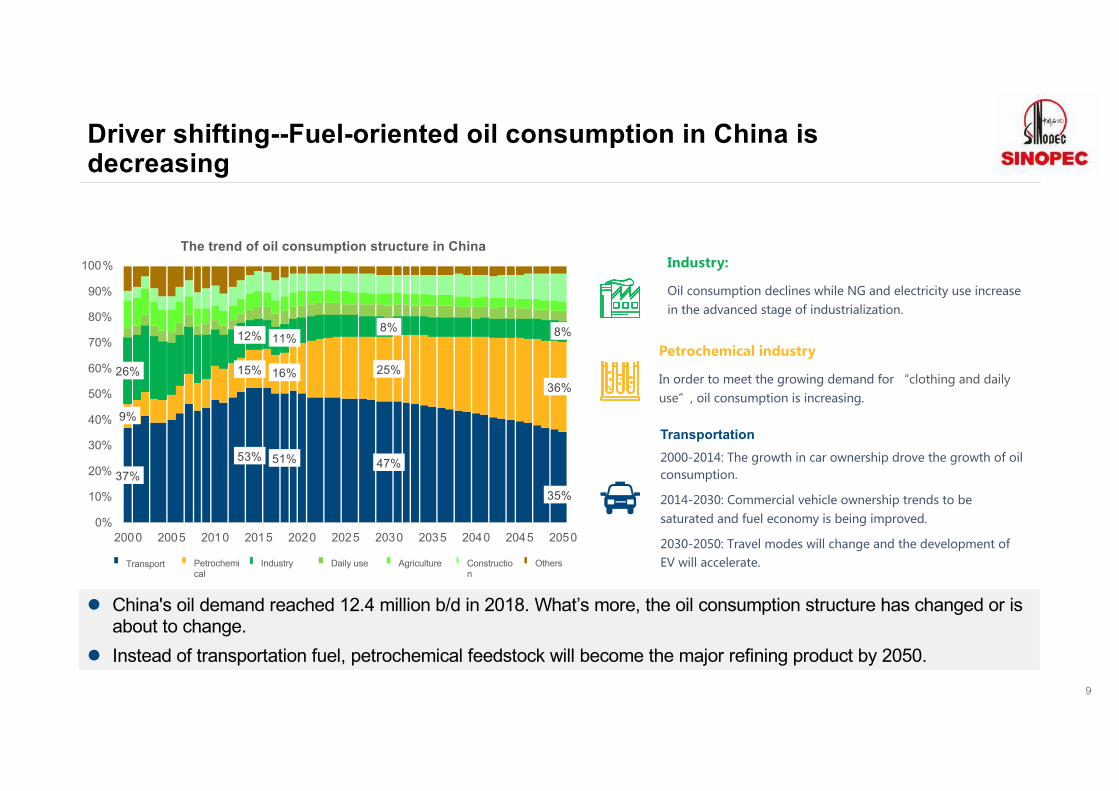
Driver shifting--Fuel-oriented oil consumption in China is decreasing
9
l China's oil demand reached 12.4 million b/d in 2018. What’s more, the oil consumption structure has changed or is about to change.
l Instead of transportation fuel, petrochemical feedstock will become the major refining product by 2050.
37%53% 51% 47%
35%
9%
15% 16% 25%36%
26%
12% 11%8% 8%
0%
10%
20%
30%
40%
50%
60%
70%
80%
90%
100%
2000 2005 2010 2015 2020 2025 2030 2035 2040 2045 2050
The trend of oil consumption structure in China
G NO ITransport Industry Daily useTransport
0: : 120 2 5 2 . 1 2 20 0 2 0 2. 252 .1 . 021 .42 :3 1 . C. :
: 12 : 22 52 4 : 4 12 . 1 3: 0 : 5 4 . 1 1.2E : 0: : 0 2. 4
Transportation ,52 4 : 5 0. : 2 5 1 : 2 52 4 : 5 :3 :
0: :
: 2 0 . 25 0 2 : 2 5 2 1 : 2. . 21 . 1 3 2 20: : 2 4 : 21
, . 2 :12 05. 42 . 1 52 12 2 : 2 :3- .002 2 . 2Petrochemi
calAgriculture Constructio
nOthers

Macro driver- Large potential of per capita consumption and the gradually emerging demographic impact
10
l Compared with other countries, the energy consumption per capita GDP of China is still rising.l In the future, China's GDP growth will slow down, but the quality of economic growth will be improved. l The fertility rate is declining in China and the population will peak before 2030.
13.7 14.2
13.4
12%
25%
10.0
11.0
12.0
13.0
14.0
15.0
2015 2020 2025 2030 2035 2040 2045 2050
The population in China is aging (100 million)
��� ����-�Total population
0.0
0.5
1.0
1.5
2.0
2.5
3.0
3.5
4.0
4.5
0 10000 20000 30000 40000 50000 60000
Kg per capita
US$ per capita
GDP per capita & Energy consumption per capita
�� � �� ��
Oil consumption peaked
Germany Japan Korea U.S. China Elderly population
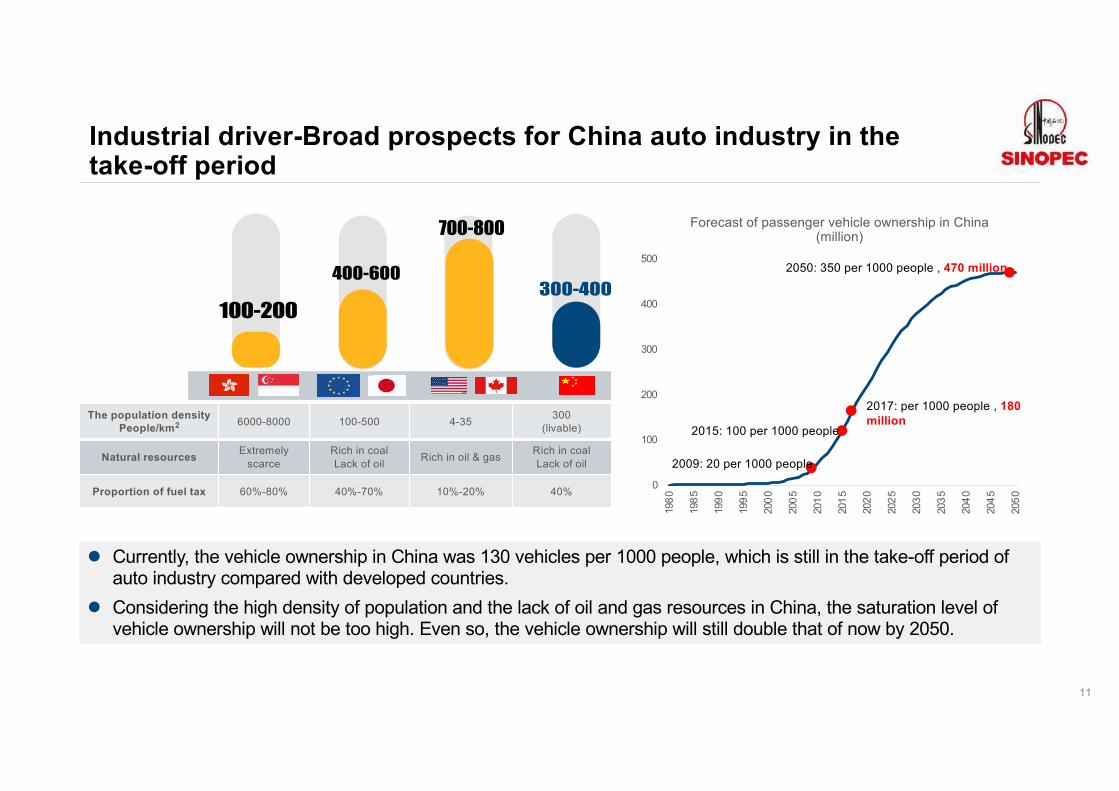
The population densityPeople/km2 6000-8000 100-500 4-35
300
(livable)
Natural resources Extremely
scarce
Rich in coal
Lack of oilRich in oil & gas
Rich in coal
Lack of oil
Proportion of fuel tax 60%-80% 40%-70% 10%-20% 40%
Industrial driver-Broad prospects for China auto industry in the take-off period
l Currently, the vehicle ownership in China was 130 vehicles per 1000 people, which is still in the take-off period of
auto industry compared with developed countries.
l Considering the high density of population and the lack of oil and gas resources in China, the saturation level of
vehicle ownership will not be too high. Even so, the vehicle ownership will still double that of now by 2050.
0
100
200
300
400
500
198
0
198
5
199
0
199
5
200
0
200
5
201
0
201
5
202
0
202
5
203
0
203
5
204
0
204
5
205
0
Forecast of passenger vehicle ownership in China
(million)
2009: 20 per 1000 people
2015: 100 per 1000 people
2017: per 1000 people , 180 million
2050: 350 per 1000 people , 470 million
11
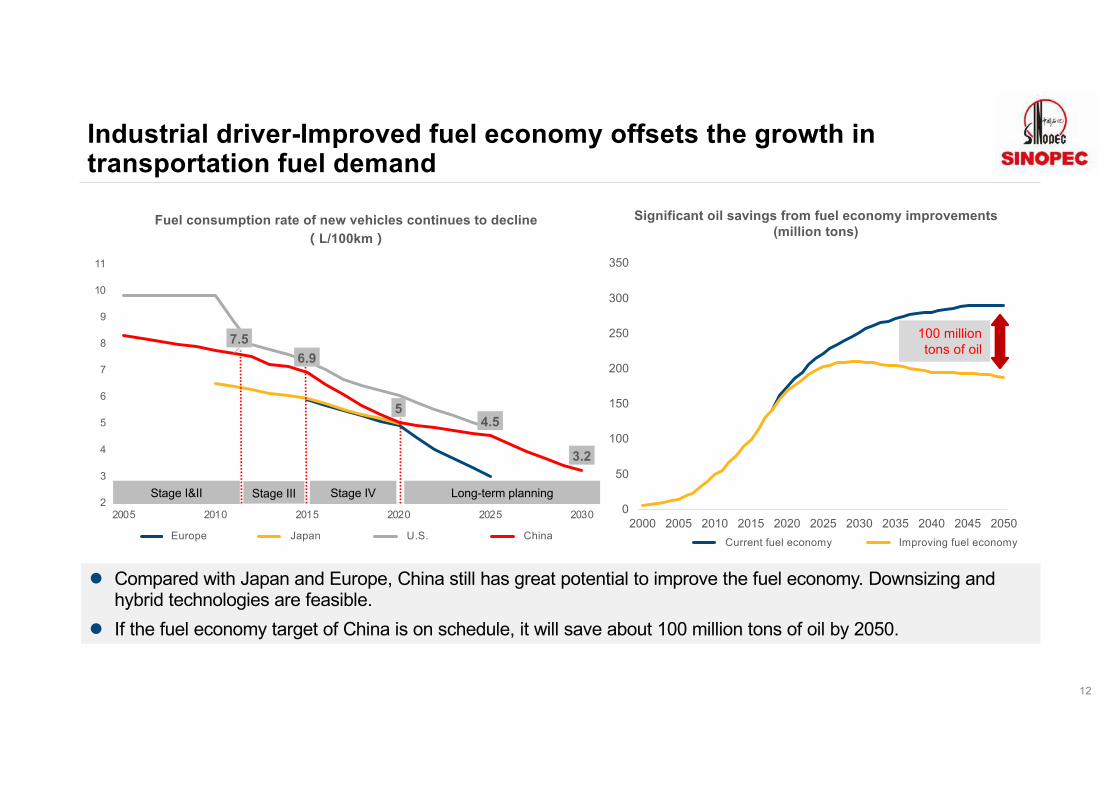
Industrial driver-Improved fuel economy offsets the growth in transportation fuel demand
12
7.56.9
54.5
3.2
2
3
4
5
6
7
8
9
10
11
2005 2010 2015 2020 2025 2030
Fuel consumption rate of new vehicles continues to decline�L/100km�
� �� �� �� Europe
Stage I&II Stage III Stage IV Long-term planning
l Compared with Japan and Europe, China still has great potential to improve the fuel economy. Downsizing and hybrid technologies are feasible.
l If the fuel economy target of China is on schedule, it will save about 100 million tons of oil by 2050.
0
50
100
150
200
250
300
350
2000 2005 2010 2015 2020 2025 2030 2035 2040 2045 2050
����� ����
100 million tons of oil
Improving fuel economy
Significant oil savings from fuel economy improvements (million tons)
Japan U.S. ChinaCurrent fuel economy
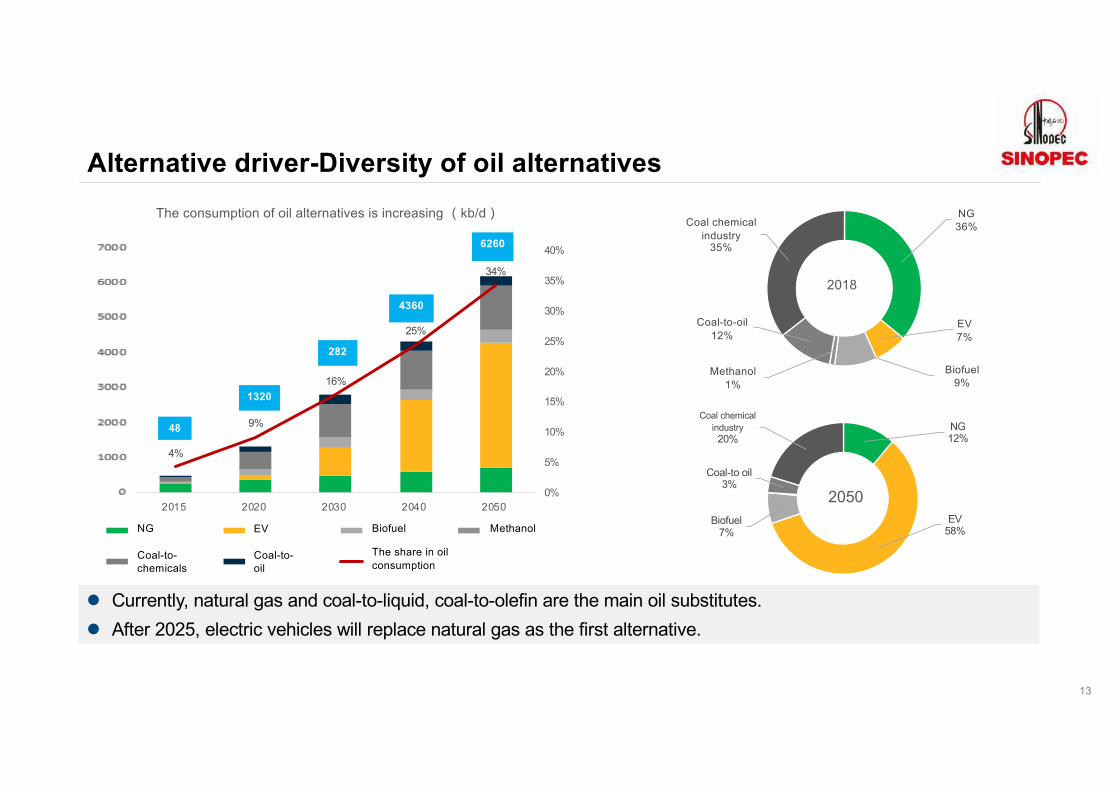
Alternative driver-Diversity of oil alternatives
13
l Currently, natural gas and coal-to-liquid, coal-to-olefin are the main oil substitutes. l After 2025, electric vehicles will replace natural gas as the first alternative.
NG36%
EV7%
Biofuel9%
Methanol1%
Coal-to-oil12%
Coal chemical industry
35%
2018
NG12%
EV58%
Biofuel7%
Coal-to oil3%
Coal chemical industry20%
2050
4%
9%
16%
25%
34%
0%
5%
10%
15%
20%
25%
30%
35%
40%
0
5000
10000
15000
20000
25000
30000
35000
2015 2020 2030 2040 2050
The consumption of oil alternatives is increasing �kb/d�
��� ���� ��� ��
�� ��� ���� ��
48
1320
282
4360
6260
The share in oil consumption
NG EV Biofuel Methanol
Coal-to-chemicals
Coal-to-oil
14
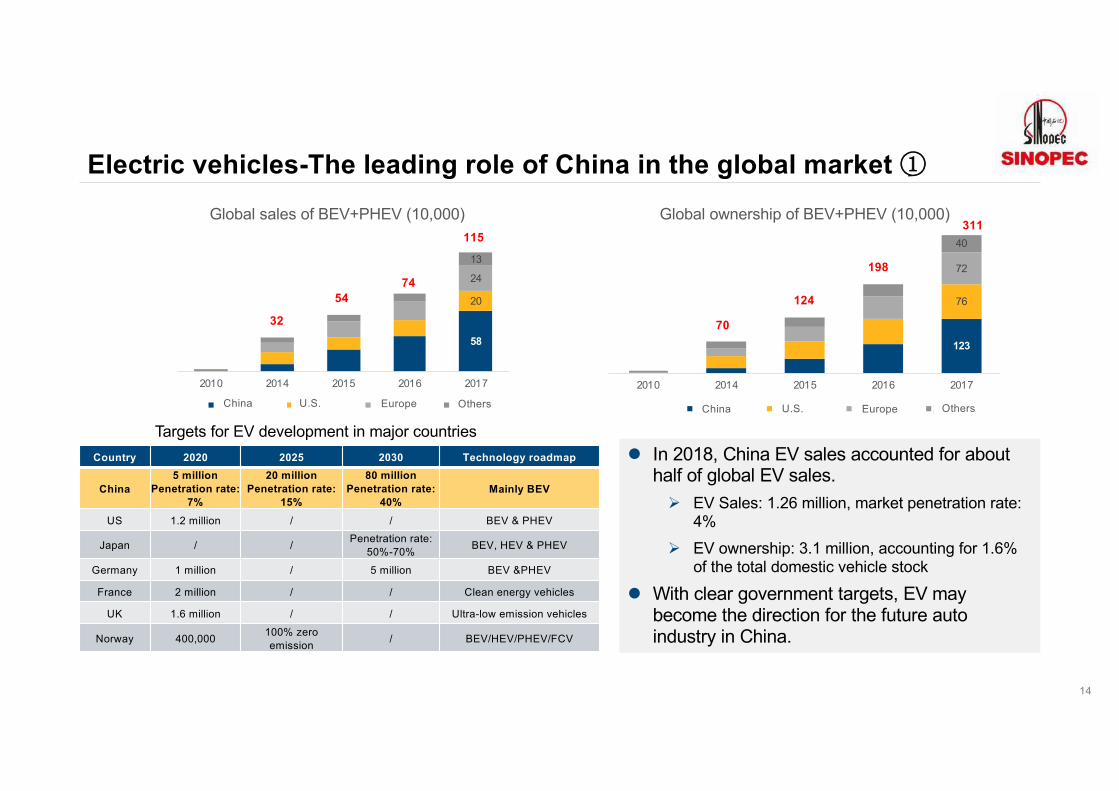
Electric vehicles-The leading role of China in the global market �
Targets for EV development in major countriesl In 2018, China EV sales accounted for about
half of global EV sales.Ø EV Sales: 1.26 million, market penetration rate:
4%Ø EV ownership: 3.1 million, accounting for 1.6%
of the total domestic vehicle stock
l With clear government targets, EV may become the direction for the future auto industry in China.
Country 2020 2025 2030 Technology roadmap
China5 million
Penetration rate: 7%
20 millionPenetration rate:
15%
80 millionPenetration rate:
40%Mainly BEV
US 1.2 million / / BEV & PHEV
Japan / / Penetration rate: 50%-70% BEV, HEV & PHEV
Germany 1 million / 5 million BEV &PHEV
France 2 million / / Clean energy vehicles
UK 1.6 million / / Ultra-low emission vehicles
Norway 400,000 100% zeroemission / BEV/HEV/PHEV/FCV
58
20
24
13
2010 2014 2015 2016 2017
Global sales of BEV+PHEV (10,000)
�� �� �� ��
115
7454
32
OthersChina U.S. Europe
123
76
72
40
2010 2014 2015 2016 2017
Global ownership of BEV+PHEV (10,000)
�� �� �� ��
311
198
124
70
China U.S. Europe Others
Electric vehicles-The decisive period: 2025-2030 �
15
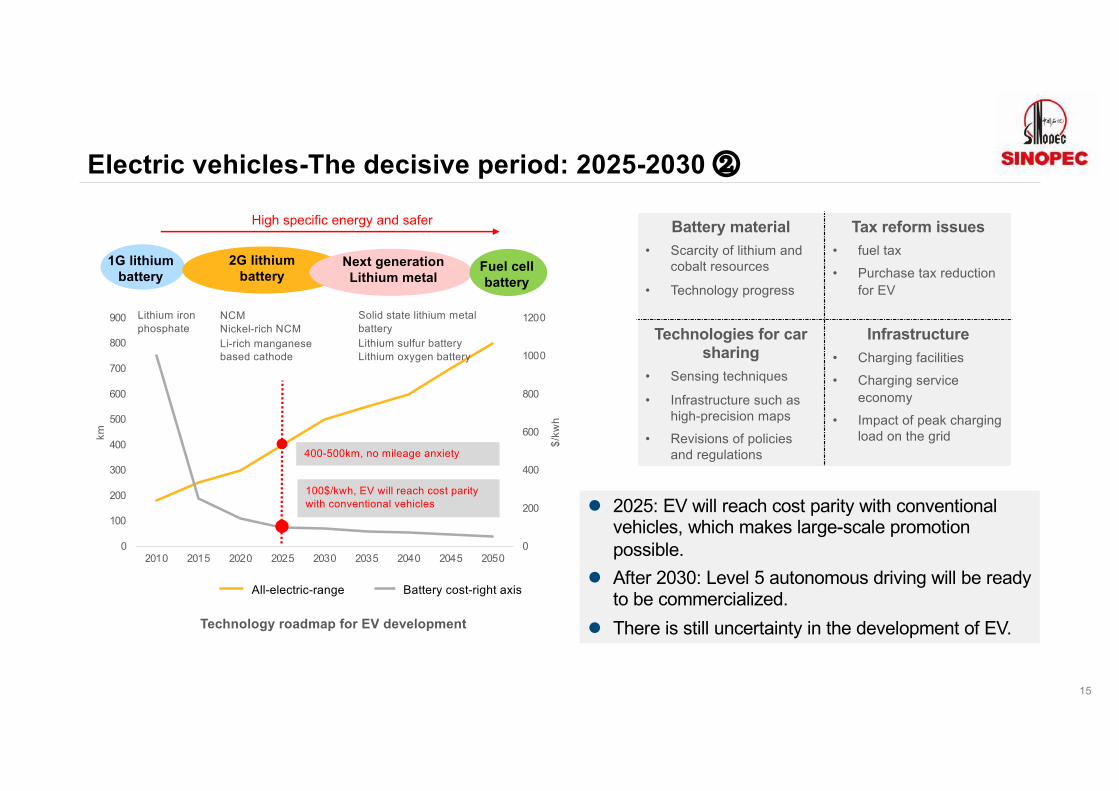
l 2025: EV will reach cost parity with conventional vehicles, which makes large-scale promotion possible.
l After 2030: Level 5 autonomous driving will be ready to be commercialized.
l There is still uncertainty in the development of EV.
Battery material• Scarcity of lithium and
cobalt resources
• Technology progress
Tax reform issues• fuel tax• Purchase tax reduction
for EV
Technologies for car sharing
• Sensing techniques
• Infrastructure such as high-precision maps
• Revisions of policies and regulations
Infrastructure• Charging facilities• Charging service
economy• Impact of peak charging
load on the grid
Technology roadmap for EV development
0
200
400
600
800
1000
1200
0
100
200
300
400
500
600
700
800
900
2010 2015 2020 2025 2030 2035 2040 2045 2050$/
kwh
km
��� ����-�
1G lithium battery
2G lithium battery
Next generationLithium metal
Fuel cell battery
Lithium iron phosphate
NCMNickel-rich NCMLi-rich manganese based cathode
Solid state lithium metal batteryLithium sulfur batteryLithium oxygen battery
400-500km, no mileage anxiety
100$/kwh, EV will reach cost parity with conventional vehicles
High specific energy and safer
All-electric-range Battery cost-right axis
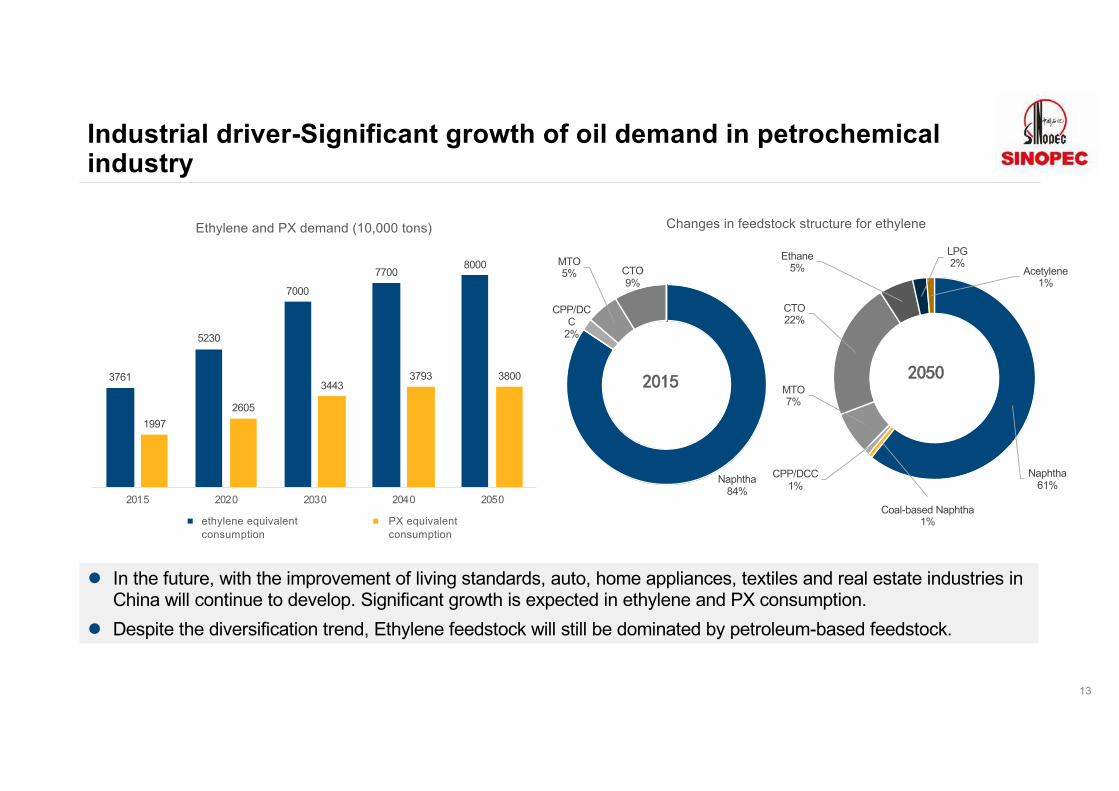
Industrial driver-Significant growth of oil demand in petrochemical industry
Naphtha84%
CPP/DCC
2%
MTO5% CTO
9%
����
Naphtha61%
Coal-based Naphtha1%
CPP/DCC1%
MTO7%
CTO22%
Ethane5%
LPG2%
Acetylene1%
����
l In the future, with the improvement of living standards, auto, home appliances, textiles and real estate industries in China will continue to develop. Significant growth is expected in ethylene and PX consumption.
l Despite the diversification trend, Ethylene feedstock will still be dominated by petroleum-based feedstock.
3761
5230
7000
77008000
1997
2605
34433793 3800
10
1010
2010
3010
4010
5010
6010
7010
8010
9010
2015 2020 2030 2040 2050
Ethylene and PX demand (10,000 tons)
������� ��PX���
Changes in feedstock structure for ethylene
ethylene equivalent consumption
PX equivalent consumption
13
Transformation and upgrading of refining industry in China under a new round of investment
18
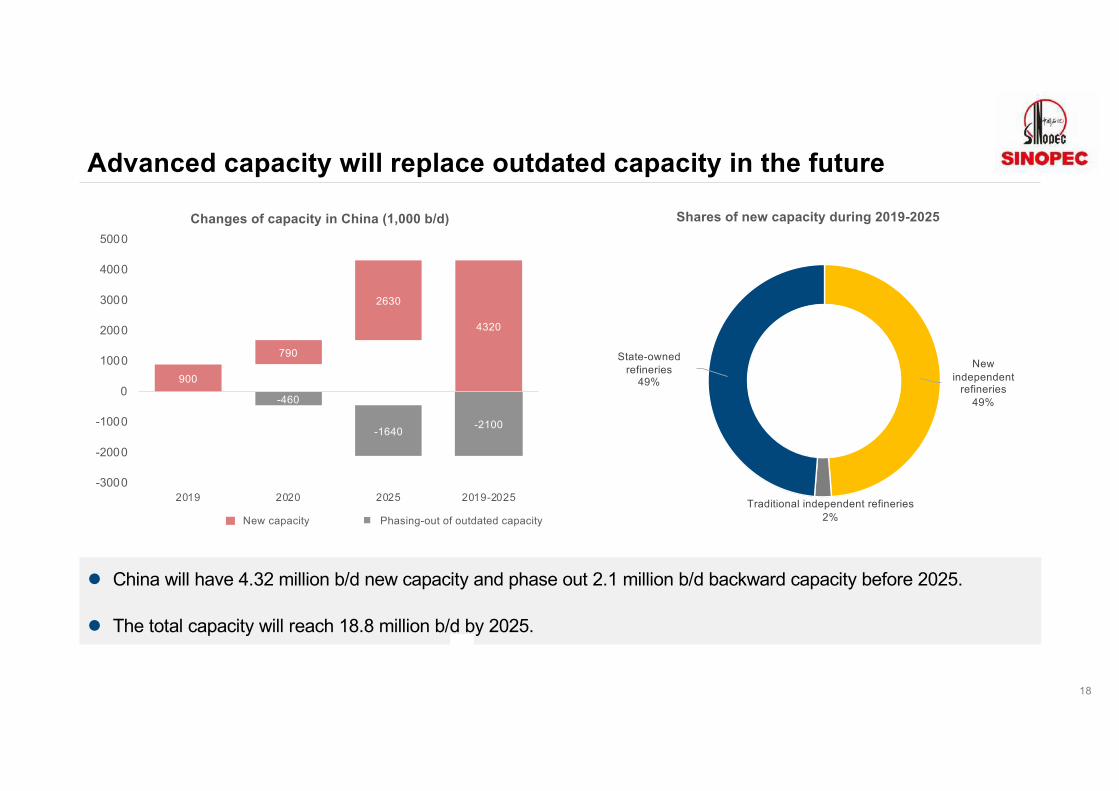
Advanced capacity will replace outdated capacity in the future
l China will have 4.32 million b/d new capacity and phase out 2.1 million b/d backward capacity before 2025.
l The total capacity will reach 18.8 million b/d by 2025.
New independent
refineries49%
Traditional independent refineries2%
State-owned refineries
49%
Shares of new capacity during 2019-2025
900
4320
790
2630
-460
-2100-1640
-3000
-2000
-1000
0
1000
2000
3000
4000
5000
2019 2020 2025 2019-2025
Changes of capacity in China (1,000 b/d)
���� ����New capacity Phasing-out of outdated capacity
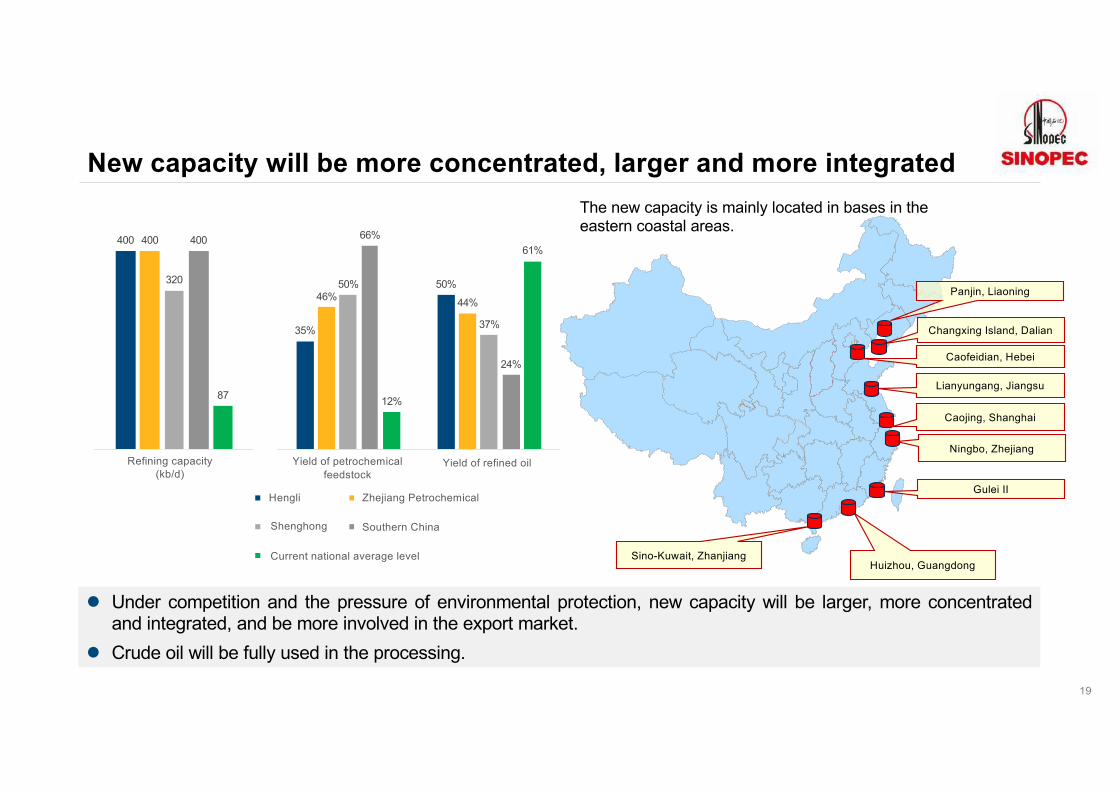
New capacity will be more concentrated, larger and more integrated
19
The new capacity is mainly located in bases in the eastern coastal areas.
l Under competition and the pressure of environmental protection, new capacity will be larger, more concentratedand integrated, and be more involved in the export market.
l Crude oil will be fully used in the processing.
400 400
320
400
87
�������/��
35%
50%46% 44%
50%
37%
66%
24%
12%
61%
����� �����
�� ��
�� �*
�����
Hengli Zhejiang Petrochemical
Southern China
Huizhou, Guangdong
Gulei II
Ningbo, Zhejiang
Lianyungang, Jiangsu
Changxing Island, Dalian
Panjin, Liaoning
Sino-Kuwait, Zhanjiang
Caojing, Shanghai
Caofeidian, Hebei
Shenghong
Current national average level
Refining capacity(kb/d)
Yield of petrochemical feedstock
Yield of refined oil
19
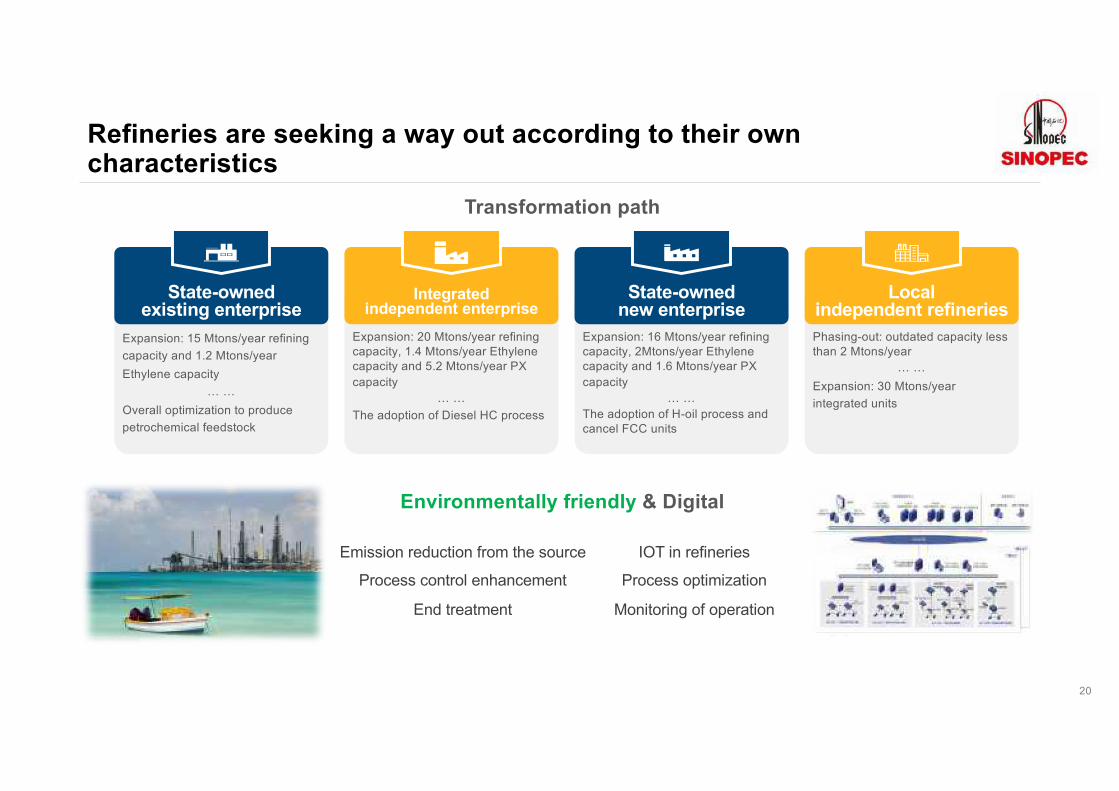
Refineries are seeking a way out according to their own characteristics
Expansion: 15 Mtons/year refining capacity and 1.2 Mtons/year Ethylene capacity
… …Overall optimization to produce petrochemical feedstock
State-owned existing enterprise
Expansion: 20 Mtons/year refining capacity, 1.4 Mtons/year Ethylene capacity and 5.2 Mtons/year PX capacity
… …The adoption of Diesel HC process
Integratedindependent enterprise
Expansion: 16 Mtons/year refining capacity, 2Mtons/year Ethylene capacity and 1.6 Mtons/year PX capacity
… …The adoption of H-oil process and cancel FCC units
State-owned new enterprise
Phasing-out: outdated capacity less than 2 Mtons/year
… …Expansion: 30 Mtons/year integrated units
Localindependent refineries
Transformation path
Emission reduction from the source
Process control enhancement
End treatment
IOT in refineries
Process optimization
Monitoring of operation
Environmentally friendly & Digital
20
21
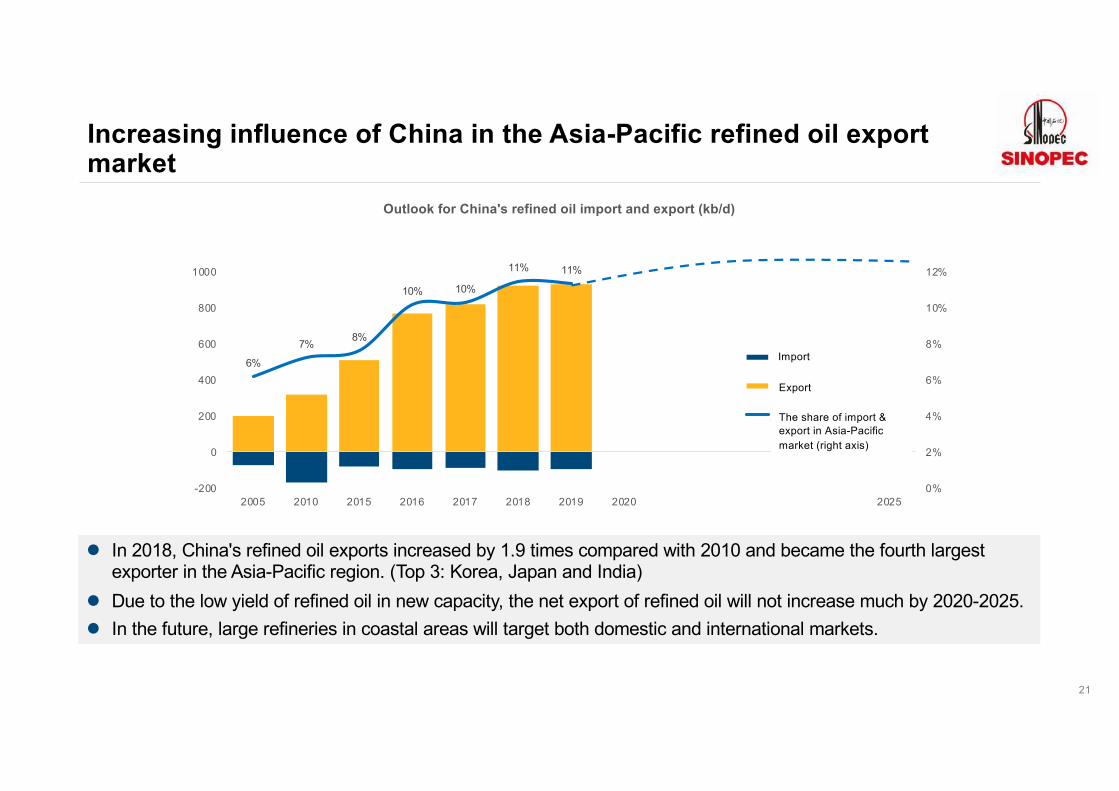
Increasing influence of China in the Asia-Pacific refined oil export market
l In 2018, China's refined oil exports increased by 1.9 times compared with 2010 and became the fourth largest exporter in the Asia-Pacific region. (Top 3: Korea, Japan and India)
l Due to the low yield of refined oil in new capacity, the net export of refined oil will not increase much by 2020-2025.l In the future, large refineries in coastal areas will target both domestic and international markets.
6%
7% 8%
10% 10%
11% 11%
0%
2%
4%
6%
8%
10%
12%
-200
0
200
400
600
800
1000
2005 2010 2015 2016 2017 2018 2019 2020 2025
Outlook for China's refined oil import and export (kb/d)
�
��
���������-�
Import
Export
The share of import & export in Asia-Pacific market (right axis)
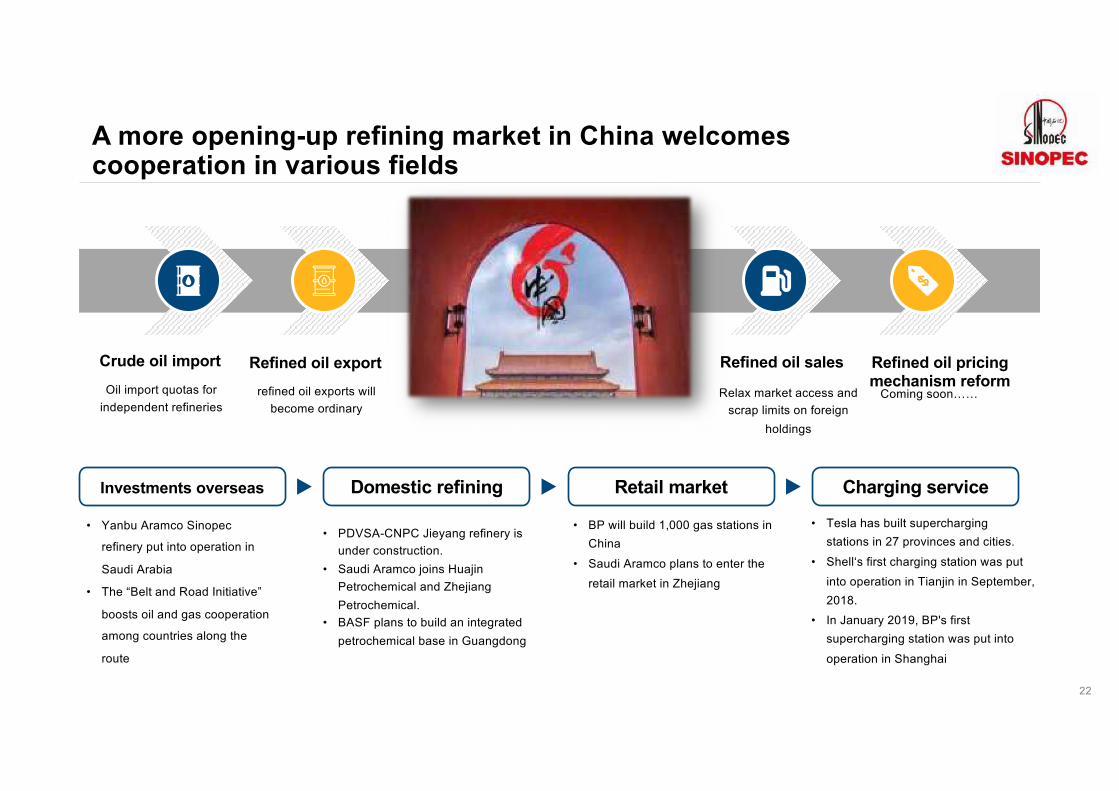
A more opening-up refining market in China welcomes cooperation in various fields
Investments overseas
• Yanbu Aramco Sinopec
refinery put into operation in
Saudi Arabia
• The “Belt and Road Initiative”
boosts oil and gas cooperation
among countries along the
route
Domestic refining
• PDVSA-CNPC Jieyang refinery is
under construction.
• Saudi Aramco joins Huajin
Petrochemical and Zhejiang
Petrochemical.
• BASF plans to build an integrated
petrochemical base in Guangdong
Retail market
• BP will build 1,000 gas stations in
China
• Saudi Aramco plans to enter the
retail market in Zhejiang
Charging service
• Tesla has built supercharging
stations in 27 provinces and cities.
• Shell‘s first charging station was put
into operation in Tianjin in September,
2018.
• In January 2019, BP's first
supercharging station was put into
operation in Shanghai
Oil import quotas for
independent refineries
Crude oil import
refined oil exports will
become ordinary
Refined oil export
Relax market access and
scrap limits on foreign
holdings
Refined oil sales
Coming soon……
Refined oil pricing mechanism reform
22
Thank you

China’s Energy Transition and
Development Path
Report series of China energy and petrochemical industry
Zuoxian LuoMarch 20th 2019
CONTENTS
1. Evolution of China's Energy Supply and Demand Structure
2. Coal Demand and Development Trend
3. Oil Demand and Development Trend
Gas Demand and Development Trend
Non-fossil Energy Demand and Development Trend
4.
5.
Future Energy Demand and International Cooperation6.

Evolution on China's Energy
Supply and Demand

Energy production and consumption have maintained growth and energy self-sufficiency has declined
• Energy consumption grew; Supply stable;
• Self-sufficiency rate :
111.8% (1985) to 98.2% (1992), 93.7% (2000) and 79% (2018).
• Domestic oil and gas production is stable.
• Growth of oil and gas consumption replaces coal.
• 2018, coal consumption dropped to 59%, 10 % lower than in 2000.
4
39
Coal Oil Gas
R/Preserve reserve R/Preserve
36.75.5 trillion cubic m³18.33.5 billion tons138.8 billion tons
R/P

5
Industrialization
2018: proportion of tertiary
industry 51.6%
2030:60.3%
2018:1.40 billion
2029:1.44 billion, peak
Population Urbanization Economic Growth
2018:60%
2030:70%
2018:GDP growth 6.9%
2030:GDP growth 5%
China Key economic development indexes estimated
6
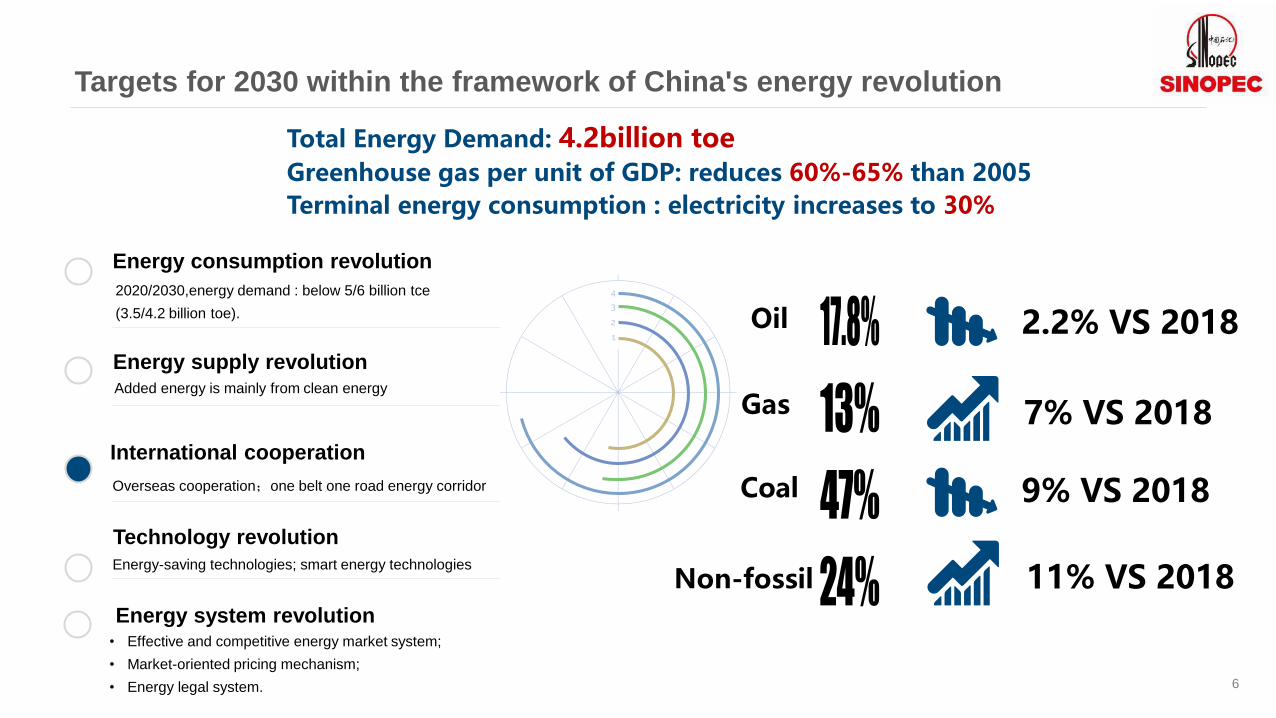
Oil
Gas
Coal
Non-fossil
2.2% VS 2018
7% VS 2018
9% VS 2018
11% VS 2018
Targets for 2030 within the framework of China's energy revolution
Total Energy Demand: 4.2billion toeGreenhouse gas per unit of GDP: reduces 60%-65% than 2005
Terminal energy consumption : electricity increases to 30%
2020/2030,energy demand : below 5/6 billion tce
(3.5/4.2 billion toe).
Energy consumption revolution
Added energy is mainly from clean energy
Energy supply revolution
Overseas cooperation;one belt one road energy corridor
International cooperation
Energy-saving technologies; smart energy technologies
Technology revolution
• Effective and competitive energy market system;
• Market-oriented pricing mechanism;
• Energy legal system.
Energy system revolution
Coal Demand and Development Trend

0
5
10
15
20
25
30
35
40
45
Coal consumption, production and imports(100 million tons)
consumption production import
8
• Consumption increased
• Imports increased
1990-
2005
2005-
2013
2013-
Three stages of China's coal
consumption since 1990
• Steady development;
• Production exceeded consumption
• Self-sufficiency
• Energy conservation
• Emission reduction
• Energy structure transition
• Cutting the backward capacity
• Encourage the import of high-quality coal
2005, difference between consumption and
production expand, coal imports accelerated.
2013, coal consumption and
imports peaking at the same time.
Since 2005, China's dependence ratio on foreign coal remained between 6% and 7.5%. The external dependence ratio of 2018 is 7.3%.
Coal consumption reached its peak on 2013
Consumption:2.4 billion tons
Production : 2.3 billion tons
Consumption:4.2 billion tons
Imports : 0.3 billion tons
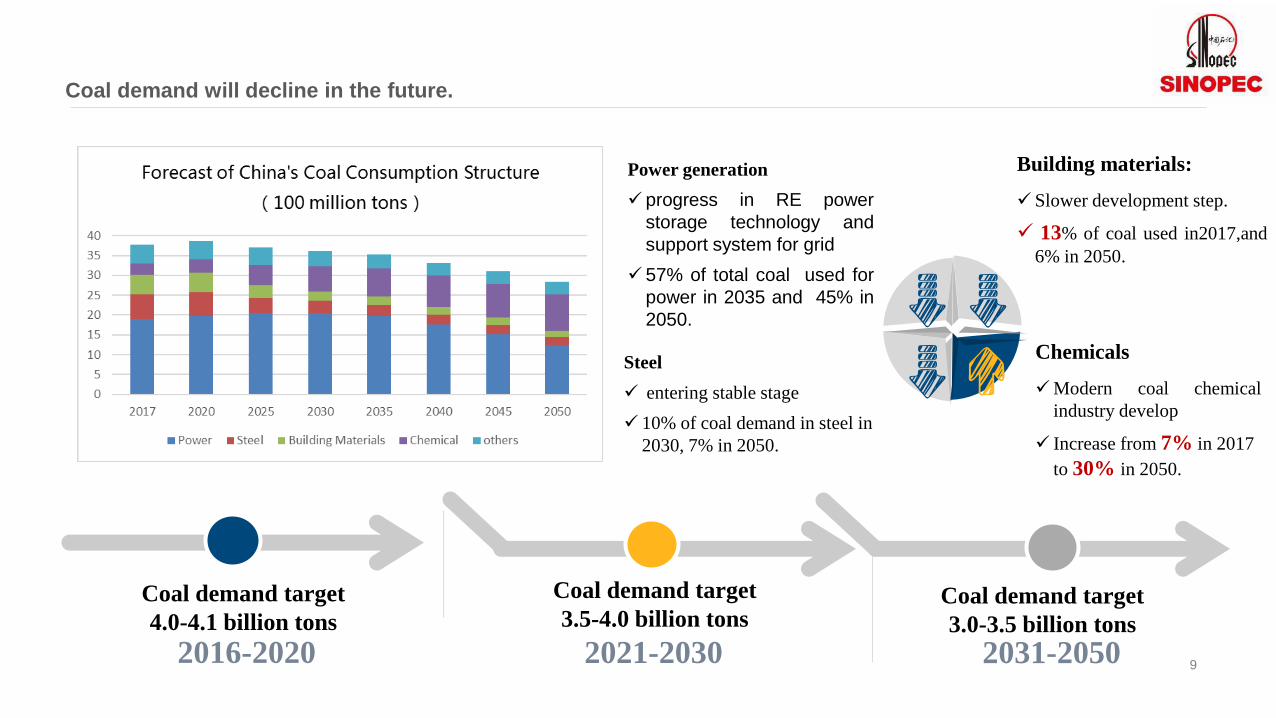
Coal demand target
4.0-4.1 billion tons
Coal demand target
3.5-4.0 billion tons
2016-2020 2021-2030 2031-2050
Coal demand will decline in the future.
Power generation
✓ progress in RE power
storage technology and
support system for grid
✓ 57% of total coal used for
power in 2035 and 45% in
2050.
Steel
✓ entering stable stage
✓ 10% of coal demand in steel in
2030, 7% in 2050.
Building materials:
✓ Slower development step.
✓ 13% of coal used in2017,and
6% in 2050.
Chemicals
✓Modern coal chemical
industry develop
✓ Increase from 7% in 2017
to 30% in 2050.
Coal demand target
3.0-3.5 billion tons
9

10
Optimization of coal industry is to mainly promote construction of integrated base
International cooperation in science and
technology promote base construction
Around 2020, the output of 14 large coal bases will be 3.7 billion tons, accounting for
more than 95% of the total coal production.
Coal production Coal clean
energy base
Coal power Chemical production
Coal to oil (gas)
Power grid
transmissionPipeline
transportation
Land
transportation
Olefins, etc.
Base construction:
coal production, chemical conversion,
electricity, building materials integrated

Oil Demand and Development Trend
0.0%
10.0%
20.0%
30.0%
40.0%
50.0%
60.0%
70.0%
80.0%
0
10000
20000
30000
40000
50000
60000
70000
2000 2001 2002 2003 2004 2005 2006 2007 2008 2009 2010 2011 2012 2013 2014 2015 2016 2017 2018
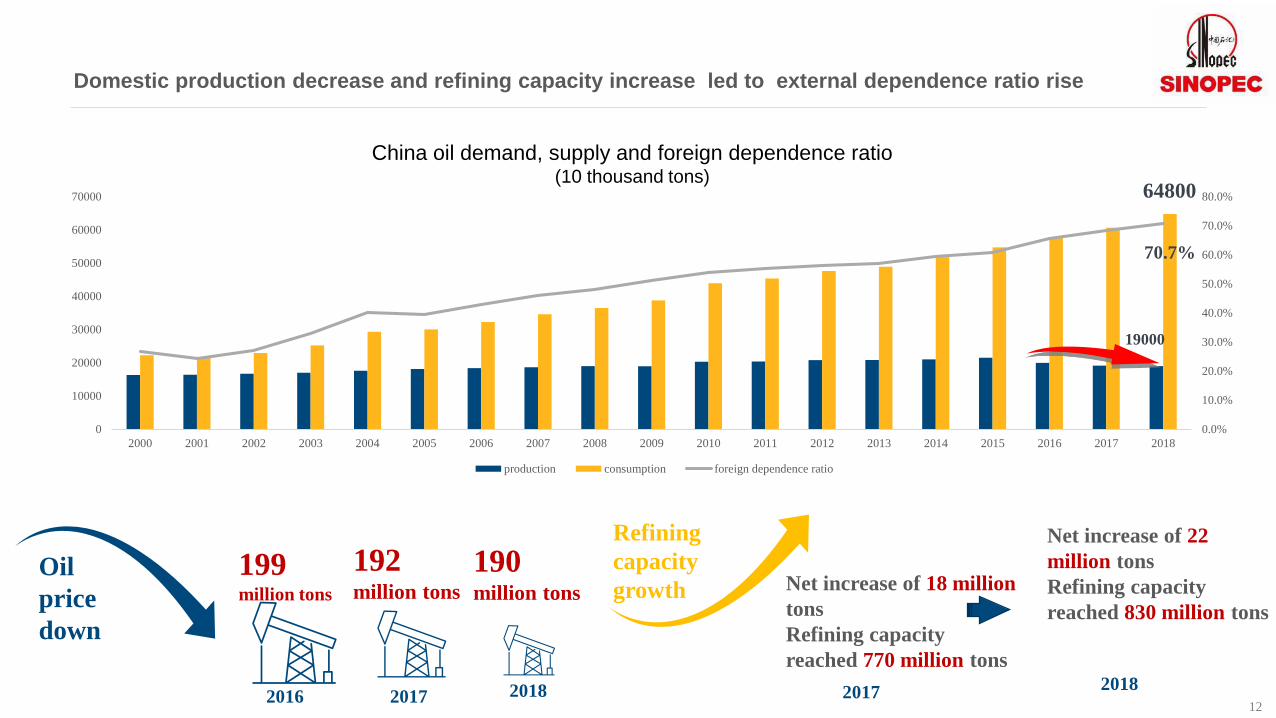
China oil demand, supply and foreign dependence ratio
(10 thousand tons)
production consumption foreign dependence ratio
12
Domestic production decrease and refining capacity increase led to external dependence ratio rise
Oil
price
down
2016
199 million tons
2017
192million tons
2018
190million tons
Refining
capacity
growth
2017 2018
Net increase of 18 million
tons
Refining capacity
reached 770 million tons
Net increase of 22
million tons
Refining capacity
reached 830 million tons
64800
19000
70.7%
China oil demand, supply and foreign dependence ratio(10 thousand tons)

0
1000
2000
3000
4000
5000
6000
7000
Oil imports by major countries(10 thousand tons)
Imports in 2000 Imports in 2017
13
Importing country in 2000
New importing countries in 2017
• 2000: 30 importing countries, covering the Middle East, Africa, Europe/former Soviet Union, the Americas and the Asia-
Pacific region. The import volume was led by the Middle East, nearly 38 million tons, far exceeding other regions.
• 2017: 43 importing countries, 13 of which were added and mainly from Africa, America and Europe. Most of the new
imports came from the Middle East and Europe, with Saudi Arabia increase more than 45 million tons.
China has more oil trade partners in the world
2017 imports of
52 million tons
2000 imports of
16 million tons
14
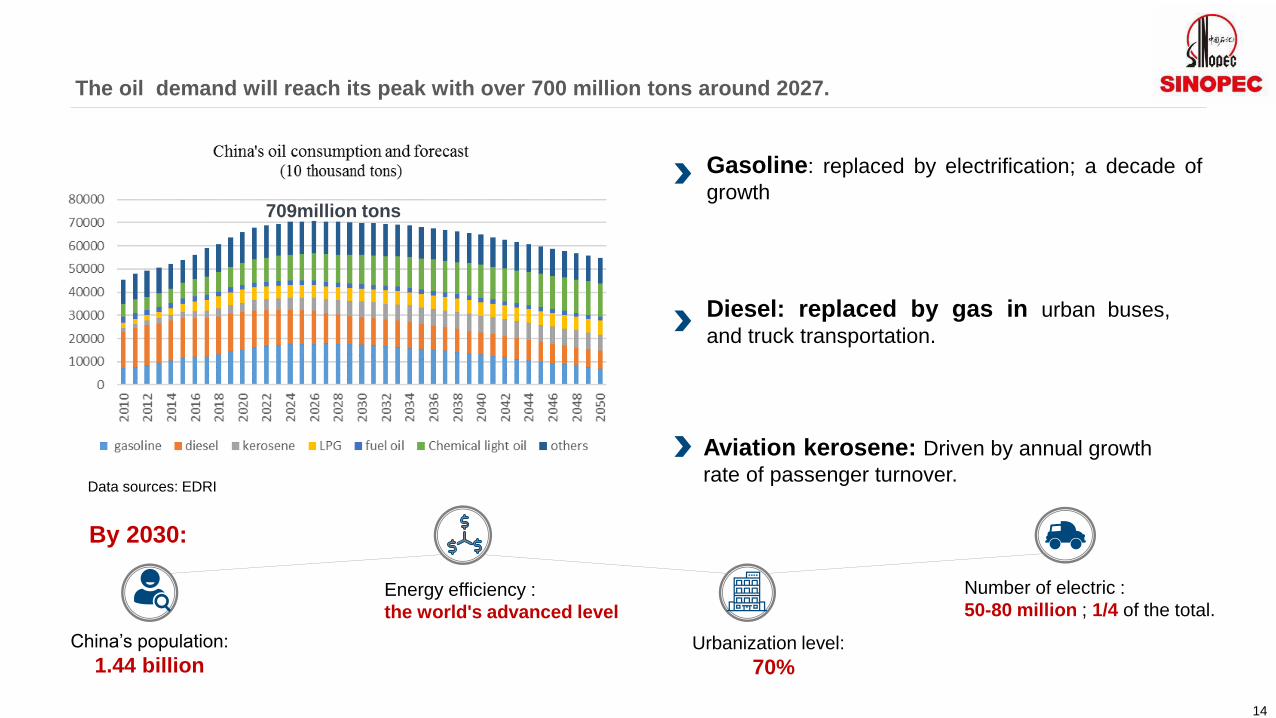
The oil demand will reach its peak with over 700 million tons around 2027.
China’s population:
1.44 billion
Energy efficiency :
the world's advanced level
Urbanization level:
70%
Number of electric :
50-80 million ; 1/4 of the total.
Data sources: EDRI
Aviation kerosene: Driven by annual growth
rate of passenger turnover.
Gasoline: replaced by electrification; a decade of
growth
Diesel: replaced by gas in urban buses,
and truck transportation.
709million tons
By 2030:

15
Resource
Unconve-
ntionalsOutput
Resource
Conversion
Rate
✓Rich in petroleum
✓35% proven, and has
potential
✓ Resource conversion rate is
Low
✓ Improving recovery and
conversion rate through
technological progress
✓ Shale oil and oil sands
are rich.
✓The State Key Laboratory
of Shale Oil has been set
up .
✓Diversified investors
✓Oil production will have
space for growth
Domestic supply: widen E&P fields and EOR technologies
Natural Gas Demand and Development Trend
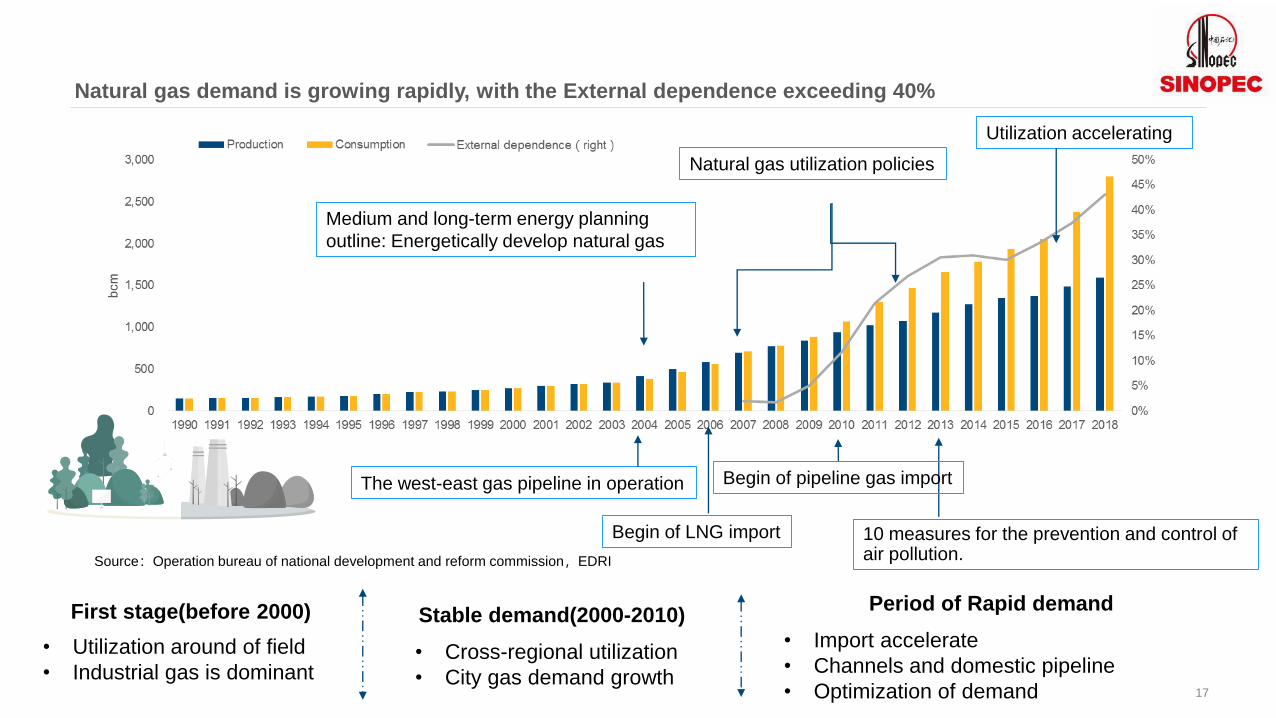
Source:Operation bureau of national development and reform commission,EDRI
Natural gas demand is growing rapidly, with the External dependence exceeding 40%
17
The west-east gas pipeline in operation
Natural gas utilization policies
Medium and long-term energy planning
outline: Energetically develop natural gas
First stage(before 2000)
• Utilization around of field
• Industrial gas is dominant
Stable demand(2000-2010)
• Cross-regional utilization
• City gas demand growth
Begin of LNG import
Begin of pipeline gas import
Period of Rapid demand
• Import accelerate
• Channels and domestic pipeline
• Optimization of demand
10 measures for the prevention and control of air pollution.
Utilization accelerating
18
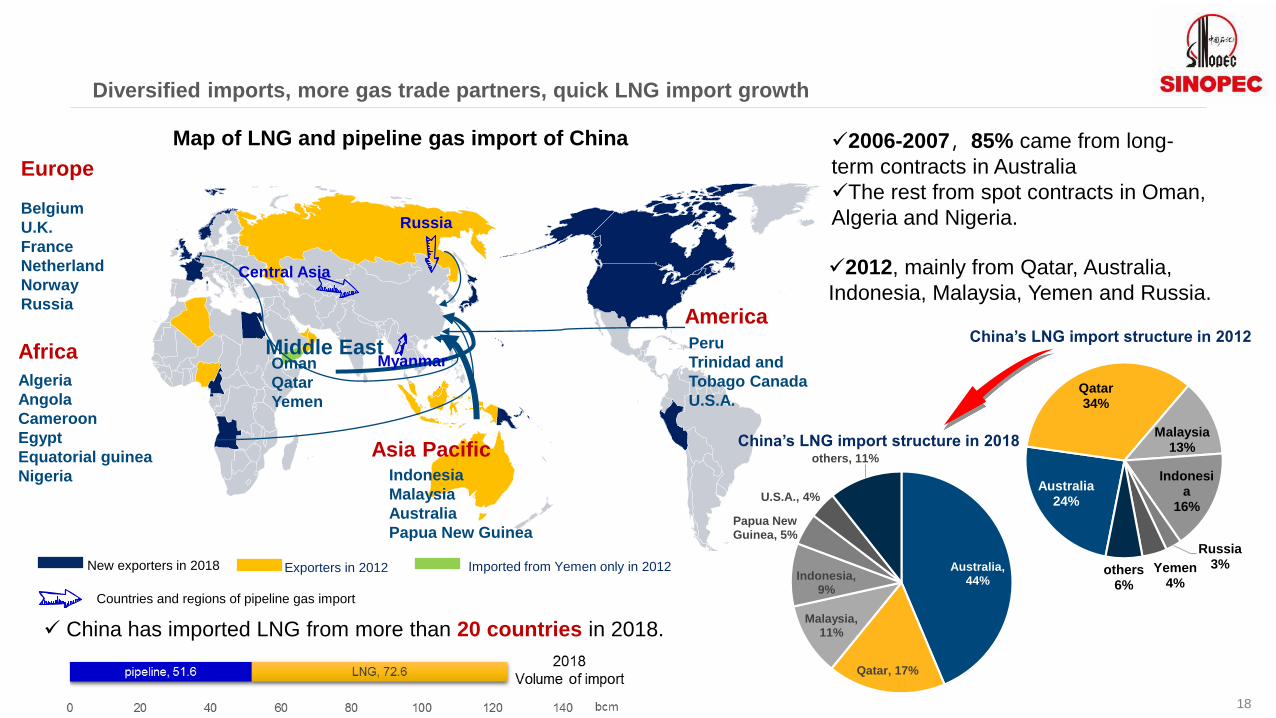
Diversified imports, more gas trade partners, quick LNG import growth
✓2006-2007,85% came from long-
term contracts in Australia
✓The rest from spot contracts in Oman,
Algeria and Nigeria.
Middle EastOman
Qatar
Yemen
Asia PacificIndonesia
Malaysia
Australia
Papua New Guinea
Europe
Belgium
U.K.
France
Netherland
Norway
RussiaAmericaPeru
Trinidad and
Tobago Canada
U.S.A.
Africa
Algeria
Angola
Cameroon
Egypt
Equatorial guinea
Nigeria
Map of LNG and pipeline gas import of China
Exporters in 2012 Imported from Yemen only in 2012
✓2012, mainly from Qatar, Australia,
Indonesia, Malaysia, Yemen and Russia.
Australia24%
Qatar34%
Malaysia13%
Indonesia
16%
Russia3%Yemen
4%others
6%
China’s LNG import structure in 2012
✓ China has imported LNG from more than 20 countries in 2018.
New exporters in 2018
Russia
Countries and regions of pipeline gas import
Myanmar
Central Asia
Australia, 44%
Qatar, 17%
Malaysia, 11%
Indonesia, 9%
Papua New Guinea, 5%
U.S.A., 4%
others, 11%
China’s LNG import structure in 2018
2018
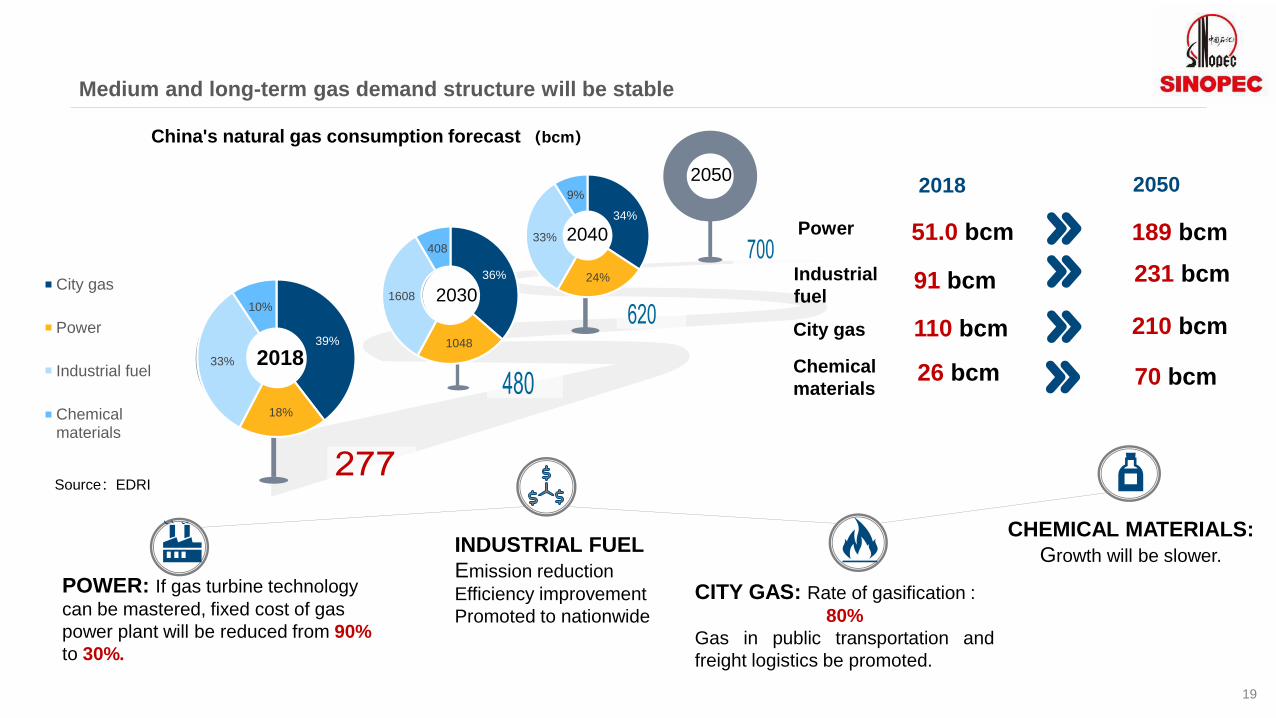
2030
2040
2050
Source:EDRI
China's natural gas consumption forecast (bcm)
Power 51.0 bcm
Industrial
fuel
City gas
Chemical
materials
91 bcm
110 bcm
26 bcm
189 bcm
231 bcm
210 bcm
70 bcm
20502018
POWER: If gas turbine technology
can be mastered, fixed cost of gas
power plant will be reduced from 90%
to 30%.
INDUSTRIAL FUEL
Emission reduction
Efficiency improvement
Promoted to nationwide
CITY GAS: Rate of gasification :
80%
Gas in public transportation and
freight logistics be promoted.
CHEMICAL MATERIALS:
Growth will be slower.
34%
24%
33%
9%
39%
18%
33%
10%
City gas
Power
Industrial fuel
Chemicalmaterials
36%
1048
1608
408
19
Medium and long-term gas demand structure will be stable
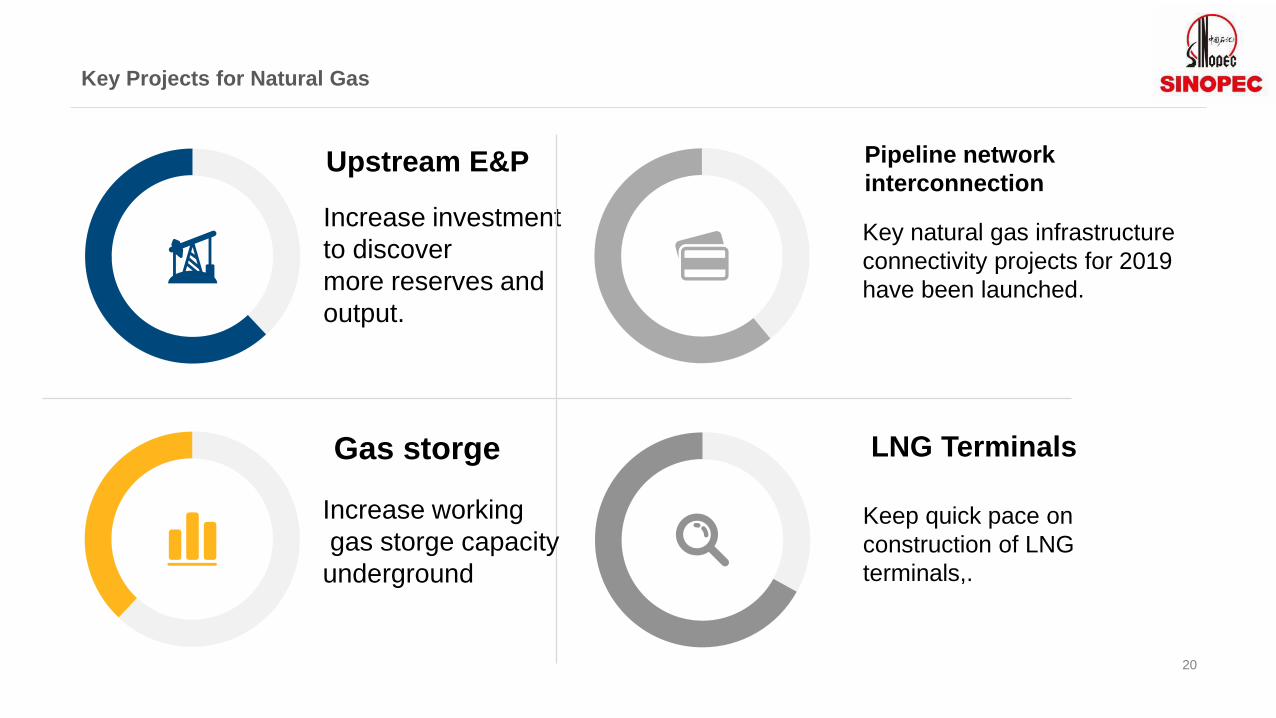
20
Upstream E&P
Increase investment
to discover
more reserves and
output.
Key Projects for Natural Gas
Gas storge
Increase working
gas storge capacity
underground
Pipeline network
interconnection
Key natural gas infrastructure
connectivity projects for 2019
have been launched.
LNG Terminals
Keep quick pace on
construction of LNG
terminals,.
Non-fossil Energy Demand and Development Trend
22
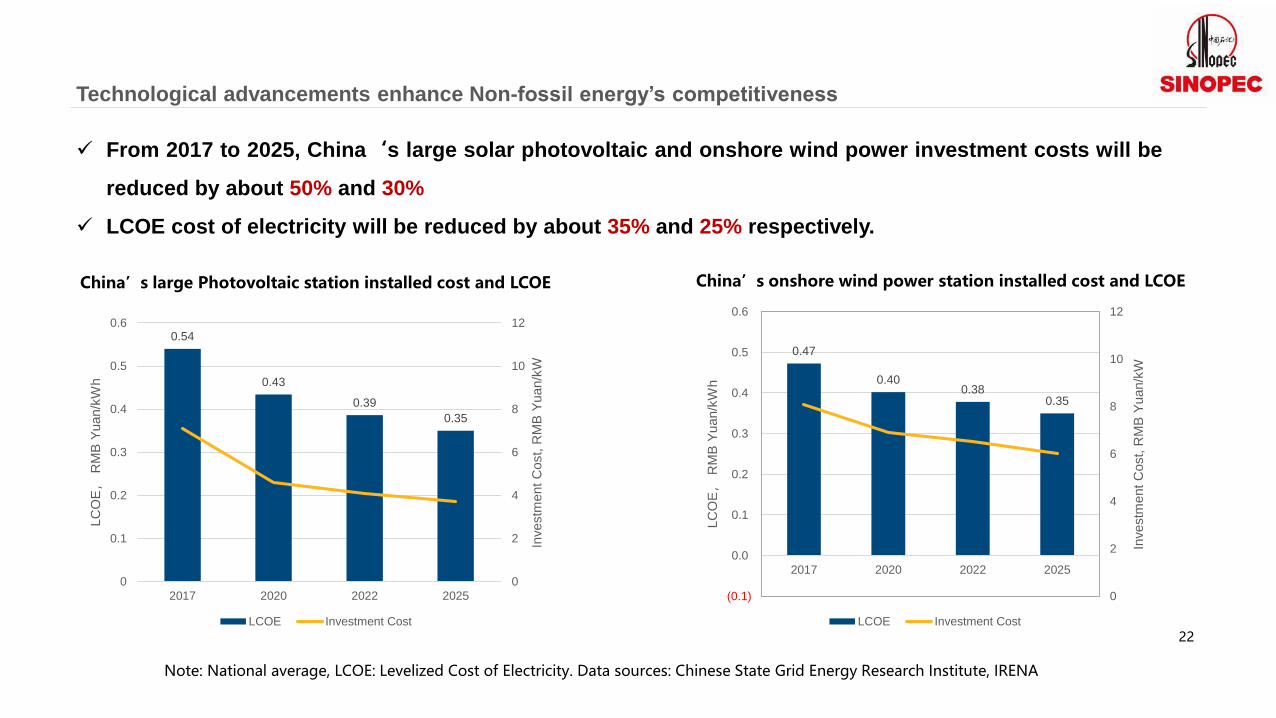
Technological advancements enhance Non-fossil energy’s competitiveness
✓ From 2017 to 2025, China‘s large solar photovoltaic and onshore wind power investment costs will be
reduced by about 50% and 30%
✓ LCOE cost of electricity will be reduced by about 35% and 25% respectively.
Note: National average, LCOE: Levelized Cost of Electricity. Data sources: Chinese State Grid Energy Research Institute, IRENA
China’s large Photovoltaic station installed cost and LCOE China’s onshore wind power station installed cost and LCOE
0.54
0.43
0.39
0.35
0
2
4
6
8
10
12
0
0.1
0.2
0.3
0.4
0.5
0.6
2017 2020 2022 2025
Investm
ent
Cost, R
MB
Yuan/k
W
LC
OE
,R
MB
Yuan/k
Wh
LCOE Investment Cost
0.47
0.400.38
0.35
0
2
4
6
8
10
12
(0.1)
0.0
0.1
0.2
0.3
0.4
0.5
0.6
2017 2020 2022 2025
Investm
ent
Cost, R
MB
Yuan/k
W
LC
OE
,R
MB
Yuan/k
Wh
LCOE Investment Cost
23
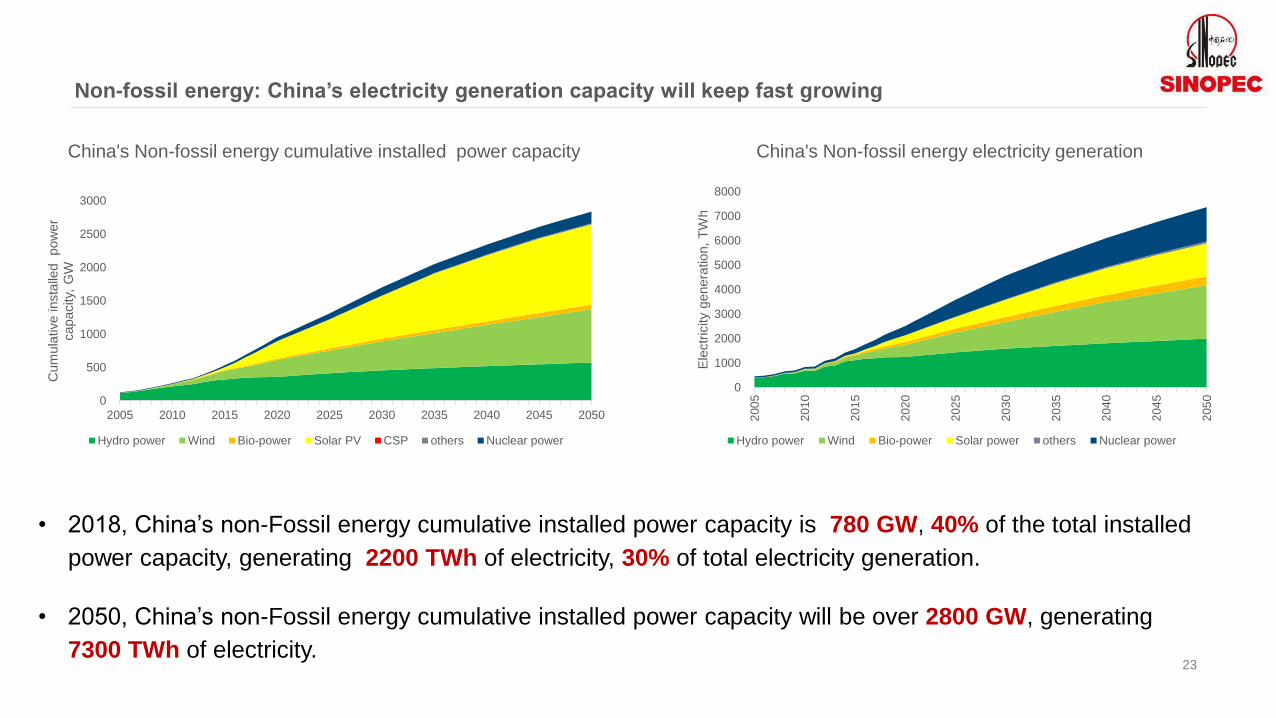
Non-fossil energy: China’s electricity generation capacity will keep fast growing
• 2018, China’s non-Fossil energy cumulative installed power capacity is 780 GW, 40% of the total installed
power capacity, generating 2200 TWh of electricity, 30% of total electricity generation.
• 2050, China’s non-Fossil energy cumulative installed power capacity will be over 2800 GW, generating
7300 TWh of electricity.
0
500
1000
1500
2000
2500
3000
2005 2010 2015 2020 2025 2030 2035 2040 2045 2050
Cum
ula
tive insta
lled
pow
er
capacity,
GW
Hydro power Wind Bio-power Solar PV CSP others Nuclear power
0
1000
2000
3000
4000
5000
6000
7000
8000
200
5
201
0
201
5
202
0
202
5
203
0
203
5
204
0
204
5
205
0
Ele
ctr
icity g
enera
tion,
TW
h
Hydro power Wind Bio-power Solar power others Nuclear power
China's Non-fossil energy cumulative installed power capacity China's Non-fossil energy electricity generation
Energy Demand & International
Cooperation Outlook
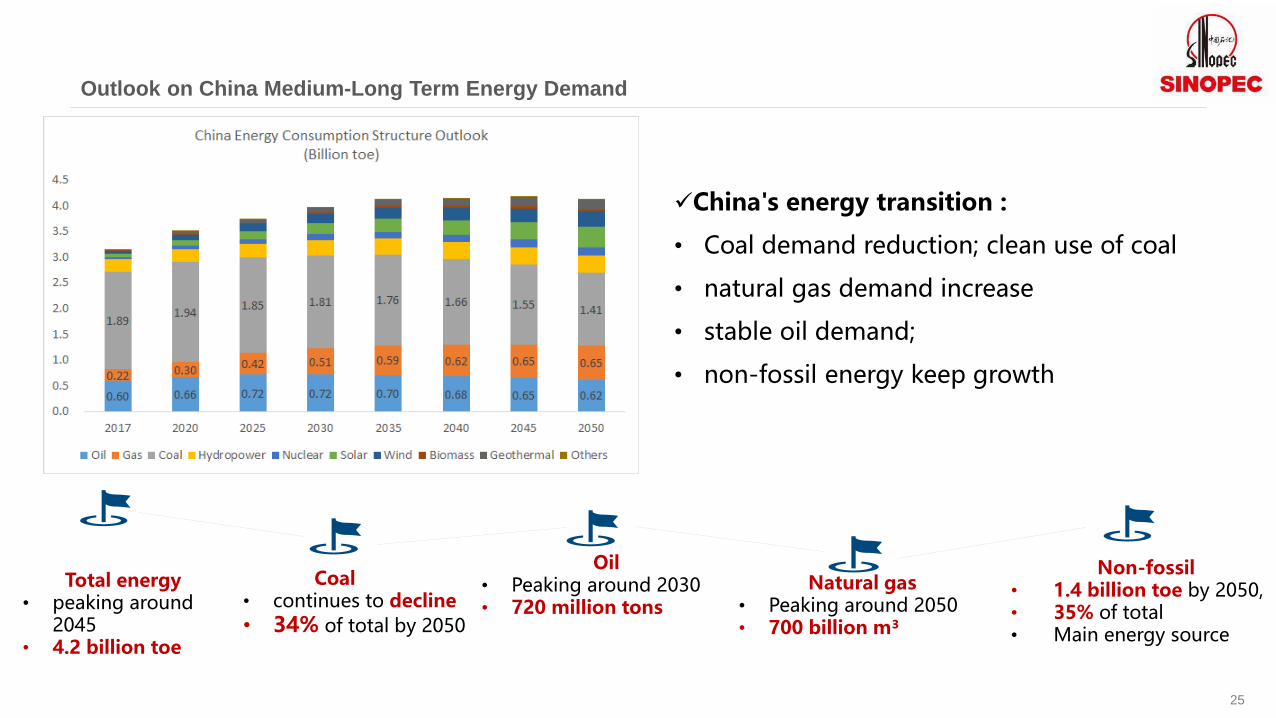
Outlook on China Medium-Long Term Energy Demand
Non-fossil • 1.4 billion toe by 2050,• 35% of total• Main energy source
✓China's energy transition :
• Coal demand reduction; clean use of coal
• natural gas demand increase
• stable oil demand;
• non-fossil energy keep growth
Total energy• peaking around
2045• 4.2 billion toe
Coal• continues to decline
• 34% of total by 2050
Oil• Peaking around 2030• 720 million tons
Natural gas • Peaking around 2050• 700 billion m³
25
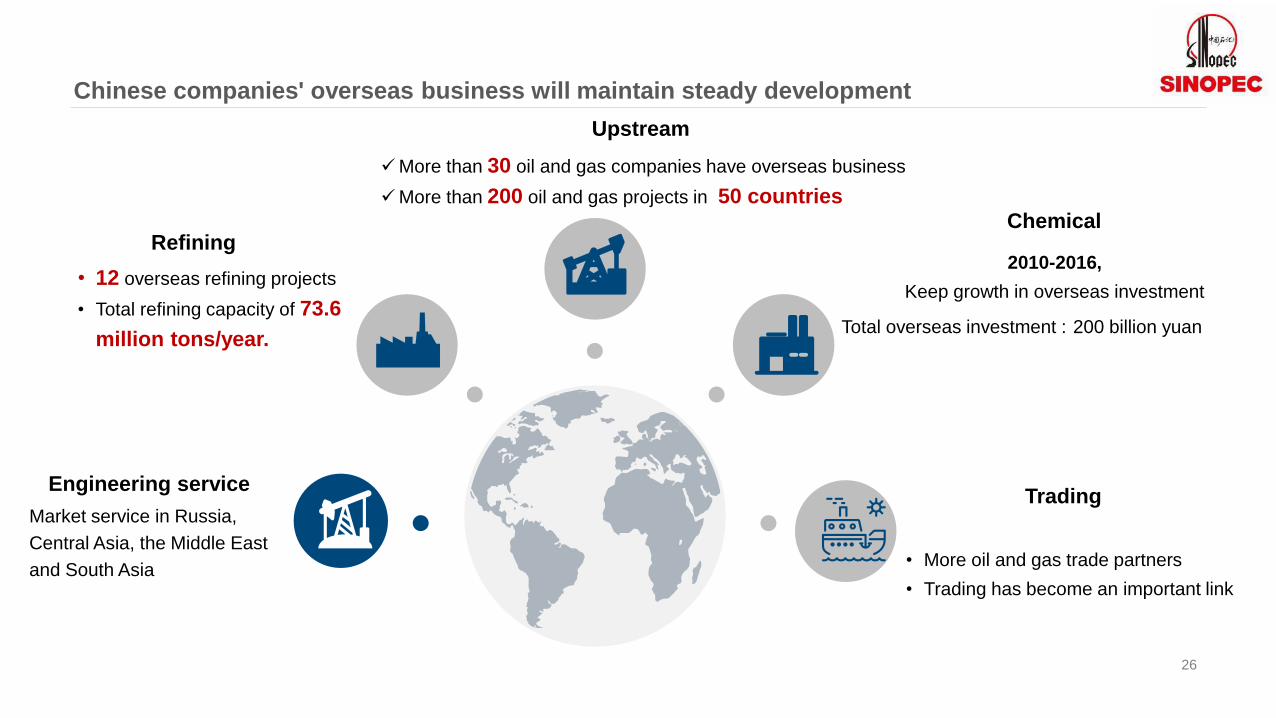
26
Refining
• 12 overseas refining projects
• Total refining capacity of 73.6
million tons/year.
Chemical
2010-2016,
Keep growth in overseas investment
Total overseas investment : 200 billion yuan
Trading
• More oil and gas trade partners
• Trading has become an important link
Engineering service
Market service in Russia,
Central Asia, the Middle East
and South Asia
Upstream
✓More than 30 oil and gas companies have overseas business
✓More than 200 oil and gas projects in 50 countries
Chinese companies' overseas business will maintain steady development
27
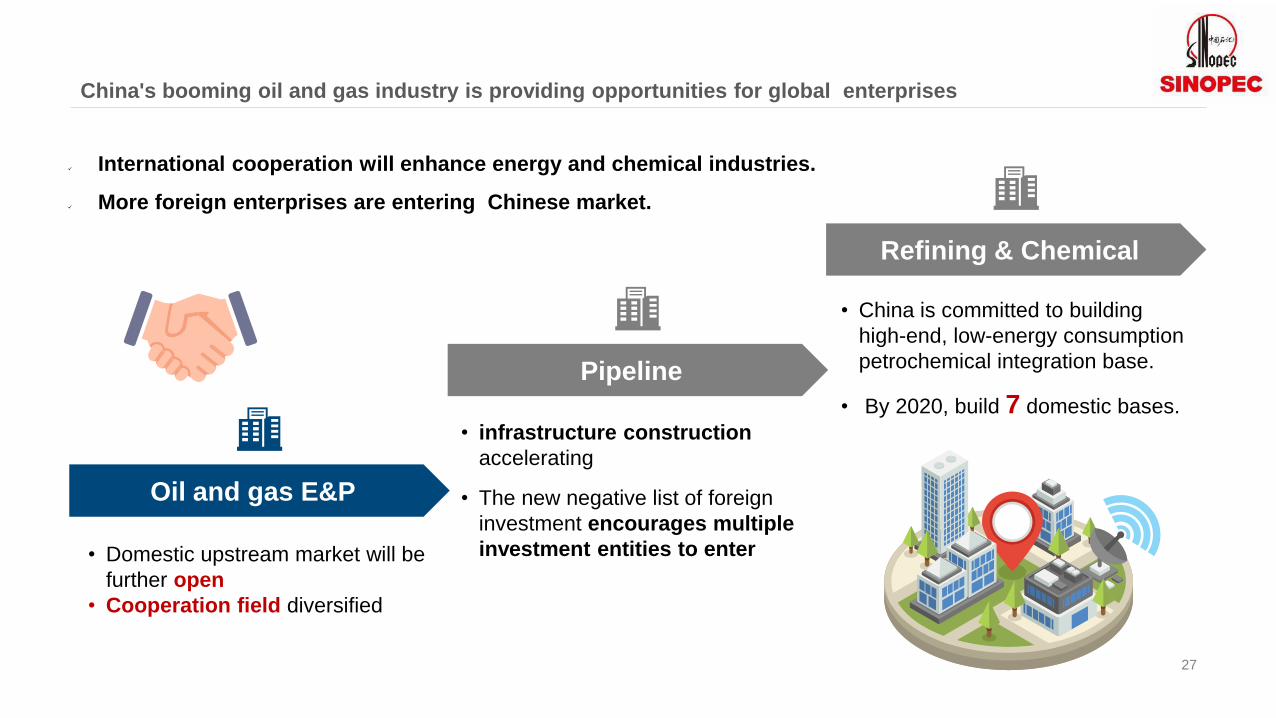
Oil and gas E&P
• Domestic upstream market will be
further open
• Cooperation field diversified
Pipeline
• infrastructure construction
accelerating
• The new negative list of foreign
investment encourages multiple
investment entities to enter
Refining & Chemical
• China is committed to building
high-end, low-energy consumption
petrochemical integration base.
• By 2020, build 7 domestic bases.
✓ International cooperation will enhance energy and chemical industries.
✓ More foreign enterprises are entering Chinese market.
China's booming oil and gas industry is providing opportunities for global enterprises

Q&A

Review and Prospect of China’sEnergy and Petrochemical Industry
������ ����� �� � � � ���� � � ����������� ������
���� ��March 25th 2019
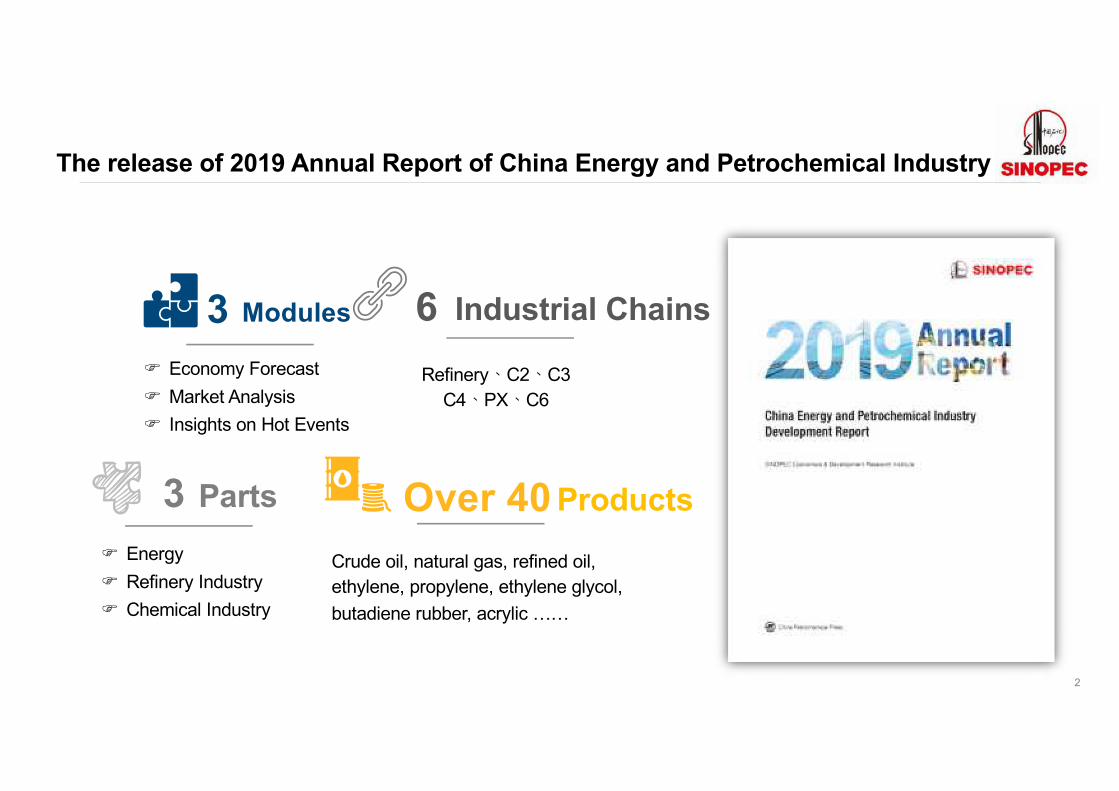
The release of 2019 Annual Report of China Energy and Petrochemical Industry
2
Industrial Chains
Refinery�C2�C3C4�PX�C6
6
Parts3 ProductsCrude oil, natural gas, refined oil, ethylene, propylene, ethylene glycol, butadiene rubber, acrylic ……
Over 40
F Economy ForecastF Market AnalysisF Insights on Hot Events
Modules3
F EnergyF Refinery IndustryF Chemical Industry

Main content of the 2019 report
3
Review 2018
Prospect 2019Pattern of Supply and Demand
&Trend of Price
Demand & Supply & Price
How many�
How much� How to change� How to impact�Impacts of Hot Events
International Market China Market

CONTENTS 1 The Development of China Energy and PetrochemicalIndustry over the Past 40 Years
2 The New Pattern of Long-term Development of Energy and Petrochemical Industry in China
3 Market Prediction for 2019
The Development of China Energy and Petrochemical Industry in the Past 40 Years

1. Has been the vital component of China’s and even the world economy
6
Crude Oil Import
Imported crude oil462 Million tons
Primary Energy Consumption
16.8 Million barrelsper day
Processing Capacityof Crude Oil
An important role in global energy and petrochemical system
1978-2017�
The main business income of the industry is 2.0 trillion US dollars �increased by182 times.
A vital position in the development of national economy
3,248 Mtoe
The number of large and medium-sized enterprises is 10 times more, and large ones is more than 30000.
11.6%of national industrial assets
19%23 % 8% 15% 14%
Natural GasImport
Imported natural gas 123 Billion cubic metres
Ethylene Production Capacity
25 MTA�2018�
�2017�
Source: BP Statistical Review of World Energy 2017, National Bureau of Statistics of China, EDRI
7
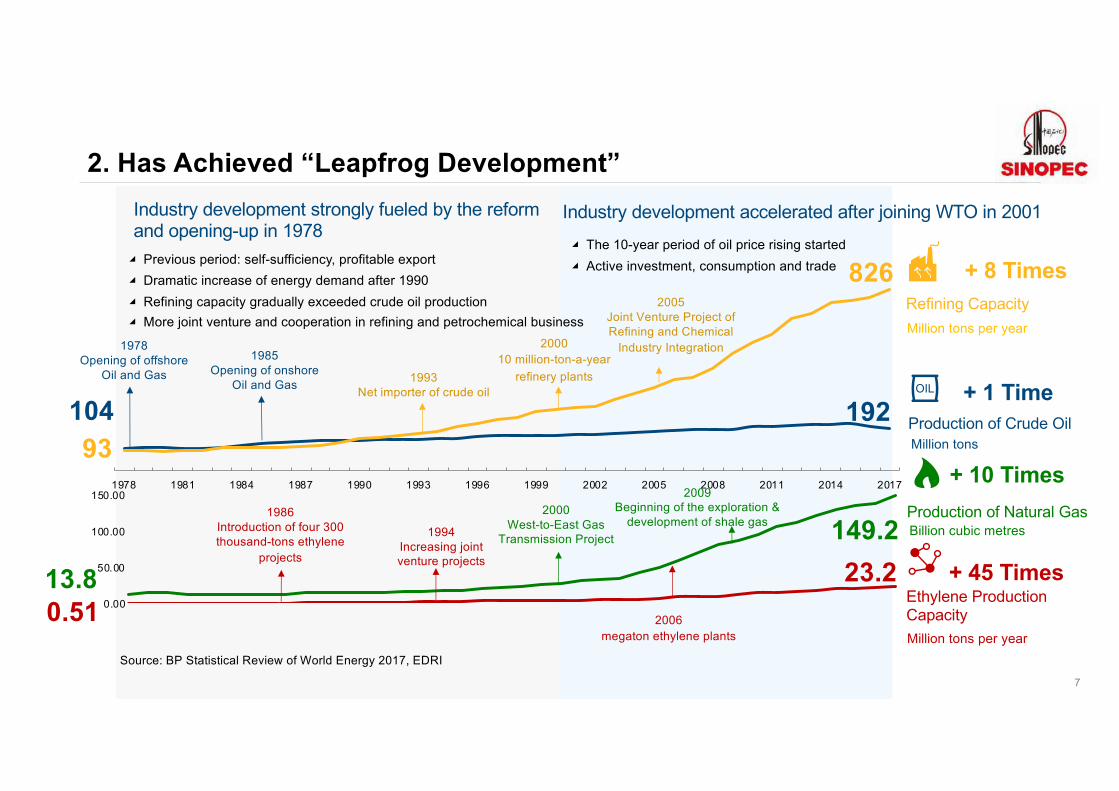
Source: BP Statistical Review of World Energy 2017, EDRI
Industry development accelerated after joining WTO in 2001Industry development strongly fueled by the reform
and opening-up in 1978
1978 1981 1984 1987 1990 1993 1996 1999 2002 2005 2008 2011 2014 2017
0.00
50.00
100.00
150.00
Ethylene Production
Capacity
Production of Natural Gas
Refining Capacity
Production of Crude Oil
Million tons
Million tons per year
93
826 + 8 Times
192104+ 1 Time
23.20.51
+ 45 Times
Million tons per year
149.2 Billion cubic metres
+ 10 Times
13.8
1993
Net importer of crude oil
1978
Opening of offshore
Oil and Gas
2000
10 million-ton-a-year
refinery plants
2005
Joint Venture Project of
Refining and Chemical
Industry Integration
2006
megaton ethylene plants
1985
Opening of onshore
Oil and Gas
1986
Introduction of four 300
thousand-tons ethylene
projects
1994
Increasing joint
venture projects
2000
West-to-East Gas
Transmission Project
2009
Beginning of the exploration &
development of shale gas
� Previous period: self-sufficiency, profitable export
� Dramatic increase of energy demand after 1990
� Refining capacity gradually exceeded crude oil production
� More joint venture and cooperation in refining and petrochemical business
� The 10-year period of oil price rising started
� Active investment, consumption and trade
2. Has Achieved “Leapfrog Development”
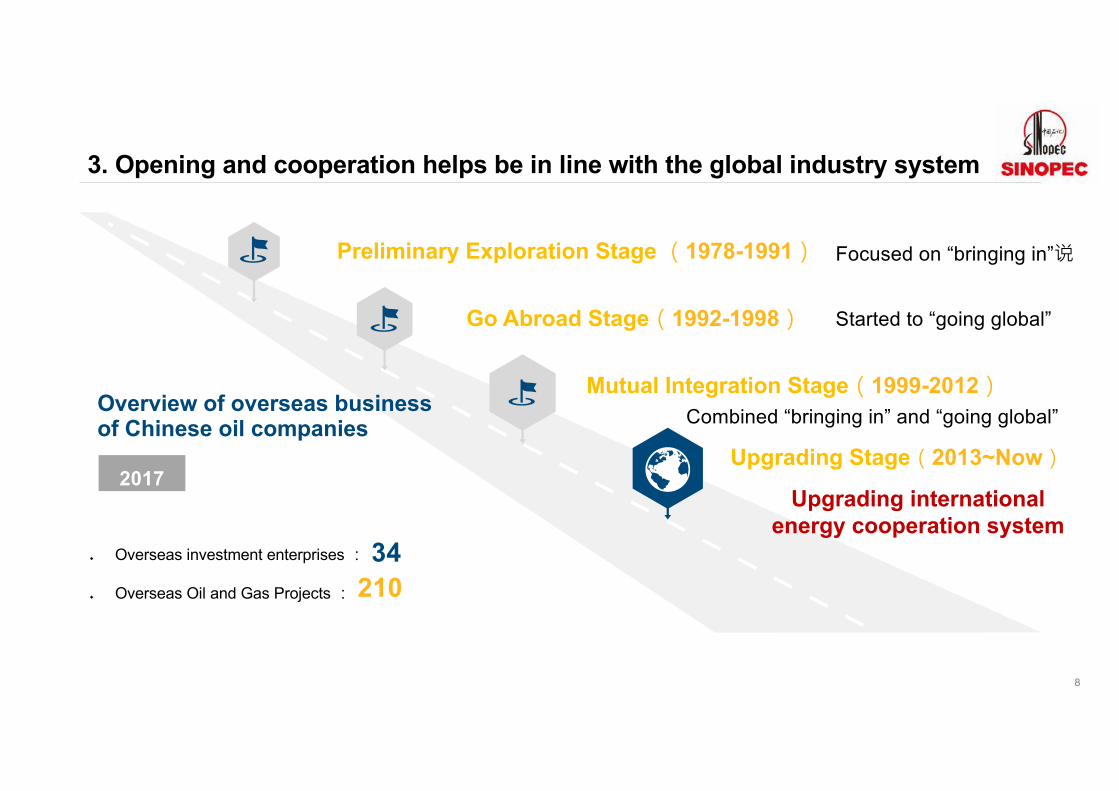
Upgrading Stage�2013~Now�
Mutual Integration Stage�1999-2012�
Go Abroad Stage�1992-1998�
Preliminary Exploration Stage �1978-1991�
Overview of overseas business of Chinese oil companies
u Overseas investment enterprises �
u Overseas Oil and Gas Projects �
2017
210 34
Upgrading internationalenergy cooperation system
3. Opening and cooperation helps be in line with the global industry system
8
Started to “going global”
Focused on “bringing in”�
Combined “bringing in” and “going global”

4. A number of petroleum and petrochemical international enterprises have emerged
9
4 3 87 5 8 28 33 9
5 4 93 1 6 10 11 3
69 70 >500 4 5 14 15 3

Refining TechnologyOverall advanced, some leading
Oil & Gas exploration and development theory as
well as technology highlights characteristics
Petrochemical TechnologyReaches or approaches the
world's advanced level
Complete technology series of modern coal chemical industry
Complete technology series ofmegaton ethylene project
Complete technology series of highly efficient and environmentally friendly aromatic hydrocarbons
(Sinopec technology series of highly efficient and environmentally friendly aromatic hydrocarbons)
Onshore →Offshore
Marine Facies →Continental Facies
Conventional→ Unconventional
5. The level of some energy and petrochemical technologies has entered advanced ranks in the world
Cooperation With
External Partners
IndependentInnovation
10
� offshore drilling�
(Exploration of Shale Gas at Fuling)
Technology with independent intellectual property
Capacity to design and build ten-million-tons oil refinery
Complete technology series of clean petroleum products production
�Yanbu Aramco Sinopec Refining Company Ltd. �

The New Pattern of long-term Development of Energy and Petrochemical Industry in China

Hig
h-qu
ality
Dev
elop
men
t In the past 40 years, petroleum and petrochemical industry emphasized on satisfying
Clothing Food Housing Transportation
Past——Meet the Demand of Basic Necessities of Life
Future——Meet the Requirement of High-quality DevelopmentIn the future, petroleum and petrochemical industry emphasized on satisfying
quality and efficiency requirement
More SustainableMore IntelligentCleaner Higher-end
New Development
New Drivers
12
quantity and speed requirement
13
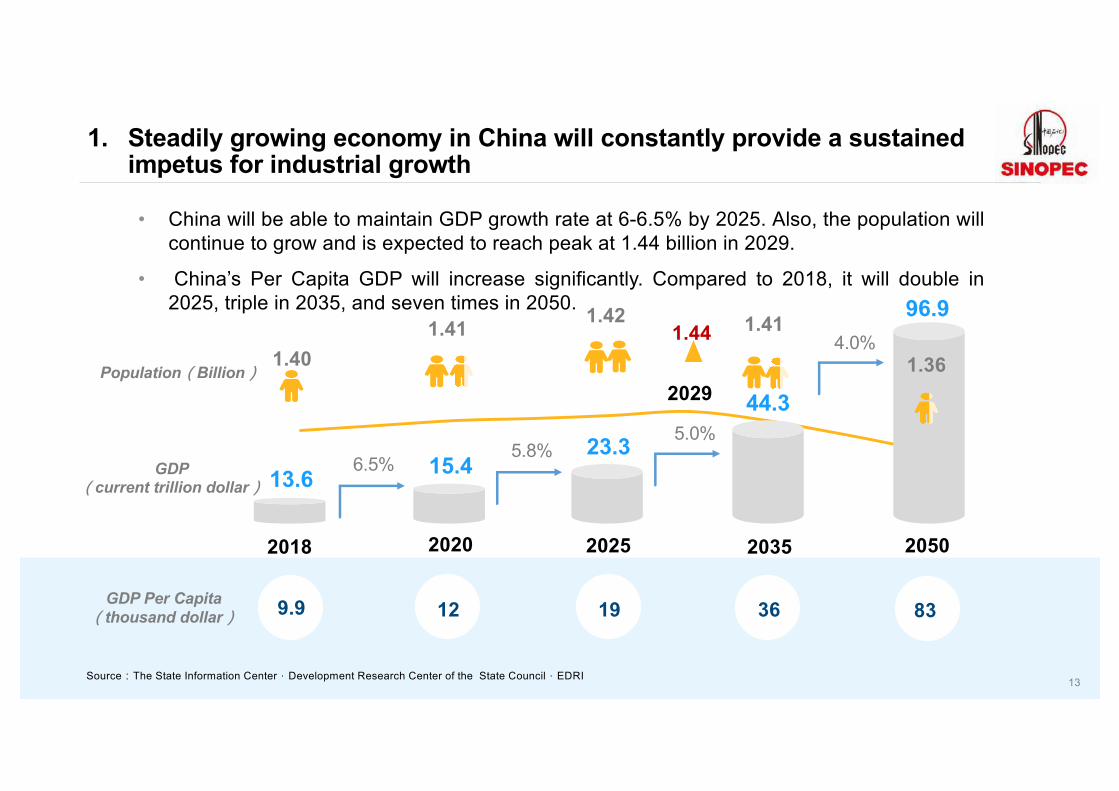
2018
13.6 15.423.3
44.3
96.9
2020 2025 20502035
1.41 1.42 1.41
1.361.44
2029Population�Billion�
GDP�current trillion dollar�
9.9 12 19 36 83GDP Per Capita�thousand dollar�
1.40
• China will be able to maintain GDP growth rate at 6-6.5% by 2025. Also, the population willcontinue to grow and is expected to reach peak at 1.44 billion in 2029.
• China’s Per Capita GDP will increase significantly. Compared to 2018, it will double in2025, triple in 2035, and seven times in 2050.
1. Steadily growing economy in China will constantly provide a sustained impetus for industrial growth
6.5%5.8%
5.0%
4.0%
Source�The State Information Center�Development Research Center of the State Council�EDRI

0
10
20
30
40
50
60
70
80
90
100
1950 1955 1960 1965 1970 1975 1980 1985 1990 1995 2000 2005 2010 2015 2020 2025 2030 2035 2040 2045 2050
The 1st New Driver: New urbanization and the rural vitalization strategy will inspire the potential of China's economic and industrial development
Source�UN, National Bureau of Statistics of China, EDRI
60% in 2018
ChinaUS
World70% in 2030
831 Million Urban Population1,018 Million Urban Population
• The rural vitalization strategy will break the urban-rural dual structure and drive economic growth strongly.
• By the free flow of factors , the integration of urban and rural industries could be promoted, level of
urbanization could be raised, the synergy of urban development and rural revitalization could be achieved.
) ( ) % ) ' % % ) % %
14
80% in 2050
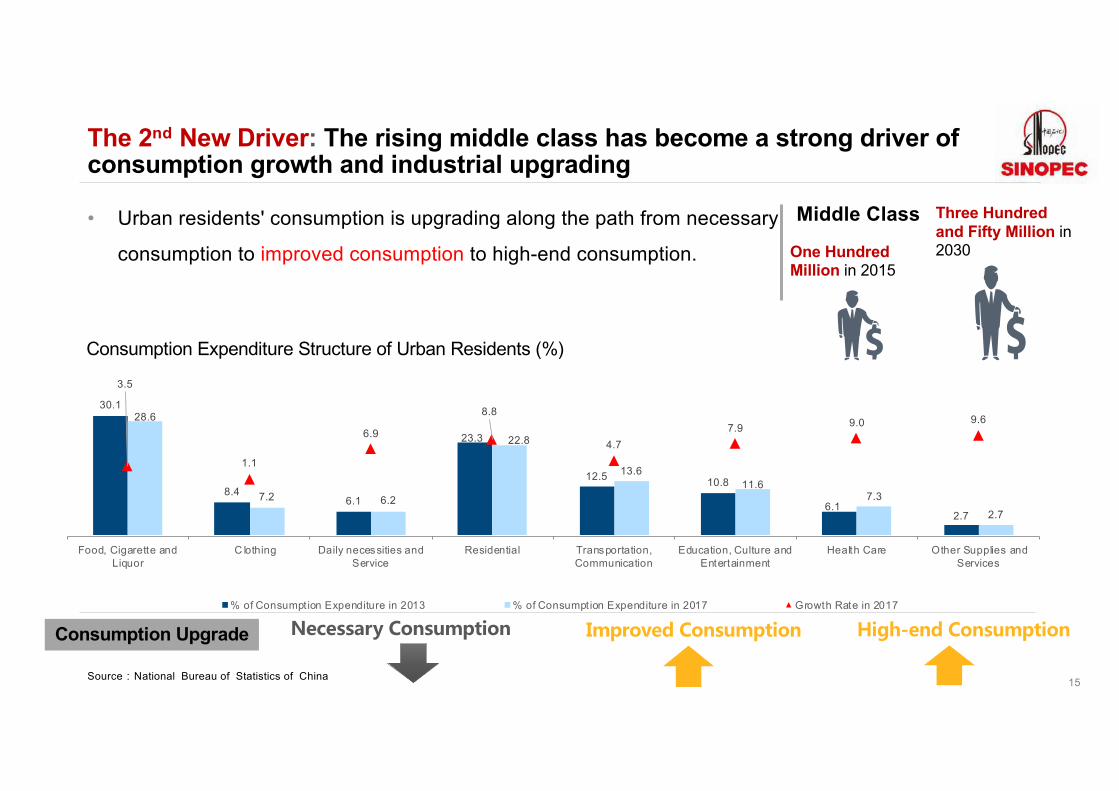
The 2nd New Driver: The rising middle class has become a strong driver of consumption growth and industrial upgrading
• Urban residents' consumption is upgrading along the path from necessary
consumption to improved consumption to high-end consumption.
Source�National Bureau of Statistics of China
30.1
8.46.1
23.3
12.5 10.8
6.12.7
28.6
7.2 6.2
22.8
13.611.6
7.3
2.7
3.5
1.1
6.9
8.8
4.77.9 9.0 9.6
Food, Cigarette andLiquor
C lothing Daily necessities andService
Residential Transportation,Communication
Education, Culture andEntertainment
Health Care Other Supplies andServices
% of Consumption Expenditure in 2013 % of Consumption Expenditure in 2017 Growth Rate in 2017
Consumption Upgrade -- - - -
Consumption Expenditure Structure of Urban Residents (%)
One Hundred Million in 2015
Three Hundred and Fifty Million in 2030
Middle Class
15

Northeast China-Eastern InnerMongolia Economic Zone
�Belt and Road�
Yangtze River Economic Belt
Beijing-Tianjin-Hebei Economic Circle &
Xiong'an New Area
Hainan Pilot Free Trade Zone
GDP�%�: Midwest + Northeast
2017 35%2050 40%
GDP�%��East + South
2017 51%2050 46%
The 3rd New Driver: The coordinated regional development strategy will provide a broader space for industrial further expansion
16
Guangdong-Hong Kong-Macao Greater Bay Area

Boosted GDP by more than $7.5
trillion
17
The 4th New Driver: Technological revolution will foster new growth and promote the upgrading of traditional petroleum and petrochemical industries
Emerging IndustryDeveloping and Growing
New Business Model
Clean Energy, Advanced Polymer Materials, High Performance Materials, etc
A New Generation of Information and Technology IndustryBig Data, Cloud Computing, High-end Software, etc
New Energy, New Materials
New Energy VehicleElectric Vehicles, Fuel Cell Vehicle, etc
Traditional IndustryTransforming and Upgrading
Traditional ManufacturingPromoting the In-depth Integration of the Internet, Big Data, Artificial Intelligence with the Real Economy
Building a clean, low-carbon, safe andefficient modern energy system
Energy Industry
Chemical IndustryProduct Upgrading, Resource Conservation and Clean Production
�Internet Plus�, Block chain , Sharing Economy, Modern Supply Chain, etc.
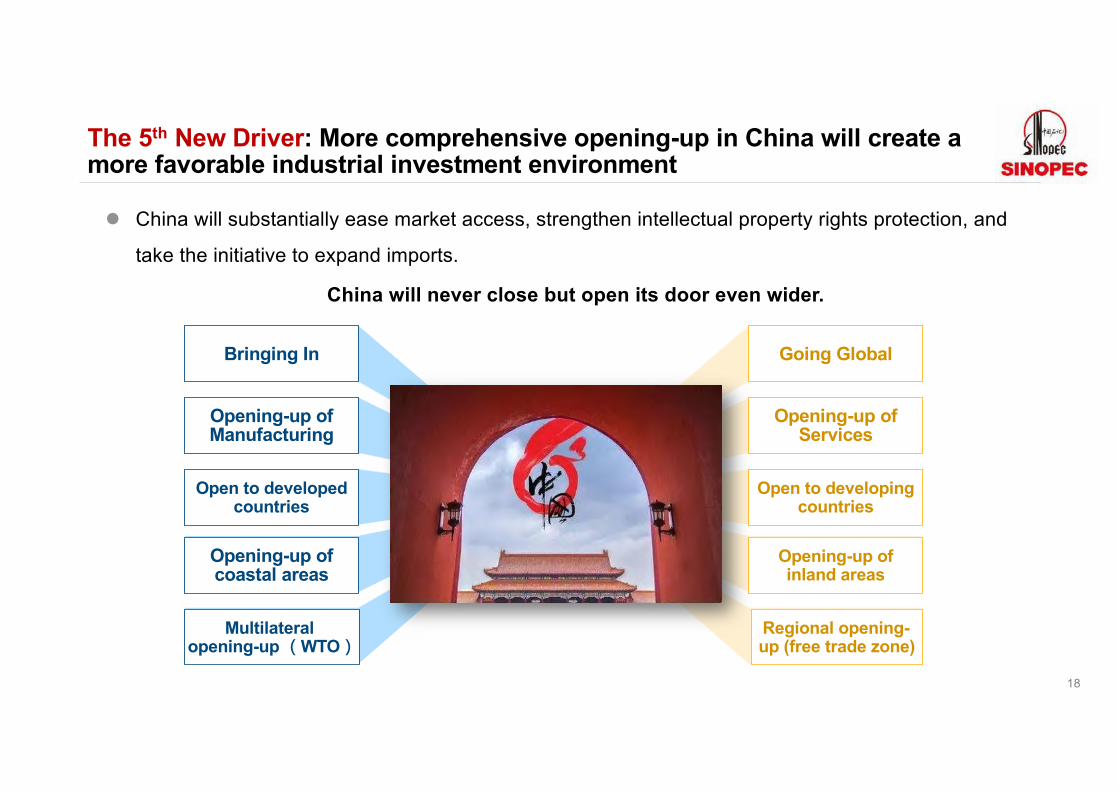
l China will substantially ease market access, strengthen intellectual property rights protection, and
take the initiative to expand imports.
Bringing In
Opening-up of Manufacturing
Open to developed countries
Opening-up of coastal areas
Multilateral opening-up �WTO�
Going Global
Opening-up of Services
Open to developing countries
Opening-up of inland areas
Regional opening-up (free trade zone)
LOREM
18
The 5th New Driver: More comprehensive opening-up in China will create a more favorable industrial investment environment
China will never close but open its door even wider.
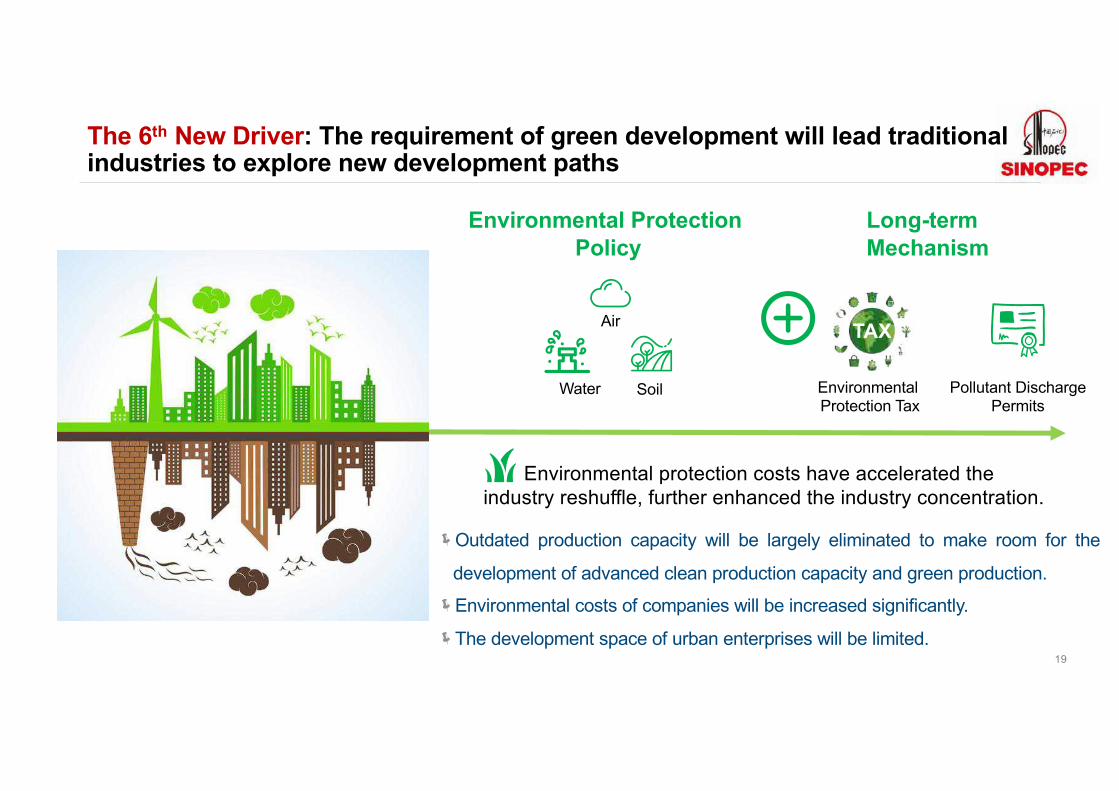
ëOutdated production capacity will be largely eliminated to make room for the
development of advanced clean production capacity and green production.
ëEnvironmental costs of companies will be increased significantly.
ëThe development space of urban enterprises will be limited.
Environmental protection costs have accelerated the industry reshuffle, further enhanced the industry concentration.
19
Environmental Protection Policy
The 6th New Driver: The requirement of green development will lead traditional industries to explore new development paths
Air
Water Soil
Long-term Mechanism
TAX
EnvironmentalProtection Tax
Pollutant Discharge Permits
0
5
10
15
20
25
2000 2010 2016 2020 2025 2030 2035 2040
Ene
rgy
Con
sum
ptio
n P
er U
nit G
DP
�kB
tu/$�
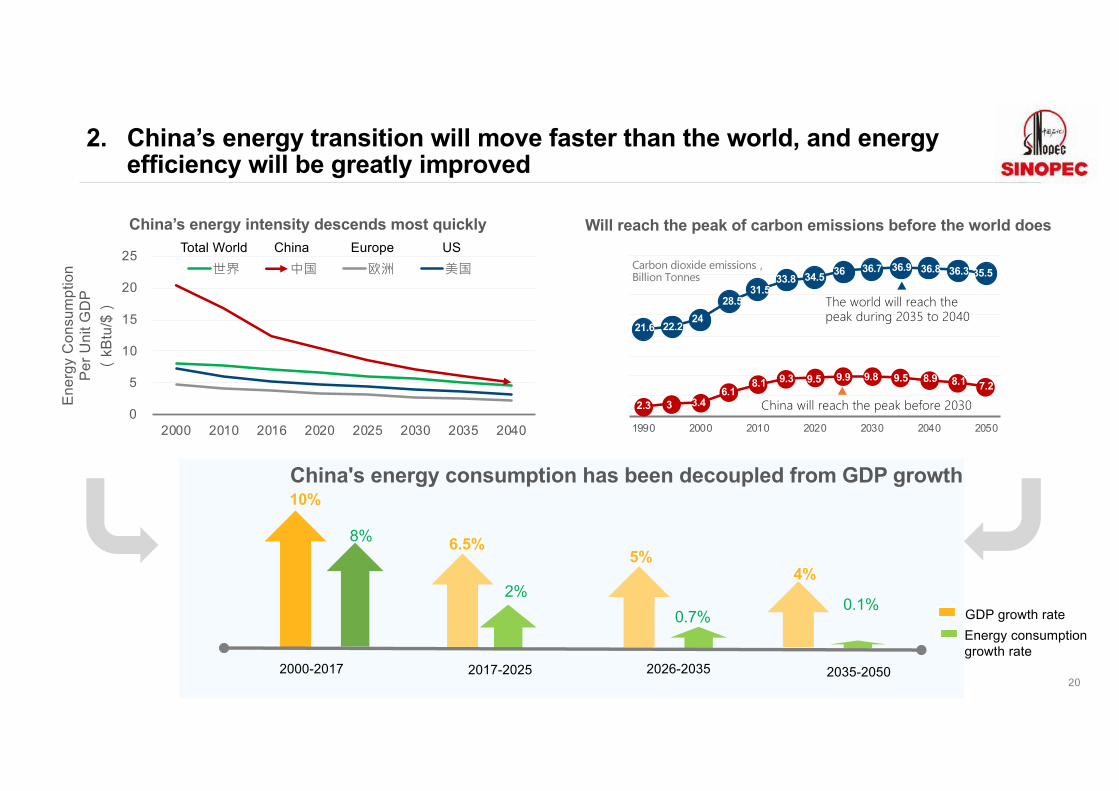
�� �� �� �
China’s energy intensity descends most quickly Will reach the peak of carbon emissions before the world does
2000-2017 2026-2035
6.5%
2%
2035-2050
0.7%
5%
0.1%
4%
10%
8%
2017-2025
China's energy consumption has been decoupled from GDP growth
21.6 22.224
28.531.5
33.8 34.5 36 36.7 36.9 36.8 36.3 35.5
2.3 3 3.46.1
8.1 9.3 9.5 9.9 9.8 9.5 8.9 8.1 7.2
1990 2000 2010 2020 2030 2040 2050
00 4 5 3 24
240 00 4 53 4 52
2. China’s energy transition will move faster than the world, and energy efficiency will be greatly improved
20
GDP growth rate
Energy consumption growth rate
Total World China Europe US
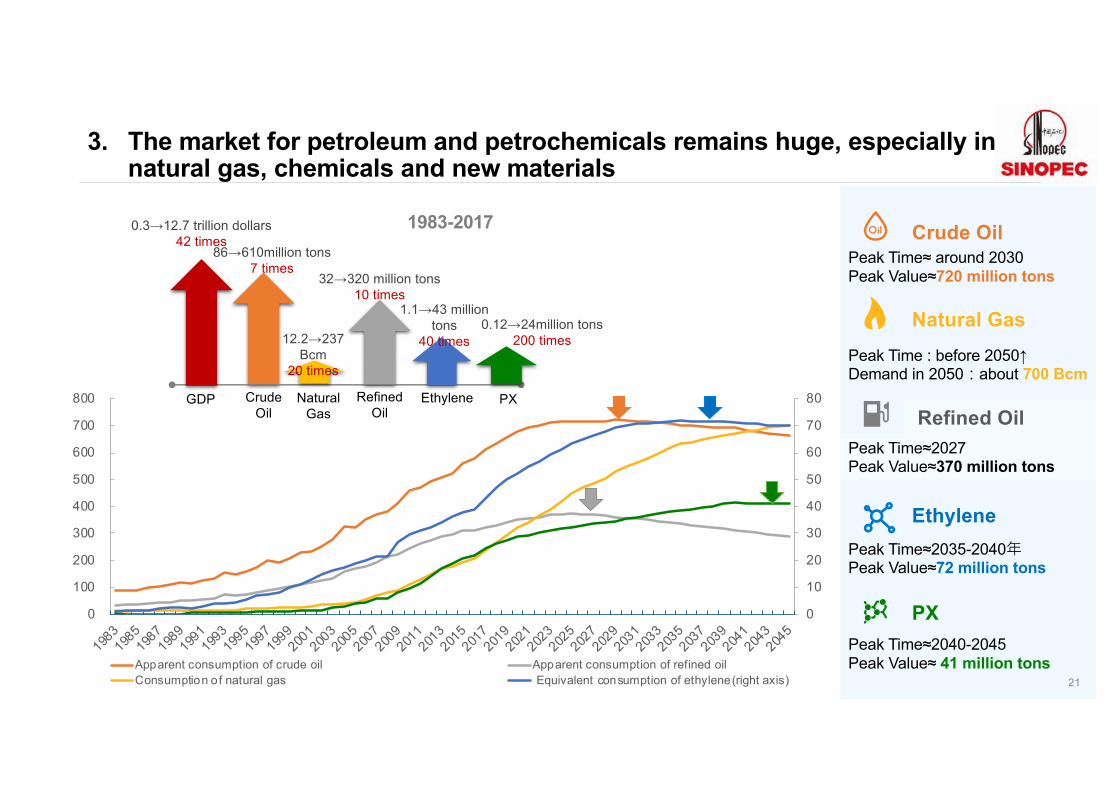
3. The market for petroleum and petrochemicals remains huge, especially in natural gas, chemicals and new materials
Peak Time : before 2050↑Demand in 2050�about 700 Bcm
0
10
20
30
40
50
60
70
80
0
100
200
300
400
500
600
700
800
1983198
5198
7198
9199
1199
3199
5199
7199
9200
1200
3200
5200
7200
9201
1201
3201
5201
7201
9202
1202
3202
5202
7202
9203
1203
3203
5203
7203
9204
1204
3204
5
Apparent consumption of crude oil Apparent consumption of refined oil
Consumption of natural gas Equivalent consumption of ethylene(right axis)
Peak Time≈ around 2030Peak Value≈720 million tons
Crude Oil
Peak Time≈2035-2040�Peak Value≈72 million tons
Ethylene
Peak Time≈2027Peak Value≈370 million tons
Refined Oil
Peak Time≈2040-2045Peak Value≈ 41 million tons
Natural Gas
PX
1983-2017
Crude Oil
Natural Gas
Refined Oil
Ethylene PX
86→610million tons7 times
12.2→237 Bcm
20 times
32→320 million tons10 times
1.1→43 million tons
40 times0.12→24million tons
200 times
GDP
0.3→12.7 trillion dollars42 times
21
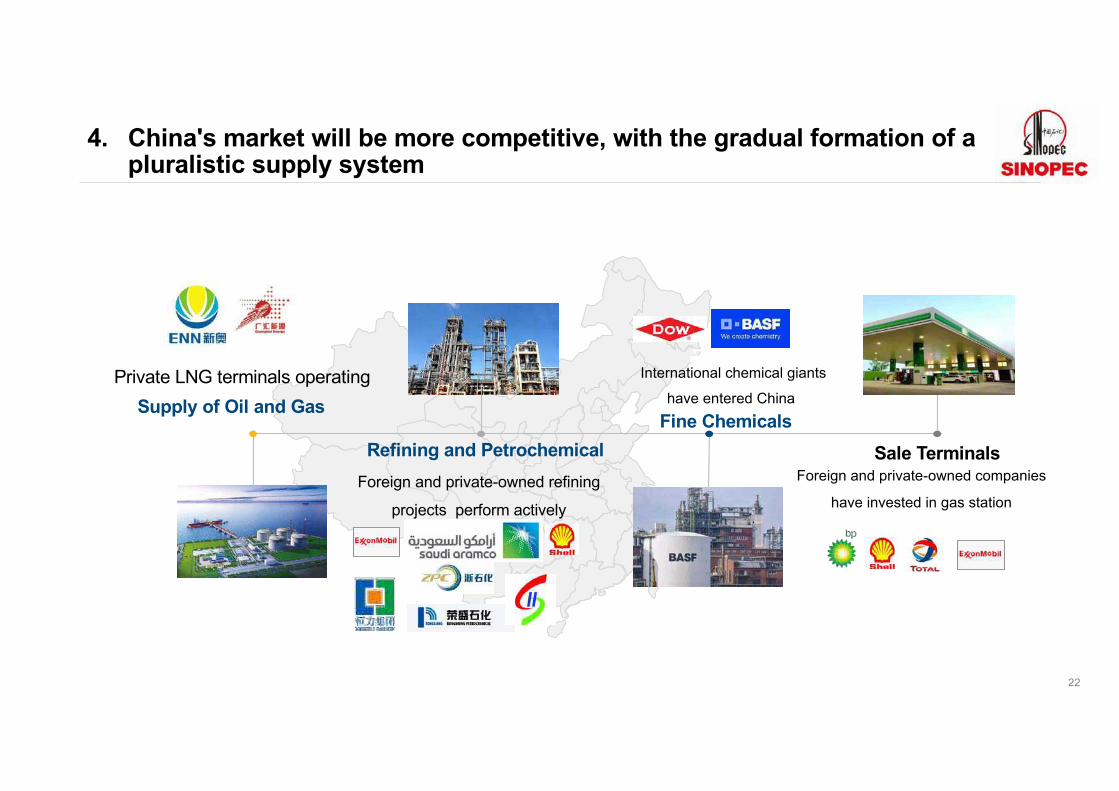
4. China's market will be more competitive, with the gradual formation of a pluralistic supply system
22
Supply of Oil and Gas
Foreign and private-owned refining
projects perform actively
Refining and Petrochemical
Private LNG terminals operating International chemical giants
have entered ChinaFine Chemicals
Foreign and private-owned companies
have invested in gas station
Sale Terminals

Market Prediction for 2019
24
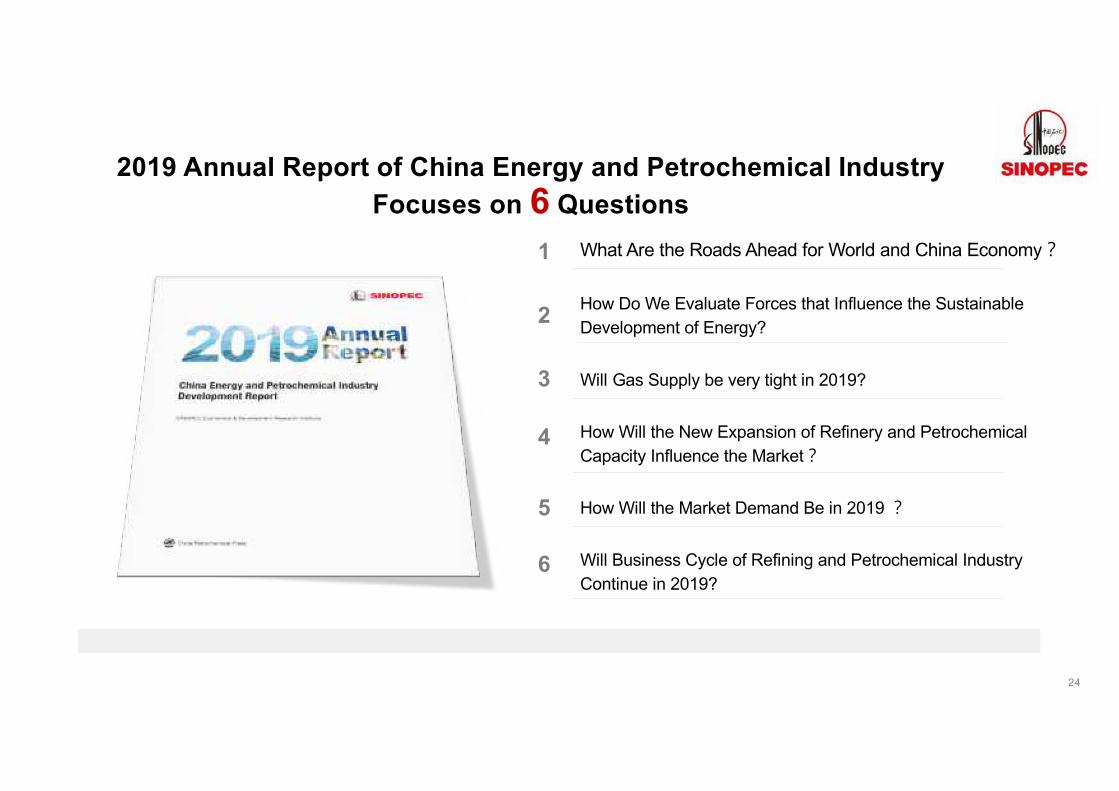
2019 Annual Report of China Energy and Petrochemical Industry Focuses on 6 Questions
What Are the Roads Ahead for World and China Economy�
How Do We Evaluate Forces that Influence the Sustainable Development of Energy?
How Will the New Expansion of Refinery and Petrochemical Capacity Influence the Market�
Will Gas Supply be very tight in 2019?
Will Business Cycle of Refining and Petrochemical Industry Continue in 2019?
How Will the Market Demand Be in 2019 �
1
2
3
4
5
6

1. What Are the Roads Ahead of World and China’s Economy�
25
Higher Risks
Stability First
2018�3.2%2019�3.1%
2018�6.6%2019�6.0-6.5%
Trade frictionUnilateral sanctions
I. Shrinking Trade
The manufacturing PMI has decreased by 3.8% since the beginning of 2018
II. Contracting Real
Economy
Employment Finance Foreign Trade
Foreign Investment Investment Expectation
StableStable Stable
Stable Stable Stable
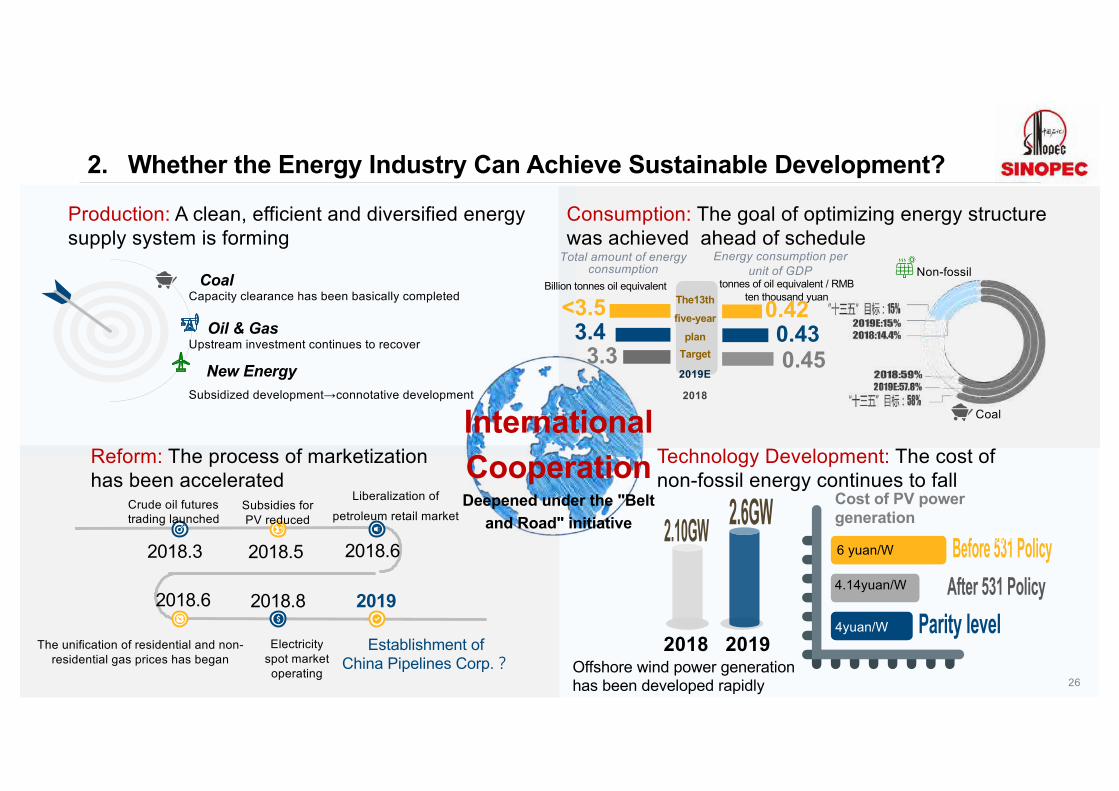
2. Whether the Energy Industry Can Achieve Sustainable Development?
26
Reform: The process of marketizationhas been accelerated
Technology Development: The cost of non-fossil energy continues to fall
Non-fossil
Coal
2018 2019Offshore wind power generation has been developed rapidly
Cost of PV power generation
6 yuan/W
4.14yuan/W
4�/�
4yuan/W
Production: A clean, efficient and diversified energy supply system is forming
Consumption: The goal of optimizing energy structure was achieved ahead of schedule
The unification of residential and non-residential gas prices has began
2018.6
Crude oil futures trading launched
2018.3
Subsidies for PV reduced
2018.5
Liberalization of petroleum retail market
2018.6
Electricity spot market operating
2018.8
Establishment of China Pipelines Corp.�
2019
Capacity clearance has been basically completedCoal
Upstream investment continues to recoverOil & Gas
Subsidized development→connotative development
New Energy
International
CooperationDeepened under the "Belt
and Road" initiative
0.42
0.45
Total amount of energy consumption
Billion tonnes oil equivalent
Energy consumption per unit of GDP
tonnes of oil equivalent / RMB ten thousand yuanThe13th
five-year
plan
Target
2019E
2018
0.43<3.5
3.43.3

3. Will Gas Supply be very tight in 2019?
27
Bcm
+28 Bcm
Year-to-year growth:
10.1%�2018�
17%�
Fuel conversion from coal-to-gas will be
more rational.
More rational demand
Bcm
+33 Bcm
Year-to-year
growth: 11.7%�2018�15.9%�
Production: Domestic gas
production will be increased
by over 7%
Global LNG production +76%
Sales�
Storage�Gas storage+3 Bcm
Supply:
The establishment of production, distribution, storage and sales
systems has been stepped up.
More sufficient supply
Pipeline network interconnection has been accelerated
• “Gas supply from South to North”: 30 Mcm/d
• Supply increase in Beijing-Tianjin-Hebei surrounding areas: 60 Mcm/d
LNG terminal: +6.40Mt/Y
Urban Gas
Industry
Electricity
Generation
Chemistry
313305
4. How Will the Operation of Private-owned Refinery and Petrochemical Capacity Influence the Market�
Dalian, Hengli
Zhejiang Petrochemical Corp
Shandong, private-owned refineries
Liaoning, Baolai
SINOPEC Hainan Petrochemical Co., Ltd.
Taixing, spchemicals
Inner Mongolia, ConnellXinjiang, Tianye
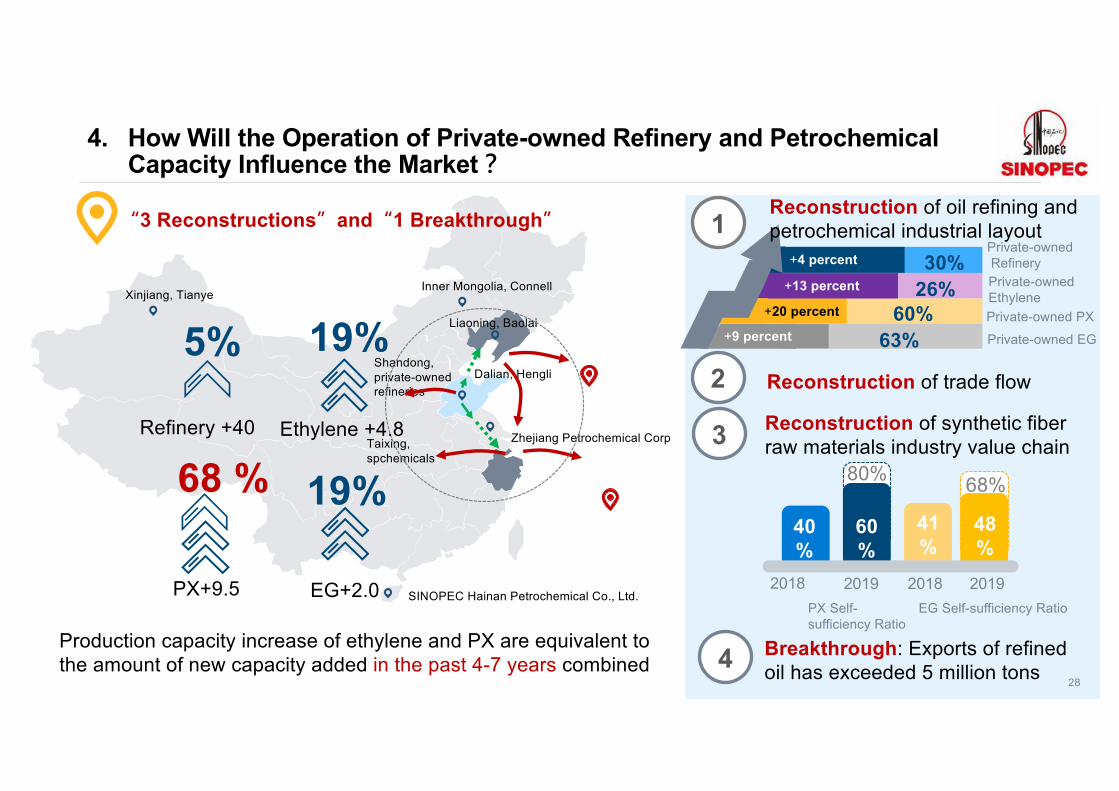
�3 Reconstructions�and�1 Breakthrough�
30%
60%63%
Private-ownedRefinery
Private-owned PX
Private-owned EG
1
2
Reconstruction of oil refining and petrochemical industrial layout
Reconstruction of trade flow
4 Breakthrough: Exports of refined oil has exceeded 5 million tons
+4 percent
+20 percent
+9 percent
Refinery +40
19%68 %
19%
Ethylene +4.8
PX+9.5 EG+2.0
Production capacity increase of ethylene and PX are equivalent to the amount of new capacity added in the past 4-7 years combined
26% Private-owned Ethylene
+13 percent
3 Reconstruction of synthetic fiber raw materials industry value chain
40%
2018 20192019 2018
60%
41%
48%
80% 68%
PX Self-sufficiency Ratio
EG Self-sufficiency Ratio
28
5%
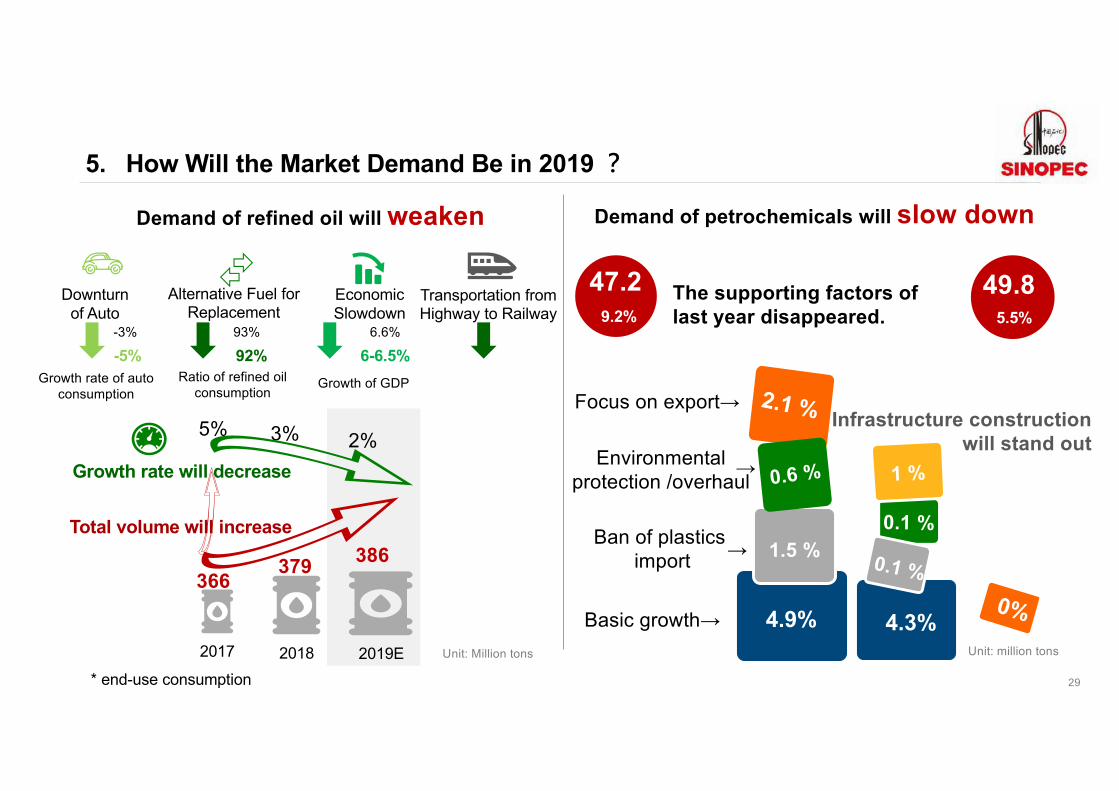
5. How Will the Market Demand Be in 2019 �
29
2017 2018 2019E
5% 2%3%
366379 386
Total volume will increase
Growth rate will decrease
49.85.5%
4.3%
0.1 %
0%
0.1 %
0.6 %
2.1 %
1.5 %
4.9%
47.29.2%
The supporting factors of last year disappeared.
Unit: million tonsUnit: Million tons
1 %
Infrastructure constructionwill stand out
Downturn of Auto
-5%Growth rate of auto
consumption
-3%
Transportation from Highway to Railway
Alternative Fuel for Replacement
92%Ratio of refined oil
consumption
93%
Economic Slowdown
6-6.5%Growth of GDP
6.6%
Demand of refined oil will weaken Demand of petrochemicals will slow down
* end-use consumption
Focus on export→
Environmental protection /overhaul
Ban of plasticsimport
Basic growth→
→
→
1999 2001 2003 2005 2007 2009 2011 2013 2015 2017 2019
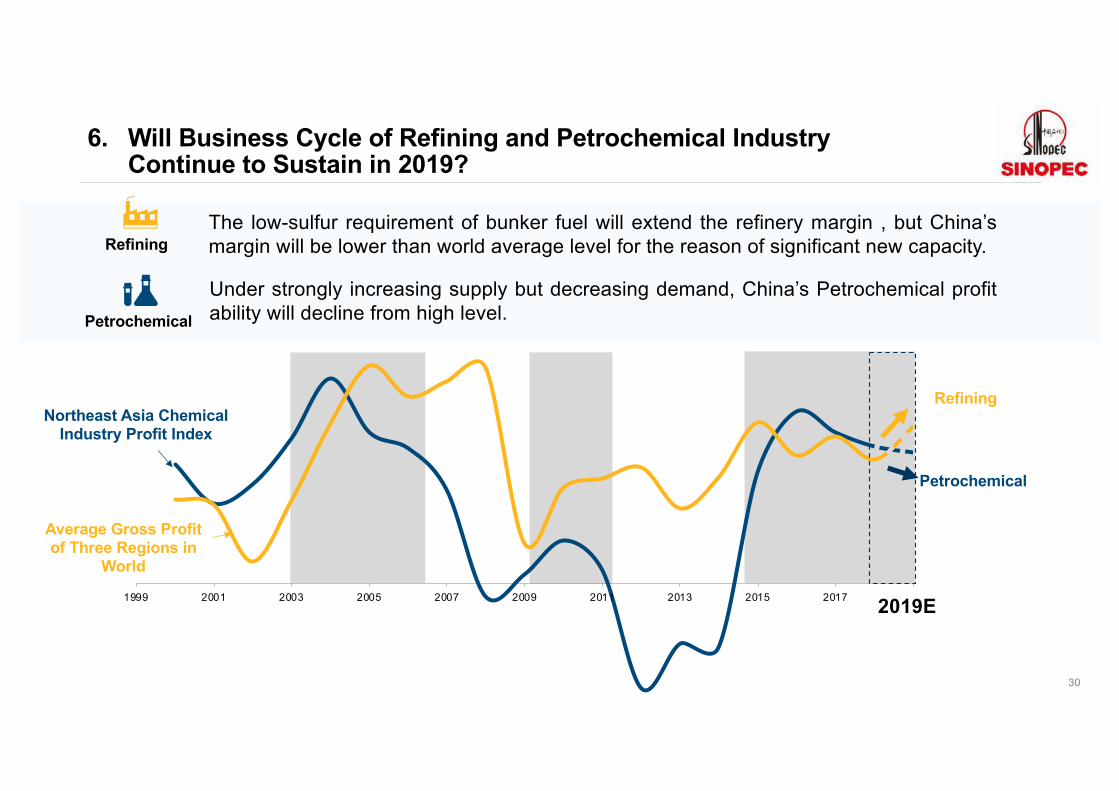
6. Will Business Cycle of Refining and Petrochemical Industry Continue to Sustain in 2019?
Petrochemical
Refining
2019E
The low-sulfur requirement of bunker fuel will extend the refinery margin , but China’smargin will be lower than world average level for the reason of significant new capacity.
Northeast Asia Chemical Industry Profit Index
Average Gross Profit of Three Regions in
World
Refining
Under strongly increasing supply but decreasing demand, China’s Petrochemical profitability will decline from high level.Petrochemical
30
Thank you