4 poverty, health and education in assam: achievements and ... · 62 poverty, health and education...
TRANSCRIPT

62
Poverty, Health and Education in Assam: Achievements and Challenges
4
4.1. Introduction
1. The main objective of this chapter is to examine the progress made so far by Assam on the human development front and the challenges it faces in the coming years and to identify areas of action. We analyze the trends in several social indicators including poverty and provide possible explanations for the same. Then we identify the target groups for public intervention aimed at poverty reduction and suggest appropria te policy measures for each of these groups. We also look at Assam’s performance in relation to other States and examine if any lessons can be learnt from other States. Once we identify who and where the poor are we need to examine the causes and identify the structural and institutional impediments for faster growth and poverty reduction. The ultimate objective is to arrive at a human development strategy consisting of macroeconomic, structural and social policies among others.
4.2. Poverty in Assam
2. The historical trend in the incidence of rural poverty in Assam (between 1957-58 to 1993-94) shows an increasing trend as opposed to a secular decline in all other States.1 This does not come as a surprise considering the slow growth of Gross State Domestic product (GSDP) in Assam as compared to the growth in the all India GDP. Unfavourable initial conditions (for example, only 4 per cent of the operated area was irrigated around 1960) has been an important reason for the poor performance of Assam in terms of poverty reduction. The growth rate of GSDP in Assam has been declining in recent years. Trends in real wages also show negative growth rates compared to positive growths in most other States and at the all India level (Table 4.1, Figure 4.1). Unemployment rate among the youth is also observed to have risen during the last two decades (Table 4.2). Since 1973-74, however, the incidence of poverty in Assam showed a declining trend (Table 4.3). Urban poverty declined in a smooth and remarkable way, whereas rural poverty has some ups and downs. For example between 1987-88 and 1993-94 rural poverty increased by 5 percentage points while urban poverty declined by 2 percentage points. However, since the population has been growing at an
1 See Datt and Ravallion, 1996, Why have some Indian States done better than others at reducing rural poverty?
Economica; 65(257), February 1998, pages 17-38.

63
alarming rate the absolute number of the poor (rural-urban combined) is on the rise (Figure 4.2).2 Inter decadal growth rate in population in Assam between 1981 and 1991 was 24.24 per cent compared to 23.86 per cent at the all India level. The recent consumption expenditure survey results show that rural poverty declined between 1993-94 and 1999-2000 and the overall absolute number of the poor declined marginally during this period (Table 4.3). Provisional totals of the 2001 census indicate that inter decadal growth rate in population in Assam between 1991 and 2001 was lower compared to the previous decade. It was 18.85 per cent compared to 21.34 per cent at the all India level.
Table 4.1: Annual percentage change in real wages for unskilled agricultural labour 1991-92 1992-93 1993-94 1994-95 1995-96 1996-97 1997-98 1998-99 1999-2000 CAGR
Andhra Pradesh -11.43 1.61 8.6 2.71 -1.73 1.51 4.33 -3.46 4.13 1.92
Assam -8.84 0.75 -6.58 -1.67 2.68 1.52 0.77 1.18 -1.02 -0.12
Bihar -4.46 -4.67 -5.98 1.69 -2.3 15.15 -4.7 -5.7 -3.26 -0.45
Gujarat -4.28 7.72 2.86 1.27 2.92 5.08 14.43 7.37 10.14 5.81
Karnataka -13.02 -14.37 41.31 -15.6 -8.61 21.39 17.05 -2.83 8.42 4.75
Kerala 4.11 9.74 -2.84 5.24 13.2 14.54 15.67 4.9 -14.53 7.07
Madhya Pradesh -3.94 12.31 -3.53 4.93 1.24 1.31 0.83 0.79 3.74 1.96
Maharashtra -14.74 0.47 25.58 -0.68 -7.89 8.31 8.78 -5.41 -10.84 2.39
Orissa -3.45 10.71 -0.14 -3.52 0.55 -0.41 2.39 0.61 -0.23 0.56
Punjab 3.76 4.11 1.51 -1.17 -6.5 -0.42 0.56 -2.92 -0.74 -1.23
Rajasthan 5.96 -3.64 -7.66 1.05 10.33 17.81 5.12 -16.26 16.83 3.06
Tamil Nadu -5.08 13.37 11.6 1.03 3.63 7.9 13.39 2.63 16.84 7.34
Uttar Pradesh 1.35 7.56 -6.77 -2.31 14.78 -6.39 17.36 0.38 -5.61 2.57
West Bengal -6.19 24.31 -6.5 -5.29 -0.28 11.15 3.02 -3.14 0.65 1.68
All India -6.15 5.24 5.61 -0.39 0.72 6.37 7.17 1.56 1.15 3.36
Source: Economic Survey, various issues. Note: CAGR indicates the compounded annual growth rate.
2 The annual population growth rate over the decades starting from the 1951 to 1991 census for Assam is 2.56
compared to 2.14 for all India.

64
-10
-8
-6
-4
-2
0
2
4
6
8
1991-92 1992-93 1993-94 1994-95 1995-96 1996-97 1997-98 1998-99 1999-2000 All IndiaAssam
Figure 4.1: Annual percentage change in real wages for unskilled agricultural labour
Table 4.2: Unemployment rate among youth (age 15 – 29)
1983-84 1993-94 Andhra Pradesh 2.49 3.45 Assam 3.01 19.25 Bihar 2.75 7.36 Gujarat 2.15 4.10
Haryana 3.31 6.20 Karnataka 2.60 4.99
Kerala 13.49 25.62 Madhya Pradesh 0.91 4.39 Maharashtra 2.79 6.55 Orissa 2.48 7.37 Punjab 4.23 5.32 Rajasthan 1.27 1.75 Tamil Nadu 5.88 8.03 Uttar Pradesh 1.96 3.79
West Bengal 5.66 11.45 All-India 3.31 6.46
Source: Aggarwal and Goyal (2000) The Indian Journal of Labour Economic\s, Vol. 43, No. 4

65
Table 4.3: Number of poor in Assam (per cent of total and in lakhs)
Years Rural head count ratio
Urban head count ratio
Combined head count ratio
Rural poor (lakhs)
Urban poor (lakhs)
Total poor (lakhs)
1973-74 52.67 37.16 51.23 76.37 5.50 81.87 1977-78 59.82 37.58 57.63 97.55 6.70 104.25 1983 42.60 26.38 40.86 81.28 6.06 87.35 1987-88 39.35 9.94 36.21 73.53 2.22 75.75 1993-94 45.01 7.73 40.86 94.33 2.03 96.36 1999-2000 (30 day recall)
40.04 7.47 36.09 92.17 2.38 94.55
1999-2000 (7 day recall) 34.00 6.29 30.64 78.27 2.0 80.27
Source: http://www.indiastat.com (Planning Commission estimates based on Expert Group methodology)
0
0.2
0.4
0.6
0.8
1
1.2
1.4
1973-74 1977-78 1983 1987-88 1993-94 1999-2000 (30 dayrecall)
Rural poorUrban poorTotal poor
Figure 4.2: Absolute number of poor (1973-74 = 1)
4.2.1. Rural-Urban contrasts
3. Incidence of poverty in rural Assam is similar to that at the all-India level whereas poverty in urban Assam is much lower than that observed for urban areas at the all-India level. The trend in recent years shows that there has been a worsening of rural poverty even though there has been a decline in urban poverty in Assam. Concentration of poverty in urban areas is much lower than in rural areas (less than 50 per cent). Along with these trends if we consider the fact that bulk (almost 90 per cent) of the population lives in rural areas we could

66
say that poverty in Assam is predominantly a rural phenomenon. The key to poverty reduction therefore lies in the growth of the rural economy. Agricultural yields in Assam are low due to lack of modernization of agriculture. Policy initiatives are therefore needed to modernize agriculture and develop non-farm employment opportunities simultaneously. The poor transport, storage, communication and marketing facilities imply that there is substantial potential for encouraging rural non-farm employment. As will be seen below, the least poor group in rural Assam is the group that is self-employed in non-agriculture.
4. For policy purposes it is not enough to know the number of poor. It is important to know who the poor are and what their various characteristics are. A detailed profile of poverty in Assam depicting the extent to which people from different geographic locations, occupation, education and social backgrounds are afflicted by poverty would be required. This information is important to target the poor through appropriate programs and make the best out of limited resources.
4.2.2. Regional dimensions of poverty
5. Poverty estimates at sub-regional levels have become available for the two time periods 1987-88 and 1993-94. The National Sample Survey Organization based on agro-climatic homogeneity has grouped the districts/ tehsils in the country into several regions termed as the NSS regions . Assam has been divided into three regions, western, eastern plains and hills. Their poverty estimates suggest that western plains are the poorest parts of Assam (Table 4.4, Figure 4.3). The hill regions and the eastern plains have somewhat similar levels of poverty. In the hill regions however, rural poverty doubled between 1987-88 and 1993-94. It needs to be explored as to what caused such a big change. At the sub-regional or the district level we find a wide variation in the incidence of rural poverty (Table 4.4a, Figure 4.3a). These are estimates obtained from an estimated relationship between the incidence of poverty and variables such as urbanization and child mortality, the most significant determinants of poverty. It is found that the least urbanized districts are the poorest. Districts with low health status as indicated by under-five mortality also turn out to be poor. A wide variation is found even in the levels of access to basic health, education and other infrastructure facilities across the districts (Tables 4.4b – 4.4f and Figures 4.3b and 4.3c).
4.2.3. Social and economic dimensions of poverty
6. In rural areas, the incidence of poverty is the highest among agricultural and other labour (as high as 76 per cent and 80 per cent respectively), followed by self-employed in agriculture and self-employed in non-agriculture in that order (Table 4.5). Among the social groups incidence of poverty is higher among the scheduled castes as compared to that among scheduled tribes.

67
Table 4.4: Regional distribution of poverty in Assam
Percent of population below poverty line
Rural Urban Combined
1987-88 1993-94 1987-88 1993-94 1987-88 1993-94
Plains- Eastern 32.25 40.09 9.14 8.23 33.15 36.70
Plains- Western 43.28 53.02 22.71 18.20 41.55 49.53
Hills 26.68 45.05 11.04 4.73 25.96 41.72
All-Assam 39.75 48.00 17.56 13.95 37.95 44.53
All-India 39.54 33.35 40.32 33.84 39.72 33.47
Source: Dubey and Gangopadhyay (1998) Notes: The poverty estimates correspond to the Expert Group Official Poverty lines (EOPL). EOPL for rural India: Rs 115.43 and Rs 196.83 respectively for 1987-88 and 1993-94 and for urban India Rs 165.58 and Rs 286.06 respectively for the years 87-88 and 93-94. EOPL for rural Assam: Rs 127.44 and Rs 238.21 respectively for the years 87-88 and 93-94 and for urban Assam Rs 140.45 and Rs 241.43 respectively for the years 87-88 and 93-94.
0
10
20
30
40
50
60
Plains- Eastern Plains- Western Hills
1987-88
1993-94
Figure 4.3: Rural poverty in Assam: Regional dimensions
7. Between the years 1987-88 and 1993-94, rural poverty increased across all the socio-economic groups. The highest increase occurred in the occupation group ‘other labour’ followed by the group ‘self-employed in agriculture’. Although the overall urban poverty

68
head count decreased between these years it increased among the group of households categorized as employed with regular wages and salaries. The lower level of poverty in upper compared to lower Assam is mainly due to higher urbanization. Also two big industries- Petroleum and Tea are concentrated in upper Assam. In upper Assam, poverty is also linked to the flooding of Brahmaputra, which in one sweep can push families into poverty overnight. The frequent floods cause erosion and displacement. The displaced people lack the skills and resources that are required to survive outside their closed, self-sufficient communities.
Table 4.4a: District wise population and rural poverty estimates District Rural poverty
(per cent below poverty line)
Rural poverty (Number of poor)
Total population
Per cent urban population
Per cent SC population
Per cent ST population
Per cent Muslim population
Dhubri 28.66 335450 1332475 12.16 4.82 2.42 70.45 Kokrajhar 75.92 569322 800659 6.34 3.76 41.15 19.33 Bongaigaon 57.46 421546 807523 9.15 10.74 17.53 32.74 Goalpara 60.34 371708 668138 7.8 5.5 17.23 50.18 Barpeta 50.19 646641 1385659 7.02 6.54 7.97 56.07 Nalbari 85.29 846854 1016390 2.31 8.78 17.67 19.94 Kamrup 24.52 329757 2000071 32.76 7.54 10.72 23.38 Darrang 64.12 791771 1298860 4.93 4.95 17.32 31.98 Sonitpur 36.8 485876 1424287 7.3 5.69 10.71 13.33 Lakhimpur 57.05 400701 751517 6.54 8.01 23.57 14.51 Dhemaji 69.53 326738 478830 1.86 6.37 43.92 1.49 marigaon 80.14 486189 639682 5.16 13.78 15.4 45.31 Nagaon 38.96 657405 1893171 10.87 10.02 3.69 47.19 Golaghat 33.55 261434 828096 5.9 5.59 10.25 7.11 Jorhat 22.75 167934 871206 15.27 7.61 12.09 4.32 Sibsagar 20.33 171247 907983 7.23 3.56 3.8 7.63 Dibrugarh 16.34 140341 1042457 17.61 4.02 7.95 4.49 Tinsukia 11.45 89160 962298 19.08 2.61 5.35 3.13 Karbi Anglong 36.85 218254 662723 10.63 4.22 51.56 1.57 North Cachar 33.01 38395 150801 22.87 2.6 65.54 2.21 Karimganj 48.23 369773 827063 7.3 14.58 0.17 49.17 Kailakandi 43.79 181694 449048 7.6 12.05 0.16 54.79 Cachar 41.04 449862 1215385 9.81 14.7 1.36 34.49 Source: Census of India, 1991, for population data and author’s estimates for poverty head count ratio.
Notes : District-wise poverty estimates are obtained as follows. Since poverty estimates are available at the level of NSS regions (for example, Dubey and Gangopadhyay, 1998) we obtain through regression a relationship between regional poverty and its most significant determinants percentages of urban, SC/ST and muslim population, information on which is available from the census. The district level census data is aggregated to the level of NSS region for running the regression. The fitted relationship is used to obtain rough estimates of poverty in the districts. Although the prediction errors are likely to be very high this method gives a fairly accurate poverty ranking of the districts.
The poverty estimates are based on the survey data for the year 1993-94 and the poverty line used Rs 223.19 per capita consumption expenditure per month (referred to as alternative poverty line (“APL”) in Dubey and Gangopadhyay, 1998).

69
Table 4.4b: District-wise Percentage of Inhabited Villages Having Different Types of Medical Institutions (1991) Part-I Districts Any
Medical Facility (%)
Primary Health Sub-centre(%)
Primary Health Centre(%)
Health Centre (%)
Dispensary (%)
Hospital (%)
Nursing Home (%)
Maternity & Child Welfare Centre (%)
Assam 14.13 4.12 2.5 1.60 1.61 2.95 0 0.82 Barpeta 19.41 17.55 2.87 1.43 4.02 1.63 0 1.82 Bongaigaon 10.26 2.68 2.8 1.52 2.21 1.83 0 0.35 Cachar 17.19 2.25 3.91 1.37 2.93 6.63 0 0.59 Darrang 13.40 5.35 1.66 2.03 1.05 3.99 0 0.60 Dhemaji 6.58 2.25 1.80 0.18 0.18 0.27 0 0 Dhubri 12.54 4.83 1.01 0.62 1.64 1.56 0 0.55 Dibrugarh 20.98 6.20 4.67 1.91 0.84 6.97 0 0.54 Goalpara 20 5.37 1.07 0.13 1.21 4.03 0.13 0 Golaghat 14.07 2.93 5.19 3.21 0.19 2.46 0 0.16 Hailakandi 22.02 2.45 5.20 5.20 2.45 5.50 0 0.31 Jorhat 16.54 6.39 3.01 0.75 0.75 4.39 0 0.88 Kamrup 18.23 6.06 2.38 2.85 3.15 2.08 0 0.54 Karbi Anglong
3.33 0.36 0.44 0 0.87 0.16 0 1.63
Karimganj 20.49 4.59 1.68 0.22 2.35 4.70 0 0.11 Kokrajhar 8.13 1.19 2.06 1.84 2.38 1.63 0 0.22 Lakhimpur 10.70 4.65 1.93 0.88 0.18 1.40 0 1.14 Marigaon 15.82 4.57 3.51 3.16 3.16 3.16 0 0.35 Nagaon 18.18 7.05 2.55 2.11 2.11 2.69 0.07 0.73 Nalbari 21.30 5.98 0.87 2.74 3.36 2.49 0 8.22 North Cachar Hills
6.93 0.17 1.91 1.73 1.39 0.52 0 0
Sibsagar 13.74 4.47 5.50 1.15 0.34 1.72 0 0.11 Sonitpur 16.32 4.79 3.73 3.13 1.95 3.67 0 0.06 Tinsukia 15.93 3.26 1.76 2.20 0.70 8.27 0 0.18
Source: Census of India, 1991 (as given by http:// www.indiastat.com).

70
Table 4.4c: District-wise Percentage of Inhabited Villages Having Different Types of Medical Institutions (1991) Part-II
Districts Maternity Home (%)
Child Welfare Centre (%)
Family Planning Centre (%)
T. B. Clinic (%)
Registered Medical Practice (%)
Sub.Medical Practice(%)
Community Health Work (%)
Others (%)
Assam 0.08 0.77 0.41 0.02 10.62 0.02 0.28 0
Barpeta 0.26 1.82 1.53 0 0.57 0.19 0.29 0.10
Bongaigaon 0 0.23 0.12 0 0.58 0 0 0.12
Cachar 0 0.00 0.20 0 1.17 0 0.10 0
Darrang 0.08 0.15 0.23 0.15 0.06 0 0 0
Dhemaji 0 1.71 0.00 0 0.70 0 0 0.27
Dhubri 0 0.16 2.65 0 0.31 0 0 0
Dibrugarh 0 0 0.61 0 0 0 0 0.08
Goalpara 0.27 11.14 0.27 0 0 0 0 0.13
Golaghat 0 0.28 0 0 0.50 0 0.19 0.09
Hailakandi 0.31 1.53 0.31 0.61 1.53 0 0.00 0.00
Jorhat 0.25 0.25 0 0 0 0 0.00 0.38
Kamrup 0.77 0.54 0.54 0 0 0 3.00 0.23
Karbi Anglong
0 0 0.04 0 0 0 0 0.04
Karimganj 0 0 0.67 0 9.85 0 0 0.11
Kokrajhar 0.11 0.22 0.11 0 0.22 0 0 0.11
Lakhimpur 0 1.58 0.09 0 0 0 0 0
Marigaon 0 1.05 0.35 0 0.26 0 0 0 Nagaon 0 0.36 0.22 0 0.19 0.07 1.82 0.36
Nalbari 0 0.37 0.62 0 0.87 0.25 0 0.12
North Cachar Hills
0 0 1.04 0 0 0 0 0.52
Sibsagar 0 0.92 0.11 0 0 0 0 0.11
Sonitpur 0 0.18 0.06 0 0.09 0 0 0.06
Tinsukia 0 0 0.09 0 0.18 0 0 0.09
Source: Census of India, 1991 (as given by http:// www.indiastat.com)

71
Table 4.4d: District-wise Percentage of Inhabited Villages Having Different Types of Educational Institutions (1991)
Districts Any Educational Facility
Primary School
Middle School
Secondary School
Jr. College/Higher. Secondary/Senior Secondary School
Degree College
Adult Literacy Center
Industrial Training School
Other Training School
Any Other
Assam 79.48 78.52 20.08 11.07 0.47 0.46 0.39 0 0.08 0.48 Barpeta 92.07 91.40 34.23 21.70 0.19 1.24 0.10 0 0.38 0.38 Bogaigaon 90.91 89.74 20.4 10.14 0.35 0.23 0.35 0 0 0.35 Cachar 84.67 84.18 24.51 11.43 0.39 0.49 0 0 0 0 Darrang 90.66 89.76 17.85 10.77 0.08 0.75 0.08 0 0 2.18 Dhemaji 72.61 70.72 12.70 6.76 0.27 0.27 0.36 0 0 0 Dhubri 88.32 87.46 30.84 9.19 0.47 0.16 1.25 0 0 1.40 Dibrugarh 85.76 84 12.94 9.04 0 0.31 0 0 0.08 0.08 Goalpara 91.01 89.80 31.01 11.54 2.82 0.94 0.40 0 0.13 0.40 Golaghat 69.78 69.22 16.81 11.52 0.85 0.57 0.19 0 0.09 0.47 Hailakandi 92.35 91.44 53.82 8.87 0.31 0 0 0 0 0.53 Jorhat 89.10 88.35 27.32 25.19 0.25 2.13 0.25 0 0.25 0.13 Kamrup 85.38 84.85 28.46 19.15 0.85 0.85 0.46 0 0.15 0.31 Karbi Anglong
33.69 33.17 4.25 2.58 0 0.08 0.24 0 0 0
Karimganj 89.14 88.47 18.25 5.38 0.34 0 0 0 0 0.22 Kokrajhar 90.90 89.60 14.08 6.61 0.33 0.22 0 0 0 0 Lakhimpur 89.56 88.51 31.23 14.63 0.53 0.35 0.35 0 0.53 0.79 Marigaon 90.33 88.93 28.12 15.47 0.35 0.35 0 0 0 0.53 Nagaom 86.62 85.53 26.91 13.38 1.53 0.36 0.53 0 0.15 1.89 Nalbari 90.54 90.16 31.01 19.80 0.62 0.75 0.75 0 0 0.29 North Cachar Hills
82.32 81.63 6.59 2.60 0 0.17 0.87 0 0.17 0
Sibsagar 86.60 85.45 24.51 17.18 0.11 0.69 0.11 0 0 0.46 Sonitpur 70.79 69.66 9.46 8.75 0.24 0.18 0.95 0 0 0 Tinsukia 74.03 72.71 10.74 5.90 0.70 0.18 0 0 0 0
Source: Census of India, 1991 (as given by http:// www.indiastat.com)

72
Table 4.4e: District-wise Percentage of Inhabited Villages Having Post & Telegraph Offices and Telephone Connections
Districts Percentage of inhabited Villages Having
Any P&T Facilities
Post Office Telegraph Office
Telephone Connections
Assam 13.34 12.33 0.82 0.70
Barpeta 18.16 17.97 0.29 0.19
Bongaigaon 13.87 12.94 0.93 0.58
Cachar 25.99 23.05 2.54 0.59
Darrang 10.99 10.24 0.90 0.90
Dhemaji 5.32 5.32 0 0
Dhubri 10.98 10.20 0.70 0.78
Dibrugarh 14.40 12.02 1.23 1.99
Goalpara 10.47 9.40 1.07 0
Golaghat 12.84 11.99 0.85 0.28
Hailakandi 25.99 24.16 1.53 2.14
Jorhat 22.68 20.43 1.75 0.75
Kamrup 14.62 14.31 0.38 0.23
Karbi Anglong 2.10 1.98 0.12 0.08
Karimganj 17.13 15.34 1.90 1.01
Kokrajhar 10.62 9.97 0.75 0
Lakhimpur 12.98 11.93 0.53 0.53
Marigaon 14.94 14.41 0.53 0
Nagaon 20.29 19.27 1.31 0.65
Nalbari 25.90 25.53 0.37 0.25
North Cachar Hills 4.51 3.99 0.35 0.17
Sibsagar 14.20 13.40 0.57 0.34
Sonitpur 12.54 11.30 0.89 2.13
Tinsukia 11.62 9.07 0.70 2.29
Source: Census of India, 1991 (as given by http:// www.indiastat.com)

73
Table 4.4f: District-wise Percentage of Inhabited Villages Having Electricity for Different Purpose (1991)
Districts Any Purpose
Domestic Purpose
Agriculture Purpose
Other Purpose
All Purpose
Assam 53.18 53.03 1.71 3.69 1.17 Barpeta 56.88 56.88 3.73 3.82 2.29 Bongaigaon 46.74 45.57 0.93 2.56 0 Cachar 56.15 54.79 2.73 4.10 0.68 Darrang 57.15 57.15 1.66 2.56 1.28 Dhemaji 6.67 6.67 0 0 0 Dhubri 59.97 59.74 0.31 0.78 0.08 Dibrugarh 74.35 74.35 2.45 5.97 1.23 Goalpara 61.21 61.21 0.40 0.94 0.13 Golaghat 48.44 47.40 1.51 5.85 1.23 Hailakandi 58.41 55.66 3.98 5.81 3.36 Jorhat 71.93 71.55 4.76 7.77 3.76 Kamrup 60.31 60.08 0.69 2.15 0 Karbi Anglong
24.72 24.72 1.71 1.71 1.71
Karimganj 57.45 57.22 0 2.24 0 Kokraijhar 52.22 52.22 3.36 3.90 3.36 Lakhimpur 40.09 37.54 0.61 4.30 0 Marigaon 42 42 0.70 1.23 0 Nagaon 69.38 69.38 4.15 5.89 2.47 Nalbari 77.33 77.33 2.24 3.36 2.12 North Cachar Hills
15.60 15.08 0.52 0 0
Sibsagar 83.51 83.39 0.69 3.89 0.57 Sonitpur 60.73 60.62 0.83 7.69 0.77 Tinsukia 68.93 68.93 2.29 7.04 2.20 Source: Census of India, 1991 (as given by http:// www.indiastat.com)

74
Table 4.5: Incidence of poverty in different economic and social groups: Assam and All India
Rural Urban
Head-count index (per cent)
Per cent of total poor
Head-count index
(per cent)
Per cent of total poor
1987-8 1993-4 1987-8 1993-4 1987-8 1993-4 1987-8 1993-4
Self employed in agriculture
45.72
(37.28)
52.01
(30.04)
50.62
(31.36)
42.07
(28.46)
- - - -
Self employed in non-agriculture
34.89
(38.72)
46.93
(33.31)
8.23
(10.67)
9.75
(10.50)
15.72
(36.34)
8.73
(30.34)
49.56
(38.36)
35.47
(37.4)
Agricultural labour
73.04
(61.80)
76.76
(55.21)
25.21
(42.36)
26.85
(43.44)
- - - -
Other labour 57.16
(47.90)
80.73
(41.81)
10.35
( 9.59)
14.41
( 8.43)
- - - -
Employed with regular wages or salaries
- - - - 6.24
(20.99)
7.84
(16.53)
24.63
(29.45)
35.94
(26.16)
Casual labour - - - - 48.54
(61.24)
40.61
(55.12)
23.48
(24.59)
26.0
(26.40)
Scheduled castes 42.78
(55.22)
61.15
(49.04)
6.84
(24.72)
9.94
(28.24)
21.40
(47.07)
16.78
(42.35)
22.48
(17.63)
11.30
(21.65)
Scheduled tribes 53.84
(59.92)
56.35
(50.07)
16.80
(14.62)
14.14
(14.40)
9.96
(44.69)
8.35
(35.67)
3.39
( 5.67)
3.31
( 4.43)
Source: NSSO 43rd and 50th rounds. Notes : Figures for all India are given in parentheses. ‘Head count index’ indicates the percentage of population in each group that fall below poverty line. For example, in
Assam 52.01 per cent of the self-employed population in agriculture were poor in 1993-94. The corresponding all India figure is 30.04 per cent.
‘Percent of total poor’ indicates the percentage distribution of the poor across different groups. For example, 42.07 per cent of the total poor population in Assam is self-employed in agriculture.
The poverty estimates correspond to the Official Poverty lines (OPL). OPL for rural India: Rs 125.68 and Rs 214.31 respectively for 1987-88 and 1993-94 and for urban India Rs 161.31 and Rs 278.68 respectively for the years 87-88 and 93-94.
OPL for rural Assam: Rs 137.35 and Rs 256.73 respectively for the years 87-88 and 93-94 and for urban Assam Rs 129.11 and Rs 221.94 respectively for the years 87-88 and 93-94.
75
8. From the distribution of the total poor across different groups it is seen that the largest fraction of the poor in rural areas belong to the ‘self employed in agriculture’ category followed by agriculture and other labour (Figures 4.4 and 4.5). There has not been much change in the occupation wise distribution of the poor in rural areas between the two periods 1987-88 and 1993-94. In the urban areas there has been a remarkable change in the distribution of the poor across occupation groups. The proportion of the poor belonging to the self employed category dropped from 50 per cent in 1987-88 to 35 per cent in 1993-94. The proportion of the poor belonging to the employed with regular wages/salaries category however increased from 25 per cent in 1987-88 to 36 per cent in 1993-94.
4.2.4. Areas of action
9. The government should assign top priority to tackling rural poverty. It should aim at reducing the incidence of poverty in rural areas by strengthening the capabilities of the poor and vulnerable groups to earn income through better education and health facilities. The existence of several anti-poverty programs such as the food subsidy program through the Public Distribution System (PDS), the employment generation program, Jawahar Rozgar Yojana (JRY) and the subsidized credit program for self-employment (IRDP) has not made much impact on poverty. The reasons for the poor performance, which holds good for most States in India, have been discussed in several evaluation reports. In the case of Assam, survey data reveals (Table 4.6) that a greater percentage of the population had access to PDS compared to All India. However, the income support provided by these programs has not been large enough to pull people out of poverty on a sustained basis. Access to IRDP is found to be lower in Assam compared to all India. In both PDS and IRDP, leakage in terms of benefits accruing to the non-poor has been high. Contrary to expectations, asset formation has been lacking in rural areas through employment programs.
10. In order to reduce geographical disparities, the government needs to identify the strengths of different regions and devise anti-poverty strategies appropriate for those regions. The effectiveness of poverty alleviation programs can be improved by targeting poorer villages and districts. The district or the village level poverty map can be obtained by combining NSS survey data with Census data since the sample size for the NSS at the level of the district is insufficient to obtain estimates of statistical significance.3 With limited resources it is important that the policies and programs first target the regions with the greatest proportion of the poor. Instead of spreading resources thinly across many people they could be restricted to a selected few. In the case of IRDP for example, the credit extended would then be adequate for the beneficiaries to come out of poverty on a sustained basis.
3 See Bigman and Srinivasan, 2001, Geographical Targeting of Poverty Alleviation Programs: Methodology and
Applications in Rural India, IGIDR (mimeo) and the references therein.

76
self employed- agriculture51%
self employed- non agriculture
8%
agricultural labor25%
other labor10%
other6%
Figure 4.4: Distribution of rural poor 1987-88
self employed- agriculture42%
self employed- non agriculture
10%
agricultural labor27%
other labor14%
other7%
Figure 4.5: Distribution of rural poor 1993-94

77
Table 4.6: Access to PDS and IRDP: Beneficiaries as per cent of total
1987-88 1993-94
All-India Assam All-India Assam
PDS rural 62.85 74.32 77.23 86.35
PDS urban 63.86 50.61 68.97 57.91
IRDP rural 6.83 3.17 7.51 2.69
Source: Dubey (2000): Hunger and poverty in North Eastern states, Implications for food security, paper presented at the National Seminar on Food security in India, CESS Hyderabad, March 25-27.
Notes: Figures in each cell denote the percentage of population benefiting from the program. For example, 62.85 per cent of rural population in All India and 74.32 per cent of rural population in Assam benefit from PDS.
11. Since the majority of the poor are employed in agriculture they are vulnerable to fluctuations in weather, floods etc. There is therefore a need to develop risk management mechanisms. At the individual level this can be done through diversification of income sources (e.g. pisciculture, livestock and horticulture). At the community level this has to be done through mechanisms for common property and infrastructure management.
12. Since a large fraction of the poor are self-employed in agriculture, diversification through better irrigation facilities and water management can increase their incomes substantially. The chain of value addition has to be developed through better roads, storage, transport and other marketing infrastructure.
13. Underdeveloped rural marketing infrastructure has been the hindering factor for the commercialization and diversification of agriculture into areas such as horticultural and floricultural activities. There is therefore a need to develop contract farming in cooperation with the corporate and business sectors to remove the initial market uncertainties faced by farmers.
14. The food-processing sector has great potential for generating rural non-farm employment. However, this would require a transition from subsistence to commercialized agriculture. Captive cultivation of raw material would be needed to prevent under utilization of productive capacities. Factors that can help in the overall development of the non-farm sector include, deregulation of markets through removal of restrictions under the Essential Commodities Act, removal of small scale sector reservation and entry barriers in sectors such as dairy, removal of selective credit controls etc.
15. A major part of the rural infrastructure can be provided through public employment schemes. The Maharashtra model of Employment Guarantee Scheme (EGS) can be used where urban employees are taxed to fund this scheme. It is now well known that such schemes can have several advantages. They are self-financing, reduce poverty through provision of

78
employment, ensure minimum wages to labour and build public assets. The EGS wage is set at such a level that only those unable to find employment elsewhere are attracted to it. This self-selecting feature of such programs makes it very convenient to target benefits at the poor.
16. The general experience through out the country including Assam has been that the administration of most developmental and anti-poverty programs is centrally controlled. Funding and administering of Centrally sponsored schemes has been in the hands of Central and State government ministries and departments with inadequate local participation in decision making. In order to strengthen the decentralization process the 73rd constitutional amendment provided for democratically elected rural local governments at three levels (district, block and village). Decentralized process however is yet to take off in Assam. It has been observed that funds allocated to the lower level bodies are not released by the State government. Elections to the Panchayats have not been held since 1997 when they were due.
17. Most of the anti-poverty programs are in the nature of short-term measures. The long-term solution lies in increasing the overall productivity in the economy. High percentage of rural population and limited opportunities for labour absorption in the urban areas underscores the importance of increasing agricultural productivity. However, for sustained poverty alleviation policy measures have to be taken not only to increase agricultural productivity but also to increase urban employment through greater urbanization and industrial growth. In the current national scenario where almost all the states are vying with each other to attract private investment through different concessions, tax holidays, etc, Assam has a clear disadvantage due to poor law and order situation and infrastructural facilities. In the short term there is hope mainly from local entrepreneurs who can deal with militants effectively. Industrial strategy should focus initially on development of industries to meet local demand since the transport bottlenecks make exports unattractive. To begin with the state should exploit its own resources to the maximum. Untapped potential exists in the fields of tourism and forest produce.
18. Modern technology could be used to overcome some of the existing infrastructural bottlenecks. For example, cellular phones can be provided in rural areas on the lines of Grameen phone in Bangladesh. License fee to cellular operators can be reduced for creating networks in rural areas. Easy access to information on prices etc from markets can help farmers get the upper hand on middleman to sell their produce in urban markets.
4.3. Health and education in Assam
19. It is well known that low economic growth and widespread poverty get reflected in poor social indicators of development such as low levels of achievement in health and education. Assam ranks 12 among 16 States when ordered in the descending order of Human Development Index (HDI) and Gender Development Index (GDI). In fact it can be grouped

79
with the BIMARU States in this respect. Rural urban disparities are high in several of the indicators. Life expectancy at birth is 54.1 in rural as compared to 63.3 in urban areas. 52 per cent of children are underweight in rural compared to 37 per cent in urban areas. These disparities are a matter of concern especially if we consider the fact that the level of urbanization in Assam is quite low. Around 10 per cent of the population lives in urban areas. The corresponding figure at the all India level is 30 per cent.
20. Publicly provided social services especially those on education and healthcare play an important role in reducing poverty. The usefulness of education and its role in poverty reduction is widely recognized. Investment in quality education makes people more productive in home and at work. Evidence suggests that schooling raises labour productivity through increasing cognitive competencies of people (increases their capacity for logical and analytical thinking and reasoning). Non-cognitive competencies that are relevant for economic and social change are also enhanced through quality education. Educated people become better informed and more open to new ideas and technological changes. Educational attainment is known to have a positive effect on health outcomes also. There is substantial evidence linking high fertility and mortality to low levels of female literacy and educational attainment. It is also observed that infant and child mortality rates are lower for households with higher levels of education (Table 4.7). The National Family Health Survey data reveals that the total fertility rate for India is 1.5 children higher for illiterate women than for women with at least a high school education. Infant mortality rates for all India declines sharply with increasing education of mothers ranging from a high of 87 deaths per 1000 live births for illiterate mothers to a low of 33 deaths per 1000 live births for mothers who have at least completed high school (Table 4.8). At the same time we also notice that school attendance and educational attainment among the poor are lower compared to others (Table 4.9). It is also the case that educational attainment among females is lower compared to males and rural areas lag behind urban ones (Table 4.10).
21. Although, in general, a positive relation is found between social development and economic growth, policies aimed at increasing economic growth alone are not sufficient to ensure social development. Direct intervention by the government is necessary not only for redistribution purposes but also because most of the basic services have a public good characteristic. Insofar as poverty acts as a constraining factor in the utilization of these services by the poor the strategies and priorities of the Assam government should be focused on the core issue of poverty, along with a greater provision of these services. The latest available data on households’ access to basic amenities shows that Assam fares worse than the national average in indicators such as access to electricity and drinking water. Only 26 per cent of the households in Assam are with electricity compared to the national average of 60 per cent and 72 per cent in Kerala. In this aspect the other North-Eastern States fare much better than Assam (Table 4.11).

80
4.3.1. Health sector:
22. Good health is important to keep the labour force productive and efficient. Frequent illnesses and inadequate nutrition will have adverse impact on the incomes of households making them vulnerable. Good health not only increases productivity and earnings of an individual but also improves the overall quality of life and the socio-economic development of the general population. Malnourishment and under-nourishment can be avoided not just by poverty reduction and higher food intake but also through good health that can be brought about through improved access to sanitation and drinking water facilities.
Table 4.7: Infant and child mortality by level of education- Assam (1991 census)
Infant Mortality Under five Mortality Male Female Total Male Female Total Rural Illiterate 97 92 94 135 124 131 Literate but below middle 77 71 73 99 99 99 Middle but below matric 60 54 57 72 64 69 Matric but below graduate 48 48 47 56 60 59 Graduate and above 50 47 49 59 55 56 Urban Illiterate 68 74 72 94 102 101 Literate but below middle 61 57 59 73 73 71 Middle but below matric 36 39 39 41 46 41 Matric but below graduate 22 25 22 27 30 27 Graduate and above 32 28 29 39 34 36 Rural-Urban Combined Illiterate 69 73 73 90 101 95 Literate but below middle 74 71 72 95 95 95 Middle but below matric 56 51 53 68 63 65 Matric but below graduate 39 39 39 44 47 46 Graduate and above 36 42 38 42 49 45
Source: Irudayarajan and Mohanachandran, EPW, December 16-22, 2000

81
Table 4.8: Fertility rates and infant and child mortality rates by mother's education, 1998-99
Total fertility rate
Mean number of children ever born to ever-married women age 40-49 years
Neonatal mortality
Post neonatal mortality
Infant mortality Under-five mortality
Illiterate 3.47 4.98 55.3 31.2 86.5 122.8 Literate, < middle complete
2.64 4.06 40.5 18 58.5 75.8
Middle school complete
2.26 3.41 33.7 14.4 48.1 58.1
High school complete and above
1.99 2.66 24.3 8.5 32.8 37.1
All 2.85 4.45 47.7 25.3 73.0 101.4
Source: NFHS-2, Tables 4.4 and 6.4
Table 4.9: Achievement levels in education by status of wealth
Proportion of 6-14-year-olds in school
Proportion of 15-19-year-olds who completed at least grade 8
Bottom 40 percent
Top 20 percent Bottom 40 percent
Top 20 percent
Andhra Pradesh 0.457 0.917 0.160 0.859
Assam 0.615 0.846 0.229 0.866
Bihar 0.378 0.942 0.183 0.864
Gujarat 0.552 0.962 0.212 0.845
Haryana 0.605 0.957 0.189 0.728
Karnataka 0.507 0.943 0.205 0.816
Kerala 0.887 0.975 0.531 0.923
Madhya Pradesh 0.461 0.937 0.172 0.832
Maharashtra 0.671 0.962 0.279 0.832
Orissa 0.552 0.969 0.189 0.908
Punjab 0.427 0.957 0.153 0.777
Rajasthan 0.414 0.910 0.141 0.773
Tamil Nadu 0.717 0.950 0.269 0.838
Uttar Pradesh 0.484 0.939 0.239 0.836
West Bengal 0.527 0.902 0.137 0.734
Source: Filmer and Prichet (1998)

82
Table 4.10: Gender and rural-urban gaps in educational attainment: Assam 1992-93
Proportion of 15- to 19-year-olds who have completed different grades Grade Male Female Gap Urban Rural Gap 1 0.796 0.635 0.161 0.878 0.692 0.186 2 0.785 0.62 0.165 0.871 0.678 0.193 3 0.756 0.601 0.155 0.862 0.652 0.21 4 0.73 0.572 0.158 0.839 0.624 0.215 5 0.645 0.513 0.132 0.789 0.549 0.24 6 0.592 0.481 0.111 0.746 0.508 0.238 7 0.532 0.434 0.098 0.701 0.452 0.249 8 0.47 0.374 0.096 0.642 0.391 0.251 9 0.374 0.298 0.076 0.543 0.307 0.236
Source: Filmer (1999)
Table 4.11: Living conditions by state, 1998-99
Percentage of households: State With
Electricity With Drinking Water that is piped or from a hand pump
With a toilet or latrine
Using biomass fuel for cooking
Living in a pucca house
Mean number of persons per room
India 60.1 77.9 35.9 71.7 32 2.7 Arunachal Pradesh 68.9 80.7 73 80.8 14.2 2.2 Assam 26.4 60.1 63 87.1 10.9 2.1 Manipur 75.3 48.9 92 69.2 7.1 2.1 Meghalaya 41.2 42.1 52 83.5 14.5 2 Mizoram 84.1 63.2 97.7 57.4 16.2 2.6 Nagaland 56.3 40.5 74.3 86.1 18.1 1.6 Sikkim 80.7 84.6 72.7 63.2 50.6 2 Kerala 71.8 19.9 85.2 81.7 79.8 1.3 Source: NFHS-2, 1998-99. Table 2.12 Notes: Majority of the households in Kerala obtains their drinking water from wells.
23. The health sector in Assam is characterized by the following. Although the infant mortality rate in Assam has been falling over the years it is still higher than the all India rate. Female infant mortality in 1997 was, for example, 77.8 per thousand live births compared to 12.9 in Kerala and 72.2 at the all India level. High mortality is mainly due to neo-natal mortality, which is affected by several factors including health of mother, birthing facilities, care of newly born etc. Part of it is also due to the fact that a large percentage of the population is deprived of access to basic health services such as vaccinations (BCG, measles, DPT, Polio, etc) (Table 4.13). The level of utilization of vaccination services in Assam is lower than the all India average as well as most other northeastern States. Disease control, particularly of vector born diseases such as malaria and encephalitis is an important area of concern in

83
Assam. Since the poor are more susceptible to these diseases provision of safe drinking water and sanitation facilities becomes extremely important.
Table 4.12: Infant and child mortality by state, 1998-99
State Neonatal Post neonatal Infant Child Under-five Mortality Mortality Mortality Mortality Mortality (NN) (PNN) (1q0) (4q1) (5q0) India 43.4 24.2 67.6 29.3 94.9 Arunachal Pradesh 41.8 21.3 63.1 37.4 98.1 Assam 44.6 24.9 69.5 21.4 89.5 Manipur 18.6 18.4 37.0 19.9 56.1 Meghalaya 50.7 38.3 89.0 36.2 122.0 Mizoram 18.8 18.2 37.0 18.4 54.7 Nagaland 20.1 22.0 42.1 22.7 63.8 Sikkim 26.3 17.6 43.9 28.4 71.0 Kerala 13.8 2.5 16.3 2.6 18.8 Source: NFHS-2, Table 6.6 Notes: Mortality is given as deaths per 1000. The definitions are as given below. Neonatal mortality: the probability of dying in the first month of life. Post neonatal mortality: the probability of dying after the first month of life but before the first birthday. Infant mortality: the probability of dying before the first birthday. Child mortality: the probability of dying between the first and the fifth birthday. Under-five mortality: the probability of dying before the fifth birthday. Post neonatal mortality is computed as the difference between the infant and neonatal mortality rates
Table 4.13: Utilization of vaccination services, 1998-99
Percentage Vaccinated
DPT Polio
State BCG Polio 0 1 2 3 1 2 3 Measles All1 None India 71.6 13.1 71.4 65.0 55.1 83.6 78.2 62.8 50.7 42.0 14.4 Arunachal Pradesh 54.2 4.5 57.4 52.7 41.8 67.6 62.5 43.3 33.6 20.5 28.7 Assam 53.5 3.1 57.4 48.5 37.5 61.8 53.6 37.9 24.6 17.0 33.2 Manipur 71.0 32.1 76.4 71.0 59.1 81.3 76.9 62.5 45.8 42.3 17.2 Meghalaya 46.1 11.5 44.8 36.8 25.4 51.8 43.8 27.6 17.7 14.3 42.3 Mizoram 88.2 4.6 86.9 83.9 69.5 88.3 83.5 71.9 71.0 59.6 10.5 Nagaland 46.1 5.5 48.1 40.9 29.6 66.6 60.3 41.8 19.6 14.1 32.7 Sikkim 76.5 8.2 75.7 71.7 62.5 79.8 75.7 63.5 58.9 47.4 17.6 Kerala 96.2 60.6 96.0 94.4 88.0 96.9 95.2 88.4 84.6 79.7 2.2
Source: NFHS-2, Table 6.11
Note: Percentage of children age 12-23 months who received specific vaccinations at any time before the interview (according to the Vaccination card or the mother). Table includes only surviving children from among the two most recent births in the three years preceding the survey. All includes BCG, measles, and three doses each of DPT and polio vaccines (excluding Polio 0).
84
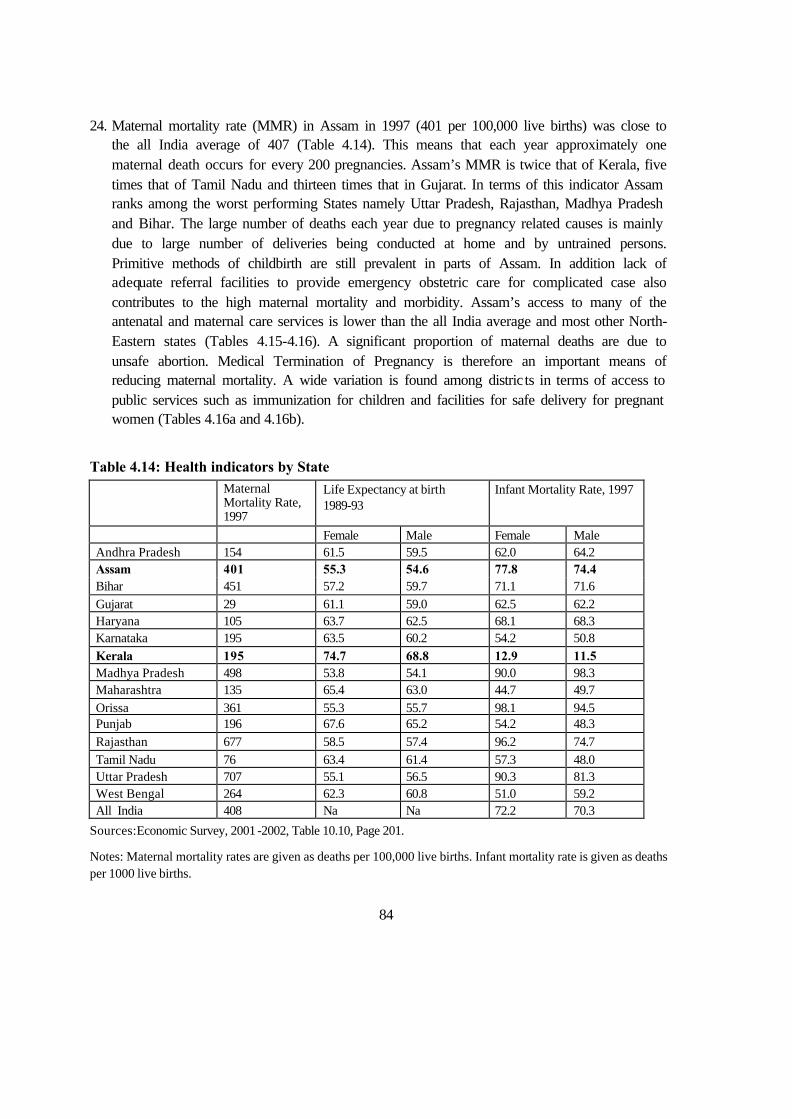
24. Maternal mortality rate (MMR) in Assam in 1997 (401 per 100,000 live births) was close to the all India average of 407 (Table 4.14). This means that each year approximately one maternal death occurs for every 200 pregnancies. Assam’s MMR is twice that of Kerala, five times that of Tamil Nadu and thirteen times that in Gujarat. In terms of this indicator Assam ranks among the worst performing States namely Uttar Pradesh, Rajasthan, Madhya Pradesh and Bihar. The large number of deaths each year due to pregnancy related causes is mainly due to large number of deliveries being conducted at home and by untrained persons. Primitive methods of childbirth are still prevalent in parts of Assam. In addition lack of adequate referral facilities to provide emergency obstetric care for complicated case also contributes to the high maternal mortality and morbidity. Assam’s access to many of the antenatal and maternal care services is lower than the all India average and most other North-Eastern states (Tables 4.15-4.16). A significant proportion of maternal deaths are due to unsafe abortion. Medical Termination of Pregnancy is therefore an important means of reducing maternal mortality. A wide variation is found among distric ts in terms of access to public services such as immunization for children and facilities for safe delivery for pregnant women (Tables 4.16a and 4.16b).
Table 4.14: Health indicators by State
Maternal Mortality Rate, 1997
Life Expectancy at birth 1989-93
Infant Mortality Rate, 1997
Female Male Female Male Andhra Pradesh 154 61.5 59.5 62.0 64.2 Assam 401 55.3 54.6 77.8 74.4 Bihar 451 57.2 59.7 71.1 71.6 Gujarat 29 61.1 59.0 62.5 62.2 Haryana 105 63.7 62.5 68.1 68.3 Karnataka 195 63.5 60.2 54.2 50.8 Kerala 195 74.7 68.8 12.9 11.5 Madhya Pradesh 498 53.8 54.1 90.0 98.3 Maharashtra 135 65.4 63.0 44.7 49.7 Orissa 361 55.3 55.7 98.1 94.5 Punjab 196 67.6 65.2 54.2 48.3 Rajasthan 677 58.5 57.4 96.2 74.7 Tamil Nadu 76 63.4 61.4 57.3 48.0 Uttar Pradesh 707 55.1 56.5 90.3 81.3 West Bengal 264 62.3 60.8 51.0 59.2 All India 408 Na Na 72.2 70.3
Sources: Economic Survey, 2001 -2002, Table 10.10, Page 201.
Notes: Maternal mortality rates are given as deaths per 100,000 live births. Infant mortality rate is given as deaths per 1000 live births.

85
Table 4.15: Access to antenatal care by State, 1998-99 State Percentage
that received at least one antenatal check-up
Percentage that received three or more antenatal check-up
Percentage that received an antenatal check-up in the first trimester of pregnancy
Percentage that received two or more Tetanus toxoid Injections
Percentage given any iron and folic acid tablets or syrup
Percentage that received supply of iron and folic acid tablets or syrup for 3+ months
India 65.4 43.8 33.0 66.8 57.6 47.5 Arunachal Pradesh
61.6 40.5 24.5 45.6 56.3 47.6
Assam 60.1 30.8 30.7 51.7 55.0 45.3 Manipur 80.2 54.4 45.0 64.2 50.0 38.0 Meghalaya 53.6 31.3 20.6 30.8 49.5 40.6 Mizoram 91.8 75.8 39.6 37.8 72.7 62.0 Nagaland 60.4 23.1 23.8 50.9 42.5 26.7 Sikkim 69.9 42.6 30.2 52.7 62.4 50.4 Kerala 98.8 98.3 81.1 86.4 95.2 88.6 Source: NFHS-2, Table 8.7 Notes: Antenatal care (ANC) refers to pregnancy related health care provided by a doctor or health worker in a medical facility or at home. The table includes only the two most recent births during the three years preceding the survey.
Table 4.16: Access to maternal care by state, 1998-99 State Percentage
that received all recommended types of antenatal care1
Percentage of births delivered in a medical institution
Percentage of deliveries assisted by a health professional2
Percentage of non- institutional deliveries with a post-partum check-up within two months of birth3
Percentage of non-institutional deliveries with a post-partum check-up within two days of birth3
India 20.0 33.6 42.3 16.5 2.3 Arunachal Pradesh 17.3 31.2 31.9 10.5 0.3 Assam 15.8 17.6 21.4 25.5 0.5 Manipur 18.3 34.5 53.9 27.1 1.4 Meghalaya 10.4 17.3 20.6 20.8 0.0 Mizoram 13.5 57.7 67.5 20.9 0.9 Nagaland 8.9 12.1 32.8 4.3 0.0 Sikkim 15.3 31.5 35.1 38.0 0.7 Kerala 64.9 93.0 94.0 27.4 7.5 Source: NFHS-2, Table 8.13 Note:
Table includes only the two most recent births during the three years preceding the survey. 1 Three or more antenatal check-ups (with the first check-up within the first trimester of pregnancy), two or more tetanus toxoid injections, and iron and folic acid tablets or syrup for three or four months. 2 Doctor, auxiliary nurse, midwife, nurse, midwife, lady health visitor, or other health professional. 3 Based on the births in the 2-35 months preceding survey.

86
Table 4.16a: District-wise Eligible Women Giving Safe Birth- 1999
Percentage of Eligible women with Live/Still Births who had
Districts 3 or more ANC Check -up
Two or more TT Injections during Pregnancy
Consumed one or two IFA Tablets Regularly
Total Institutional Delivery
Delivery at Home by Trained Personnel
Total Safe Delivery
Bongaigaon 20.4 49 54.5 16.7 9 25.7
Darrang 22.7 66.3 64.6 20 14.5 34.5
Dhubri 21.2 46.5 50 11.5 6.9 18.4
Goalpara 9.6 47.9 43.4 10.6 10.6 21.2
Hailakandi 31.1 47.2 47.8 16.9 13.2 30.2
Kamrup 38.2 63.6 72.7 32.6 8.5 41.1
Karimganj 29.6 59.6 45.7 12.7 11.8 24.5
Lakhimpur 33 60.4 45 21.7 6.3 28
Nagaon 7.8 50.8 41.6 5.6 4.4 10
North Cachar Hills
8.7 12.4 24 7.7 14.9 22.7
Source : Ministry of Health and Family Welfare
Table 4.16b: District-wise Children who Received Immunization
Districts Percentage of Children who Received BCG DPT (3
Injections) Polio (3 Doses) Measles Complete
Immunization At Least one Dose of Vitamin 'A'
Bongaigaon 71.9 67.3 69.7 60.4 51.6 48Darrang 28.9 57.2 70.2 60.5 48.5 34.3Dhubri 75.6 63.2 62 53.7 48 12.5Goalpara 55 44.6 46.9 38.4 34.2 27Hailakandi 61.2 41.6 38.1 33.5 20.8 9.7Kamrup 82.5 58.9 74.6 58.9 46.4 47.8Karimganj 56.2 38.9 57.2 27.1 23 45Lakhimpur 80.7 76.6 77.3 77.6 75.2 90.7Nagaon 66.3 42.9 64.4 40.1 31 14.3North Cachar Hills
53.6 37 63.3 12.9 7.5 2.4
Source: Ministry of Health and Family Welfare.

87
25. Though the per capita revenue expenditure on health in Assam is lower compared to the average of all States, the share of SDP spent on health services in Assam is quite high, above the average of all States (Figures 4.6 and 4.7). Why then do the expenditures not get translated into better indicators?
0
1
2
3
4
5
6
7
90-91 91-92 92-93 93-94 94-95 95-96 96-97
Assam All States
Figure 4.6: Education expenditure as percent of SDP
4.3.1.1. Reasons for inefficiencies
26. While there appears to be adequate physical health infrastructure with primary health centres (PHC) and hospitals, etc, the quality of service provision is low. Lack of adequate complementary infrastructure such as roads, etc makes health services effectively inaccessible to people. Poor living conditions in villages with inadequate infrastructure facilities such as electricity, roads and sanitation make it unattractive for doctors and other health workers to work in PHCs.
27. There is also a high degree of administrative inefficiency. A high percentage of current expenditure goes to salaries and wages. Posts created under plan expenditure continue to exist even after the completion of projects. Due to this problem the Central government allowed the use of plan expenditure up to 20 per cent on the revenue account. However, currently 90 per cent of the plan expenditure is spent on revenue account.

88
0
0.2
0.4
0.6
0.8
1
1.2
1.4
90-91 91-92 92-93 93-94 94-95 95-96 96-97
Assam All States
Figure 4.7: Health expenditure as percent of SDP
28. Other problems pertain to the design of the health sector expenditures. Greater importance is given to curative, rather than preventive care and cost recovery is low even from well off individuals.
4.3.1.2. Areas of action
29. The delivery of immunization and maternal care services needs to given top priority in order to improve Assam’s ranking in terms of human development. Maternal, infant and child mortality is influenced by a whole range of socio-economic factors, the status of women, which includes low level of education, economic dependency and lack of access to services. States like Kerala, Karnataka, Tamil Nadu, Maharashtra, Andhra Pradesh, Punjab and Haryana, which have relatively better socio-economic and education status, have lower MMR than the other states. Thus, besides improving the maternal health care services, it is necessary to improve the social status of women, including the education standard, to reduce the current level of MMR. To end unwanted pregnancies, women resort to abortions. The absence of appropriate quality of contraception is an important reason for abortion. Lack of safe abortion facilities in rural areas force women to resort to unsafe abortions. Most of the services are located in the urban areas, while nearly 90 per cent of the population lives in the rural areas. This distinct urban bias in the provision of these services needs to be corrected.
30. The resource constraint faced by the health sector implies that there is an urgent need to improve cost recovery through introduction of reasonable levels of user charges at least in certain areas such as curative services. Resources generated should be sufficient enough to operate and maintain the existing capital equipment. Households’ ability to pay can be

89
enhanced through risk sharing mechanisms such as health insurance and other forms of social financing. Employer health-based insurance schemes need also to be developed.
31. There is also a need to protect the poorer and vulnerable sections through direct targeting. Health cards (similar to ration cards) can be issued to the poor so that they become eligible for free or subsidized treatment and other services. Clear guidelines can be specified for qualifying to be a beneficiary. And social workers, NGOs, etc can aid the process of identifying beneficiaries.
32. Expenditure decentralization with strict accountability and transparency can increase the efficiency of use of funds through greater involvement of stakeholder fraternity. Direct resources transfers to the local level will lead to increased participation of the local authorities in health care delivery. However, capacity building for management and leadership at the local level is necessary to improve governance. It is crucial to have institutional reforms to make them responsive to the needs of the traditionally marginalized groups such as women, tribal groups and the poor in general. The Rogi Kalyan Samiti (RKS) or Patients’ Welfare Committee in Madhya Pradesh is an example where a community of volunteers (stakeholders) was allowed to collect user fees to generate funds to improve hospital amenities.4 The RKS are registered as autonomous NGOs and have complete control over the funds.
4.3.2. Education:
33. The education scene in Assam is characterized by the following facts. A large number of eligible children of school going age still remain out of school. The recent NFHS survey indicates that 72 per cent of the population in the 6-17 age group is attending school in Assam, which is same as the all India average (Table 4.17). This figure is however much lower than that of Kerala (91 per cent) and lower than all other North-Eastern States (in the range of 80 per cent to 87 per cent). The school completion rates are found to be low, indicating high dropout rates. Median number of years of schooling completed among the male population age 6 and above is 4.4 compared to 8.1 for Kerala and 5.5 for all India (Table 4.18). Female educational achievement in Assam is found to be better relative to the all India performance. The various gaps: rural-urban gap, gender gap (male/female) and poverty gap (poor/non-poor)) is very much evident from the data on educational attainment. The problem of school dropouts in Assam relative to other Indian States has also been brought out sharply in the Economic Survey 2000-01 (Table 4.19). During 1998-99, the gross enrolment ratio for primary school (class I-V) children was 109.63 in Assam compared to 92.14 per cent in all India. But for the upper primary level (classes VI to VIII), the enrolment ratio was merely 61.12 compared to 57.58 per cent for all India. Although the primary level
4 See Madhya Pradesh Human Development Report, 1998.

90
enrolment during 1998-99 in Assam is higher than most other States, the gross enrolment ratio is considerably lower at the upper primary level indicating a high percentage of dropouts. One important reason for high dropout rate is the non-availability of educational facilities above the primary level in villages. A large percentage of the villages are still without an upper primary school. This especially accounts for a large chunk of girls dropping out after primary level. The parents are reluctant to send the girls to other villages for schooling, for fear of their security.
34. Literacy rate for the State has improved substantially between 1991 and 2001 (Table 4.20). The district wise performance in literacy shows wide variations in performance. Not only has there been an overall reduction in illiteracy but there has also been a substantial reduction in regional disparities in literacy (Figures 4.7a and 4.7b). The gender gap in literacy however persists. The role of literacy in bringing about a demographic transition and better health outcomes is well recognized in the literature.
Table 4.17: Percentage population age 6-17 years attending school, 1998-99
State Male Female Total
Urban Rural Total Urban Rural Total Urban Rural Total
India 83.0 75.8 77.6 80.0 61.7 66.2 69.0 69.0 72.1
Arunachal Pradesh 96.7 82.3 84.2 87.3 74.3 75.9 92.2 78.3 80.1
Assam 86.8 73.3 74.2 81.1 69.0 69.9 83.8 71.2 72.1
Manipur 91.8 87.3 89.1 89.3 82.0 84.4 90.5 84.7 86.6
Meghalaya 91.4 75.3 78.5 91.3 76.8 79.9 91.3 76.0 79.2
Mizoram 92.6 78.6 85.5 89.3 79.9 85.3 91.0 79.2 85.4
Nagaland 87.3 84.5 85.1 89.8 78.0 79.4 86.0 81.1 82.2
Sikkim 88.0 82.7 83.2 84.8 83.6 82.6 80.6 83.2 82.9
Kerala 95.6 89.7 91.0 94.5 89.8 90.8 95.0 89.8 90.9
Source: NFHS-2, Table 2.9

91
Table 4.18: Percentage distribution of population across different levels of educational attainment, 1998-99 State Illiterate Literate,
Primary School Complete
Primary School Complete
Middle School Complete, Male
High School Complete
Higher Secondary Complete and above
Median Number of years of Schooling
Male India 25.5 21.1 18.4 13.0 10.7 11.2 5.5 Arunachal Pradesh 27.0 26.6 16.5 13.2 7.4 9.2 4.4 Assam 25.4 27.2 15.7 15.8 6.9 8.9 4.7 Manipur 20.3 15.0 14.7 20.5 12.3 17.3 8.0 Meghalaya 28.3 35.1 14.0 11.2 5.5 5.8 3.2 Mizoram 6.4 31.9 24.4 19.7 7.6 9.9 6.4 Nagaland 19.4 27.6 20.3 15.3 8.7 8.5 5.4 Sikkim 20.7 32.0 20.2 11.2 7.2 8.6 4.7 Kerala 7.2 18.4 23.4 17.4 21.2 12.4 8.1 Female India 48.6 17.1 14.5 8.1 6.0 5.6 1.6 Arunachal Pradesh 43.0 22.0 14.5 11.3 5.2 4.0 2.1 Assam 40.9 24.0 12.5 13.7 4.9 3.8 2.5 Manipur 41.3 13.1 11.6 15.5 7.4 11.0 4.3 Meghalaya 33.2 35.9 13.0 9.4 4.6 3.9 2.3 Mizoram 10.6 36.3 21.7 17.9 7.5 6.0 5.5 Nagaland 31.7 26.3 19.1 13.2 5.4 4.3 3.7 Sikkim 35.6 26.4 18.0 10.3 5.2 4.5 3.3 Kerala 14.9 16.9 21.4 16.0 18.5 12.3 4.5 Source: NFHS-2, Table 2.8 Notes: Illiterate means persons cannot read and write. Primary school complete means 5-7 completed years of education. Middle school complete means 8-9 completed years of education. High School complete means 10-11 completed years of education. Higher secondary complete and above means 12 or more completed years of education.

92
Table 4.19: Gross Enrolment Ratio for Major States- 1998-99 Primary (I-V) Upper Primary (VI-VIII) Boys Girls Total Boys Girls Total Andhra Pradesh 99.20 94.50 96.89 50.86 40.93 46.03 Assam 118.78 100.16 109.63 69.41 52.42 61.12 Bihar 93.20 61.51 78.02 42.43 23.13 33.55 Gujarat 122.92 100.70 112.22 72.06 58.00 65.39 Haryana 82.25 84.05 83.09 67.17 61.09 64.37 Karnataka 111.35 104.38 107.90 70.94 61.06 66.08 Kerala 88.69 87.00 87.86 97.15 93.24 95.22 Madhya Pradesh 119.58 96.46 108.35 75.03 48.09 62.25 Maharashtra 114.38 111.01 112.74 89.28 83.29 86.40 Orissa 109.53 79.82 94.91 64.79 37.43 51.31 Punjab 81.33 84.16 82.66 67.29 65.02 66.22 Rajasthan 125.52 75.68 101.82 78.57 33.60 57.56 Tamil Nadu 109.47 107.10 108.31 97.67 87.94 92.91 Uttar Pradesh 75.97 49.31 63.35 48.88 26.41 38.57 West Bengal 100.06 87.01 93.66 56.99 43.60 50.50 All India 100.86 82.85 92.14 65.27 498.08 57.58
Sources: Economic Survey, 2001-2002, Table 10.7, Page 197.
Table 4.20. District-wise literacy in Assam (Per cent) Literacy Rate
1991 2001 Persons Males Females Persons Males Females
Assam 52.89 61.87 43.03 64.28 71.93 56.03
Kokrajhar 40.47 49.46 30.83 52.55 61.9 42.65
Dhubri 38.36 47.38 28.79 49.86 56.61 42.64
Goalpara 46.81 55.47 37.58 58.56 65.36 51.4
Bongaigaon 49.06 58.67 38.72 60.27 68.81 51.16 Barpeta 43.24 52.61 33.2 57.35 65.95 48.16 Kamrup 65.04 73.67 55.01 74.69 81.24 67.31
Nalbari 55.99 66.95 44.19 68.08 77.12 58.4 Darrang 42 50.8 32.53 55.92 64.32 46.95
Marigaon 47.99 56.17 39.19 59.46 66.13 52.36
Nagaon 54.74 62.49 46.3 62.28 68.52 55.57 Sonitpur 48.14 56.7 38.6 60.29 67.64 52.43
Lakhimpur 58.96 68.28 48.85 69.59 78.26 60.47 Dhemaji 53.84 65.43 41.12 65.96 75.15 56.11
Tinsukia 50.28 59.27 39.99 63.28 72.16 53.4
Dibrugarh 58.32 66.72 48.89 71.21 79.58 62.1 Sibsagar 64.46 71.91 56.14 75.33 82.08 68
Jorhat 65.51 73.29 56.88 77.91 82.76 72.54
Golaghat 58.54 66.5 49.75 70.36 78.01 62.07 Karbi Anglong 45.57 55.55 34.35 58.83 68.11 48.65
North Cachar Hills 57.76 66.39 47.34 68.59 76.59 59.4
Cachar 59.19 68.79 48.76 68.42 76.51 59.85 Karimganj 54.71 64.05 44.76 67.21 73.87 60.09
Hailakandi 53.07 64.08 41.04 59.84 68.47 50.65
Coefficient of variation
0.14889 0.12457 0.18790 0.11493 0.09819 0.14035

93
35. Surveys indicate that the majority of school dropouts belong to the poorest and the least developed areas. They are usually from SC/ST communities, backward rural areas and urban slums. The factors responsible for dropouts range from economic to cultural reasons. Children are pulled out of school due to economic reasons- they have to earn livelihood for their family. Lack of access to a school in the vicinity of their home is another reason why children dropout. Gender discrimination against girl child is a major cultural issue. Since girls are made to do domestic chores they are left with very little time for learning. The absence of women teachers in the village schools and the lack of separate toilet facilities for girls are other factors, which keep girls away from school. Also high teacher absenteeism and poor quality teaching does not motivate children to remain in schools. It is very important to tackle the problem of dropouts in order to achieve universal elementary education. The classroom experience needs to be made enjoyable to the children by using modern and interesting teaching materials. Community participation in the management of schools needs to be encouraged in order to reduce teacher absenteeism and improve the overall quality of education.
36. With the objective of supplementing access to schools and of providing exclusive and easy social access to Muslim children especially girls, alternative schools sponsored by the District Primary Education Programme (DPEP) have been opened at the Maktabs to which these children are religiously bound to attend. Since each Muslim habitation has its own Maktab, it is easy to open the Alternative School at the Maktabs, depending on the number of out-of-school Muslim children. According to the programme proposals, the Maktabs with 25 out-of-school Muslim children including 15 minimum female children and with matriculate Janabs will be converted into Alternative Schools.
37. The Mid-day Meal programmes started by certain States provided some motivation for children, especially those from poorer background to attend school. The National Programme of Nutritional Support to Primary Education was launched in 1995 in order to consolidate earlier efforts to provide the Mid-day Meal in primary schools to supplement nutrition for children in the age group 5-9 years. By doing so it was hoped school enrolment would increase and drop out rate would decline. A nation-wide Mid-day Meal programme was launched from August 15, 1995 to give a boost to universalization of elementary education by improving enrolment, retention and attendance in primary schools and also to improve the nutritional status of children. Under the scheme, foodgrains at the rate of three kg per child are provided per month subject to a minimum attendance of 80 per cent. Central Government supplies free of cost the full requirement of foodgrains for the programme. As an incentive to facilitate the movement of foodgrains to villages, the Central government has even decided to reimburse the actual transportation charges for moving foodgrains from Food Corporation of India godowns to schools/villages under the Scheme. The success of this programme however is limited.

94
4.3.2.1. Reasons for inefficiencies
38. The poor performance as seen from the various indicators is despite the fact that the percentage of SDP devoted to education and per capita public expenditure on education have been consistently higher than the corresponding all India averages (Figures 4.8 and 4.9). The pattern of distribution of expenditure across different sub sectors, primary, secondary, university etc is not very different from other States. A major share of education expenditure goes to elementary education followed by secondary and higher education. Given that the social returns on elementary education are high, a larger share in public expenditure is justified. In spite of a high share in expenditure physical infrastructure facilities are found to be poor. A high percentage of schools lack facilities such as all weather usable rooms, drinking water and separate toilets and common rooms for girls. The percentage of untrained teachers is also quite high, 40 per cent in the case of primary and 70-80 per cent in the case of secondary/higher secondary schools.
39. There are also problems with the implementation of the nation wide Mid-day Meal scheme. According to the Comptroller & Auditor General of India Report, the National Programme of Nutritional Support to Primary Education, failed to realize its primary objective of improving the nutritional status of the students as well as the secondary objectives of promoting the universalisation of primary education. It has also failed in reducing the percentage of school dropouts. Financial constraints both at the Central and state level led to inadequate coverage and the “complex administrative arrangement” led to “considerable leakages between the FCI godowns and the primary school”. Even in the food-surplus States of Punjab and Haryana the scheme is being discontinued due to financial constraints. While there is no cash involved in getting the wheat from the FCI as it is a department-to-department transaction, the District Education Officer has to collect the carriage charges to transport the wheat to various primary schools. The distribution is left to the schoolteachers. The teachers, however, want to be disassociated from the scheme since they are made to transport wheat to their schools at their own cost. This additional responsibility also affected their teaching work.

95
0
50
1 0 0
1 5 0
2 0 0
2 5 0
3 0 0
3 5 0
4 0 0
90-91 91-92 92-93 93-94 94-95 95-96 96-97
A s s a m
Al l States
Figure 4.8: Per capita revenue expenditure on education
0
10
20
30
40
50
60
70
80
90
90-91 91-92 92-93 93-94 94-95 95-96 96-97
Assam All States
Figure 4.9: Per capita revenue expenditure on health

96
40. The Planning Commission’s monitoring and evaluation study assessing the impact of DPEP intervention of Maktab Alternative Schooling on access, infrastructural enrolment and retention situations in Darrang, Dhubri and Morigaon districts revealed the following. “The DPEP strategy of Alternative Schooling through Maktabs, to a certain extent, has been successful in providing additional access, enrolment and retention”. “In terms of enrolment and retention, the sample Maktabs have been able to induct a large number of out-of-school Muslim children especially girls. The retention of these children however has been of relative success because of their higher age and difficult domestic situation.”
4.3.2.2. Areas of action
41. In order to achieve the goal of universalization of elementary education, concerted efforts have to be made with a greater focus on school dropouts, working children, girls who cannot attend formal schools, particularly those belonging to SCs/STs and other disadvantaged groups. Special attention has to be given for removal of caste, sectional, regional and gender disparities.
42. The Mid-day Meal scheme should be targeted at these focus groups. Currently the scheme does not serve its purpose well because it encompasses all children of primary schools, irrespective of their economic backgrounds producing strain on the state budget. In order to avoid the administrative burden falling on the educational system foodgrains could be distributed free of cost to the focus groups through the regular fair price shops of the Public Distribution System.
43. In both the education and health sectors the quality of governance needs to be improved. The decentralization of administration has to be strengthened. It has been observed that funds allocated to the lower level bodies were not being released to them.
44. Given that there is wide gap to be bridged in terms of achievements in education compared to several other states or the all India average and given the financial resource constraint Assam indeed faces a major challenge in fostering the human capital accumulation of the poor.
45. There is no doubt that poverty is a major stumbling block to higher educational attainment. Though school-feeding programs encourage children’s participation in schooling this alone may not suffice. Quality of education needs to be improved to prevent children from dropping out and increase school completion rates. As has been noted in the World Development Report (2001) subsidies can be used to close gender gaps in education. Experience from several countries suggests that subsidizing various expenses for girls has increased their enrolment rate. The access of the poor to education can be improved through geographic targeting. That is location of schools in rural and remote areas where most of the poor live.

97
46. Some States have made reforms in this direction and Assam could follow these examples. For instance, the State governments in MP, Rajasthan and UP are adopting more efficient methods of expenditure control. They are trying to outsource funds, by contracting out work such as replacing government teachers with “shiksha karmis” (para teachers). Preliminary evidence from some tribal villages [Sharma (1999)] suggests that appointment of a local shiksha karmi as teacher tremendously improved the quality of education.5 The karmi was devoted, committed and motivated to educating the children of the community, was regular and punctual, did not face the language problem and worked for a lower salary, unlike a city-based teacher coming to the school. Resources saved from such expenditure control can be spent on modern learning materials, etc to improve quality.
47. The Education Guarantee Scheme (EGS) promoted in 1997 in Madhya Pradesh, for example, has been responsible for providing a primary education facility within one kilometre of every inhabitation. Under this scheme, the Madhya Pradesh government guaranteed the provision of a teacher, his/her salary, learning material and contingencies to start a school within ninety days wherever there was a demand from a community without a primary schooling facility within one kilometre. This is an effort at community-centred and rights-based education to provide primary education to all children in a quick and time-bound manner. EGS operates on a decentralized basis through collaboration of the State government, local body/panchayat and the community. The community raises demand, identifies a local resident to be a teacher and provides a startup space for school. The Panchayat appoints the teacher and oversees the functioning of the school. The State government supports the school through grant for teacher's salary, teacher’s training, etc. The EGS school bypasses the major abuses of the formal government school system. The EGS teacher is accountable to the local community unlike the government teachers who are unionized, powerful and are accountable only to the distant State government. The Shiksha Lehar in Haryana is another programme involving the local community. It is one of the programmes initiated by government agencies, NGOs and UN agencies using a decentralised approach.
48. Given the resource constraint, more innovative measures would be needed in cost recovery and raising of resources for education. There is a lot of scope for cost recovery in higher education. The fee structure should reflect the cost of provision of education. It should at least recover the long run marginal cost. The poorer and deserving sections can be protected through a system of scholarships or subsidized loans. Private financing and provision of higher education needs to be encouraged simultaneously. There is a lot of scope in making technical education self financed. Engineering colleges and polytechnics can generate funds by providing consultancy services to industry and trade. There is also a need for greater
5 Sharma, R., 1999, What manner of teacher? Some lessons from Madhya Pradesh, Economic and Political
Weekly, June 19, 1597-1607.

98
emphasis on vocational education so that the prospects for self-employment and wage employment are increased and students would be willing to pay higher fees.
49. Some of these problems are common to many States in India and are not exclusive to Assam. However, the sorry state of finances of the government of Assam indicates that there is a need to tackle these problems with utmost urgency.
4.4. Summary and concluding remarks
50. We note that poverty in Assam is predominantly a rural phenomenon with close to 90 per cent of the population being rural. Rural poverty is more than twice that of urban poverty. Urban poverty in Assam is much lower than all India urban poverty whereas rural poverty is at a similar level as all India. Whereas urban poverty decreased steadily rural poverty showed fluctuations with very little decrease over the years. The population growth in Assam also implied that there has hardly been any reduction in the absolute number of the poor over the years. The main reasons for poor performance in terms of rural poverty is the continuously declining real wages of non-skilled agricultural labour and increasing unemployment among the youth. Growth of the rural economy is therefore the key to poverty reduction in Assam.
51. Information regarding who and where are the poor is important to target the poor through appropriate programs and make the best out of limited resources. Regional dimensions (NSS regions) of poverty indicate that the western plain region of Assam is the poorest. Incidence of rural poverty is the highest among agricultural labour and least among self-employed in non-agriculture. Urban poverty is the highest among casual labour. Large proportions of the rural poor belong to the agricultural labour and self-employed in agriculture groups. The self-employed in the non-agricultural section form the largest proportion of the urban poor. Incidence of poverty among SC/STs is higher than the general level of incidence. More than 40 per cent of the poor are SC/STs.
52. Assam’s achievements, in health and education are mostly below or at par with all India levels and well below the levels achieved in Kerala. Assam ranks 12th among 16 States in terms of Human and Gender development indices. Public expenditure on health and education as a percentage of SDP is higher than the average for all states and increasing. Per capita expenditure on education is higher than the average for all States and increasing. Per capita health expenditure is lower that the all-State average but increasing. Poverty exists not so much due to expenditure shortfall as due to inefficient expenditure management. A large percentage of expenditure is unproductive, going to wages and salaries. There is a considerable overlap in development activities by different layers of government. Gap between plan outlay and utilization exists possibly due to the inability in mobilizing resources to meet the matching fund requirements for centrally sponsored programs.
53. The broad areas of action can be summarized below.

99
• Provide better education and health facilities to strengthen the capabilities of the poor and vulnerable groups to earn income.
• Focus on asset formation through employment generation programmes in order to achieve sustainable poverty reduction.
• Use geographic targeting to help the poor so that resources are not thinly spread and the quantum of subsidy is large enough to pull them out of poverty permanently.
• Provide better irrigation facilities and water management in order to encourage the self-employed in agriculture to diversify their activities and increase their incomes.
• Develop opportunities for non-farm employment by strengthening rural marketing infrastructure and deregulation of markets (removal of small-scale sector reservations and restrictions under the Essential Commodities Act).
• Encourage local community participation in decision making by strengthening the decentralization process through Panchayati Raj institutions.
• Use modern technology to overcome some of the existing infrastructural bottlenecks (e.g. cellular phones).
• Improve the social status of women through better access to education apart from improving health care services.
• Overcome resource constraints by introducing user charges for certain health services. Enhance household’s ability to pay through risk sharing mechanisms such as insurance and other forms of social financing including employer health-based insurance schemes. Use health cards (similar to ration cards) to protect the poor.
• Achieve universal elementary education by giving special attention to remove various kinds of disparities - caste, gender and regional. Provide special subsidies, for example, to girl children to close gender gaps in education.
• Remove the administrative burden of Mid-day Meal scheme on the educational system by providing free of cost additional foodgrain quota for school going children, through the regular Public Distribution System.
• Use innovative measures such as the Education Guarantee Scheme of the Madhya Pradesh government to reduce costs of schooling and increase accountability of teachers.
• Exploit potential for cost recovery in higher education.
54. In short, steps need to be taken to increase the effectiveness of service delivery; to encourage decentralization for better accountability and governance; to improve quality of public service provision through innovative means; to recover costs of service provision to the

100
maximum extent possible; to reduce establishment costs and administrative overheads; and to transfer expenditure authority to local bodies who are directly responsible and accountable to the local people.
References
Aggarwal, S.C., and J.K. Goyal, (2000), “Trends in Youth Unemployment in India: An Empirical Analysis”, The Indian Journal of Labour Economics, Vol. 43, No. 4
Bigman and Srinivasan, (2002), “Geographical Targeting of Poverty Alleviation Programs: Methodology and Applications in Rural India”, Journal of Policy Modeling, Vol. 24.
Datt, G., and M. Ravallion, (1998), “Why have some Indian states done better than others at reducing rural poverty?” Economica, 65(257).
Dubey, A, (2000), Hunger and poverty in North Eastern states, Implications for food security, paper presented at the National Seminar on Food security in India, CESS Hyderabad, March 25-27.
Dubey and Gangopadhyay, (1998), “Counting the Poor”, Sarvekshana Analytical Report No. 1, Department of Statistics, Ministry of Planning, Statistics and Programmme Implementation, New Delhi.
Economic Survey, (2002), Ministry of Finance, Economic Division, Government of India.
Filmer, Deon, (1999), The Structure of Social Disparities in Education: Gender and Wealth, Gender and Development Working Paper No. 5, World bank.
Filmer, Deon, and Lant Pritchett, (1998), Educational Enrollment and Attainment in India: Household Wealth, Gender, Village, and State Effects, Working paper, World bank, Washington, D.C.
Irudayarajan and Mohanachandran, (2000), “Infant and child Mortality, 1991 Census: By Religion, Occupation and Level of Education”, Economic and Political Weekly, December 16-22.
NFHS-2, (2002), National Family Health Survey 1998-99, International Institute for Population Sciences, Mumbai, India.
Sharma, R., (1999), “What manner of teacher? Some lessons from Madhya Pradesh”, Economic and Political Weekly, June 19.

101
Figure 4.3a: Rural Poverty: Percent Below Poverty line

102
Figure 4.3b: Percentage of villages with any medical facilty

103
Figure 4.3c: Percentage of villages with primary school

104
Figure 4.7a : Percentage of Literates: 1991

105
Figure 4.7b: Percentage of Literates 2001