4. qiba aium2012 tjh
TRANSCRIPT

4/11/2012
1
Quantitative Imaging Biomarkers in
Ultrasound Elasticity Imaging
Timothy J Hall
Medical Physics Department
University of Wisconsin
AIUM 2012
Proposed Biomarkers
• Shear wave speed for quantifying liver fibrosis
• Shear wave imaging for breast tumor
classification
– Elastic modulus
– Tumor volume

4/11/2012
2
Outline
• Techniques and potential biomarkers measured– Underlying physics
• Degree of fit with QIBA biomarker selection criteria:– Transformative
– Translational
– Feasible
– Practical
– Collaborative
• Numbers of exams that might be involved in the US and worldwide by use of the biomarker
• QUALY’s saved, or most important impact estimates that can be made reasonably
• Implementations by the various manufacturers
• Clinical demand
Acknowledgements
• Many thanks to my friends at Duke University
– Kathy Nightingale
– Mark Palmeri
– Gregg Trahey
• Most of the content presented here was
developed by them

4/11/2012
3
“Elasticity” as a Quantitative Biomarker
• Analogous to the stiffness of a spring
– How hard do you have to push on it to change its length
• Relate force on the spring to its stretch or compression
• In 3D we relate force (stress) to displacement (strain)
– “strain imaging” (relative displacement)
– Other more sophisticated methods for elasticity imaging
• Shear wave speed
• Elastic modulus imaging
• Nonlinear elasticity imaging
What is “Elasticity Imaging”?
• Two-step process
– Apply a force
– Watch what happens
• Using ultrasound (or MRI, or OCT, or…)
• Categorize imaging approaches by the type of
force used to induce displacement

4/11/2012
4
Methods for Elasticity Imaging
Vibration Sono-
Elastography
Endogenous
Motion Imaging
Quasi-Static
Elastography
Harmonic Motion
Imaging
Vibro-
Acoustography
ARFI
SDUV
Shear wave
Elasticity Imaging
Radiation
Force
Excitation
Mechanical
Excitation
US Elasticity
Imaging
“Elasticity” Depends on Rate
Consider a simple thought experiment
• Slowly lower your finger into a pool of water– Your finger enters slowly without significant disruption of
the surface
– You feel almost nothing except wet
• Slap the surface of the water with your hand– The water splashes
– It ‘hurts’ a little
• Fall from the sky into the ocean (say 10,000ft up)– The water splashes
– Contacting the water is not much different than falling on a cement roadway

4/11/2012
5
“Elasticity” Depends on Rate
• Absolute “Stiffness” estimated with one system
might not equal that obtained with another
system
– The elastic modulus depends on the rate at which
force is applied
• Quasi-static elastography is about 1Hz
• Radiation force elastography is about 50Hz—1kHz
– Use caution when comparing systems
• Expect the modulus estimated with radiation force
methods to be higher than that estimated with freehand
palpation
Acoustic Radiation Force
Force generated by a transfer of momentum from an acoustic wave to the medium through which it is propagating, caused by absorption (predominantly) and scattering in soft tissue. Force magnitude typically ~3 g/cm3
α = absorption coefficientIta = temporal average intensityc = speed of sound
c
IF
taα2
=
Nyborg, W. Acoustic Streaming, in Physical Acoustics Vol. IIB, editor: Mason W.P., Academic Press,1965.

4/11/2012
6
Wave Propagation in Soft Tissues
Ult
raso
un
d (
com
pre
ssio
n)
Wa
ve
(15
40
m/s
)
x
z
http://www.kettering.edu/%7Edrussell/Demos/waves/wavemotion.html
Transverse (Shear ) Wave (1-5 m/s)
Acoustic Radiation Force
µ=1 kPa, movie duration = 10 ms
Palmeri et , IEEE UFFC, 52(10): 1699-1712, 2005.
c
IF
taα2
=
transducer

4/11/2012
7
Estimate shear wave speed with linear regression
soft
stiff
C=inverse slope
µ=ρc2
Relating material parameters
• Linear, isotropic, elastic solid (anistotropy?)
• Incompressible (ν = 0.5), [-1:0.5]
• May be a function of viscosity (dispersive)
• May be a function of strain (nonlinear)
• Poroelastic?
• Young’s modulus: E
• Shear modulus: µ
• Shear wave speed: cT

4/11/2012
8
Liver Biopsy
• Diagnostic gold-standard– Invasive
• Infection
• Hemorrhage
• Pain
– Limited sampling
– Costly (time and money)
– Not suitable for longitudinal monitoring of disease progression / resolution
• Can a non-invasive liver stiffness estimate be used as a surrogate measure of liver health?
http://www.medandlife.ro/assets/images/Vol%20II%20N
O%204/generalarticles/fierbinteanu/image005.jpg
Liver Fibrosis Staging
• Stage 0: Normal
• Stage 1: Zone 3 perisinusoidal / periportal
• Stage 2: Perisinusoidal / periportal fibrosis
• Stage 3: Bridging fibrosis
• Stage 4: Cirrhosis
http://homepage.smc.edu/wissmann_paul/anatomy2textbook/liverCirrhosis.jpg
http://www.sciencephoto.com/image/252776/large/M1300676-Cirrhosis_of_the_liver-SPL.jpg

4/11/2012
9
Shear Modulus vs. Fibrosis Stage
• 4.24 kPa F0-2:F3-4
threshold
• 90% sensitivity
• 90% specificity
• 0.90 AUC
FibroScan (EchoSens)
• Does not use acoustic
radiation force
• Uses fixed-frequency
mechanical punch at the
skin surface
• Ultrasonic tracking of the
resultant shear wave from
the skin surface
• Not FDA cleared for use
in the USA

4/11/2012
10
FibroScan metrics
Clinical Studies (ARFI Imaging & FibroScan)

4/11/2012
11
Supersonic Shear Imaging: Liver Fibrosis
Bavu et al. “Noninvasive In Vivo Liver Fibrosis Evaluation Using Supersonic Shear Imaging: A Clinical Study on 113 Hepatitis C Virus Patients,” UMB, 37(9), 2011.
Magnetic Resonance Elastography
Normal
Cirrhotic
Mariappan, Glaser and Ehman, “Magnetic Resonance Elastography: a review,” Clinical Anatomy, 23, 2010.

4/11/2012
12
Breast Cancer
• 1-in-8 women will develop breast cancer
• > 207,000 new cases of invasive cancer diagnosed in 2010 in the US
• Second leading cause of cancer death in US women
• 70-80% occur in women with no family history
• Risk factors:
– Aging woman
– BRCA1 / BRCA2
Breast Lesion Elastograms
Fibroadenoma Cancer
Larger region of decreased strain; desmoplasia?

4/11/2012
13
Supersonic Shear Imaging: Breast Imaging
Dr Balu Maestro, Nice France
• 77 years old
• Previous IDC 6 years
ago.
• Recurrence of IDC.
Surgery for a 15mm
IDC with grade III.
• Sentinel lymph node
method.
• This lymph node is
considered as
suspect.
• N0, no malignant
lymph node.
• Emean < 30kPa
Supersonic Shear Imaging: Breast Imaging
Dr Svensson, London UK
Simple cyst.
No ShearWave propagation in liquids.
4/11/2012
14
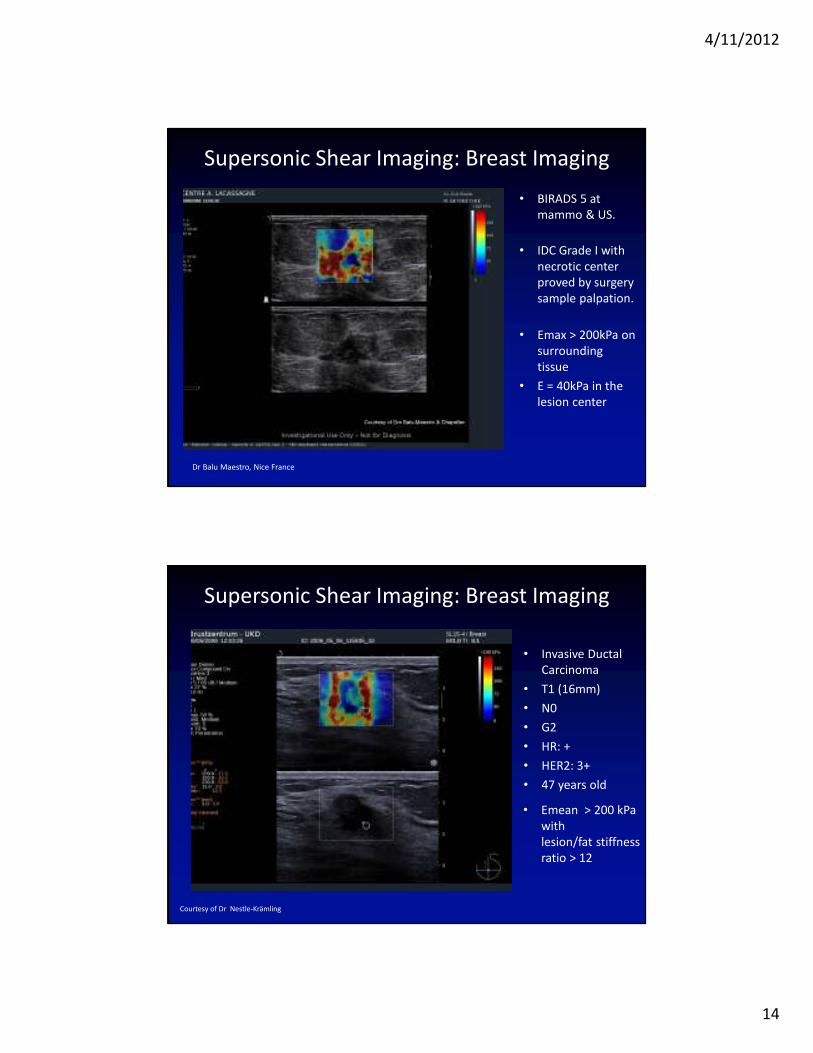
Supersonic Shear Imaging: Breast Imaging
Dr Balu Maestro, Nice France
• BIRADS 5 at
mammo & US.
• IDC Grade I with
necrotic center
proved by surgery
sample palpation.
• Emax > 200kPa on
surrounding
tissue
• E = 40kPa in the
lesion center
Supersonic Shear Imaging: Breast Imaging
• Invasive Ductal
Carcinoma
• T1 (16mm)
• N0
• G2
• HR: +
• HER2: 3+
• 47 years old
• Emean > 200 kPa
with
lesion/fat stiffness
ratio > 12
Courtesy of Dr Nestle-Krämling

4/11/2012
15
Magnetic Resonance Elastography
Mariappan, Glaser and Ehman, “Magnetic Resonance Elastography: a review,” Clinical Anatomy, 23, 2010.
Ex vivo ARFI prostate images
McNeal Zonal Anatomy * ARFI Image
*McNeal JE, The zonal anatomy of the prostate, Prostate, (1981) 2, 35- 49
Ele
vatio
n(m
m)

4/11/2012
16
Limitations & future directions
• Many assumptions surrounding tissue homogeneity– when is isotropy actually appropriate?
• Elastic nonlinearity, viscosity and anisotropy considerations are important
• Disease etiology may play a significant role in tissue stiffness
• Need for large-scale clinical studies and research validation in the quantitative methods
• Reassess the acoustic output limitations for acoustic radiation force imaging modalities
Conclusions
• Potential biomarkers identified– Shear wave speed for staging liver fibrosis
– Breast tumor classification
• Underlying physics reasonably well understood
• Degree of fit with QIBA biomarker selection criteria:– Transformative: Likely to change clinical workflow
– Translational: Laboratory studies and preliminary clinical trials completed
– Feasible: In clinical use outside of USA
– Practical: Easy to perform
– Collaborative: world-wide interest
• Implementations by the various manufacturers– At least two ultrasound system manufacturers