4 stormwater controlsunix.eng.ua.edu/~rpitt/slammdetpond/winslamm/ch4/4 stormwater... · but...
TRANSCRIPT

4-1
Copyright R. Pitt © 2003 August 12, 2003
4. Stormwater Quality Controls in WinSLAMM
Introduction ...................................................................................................................................................................................... 2
Treatment of Flows at Sources of Urban Runoff Pollution and at Outfalls ........................................................................ 4 Public Works Practices.................................................................................................................................................................... 6
Street Cleaning ............................................................................................................................................................................. 6 Summary of Street Cleaning as a Stormwater Control Practice ........................................................................................ 9 Street Cleaning Effectiveness Calculations used in WinSLAMM.................................................................................. 9
Storm Drainage System Inlet Structures................................................................................................................................. 13 Catchbasins and Gully Pots................................................................................................................................................. 13 Storm Drain Inlets with Filters ............................................................................................................................................. 15 Design Suggestions to Enhance Pollution Control with Storm Drain Inlet Structures .............................................. 16 Summary of Sewerage Inlet Devices as Stormwater Control Practices ......................................................................... 18 Catchbasin Cleaning Performance Calculations used in WinSLAMM ........................................................................ 19
Sedimentation ................................................................................................................................................................................. 20 Wet Detention Pond Performance Reported in the Literature ............................................................................................ 21 Problems with Wet Detention Ponds...................................................................................................................................... 23
Safety of Wet Detention Ponds.......................................................................................................................................... 23 Nuisance Conditions in Wet Detention Ponds and Degraded Water Quality ............................................................ 25 Attitudes of Nearby Residents and Property Values ...................................................................................................... 25
Maintenance Requirements of Wet Detention Ponds ......................................................................................................... 26 Routine Maintenance Requirements .................................................................................................................................. 26 Sediment Removal from Wet Detention Ponds ................................................................................................................ 27 Vegetation Removal from Wet Detention Ponds ............................................................................................................. 28
Guidelines to Enhance Pond Performance ............................................................................................................................. 29 Insect Control, Fish Stocking and Planting Desirable Aquatic Plants.......................................................................... 29 Pond Side Slopes................................................................................................................................................................... 30 Enhancing Pond Performance During Severe Winter Conditions................................................................................. 30
Particle Settling Characteristics in Stormwater...................................................................................................................... 31 Wet Detention Pond Design Procedures ............................................................................................................................... 34 Wet Detention Pond Design Guidelines for Suspended Solids Reductions.................................................................... 38 Summary of Detention Ponds as a Stormwater Control....................................................................................................... 39 WinSLAMM Calculation Procedures for Wet Detention Ponds....................................................................................... 39
Infiltration........................................................................................................................................................................................ 40 Benefits and Problems Associated with Stormwater Infiltration........................................................................................ 40 General Infiltration Practices .................................................................................................................................................... 46
Infiltration Device Performance Reported in the Literature ............................................................................................ 46 Summary of Infiltration Devices as Stormwater Controls .................................................................................................... 46 WinSLAMM Calculation Procedures for Infiltration Devices............................................................................................ 46
Grass Swales and Grass Filter Strips ........................................................................................................................................... 47 Performance of Grass Swales and Filters as Reported in the Literature ............................................................................ 47 Summary of Grass Swales for Stormwater Control................................................................................................................ 49 Grass Swale Performance Calculations in WinSLAMM...................................................................................................... 49
Porous Pavements.......................................................................................................................................................................... 50

4-2
Performance of Porous Pavements as Reported in the Literature ...................................................................................... 50 Maintenance of Porous Pavements ........................................................................................................................................ 52 Summary of Porous Pavement Control Benefits ................................................................................................................... 52 WinSLAMM Calculation Procedures for Porous Pavements............................................................................................. 52
Filtration of Stormwater................................................................................................................................................................. 53 Treatment of Stormwater Using Filtration Media.................................................................................................................. 53
Sand......................................................................................................................................................................................... 53 Activated Carbon.................................................................................................................................................................. 54 Composted Leaves................................................................................................................................................................ 55 Peat Moss............................................................................................................................................................................... 55
Recent Filtration Tests .............................................................................................................................................................. 56 Design of Stormwater Filters .................................................................................................................................................... 59 Summary of Filtration as a Stormwater Control..................................................................................................................... 64 WinSLAMM Calculation Procedures for Media Filters ...................................................................................................... 65
Combination Devices (Example use of the Multi-Chambered Treatment Train, MCTT)..................................................... 65 WinSLAMM Calculation Procedures for Combination Devices (specifically the MCTT) ............................................ 68
References and Bibliography ....................................................................................................................................................... 68 Introduction Many alternative urban runoff control practices are available at the sources where the sediment is generated (eroded) and at inputs to sewerage systems. These include infiltration devices (such as subsurface infiltration trenches, surface percolation areas, and porous pavements), grass drainage swales, grass filters, detention basins, street cleaning, and catchbasin cleaning. Other practices include those specialized for construction sites, such as site mulching and the use of filter fencing. Another important practice is the elimination of inappropriate discharges to sewerage through cross-connections. Outfall controls most commonly include wet detention ponds.
The first concern when investigating alternative treatment methods is determining the needed level of stormwater control. This determination has a great affect on the cost of the stormwater management program and needs to be carefully made. Problems that need to be reduced range from sewerage maintenance issues to protecting many receiving water uses. As an example, Laplace, et al. (1992) recommends that all particles greater than about 1 to 2 mm in diameter be removed from stormwater in order to prevent deposition in sewerage. The specific value is dependent on the energy gradient of the flowing water in the drainage system and the hydraulic radius of the sewerage. This treatment objective can be easily achieved using a number of cost-effective source area and inlet treatment practices. In contrast, much greater levels of stormwater control are likely needed to prevent excessive receiving water degradation. Specific treatment goals usually specify about 80% reductions in suspended solids concentrations. In most stormwaters, this would require the removal of most particulates greater than about 10 µm in diameter, about 1% of the 1 mm size to prevent sewerage deposition problems. Obviously, the selection of a treatment goal must be done with great care. The Engineering Foundation/ASCE, Mt. Crested Butte conference held in 1993 included many presentations describing receiving water impacts associated with stormwater discharges (Herricks 1995). Similarly, Pitt (1996) summarized numerous issues concerning potential groundwater impacts associated with sub-surface stormwater disposal. These references illustrate the magnitudes and variations of typical problems that can be caused by untreated stormwater. Specific control programs will therefore need to be unique for a specific area due to these variations.
There are many stormwater control practices, but all are not suitable in every situation. It is important to understand which controls are suitable for the site conditions and can also achieve the required goals. This will assist in the realistic evaluation for each practice of: the technical feasibility, implementation costs, and long-term maintenance requirements and costs. It is also important to appreciate that the reliability and performance of many of these controls have not been well established, with most still in the development stage. This is not to say that emerging controls cannot be effective, however, they do not have a large amount of historical data on which to base designs or

4-3
to be confident that performance criteria will be met under the local conditions. The most promising and best understood stormwater control practices are wet detention ponds. Less reliable in terms of predicting performance, but showing promise, are stormwater filters, wetlands, and percolation basins (Roesner, et al. 1989). Grass swales also have shown great promise during the EPA’s Nationwide Urban Runoff Program (NURP) (EPA 1983) and other research projects.
A study of 11 types of stormwater quality and quantity control practices currently being used in Prince George's County, Maryland (Metropolitan Washington Council of Governments 1992) was conducted to examine their performance and longevity. This report concluded that several types of the stormwater control practices had either failed or were not performing as well as intended. Generally, wet ponds, artificial marshes, sand filters, and infiltration trenches achieved moderate to high levels of removal for both particulate and soluble pollutants. Only wet ponds and artificial marshes demonstrated an ability to function for a relatively long time without frequent maintenance. Control practices which were found to perform poorly were infiltration basins, porous pavements, grass filters, swales, smaller “pocket” wetlands, extended detention dry ponds, and oil/grit separators. Infiltration stormwater controls had high failure rates which could often be attributed to poor initial site selection and/or lack of proper maintenance. The poor performance of some of the controls was likely a function of poor design, improper installation, inadequate maintenance, and/or unsuitable placement of the control. Greater attention to these details would probably reduce the failure rate of these practices. The wet ponds and artificial marshes were much more robust and functioned adequately under a wider range of marginal conditions. Other important design considerations include: safety for maintenance access and operations, hazards to the general public (e.g., drowning) or nuisance (e.g., mosquito breeding), acceptance by the public (e.g., enhance area aesthetics and property values).
The majority of the stormwater treatment processes are most effective for the removal of particulates only, especially the settleable solids fraction. Removal of dissolved, or colloidal, pollutants is minimal and therefore pollution prevention or control at the sources offers a more effective way to control the dissolved pollutants. Fortunately, most toxic stormwater pollutants (heavy metals and organic compounds) are mostly association with stormwater particulates (Pitt, et. al. 1994). Therefore, the removal of the solids will also remove much of the pollutants of interest. Notable exceptions of potential concern include: nitrates, chlorides, zinc, pathogens, 1,3-dichlorobenzene, fluoranthene, and pyrene.
A successful stormwater management program requires several components (after Field, et al. 1994):
• Regulations, Local Ordinances, and Public Education. This should be the primary component because it is likely to be the most cost effective. Mainly non-structural practices (such as simple site layout options, selection of drainage system components, etc.) and requirements for controls at new developments are particularly effective. Even though not quantified, public education to encourage careful selection of landscaping chemicals, proper disposal of household toxic substances, etc., are all important stormwater control activities.
• Pollution Prevention. Pollution prevention is an important component of any stormwater management program. Both non-structural and structural practices can be used to prevent pollutants from coming into contact with stormwater. These practices include:
− selection of alternative building materials (decreasing the use of galvanized metals, for example);
− flow diversion practices to keep uncontaminated stormwater from contacting contaminated surfaces, or to keep contaminated stormwater from contacting uncontaminated stormwater. This is accomplished by a variety of exposure minimization structural means, such as covering storage areas, using berms and curbs, etc.;
− management practices can include plans to recover released or spilled pollutants; and preventative practices including a variety of monitoring techniques intended to prevent releases;

4-4
− public works practices (such as catchbasin and sewerage cleaning, leaf removal, etc.) are also important pollution prevention controls;
− investigation and control of inappropriate discharges into storm drainage systems;
− controlling construction site sediment erosion by vegetative and structural means; and
− infiltration practices through site development options (direct roof and paved area runoff to lawns, use swale drainages, etc.) which infiltrate source area runoff into the groundwater, thereby reducing surface runoff during storms, recharging local groundwaters, and maintaining low flow conditions in streams.
• Critical Source Area and Outfall Treatment. These are mainly structural practices to provide upstream pollutant removal at the source, controlled stormwater releases to the conveyance system, outfall controls, and infiltration or reuse of the stormwater. Upstream pollutant removal at critical source areas provides treatment of stormwater at highly polluting locations (such as vehicle service facilities, storage areas, junk yards, etc.) before it enters the stormwater conveyance system. Downstream, en4-of-pipe, controls may also be needed in industrial areas or at outfalls from large drainages. Large-scale infiltration, through the use of percolation ponds for example, may also be used at outfall locations, especially after pre-treatment using wet detention ponds.
Several reviews of stormwater management practices from throughout the world have recently been published. Stahre (1993) described practices in Scandinavia, Driscoll and Strecker (1993) described U.S. and Canadian practices, and Pratt (1993) described UK stormwater management activities.
The following discussion summarizes the possible levels of performance that may be achieved by various stormwater control practices. Stormwater control practices may be grouped into several general categories, including: regulations and public education, public works practices, sedimentation, infiltration, filtration and combination practices, and construction site erosion controls.
Treatment of Flows at Sources of Urban Runoff Pollution and at Outfalls Most stormwater needs to be t reated to prevent harm either to the surface waters or the groundwaters. One approach is to treat the runoff from critical source areas before it mixes with the runoff from less polluted areas. The general features of critical source areas appear to be large paved areas, heavy vehicular traffic, and outdoor use or storage of problem pollutants. The control of runoff from relatively small critical areas may be the most cost-effective approach for treatment/reduction of stormwater toxicants. However, in order for a treatment device to be useable, it must be inexpensive, both to purchase and maintain, and effective. Outfall stormwater controls, being located at the outfalls of storm drainage systems, treat all the flows that originate from the watershed. The level of treatment provided, of course, is greatly dependent on many decisions concerning the design of the treatment devices. Source area controls are, of course, physically smaller than outfall controls but may be difficult to locate on a crowded site, and there could be a great number of them located in a watershed. In all cases, questions must be answered about the appropriate level of control needed, where the control should be provided, and what controls should be used. These questions can best be answered by using a comprehensive stormwater quality management model. During this research effort, we are examining the use of the Source Loading and Management Model (WinSLAMM), in conjunction with the Storm Water Management Model (SWMM), to address these issues. WinSLAMM is unique in that it can evaluate a large number of source and outfall stormwater quality controls for a large number of rains. Table 4-1 shows the stormwater control measures that are currently available in WinSLAMM. The results of recent research funded by the EPA are currently being used to expand WinSLAMM. This matrix of controls illustrates how some source area controls can be used at both source areas and at outfalls. Infiltration, filtration, and sedimentation controls can be used at both source areas and at outfalls, even though the sizes and specific designs of the specific practices must be varied to fit the site and to handle the specific flows. Therefore, the following literature review of stormwater quality management options includes practices that are usually considered as source area controls (such

4-5
as street cleaning) and those that are usually considered as outfall controls (such as wet detention ponds). This review is organized into the following general categories, and topics, of control practices:
• public works practices (street cleaning, drainage inlets, oil and grease separators, and inappropriate discharges), • sedimentation and wetlands (wet detention ponds, chemical addition, dry detention ponds, and wetlands), • infiltration (infiltration trenches, rain gardens, grass swales, grass filter strips, porous pavement, and groundwater protection), and • filtration and combination practices (sand, activated carbon, peat moss, composted leaves, and filter fabrics).
Table 4-1. Source Area, Drainage System, and Outfall Control Options Currently Available in WinSLAMM1
Infiltration
trenches Biofiltrat-ion/rain gardens
Cisterns/ rain barrels
Wet detention pond
Grass drainage swale
Street cleaning
Catch-basins
Porous pavement
Roof X X X X Paved parking/storage
X X X X X
Unpaved parking/storage
X X X
Playgrounds X X X X X Driveways X X X Sidewalks/walks X X X Streets/alleys X X Undeveloped areas
X X X
Small landscaped areas
X X
Other pervious areas
X X X
Other impervious areas
X X X X X
Freeway lanes/shoulders
X X X
Large turf areas X X X Large landscaped areas
X X X
Drainage system X X X Outfall X X X
1 Development characteristics affecting runoff, such as roof and pavement draining to grass instead of being directly connected to the drainage system, are included in the individual source area descriptions.

4-6
Public Works Practices Numerous public works practices affect stormwater quality and quantity. The most significant being the design, construction, and maintenance of the stormwater drainage system. Obviously, managing stormwater quantity to provide drainage and to prevent flooding must remain the primary objective of stormwater drainage systems. Over the years, addressing this objective, while ignoring other receiving water beneficial uses, has resulted in many problems. It is now possible, as demonstrated by numerous examples from around the world, to provide stormwater drainage that addresses these numerous, and seeming conflicting objectives.
Other public works practices affecting stormwater quality may include: landscaping maintenance on public rights-of-ways, roadway and utility construction erosion controls, erosion controls at sanitary landfills, runoff control at public works garages, street cleaning, and storm drainage inlet cleaning. This section specifically addresses street and catchbasin cleaning, two commonly recommended stormwater control practices because of their apparent ease of use in existing built-up areas. Many of the on-site “ultra-urban” controls described later )filtration and combination practices) are suitable for public works facilities, such as maintenance yards.
Street Cleaning Street cleaning was extensively studied as an urban runoff water quality control practice because of the large quantities of pollutants found on streets during early research in the U.S. (Sartor and Boyd 1972). Because streets were assumed to contribute most of the urban runoff flows and pollutants, street cleaning was assumed to be a potentially effective practice. Unfortunately, not all research has shown street cleaning to be effective because of the different sized particles that street cleaners remove compared to the particles that are mostly removed by rains. Furthermore, in many areas, rains are relatively frequent and keep the streets cleaner than typical cleaner threshold values. However, in the arid west of the U.S., rains are very infrequent, allowing streets to become quite dirty during the late summer and fall. Extensive street cleaning during this time has been shown to result in important suspended solids and heavy metal reductions in runoff (Pitt 1979, Pitt and Shawley 1982). Street cleaning should not be confused with flushing operations that really do not remove particles from the street, but simply transfer them to the sewer systems and possibly to the receiving waters. Street flushing in areas served by combined sewers, however, should be considered an alternative in areas having suitable water supplies.
Street cleaning plays an important role in most public works departments as an aesthetic and safety control measure. Street cleaning is also important to reduce massive dirt and debris buildups present in the spring in the northern regions. Leaf cleanup by street cleaning is also necessary in most areas in the fall.
Particles of different sizes “behave” quite differently on streets. Typical street dirt total solids loadings show a “saw-tooth” pattern with time between street cleaning or rain washoff events. The patterns for the separate particle sizes are considerably different than the pattern for total residue. Typical mechanical street cleaners remove much (about 70 percent) of the coarse particles in the path of the street cleaner, but they remove very little of the finer particles (Sartor and Boyd 1972; Pitt 1979). Rains, however, remove very little of the large particles, but can remove large amounts (about 50 percent) of the fine particles (Bannerman, et al. 1983; Pitt 1985; Pitt 1987). The intermediate particle sizes show reduced removals by both street cleaners and rain.
Factors significantly affecting street cleaning performance include particle loadings, street texture, moisture, parked car conditions, and equipment operating conditions (Pitt, et al. 1976; Pitt 1979). If the 500-1000 µm particle loadings are less than about 75 kg/curb-km for smooth asphalt streets, conventional street cleaning does little good. As the loadings increase, so do the removals: with loadings of about 10 kg/curb-km, less than 25 percent removals can be expected, while removals of up to about 50 percent can be expected if the initial loadings are as high as 40 kg/curb-km for this particle size. The removal performance decreases substantially for smaller particles, including those that are most readily washed off the street during rains and contribute to stormwater pollution.
Increased performance was obtained with a modified regenerative-air street cleaner, especially at low loadings during tests in Bellevue, WA (Pitt 1985). The improved performance was much greater for fine particle sizes, where the mechanical street cleaner did not remove any significant quantities of material. The larger particles were removed with

4-7
about the same effectiveness for both street cleaner types. Other tests of vacuum street cleaners (Pitt 1979) and regenerative-air street cleaners (Pitt and Shawley 1982) showed very few differences in performance when compared to more standard mechanical street cleaners. These earlier tests were conducted in areas having much higher street loadings, especially for the larger particle sizes, than in Bellevue. It is expected that the high loadings of the large particles armored the small particles, so they could not be removed. For high loadings, it may be best to use a tandem operation, where the streets are first cleaned with a mechanical street cleaner to remove the large particles, followed by a regenerative-air street cleaner to remove the finer particles.
Much information concerning street cleaning productivity has been collected previously in many areas. The early tests (Clark and Cobbin 1963; and Sartor and Boyd 1972) were conducted in controlled strips using heavy loadings of simulates instead of natural street dirt at typical loadings. Later tests, from the mid 1970s to mid 1980s, were conducted in large study areas (20 to 200 ha) by measuring actual street dirt loadings on many street segments immediately before and after typical street cleaning. These large-scale tests are of most interest, as they monitored both street surface phenomena and runoff characteristics. The following list briefly describes these large-scale street cleaning performance tests:
• San Jose, California, tests during 1976 and 1977 (Pitt 1979) considered different street textures and conditions; multiple passes, vacuum-assisted, and two types of mechanical street cleaners; a wide range of cleaning frequencies; and effects of parking densities and parking controls.
• Castro Valley, California, tests during 1979 and 1980 (Pitt and Shawley 1982) considered street slopes, mechanical and regenerative-air street cleaners, and several cleaning frequencies.
• Reno/Sparks, Nevada, tests during 1981 (Pitt and Sutherland 1982) considered different lan4-uses, street textures, equipment speeds, multiple passes, full-width cleaning, and vacuum and mechanical street cleaners in an arid and dusty area.
• Bellevue, Washington, tests from 1980 through 1982 (Pitt 1985) considered mechanical, regenerative-air, and modified regenerative-air street cleaners, different lan4-uses, different cleaning frequencies, and different street textures in a humid and clean area.
• Champaign-Urbana, Illinois, tests from 1980 and 1981 (Terstriep, et al. 1982) examined spring clean-up, different cleaning frequencies and lan4-uses, and used a three-wheel mechanical street cleaner.
• Milwaukee, Wisconsin, tests from 1979 to 1983 (Bannerman, et al. 1983) examined various street cleaning frequencies at five study sites, including residential and commercial lan4-uses and large parking lots.
• Winston-Salem, North Carolina, tests during their NURP project examined different lan4-uses and cleaning frequencies.
Sutherland (1996, and with Jelen 1996) has conducted recent tests using a new style street cleaner that shows promise in removing large fractions of most of the street dirt particulates, even the small particles that are most heavily contaminated. The Enviro Whirl I, from Enviro Whirl Technologies, Inc. is capable of much improved removal of fine particles from the streets compared to any other street cleaner ever tested. This machine was also able to remove large fractions of the fine particles even in the presence of heavy loadings of large particles. This is a built-in tandem machine, incorporating rotating sweeper brooms within a powerful vacuum head. Model analyses for Portland, OR, indicate that monthly cleaning in a residential area may reduce the suspended solids discharges by about 50%, comp ared to only about 15% when using the older mechanical street cleaners that were tested during the early 1980s.
The pollutant removal benefits of street cleaning is directly dependent on the contributions of pollutants from the streets. In the Pacific Northwest region of the U.S., the large number of mild rains results in much of the runoff

4-8
pollutants originating from the streets. In the Southeast, in contrast, where the rains are much larger, with greater rain intensities, the streets contribute a much smaller fraction of the annual pollutant loads for the same residential land uses. However, in heavily paved areas, such as large parking lots or paved storage areas, street cleaning of these surfaces, especially with an effective machine like the Enviro Whirl, should result in significant runoff improvements.
These many tests have examined a comprehensive selection of alternative street cleaning programs. Not all alternatives have been examined under all conditions, but sufficient information has been collectively obtained to examine many alternative street cleaning control options. Few instances of significant and important reductions in runoff pollutant discharges have been reported during these large-scale tests.
The primary and historical role of street cleaning is for litter control. Litter is also an important water pollutant in receiving waters. Litter affects the aesthetic attributes and recreation uses of waters, plus it may have direct negative biological and water quality effects. Litter has not received much attention as a water pollutant, possibly because it is not routinely monitored during stormwater research efforts. The City of New York recently conducted a special study to investigate the role of enhanced street cleaning (using intensive manual street sweeping) to reduce floatable litter entering the City’s waterways (Newman, et al. 1996). During the summer of 1993, the City hired temporary workers to manually sweep near-curb street areas and sidewalks in a pilot watershed area having 240 km of curb face. Two levels of manual sweeping supplemented the twice per week mechanical street cleaning the area normally receives. Continuous litter monitoring was also conducted to quantify the differences in floatable litter loadings found on the streets and sidewalks. An additional four manual sweepings each week to the two mechanical cleanings reduced the litter loadings by about 64% (on a weight basis) and by about 51% (on a surface area basis). Litter loading analyses were also conducted in areas where almost continuous manual sweeping (8 to 12 daily sweeps, 7 days per week) was conducted by special business organizations. In these special areas, the litter loadings were between 73 and 82% cleaner than comparable areas only receiving the twice weekly mechanical cleaning. They concluded that manual sweeping could be an important tool in reducing floatable pollution, especially in heavily congested areas such as Manhattan. New York City is also investigating catch basin modifications and outfall netting for the control of floatable litter.
Conventional street cleaning does not have a very positive effect on stormwater quality because conventional street cleaners preferentially remove the large particles, and the smaller particles from the street that are mo st effectively removed during rains. Valiron (1992) confirmed the many earlier U.S. studies by showing that street cleaners only remove about 15% of the finest particles (less than 40 µm), while close to 80% of the largest particles (>2,000 µm) are removed.
Ellis (1986) concluded that street cleaning is most efficient if conventional street sweeping (using broom operated equipment) is conducted in a tandem operation with vacuuming, and if it is done three times per week. He did find that conventional tandem sweeping-vacuum machines are very sensitive to the clogging of their filters and to street moisture levels which causes particles to adhere to the street surface, preventing their efficient removal. The Enviro Whirl, mentioned above, is a new tandem machine that overcomes many of these problems. General street cleaning efficiency depends on the speed of the machines, the number of passes, the street loading and street texture, and interference from parked vehicles (Pitt 1979).
Flushing operations, using low pressure water, is more efficient than broom sweeping for the removal of fine particles. In combined sewer systems, the flushed pollutants are treated at the downstream municipal wastewater plant. However, deposition of the particulates in separate sewer systems is a potential problem, as the pollutants typically remain in the sewerage until the next storm event.
In most cases, streets are not cleaned often enough to maintain low street dirt loadings. A frequency of about 6 to 7 cleanings per week is needed to remove about 50 to 55% of the particles (Bertran4-Krajewski 1991, Valiron 1992, Vignoles and Herremans 1992). This very high cleaning frequency is typically only conducted in commercial districts of large cities.

4-9
Butler, et al. (1993) examined the benefits and costs of street and gully pot use for the prevention of sediments from entering combined sewerage. They compared these costs with those associated with removal of the sediment from the sewerage and removal at the sewage treatment facility. In one example, they found that the minimum total cost would be achieved with a street cleaning interval of about once every six to eight weeks, but the total costs of sediment removal would not be significantly increased if there was no street cleaning. The street cleaning costs would increase directly and linearly with increased cleaning effort, while the costs of particulate removal by the other methods would be reduced with increased street cleaning. However, the total costs would increase with increased street cleaning because the cost savings from the other treatment options were more than off-set by the increased street cleaning costs. For this combined sewerage system example, they concluded that it was more cost-effective to remove the sediment at the treatment facility. They do point out that the main requirements for street cleaning in the UK are determined by the Environmental Protection Act and stress litter removal. Sediment removal by street cleaning was never a stated objective.
Summary of Street Cleaning as a Stormwater Control Practice Normal street cleaning operations for aesthetics and traffic safety purposes are not very satisfactory from a stormwater quality perspective. These objectives are different and the removal efficiency for fine and highly polluted particles is very low. Unless the street cleaning operations can remove the fine particles, they will always be limited in their pollutant removal effectiveness. Some efficient machines are now available to clean porous pavements and infiltration structures, and new tandem machines that incorporate both brooms and vacuums have recently been shown to be very efficient, even for the smaller particles. Conventional street cleaning operations preferentially remove the largest particles, while rain preferentially remove the smallest particles. In addition, street cleaners are very inefficient when the street dirt loadings are low, when the street texture is course, and when parked cars interfere. However, it should also be noted that streets are not the major source of stormwater pollutants for all rains in all areas. Streets are the major source of pollutants for the smallest rains, but other areas contribute significant pollutants for moderate and large rains. Therefore, the ability of street cleaning to improve runoff quality is dependent on many issues, including the local rain patterns and other sources of runoff pollutants. More research is needed to investigate newer pavement cleaning technologies in areas such as industrial storage areas and commercial parking areas which are critical pollutant sources.
Street Cleaning Effectiveness Calculations used in WinSLAMM WinSLAMM keeps track of this street dirt accumulation, rain washoff, and street cleaner removal pattern for each street in the study area, as indicated in the attached calculation flowsheet. The accumulation and washoff equations were described in the previous section. Factors significantly affecting street cleaning performance include particle loadings, street texture, moisture, parked car conditions, and equipment operating conditions (Pitt, et al. 1976; Pitt 1979). Figure 4-1 is an example of a performance plot from a series of street cleaner tests conducted in Bellevue, Washington (Pitt 1984). It shows the dramatic effect loadings have on street cleaner performance. If the total solids loadings on the street before cleaning are less than about 300 lbs/curb-mile for smooth asphalt streets, conventional mechanical street cleaning does little good, as reflected on the data for the Mobil mechanical broom sweeper. As the loadings increase, so do the removals. With loadings approaching 700 lbs/curb-mile, removals of up to about 40 percent can be expected. The number of data observations for these higher loadings were rare for these Bellevue tests, and most of the observations were for very low loadings (75 to 400 lbs/curb-mile of total solids). Figure 4-1 also shows the improved performance obtained with a regenerative-air street cleaner, especially at low loadings, as shown for the Tymco cleaner. The improved performance was much greater at the low initial street dirt loadings, where the mechanical street cleaner did not remove any significant quantities of material. Forty percent removals occurred at about 150 lbs/curb-mile, in the lower range of observed conditions, and increased to about 60% removals at about 700 lbs/curb-mile. Other tests of vacuum street cleaners (Pitt 1979) and regenerative-air street cleaners (Pitt and Shawley 1981) showed very few differences in performance when compared to standard mechanical street cleaners. These earlier tests were conducted in areas having much higher street loadings, especially for the larger particle sizes, than in Bellevue. It is expected that the high loadings of the large particles armored the small particles, so they could not be effectively

4-10
removed. For high loadings, it may be best to first clean with a mechanical street cleaner to remove the large particles, followed by a regenerative-air street cleaner to remove the finer particles. Recent improvements in street cleaners have incorporated both technologies in the same unit, with much improved cleaning capabilities, as noted above. WinSLAMM uses a series of linear first order equations describing the slope of the performance line, and the intersection of this performance line with the diagonal indicating no removal (the threshold value). No street cleaning benefit occurs if the initial street loading is less than this threshold value. Much information concerning street cleaning productivity has been collected previously in many areas. The early tests (Clark and Cobbin 1963; and Sartor and Boyd 1972) were conducted in controlled strips using simulants instead of street dirt. The later tests were conducted in large study areas (50 to 500 acres) by measuring actual street dirt loadings on many street segments immediately before and after typical street cleaning. These large-scale tests are of most interest and were used to develop the street cleaning performance curves used in WinSLAMM.

4-11
For each street area, initialize subroutine for first rainfall event only- • Determine Julian Street Cleaning Dates • Determine Maximum Load -
o If c = 0 then MaxLoad = a + b * 30 o If c < 0 then MaxLoad = a - b^2/c
• Adjust initial load for Winter Season Exclusion, if selected by user • Determine Maximum Accumulation Time
Determine Type of Event – Street Dirt Removal (Type 1) or Washoff (Type 2)
Washoff (Event Type 2)
Accumulation Duration (AccumDur) = Current Time – Time of Previous Event (either Street Dirt Removal or Washoff) Calculation Accumulation: BeforeEventLoad = B*AccumDur + C*AccumDur^2 + Prior Load
Determine Street Delivery: Calculate Street Delivery Reduction Factor, StreetDeliveryFraction, from .STD parameter file:
For each Street Area, for each Rainfall Event
For the street areas of each Land Use, determine the LUCurbRatio, the ratio of each street length divided by the sum of the street lengths for the Land Use
Calculate Washoff: Determine Availability Factor (f(street texture)) N0 = BeforeEventLoad * Availablilty Factor Determine k Determine Residual Street Load after Storm (N*) N* = N0 * exp(-k * rain depth) Load Unavailable After Rain = BeforeEventLoad – N0
AfterEventLoad = Load Unavailable After Rain + N* Initial Washoff = BeforeEventLoad – AfterEventLoad [lbs/curb-mi]
For both Street Loading Iterations
Street Dirt Removal by Street Cleaning (Event Type 1)
If BeforeEventLoad < B / (1 – M) Then
AfterEventLoad = BeforeEventLoad
Else
AfterEventLoad = M * BeforeEventLoad + B

4-12
For each Rainfall Event, determine the LUStreetDirtStored, which is the sum of the street dirt stored in the delivery system, for each event, for all street source areas in each Land Use: Find the WashoffParticulateFraction. It is the sum, for the fractions of DrainageTypes 3 to 5 (the three curb & gutter drainage types), of the portion of loading from each source area that remains in the washoff before the runoff reaches the outfall (PRDFrac) from the .PRR file
5 WashoffParticulateFraction = Σ(1 – PRDFrac) *
3 DrainageTypeFraction
Where PRDFrac is the fraction, from the .PRR (Particulate Residue
Reduction) file, of particulate loading from each source area that settles into
the delivery system before the runoff reaches the outfall.
Street Loading Iteration Number
Iteration 2 – to apply the street dirt stored in the delivery system from Iteration 1 to each street source area
Iteration 1 – to determine the street dirt stored in the delivery system
BeforeEventLoad for next event = AfterEventLoad of current event
BeforeEventLoad for next event = (AfterEventLoad + LUStreetDirtStored/Street Length * LUCurbRatio) of current event
Last Event
Finish Street Particulate Calculations
YES
NO

4-13
Storm Drainage System Inlet Structures Storm drainage system inlet structures can be separated into three general categories. The first category is a simple inlet that is comprised of a grating at the curb and a box, with the discharge located at the bottom of the box which connects directly to the main storm drainage or combined sewerage. This inlet simply directs the runoff to the drainage system and contains no attributes that would improve water quality. However, large debris (several cm in size) may accumulate (if present in the stormwater, which is unlikely) in them. The second type of inlet is similar to the simple inlet, but it contains a sump that typically extends up to 0.5 to 1 m below the bottom of the outlet. This is termed a catchbasin in the U.S., or a gully pot in the U.K. (usually smaller than a catchbasin), and has been shown to trap appreciable portions of the course sediment (somewhat less than a mm in size and larger). The third category is also similar to the simple inlet, but contains some type of screening to trap debris. These include small cast iron perforated buckets placed under the street grating as used in Germany, large perforated stainless steel plates placed under the inlet grating as used in Austin, Texas, and a number of proprietary devices incorporating filter fabric or other types of screening placed to intercept the stormwater flow. This last category may trap large debris and litter, depending on the overflow provisions, but have not been shown to produce important water quality improvements.
Catchbasins and Gully Pots Catchbasin performance has been investigated for some time in the U.S. Sartor and Boyd (1972) conducted controlled field tests of a catchbasin in San Francisco, using simulated sediment in fire hydrant flow. They sampled water flowing into and out of a catchbasin for sediment and basic pollutant analyses, for varying conditions and times since flow began. Lager, et al. (1977) was the first EPA funded research effort that included a theoretical laboratory investigation to evaluate sedimentation in catchbasins and to develop effective designs. They also conducted extensive laboratory tests using simulated runoff.
The mobility of catchbasin sediments was investigated by Pitt (1979) during a research project sponsored by the U.S. EPA's Storm and Combined Sewer Section. Long-duration tests were conducted using an “idealized” catchbasin (based on Lager, et al.’s 1977 design), retro-fitted in San Jose, CA. The research focused on re-suspension of sediment from a full catchbasin over an extended time period. This project used particulate fluorescent tracers mixed with catchbasin sediment. It was concluded that the amount of catchbasin and sewerage sediment was very large in comparison with storm runoff yields, but was not very mobile. Cleaning catchbasins would enable catchbasins to continue to trap sediment instead of reaching a steady-state loading and allowing flows to remain untreated.
The removal of overlying water above sediment in catchbasins readily occurs and has been noted by Sartor and Boyd (1972) as their largest water quality problem. However, Pitt (1985) statistically compared catchbasin supernatant with outfall water quality and could not detect any significant differences. EDP (1980) examined “first flushes” from catchbasins and found the quality of the water leaving the catchbasins to be much less than the high concentrations of pollutants in the gutter flows during early parts of rains. However, Butler, et al. (1995) have recently investigated gully pot supernatant water and have found that it may contribute to the more greatly polluted first flush of stormwater reported for some locations. Specific problems have been associated with the anaerobic conditions that rapidly form in the supernatant water during dry weather, causing the release of oxygen demanding material, ammonium, and possible sulfides. These anaerobic conditions also affect the bio-availability of the heavy metals in the flushed water.
Aronson, et al. (1983) reported a field evaluation of three catchbasins in West Roxbury, MA, for four events. An inlet strainer was also tested for three events at each site. They monitored suspended solids and conventional pollutants.

4-14
Figure 4-1. Measured performance of street cleaners in Bellevue, WA, for different total solids loadings on the street before cleaning (Pitt 1984).

4-15
Catchbasins, simple inlets, man-holes, and sewerage sediment accumulations were monitored at more than 200 locations in Bellevue, Washington at two mixed residential and commercial study areas (Pitt 1985). These locations were studied over three years to monitor accumulation of sediment and sediment quality. The sediment in the catchbasins and the sewerage was found to be the largest particles that were washed from the streets. A few unusual locations were dominated by erosion sediment from steep hillsides adjacent to the storm sewer inlets. The sewerage and catchbasin sediments had a much smaller median particle size than the street dirt and were therefore more potentially polluting than the particulates that can be removed by street cleaning, but the particulates were much larger than those generally found in stormwater. Basically, catchbasins remove the largest particulates that are washed from the watershed during rains, preventing them from being deposited in downstream sewerage and in the receiving water. If the catchbasins are full, they also cannot remove any additional particulates from the runoff. Catchbasin sump particulates can be conveniently removed to restore the trapping of these particulates, and some of the runoff pollutants. Cleaning catchbasins twice a year was found to allow the catchbasins to capture particulates for most rains. This cleaning schedule was found to reduce the annual discharges of total solids and lead by between 10 and 25 percent, and COD, total Kjeldahl nitrogen, total phosphorus, and zinc by between 5 and 10 percent (Pitt and Shawley 1982).
The median particle size of the sump particles is shown to be between about 300 and 3000 µm, with less than 10% of the particles smaller than 100 µm, the typical upper limit of particles found in stormwater (Butler, et al. 1995). Catchbasin sumps trap the largest particles that are flowing in the water, and allow the finer particles to flow through the inlet structure. Relatively few pollutants are associated with these coarser solids found in the sumps, compared to the finer particles.
Butler, et al. (1995) and Butler and Karunaratne (1995) present equations for sediment accumulation in gully pots, based on detailed laboratory tests. The sediment trapping performance was found to be dependent on the flow rate passing through the gully pot, and to the particle sizes of the sediment. The depth of sediment in the gully pot had a lesser effect on the capture performance. In all cases, decreased flows substantially increased the trapping efficiency and larger particles had substantially greater trapping efficiency than smaller particles, as expected.
Butler, et al. (1993) examined the buil4-up rate of sediment in roadside gully pots. They found that for mo st gullies, the buil4-up rate is fairly constant, at about 18 mm per month, while the average rates ranged from 14 to 24 mm per month. The average drainage area for each of the gully pots examined was 228 m2. They also evaluated the costs of sediment removal by gully pots, comparing them to street cleaning costs, sewerage cleaning costs, and costs to remove the sediment at the treatment facility. They concluded that it was more cost-effective to remove the sediment at the treatment facility. However, they also concluded that the transport of all sediments to the treatment facility is not practicable for most systems, and the role of gully pots in limiting sediment entry to the sewerage system was deemed vital.
Storm Drain Inlets with Filters Little information is available in the literature concerning the performance of filter fabrics in removing stormwater pollutants. They have been used for years in controlling construction site runoff, but in filter fence arrangements, where they act as small impoundments and not as true filters. Research at the University of Alabama at Birmingham (Clark, et al. 1995) is analyzing many filter fabrics, including fabrics being used in the inlet devices. The biggest disadvantage of using filter fabrics in catchbasins is their likelihood of quickly clogging. During controlled laboratory tests, they were found to provide important reductions (about 50%) in suspended solids and COD. However, the filter fabrics can only withstand very thin accumulations of sediment before they clog. The maximum sediment thickness on the fabrics before absolute clogging was between 1 and 2 mm, and the sediment loading was about 3.8 kg sediment per m2 of fabric. The median particle size was 43 µm, 90% of the particles were smaller than 96 µm, and the largest particle observed was 130 µm in the runoff sample used in these clogging tests. If the stormwater had a typical suspended solids concentration of 100 mg/L, then about 40 meters of stormwater could be loaded on the filter fabric before absolute failure due to clogging. If the suspended solids concentration was a high 500 mg/L, then only about 7.5 meters of stormwater could be loaded. These are small loading rates and would

4-16
require extremely large filter surfaces or very frequent fabric exchanges. As an example, if a 1 ha paved area drained to an inlet having a 1 m2 filter fabric, and the runoff had a suspended solids concentration of 100 mg/L, a rainfall of only about 5 mm would cause absolute clogging. This would basically require exchanging the filter after almost every rain, plus having the filter clog even before the end of many common rains. If the water was pre-treated (such as in the multi-chambered treatment train (MCTT) which uses the Gunderboom fabric, as described later under combination devices), then much more rain can be tolerated before clogging. In the Minocqua, WI, MCTT, for example, a Gunderboom filter fabric 24 m2 in area is used for a paved drainage area about 1 ha in size (Pitt 1996). Because of the pre-treatment provided in the MCTT before the filter fabric (suspended solids are about 5 mg/L, and less than about 10 µm in size) and the large area of fabric, this filter should tolerate at least 2.5 meters of rain over the drainage area before clogging and needing replacement (at least 3 to 4 years of operation). Three storm drain inlets were evaluated in Stafford Township, New Jersey as part of an EPA sponsored research project (Clark, et al. 1995; Pitt, et al. 1997). A conventional catchbasin, with a sump, and two representative designs that used filter material were tested. The inlet devices were located in a residential area. The filter fabrics were also evaluated in the laboratory using stormwater runoff from a large parking area on the campus of UAB. The monitoring program began in January 1994 and included 12 inlet and effluent samples from each device over several different storms, ending in late summer of 1994. Complete organic and metallic toxicant analyses, in addition to conventional pollutants, were included in the analytical program. An optimally designed catchbasin with a sump was constructed by installing a sump in the bottom of an existing storm drain inlet by digging out the bottom and placing a section of 36 inch concrete pipe on end. The outlet pipe was reduced to 8 inches and the sump depth was 36 inches. Inlet water was sampled before entering the catchbasin, while outlet water was sampled after passing through the unit. Twelve storms were evaluated for each of the three inlet units by making composite influent and effluent samples using a dipper grab sampler over the storm duration. The samples were analyzed for a broad range of conventional pollutants, metals, and organic toxicants, both in total and filtered forms. The catchbasin with the sump was the only device that showed important and significant removals for several pollutants: total solids (0 to 50%, average 22%). suspended solids (0 to 55%, average 32%). turbidity (0 to 65%, average 38%). color (0 to 50%, average 24%). Design Suggestions to Enhance Pollution Control with Storm Drain Inlet Structures The goal is a storm drainage inlet device that: • prevents entry of unwanted material and is safe for small children and pets, • does not cause flooding when it clogs with debris, • does not force stormwater through the captured material, • does not have adverse hydraulic head loss properties, • maximizes pollutant reductions, and • requires inexpensive and infrequent maintenance. The following suggestions and design guidelines should meet these criteria (Pitt, et al. 1997). These options are all suitable for retro-fitting into existing simple storm drainage inlets. However, the materials used should be concrete, plastic, aluminum or stainless steel; especially do not use galvanized metal or treated woods. Catchbasins in newly developing areas could be more optimally designed than the suggestions below, especially by enlarging the sumps and by providing large and separate offset litter traps. 1) The basic catchbasin (having an appropriately sized sump) and an inverted outlet should be used in most areas. This is the most robust configuration. In almost all full-scale field investigations, this design has been shown to withstand extreme flows with little scouring losses, no significant differences between supernatant water quality and runoff quality, and minimal insect problems. It will trap the be4-load from the stormwater (especially important in areas

4-17
using sand for traction control) and will trap a low to moderate amount of suspended solids (about 30 to 45% of the annual loadings). The largest fraction of the sediment in the flowing stormwater will be trapped, in preference to the finer material that has greater amounts of associated pollutants. Their hydraulic capacities are designed using conventional procedures (grating and outlet dimensions), while the sump is designed based on the desired cleaning frequency. Figure 4-2 is this basic recommended configuration (from Lager, et al. 1977). The size of the catchbasin sump is controlled by three factors: the runoff flow rate, the suspended solids concentration in the runoff, and the desired frequency at which the catchbasin will be cleaned without sacrificing efficiency. Table 4-2 shows the calculated volume of sediment captured in a catchbasin sump for a one acre paved drainage area and for runoff having 50 to 500 mg/L suspended solids concentrations. The 1976 Birmingham, AL, rain year was used to obtain typical rain depths and flow rates for each rain. The Rv (volumetric runoff coefficient) was obtained from the small storm hydrology tests conducted by Pitt (1987). An estimate of the required catchbasin sump volume and cleanout frequency can be calculated using this table and site conditions. For example, assume the following conditions:
• paved drainage area: 1.3 ha (3.3 acres), • 250 mg/L suspended solids concentration, and • 640 mm (25 in) of rain per year.
Figure 4-2 conventional catchbasin with inverted sump (after Lager, et al. 1977).

4-18
Table 4-2. Approximate Suspended Solids Accumulations in Catchbasin Sump for Different Accumulative Rain Depths and Suspended Solids Concentrations, for Birmingham, AL, Rain Pattern (m3/ha and ft3/acre of pavement) Total Rainfall (mm)
Total Rainfall (inches)
50 mg/L SS conc. 100 mg/L SS conc. 250 mg/L SS conc. 500 mg/L SS conc.
130 5 0.0092 0.13 0.019 0.27 0.047 0.67 0.092 1.3 250 10 0.019 0.27 0.038 0.54 0.092 1.3 0.19 2.7 380 15 0.028 0.40 0.057 0.81 0.14 2.0 0.28 4.0 640 25 0.047 0.67 0.092 1.3 0.24 3.4 0.47 6.7 1,300 50 0.092 1.3 0.19 2.7 0.47 6.7 0.92 13 2,500 100 0.19 2.7 0.38 5.4 0.92 13 1.9 27 5,100 200 0.38 5.4 0.78 11 1.9 27 3.8 54
The sediment accumulation rate in the catchbasin sump would be about 0.24 m3/ha (3.4 ft3/acre) of pavement per year. For a 1.3 ha (3.3 acre) paved drainage area, the annual accumulation would therefore be about 0.3 m3 (10 ft3). The catchbasin sump diameter should be at least four times the diameter of the outlet pipe. Therefore, if the outlet from the catchbasin is a 250 mm (10 in) diameter pipe, the sump should be at least 1 m (40 in) in diameter (having a surface area of 0.8 m3, or 9 ft2). The annual accumulation of sediment in the sump for this situation would therefore be about 0.4 m (1.3 ft). If the sump was to be cleaned about every two years, the total accumulation between cleanings would therefore be about 0.8 m (2.6 ft). An extra 0.3 m (1 ft) of sump depth should be provided as a safety factor because of potential scour during unusual rains. Therefore, a total sump depth of about 1.1 m (3.6 ft) should be used. In no case should the total sump depth be less than about 1 m (3 ft) and the sump diameter less than about 0.75 m (2.5 ft). This would provide an effective sump volume of about 0.8 m3 (9 ft3) assuming a safety factor of about 1.6. 2) A relatively safe ad4-on to the basic recommended configuration is an adversely sloped inclined screen covering the outlet side of the catchbasin, as shown in Figure 4-3. The inclined screen would be a relatively coarse screening (such as the SoilSave , which is a 6 mm thick plastic foam and has 1 mm apertures) that should trap practically all trash of concern. The bottom edge of the inclined screen would be solidly attached to the inside wall of the catchbasin below the inverted outlet. The screen would tilt outwards so it covers the inverted outlet. The sides of the screen need to be sealed against the sides of the catchbasin. The top edge of the screen would extend slightly above the normal water surface. A solid top plate would extend out from the catchbasin wall on the outlet side covering the top opening of the inclined screen. This plate would overhang the top of the screen, but provide a slot opening above the screen for a large overflow in case the screen was clogged. The slot opening should be several inches high and extend the width of the catchbasin. This design will also capture grit and the largest suspended solids, plus much of the trash. This design would allow the trapped material to fall into the sump instead of being forced against the screen by out-flowing water. Summary of Sewerage Inlet Devices as Stormwater Control Practices The best catchbasin configuration for a specific location would be dependent on site conditions and would probably incorporate a combination of features from several different inlet designs. The primary design should incorporate a catchbasin with a sump, as described by Lager, et al. (1977), and an inverted (hooded) outlet. If large enough, catchbasins with sumps have been shown to provide a moderate level of suspended solids reductions in stormwater under a wide range of conditions in many studies in the U.S. and Europe. The use of filter fabrics in catchbasins is not likely to be beneficial because of their rapid clogging from retained sediment and trash. The use of coarser screens in catchbasin inlets is also not likely to result in water quality improvements, based on conventional water pollutant analyses. However, well designed and maintained screens can result in substantial trash and litter reductions. It is important that the screen not trap organic material in the flow path of the stormwater. Tests during recent research found that stormwater flowing through decomposing leaves degraded the stormwater quality (Pitt, et al. 1997). Prior research (Pitt 1979 and 1985) has shown that if most of the trapped material is contained in the catchbasin sump, it is out of the direct flow path and unlikely to be scoured during high flows, or to degrade

4-19
Figure 4-3. Catchbasin with sump and inclined screen (Pitt, et al. 1997). overlying supernatant water. Storm drainage inlet devices also should not be considered as leaf control options, or used in areas having very heavy trash loadings, unless they can be cleaned after practically every storm. Catchbasin Cleaning Performance Calculations used in WinSLAMM WinSLAMM calculates catchbasin cleaning water quality benefits by keeping track of the accumulation of sediment in the catchbasins from rains and the amount of material removed during catchbasin cleaning operations. Research (Lager, et al. 1977a, Pitt 1979, and Pitt 1984) has found that the amount of material accumulated in catchbasins is related to the inflow rate. The following nonlinear equation describes this accumulation of sediment in catchbasins (with a calculated R2value of 0.97): Percent removal from inflow = 44.04 (0.51x) (1.061x2), for values of x less than 5 ft3/sec, and Percent removal from inflow = 6.5 percent for values of x greater than 5 ft3/sec. where x is the inlet flow rate (in ft3/sec). These equations have been found to be applicable for catchbasin sumps ranging from 2 to 100 ft3 in volume. After the catchbasins are 60 percent full, the sediment accumulation is zero. Therefore, cleaning operations need to be scheduled to maintain the catchbasin accumulation of sediment below 60 percent of capacity. When the

4-20
catchbasin is fuller than this amount, no sediment removal occurs. The following list summarizes some sediment removal values for different flow rates: Flow rate Percent removal (ft3/sec) . 0.01 44 % 0.25 37 0.50 32 1.25 21 3.2 9.5 4.7 6.9 >5.0 6.5 . Several studies (Sartor and Boyd 1972, Lager, et al. 1977a, Pitt 1979, and Pitt 1984) have found very small sediment loading changes due to flushing during rains. Pitt (1984) even monitored about 200 catchbasins during a period of time that included a rain of greater than 4 inches, with no appreciable change in sediment loadings in the catchbasins. It was possible that flushed material was immediately replaced during the same rain, but the net change was zero. The removal of overlying water above sediment in catchbasins readily occurs and has been noted by Sartor and Boyd (1972) as their largest water quality problem. However, Pitt (1984) statistically compared catchbasin supernatant with outfall water quality and could not detect any significant differences. EDP (1980) examined “first flushes” from catchbasins and found the quality of the water leaving the catchbasins to be much less than the high concentrations of pollutants in the gutter flows during early parts of rains. It is possible that bacteria and soluble heavy metal concentrations could be increased by the residence times between rains due to "favorable" chemical and temperature conditions in catchbasins. Because street cleaning and catchbasins tend to remove the same particle size group, WinSLAMM ignores catchbasin sediment accumulation for streets that also have street cleaning. The catchbasins do affect the sediment originating from other source areas though. Sedimentation Detention ponds are probably the most common management practice for the control of stormwater sediment. If properly designed, constructed, and maintained, they can be very effective in controlling a wide range of pollutants and peak runoff flow rates. In an early 1980 survey of cities in the U.S. and Canada, the American Public Works Association found more than 2,000 wet ponds, more than 6,000 dry ponds, more than 3,000 parking lot multi-use detention areas, and more than 500 rooftop storage facilities (Smith 1982). About half of the wet detention ponds were publicly owned. In some areas of the U.S., detention ponds have been required for some time and are therefore much more numerous than elsewhere. In Montgomery County, Maryland, as an example, detention ponds were first required in 1971, with more than 100 facilities planned during that first year, and about 50 actually constructed. By 1978, more than 500 detention facilities had been constructed in Montgomery County alone (Williams 1982). In DuPage County, Illinois, near Chicago, more than 900 stormwater detention facilities (some natural) receive urban runoff (McComas and Sefton 1985).
There is probably more information concerning the design and performance of detention ponds in the literature than for any other stormwater control device. Wet detention ponds are also a very robust method for reducing stormwater pollutants. They typically show significant pollutant reductions as long as a few design-related attributes are met (most important being size). Many details are available to enhance performance, and safety, that should be followed. Many processes are responsible for the pollutant removals observed in wet detention ponds. Physical sedimentation is the most significant removal mechanism. However, biological and chemical processes can also contribute important pollutant reductions. The extensive use of aquatic plants, in a controlled manner, can provide additional pollutant

4-21
removals. Magmedov, et al. (1996), for example, report on the use of wetlands for treatment of stormwater runoff in the UK and in the Ukraine, including design guidelines. Wet detention ponds also are suitable for enhancement with chemical and advanced physical processes. Lamella separators, air floatation, filtration, and UV disinfection are examples of treatment enhancements being investigated in France (Bernard, et al. 1996; Delporte 1996).
Wet Detention Pond Performance Reported in the Literature The use of detention ponds for both water quality and quantity benefits is relatively new. Wet pond stormwater quality benefits have been commonly reported in the literature since the 1970s, while the water quality benefits of dry detention ponds have only recently been adequately described (Hall 1990).
The Nationwide Urban Runoff Program included full-scale monitoring of nine wet detention ponds (EPA 1983). The Lansing project included two up-sized pipes, plus a larger detention pond. The NURP project located in Glen Ellyn (west of Chicago) monitored a small lake, the largest pond monitored during the NURP program. Ann Arbor, Michigan, monitoring included three detention ponds, Long Island, New York, studied one pond, while the Washington D.C. project included one pond. About 150 storms were completely monitored at these ponds, and the performances ranged from negative removals for the smallest up-sized pipe installation, to more than 90 percent removal of suspended solids at the largest wet ponds. The best wet detention ponds also reported BOD5 and COD removals of about 70 percent, nutrient removals of about 60 to 70 percent, and heavy metal removals of about 60 to 95 percent.
The Lansing NURP project monitored a wet detention pond (Luzkow, et al. 1981). The monitored pond was located on a golf course (receiving urban runoff from an adjacent residential and commercial area). Suspended solids removals were about 70 percent for moderate rains (10 to 25 mm rains) while phosphorus removals were usually greater than 50 percent. Total Kjeldahl nitrogen removals ranged from about 30 to 50 percent.
Two wet detention ponds near Toronto, Ontario, were monitored from 1977 through 1979 (Brydges and Robinson 1980). Lake Aquitaine is 1.9 ha in size and receives runoff from a 43 ha urban watershed. Observed pollutant reductions were about 70 to 90 percent for suspended solids, 25 to 60 percent for nitrogen, and about 80 percent for phosphorus. The much smaller Lake Wabukayne (0.8 ha) received runoff from a much larger urban area (186 ha). The smaller Lake Wabukayne experienced much smaller pollutant reductions: about 30 percent for suspended solids, less than 25 percent for nitrogen, and 10 to 30 percent for phosphorus.
Oliver, et al. (1981), monitored a small lake detention facility in Rolla, Missouri. Suspended solids yield reductions averaged about 88 percent, with 54 and 60 percent yield reductions for COD and total phosphorus. Organic nitrogen yields were reduced by about 22 percent.
Gietz (1983) studied a 1.3 ha wet detention pond serving a 60 ha urban watershed near Ottawa, Ontario. Batch operation of the pond resulted in substantial pollutant control improvements for particulate residue, bacteria, phosphorus, and nitrate nitrogen. Continuous operation gave slightly better performance for BOD5 and organic nitrogen. Suspended solids reductions were about 80 to 95 percent, BOD5 reductions were about 35 to 45 percent, bacteria was reduced by about 50 to 95 percent, phosphorus by about 70 to 85 percent, and organic nitrogen by about 45 to 50 percent.
Yousef (1986) reported long-term nutrient removal information for a detention pond in Florida having very long residence times and substantial algal and rooted aquatic plant growths. He found 80 to 90 percent removals of soluble nutrients due to plant uptake. Particulate nutrient removals, however, were quite poor (about ten percent).
Hvitve4-Jacobsen, et al. (1987) along with Martin and Miller (1987) described pollutant removal benefits of wet detention ponds. Niemczynowicz (1990) described stormwater detention pond practices in Sweden. Van Buren, et al. (1996) also recently reported on the performance of a on-stream pond located in Kingston, Ontario. They describe their monitoring activities and measures taken to enhance performance.

4-22
Hvitve4-Jacobsen, et al. (1994) examined the most effective treatment systems for treating urban and highway runoff in Denmark. They concluded that wet detention ponds were the most efficient and suitable solution for the removal of most pollutants of concern from both highway and urban runoff. Denmark does not have any effluent standards and the acceptable pollutant discharges are therefore determined based on specific receiving water requirements. They concluded that CSO problems were causing acute receiving water effects (hydraulic problems, oxygen depletion, high bacterial pollution, etc.), requiring treatment designs based on design storm concepts. However, both urban and highway runoff were mostly causing accumulative (chronic) effects (associated with suspended solids, toxicants, and nutrient discharges) and treatment designs therefore need to be based on long-term pollutant mass discharge reductions. It was evident that relatively low concentrations of pollutants must be reduced, and that large volumes of water must be treated in a short time period. For these reasons, and for the specific pollutants of concern, they concluded that wet detention ponds were the most effective option, even though the first wet detention pond was only constructed in Denmark in 1989. Their recommended design was based on: detention pond volume (about 250 m3 per effective hectare of drainage area), water depth, pond shape, use of plants (covering at least 30% of the water surface), and the use of a grit removal forebay. This pond design was evaluated using the computer program MOUSE/SAMBA for long-term simulations using Aalborg, Denmark, rains. The resulting mass removals using this design were excellent for suspended solids (80 to 90%) phosphorus (60 to 70%) and heavy metals (40 to 90%).
Mayer, et al. (1996) examined sediment and water quality conditions in four wet detention ponds in Toronto. They found that poor water circulation in the summer months between rains decreased the pond water quality, especially for dissolved oxygen and nutrients. Anaerobic conditions near the pond water-sediment interface in two of the ponds caused elevated ammonia concentrations. They felt that decomposition of nitrogenous organic matter (from terrestrial and aquatic plant debris) was the likely source of the ammonia. They also found prolific algal growths in the same two ponds in the summer, with chlorophyll a concentrations of about 30 µg/L. The chlorophyll a concentrations in the other two ponds were much lower, between about 3 and 10 µg/L.
Maxted and Shaver (1996) examined the biological and habitat characteristics downstream from several headwater wet detention ponds in Delaware to measure beneficial effects. They found that the ponds did not improve the habitat conditions or several benthic indices, compared to similar sites without ponds, when the watershed impervious cover exceeded about 20%. They stress that more research is needed examining other stream indicators, especially in less developed watersheds and in other parts of the country. They concluded that riparian zone protection, which is commonly overlooked in extensively developed watersheds, needs much more attention. The use of stormwater management practices apparently only is able to overcome part of the detrimental effects of development.
Stanley (1996) examined the pollution removal performance at a dry detention pond in Greenville, NC, during eight storms. The pond was 0.7 ha in size and the watershed was 81 ha of mostly medium density single family residential homes, with some multifamily units, and a short commercial strip. The observed reductions were low to moderate for suspended solids (42 to 83%), phosphate (-5 to 36%), nitrate nitrogen (-52 to 21%), ammonia nitrogen (-66 to 43%), copper (11 to 54%), lead (2 to 79%), and zinc (6 to 38%). Stanley also summarized the median concentration reductions at dry detention ponds studied by others, shown in Table 4-3. In all cases, the removals of the stormwater pollutants is substantially less than would occur at well designed and operated wet detention ponds. The resuspension of previously deposited sediment during subsequent rains was typically noted as the likely cause of these low removals. The conditions at the Greenville pond were observed three years after its construction. The most notable changes was that the pond bottom and interior banks of the perimeter dike were covered with weeds and many sapling trees (mostly willows), indicating that the interior areas have been too wet to permit mowing. The perforated riser was also partially clogged and some pooling was occurring near the pond outlet. It seemed that the dry pond was evolving into a wetlands. The monitoring activity was conducted a few months after the pond was constructed and was not affected by these changes. Stanley felt that the wetlands environment, with the woody vegetation, if allowed to spread, could actually increase the pollutant trapping performance of the facility. With continued no maintenance, the dry pond will eventually turn into a wet pond, with a significant permanent pool. The pollutant retention capability would increase, at the expense of decreased hydraulic benefits and less flood protection than originally planned. Maintenance problems in dry ponds had also been commonly noted in earlier Maryland surveys.

4-23
The benefits of off-line stormwater detention ponds were examined by Nix and Durrans (1996). Off-line ponds (side-stream ponds) are designed so that only the peak portion of a stream flow is diverted to the pond (by an in-stream diversion structure). They are designed to reduce the peak flows from developed areas, with no direct water quality benefits, and are typically dry ponds. Off-line ponds are smaller (by as much as 20 to 50%) than on-line ponds (where the complete storm flow passes through the pond) for the same peak flow reductions. However, the outflow hydrographs from the two types of ponds are substantially different. The off-line ponds produce peak outflows earlier and the peak flows no not occur for as long a period of time. If located in the upper portion of a watershed, off-line ponds may worsen flooding problems further downstream, whereas downstream on-line ponds tend to worsen basin outlet area flooding. Off-line dry ponds can be used in conjunction with on-line wet ponds to advantage to provide both water quality and flood prevention benefits. Off-line ponds have an advantage in that they do not interfere with the passage of fish and other wildlife and they do not have to dramatically affect the physical character of the by-passed stream itself. On-line dry ponds would substantially degrade the steam habitat by removing cover and radically changing the channel dimensions. The peak flow rate reductions can also have significant bank erosion benefits in the vicinity of the pond, although these benefits would be decreased further downstream.
Problems with Wet Detention Ponds Wet detention ponds may experience various operating and nuisance problems. The following discussion attempts to describe these negative aspects of wet ponds, as reported in the literature, and to describe how they have been overcome through specific designs.
Safety of Wet Detention Ponds The most important wet detention pond design guidelines are to maintain public safety. The following discussion briefly summarizes common suggestions to maintain and improve safety at wet detention facilities. Marcy and Flack (1981) state that drownings in general most often occur because of slips and falls into water, unexpected depths, cold water temperatures, and fast currents. Four methods to minimize these problems include: eliminate or minimize the hazard, keep people away, make the onset of the hazard gradual, and provide escape routes. Many of the design suggestions and specifications contained in this section are intended to accomplish these methods.
Jones and Jones (1982) consider safety and landscaping together because landscaping can be an effective safety element. They feel that appropriate slope grading and landscaping can provide a more desirable approach than wide-spread fencing around a wet detention pond. Fences are expensive to install and maintain and usually produce unsightly pond edges. They collect trash and litter, challenge some individuals who like to defy barriers, and impede emergency access if needed. Marcy and Flack (1981) state that limited fencing may be appropriate in special areas. When the pond side slopes cannot be made gradual (such as when against a railroad right-of-way or close to a roadway), steep sides having submerged retaining walls may be needed. A chain link fence located directly on the top of the retaining wall very close to the water's edge would be needed (to prevent human occupancy of the narrow ledge on the water side of the fence). Another area where fencing may be needed is at the inlet and outlet structures. However, fencing usually gives a false sense of security, as most can be easily crossed (Eccher 1991).
Pond side slopes need to be gradual near the water edge, with a submerged shallow ledge close to shore. Aquatic plants on the ledge would decrease the chance of continued movement to deeper water and thick vegetation on shore near the water edge would discourage access to the water edge and decrease the possibility of falling into the water accidentally. Pathways should not be located close to the water's edge, or turn abruptly near the water.
Marcy and Flack (1981) also encourage the placement of escape routes in the water whenever possible. These could be floats on cables, ladders, han4-holds, safety nets, or ramps. However, they should not be placed to encourage entrance into the water.

4-24
Table 4-3. Summary of Dry Detention Pond Pollutant Removal (Stanley 1996)

4-25
The use of inlet and outlet trash racks and antivortex baffles is also needed to prevent access to locations having dangerous water velocities. Racks need to be placed where water velocities are less than three feet per second through the racks to allow people to escape and the openings should be less than 6 inches across (Marcy and Flack 1981). Besides maintaining safe conditions, racks also help keep trash from interfering with the operation of outlet structures.
Eccher (1991) lists the following pond attributes to ensure maximum safety, while having good ecological control:
1) There should be no major abrupt changes in water depth in areas of uncontrolled access, 2) slopes should be controlled to insure good footing, 3) all slope areas should be designed and constructed to prevent or restrict weed and insect growth (generally requiring some form of hardened surface on the slopes), and 4) shoreline erosion needs to be controlled.
Nuisance Conditions in Wet Detention Ponds and Degraded Water Quality Most new detention ponds require from three to six years before an ecological balance is obtained (Ontario 1984). Excessive algal growths, fish kills, and associated nuisance odors may occur during this period, creating management problems for municipal officials and developers. Water quality is also generally poor in wet detention ponds, but unauthorized swimming can be common if alternative swimming facilities are not conveniently available. The poorest water and sediment quality in wet detention ponds usually occurs near the inlets and in depressions (Free and Mulamoottil 1983 and Wigington, et al. 1983). Some urban lakes have also been subjected to duck plagued disease which is a deadly virus that thrives in lakes having excessive algae growths (Ontario 1984). Schueler and Galli (1992) reported that water discharged from wet detention ponds may be warmed by as much as 10 to 15°F in the summer months, unless shaded or subsurface discharges are used.
The haphazard installation of detention ponds can increase downstream flooding and erosion problems if a regional analysis and careful plan is not developed and followed (Duru 1981 and 1983, Jones and Jones 1982, and Hawley, et al. 1981). This can occur by increasing the duration of erosive flow velocities and by adding the delayed high discharge flows from a pond to the natural high flows from upstream areas. These problems can be substantially reduced with careful design and maintenance, as described in the following paragraphs.
Attitudes of Nearby Residents and Property Values Wet detention ponds may create potential nuisance conditions if they are not properly designed or maintained. However, many people living near wet detention ponds do so because of the close presence of the wetlands, and their property values are typically greater than lots further from the ponds (Marsalek 1982). Marsalak (1982) also reported that small (well maintained) wet detention ponds are less subject to controversy that larger ponds (that are more commonly neglected). Debo and Ruby (1982) summarized a survey conducted in Atlanta of residents living near and downstream of 15 small detention ponds and found that almost half of the people surveyed who lived in the immediate areas of the ponds did not even know that they existed. Wiegand, et al. (1986) also stated that wet detention ponds, when properly maintained, are more preferred by residents than any other urban runoff control practice. Emmerling-DiNovo (1995) reported on a survey of homeowners in the Champaign-Urbana area living in seven subdivisions having either dry or wet detention ponds. She reported that past studies have recognized that developers are well aware that proximity to water increases the appeal of a development. Detention ponds can create a sense of identity, distinguishing one development from another, and can be prominent design elements. Increased value is important because the added cost of the detention facility, including loss of developable land, must be recovered by increasing the housing costs. Others have also found that the higher costs of developments having stormwater detention facilities can also be offset by being able to sell the housing faster. In a prior survey in Columbia, MD, 73% of the respondents would be willing to pay more for property located in an area having a wet detention pond if designed to enhance fish and wildlife use. Although the residents were concerned about nuisances and hazards, they felt that these concerns were out-weighed by the benefits. In her survey, Emmerling-DiNovo (1995) received 143 completed surveys. Overall attractiveness of the neighborhood was the most important factor in purchasing their home. Resale value was the second most important factor, while proximity to water was slightly

4-26
important. More than 74% of the respondents believed that wet detention ponds contributed positively to the image of the neighborhood and they were a positive factor in choosing that subdivision. In contrast, the respondents living in the subdivisions with the dry ponds felt that the dry ponds were not a positive factor in locating in their subdivision. Respondents living adjacent to the wet ponds felt that the presence of the pond was very positive in the selection of their specific lot. The lots adjacent to the wet ponds were reported to be worth about 22% more than lots that were not adjacent to the wet ponds. Lots adjacent to the dry ponds were actually worth less (by about 10%) than other lots. Dry detention ponds actually decreased the assessed values of adjacent lots in two of the three dry basin subdivisions studied. The respondents favored living adjacent to wet ponds even more than next to golf courses. Living adjacent to dry ponds were the least preferred location. Another example of increased land value occurred in Fairfax, VA (Land and Water 1996). A 1.6 acre wet detention pond was constructed using a modular concrete block retaining wall system. Total construction time was about six weeks and resulted in an attractive pond that added substantial value to the new housing development. The Hennepin (MN) park district (John Barten, personal communication) reports that the park district is frequently asked by developers to be allowed to “improve” the parks by putting their wet detention ponds on park land that is adjacent to new developments. Needless to say, the park district cannot afford to convert their dry land to lakes which would dramatically decrease the utilization of the park by the park users. The park district is also frequently asked by residents of subdivisions to improve the water quality in the wet detention ponds located in their subdivisions, especially to allow fishing and swimming. The residents do not understand that their “lake” is actually a water treatment system and is not a natural lake or park and is not intended for water contact recreation or fishing. However, because many of these subdivisions are marketed by stressing the benefits of “lakeside” living, some of the residents expect the city to improve the wet detention ponds for recreational use. The park department, under a lot of citizen and political pressure, has actually had to construct new wet detention ponds upstream of some of these wet detention ponds. Maintenance Requirements of Wet Detention Ponds In order for detention ponds to perform as anticipated, they must be regularly maintained. Poor operation and maintenance not only reduces the pollutant and flow rate reduction effectiveness of detention ponds, but can cause detention facilities to become eyesores, nuisances, and health hazards (Poertner 1974). If a pond does not “need” maintenance (such as sediment removal), then it is not providing significant water quality benefits. Ponds can be designed to minimize maintenance, however, a maintenance free detention facility (that is working properly) does not exist (SEMCOG 1981).
Institutional arrangements must be made to insure continued detention pond maintenance after construction. SEMCOG (1981) recommends that appropriate maintenance programs specifically identify the organization or person who will perform the maintenance and how the maintenance operations will be financed. They also found that major detention pond maintenance (dredging) is usually needed within about ten years after pond construction. More frequent (routine) maintenance may include: structural repairs (bank stabilization), removal of debris and litter from the water and surrounding land, grass cutting, fence repairing, algal control, mosquito control, and possible fish stocking. Wet detention ponds require a lot of attention.
Routine Maintenance Requirements The following summary of routine maintenance requirements is based on a discussion by Schueler (1987).
Mowing. The most costly routine maintenance required of a detention facility is mowing the surrounding area. In residential areas, frequent mowing (up to 12 times a year) may be necessary to maintain a lawn surrounding the pond. Some native plants (such as in the small prairie surrounding the Monroe Street detention pond in Madison at the University of Wisconsin Arboretum) require much less maintenance. In all cases, the emergency spillway, side slopes, and pond embankments need to be mowed at least twice a year to control undesirable plants that may interfere with pond operation. Attractive landscaping and adequate landscaping maintenance are always needed. Careful plant selection (water and salt tolerant, disease and winter hardy, and slow growing) should be made in conjunction with a landscape architect or the Soil Conservation Service.

4-27
Debris and litter removal. During the routine mowing operations and after each major storm, debris and litter should also be removed from the site, especially from the inlet and outlet grates and the water surface.
Inspections. Wet detention ponds need to be inspected at least once a year, and after each major storm. The inspection should include checking the pond embankments for subsidence, erosion, and tree growth. The conditions of the emergency spillway and inlets and outlets also need to be determined during the inspection. The adequacy of any channel erosion protection measures near the pond should also be investigated. Sediment accumulation in the pond (especially near, and in, the inlets and outlets) also needs to be examined.
Sediment Removal from Wet Detention Ponds Large sediment accumulations in detention ponds can have significantly adverse affects on pond performance. Bedner and Fluke (1980) reported on the long term effects of detention ponds that received little maintenance. Lack of dredging actually caused the silte4-in ponds to become a major sediment source to downstream areas. Poorly maintained ponds only delayed the eventual delivery of the sediment downstream, they did not prevent it.
Based on the NURP detention pond monitoring results (EPA 1983), a pond having a surface area of about 0.6 percent of the contributing area should remove about 90 percent of the settleable solids (particulate residue) from the runoff. The Milwaukee NURP project (Bannerman, et al. 1983) estimated an annual sediment delivery of about 500 pounds per acre for medium density residential land uses and about 2500 pounds per acre for commercial areas. Other land uses contribute sediment generally between these values. Assuming a density of about 120 pounds per cubic feet, about 3.6 and 18 cubic feet of sediment would be deposited in a well designed detention pond for each medium density residential or commercial acre per year. With a pond 0.6 percent of the contributing area in size, this would only result in the deposition of between 0.2 and 0.9 inches per year. McComas and Sefton (1985) report two measured sediment accumulation rates in Chicago area wet detention ponds (about two and three percent of the drainage pond in size) of 0.24 and 1.3 inches per year. Kamedulski and McCuen (1979) report a much greater sedimentation rate of about three inches per year in another pond. When uncontrolled construction site erosion is allowed to enter a detention pond, the pond can literally fill up over night.
Most of the sedimentation would occur near the inlet and the resulting sediment accumulation would be very uneven throughout the pond. Sediment removal in a wet pond may therefore be needed about every five to ten years, depending on the variation in sediment deposition over the pond and the sacrificial storage volume designed.
It is necessary to plan for required maintenance during the design and construction of detention ponds. Ease of access of heavy equipment and the possible paving of a sediment trap near the inlet would ease maintenance problems. Deposited sediment can be heavily polluted and may require special disposal practices. Sediment concentrations of up to 100,000 mg organic carbon, several thousand mg lead, several hundred mg zinc, and more than ten mg arsenic per kg dry sediment are not uncommon for lakes receiving urban runoff (Pitt and Bozeman 1979). Dredged sediment is usually placed directly onto trucks, or is placed on the pond banks for dewatering before hauling to the disposal location. One common practice is to keep an area adjacent to the detention pond available for on-site sediment disposal. Small mounds can be created of the dried sediment and covered with top soil and planted.
Poertner (1974) reviewed various sediment removal procedures. An underwater scoop can be pulled across the pond bottom and returned to the opposite side with guiding cables. If drains and underwater roads were built during the initial pond construction, the pond can be drained and front-en4-loaders, draglines, and trucks can directly enter the pond area. Small hydraulic dredges can also be towed on trailers to ponds. The dredge pumps sediment to the shore through a floating line where the sediment is then dewatered and loaded into trucks or piled. A sediment trap can also be constructed near the inlet of the pond. The entrances into the pond are widened and submerged dams are used to retain the heavier materials in a restricted area near the inlets. This smaller area can then be cleaned much easier and with less expense than the complete pond. Hey and Schaefer (1983) report the successful use of a submerged dam across the pond inlet in Lake Ellyn.
The estimated cost of removing sediment from a detention pond varies widely, depending on the amount to be removed and the disposal requirements. Costs as low as one dollar per cubic yard have been reported, but this low cost does not include any possible special disposal practices. Sediment removal costs are estimated to generally

4-28
range from about $5 to $25 per cubic yard of sediment removed.
Problems with Contaminated Sediments in Wet Detention Ponds. Frequently, concern arises about the safety of disposing sediments from wet detention ponds. There have recently been several studies that have addressed this issue, as summarized in the following paragraphs. Dewberry and Davis (1990) analyzed sediments from 21 ponds in northern Virginia. They found trace metals in many of the sediments, but the available forms of the metals were significantly less than applicable toxic thresholds. They concluded that the dredged materials could be safely disposed either on-site or at sanitary landfills without danger of health problems. However, they recommend that sediment samples from specific ponds be analyzed before dredging. Yousef and Lin (1990) conducted extensive pond water quality and sediment quality analyses in six wet detention ponds in Florida as part of a Florida Dept. of Transportation study to develop pond maintenance procedures. The ponds had all been constructed from 4 to 13 years prior to analyses and received runoff from various urban watersheds that all contained different amounts of highway runoff. The dissolved oxygen levels in the ponds all dropped significantly with depth, in many cases being lower than 1 mg/L at the water-sediment interface. The pH of the pond water was also generally acidic in all of the ponds, being from 5.5 to 7.2 throughout the water columns. The temperature differences between the water surface and the bottom of the ponds was generally less than 1oC. The sediment accumulation rates were found to be between 0.25 and 0.72 cm per year and correlated with pond age, size of drainage basin and size of pond. The bottom material was found to be poorly graded sand. Appreciable amounts of heavy metals (Cu: 7 to 73 µg/g, Ni: 12 to 82 µg/g, Pb: 84 to 1025 µg/g, and Zn: 13 to 538 µg/g), and nutrients (N: 1.1 to 5.2 mg/g, and P: 0.1 to 1.2 mg/g) were found in the surface layers of the sediments. However, the concentrations of the pollutants decreased rapidly with depth, generally being less than 10% of the surface sediment concentrations below 20 cm beneath the water-sediment interface. The bottom sediments were also analyzed to determine the TCLP extractable portions of the metals. These were found to be significantly less than the whole sediment metal concentrations (Cu: 0.13, Ni: 0.31, Pb: 0.27, and Zn: 0.33). They determined that the TCLP extractable fraction was lowest for sediments having higher clay and organic material. They concluded that the sediments could be removed during normal maintenance operations and disposed of on non-agricultural land.
Jones (1995) and Jones, et al. (1996) discuss the implications that the Resource Conservation and Recovery Act (RCRA) may have on sediments that need to be removed from stormwater management facilities, as summarized in the following discussion. The “mixture” (40 CFR Section 261.3(a)(2)(iv)) and “derived from” (40 CFR Sections 261.3(c)(2)(1) and 261.3(d)(2)) rules can cause sediments having very low concentrations of pollutants to be classified as “hazardous.” These regulations are likely to be changed in the near future, with clearer definitions for non-hazardous operations and facilities. Sediments are evaluated as being hazardous when the wet detention pond is being dredged, not while they remain in-place. Many of the materials that are listed as hazardous under RCRA may enter stormwater, especially at vehicle service facilities, industrial facilities, and even golf courses and parks. These include solvents, degreasers, hydraulic fluids, herbicides, fungicides, and pesticides. For the sediments to be considered hazardous under the current RCRA mixture rule, the source of the specific material containing the listed hazardous material must contain more than 10% of the hazardous material. This is irrespective of how much of the material actually enters the stormwater. Therefore, site inventories become important tools in determining if a sediment would be classified as hazardous. If a listed material is used on the site, but it would not come in contact with rain (either through normal use or spills), the sediment would not likely be classified as hazardous. It is difficult to conduct detailed site surveys for a large drainage area having many separate owners, but it is feasible for small wet ponds serving single facilities. Jones (1995) and Jones, et al. (1996) also discuss other options to minimize the chance that wet pond sediment would be classified as hazardous under RCRA:
• Reduce the likelihood that listed substances would come in contact with precipitation or runoff. • Inventory and track hazardous materials and encourage the use of replacement compounds. • Install stormwater pre-treatment facilities to localize the problem. • Reduce the accumulation rate, and increase the storage area for sediment in the pond.
Vegetation Removal from Wet Detention Ponds In shallow detention ponds, excessive rooted aquatic plant (macrophyte) growths may occur over the entire pond surface. In deeper ponds, rooted aquatic plant growths are usually restricted close to the shoreline (Ontario 1984).

4-29
Floating algae may create problems anywhere in a lake, irrespective of pond depth. As noted earlier, a narrow band of natural rooted aquatic plants along the narrow “safety” shelf is desirable as a barrier and to add habitat for pond wildlife.
Excessive algal growths create nuisance problems with strong odors, but more serious problems may also occur. Schimmenti (1980) reports that decaying vegetation, if not removed, promotes the breeding of mosquitoes. Certain types of algae (Anabaena, Aphanizomenon, and Anacystis) naturally produce toxins that can kill animals (including fish) which drink the water and can cause skin irritation and nausea in humans (Ontario 1984). Algae is usually mechanically controlled in detention ponds by using algae harvestors or by dewatering the pond. Certain fish also consume large amounts of algae, but the most common type of algae control is by using aquatic herbicides. Many rooted aquatic plant growth problems can be significantly reduced by using a deep pond which restricts light penetration.
Small weed harvestors can be delivered to a detention pond by trailer. The use of chemicals for algae control is popular, but must be carefully done to prevent contamination of the receiving water. Dead algae and rooted plants must also be removed to prevent odor and dissolved oxygen problems. Mechanical barriers can als o be placed on the pond bottom to reduce rooted aquatic plant growth. AquaScreen is a fairly fine, dark mesh that is laid on the pond bottom that restricts sunlight from reaching the rooted aquatic plants. In tests conducted on Lake Washington, Perkins (1980) concluded that a two or three month use of the material resulted in about an 80 percent reduction of rooted aquatic plants where the material had been placed. Again, increased pond depth, possibly at less cost, can do the same thing.
Guidelines to Enhance Pond Performance The Natural Resources Conservation Service (NRCS, renamed from SCS, undated) has prepared a design manual that addresses specific requirements for such things as anti-seep collars around outlet pipes, embankment widths, type of fill required, foundations, emergency spillways, etc., for a variety of wet detention pond sizes and locations. That manual must be followed for detailed engineering requirements.
The rest of this discussion presents some of the many design suggestions that have been made by researchers having many years of design and monitoring experience with detention ponds. Akeley (1980) listed several modifications that can be made to existing ponds to improve their performance. Gravel, or cement, should be added along unstable banks and near the inlet and control structures. A baffle should be placed at the inlet to reduce turbulence, and barriers can be used to separate the pond into compartments to reduce short-circuiting. On-going maintenance is also needed to remove deposited sediment. Hawley, et al. (1983) also recommended similar design considerations. Hey and Schaefer (1983) found that a submerged dam near the pond inlets significantly reduced the area requiring maintenance dredging.
Insect Control, Fish Stocking and Planting Desirable Aquatic Plants Mosquito problems at wet detention ponds are increased when large water level fluctuations occur, especially when vast amounts of aquatic plants are wetted and available for egg laying. If ponds drain to normal water levels within several hours after a rain has ended, if aquatic vegetation is kept to a minimum (such as only along a narrow ledge close to shore), and if the pond shape allows adequate water movement and wind disturbance, then mosquito problems should be minimal.
Schimmenti (1980) made several recommendations to reduce the possibility of mosquito problems in detention ponds. Wet ponds should have adequate water quality to support surface feeding fish, such as sunfish, and various minnows, that feed on mosquitoes. Carp or crayfish also make adequate biological controls for midges, reducing the need for chemical controls (Ontario 1984).
Some developers have tried to stock trout, yellow perch, and northern pike in detention ponds, but no reproduction and poor wintering soon eliminates these less tolerant fish. Detention ponds receiving urban runoff are likely to contaminate fish, making them unsuitable for consumption. Brydges and Robinson (1980) have conducted extensive heavy metal and pesticide analyses in fish in two wet detention ponds near Toronto, Ontario and have found little

4-30
problem accumulations of these substances. However, other studies have reported problem toxic pollutant concentrations in fish from waters receiving urban runoff, so allowing fish consumption in wet detention facilities should only be allowed after careful study. Therefore, game fish should not generally be used in ponds, and consumptive fishing should be discouraged. Fathead minnows, stocked for mosquito control, have survived in detention ponds in Ontario.
Rooted aquatic plants should be planted along much of the shallow perimeter shelf to deter small children, for aesthetics and to provide wildlife habitat. The use of native aquatic plants is to be encouraged to lessen maintenance costs and to prevent nuisance plants from becoming established in a waterway (such as purple loosestrife). Plants that could be established in wet detention ponds include arrowhead and cattails. Cattails sometimes interfere with the operation of a surface outlet because of large floating pieces clogging the weir. Subsurface weirs and trash racks (both recommended) would decrease this problem. Other rooted aquatic plants may also be used in wet detention ponds, but their selection and planting should be done in consultation with a landscape architect and a wildlife biologist. Fuhr (1996) warns against planting trees and brush on an impoundment because seepage problems may result by root action.
An interesting use of aquatic plants to enhance wet detention pond performance was described in the February 1991 Lake Line. Nutri-Pods, developed by the Limnion Corporation of Concord, CA, are two m diameter mesh balls, initially filled about 25% full with coontail (Ceratophyllum demersum). One to five Nutri-Pods are used per acre of pond surface, for ponds at least one acre in size. These reduce nutrient concentrations in the water and successfully compete with other aquatic plants, including planktonic algae. They were tested on a 27 acre lake near Sacramento, CA, which underwent periodic major increases in nutrients (phosphates as high as 50 mg/L) from fertilizing surrounding land. It took about two to four weeks for the Nutri-Pods to stabilize the lake after each major increase. Adding Elodea to the Nutri-Pods helped to keep nutrient concentrations very low (phosphorus at about 0.01 mg/L and nitrates less than 0.1 mg/L). The Nutri-Pods are inspected every few weeks and when they approach 100% capacity with the internal aquatic plants, they are removed from the water, and plants are removed, except for about 25% which are used as a starter. The Nutri-Pods therefore use aquatic plants to improve wet detention pond water quality, while enabling controlled harvesting with very little specialized equipment.
Pond Side Slopes Reported recommended side slopes of detention ponds have ranged from 4:1 (four horizontal units to one vertical unit) to 10:1. Steeper slopes will cause problems with grass cutting and may erode. Steep slopes are not as aesthetically pleasing and are more dangerous than gentle slopes (Chambers and Tottle 1980). Sclueler (1986) also recommends a minimum slope of 20:1 for land near the pond to provide for adequate drainage.
The slope near the waterline, and for about one foot below, should be relatively steep (4:1) to reduce mosquito problems (by reducing the amount of frequently wetted land surface), and to provide relatively fast pond drawdown after common storms. However, a flat underwater shelf several feet wide and about one foot below the normal pond surface is needed as a safety measure to make it easier for anyone who happens to fall into the pond to regain their footing and climb out. This shelf should also be planted with native rooted aquatic plants (marcrophytes) to increase the aesthetics and habitat benefits of a pond and to create a barrier making unwanted access to deep water difficult.
Another method of treating pond edges is placing gravel along the pond edge to decrease erosion and to make mowing easier (Chambers and Tottle 1980). This method requires placing a layer of gravel about one foot deep and 15 feet wide along the pond edge, from about ten feet above the normal waterline edge and extending about five into the water.
Enhancing Pond Performance During Severe Winter Conditions Oberts (1990 and 1994) monitored four urban wet detention ponds during both warm and cold weather in Minnesota. The ponds performed as expected during warm weather, providing typical removals of suspended solids (80%), lead (68%), and TP (52%). However, he found that the ponds did a much worse job of removing suspended solids (39%), organic matter (12% for COD), nutrients (4 % for TKN to 17% for TP) and lead (20%) in the winter. He found that thick ice, which can form as much as 1 m in thickness, effectively eliminated mu ch of the detention volume for incoming snowmelt water. In addition, the first melting water was forced under the ice, causing scour of the

4-31
previously sediments. Later snowmelt water flowed across the surface of the ice, with very little sedimentation opportunities. Any sediment that was accumulated on top of the underlying ice was later discharged when the ice melted. Similar research in Minnesota wetlands also showed similar dismal performance during winter conditions, for much the same reasons.
Oberts (1990 and 1994) proposed several improvements in stormwater management during winter conditions. His initial recommendation is to utilize infiltration and grass filtering in waterways before any detention facilities. He found that substantial infiltration can occur, even in clayey soils, underlying the snow. The ground under snowpacks is rarely frozen and infiltration can be significant until the soil becomes saturated. If the snowmelt is originating from areas having automobile activity (streets and parking areas) or sidewalks, care must be taken because the snowmelt likely would have high concentrations of salts which would adversely affect the local groundwater (Pitt 1996). The design of the detention pond should be modified for winter operations (Oberts 1994). A low flow channel leading to and through the pond will discourage the formation of ice. The pond can also be aerated to prevent ice formation, however, if it gets extremely cold, ice formation could then be very thick and rapid. The most important suggestion by Oberts is to use a special riser for the outlet of the pond that can be used to draw down the water elevation during the winter. Ice would then form near the bottom of the pond and seal off the sediments. As the snowmelt occurs, the bottom outlets on the riser should be closed, forming a deeper pond for better sedimentation.
Droste and Johnston (1993) examined snowmelt quality from snow disposal areas in Ottawa and conducted treatability tests to examine the benefits of different settlement times in 1 L test columns. They found that 2 to 6 hour settling times in these columns produced suspended solids and metal removals approaching 90%. These tests were conducted in controlled laboratory conditions and were not subjected to the actual site problems identified by Oberts. These tests do indicate that sedimentation treatment of snowmelt is likely beneficial, especially if the unique problems of scour and ice formation can be overcome.
Mayer, et al. (1996) examined the performance of four wet detention ponds in Toronto during different seasons and during non-storm conditions. The thick ice cover on the ponds during the winter severely affected the pond water quality. In addition, snowmelt and runoff from rainfall occurring on an existing snowpack, were poorly treated by the ponds. Few of the biochemical processes that normally enhance pollutant removal in wet detention ponds during warm weather are available during the winter, plus the ice pack decreases the efficiency of the physical processes, as noted by Oberts. Water beneath the winter ice was typically devoid of oxygen, causing the release of ammonia from sediments and increasing the water column concentrations to about 0.5 mg/L. High grit concentrations in snowmelt, associated with winter sanding of streets, were effectively removed in the detention ponds. However, the high chloride concentrations, from salting of the streets, were not affected by the ponds, as expected.
Particle Settling Characteristics in Stormwater Knowing the settling velocity characteristics associated with stormwater particulates is necessary when designing wet detention ponds. Particle size is directly related to settling velocity (using Stokes law, for example, and using appropriate shape factors, specific gravity and viscosity values) and is usually used in the design of detention facilities. Particle size can also be much more rapidly measured in the laboratory than settling velocities. Settling tests for stormwater particulates need to be conducted for about three days in order to quantify the smallest particles that are of interest in the design of wet detention ponds. If designing rapid treatment systems (such as grit chambers or vortex separators) for CSO treatment, then much more rapid settling tests can be conducted. Probably the earliest description of conventional particle settling tests for stormwater samples was made by Whipple and Hunter (1981).
The particle size distributions of stormwater at different locations in an urban area greatly affect the ability of different source area and inlet controls in reducing the discharge of stormwater pollutants. A series of recent U.S. Environmental Protection Agency (USEPA) funded research projects has examined the sources and treatability of urban stormwater pollutants (Pitt, et al. 1995). This research has included particle size analyses of 121 stormwater inlet samples from three states (southern New Jersey; Birmingham, Alabama; and at several cities in Wisconsin) in the U.S. that were not affected by stormwater controls. Particle sizes were measured using a Coulter Counter Multi-Sizer IIe and verified with microscopic, sieve, and settling column tests. Figures 4-4 and 4-5 are grouped box and whisker plots showing the particle sizes (in µm) corresponding to the 10th, 50th (median) and 90th percentiles of the

4-32
cumulative distributions. If 90 percent control of suspended solids (by mass) was desired, then the particles larger than the 90th percentile would have to be removed, for example. In all cases, the New Jersey samples had the smallest particle sizes (even though they were collected using manual “dipper” samplers and not automatic samplers that may miss the largest particles), followed by Wisconsin, and then Birmingham, Alabama, which had the largest particles (which were collected using automatic samplers). The New Jersey samples were obtained from gutter flows in a residential neighborhood that was xeroscaped, the Wisconsin samples were obtained from several source areas, including parking areas and gutter flows mostly from residential, but from some commercial areas, and the Birmingham samples were collected from a long-term parking area on the UAB campus. In contrast, Figure 4-6 is a plot of stormwater particle sizes from the outfall at the Monroe St. site in Madison, WI (collected using both an automated sampler and be4-load samplers). These data were also not affected by stormwater controls, but do show the significant shift in particle sizes in stormwater at the outfall compared to source area sheetflow. The median particle size at the outfall was only about 8 µm, and the 90th percentile value was less than 1 µm. At the source areas, the median particle size was about twice as large, at about 15 µm, while the 90th percentile size was about 3 µm. The bed load sampler also enabled larger particles moving in the stormwater to be effectively sampled. The bed load sampler material represented about 10% (by weight) of the annual sediment load (mostly in sizes larger than about 300 µm), while the automatic sampler captured about 90% of the annual load (mostly in sizes from <1 µm to about 300 µm). The median particle sizes ranged from 0.6 to 38µm and averaged 14µm. The 90th percentile sizes ranged from 0.5 to 11µm and averaged 3µm. These particles were all substantially smaller than have been typically assumed for stormwater. The suspended solids concentrations ranged from 4 to 1080 mg/L (averaging 130 mg/L), while the turbidity ranged from 1 to 290 NTU (averaging 41 NTU). Notably lacking was a better relationship between suspended solids and turbidity, or between suspended solids and any of the particle sizes. Additional data obtained by Pitt and Barron (1989) for the USEPA described particle sizes from many different source flows in the Birmingham, Alabama, area. These data did not indicate any significant differences in particle size distributions for different source areas or land uses, except that the roof runoff had substantially smaller particle sizes. Pisano and Brombach (1996) recently summarized numerous solids settling curves for stormwater and CSO samples. They are concerned that many of the samples analyzed for particle size are not representative of the true particle size distribution in the sample. As an example, it is well known that automatic samplers do not sample the largest particles that are found in the bedload portion of the flows. Particles having settling velocities in the 1 to 15 cm/sec range are found in grit chambers and catchbasins, but are not seen in stormwater samples obtained by automatic samplers, for example. It is recommended that bedload samplers be used to supplement automatic water samplers in order to obtain more accurate particle size distributions (Burton and Pitt 1997). Selected US and Canadian settling velocity data are shown in Table 4-4. The CSO particulates have much greater settling velocities than the other samples, while the stormwater has the smallest settling velocities. More than 13,000 CSO control tanks have been built in Germany using the ATV 128 rule (Pisano and Bromback 1996). This rule states that clarifier tanks (about 1/3 of these CSO tanks) are to retain all particles having settling velocities greater than 10 m/hr (0.7 cm/sec), with a goal of capturing 80% of the settleable solids. Their recent

4-33
Figure 4-4. Median particle sizes for stormwater sheetflow samples (Pitt, et al. 1995).
Figure 4-5. Ninetieth percentile particle sizes for stormwater sheetflow samples (Pitt, et al. 1995).

4-34
Figure 4-6. Stormwater outfall particle size distribution, Monroe St., Madison, WI (WI DNR unpublished data). measurements of overflows from some of these tanks indicate that the 80% capture was average for these tanks and that the ATV 128 rule appears to be reasonable.
The relationship between solids retention and pollution retention is important for wet detention ponds. Becker, et al. (1995) used settling column tests to measure the settling characteristics of different pollutants in sanitary sewage. They found that the majority of the particulate fractions of COD, copper, TKN, and total phosphorus was associated with particles having settling velocities of 0.04 to 0.9 cm/sec.
Vignoles and Herremans (1995) also examined the heavy metal associations with different particles sizes in stormwater samples from Toulouse, France. They found that the vast majority of the heavy metal loadings in stormwater were associated with particles less than 10 µm in size, as shown on Table 4-5. They concluded that stormwater control practices must be able to capture the very small particles.
Wet Detention Pond Design Procedures The basic design approaches for wet detention ponds consider either slug flow or completely mixed flow. Martin (1989) reviews these flow regimes and conducted five tracer studies in a wet detention pond/wetland in Orlando, FL, to determine the actual flow patterns under several storm conditions. Completely mixed flow conditions assumes that the influent is completely and instantaneously mixed with the contents of the pond. The concentrations are therefore uniform throughout the pond. Under plug flow conditions, the flow proceeds through the pond in an orderly manner, following streamlines and with equal velocity. The concentrations vary in the direction of flow and

4-35
Table 4-4. Settling Velocities for Wastewater, Stormwater, and CSO
Samples Geometric Means of Settling Velocities Observed (cm/sec)
Range of Medians of Settling Velocities Observed (cm/sec)
dry weather wastewater (sanitary sewage)
0.045 0.030 to 0.066
stormwater 0.011 0.0015 to 0.15
CSO 0.22 0.01 to 5.5
Source: Pisano and Bromback (1996)
Table 4-5. Percentages of Suspended Solids and Distribution of Heavy Metal Loadings Associated with Various Stormwater Particulate Sizes (Toulouse, France) (Percentage associated with size class, concentration in mg/kg)
>100 µm 50 to 100 µm 40 to 50 µm 32 to 40 µm 20 to 32 µm 10 to 20 µm <10 µm Suspended solids
15% 11% 6% 9% 10% 14% 35%
Cadmium 18 (13) 11 (11) 6 (11) 5 (6) 5 (5) 9 (6) 46 (14) Cobalt 9 (18) 5 (16) 4 (25) 6 (20) 6 (18) 10 (22) 60 (53) Chromium 5 (21) 4 (25) 2 (26) 6 (50) 3 (23) 9 (39) 71 (134) Copper 7 (42) 8 (62) 3 (57) 4 (46) 4 (42) 11 (81) 63 (171) Manganese 8 (86) 4 (59) 3 (70) 3 (53) 4 (54) 7 (85) 71 (320) Nickel 8 (31) 5 (27) 4 (31) 5 (31) 5 (27) 10 (39) 63 (99) Lead 4 (104) 4 (129) 2 (181) 4 (163) 5 (158) 8 (247) 73 (822) Zinc 5 (272) 6 (419) 3 (469) 5 (398) 5 (331) 16 (801) 60 (1,232) Source: Vignoles and Herremans (1995)
are uniform in cross section. The steady state resident time for both flow conditions is the same for both flow patterns, namely the pond volume divided by the discharge rate. Historically, wet detention ponds have been designed using the plug flow concept, probably because it had been used in conventional clarifier designs for water and wastewater treatment. In reality, detention ponds exhibit a combination flow pattern that Martin terms moderately mixed flow. He found that the type of mixing that actually occurs is dependent on the ratio of the storm volume to the pond storage volume. If the ratio is less than one, plug flow likely predominates. If the ratio is greater than one, the flow type is not as obvious. With faster flows in the pond, short-circuiting effectively reduces the available pond storage volume (and therefore the resident time), with less effective treatment.
The stormwater management system that Martin (1989) monitored was comprised of a 0.2 acre wet detention pond followed by a 0.7 acre wetland. The drainage area was 41.6 acres, with 33% roadway, 28% forest, 27% high density residential, and 13% low density residential land uses. The system was therefore about 2% of the drainage area, with the wet detention pond portion about 0.5% of the drainage area. The pond’s maximum available live storage volume was 18,500 ft3. The system produces moderate to high pollutant reductions of solids, lead, and zinc (between 50 and 80%) and smaller reductions for nitrogen and phosphorus (between 30 and 40%). At low discharges and with large storage volumes, the pond was found to be moderately well mixed with residence times not much less than the maximum expected if operating under ideal mixing conditions, with little short-circuiting apparent. At higher discharges and with less storage volume, significant short-circuiting occurred.

4-36
Driscoll (1989; and EPA 1986) presented a basic methodology for the design and analysis of wet detention ponds. A pond operates under dynamic conditions when the storage of the pond is increasing with runoff entering the pond and with the stage rising, and when the storage is decreasing when the pond stage is lowering. Quiescent settling occurs during the dry period between storms when storage is constant and when the previous flows are trapped in the pond, before they will be partially or completely displaced by the next storm. The relative importance of the two settling periods depends on the size of the pond, the volume of each runoff event, and the inter-event time between the rains.
Driscoll (1989) produced a summary curve, shown as Figure 4-7, that relates wet pond performance to the ratio of the surface area of the pond to the drainage area, based on the numerous NURP wet detention pond observations. The NURP ponds were in predominately residential areas and were drained with conventional curb and gutters. This figure indicates that wet ponds from about 0.3 to 0.8 percent of the drainage area should produce about 90% reductions in suspended solids. Southeastern ponds need to be larger than ponds in the Rocky Mountain region because of the much greater amounts of rain and the increased size of the individual events in the southeast. Also, wet ponds intending to remove 90% of the suspended solids need to be about twice as large as ponds with only a 75% suspended solids removal objective.
Figure 4-7. Regional variations in wet detention pond performance, US EPA NURP data (Driscoll 1989). Under dynamic conditions, particle trapping can be predicted using the basic Fair and Geyer (1954) equation that considers short-circuiting effects:
R = 1 - [1 + (1/n) x (vs /(Q/A))]-n
where R = fraction of initial solids removed vs = settling velocity of particles of concern Q = wet pond discharge A = wet pond surface area
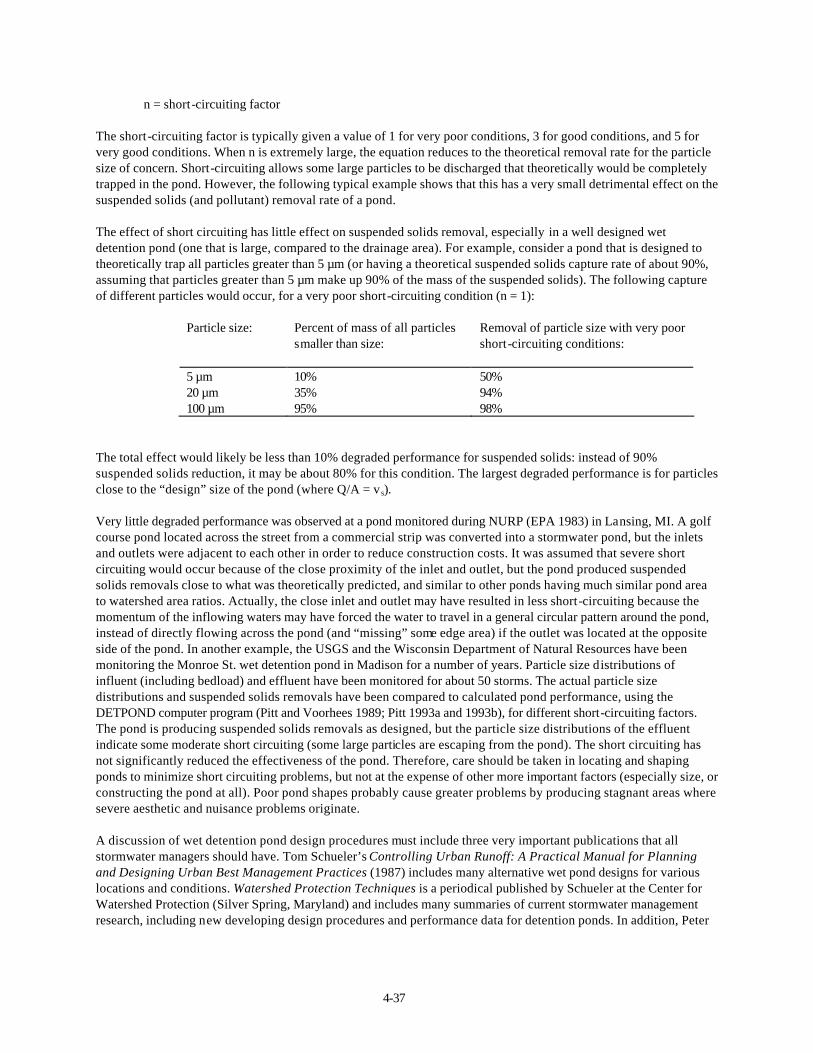
4-37
n = short-circuiting factor The short-circuiting factor is typically given a value of 1 for very poor conditions, 3 for good conditions, and 5 for very good conditions. When n is extremely large, the equation reduces to the theoretical removal rate for the particle size of concern. Short-circuiting allows some large particles to be discharged that theoretically would be completely trapped in the pond. However, the following typical example shows that this has a very small detrimental effect on the suspended solids (and pollutant) removal rate of a pond.
The effect of short circuiting has little effect on suspended solids removal, especially in a well designed wet detention pond (one that is large, compared to the drainage area). For example, consider a pond that is designed to theoretically trap all particles greater than 5 µm (or having a theoretical suspended solids capture rate of about 90%, assuming that particles greater than 5 µm make up 90% of the mass of the suspended solids). The following capture of different particles would occur, for a very poor short-circuiting condition (n = 1):
Particle size: Percent of mass of all particles smaller than size:
Removal of particle size with very poor short-circuiting conditions:
5 µm 10% 50% 20 µm 35% 94% 100 µm 95% 98%
The total effect would likely be less than 10% degraded performance for suspended solids: instead of 90% suspended solids reduction, it may be about 80% for this condition. The largest degraded performance is for particles close to the “design” size of the pond (where Q/A = v s).
Very little degraded performance was observed at a pond monitored during NURP (EPA 1983) in Lansing, MI. A golf course pond located across the street from a commercial strip was converted into a stormwater pond, but the inlets and outlets were adjacent to each other in order to reduce construction costs. It was assumed that severe short circuiting would occur because of the close proximity of the inlet and outlet, but the pond produced suspended solids removals close to what was theoretically predicted, and similar to other ponds having much similar pond area to watershed area ratios. Actually, the close inlet and outlet may have resulted in less short-circuiting because the momentum of the inflowing waters may have forced the water to travel in a general circular pattern around the pond, instead of directly flowing across the pond (and “missing” some edge area) if the outlet was located at the opposite side of the pond. In another example, the USGS and the Wisconsin Department of Natural Resources have been monitoring the Monroe St. wet detention pond in Madison for a number of years. Particle size distributions of influent (including bedload) and effluent have been monitored for about 50 storms. The actual particle size distributions and suspended solids removals have been compared to calculated pond performance, using the DETPOND computer program (Pitt and Voorhees 1989; Pitt 1993a and 1993b), for different short-circuiting factors. The pond is producing suspended solids removals as designed, but the particle size distributions of the effluent indicate some moderate short circuiting (some large particles are escaping from the pond). The short circuiting has not significantly reduced the effectiveness of the pond. Therefore, care should be taken in locating and shaping ponds to minimize short circuiting problems, but not at the expense of other more important factors (especially size, or constructing the pond at all). Poor pond shapes probably cause greater problems by producing stagnant areas where severe aesthetic and nuisance problems originate.
A discussion of wet detention pond design procedures must include three very important publications that all stormwater managers should have. Tom Schueler’s Controlling Urban Runoff: A Practical Manual for Planning and Designing Urban Best Management Practices (1987) includes many alternative wet pond designs for various locations and conditions. Watershed Protection Techniques is a periodical published by Schueler at the Center for Watershed Protection (Silver Spring, Maryland) and includes many summaries of current stormwater management research, including new developing design procedures and performance data for detention ponds. In addition, Peter

4-38
Stahre’s and Ben Urbonas’s book on Stormwater Detention for Drainage, Water Quality and CSO Management (1990) includes in-depth discussions on many detention pond design and operational issues.
Wet Detention Pond Design Guidelines for Suspended Solids Reductions A wet detention pond performance specification for water quality control needs to result in a consistent level of protection for a variety of conditions, and to allow a developer a large range of options to best fit the needs of the site. It must also be easily evaluated by the reviewing agency and be capable of being integrated into the complete stormwater management program for the watershed. It should have minimal effects on the hydraulic routing of stormwater flows, unless a watershe4-wide hydraulic analyses is available that specifies the specific hydraulic effects needed at the specific location. The following specifications should meet these objectives under most conditions. However, the specific pond sizes should be confirmed through continuous long-term simulations using many years of actual rainfall records for the area of interest. These guidelines should therefore be considered as a starting point and modified for specific local conditions. As an example, it may be desirable to provide less treatment than suggested by the following guidelines (Vignoles and Herremans 1996). The following guidelines were developed by Pitt (1993a and 1993b), based on literature information and on his personal experience.
1) The wet pond should have a minimum water surface area corresponding to land use, and desired pollutant control. The following values were extrapolated from extensive wet detention pond monitoring, mainly the EPA’s NURP (EPA 1983) studies:
Percent of drainage area required as pond surface for control of suspended solids:
Land Use 5 µm 20 µm (90 percent) (65 percent) ___________________________________________________________________ Freeways 2.8 percent 1.0 percent Industrial areas 2.0 0.8 Commercial areas 1.7 0.6 Institutional areas 1.7 0.6 Residential areas 0.8 0.3 Open space areas 0.6 0.2 .
These values are based on expected runoff volumes for typical development conditions and would therefore vary considerably for different development practices, especially if using infiltration practices. These surface area criteria have been shown to result in consistent pond performance, when used with the following criteria and good design practice.
2) The freeboard storage (the storage volume above the normal wet pond surface and below the invert of the emergency spillway) should be adequate to provide for 13 mm of runoff from the watershed, for a medium density residential area. For a typical medium density residential area, a rain of about 32 mm would produce this runoff depth. For a shopping center, a much smaller rain of about 15 mm would produce 13 mm of runoff. Pond performance is very closely related to flow rates and runoff volumes. Therefore, in order to provide a constant level of protection, freeboard storage needs to be provided for the runoff volume that would result from a constant rain depth (such as for 32 mm of rain). A pond for a highly impervious watershed would therefore be much larger than for a similar sized watershed characterized with less impervious areas. Areas having relatively clayey soils (such as SCS hydrologic type D soils) would also require larger ponds than similar areas having sandy soils. However, this rain depth specification will also be sensitive to the use of on-site infiltration controls that would be needed for most developments.
3) Require a specific surface area for each stage elevation, depending on the outlet structure selected and the desired level of pollutant control. This specification regulates the detention time periods and the draining period to produce consistent removals for all rains. The ratio of outlet flow rate to pond surface area for each stage value

4-39
needs to be at the most 0.04 mm/sec for 5 µm (about 90 percent) control, 0.15 mm/sec for 10 µm (about 80 percent) control, and 0.61 mm/sec for 20 µm (about 65 percent) control. In practice, the desired pond surface area to stage relationship (simply the shape of the hole) is compared to the minimum surface areas needed at each stage for various candidate outlet structures. As an example, the following list summarizes the minimum surface areas needed to control all particles greater than 10-micrometer particles. Also shown are the freeboard storage values below each elevation:
45o V-notch 90o V-notch stage (feet)
storage (acre-ft) surface (acres)
storage (acre-ft) surface (acres)
0.5 <0.01 0.01 0.01 0.02 1.0 0.01 0.05 0.04 0.12 1.5 0.06 0.14 0.15 0.32 2.0 0.16 0.27 0.41 0.68 3.0 0.43 0.76 1.7 1.8 4.0 1.6 1.6 4.6 3.8 5.0 3.8 2.7 9.7 6.8 6.0 7.3 4.3 18 11
The large stage values are only needed for ponds having hydraulic benefits and the water quality objectives may not apply. Many alternative outlet devices could be selected, depending on the pond geometry, and still obtain relatively consistent pond performance.
4) The ponds must be constructed according to specific design guidelines to insure the expected performance and adequate safety. The guidelines need to specify such things as pond depth, side slopes, vegetation, and shape.
Summary of Detention Ponds as a Stormwater Control Detention ponds are probably the most commonly used stormwater quality devices and have substantial literature documenting their performance and problems. Wet detention ponds have been shown to be very effective, if their surface area is large enough in comparison to the drainage area and expected runoff volume. Small wet ponds and dry ponds have been shown to be much less effective. Detention ponds can be easily integrated into a comprehensive stormwater management program, but only if land is available and if installed at the time of development. They are very difficult and expensive to retro-fit into existing areas. Care must also be taken to minimize safety and environmental hazards associated with ponds in urban areas. In addition to safety concerns, contaminated sediment management and poor water quality are major issues. WinSLAMM Calculation Procedures for Wet Detention Ponds WinSLAMM calculates particulate deposition in wet detention ponds using the upflow velocity method (Linsley and Franzini 1964). Hydrograph routing through the pond is first calculated using the storage-indication procedure summarized by McCuen (1982) and as used by the RESVOR reservoir routing subroutine of the Natural Resources Conservation Service in Tech. Releases 20 and 55 (SCS 1986). Detention pond hydraulic performance is dependent on the basin inflow hydrograph, the stage-area curve of the pond, and the outfall structure. The inflow hydrograph is based on the rain being considered and the source areas. Small storm hydrology principles are used by WinSLAMM to calculate runoff volume. Related research on urban hydrograph shapes (Pitt 1987) was used to statistically describe the peak and duration of the inflowing runoff hydrograph. The model user must describe the stage-surface area relationship for each pond and select the outlet structures. WinSLAMM allows a variety of outlet structures to be used in many combinations (including rectangular weirs, various V-notch weirs, orfices, drop structures, etc.). Weir ratings are built into WinSLAMM from standard

4-40
weir formulas. In addition, the user can describe any stage-outfall velocity desired, reflecting laboratory tests, or open channels. WinSLAMM expands on the storage-indication procedure by calculating incremental upflow velocities for each calculation interval. WinSLAMM automatically determines the most efficient calculation interval. The upflow velocity is defined as the pond outfall rate divided by the pond surface area. Any particle that has a settling velocity greater than this upflow velocity will be retained in the pond. The user describes a particle size distribution for the inflowing water, which WinSLAMM uses to calculate the particle settling rates from Stoke and Newton settling equations. WinSLAMM calculates the critical particle sizes retained in each calculation interval and sums the retained particles for the complete event. Hydraulic performance of an outfall pond is also summarized by giving the peak flow rate reduction factor (PRF) and the pond flushing ratio (ratio of incoming runoff volume to normal pond volume for each event. The stan4-alone detention pond program (WinDETPOND) results in much more performance information, if desired, along with allowing the user to specify any runoff inflow hydrograph. Infiltration Benefits and Problems Associated with Stormwater Infiltration In most urban areas, stormwater is directed to subsurface drainage systems. In areas having combined sewer systems, such as in most of Europe, in the large cities of Asia, and in many older cities of the U.S., this additional water causes overflows of raw or poorly treated domestic sewage during periods of moderate to heavy rainfalls. Even in areas having separate sewerage systems, the use of conventional subsurface sewerage radically alters the receiving waters. The frequent and high flows in receiving waters causes detrimental biological conditions, causes increased erosion of channels, causes flood damage, and dramatically reduces the amount of rainfall that recharges the local groundwaters. This recharge reduction causes severe low flow problems in many areas during prolonged dry periods, further worsening the biological habitat, decreasing recreation benefits, and reducing the assimilative capacity for downstream wastewater discharges.
Infiltration techniques have been used for many years to control stormwater quality and flooding. They offer many advantages when integrated into conventional drainage systems (Azzout, et al. 1994, Novatech 1992, Novatech 1995):
• lower the costs of the sewerage systems; • limited required maintenance; • good integration in urban environment; • preservation of the hydrological balance in the environment.
The following infiltration techniques are most often used :
• reservoir structure and porous pavements; • drainage trenches; • infiltration wells; • dry basins.
Upland infiltration devices are located at urban source areas and can significantly reduce both stormwater runoff volume and contaminant contributions from the treated areas to the receiving waters. All infiltration devices redirect runoff waters from the surface to the sub-surface environments. Therefore, they must be carefully designed using sufficient site specific information to protect the groundwater resources and to achieve the desired water quality management goals.
With development, natural groundwater recharge is reduced, with increased surface water flows during wet weather and significantly reduced surface water flows (that rely on groundwater discharge) during dry weather. The use of infiltration can help maintain the natural groundwater recharge in an urbanizing area and maintain adequate receiving water base flows during critical dry weather periods.

4-41
The Lake Tahoe (California/Nevada) Regional Planning Agency has developed a preliminary set of design guidelines for infiltration devices (Lake Tahoe 1978). They recommend the use of infiltration trenches to collect and infiltrate runoff from impervious surfaces, such as driveways, roofs, and parking lots. A secondary objective of infiltration devices in the Lake Tahoe area is to reduce soil erosion caused by high runoff flow rates. The Ontario Ministry of the Environment (1984) also included infiltration devices in its general stormwater management plan.
Beale (1992) described numerous methods to reduce problems in storm drainage. The traditional approach had been for the rapid removal of stormwater from a development to the nearest watercourse or sewer system. This approach cannot continue due to the high economic and social cost associated with upgrading existing sewerage and/or increased flooding in urban areas. Three main options are: 1) reduce flows entering the drainage system, 2) increase the capacity of the drainage system (the traditional approach), or 3) attenuate flows within the drainage system. The methods available include, indicating the role that infiltration has, especially in conjunction with storage:
to reduce incoming flows:
• Diversion • Infiltration (plane infiltration, basin infiltration, soakaways, infiltration trenches, or infiltration boreholes) • Control flows entering drainage (rooftop detention, control in down pipes, control in gully outlets, control by gully spacing
to attenuate flows in drainage:
• Attenuation in drainage (surface flooding, oversize sewer, on-line tank, off-line tank, storage ponds, or tank design) • Attenuation in watercourse (on-line storage ponds, or off-line storage ponds)
Numerous recent papers describe the successful use of stormwater infiltration throughout the world. Musiake, et al. (1990) described the use of shallow infiltration facilities is Tokyo, and Stenmark (1990) described the use of infiltration facilities in cold climates. Other stormwater infiltration experience has been described by Wada and Miura (1990), Harada and Ichikawa (1993),Yamada (1993), and Duchene, et al. (1993). The Technical University of Denmark has recently conducted numerous research projects concerning the benefits of infiltration as a source area control to reduce combined sewer overflows (Geldof, et al. 1994; Mikkelsen, et al. 1994; Rosted Petersen, et al. 1994; and Jacobsen and Mikkelsen 1996). Rosted Petersen, et al. (1994), for example, found that the optimal solution for reducing CSO volumes by 40% required infiltrating 65% of the paved areas using infiltration trenches having total storage volumes of 3.6 mm. This corresponds to a return period of 0.04 years (about 2 weeks), in contrast to the commonly applied design return periods of 2 to 10 years.
Geldof, et al. (1993) describe many stormwater problems that can be reduced by using infiltration. The Experimental Sewer System (ESS) in Tokyo includes many infiltration components (infiltration inlets, infiltration trenches, infiltration curbs, and permeable pavements) and has significantly reduced the amount and frequency of urban flooding (Fujita 1993). The ESS has reduced the stormwater peak flows by 60% and runoff volume by 50%, compared to conventional storm sewerage systems. Furthermore, the cost of the ESS is about 1/3 of the cost of conventional detention facilities, and only about 1/10 of the cost of underground detention facilities. The infiltration trenches used as part of the ESS have been easily installed in parks and alongside roads, with little interference to the intensive use of the land. Figure 4-8 is a schematic showing the major components of the ESS.

4-42
Figure 4-8. Major components of the Experimental Sewer System (ESS) in Tokyo, Japan (Fujita 1990). The main purpose of stormwater infiltration in Tokyo has shifted away from improving the conveyance of stormwater (flood prevention, soil erosion prevention, and reduction of pollution discharges) to restoring groundwater (maintenance of river base flows, prevention of heat island effects, and prevention of ground subsidence) (Fujita 1993).
The ESS is likely the largest stormwater infiltration enterprise in the world today. It is made possible by the large infiltration capacity of Tokyo area soils and the knowledge of the limitations of alternatives (Fujita 1993). Detention basins had been used in newly developing housing complexes to reduce the stormwater flow rates to sewerage, but they were much more expensive than the use of infiltration. Infiltration also has the great benefit of re-directing stormwater away from the sewerage for groundwater recharge, instead of just delaying the discharge of the runoff into the sewerage. Japanese sewerage authorities made a landmark change in policy, with a new emphasis on “reducing stormwater runoff” volume, instead of the traditional goal of “draining stormwater quickly through sewer pipes” (Fujita 1993).
The ESS includes the following components in Tokyo (from 1981 to 1992): length of sewers 337 km
area served by ESS 1,329 ha population served by ESS 166,000 number of infiltration inlets 30,994 length of infiltration trenches 201 km length of infiltration curbs 70 km permeable pavement area 450,000 m2 cost of construction $US 493 million

4-43
The ESS concept has been now employed in many other Japanese cities, in addition to other areas in Tokyo. The total area of permeable pavement in Tokyo is about 3,740,000 m2 as of 1990 (about 2.5% of the total road area in the city). Parking lots in public areas are commonly covered with permeable pavement, in addition to private parking lots. Efforts are also being made to encourage stormwater infiltration in public areas (such as at schools, athletic stadiums, tennis courts, etc.). The total estimated infiltration effort in Tokyo (in addition to the ESS) is summarized below (1981 to 1989):
permeable pavement area 3.74 km2 length of infiltration trenches 571 km number of infiltration inlets 86,000 length of infiltration curbs 145 km Fujita (1994) further describes the Tokyo ESS. All footpaths are now made using porous pavements in Tokyo and some of the paver blocks are being made using ash from incinerated sewage sludge. Residents like the porous pavement walkways because no puddles form and they are not slippery. About 15,000 of these soakaways have been built in the City of Koganei (about 15 km west of central Tokyo) in the 10 years preceding 1993. As a result, many of the natural springs, which had previously dried up with conventional storm drainage use, have been revived. The extensive use of soakaways also decreases the amount of stormwater entering sewerage, enabling reductions in pipe sizes, but that has not been implemented as yet.
The infiltrating inlet is made using two adjacent small tanks. The first tank contains the inlet to the street and has a perforated plastic bucket to capture large debris, plus a grit chamber (“mudpit”). The overflow goes into the second small tank that has a perforated bottom for infiltrating stormwater. The bottom of the tank is open, but filled with gravel atop which is placed two semi-circular plates made of porous concrete to act as a filter to minimize clogging. If the runoff entering the infiltration inlet exceeds the infiltration capacity of the inlet, the excess water flows to infiltration trenches connected to the tank, up from the bottom. The ends of the infiltration trenches are covered with stainless steel screening to further minimize the entry of clogging particles into the trenches. If the runoff flow exceeds the total infiltration capacity of the whole inlet system, then the overflow enters the sewerage pipe. They have found that cleaning the perforated basket and the mudpit twice a year is sufficient to prevent clogging. They have not needed to clean any infiltration trench, as none have clogged in the ten years of operation.
Infiltration curbs are placed along both sides of streets to allow additional stormwater infiltration. The L-shaped curb is made using porous pavement if possible, although the porous concrete curb cannot withstand the weight of large vehicles. In areas where heavy vehicles are likely, normal concrete curb pieces are used. Any stormwater infiltrated through the curb is carried in the U-shaped trough which is porous or perforated.
Infiltration also improves the receiving water quality in areas served by either combined or separate sewers (Geldof, et al. 1993). Decreased amounts, frequencies, and durations of overflows from combined systems have dramatically lowered the discharges of many pollutants. The number of overflows in combined sewers in Tokyo have decreased from about 36 per year to about 7 in areas served by the ESS. The resulting BOD discharges have also been reduced by about 45%. Phosphorus and heavy metals in separate sewer discharges can be substantially reduced with the widespread use of infiltration (Hvitve4-Jacobsen, et al. 1992).
Wada and Miura (1993) constructed a field test site to measure the effects of the different infiltration devices being used in Tokyo. The test site included four permeable pavement lengths, two lengths of infiltration trench, an infiltration roadside gutter, and seven infiltration street inlets. Detailed runoff and subsurface flow measurements were made during artificial rains for a variety of conditions. They produced a model that accurately simulated observed runoff values. An interesting conclusion was that groundwater had significant influence on the infiltration rates of the devices if it was within 1.5 m from the bottom of the infiltration devices.
Herath and Musiake (1994) developed and tested a stormwater model in Tokyo that successfully simulated complex arrangements of infiltration systems on a watershed scale. A lumped model was produced that accurately reproduced both flow volumes and hydrographs in areas having infiltration facilities.

4-44
The most difficult problems related to the Tokyo infiltration facilities have been clogging and groundwater contamination (Fujita 1993). A high-pressure water jet has been successfully used to restore clogged permeable pavements, along with other measures to protect the devices. Groundwater monitoring has been conducted for ten years in the ESS area, with no indication of groundwater contamination. However, efforts to improve service life and to protect groundwater quality are continuing.
Groundwater recharge is also an important benefit of infiltration (Geldof, et al. 1993). The Netherlands experiences sinking groundwater tables, with the deterioration of nature reserves and the drying out of moorlands during periods of drought. Infiltration of stormwater has been shown to be a viable alternative in recharging the groundwaters, compared to restrictions in domestic water pumping and prohibiting irrigation in urban areas.
Other benefits of infiltration, according to Geldof, et al. (1993) include preventing salt water intrusion in coastal areas, preventing consolidation of soils near buildings, and reducing damage from frost penetration.
This radical alteration of the local hydrologic cycle has prompted the use of infiltration of stormwater to mitigate these affects. As an example, Krijci, et al. (1993) described the mandatory use of stormwater infiltration in Switzerland to decrease the burden on combined and separate sewerage systems. The 1992 Swiss Water Pollution Control Law requires that unpolluted wastewater must be infiltrated. If local conditions prevent infiltration, then special authorization is required and detention is used. A simple system is used to determine the suitability of stormwater for infiltration, depending on the area drained and the use of the groundwater. As an example, runoff from roofs, bike lanes, and walking paths must be infiltrated in all areas, even if the groundwater has high importance as a drinking water source. Surface infiltration is required (and subsurface infiltration is prohibited) for this runoff in most drinking water protection zones. The infiltration of roadway and parking area runoff is more restricted, where only surface infiltration is allowed for all areas. Any infiltration of highway and freeway runoff is only allowed in exceptional situations. In all cases, “clean” water (runoff from yard drainage, spring water, groundwater, and cooling water) is forbidden in combined sewers.
Conradin (1995) describes how Zurich is complying with the Swiss Water Pollution Control Law. The city has 50 to 100 year old sewerage, about 80% being combined sewerage and 20% being separate sewerage. Clean flows (fountain water, spring water, yard drainage, cooling system water, and possibly roof runoff) are required to be diverted from the sewerage. All other stormwater will be directed to the combined sewerage and newly renovated treatment plants. The city is converting its system to a partially separate system that collects the clean water and directly diverts it to the Limmat River. Zurich is building open brooks along streets and walkways to collect these waters. The open brooks provide natural water channels and aesthetically revitalizes the urban area. About 12 km of brooks have been built as of 1995, and as much as 30 km total are planned. The current brooks divert about 150 L/sec from the sewerage. The brooks are designed to carry about two to five times the dry weather flows, with excess diverted to the sewerage and the treatment plants.
Payne and Davies (1993) describe the Manual on Infiltration Methods for Stormwater Source Control recently developed by the National Rivers Authority in the UK. This manual takes a careful approach to protect groundwater quality. Infiltration policies of about 20% of the local governments surveyed in the UK prohibit, or strongly discourage, the use of stormwater infiltration, while about 45% encourage its use, with reservations. Soakaways are the most common method of stormwater infiltration in the UK. The perceived benefits of soakaways are reduced burden on the sewer system, followed by lowered cost and ease of construction. Perceived disadvantages include the dependence on local soil conditions for their success, the lack of precise design methodologies, and uncertain maintenance responsibilities. The protection of groundwater is a high priority in the Manual, even though “environmental friendliness” was not a highly ranked issue when surveying the local governments. Roof runoff is acceptable for infiltration for all groundwater protection zones, while infiltration of runoff from paved areas is restricted generally directly related to the amount of automobile activity. Infiltration of runoff from industrial areas and from vehicle service areas is most restricted and requires pretreatment, at least, even in the least protected groundwater zone. They found that biofiltration controls offer a viable option for pretreatment of runoff before infiltration, but their success greatly relies on long-term maintenance.

4-45
Pratt and Powell (1993) describe a new approach for infiltration trench designs for the UK, developed by the Building Research Establishment. This is a reasonable storage/treatment approach, and relies on site investigations of soil properties. Soil infiltration rate measurements are made in relatively large test excavations of 0.3 to 1 m in width and 1 to 3 m in length, and of similar depth as the final infiltration device. Infiltration through the trench bottom is assumed to be insignificant due to clogging (as also assumed by many other trench designers), with all infiltration occurring through the upper half of the trench sides. This provides a conservative infiltration area that attempts to estimate long-term infiltration trench performance. Rains with 10-year return frequencies are used in this design in order to provide significant relief to storm sewerage for critical flooding events. BRESOAK software was developed to enable the investigation of alternative trench geometries. In most cases, the most effective trench design is determined to be long, narrow, and relatively deep, similar in geometry as many of the trenches in the successful Tokyo ESS. In some areas, these trench shapes are not allowed. Wisconsin, for example, requires all trenches to be wider than they are deep to maximize the amount of infiltration occurring through surface soils to increase soil aquifer treatment (SAT) of the infiltrating stormwater in order to minimize groundwater contamination.
Candaras, et al. (1995) describe an exfiltration and filtration demonstration project in Etobicoke, Ontario, near Toronto. The exfiltration system was developed to eliminate the discharge of stormwater for frequent rains, while improving the function of traditional drainage systems. The City of Etobicoke adopted a new stormwater management concept that promotes three levels of control:
1) Major drainage system (overland flow) designed to transport runoff from large and infrequent rains (such as the 100 year storm), 2) Minor drainage system (typical stormwater conveyance system) designed to transport the runoff from smaller and more frequent rains (such as the 2 and 5 year storms), and 3) Micro drainage system designed to eliminate runoff form the very frequent rains (such as rains of about 10 to 15 mm in depth).
The city developed two basic devices, currently being tested to accomplish these goals. The exfiltration system is a pair of small diameter, perforated PVC pipe that is installed below conventional storm drainage pipe. All three pipes run from manhole to manhole, but the perforated pipes are plugged at the downstream end to eliminate short-circuiting. The pipe trench is wrapped in a geotextile and back filled with 15 mm clear stone. If the storm exceeds the capacity of the stone, the excess water flows through the conventional pipe. The filtration system uses a perforated PVC pipe located above the conventional pipe, with both ends plugged. The catchbasin inlet has a lower outlet that directs runoff to the perforated pipe. The clear stone trench lining acts as a filter for the percolating water, which is picked up by another series of two perforated pipes located under the conventional pipe and connected to the lower manhole. If the filter capacity is exceeded, water flows out of the upper outlet from the catchbasin directly into the conventional pipe. Preliminary monitoring has shown that the test devices have performed better than expected.
A recurrent theme in the literature is concern for lack of appropriate design guidelines for infiltration practices (Petersen, et al. 1993). Very little design guidance for specific stormwater infiltration practices existed for Europe before 1991. Somewhat more guidance had been available in the U.S. However, much of the U.S. guidance had been transferred from other areas of the country having greatly different rainfall, topographic, soil, and frost conditions, with little mo dification. In addition, long-term performance information on infiltration practices is also limited. This makes predictions of useful life very difficult. The high failure rate of many types of infiltration practices, mostly associated with lack of any maintenance, is also of great concern, along with concerns of groundwater contamination. However, the extensive and successful use of stormwater infiltration in Tokyo, and elsewhere, plus the absence of groundwater contamination problems from stormwater infiltration for most areas, indicates that stormwater infiltration is feasible in many situations. Newer guidelines (such as described by Pratt and Powell 1993) also offer a uniform and reasonably conservative approach for the design of infiltration devices. The goal is to identify those conditions where stormwater infiltration is most likely to be successful, stress the use of robust infiltration practices (such as grass swales), be conservative in useful life estimates, provide appropriate pretreatment, and ensure adequate maintenance. It is important to use alternative stormwater controls (such as detention and biofiltration) in areas and situations that are marginal for infiltration.

4-46
General Infiltration Practices Infiltration Device Performance Reported in the Literature The Long Island and metropolitan Washington D.C. NURP projects (EPA 1983) examined the performance of several types of infiltration devices. The Long Island project studied a series of interconnected percolating catchbasins which were found to reduce stormwater discharges by more than 99 percent. The Washington D.C. study found that porous pavement reduced the pavement pollutant runoff loadings by 85 to 95 percent, while an infiltration trench reduced urban runoff flows by about 50 percent. The EPA concluded that, with a reasonable degree of site specific design considerations to compensate for soil characteristics, infiltration devices can be very effective in controlling urban runoff. Local conditions that can make recharge inappropriate include steep slopes, slowly percolating soils, shallow groundwater, and close-by important uses of the groundwater.
Modernizing the combined sewerage system in Tündern a suburb of Hameln, Germany, is necessitated by extensive growth during the 25 years since the current system was constructed (Adams 1993). Conventional methods would require replacement of about 40% of the sewer, plus construction of detention basins. However, the depth to groundwater (at least 2.5 m below the ground surface), plus the sandy soil, encouraged the investigation of de-centralized infiltration as an alternative. Design calculations indicate that the flooding frequency would decrease by about half, and that the COD discharges would be decreased by about 45% by using stormwater infiltration. The infiltration option would help restore the natural hydrologic cycle and reduce current problems at a much reduced cost.
An extensive report was prepared by Kuo, et al. (1989) on infiltration trenches. This report included an examination of the theoretical behavior of infiltrating water, and it presented the results of laboratory model studies.
Summary of Infiltration Devices as Stormwater Controls Infiltration devices are unique in that they reduce stormwater volumes, in addition to peak flow rates and pollutant discharges. They discharge the stormwater to the groundwater and care must be taken to prevent groundwater contamination. Significant reductions in most pollutants occur in the vadose zone above the saturated layer. However, some stormwaters should not be considered for infiltration, including snowmelt water (especially in areas of de-icing salt use), industrial runoff (due to likelihood of high concentrations of filterable toxicants), and construction site runoff (due to clogging by sediment). The majority of stormwater flows can likely be safely infiltrated with significant reductions in surface water discharges and important equalizations of the hydrological cycle in urban areas. Pratt (1996) describes the current widespread installations of “soakaways” in the UK (tens of thousands per year), despite the extensive storm drainage systems available. Most are used for infiltrating runoff from small paved areas and roofs. Unfortunately, little systematic research has been conducted on their benefits and problems. Schmitt (1966) also describes current German regulations favoring the use of infiltration controls for stormwater located at source areas to reduce combined sewer problems.
WinSLAMM Calculation Procedures for Infiltration Devices Infiltration devices are assumed to affect water volume, but not pollutant concentrations. As the water volume is reduced, the pollutant yield is obviously decreased. WinSLAMM calculates the runoff volume reductions for each source area (served by an infiltration device) for each individual rain in the study period. Runoff volume reduction is assumed to be equal to: volume reduction = (Pr/Rr) (As/At)
where Pr is the percolation volume rate, Rr is the runoff rate to the device, As is the area served by the device, and At is the total study area. The ratio Pr/Rr used in this equation can never be greater than 1.0. The percolation volume rate is the capacity of the infiltration device to infiltrate runoff, expressed as:

4-47
Pr = (1 + 0.67/width to depth ratio) (percolation rate)(percolation area) The side walls of an infiltration trench have 0.33 of the infiltration capacity as the trench bottom, reflected in the 0.67 factor in the equation (assuming two side walls). The runoff rate is the flow rate of water entering the infiltration device: Rr = runoff volume / runoff duration The runoff volume for the source area is calculated using the procedures described in Section 3, or basically the event volumetric runoff coefficient times the area served times the rain depth. The runoff duration is the base of the inflow hydrograph and is calculated using the regression equation derived by Pitt (1987): Runoff duration = 0.90 + 0.98 (rain duration), expressed in hours An example of use of this procedure follows: Percolation rate = 3 in/hr Total rain = 1.7 in Rain duration = 6 hours Volumetric runoff coefficient = 0.35 Area served by infiltration trench = 1.3 acres Total area in study = 5.6 acres Trench bottom area (percolation area) = 5500 ft2 Trench width/depth ratio = 2 Therefore: runoff volume = 0.35 (1.7 in)(1.3 acres) = 0.774 ac-in runoff duration = 0.90 + 0.98(6 hours) = 6.78 hours and Rr = 0.774/6.78 = 0.114 ac-in/hr = 0.115 ft3/sec. Pr = [1 + 0.67/2] (3 in/hr) (5500 ft2) (ft/12 in) (hr/3600 sec) = 0.510 ft3/sec. Therefore Pr/Rr = 0.51/0.114 = 4.434 which is greater than 1.0, so 1.0 must be used in the equation. (The infiltration trench is oversized for this event: all of the runoff from the service area is infiltrated.) The study area volume reduction performance is therefore: 1.3 acres/5.6 acres = 0.23. (23 percent of the runoff and pollutant yield are infiltrated). Grass Swales and Grass Filter Strips Grass swale drainages can be used in place of concrete curb and gutter drainages in most land uses, except strip commercial, manufacturing industrial, and high density residential areas. Grass swales reduce urban runoff problems by a combination of mechanisms. Infiltration of the runoff and associated pollutants is probably the most important process. Filtering of particulate pollutants in grass waterways may also occur, but the flows are usually too large (and deep) to permit effective filtering by the grass. Groundwater contamination concerns are frequently raised whenever stormwater infiltration is proposed. Pitt (1996) reported that groundwater contamination is not a major concern for most stormwaters, if using surface spreading (such as occurs in grass swales). Lind and Karro (1995) also recently reported on the accumulation of stormwater pollutants in the surface soils of swales, minimizing groundwater contamination problems.
Performance of Grass Swales and Filters as Reported in the Literature

4-48
Several large-scale urban runoff monitoring programs have included test sites that were drained by grass swales. Bannerman, et al. (1979), as part of the International Joint Commission (IJC) monitoring program to characterize urban runoff inputs to the Great Lakes, monitored a residential area served by swales and a similar residential area served by concrete curb and gutters in the Menomonee River watershed in the Milwaukee area. This monitoring program included extensive flow and pollutant concentration measurements during a variety of rains. They found that the swale drained area, even though it had soils characterized as poorly drained, had significantly less flows and pollutant yields (up to 95 percent less) as compared to the curb and gutter area.
The ability of grass swales to reduce source area sheetflow pollutant concentrations was also monitored by the Durham, New Hampshire NURP project (EPA 1983). A special grass swale was constructed to treat runoff from a commercial parking lot. Flow measurements were not available to measure pollutant yield reductions, but pollutant concentration reductions were found. Soluble and particulate heavy metal (copper, lead, zinc, and cadmium) concentrations were reduced by about 50 percent. COD, nitrate nitrogen, and ammonia nitrogen concentrations were reduced by about 25 percent, while no significant concentration reductions were found for organic nitrogen, phosphorus, and bacteria.
Wang, et al. (1980) monitored the effectiveness of grass swales at several freeway sites in Washington. They found that 55 to 75 m of grass swale removed most of the heavy metals in the runoff. Lead was more consistently and effectively removed than the other metals, possibly because of its greater association with particulates in the runoff. Lead concentration reductions, with 55 m grass swales, were typically 80 percent, or more, while copper was reduced by about 60 percent, and zinc was reduced by about 70 percent. They concluded that it may be necessary to remove the contaminated sediments and replant the grass periodically to prevent the dislodgment of the deposited polluted sediment. Part of the swales monitored by Wang, et al. (1980) were bare earth lined. Pollutant concentrations were not found to be effectively reduced in these sections, and the earth lining was not contaminated. Again, infiltration effects on flow volumes and pollutant yields were not monitored, and the concentration observations were only affected by grass filtration.
A project to specifically study the effects of grass swale drainages was also conducted in Brevard County, Florida by Kercher, et al.(1983). Two adjacent low density residential areas, about 5.6 ha in area and having about 50 homes, were selected for study. One area had conventional concrete curbs and gutters, while the other had grass swales for roadside drainage. The two areas had very similar characteristics (soils, percentage imperviousness, slopes, vegetation, etc.). Thirteen rains were monitored in the areas for flow and several selected pollutants. The curb and gutter area produced runoff flows during all 13 events, while the grass swale area only produced runoff during three events. Estimated annual pollutant yields from the curb and gutter area were much greater than for the grass swale area. BOD5 annual discharges from the guttered area were estimated to be about 130 times the discharges from the swale area. Yield increases from the guttered area as compared to the swale area for some other pollutants were reported as follows: 160 times for total nitrogen, 450 times for total phosphorus, and 90 times for suspended solids. The grass swale system also cost about one-half the cost of the curb and gutter system.
In another large scale urban runoff monitoring project, Pitt and McLean (1986) monitored a residential area in Toronto served about evenly by both swales and concrete curbs and gutters. The pollutant concentrations in both types of drainage systems were similar, but the area had annual flows (and therefore pollutant yields) about 25 percent less than if the area was served solely by curbs and gutters. For small but frequent rains (less than about 13 mm), very little runoff was observed in the grass swales. If the area had all grass swales, the flow and pollutant yields would have been even less.
Schueler (1996) summarized grass swale performance literature and related pollutant reductions to drainage swales or water quality swales. The water quality swales had appreciable concentration and mass reductions, mainly by enhancing infiltration through the swale bottom, widening the bottom width of the swale, providing a subsurface infiltration trench under the swale, or even by planting wetland plants in a swale that was in an area that has a high groundwater table. The drainage channels provided little concentration reductions, but some had significant mass reductions due to infiltration. In all cases, more care can be taken in designing swales to enhance their water quality performance, while still providing necessary drainage benefits. Claytor and Schueler (1996) have published a manual for designing water quality swales (along with other stormwater filtering systems).

4-49
Yu, et al. (1993) constructed and monitored a grass filter in Charlottesville, VA. A 4 ha paved commercial area drained to the 3,800 m2 grass filter. Stormwater was directed to the grass filter via an infiltration trench and a level spreader. The level spreader system cost about $15,000 (1986). The filter had moderate removals for suspended solids (54 to 84%), total phosphorus (25 to 40%), and zinc (47 to 55%), but only poor removals for nitrate nitrogen (-27 to 20%) and lead (-16 to 55%).
Summary of Grass Swales for Stormwater Control Grass swales (and grass filters in general) may be an effective stormwater control practice to reduce pollutants before the stormwater is discharges. Grass swales are inexpensive compared to conventional curb and gutter systems, but their use is restricted to areas that have relatively low density developments. In addition, current design and construction practices for grass swales are very poor, leading to many problems with maintenance. Much greater care needs to be used in the utilization of grass swales.
Grass Swale Performance Calculations in WinSLAMM WinSLAMM calculates the performance of grass swales in a similar manner as other infiltration devices, by assuming (Pr/Rr) (As/At) as indicative of swale infiltration. WinSLAMM calculates runoff volume entering the swale as the addition of all upland source area flows. The water percolation rate in the swale is calculated by: Pr = (dynamic percolation rate) (percolation area) where the percolation area is simply the swale length times the swale width. The percolation rate in the swale is for dynamic flow conditions and is generally about ½ of the typically measured static infiltration rate (Wanielista, et al. 1983). This procedure is generally independent of swale routing: it assumes that the water is in the swale long enough to be infiltrated. “Long” swales serving “small” service areas encourage infiltration. Grass filters include infiltration as a function of flow distance for different slopes and infiltration rates and can therefore be used to estimate needed flow length in swales (Pitt 1985 and 1987). Obviously, swale design (like all other controls) must be carefully done to encourage performance. As an example, these procedures would not be appropriate for steep swale gradients. The ratio of area served by swales to total area therefore needs to be reduced if steep swales are present, or if the swales are “short.” The swale length is calculated from the swale density times the area served by swales. Typical swale density values for different land uses are as follows (Pitt and McLean 1986): Land Use Swale Density (ft/acre) . Low density residential 160 Medium density residential 350 High density residential 375 Strip commercial 630 Shopping centers 280 Industrial 125 . Of course, not all of these land uses, especially high density residential or strip commercial areas, are suitable for grass swales. Again, the selection and design of any control practice must be carefully done. An example of the calculations for swale performance follows: Total contributing area flows = 1140 ft3

4-50
Rain duration = 5.5 hours Dynamic percolation rate in swale = 3.5 in/hr (1/2 of measured static infiltration rate) Swale density = 350 ft/acre Wetted swale width = 5 ft Area served by swales = 1.5 acres Study area = 3.3 acres Therefore the runoff duration = 0.90 + 0.98 (5.5 hours) = 6.29 hours, and: Rr = 1140 ft3/6.29 hrs = 181 ft3/hr = 0.05 ft3/sec Pr = (3.5 in/hr)(350 ft/acre)(1.5 acre)(5 ft)(hr/3600 sec)(ft/12 in) = 0.21 ft3/sec Therefore Pr/Rr = 0.213/0.05 = 4.26, which is greater than 1.0 and the swale is larger than necessary for this rain (total infiltration). The study area runoff reduction is therefore 1.5 acres/3.3 acres = 0.46 (46 percent reduction in flows and pollutant yields due to the swales). Porous Pavements Porous pavement is a “hard” surface that can support a certain amount of activity, while still allowing water to pass through. Porous pavement is generally used in areas of low traffic, such as service roads, storage areas, and parking lots. Several different types of porous pavement exist. Open mixes of asphalt appear to be similar to regular asphalt, but only use a specific size range of rocks in the hot mix. The porosity of the finished asphalt is much higher than regular asphalt, if properly designed and constructed. Concrete grids have open holes up to several cm wide, possibly containing sand or gravel. It is possible to plant grass in the holes, if traffic is very light and if light and moisture conditions are adequate. Recent tests have found few problems with porous pavement in areas having severe winters. They can be designed to eliminate all of the runoff from paved areas.
Performance of Porous Pavements as Reported in the Literature Porous pavements can be effectively used in areas having soils with adequate percolation characteristics. The percolation requirements for porous pavements are not as critical as they are for other infiltration devices, unless runoff from other areas is directed towards the paved area. The percolation of the soils underlying the porous pavement installation only need to exceed the rain intensity directly. In most cases, several cm of storage is available in the asphalt base to absorb short periods of very high rain intensities. Diniz (1980) states that the entire area contributing to the porous pavement can be removed from the surface hydrologic regime.
Gburek and Urban (1983) studied a porous pavement parking lot in Pennsylvania. They found that percolation below the pavement occurred soon after the start of rain. For small rains (less than 6 mm), no percolation under the pavement was observed, with all of the rain being contained in the pavement base. Percolation during large rains was equal to about 70 to 90 percent of the rainfall, resulting in similar runoff flow and pollutant reductions of 70 to 90 percent. The differences between the rain amounts and the observed percolation quantities were caused by flash evaporation (not estimated) and storage in the asphalt base material.
Goforth, et al. (1983 and 1984) evaluated a porous pavement parking lot in Austin, Texas over several years under heavy traffic conditions. Infiltration rates through the pavement averaged about 45 m per hour, while the 50 mm pavement base had an infiltration rate of about 1,800 mm per hour.
Day (1980) conducted a series of laboratory tests using several different types of concrete grid pavements. The geometry of the grid was more important than the percentage of open space in determining the ability of the grid to absorb and detain rainwater. The volumetric runoff coefficients from the grids ranged from 0.06 to 0.26 (resulting in runoff volume and pollutant reductions from about 75 to 95 percent) depending on the rain intensity, ground slope, and subsoil type.

4-51
Numerous recent papers have described successful applications of porous pavements throughout the world. Niemczynowicz and Hogland (1987) describe tests of porous pavements in Sweden. Hogland (1990) gave an overview of porous pavement use in the U.S. and in Sweden. Pratt (1990) described design and maintenance issues, Nawang and Saad (1993) and Sztruhar and Wheater (1993) presented results of experimental field tests of porous pavements, and Fujita (1993) described the extensive use of porous pavements as part of the Experimental Sewer System in Tokyo.
Recent work at the University of Guelph in Ontario (Thompson and James 1995) has found that porous pavement systems can also be effective filters to remove particulate pollutants from the runoff, even with an underdrain that captures the runoff after pavement percolation. Runoff from typical pavement also had greater masses of pollutants than runoff from the porous pavements. Porous pavement research at the University of Essen in Germany (personal communication, Wolfgang Geiger 1995) also found significant water quality benefits from using porous pavement systems. However, Diniz (1993) measured the water quality of underdrain water from different porous pavement systems, gravel trenches located on the edge of an asphalt area, and conventional asphalt and concrete pavement during controlled sprinkler tests. Lead concentrations were about the same for all surfaces (12 to 25 µg/L, flow-weighted averages), while zinc (20 to 90 µg/L for porous pavements, vs. 7 to 12 µg/L for conventional pavements) and TKN (1.4 to 2.2 mg/L for porous pavements, vs. 0.5 to 1.3 mg/L for conventional pavements) were all higher for the porous pavement drain waters, compared to the conventional pavement runoff. Some, but not all, of the suspended solids and COD porous pavement drainage water concentrations were greater than for the conventional pavement runoff. The few data presented make conclusions uncertain, but it is likely that porous pavement may contribute some pollutants to the water, while removing others. In all cases, the amount of runoff diverted from the surface flows can be very large.
Recent French experiments in Nantes, Bordeaux and Paris have shown that porous pavements (with substantial subsurface reservoir capacity) were very efficient in reducing the pollutant loads discharged into the receiving water (Baladès, et al. 1995a and 1995b). These French studies have shown that the pollutant removal efficiencies of suspended solids can be between 50 and 70%, between 54 and 89% for COD, and between 78 and 93% for lead. These reductions were associated with the high amount of infiltration of water, and associated pollutants, through the pavements, away from the surface drainage. These experiments confirm results from previous studies in other countries (Hogland, et al. 1987, Pratt, et al. 1989, Pratt, et al. 1995).
Analyses of samples taken at the outlet of porous pavement structures by Baladès, et al. (1995a and 1995b) have shown that the discharged water met the French national standards for raw waters to be used for drinking water supplies, and that there were no problems that would restrict this water from being infiltrated directly into the ground.
The use of porous pavements in cold climates was investigated by Stenmark (1995) in northern Sweden. A 3.3 ha drainage area was modified because of existing problems associated with frost heaves and ice blocking the conventional drainage system. A porous pavement was installed over a thick subbase having a drainage pipe to remove excessive water. The width of the streets were also reduced to accommodate wider roadside grass swales, and the street surface was re-shaped to eliminate backwater problems. During preliminary observations, much less snowmelt water (about 30 to 40% of the accumulated water content of the snow, instead of close to 100%) originated from the area than from conventionally paved areas. Infiltration measurements in frozen soils indicated infiltration rates of about 0.004 mm/min (0.01 in/hr) to 5 mm/min (12 in/hr) for silts and sands. Increased water content in the frozen soil decreased the infiltration rates. Frost heaving was also reduced because the road materials were more homogeneous (no manholes, gutters, or shallow pipes were used), with less differences in heat properties. Frost heaving was more pronounced in a special test area having a thinner subbase. They concluded that the subbase should be at least 0.6 m thick.
The primary objective of using porous pavements is to mimic natural flow and infiltration conditions as closely as possible. It is therefore very important to pay attention to the following aspects to reduce groundwater contamination potential (Pitt 1996):
• depth to groundwater; • groundwater uses;
4-52
• risks due to industrial activities in the catchment; • use and traffic levels on the porous pavement; • use of de-icing salts on the street.
Maintenance of Porous Pavements Clogging of porous pavements is only a superficial phenomenon (typically extending to a depth of about 1 to 2 cm). Progressive clogging with time is caused by an increase of accumulated solids in the first few centimetres of the pavement and not to the mo ving of the clogging front within the pavement structure. The decrease in permeability in porous pavement may cause a drop by about 50% over three years. The mean diameter of the particles which are responsible for this clogging is about 300 µm. For sites where there is only a thin porous pavement layer above an impervious structure layer, it has been observed that the mean diameter of the clogging particles is finer, with about 30% of the particles responsible for the clogging being finer than 100 µm. Typical street dirt mean particle sizes are in the range of 200 µm, indicating that the particles responsible for the clogging are very common. Particles in these sizes are also suitable for effective removal by most conventional street cleaning operations. The masses of particles extracted from porous pavements depend on the use of the street, on the traffic intensity, on the cleaning equipment used and on the cleaning frequency. However, the amount of extracted particles is always very high: 0.2 to 1.5 kg/m2. The highest value has been measured several times in residential streets which have not been cleaned during the last 2 or 3 years (Artières1987). The masses of particles extracted from impervious streets range between 0.5 and 2 kg/m2, depending on the s ite, on the cleaning frequency, and on the cleaning machine. As shown by several authors (Sartor, et al. 1974, Novotny, et al. 1985, Artières 1987), 50 to 80% of the mass of particles accumulated on streets are located near the curb for light parking conditions. The curb-side loading decreases as the parking density increases (Pitt 1979). It is very important to be able to efficiently clean the part of the street where the street dirt is located. Cleaning in the driving lanes may also be needed in areas where parking conditions are intense. The street surface texture, the street dirt loading, the parking conditions, and the street cleaning equipment operating conditions all have a significant effect on the cleaning efficiency. Severe porous pavement clogging will require very powerful cleaning techniques, whereas regular cleaning with usual techniques should be satisfactory to keep the porous pavement surface in a relatively good state.
Summary of Porous Pavement Control Benefits For porous pavements subjected to traffic below 100 vehicles/day, and especially for parking lots, monthly cleaning by vacuuming is sufficient to keep an almost constant infiltration capacity. If clogging is already evident, a stronger cleaning technique using high pressure water jetting and vacuuming is necessary. Techniques which recycle the cleaning water are obviously preferred in order to avoid flushing of the pollutants to the receiving water. In all sites where measurements have been carried out, the extraction was very efficient and the porous pavement infiltration capacity was usually well restored. Bertran4-Krajewski, et al. (1994), in a comparative study of available street cleaning techniques, showed that they have the following ability to improve infiltration through partially clogged porous pavements (cm/s enhanced infiltration capacity after cleaning):
• simple wetting and sweeping (<0.01 cm/s); • sweeping and vacuuming (0.13 cm/s); • vacuuming (0.28 cm/s); and • high pressure jetting and vacuuming (0.80 cm/s).
WinSLAMM Calculation Procedures for Porous Pavements WinSLAMM uses a calculation procedure similar to the general infiltration device procedure for porous pavement performance. However, porous pavements are only assumed to treat the paved area, with no additional flows from upland areas discharging to the pavement. The volume reduction is therefore:

4-53
(Pr/Ir) (Ap/At) where Pr is the percolation rate of the porous pavement, the pavement base, or the soil, whichever is less, Ir is the rain intensity: total rain/rain duration, Ap is the paved area, and At is the total study area. Again, the ratio Pr/Ir must be less than, or equal to, 1.0. An example follows: Percolation rate = 3 in/hr Total rain = 1.7 in Rain duration = 6 hrs Porous pavement area = 0.7 acres Total study area = 5.3 acres Therefore Ir = 1.7 in/6 hrs = 0.283 in/hr The ratio of Pr/Ir therefore is 3/0.283 = 10.6 which indicates an over-design for this rain, requiring the use of 1.0 in the performance equation. The volume reduction is therefore 0.7 acres/5.3 acres = 0.13 (13 percent reduction in flow and pollutant yield). Filtration of Stormwater Treatment of Stormwater Using Filtration Media Small source area stormwater runoff treatment devices using various forms of filtration have been developed and are currently being marketed. The control of small critical area contributions to urban runoff may be the most cost-effective approach for treatment/reduction of stormwater toxicants. The general features of the critical source areas appear to be large paved areas, heavy vehicular traffic (especially frequent and large numbers of vehicle starts, such as at convenience stores) and outdoor use or storage of problem pollutants. The following paragraphs describe the different filtering media that have been evaluated for stormwater control:
Sand The use of sand filtration is common throughout the U.S. Water supply treatment plants have successfully used sand filtration for many years. Wastewater treatment plants often use sand filtration to polish their effluent before release, especially as the regulatory requirements become more stringent. Sand filtration of stormwater began in earnest in Austin, Texas. The Austin sand filters are used both for single sites and for drainage areas less than 20 ha. The filters are designed to hold and treat the first 13 mm of runoff and the pollutant removal ability of the sand filters has been found to be very good.
According to the City of Austin design guidelines, the minimum depth of sand should be 0.5 m. If the City's design guidelines are followed, the assumed pollutant removal efficiencies, which are based upon the preliminary results of the City of Austin’s stormwater monitoring program, are as follows:

4-54
Pollutant Removal Efficiency (%) Fecal Coliform Bacteria 76 Total Suspended Solids (TSS) 70 Total Nitrogen 21 Total Kjeldahl Nitrogen 46 Nitrate - Nitrogen 0 Total Phosphorus 33 BOD 70 Total Organic Carbon 48 Iron 45 Lead 45
Zinc 45 . Ref: City of Austin 1988. In Washington, D.C., sand filters are used both to improve water quality and to delay the entrance of large slug inputs of runoff into the combined sewer system. Water quality filters are designed to retain and treat 8 to 13 mm of runoff with the final design based upon the amount of imperviousness in the watershed.
The State of Delaware considers the sand filter to be an acceptable method for achieving the eighty percent reduction requirement of suspended solids. Sand filters in Delaware are intended for sites which have impervious areas that will drain directly to the filter. The purpose of the sand filter in many areas is to help prevent or postpone clogging of an infiltration device. According to the State of Delaware guidelines, sand filtration is “intended for use on small sites where overall site imperviousness is maximized. Examples of these sites would be fast food restaurants, gas stations or industrial sites where space for retrofitting with other infiltration devices, such as detention ponds, is not available” (Shaver undated).
According to Delaware’s recommendations, the sand filter will adequately remove particulates (TSS removal efficiency 75 - 85 %) but will not remove soluble compounds. Studies of a sand filter in Maryland show that it is now just becoming clogged after six years of use in a heavily used parking lot. Inspection of the sand below the surface of the filter has shown that oil, grease and finer sediments have migrated into the filter, but only to a depth of approximately 50 to 75 mm (Shaver undated).
It has been generally expected that sand would retain any particles that it trapped. However, preliminary tests (Clark, et al. 1995) showed that fresh sand (without aging and associated biological growths) by itself did not retain stormwater toxicants (which are mostly associated with very fine particles). This lack of ability to retain stormwater toxicants prompted the investigation of other filtration media during this research. Combinations of filtration media, especially those using organic materials (activated carbon, peat moss, composted leaves and ion exchange resins) along with sand, are currently being investigated for their ability to more permanently retain stormwater pollutants.
Activated Carbon Activated carbon filtration/separation has long been used in the chemical process industry and in hazardous waste cleanup as an effective method for removing trace organics from liquids. Activated carbon is made first by charring materials such as almond, coconut and walnut hulls, other woods, or coal. The char particles are activated by exposing them to an oxidizing gas at high temperatures. The activation process makes the particles porous which creates a large internal surface area available for pollutant adsorption (Metcalf and Eddy 1991).
The ability of the activated carbon to adsorb organics is based upon the molecular structure, solubility and the substitute groups on the organic molecule. Examples of compounds adsorbed by activated carbon include n-butyl phthalate, chlorobenzene, carbon tetrachloride, phenol, chloroform and nitrobenzene. Compounds that activated carbon does not adsorb include butylamine, cyclohexylamine, ethylenediamine and hexamethylenediamine. In the adsorption process, mo lecules attach themselves to the solid surface through attractive forces between them and the

4-55
adsorbent carbon (Bennett, et al. 1982). Activated carbon filtration is limited by the number of adsorption sites in the media.
Activated carbon has a very small net surface charge and is ineffective at removing free hydrated metal ions, unless they are complexed with easily-adsorbed organics prior to contact with the activated carbon filter. However, once they are complexed with these usually insoluble organics, the complexed metals are readily adsorbed onto the carbon which results in high removal rates (Rubin and Mercer 1981).
Composted Leaves Composts made from yard waste, primarily leaves, have been found to have a very high capacity for adsorbing heavy metals, oils, greases, nutrients and organic toxins due to the humic content of the compost. These humic compounds are stable, insoluble and have a high molecular weight. The humics act like polyelectrolytes and adsorb the toxicants.
The composted leaf filter was developed by W&H Pacific (now Stormwater Management) for Washington County (Washington), the Unified Sewer Agency and the Metropolitan Service District of Washington County (W&H Pacific 1992). The exact content of the composts and aging process for the composts used by W&H Pacific are not public knowledge with the result that the filter installation/maintenance company supplies the compost to the stormwater treatment device owner. The initial filter design consists of a bottom impermeable membrane with a drainage layer above. Above the drainage layer is a geotextile fabric above which is the compost material. A new design, the CSF II includes a concrete vault, having a flow spreader and a main tank area. The tank includes modular units containing the compost, and the stormwater flows horizontally through the compost. These modular units can be easily removed for maintenance. The actual pollutant removal occurs in the compost material. The removal processes that occur in the compost are filtration, adsorption, ion exchange and biodegradation of organics. Testing of a prototype of the initial design has shown the following pollutant removal rates:
Pollutant Removal Rate (%) Turbidity 84 Suspended Solids 95 Total Volatile Suspended Solids 89 COD 67 Settleable Solids 96 Total Phosphorus 40 Total Kjeldahl Nitrogen 56 Cooper 67 Zinc 88 Aluminum 87 Iron 89 Petroleum Hydrocarbons 87 . Ref: W&H Pacific 1992. Peat Moss Peat is partially decomposed organic material, excluding coal, that is formed from dead plant remains in water in the absence of air. The physical structure and chemical composition of peat is determined by the types of plants (mosses, sedges and other wetland plants) from which it is formed. Peat is physically and chemically complex and is highly organic. Peat's main components are humic and fulvic acids and cellulose.
Peat’s permeability varies greatly and is determined by its degree of decomposition and the plants from which it came. Generally, the more decomposed the peat is, the lower its hydraulic conductivity. Peats are generally light-weight when dry and are highly adsorptive of water. Because of the lignins, cellulosic compounds and humic and fulvic acids in peat, peat is highly colloidal and has a high cation-exchange capacity. Peat also is polar and has a high specific adsorption for dissolved solids such as transition metals and polar organic compounds. Peat has an excellent natural capacity for ion exchange with copper, zinc, lead and mercury, especially at pH levels between 3.0 and 8.5. This adsorption, complexing and exchange of various metal cations occur principally through the carboxyl, phenolic

4-56
and hydroxyl groups in the humic and fulvic acids. This capacity to bind and retain cations, though, is finite and reversible and is determined mostly by the pH of the solution.
Peat is an excellent substrate for microbial growth and assimilation of nutrients and organic waste materials because of its high C:N:P ratio, which often approaches 100:10:1. Nitrifying and denitrifying bacteria are typically present in large numbers in natural peat. Peat's ability to retain phosphorus in the long-term is related to its calcium, aluminum, iron and ash content with the higher the content of each of the above constituents, the higher the retention capability.
Peat moss (sphagnum moss) is a fibric peat. It has easily identifiable undecomposed fibrous organic materials and its bulk density is generally less than 0.1 g/cc. Because of its highly porous structure, peat moss can have a high hydraulic conductivity, up to 140 cm/hr. It is typically brown and/or yellow in color and has a high water holding capacity.
For filtration devices, peat generally has been combined with sand to create a peat-sand filter (PSF). The PSF is a “man-made” filtration system, unlike the sand or peat filtration systems that were first used as wastewater treatment systems in areas where these soils naturally occur. The PSF removes most of the phosphorus, BOD and pathogens and with a good grass cover, additional nutrient removal occurs.
The Peat-Sand Filter System designed by the Metropolitan Washington Council of Governments (Washington, D.C.) has a good grass cover on top underlain by 300 to 500 mm of peat. The peat layer is supported by a 100 mm mixture of sand and peat which is supported by a 500 to 600 mm layer of fine to medium grain sand. Under the sand is gravel and the drainage pipe. The mixture layer is required because it provides the necessary continuous contact between the peat and the sand layers, ensuring a uniform water flow. Because this is a biological filtration system, it works best during the growing season when the grass cover can provide the additional nutrient removal that will not occur in the peat-sand regimes of the system (Galli 1990).
The PSF is usually an aerobic system. However, modifications to the original design by the Metropolitan Washington Council have been made to account for atypical site conditions or removal requirements. The estimated pollutant removal efficiency for the PSF system for stormwater runoff is given below:
Pollutant Removal Efficiency (%)
Suspended Solids 90 Total Phosphorus 70 Total Nitrogen 50 BOD 90 Trace Metals 80 Bacteria 90 . Ref. Galli 1990. Recent Filtration Tests The Department of Civil and Environmental Engineering at the University of Alabama at Birmingham is engaged in a multi-year cooperative agreement with the Storm and Combined Sewer Program of the U.S. EPA. Additional funding was provided by the U.S. Army Corps of Engineers Construction Engineering Research Laboratory in Champaign, IL. As part of this cooperative agreement, potential filtration and sorption media for stormwater runoff treatment from critical source areas were examined (Clark 1996).
Stormwater filters currently in operation typically use sand, leaf compost, or peat. This research tested the capabilities of these media, plus others with expected pollutant removal capability (activated carbon, Zeolite, a cotton milling waste, and a waste agrofiber), in both controlled laboratory and field tests. Influent and effluent samples from each test column were analyzed for toxicity (using Microtox screening test), turbidity, conductivity, pH, major anions and cations, semi-volatile organics, pesticides, particle size distribution, and heavy metals. This research also

4-57
tested the influence that atypical influent pH and ionic strengths have on a medium’s pollutant removal capability, since a potential exists that stormwater filters will be retrofit or designed for places that either receive snowmelt runoff with its high salt concentrations or runoff from an area, such as an industry or commercial establishment, where the pH is unusual. The pollutant removal abilities of two geotextiles were also investigated and their removal capacities compared with that of the traditional media.
The main objective of this research was to monitor a variety of media used to treat stormwater runoff to determine their overall pollutant removal capabilities. Generally, a variety of mechanisms, including straining, sorption, and ion-exchange, are responsible for removing pollutants during “filtration”. No attempt was made to determine which mechanisms were responsible for removing a particular pollutant. In these tests, it soon became apparent that the media were limited by clogging caused by suspended solids in the stormwater runoff. Clogging occurred long before reductions in the pollutant removal capabilities could be determined when using typical pavement runoff. It is suggested that in order to lengthen the run time and better use the pollutant retention capacity of the media, the influent suspended solids concentration should be no more than about 10 mg/L.
Table 4-6 provides a ranking of the media based only on suspended solids removal during 12 filter tests using stormwater collected from a large parking area on the UAB campus. Another series of 12 tests were also conducted using stormwater collected from the same location, but pretreated by settling for 1 to 3 days in a 1 m deep tank.
Table 4-7 shows the levels of removal of stormwater pollutants that had significantly different influent and effluent concentrations after passing through the media (for normal stormwater that was not pretreated). Pollutant removal efficiency increased for all the media after they had aged because they typically develop a biofilm that aids in pollutant removal, and they have fewer small particles available in the medium to be washed out. Because many of the pollutants in stormwater runoff are associated with the particulate matter, more significant reductions in pollutant concentrations were noted when the runoff was not pretreated prior to filtering and when the media itself removed significant quantities of suspended solids.
Table 4-6. Removal Efficiency for Suspended Solids
Ranked Media Percent TSS Reduction (Pretreated) (Avg. Influent TSS = 10 mg/L)
Percent TSS Reduction (Avg. Influent TSS = 30 to 60 mg/L)
Sand Carbon-Sand
>50% >90% >90%
Zeolite-Sand Filter Fabrics
20 - 50% >90% 10%
Peat-Sand Enretech-Sand Compost-Sand
<10 % 80-90% >90% 80%
Table 4-7. Pollutant Removal for Stormwater Treatment Media (not pretreated, TSS = 30 to 50 mg/L) Media Additional Comments
Carbon-Sand Reduced toxicity (>95%), color (60%), alkalinity (30 to 50%), nitrate (95%), potassium (45%),
suspended and volatile solids (50 to 80%), COD (50%), while increasing sulfate concentration in effluent.
Peat-Sand Reduced toxicity (60%), fluoride (<10%), hardness and alkalinity (60%), while increasing turbidity, color, COD, and small particle concentrations in effluent. Lowered pH 1 unit.
Zeolite-Sand Reduced toxicity (50 to 80%), potassium (35%), solids (15 to 50%), with minimal deterioration of effluent.
Sand Reduced solids (10 to 70%), with minimal degradation of effluent. Enretech-Sand Reduced toxicity (< 10%), with minimal degradation of effluent. Compost-Sand Reduced toxicity (70 to >95%), large particle sizes (<30%), while increasing color and potassium

4-58
concentration in effluent. Filter Fabrics Reduced solids (<30%), with minimal degradation of effluent.
Pretreatment of the stormwater was conducted to reduce the solids loadings on the media in order to increase the run times before clogging. This was done to better take advantage of the chemical retention capabilities of the filters. The settling reduced the stormwater suspended solids concentrations to about 10 mg/L, with about 90% of the particles being less than 10 µm in size (similar to the suspended solids conditions that is obtained using a well designed and operated wet detention pond). The pretreatment also reduced the other stormwater pollutant concentrations (for example, color and turbidity were reduced by about 50%, and COD by about 90%). This pretreatment had a significant effect on the media's pollutant removal performance, as shown in Table 4-8. The suspended solids concentrations were generally not further reduced by the media, and its removal by itself would no longer be a suitable criterion for selecting a treatment medium, if the stormwater was pretreated.
Table 4-8. Pollutant Removal for Stormwater Treatment Media (pretreated stormwater, TSS = 10 mg/L)
Media Additional Comments Carbon-Sand Reduced toxicity (80%), color (25%), alkalinity (>95%), zinc (50 to 75%), COD (85 to 95%), 2,4-
dinitrophenol (40%), bis(2-ethylhexyl) phthalate (90%), with minimal effluent degradation. Peat-Sand Reduced toxicity (60%), alkalinity and hardness (50 to 100%), chloride (<20%), large solids
(<50%), zinc (60 to 70%), 2,4-dinitrophenol (35%), di-n-butyl phthalate (65%), bis(2-ethylhexyl) phthalate (20%), dieldrin (70%), while adding color, turbidity, and reducing pH (1-2 units).
Zeolite-Sand Reduced toxicity (>90%), chloride (<10%), potassium (40%), calcium (15%), zinc (60 to 75%), bis(2-ethylhexyl) phthalate (80%), pentachlorophenol (90%), with minimal effluent degradation.
Enretech-Sand Reduced volatile solids (20%), zinc (65 to 75%), 2,4-dinitrophenol (30%), pentachlorophenol (85%), with minimal effluent degradation.
Forest-Sand Reduced zinc (75 to 80%), pentachlorophenol (90%), with minimal effluent degradation. Sand Reduced volatile solids (<10%), zinc (75 to 80%), bis(2-ethylhexyl) phthalate (100%), with
minimal effluent degradation. Compost-Sand Reduced zinc (75 to 80%), while adding color to effluent. Filter Fabrics Reduced COD (20 to 50%), with minimal effluent degradation. Gunderboom reduced 2,4-
dinitrophenol (75 to 80%) and di-n-butyl phthalate (75 to 80%).
As shown during these results, the characteristics of the influent water greatly influence the performance of the treatment medium. Generally, most stormwater filters are designed based upon the influent suspended solids concentration and desired suspended solids removal. For most applications, this likely will remain the primary design factor. However, the selection of the media may likely be different when the influent suspended solids concentration is low, or when the pH is not near neutral and/or the ionic strength is high. Stormwater filter designers also need to consider that most of these media are also ion exchange materials: when ions are removed from solution by the treatment material, other ions are released into the effluent. In most instances, these ions are not a problem in receiving waters, but the designer should know what is added to the water. For the activated carbon examined during these tests, the exchangeable ion was found to be mostly sulfate; while for the compost, the exchangeable ion was found to be mostly potassium. The Zeolite tested appeared to exchange sodium and some divalent cations (measured as increasing hardness) for the ions it removed.
The stormwater control objectives may dictate a combination of filter media. The peat-sand and compost-sand mixtures provided excellent removal for most pollutants, but they added some potentially undesirable constituents to the water. A three-media filter (peat, sand, and activated carbon) has been tested to deal with the addition of some of the undesirables. This design currently is in operation as the polishing chamber of a Multi-Chamber Treatment Train (MCTT) in Milwaukee, WI (Pitt 1996). Based upon the results from a year of monitoring, the addition of activated carbon to the peat-sand media has enhanced the removal ability of the material without adding the undesirable elements like color and turbidity to the effluent. For many stormwater treatment applications, this multi-media approach may be the best solution for treating runoff before it reaches any sensitive receiving waters.
Roberts (1996) described the use of underground detention storage using pipes, in combination with an underground stormwater filtration system as an emerging technology. The city of Alexandria has recently published a regional

4-59
stormwater management manual that includes several designs for sand filters. In addition, the Center for Watershed Protection (1996) has also recently published a design manual for stormwater filtration. Tenney, et al. (1995), at the University of Texas, also recently published a detailed report on highway runoff filtration systems.
Design of Stormwater Filters The information obtained during this EPA sponsored research can be used to develop design guidelines for stormwater filtration, especially in conjunction with reported information in the literature. The design of a stormwater filter needs to be divided into two phases. The first phase is the selection of the media to achieve the desired pollutant removal goals. The second phase is the sizing of the filter to achieve the desired run time before replacement of the media. The main objective of this research was to monitor a variety of filtration media to determine their pollutant removal capabilities, as noted previously. However, it soon became apparent that the filters were more limited by clogging caused by suspended solids in the stormwater, long before reductions in their pollutant removal capabilities could be identified. Therefore, measurements in filter run times, including flow rates and clogging parameters, were added to the research activities. However, the small-scale filter set-ups used for the pollutant removal measurements (using 1 L test columns) probably under-predicted the actual run times that could be achieved under full-scale applications. Even with the increased filter depth utilization and better drying between storms that may be achieved with full-scale applications, pretreatment of the stormwater so the suspended solids content is about 10 mg/L, or less, is probably necessary in order to take greater advantage of the pollutant retention capabilities of most of the media. This level of pretreatment, however, may make further stormwater control unnecessary, except for unusual conditions. Of course, it may be more cost-effective to consider shortened filter run times, without pretreatment, and not utilize all of the pollutant retention capabilities of the media.
Selection of Filtration Media for Pollutant Removal Capabilities. The selection of the filter media needs to be based on the desired pollutant removal performance and the associated conditions. If based on suspended solids alone for untreated stormwater (a likely common and useful criteria), then the filtration media would be ranked according to the following:
1) >90% control of suspended solids: compost/sand, act. carbon/sand, Zeolite/sand, Enretech/sand 2) 80 - 90% control of suspended solids: sand, peat/sand 3) very little control of suspended solids: filter fabrics
If based on a wider range of pollutants for untreated stormwater, then the ranking would be as follows:
1) sand, act. carbon/sand, Enretech/sand (no pollutant degradation, but sand by itself may not offer “permanent” pollutant retention until aged and has biological growths and/or deposition of silts and oils - that is the reason supplements were added to the sand during this research) 2) Zeolite/sand (no degradation) 3) compost/sand (color degradation) 4) peat moss/sand (turbidity and pH degradation) 5) filter fabrics alone (very little pollutant removal benefit)
Pre-settling of the stormwater was conducted to reduce the solids loadings on the filters to increase the run times before clogging in order to take better advantage of the pollutant retention capabilities of the filters. Settling reduced the stormwater suspended solids to about 10 mg/L, with about 90% of the particles (by volume) less than 10 µm in size. The untreated stormwater had a suspended solids concentration of about 30 to 50 mg/L, but many of the particles were larger, with about 90% of the particles being less than 50 µm. The pre-settling also reduced the other stormwater pollutants (color and turbidity by about 50%, and COD by about 90%, for example). This pre-settling was similar to what would occur with a well designed and operated wet detention pond. This pre-settling had a significant effect on the filter performance, as noted, and the rankings would be as follows, considering a wide range of stormwater pollutants (suspended solids removal by itself would not be a suitable criteria, as it is not likely to be reduced any further by the filters after the pre-settling):

4-60
1) peat moss/sand (with degradation in color, turbidity, and pH) 2) activated carbon/sand (no degradation, but fewer benefits) 3) Enretech/sand, forest/sand, sand (few changes, either good or bad) 4) compost/sand (many negative changes)
Obviously, knowing the stormwater control objectives and options will significantly affect the selection of the treatment media. This is most evident with the compost material. If suspended solids removal is the sole criterion, with minimal stormwater pre-treatment, then it is the recommended choice (if one can live with a slight color increase in the stormwater, which is probably not too serious). However, if a filter is to be used after significant pre-treatment in order to have a longer filter life, a compost filter would be the last choice (not considering economics).
The following list summarizes the likely significant reductions in concentrations observed for the filters:
• Sand: Medium to high levels of control for most pollutants, if the stormwater is not pre-treated. These levels of control are associated with retention of suspended solids and the associated particulate fractions of the pollutants. Can relatively easily flush previously captured pollutants. With pretreatment, has little additional benefit. Likely minimum effluent concentrations: 10 mg/L for suspended solids, 50 HACH color units, 10 NTU for turbidity.
• Peat moss/sand: Medium to high levels of control for most pollutants, for both untreated and pre-settled stormwater. Largest range and number of pollutants benefited under pre-settled conditions. Caused increases in color and turbidity, and reductions in pH (by about one pH unit). Likely minimum effluent concentrations: 5 mg/L for suspended solids, 85 HACH color units, 10 - 25 NTU for turbidity.
• Activated carbon/sand: Very good control for most pollutants, especially if the stormwater is not pre-treated. Also large number of benefited pollutants under pre-settled conditions. Caused no adverse changes for any pollutant. Likely minimum effluent concentrations: 5 mg/L for suspended solids, 25 HACH color units, 5 NTU for turbidity.
• Zeolite/sand: Medium to high levels of control for many pollutants for untreated stormwater, but no likely benefits for pre-settled stormwater. Caused increased color and turbidity on pre-settled stormwater. Likely minimum effluent concentrations: 10 mg/L for suspended solids, 75 HACH color units, 15 NTU for turbidity.
• Compost/sand: Medium to very high levels of control for many pollutants for untreated stormwater, but worsened water quality for many pollutants if pre-settled. Increased color under all conditions and had increased phosphate and potassium in effluent. Likely minimum effluent concentrations: 10 mg/L for suspended solids, 100 HACH color units, 10 NTU for turbidity.
• Enretech/sand: Medium to high levels of control for many pollutants for untreated stormwater, but had little effect on pre-settled stormwater. Likely minimum effluent concentrations: 10 mg/L for suspended solids, 80 HACH color units, 10 NTU for turbidity.
• Filter fabrics: No significant and/or important reductions for any pollutants using either untreated or pre-settled stormwater.
Design of Filters for Specified Filtration Durations. The filtration durations measured during these tests can be used to develop preliminary filter designs. It is recommended that allowable suspended solids loadings be used as the primary controlling factor in filtration design. Clogging is assumed to occur when the filtration rate becomes less than about 1 m/day. Obviously, the filter would still function at smaller filtration flow rates, especially for the smallest rains in arid areas, but an excessive amount of filter by-passing would likely occur for moderate rains in humid areas. Tables 4-9 and 4-10 summarize the observed filtration capacities of the different media tested. The wide ranges in filter run times as a function of water are mostly dependent on the suspended solids content of the water, especially when the water is pre-treated. Therefore, the suspended solids loading capacities are recommended for design purposes.

4-61
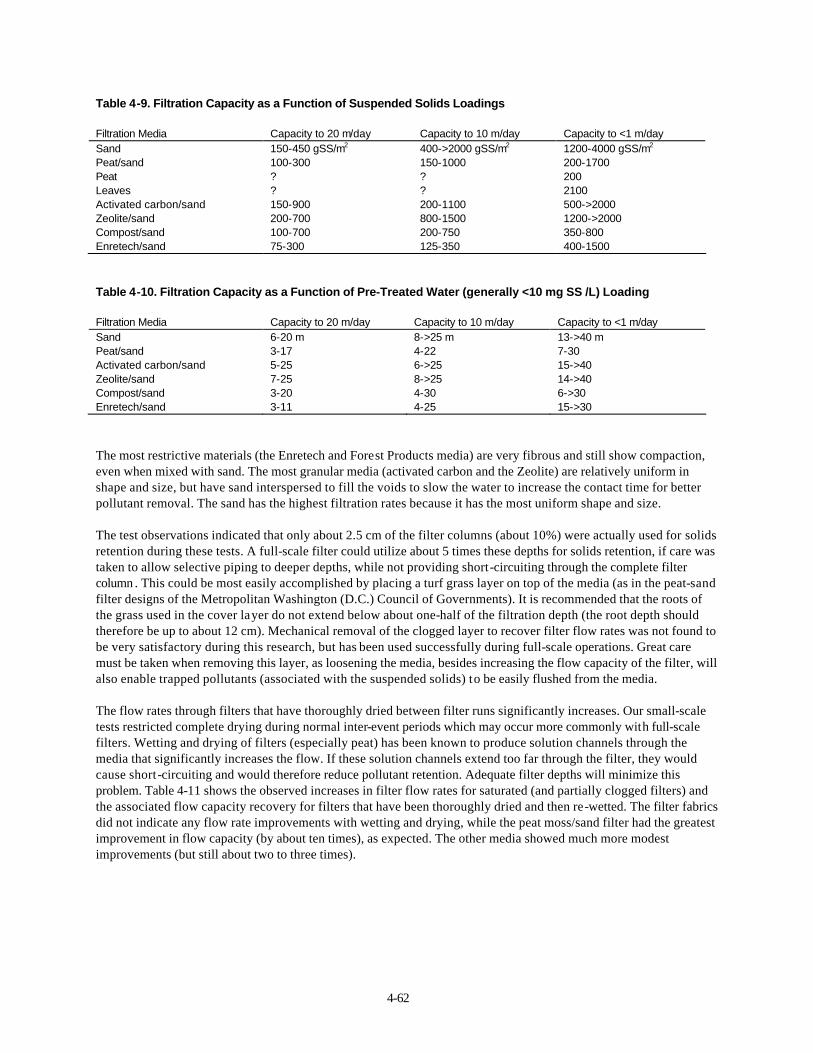
4-62
Table 4-9. Filtration Capacity as a Function of Suspended Solids Loadings
Filtration Media Capacity to 20 m/day Capacity to 10 m/day Capacity to <1 m/day Sand 150-450 gSS/m2 400->2000 gSS/m2 1200-4000 gSS/m2 Peat/sand 100-300 150-1000 200-1700 Peat ? ? 200 Leaves ? ? 2100 Activated carbon/sand 150-900 200-1100 500->2000 Zeolite/sand 200-700 800-1500 1200->2000 Compost/sand 100-700 200-750 350-800 Enretech/sand 75-300 125-350 400-1500
Table 4-10. Filtration Capacity as a Function of Pre-Treated Water (generally <10 mg SS /L) Loading
Filtration Media Capacity to 20 m/day Capacity to 10 m/day Capacity to <1 m/day Sand 6-20 m 8->25 m 13->40 m Peat/sand 3-17 4-22 7-30 Activated carbon/sand 5-25 6->25 15->40 Zeolite/sand 7-25 8->25 14->40 Compost/sand 3-20 4-30 6->30 Enretech/sand 3-11 4-25 15->30
The most restrictive materials (the Enretech and Forest Products media) are very fibrous and still show compaction, even when mixed with sand. The most granular media (activated carbon and the Zeolite) are relatively uniform in shape and size, but have sand interspersed to fill the voids to slow the water to increase the contact time for better pollutant removal. The sand has the highest filtration rates because it has the most uniform shape and size.
The test observations indicated that only about 2.5 cm of the filter columns (about 10%) were actually used for solids retention during these tests. A full-scale filter could utilize about 5 times these depths for solids retention, if care was taken to allow selective piping to deeper depths, while not providing short-circuiting through the complete filter column . This could be most easily accomplished by placing a turf grass layer on top of the media (as in the peat-sand filter designs of the Metropolitan Washington (D.C.) Council of Governments). It is recommended that the roots of the grass used in the cover layer do not extend below about one-half of the filtration depth (the root depth should therefore be up to about 12 cm). Mechanical removal of the clogged layer to recover filter flow rates was not found to be very satisfactory during this research, but has been used successfully during full-scale operations. Great care must be taken when removing this layer, as loosening the media, besides increasing the flow capacity of the filter, will also enable trapped pollutants (associated with the suspended solids) to be easily flushed from the media.
The flow rates through filters that have thoroughly dried between filter runs significantly increases. Our small-scale tests restricted complete drying during normal inter-event periods which may occur more commonly with full-scale filters. Wetting and drying of filters (especially peat) has been known to produce solution channels through the media that significantly increases the flow. If these solution channels extend too far through the filter, they would cause short -circuiting and would therefore reduce pollutant retention. Adequate filter depths will minimize this problem. Table 4-11 shows the observed increases in filter flow rates for saturated (and partially clogged filters) and the associated flow capacity recovery for filters that have been thoroughly dried and then re-wetted. The filter fabrics did not indicate any flow rate improvements with wetting and drying, while the peat moss/sand filter had the greatest improvement in flow capacity (by about ten times), as expected. The other media showed much more modest improvements (but still about two to three times).

4-63
Table 4-11. Filter Flow Rates (m/day) for Saturated (and Partially Clogged) Filters and Recovered Filtration Capacity after Through Drying
Filter Condition
sand peat moss/ sand
act. carbon/ sand
Zeolite/ sand
compost/ sand
Enretech/ sand
forest/ sand
Emcon fabric
Gunder-boom fabric
Saturated/ partially clogged
13 4.0 17 17 13 8.4 8.4 850 200
Recovered flow capacity after drying
40 42 33 39 32 24 17 850 200
Increase in flow (multiple)
3.1X 11X 1.9X 2.3X 2.5X 2.9X 2.0X 1.0X 1.0X
The above filter capacity ranges are associated with varying test conditions and may be further grouped into the following approximate categories, as shown on Table 4-12, which are multiplied by 5 to account for an anticipated greater filter flow capacity associated with full-scale applications.
Table 4-12. Expected Full-Scale Media Flow Capacities
Capacity to <1 m/day Capacity to 10 m/day Filtration Media Category 5,000 gSS/m2 1,250 gSS/m2 Enretech/sand; Forest/sand 5,000 2,500 Compost/sand; Peat/sand 10,000 5,000 Zeolite/sand; Act. Carbon/sand 15,000 7,500 Sand
Filter designs can be made based on the predicted annual discharge of suspended solids to the filtration device and the desired filter replacement interval. As an example, Table 4-13 shows the volumetric runoff coefficients (Rv) that can be used to approximate the fraction of the annual rainfall that would occur as runoff for various land uses and surface conditions, based on small-storm hydrology concepts (Pitt 1987). In addition, Table 4-14 summarizes likely suspended solids concentrations associated with different urban areas and waters.
Table 4-13. Volumetric Runoff Coefficients (Rv) for Different Urban Areas
Area Volumetric Runoff Coefficient (Rv)
Low density residential land use 0.15 Medium density residential land use 0.3 High density residential land use 0.5 Commercial land use 0.8 Industrial land use 0.6 Paved areas 0.85 Sandy soils 0.1

4-64
Clayey soils 0.3
Table 4-14. Typical Suspended Solids Concentrations in Runoff from Various Urban Surfaces
Source Area Suspended Solids Concentration (mg/L)
Roof runoff 10 Paved parking, storage, driveway, streets, and walk areas 50 Unpaved parking and storage areas 250 Landscaped areas <500 Construction site runoff 10,000 Detention pond effluent water 20 Mixed stormwater 150 Effluent after high level of pre-treatment of stormwater 5
Using the information in the above two tables and the local annual rain depth, it is possible to estimate the annual suspended solids loading from an area. The following three examples illustrate these simple calculations.
1) A 1.0 ha paved parking area, in an area receiving 1.0 m of rain per year: (50 mg SS/L) (0.85) (1 m/yr) (1 ha) (10,000 m2/ha) (1,000 L/m3) (g/1,000 mg) = 425,000 g SS/yr Therefore, if a peat/sand filter is to be used having an expected suspended solids capacity of 5,000 g/m2 before clogging, then 85 m2 of this filter will be needed for each year of desired operation for this 1.0 ha site. This is about 0.9% of the paved area per year of operation. If this water is pre-treated so the effluent has about 5 mg/L suspended solids, then only about 0.2% of the contributing paved area would be needed for the filter. A sand filter would only be about 1/3 of this size.
2) A 100 ha medium density residential area having 1.0 m of rain per year: (150 mg SS/L) (0.3) (1 m/yr) (100ha) (10,000 m2/ha) (1,000 L/m3) (g/1,000 mg) = 45,000,000 g SS/yr The unit area loading of suspended solids for this residential area (450 kg SS/ha-yr) is about the same as in the previous example (425 kg SS/ha-yr), requiring about the same area dedicated for the filter. The reduced amount of runoff is balanced by the increased suspended solids concentration.
3) A 1.0 ha rooftop in an area having 1.0 m of rain per year:
(10 mg SS/L) (0.85) (1 m/yr) (1 ha) (10,000 m2/ha) (1,000 L/m3) (g/1,000 mg) = 85,000 g SS/yr The unit area loading of suspended solids from this area (85 kg SS/ha-yr) is much less than for the other areas and would only require a filter about 0.2% of the roofed drainage area per year of operation.
It is recommended that the filter media be about 50 cm in depth and that a surface grass cover be used, with roots not extending beyond half of the filter depth. This should enable a filtration life of about five times the basic life observed during these tests. In addition, it is highly recommended that significant pre-treatment of the water be used to reduce the suspended solids concentrations to about 10 mg/L before filtration for pollutant removal. This pre-treatment can be accomplished using grass filters, wet detention ponds, or other specialized treatment (such as the sedimentation chamber in the multi-chambered treatment train, MCTT). The selection of the specific filtration media should be based on the desired pollutant reductions, but should in all cases include amendments to plain sand if immediate and permanent pollutant reductions are desired.
Summary of Filtration as a Stormwater Control

4-65
In all cases, comprehensive chemical analyses are showing limited changes in the pollutant reductions with time. The media is apparently clogging before the media is experiencing chemical break-though. It is not yet clear if depth filtering media will be a cost-effective stormwater control, considering the pre-treatment needed to prevent clogging. The pretreatment alone may provide adequate control alone, with the additional filtration cost. Large-scale filtration installations (especially sand) have been shown to perform well for extended periods of time with minimal problems. The use of supplemental materials (such as organic compounds) should increase their performance for soluble compounds.
WinSLAMM Calculation Procedures for Media Filters WinSLAMM is currently being modified to incorporate media filters using on-going research. The specific procedures have not yet been finalized, although they will be similar to the design procedures described above (clogging as a critical issue, with pollutant removal relatively constant until clogging).
Combination Devices (Example use of the Multi-Chambered Treatment Train, MCTT) Earlier bench-scale treatability studies, sponsored by the U. S. Environmental Protection Agency (EPA), found that the most beneficial treatment for the removal of stormwater toxicants (as measured using the Microtox™ test) included quiescent settling for at least 24 hours in a 1 meter settling column (generally 40% to 90% reductions), screening through at least 40 µm screens (20% to 70% reductions), and aeration and/or photo-degradation for at least 24 hours (up to 80% reductions) (Pitt, et al. 1995). The MCTT contains aeration, sedimentation, sorption, and sand/peat filtration and was developed by Pitt at the University of Alabama at Birmingham (Robertson, et al. 1995).
The MCTT is most suitable for use at relatively small and isolated paved critical source areas, from about 0.1 to 1 ha (0.25 to 2.5 acre) in area, where surface land is not available for stormwater controls. Typical locations include gas stations, junk yards, bus barns, public works yards, car washes, fast food restaurants, convenience stores, etc., and other areas where the stormwater has a high probability of containing high concentrations of oils and filterable toxic pollutants that are difficult to treat by other means. A typical MCTT requires between 0.5 and 1.5 percent of the paved drainage area, which is about 1/3 of the area required for a well-designed wet detention pond, and is generally installed below ground. A pilot-scale MCTT was constructed in Birmingham, AL, at a large parking area at the University of Alabama at Birmingham campus, and tested over a six month monitoring period. Two additional full-scale MCTT units have also been constructed and are being monitored as part of Wisconsin’s 319 grant from the U.S. EPA. Complete organic and metallic toxicant analyses, in addition to conventional pollutants, are included in the evaluation of these units.
Figure 4-9 shows a general cross-sectional view of a MCTT. It includes a special catchbasin followed by a two chambered tank that is intended to reduce a broad range of toxicants (volatile, particulate, and dissolved). The MCTT includes a special catchbasin (based on Lager, et al.’s 1977 design) followed by two tank chambers that is intended to reduce a broad range of suspended solids and stormwater toxicants (volatile, particulate, and dissolved). The runoff enters the catchbasin chamber by passing over a flash aerator (small column packing balls with counter-current air flow) to remove any highly volatile components present in the runoff (unlikely). This catchbasin also serves as a grit chamber to remove the largest (fastest settling) particles. The second chamber serves as an enhanced settling chamber to remove smaller particles and has inclined tube settlers to enhance sedimentation. The settling time in this main settling chamber usually ranges from 20 to 70 hours. This chamber also contains fine bubble diffusers and sorbent pads to further enhance the removal of floatable hydrocarbons and additional volatile compounds. The water is then pumped to the final chamber at a slow rate to maximize pollutant reductions. The

4-66
Figure 4-9. General schematic of MCTT (Pitt 1995). final chamber contains a mixed media (sand and peat) slow filter, with a filter fabric layer. The MCTT is typically sized to totally contain all of the runoff from a 6 to 20 mm (0.25 to 0.8 in) rain, depending on treatment objectives, inter-event time, typical rain size, and rain intensity for an area.
Table 4-15 shows the median toxicity reductions for various holding times for a 2.1m deep main settling chamber, based on laboratory bench-scale treatability tests. Table 4-16 shows how this device would operate for Birmingham, Alabama, rains. Short holding times result in mu ch of the annual rainfall being treated (the unit is empty before most of the rains begin, because it rains about every 3 to 5 days), but each rain is not treated very well, because of the short settling periods. Therefore, the annual treatment level approaches a constant level with long holding periods. In this example, a relatively large main settling chamber is needed in order to contain large fractions of most of the rains. Long-term continuous analyses have been conducted to identify the most cost-effective MCTT sizes (and holding times) for different treatment objectives for many U.S. locations (Pitt 1996).
Table 4-15. Median Toxicity Reductions for Different
Treatment Holding Times Holding Period Median Toxicity Reduction for 2.1 m depth (h) (%) per Individual Rain 6 46 12 60 24 75 36 84 48 92 72 100 .

4-67
Table 4-16. Effects of Storage Volume and Holding Periods on Annual Runoff Treated and on Total Annual Toxicity Reduction (Birmingham, AL rains)
Storage volume corresponding to: Storage volume corresponding to: 12.7 mm rain with 10.2 mm runoff 38.1 mm rain with 33.5 mm runoff (0.50 in. rain with 0.40 in. runoff) (1.50 in. rain with 1.32 in. runoff) Holding % Annual % Annual % Annual % Annual Period Runoff Toxicity Runoff Toxicity (h) Treated Reduction Treated Reduction 6 84 39 100 46 12 62 37 100 60 24 52 39 98 73 36 48 41 91 77 48 46 42 88 81 72 44 44 84 84 .
During monitoring of 13 storms at the Birmingham pilot-scale MCTT facility (designed for 90% toxicity reductions), the following overall median removal rates were observed: 96% for total toxicity (as measured using the Microtox™ screening test), 98% for filtered toxicity, 83% for suspended solids, 60% for COD, 40% for turbidity, 100% for lead, 91% for zinc, 100% for n-Nitro-di-n-proplamine, 100% for pyrene, and 99% for bis (2-ethyl hexyl) phthalate. The color was increased by about 50% due to staining from the peat and the pH decreased by about one-half pH unit, also from the peat media. Ammonia nitrogen was increased by several times, and nitrate nitrogen had low removals (about 14%). The MCTT performed better than intended because of the additional treatment provided by the final ion exchange/filtration chamber. It had very effective removal rates for both filtered and particulate stormwater toxicants and suspended solids. Increased filterable toxicant removals were obtained in the peat/sand mixed media filter/ion exchange chamber, at the expense of increased color, lowered pH, and depressed COD and nitrate removal rates.
Preliminary results from the full-scale Wisconsin tests collaborate the high levels of treatment observed during the Birmingham pilot-scale tests. Table 4-17 shows the treatment levels that have been observed to date, based on seven tests in Minocqua (during one year of operation) and three tests in Milwaukee (during the first several months of operation). This initial data indicates very high removals (generally >90%) for suspended solids, COD, turbidity, phosphorus, lead, zinc, and many organic toxicants. None of the organic toxicants were ever observed in effluent water from either full-scale MCTT, even considering the excellent detection limits available in the Wis consin laboratories. The MCTT effluent concentrations were also very low for all of the other constituents monitored: <10 mg/L for suspended solids, <0.1 mg/L for phosphorus, <5 µg/L for cadmium and lead, and <20 µg/L for copper and zinc. The pH changes in the Milwaukee MCTT were much less than observed during the Birmingham pilot-scale tests, possibly because of the added activated carbon in the final chamber in Milwaukee. Color was also much better controlled in the full-scale Milwaukee MCTT.
The Milwaukee installation is at a public works garage and serves about 0.1 ha (0.25 acre) of pavement. This MCTT was designed to withstand very heavy vehicles driving over the unit and was a custom-built concrete tank. The estimated cost was $54,000 (including a $16,000 engineering cost), but the actual cost was $72,000. The high cost was likely due to uncertainties associated with construction of an unknown device by the contractors and because it was a retrofitted installation. It therefore had to fit within very tight site layout constraints. As an example, installation problems occurred due to sanitary sewerage not being accurately located as mapped.

4-68
Table 4-17. Preliminary Performance Information for Full-Scale MCTT Tests (median removals and median effluent quality)
Milwaukee MCTT
(3 initial tests)
Minocqua MCTT (7 initial tests)
suspended solids >95 (<5 mg/L) 85 ( 10 mg/L) COD 90 ( 10 mg/L) na turbidity 90 (5 NTU) na pH -7 (8 pH) na ammonia 50 (<0.03 mg/L) na nitrates 0 (0.3 mg/L) na phosphorus 90 (0.03 mg/L) 80 (0.1 mg/L) cadmium 90 (0.1 µg/L) na copper 90 (3 µg/L) 65 (15 µg/L) lead 95 (2 µg/L) nd (<3 µg/L) zinc >85 (<20 µg/L) 90 ( 15 µg/L) benzo(a)anthracene >45 (<0.05 µg/L) >65 (<0.2 µg/L) benzo(b)fluoranthene >95 (<0.1 µg/L) >75 (<0.1 µg/L) dibenzo(a,h)anthracene >80 (<0.02 µg/L) >90 (<0.1 µg/L) fluoranthene >95 (<0.1 µg/L) >90 (<0.1 µg/L) indeno(l,2,3-cd)pyrene >90 (<0.1 µg/L) >95 (<0.1 µg/L) phenanthrene >70 (<0.05 µg/L) >65 (<0.2 µg/L) pyrene >80 (<0.05 µg/L) >75 (<0.2 µg/L)
na: not analyzed nd: not detected The Minocqua site was a 1 ha (2.5 acre) newly paved parking area serving a state park and commercial area. This MCTT was constructed using standard 10’ x 15’ concrete culvert sections. It was located underneath a grassed area, with the runoff piped to the MCTT. It was also a retro-fitted installation, designed to fit within an existing storm drainage system. The installed cost of this MCTT was about $95,000. It is anticipated that MCTT costs could be substantially reduced if designed to better integrate with a new drainage system and not installed as a retro-fitted stormwater control practice. Plastic tank manufactures have also expressed an interest in preparing pre-fabricated MCTT units that could be sized in a few standard sizes for small critical source areas. It is expected that these pre-fabricated units would be much less expensive and easier to install than the custom-built units tested to date.
The development and testing of the MCTT showed that the t reatment unit provided substantial reductions in stormwater toxicants (both in particulate and filtered phases), and suspended solids. Increases in color and a slight decrease in pH also occurred during the filtration step at the pilot-scale unit. The main settling chamber resulted in substantial reductions in total and dissolved toxicity, lead, zinc, certain organic toxicants, suspended solids, COD, turbidity, and color. The filter/ion exchange unit is also responsible for additional filterable toxicant reductions. However, the catchbasin/grit chamber did not indicate any significant improvements in water quality, although it is an important element in reducing maintenance problems by trapping bulk material.
WinSLAMM Calculation Procedures for Combination Devices (specifically the MCTT) WinSLAMM is currently being modified to incorporate combination devices. The MCTT will be modeled using the catchbasin procedures, plus the detention pond procedures for the main settling chamber, and finally the media filter procedures for the last chamber (if used).
References and Bibliography Adams, R. “Stormwater infiltration as a part of an environmentally compatible drainage concept.” Proceedings of the
6th International Conference on Urban Storm Drainage. Edited by J. Marsalek and H.C. Torno. Niagara Falls,
4-69
Ontario. September 12 - 17, 1993. IAWQ, London. Published by Seapoint Publishers, Victoria, B.C. pp. 975 - 980. 1993.
Aires, N, and J.P. Tabuchi. “Hydrocarbons separators and stormwater treatment.” (in French) TSM, Special Issue «Stormwater» , no 11, pp 862-864. 1995.
Akeley, R.P. “Retention basins for control of urban stormwater quality.” In Proceedings: National Conference on Urban Erosion and Sediment Control: Institutions and Technology, EPA-905/9-80-002, Chicago, January 1980.
Alhajjar, B.J., Harkin, J.M., and Chesters, G. “Detergent formula and characteristics of wastewater in septic tanks.” J. Water Poll. Control Fed., 61(5). 1989.
Allard, L.A., E. Graham, W. Platz, R. Carr, and J. Wheeler. “The StormTreat system used as a storm water best management practice.” Proceedings of: Watershed’96, A National Conference on Watershed Management. June 8 -12, 1996. Baltimore, MA. Tetra Tech, Inc. ISBN: 1-57278-028-2. pp. 463 - 465. 1996.
Aronson, G., D. Watson, and W. Pisano. Evaluation of Catchbasin Performance for Urban Stormwater Pollution Control. U.S. EPA. Grant No. R-804578. EPA-600/2-83-043. 78 pages. Cincinnati, June 1983.
Artières, O. Deposits in Sewer Systems : Origins, Characteristics, Pollution, Transport. (in French) PhD thesis of the Louis Pasteur University of Strasbourg, 214 p. September 1987.
Austin, Texas (City of). Design Guidelines for Water Quality Control Basins . Environmental DCM. City of Austin Transportation and Public Services Department. 1988.
Austin, G., A. Iatrou, and A. Rheams. “Art and fun help save Lake Pontchartrain.” Proceedings: Urban Wet Weather Pollution: Controlling Sewer Overflows and Stormwater Runoff. June 16 - 19, 1996. Quebec City, Quebec. Water Environment Federation, Alexandria, VA. pp. 9-33 - 9-36. 1996.
Ayyoubi, A.H. Physical Treatment of Urban Storm Water Runoff Toxicants. MSCE Thesis. Department of Civil Engineering. University of Alabama at Birmingham. Birmingham, Alabama. 118 pages. 1993.
Azzout, Y., S. Barraud, F.N. Crès, and E. Alfakih. “Alternative techniques for urban storm drainage.” (in French) Tech et Doc, ed. Lavoisier, Paris, 372 p. 1994.
Baladès, J.D., P. Bourgogne, and H. Madiec. “Assessment of pollutant removal through a compensating technique structure.” (in French) International Conference NOVATECH 92, Lyon, pp. 66-75. 1992.
Baladès, J.D., P. Bourgogne, and Gourioux. “A reservoir structure pavement for the urban storm drainage of a supermarket area of 120.000 m2 in Bordeaux.” (in French) International Conference NOVATECH 95, Lyon, pp. 329-336. 1995a.
Baladès, J.D., M. Legret, and H. Madiec. “Porous pavements as tools to control the pollutant loads on urban streets.” (in French) International Conference NOVATECH 95, Lyon, pp. 345-352. 1995b.
Bannerman, R., J.G. Konrad, and D. Becker. The IJC Menomonee River Watershed Study. EPA-905/4-79-029. US Environmental Protection Agency. Chicago Illinois. 1979.
Bannerman, R., K. Baun, M. Bohn, P.E. Hughes, and D.A. Graczyk. Evaluation of Urban Nonpoint Source Pollution Management in Milwaukee County, Wisconsin, Vol. I. Grant No. P005432-01-5, PB 84-114164. US Environmental Protection Agency, Water Planning Division, November 1983.
Barron. P.F. Characterization of Polynuclear Aromatic Hydrocarbons in Urban Runoff. MSCE Thesis . Department of Civil Engineering. The University of Alabama at Birmingham, Birmingham. Alabama. 90 pages. 1990.
Barten, J.M. “Lawn fertilizer as a source of phosphorus runoff.” North American Lake Management Society (NALMS) Conference presentation. Minneapolis/St. Paul. October 1996.
Beale, D.C. “Recent developments in the control of urban runoff.” Water and Environmental Management. Vol. 6, no. 2, pp. 141 - 150. April 1992.
Beech, R.M. and A.F. Dake. Designing an Effective Communication Program: A Blueprint for Success. University of Michigan, School of Natural Resources and Environment. For the U.S. Environmental Protection Agency, Region 5. 1992.
Becker, F.A., P.D. Hedges, and R.P.M. Smisson. “The relationship between pollutants and specific sewage settling velocity fractions.” NOVATECH 95, 2nd International Conference on Innovative Technologies in Urban Storm Drainage. May 30 - June 1, 1995. Lyon, France. pp. 607-610. Organized by Eurydice 92 and Graie. 1995.
Bedner, R.E. and D.J. Fluke. Demonstration of Debris Basin Effectiveness in Sediment Control. Environmental Protection Agency, Industrial Environmental Research Laboratory - Cincinnati, EPA-600/7-80-154. Cincinnati, Ohio, 1980.
Bennett, Gary F., Frank S. Feates and Ira Wilder. Hazardous Materials Spills Handbook . McGraw-Hill Book Company, New York, 1982. pp. 9-9 - 9-57.
4-70
Bernard, C., P. Herviou, T. Poujol, and C. Zobrist. “Procedures for treatment of stormwater and quality objectives: two practical representative examples.” Proceedings: Urban Wet Weather Pollution: Controlling Sewer Overflows and Stormwater Runoff. Quebec City, Quebec. June 16 - 19, 1996. Water Environment Federation, Alexandria, VA. Pp. 15-59 - 15-68. 1996.
Bertran4-Krajewski, J.-L. “Modeling of flows and of solid transport in sewer systems: literature review.” (in French) Lyonnaise des Eaux/ENGEES report, Strasbourg, 207 p April 1991.
Bertran4-Krajewski, J.-L., B. Breuil, L. Herremans, and D. Renard. “How to reduce stormwater discharges and their impact on receiving water?” (in French) La Houille Blanche, no1/2, pp 155-169. 1994.
Brydges, T. and G. Robinson. “Two examples of urban stormwater impoundment for aesthetics and for protection of receiving waters.” In: Restoration of Lakes and Inland Waters: International Symposium on Inland Waters and Lake Restoration. Portland, Main, September 1980. Proceedings published by the U.S. Environmental Protection Agency, Washington, D.C. 1986.
Butler, D., P. Clark, and J. Payne. “Management of sediment in drainage catchments.” Proceedings of the 6th International Conference on Urban Storm Drainage. Edited by J. Marsalek and H.C. Torno. Niagara Falls, Ontario. September 12 - 17, 1993. IAWQ, London. Published by Seapoint Publishers, Victoria, B.C. pp. 736 - 741. 1993.
Butler, D. and S.H.P.G. Karunaratne. “The suspended solids trap efficiency of the roadside gully pot.” Wat. Res. Vol. 29, No. 2. pp. 719-729. 1995.
Butler, D., Y. Xiao, S.H.P.G. Karunaratne, and S. Thedchanamoorthy. “The gully pot as a physical and biological reactor.” Water Science & Technology. Vol. 31, No. 7, pp. 219-228. 1995.
Cairncross and R.G. Feacham. Environmental Health Engineering in the Tropics. John Wiley & Son. NY. 1993. Candaras, A.M., L.M.J. Carvalho, and M-K. Koo. “City of Etobicoke exfiltration and filtration systems
pilot/demonstration project.” Modern Methods for Modeling the Management of Stormwater Impacts. Edited by W. James. Computational Hydraulics International, Guelph, Ontario. pp. 399 - 419. 1995.
Chambers, G.M. and C.H. Tottle. Evaluation of Stormwater Impoundments in Winnipeg. Report SCAT-1, Environment Canada, Ottawa, April 1980.
Clark, D.E.,Jr., and W.C. Cobbin. Removal Effectiveness of Simulated Dry Fallout from Paved Areas by Motorized and Vacuumized Street Sweepers. USNRDL-TR-746, U.S. Naval Radiological Defense Laboratory, Alexandria, Virginia, 1963.
Clark, S., R. Pitt, and R. Field. “Stormwater treatment: inlet devices and filtration.” Presented at the Stormwater NPDES Related Monitoring Needs ASCE conference, Mt. Crested Butte, CO. Proceedings edited by H. Torno. Published by ASCE, New York. pp. 641-650. 1995.
Clark, S. Evaluation of Filtration Media for Stormwater Runoff Treatment. MSCE thesis. Department of Civil and Environmental Engineering, University of Alabama at Birmingham. 442 pgs. 1996
Claytor, R. and T. Schueler. Design of Stormwater Filtering Systems. Center for Watershed Protection. Silver Spring, MD. 200 pgs. September 1996.
Conradin, F. “Zurich modifies collection system by building open brooks.” Water Environment & Technology. pp. 26 - 27. November 1995.
Day, G.E. “Investigation of concrete grid pavements.” In Proceedings - National Conference on Urban Erosion and Sediment Control: Institutions and Technology, EPA-905/9-80-002, U.S. Environmental Protection Agency, Chicago, Ill., January 1980.
Debo, T.N. and Ruby. “Detention ordinances -- Solving or causing problems?,” Proceedings: Conference on Stormwater Detention Facilities, Planning, Design, Operation, and Maintenance. Henniker, New Hampshire, Edited by W. DeGroot, published by the American Society of Civil Engineers, New York, August 1982.
Delporte, C. “Treating rainfall - enhancing discharges from urban areas using lamellar decantation.” Proceedings: Urban Wet Weather Pollution: Controlling Sewer Overflows and Stormwater Runoff. Quebec City, Quebec. June 16 - 19, 1996. Water Environment Federation, Alexandria, VA. Pp. 15-1 - 15-9. 1996.
Dewberry and Davis, Inc. Investigation of Potential Sediment Toxicity from BMP Ponds. Prepared for the Northern Virginia Planning District Commission, the Occoquan Policy Board, and the Virginia State Water Control Board. May 1990.
Diniz, E.V. Porous Pavement; Phase I, Design and Operational Criteria. EPA-600/2-80-135. U.S. Environmental Protection Agency, Cincinnati, Ohio, August 1980.
Diniz, E.V. “Hydrologic and water quality comparisons of runoff from porous and conventional pavements.” In: Integrated Stormwater Management. Edited by R. Field, M.L. O’Shea, and K.K. Chin. Lewis Publishers. Boca Raton. pp. 149 - 162. 1993.

4-71
Driscoll, E. D. “Detention and retention controls for urban stormwater.” Engineering Foundation Conference: Urban Runoff Quality - Impact and Quality Enhancement Technology. Henniker, New Hampshire, edited by B. Urbonas and L. A. Roesner. Pp. 145 - 163. Published by the American Society of Civil Engineers, New York, June 1986.
Driscoll, E. D. “Long term performance of water quality ponds.” Engineering Foundation Conference: Design of Urban Runoff Quality Controls. Potosi, Missouri. July 10 - 15, 1988. Edited by L. A. Roesner, B. Urbonas and M.B. Sommen. Published by the American Society of Civil Engineers, New York, June 1989.
Driscoll, E.D. and E.W. Strecker “Assessment of BMP’s being used in the U.S. and Canada.” Proceedings of the 6th International Conference on Urban Storm Drainage. Edited by J. Marsalek and H.C. Torno. Niagara Falls, Ontario. September 12 - 17, 1993. IAWQ, London. Published by Seapoint Publishers, Victoria, B.C. pp. 945 - 950. 1993.
Droste, R.L. and J.C. Johnston. “Urban snow dump quality and pollutant reduction in snowmelt by sedimentation.” Canadian Journal of Civil Engineering. Vol. 20, pp. 9-21. February 1993.
Duchene, M., E. McBean, and N. Thomson. “Infiltration characteristics associated with the use of trenches in stormwater management.” Proceedings of the 6th International Conference on Urban Storm Drainage. Edited by J. Marsalek and H.C. Torno. Niagara Falls, Ontario. September 12 - 17, 1993. IAWQ, London. Published by Seapoint Publishers, Victoria, B.C. pp. 1115 - 1120. 1993.
Duru, J. O. “On-site detention: A stormwater management or mismanagement technique.” Second International Conference on Urban Storm Drainage, Urbana, Illinois, June 1981.
Eccher. C.J. “Thoughtful design is prime factor in water safety.” Lake Line. pp. 4-8. May 1991. EDP (Environmental Design and Planning, Inc.). Evaluation of Catchbasin Monitoring. Contract No. R804578010,
U.S. Environmental Protection Agency, Cincinnati, Ohio, March 1980. Ellis, J.B. “Pollutional aspects of urban runoff.” Urban Runoff Pollution, NATO ASI series, vol. G10, Springer Verlag,
Berlin, pp. 1-38. 1986. Ellis, J.B. “Wetland BMP design for urban runoff pollution control in Europe and Australia.” Proceedings of the 6th
International Conference on Urban Storm Drainage. Edited by J. Marsalek and H.C. Torno. Niagara Falls, Ontario. September 12 - 17, 1993. IAWQ, London. Published by Seapoint Publishers, Victoria, B.C. pp. 957 - 962. 1993.
Emmerling-DiNovo, C. “Stormwater detention basins and residential locational decisions.” Water Resources Bulletin. Vol. 31, no. 3, pp. 515-521. June 1995.
EPA (U.S. Environmental Protection Agency). Final Report for the Nationwide Urban Runoff Program. Water Planning Division, Washington, D.C., December 1983.
EPA (U.S. Environmental Protection Agency). Methodology for Analysis of Detention Basins for Control of Urban Runoff Quality. Office of Water, NonPoint Source Division. Washington, D.C., September 1986.
EPA. Urban Runoff Management Information/Education Products. Developed for US EPA Region 5, Water Division, Wetlands and Watershed Section Watershed Management Unit and USEPA Office of Wastewater Enforcement and Compliance Permits Division, NPDES Program Branch, Stormwater Section, Version 1. 1993.
EPA. Nonpoint Source News Notes. Issue #46. Also available through http://www.epa.gov. August/September 1996. Fair, G.M. and J.C. Geyer. Water Supply and Waste Water Disposal. John Wiley and Sons. New York. 1954. Federal Register. 55 (No. 222; November 16), 48062. 1990. Field, R. and R. Pitt. “Combined sewer overflow control through in-receiving water storage: an efficiency evaluation.”
Water Environment Federation Specialty Conference on A Global Perspective for Reducing CSOs: Balancing Technologies, Costs, and Water Quality. Louisville, KT. July 1994a.
Field, R. and R. Pitt. “Optimization of CSO storage and treatment systems.” Water Environment Federation Specialty Conference on A Global Perspective for Reducing CSOs: Balancing Technologies, Costs, and Water Quality. Louisville, KT. July 1994b.
Field, R., R. Pitt, D. Jaeger, and M. Brown. “Combined sewer overflow control through in-receiving water storage: an efficiency evaluation.” Water Resources Bulletin, the Journal of the American Water Resources Association. Vol. 30, No. 5. pp. 921-928. October 1994.
Field, R. M.P. Brown, W.V. Vilkelis. Stormwater Pollution Abatement Technologies. U.S. Environmental Protection Agency, Office of Research and Development. Cincinnati. OH. EPA/600/R-94/129. 1994.
Field, R., R. Pitt, M. Lalor, M. Brown, W. Vilkelis, and E. Thackston. “Investigation of dry-weather pollutant entries into storm-drainage systems.” J. Envir. Eng. Vol. 120, No. 5, pp. 1044-1066. Sept./Oct. 1994.
Field, R., R. Pitt, M. Brown, and T. O’Conner. “Combined sewer overflow control using storage in seawater.” Water Research. Elsevier Science. Vol. 29, No. 6, pp. 1505-1514. 1995.
Forndran, A., R. Field, K. Dunkers, and D. Moran. “Balancing flow for CSO abatement.” Water Environment & Technology. pp. 54-58. May 1991.

4-72
Fourage, M. “Assessment of the efficiency of a prefabricated separator for stormwater treatment. Thoughts to and tests of materials to trap hydrocarbons.” (in French) Unpublished DESS student report, Universities of Nancy and Metz, September 1992.
Free, B. M. and G. G. Mulamoottil. “The limnology of Lake Wabukayne, A storm-water impoundment.”, Water Resources Bulletin, Vol. 19, no. 5, pg. 821, October 1983.
Fuhr, M. “Will your pond hold water?” Land and Water, Vol. 40, no. 6, pg. 38. Nov./Dec. 1996. Fujita, S. “Infiltration in congested urban areas of Tokyo.” Proceedings of the 6th International Conference on Urban
Storm Drainage. Edited by J. Marsalek and H.C. Torno. Niagara Falls, Ontario. September 12 - 17, 1993. IAWQ, London. Published by Seapoint Publishers, Victoria, B.C. pp. 993 - 998. 1993.
Fujita, S. “Infiltration structures in Tokyo.” Water Science and Technology. Vol. 30, no. 1, pp. 33 - 41. 1994. Galli, John. Peat-Sand Filters: A Proposed Stormwater Management Practice for Urbanized Areas. Prepared for the
Coordinated Anacostia Retrofit Program and Office Of Policy and Planning, D.C. Department of Public Works. December 1990.
Gburek, W.J. and J.B. Urban. “Storm water detention and groundwater recharge using porous asphalt - initial results.” 1983 International Symposium on Urban Hydrology, Hydraulics and Sediment Control, University of Kentucky, Lexington, Kentucky, July 1983.
Geldof, G., P. Jacobsen, and S. Fujita. “Urban stormwater infiltration perspectives.” Proceedings of the 6th International Conference on Urban Storm Drainage. Edited by J. Marsalek and H.C. Torno. Niagara Falls, Ontario. September 12 - 17, 1993. IAWQ, London. Published by Seapoint Publishers, Victoria, B.C. pp. 963 - 968. 1993.
Geldof, G., P. Jacobsen, and S. Fujita. “Urban stormwater infiltration perspectives.” Water Science and Technology. Vol. 29, no. 1 - 2, pp. 245-254. 1994.
Gietz, R.J. Urban Runoff Treatment in the Kennedy-Burnett Settling Pond. For the Rideau River Stormwater Management Study, Pollution Control Division, Works Department, Regional Municipality of Ottawa-Carleton, Ottawa, Ontario, March 1983.
Goforth, G.F., E.V. Diniz, and J.B. Rauhut. Stormwater Hydrological Characteristics of Porous and Conventional Paving Systems. EPA-600/2-83-106, U.S. Environmental Protection Agency, Cincinnati, Ohio, February 1984 (also dated October 1983).
Green, M.B. and J.R. Martin. “Constructed reed beds clean up storm overflows on small wastewater treatment works.” Water Environment Research. Vol. 68, no. 6, pp. 1054 - 1060. Sept./Oct. 1996.
Grottker, M. “Pollutant removal by gully pots in different catchment areas.” The Science of the Total Environment. Vol. 93. pp. 515-522. 1990.
Hall, M.J. “The design of flood storage ponds: catering for both quality and quantity of runoff.” Developments in Storm Drainage - A Symposium on Infiltration and Storage of Stormwater in New Developments. Sheffield City. Jan. 1990. Pp. 21 - 33. 1990.
Harada, S. and A. Ichikawa. “A study on the performance of the drainage infiltration strata.” Proceedings of the 6th International Conference on Urban Storm Drainage. Edited by J. Marsalek and H.C. Torno. Niagara Falls, Ontario. September 12 - 17, 1993. IAWQ, London. Published by Seapoint Publishers, Victoria, B.C. pp. 1104 - 1109. 1993.
Harper, H.H. and J.L. Herr. “Alum treatment of stormwater - The first ten years: What have we learned and where do we go from here?” North American Lake Management Society (NALMS) Conference presentation. Minneapolis/St. Paul. October 1996.
Hawley, M. E., T. R. Bondelid, and R. H. McCuen. “A planning method for evaluating downstream effects of detention basins.” Water Resources Bulletin, Vol. 17. no. 5, pg. 806, October 1981.
Heinzmann, B. “Coagulation and flocculation of stormwater from a separated storm sewer - A new possibility for enhanced treatment.” 2nd International Conference on: Upgrading of Wastewater Treatment Plants. Berlin. September 21 - 24, 1993. Sponsored by IAWQ and EWPCA. Pp. 304 - 313. 1993.
Herr, J.L. and H.H. Harper. “The evaluation and design of an alum stormwater treatment system to improve water quality in Lake Maggiore, St. Petersburg, Florida” North American Lake Management Society (NALMS) Conference presentation. Minneapolis/St. Paul. October 1996.
Herath, S. and K. Musiake. “Simulation of basin scale runoff reduction by infiltration systems.” Water Science and Technology. Vol. 29, no. 1 - 2, pp. 267 - 275. 1994.
Hey, D.L. and G.C. Schaefer. An Evaluation of the Water Quality Effects of Detention Storage and Source Control. U.S. Environmental Protection Agency and the Northeastern Illinois Planning Commission, Chicago, August 1983.

4-73
Hvitve4-Jacobsen, T., K. Keiding, and Y.A. Yousef. “Urban runoff pollution removal in wet detention ponds.” Proceedings of the 4th International Conference on Urban Storm Drainage. Lausanne, Switzerland. August 1987. Water Resources Publications. pp. 137 - 142. 1987.
Hvitve4-Jacobsen, T., N.B. Johansen, and Y.A. Yousef. “Treatment systems for urban and highway runoff in Denmark.” In: the 4th International Symposium on Highway Pollution, Madrid, Spain. May 18-22, 1992. The Science of the Total Environment, 1992.
Hvitve4-Jacobsen, T., N.B. Johansen, and Y.A. Yousef. “Treatment systems for urban and highway runoff in Denmark.” The Science of the Total Environment. No. 146/147, pp. 499-506. 1994.
Herricks, E.E., editor. Stormwater Runoff and Receiving Systems: Impact, Monitoring, and Assessment. Engineering Foundation and ASCE. CRC/Lewis. Boca Raton, FL. 1995.
Hogland, W., J. Niemczynowicz , and T. Wahlman. “The unit superstructure during the construction period.” The Science of the Total Environment, 1987, vol. 59, pp. 411-424. 1987.
Hogland, W. “Pervious asphalt construction - an overview of the situation in Sweden and the U.S.A.” Developments in Storm Drainage - A Symposium on Infiltration and Storage of Stormwater in New Developments. Sheffield City. Jan. 1990. Pp. 122 - 135. 1990.
Jackson, H.B. “Global needs and developments in urban sanitation.” Proc. Int. Conf. On Low Cost Sewerage. Univ.Leeds, UK, July 1995.
Jacobsen, P. and P.S. Mikkelsen. “Reduction of urban runoff pollutant loads using detention ponds and stormwater infiltration techniques.” Proceedings of the 7 th Conference of Urban Storm Drainage. Hanover, Germany. Sept. 9-13, 1996.
Jones, J. E. and D. E. Jones. “Interfacing considerations in urban detention ponding.” Proceedings of the Conference: Stormwater Detention Facilities, Planning, Design, Operation, and Maintenance. Henniker, New Hampshire, Edited by W. DeGroot, published by the American Society of Civil Engineers, New York, August 1982.
Jones, J. “Beware the sediment scare.” Civil Engineering. pp. 56-57. July 1995. Jones, J., S. Anderson, J. Fognani. F.R. McGregor, and T. Axley. “Stormwater best management practices: When is
sediment considered hazardous?” Water Environment & Technology. Vol. 8, no. 10, pp. 51-57. October 1996. Kamedulski, G. E. and R. H. McCuen. "The effect of maintenance on storm water detention basin efficiency.” Water
Resources Bulletin, Vol. 15, no. 4, pg. 1146, August 1979. Karunaratne, S.H.P.G. The Influence of Gully Pot Performance on the Entry of Sediment into Sewers. Ph.D.
dissertation. South Bank University. London. 1992. Kercher, W.C., J.C. Landon and R. Massarelli. “Grassy swales prove cost-effective for water pollution control”.
Public Works, April 1983. Kloiber, S.M. and P.L. Brewonik. “Effectiveness of continuous alum treatment for phosphorus removal from
stormwater.” North American Lake Management Society (NALMS) Conference presentation. Minneapolis/St. Paul. October 1996.
Krejci, V., P. Haldimann, and M. Grottker. “Administrative aspects of stormwater infiltration in Switzerland.” Proceedings of the 6th International Conference on Urban Storm Drainage. Edited by J. Marsalek and H.C. Torno. Niagara Falls, Ontario. September 12 - 17, 1993. IAWQ, London. Published by Seapoint Publishers, Victoria, B.C. pp. 999 - 1004. 1993.
Kuo, C.Y., J.L. Zhu, and L.A. Dollard. A Study of Infiltration Trenches. VPI-VWRRC-BULL 163. 3.5C. Virginia Water Resources Research Center, Virginia Polytechnic Institute and State University. Blacksburg, VA. 87 pgs. 1989.
Lager, J.A., W.G. Smith, and G. Tchobanoglous. Catchbasin Technology Overview and Assessment. U.S. EPA. Contract No. 68-03-0274. EPA-600/2-77-051. 129 pages Cincinnati, May 1977.
Lager, J.A., W.G. Smith, W.G. Lynard, R.M. Finn, and E.J. Finnemore. Urban Stormwater Management and Technology: Update and Users' Guide. U.S. Environ. Protection Agency, EPA-600/8-77-014, 313 p. Cincinnati, Ohio, September 1977.
Lake Line “The Nutri-Pod: A new way.” pp. 2-19. February 1991. Lake Tahoe Regional Planning Agency. Lake Tahoe Basin Water Quality Management Plan, Volume II, Handbook
of Best Management Practices. Lake Tahoe, California, January 1978. Lalor, M. M. Assessment of Non-Stormwater Discharges to Storm Drainage Systems in Residential and Commercial
Lan4-Use Areas, Ph.D. thesis, Vanderbilt University, Nashville, Tennessee. 1993. Land and Water “Storm pond turned into selling feature” Vol. 40, no. 6, pg. 35. Nov./Dec. 1996. Laplace, D., A. Bachoc, Y. Sanchez, and D. Dartus. “Truck sewer clogging development - description and solutions.”
Water Science and Technology. Vol. 25, No. 8, pp. 91-100. 1992.

4-74
Legrand, J., H. Maillot, F. Nougarède, and S. Defontaine. “A device for stormwater treatment in the urban development zone of Annœullin.” (in French) TSM, no 11, pp 639-643. 1994.
Legret, M., D. Demare, V. Colandini, J-D. Balades, and H. Madiec. “Behaviour of metallic pollutants in a pervious road construction.” Proceedings of the 6th International Conference on Urban Storm Drainage. Edited by J. Marsalek and H.C. Torno. Niagara Falls, Ontario. September 12 - 17, 1993. IAWQ, London. Published by Seapoint Publishers, Victoria, B.C. pp. 1201 - 1206. 1993.
Lind, B.B. and E. Karro. “Stormwater infiltration and accumulation of heavy metals in roadside green areas in Goteborg, Sweden.” Ecological Engineering. Vol. 5, no. 4, pp. 533-529. Dec. 1995.
Luzkow, S.M., D.A. Scherger, and J.A. Davis. “Effectiveness of two in-line urban stormwater best management practices (BMP's).” 1981 International Symposium on Urban Hydrology, Hydraulics, and Sediment Control, University of Kentucky, Lexington, Kentucky, July 1981.
Magmedov, V.G., M.A. Zakharchenko, L.I. Yakovleva, and M.E. Ince. “Use of constructed wetlands for the treatment of runoff and drainage waters: the UK and Ukraine experience.” Water Science and Technology. Vol. 33, no. 4 - 5, pp. 315-323. 1996.
Marcy, S. J. and J. E. Flack. “Safety considerations in urban storm drainage design.” Second International Conference on Urban Storm Drainage. Urbana, Illinois, June 1981.
Marsalek, J., D. Weatherbe, and G. Zukovs. “Institutional aspects of stormwater detention.” Proceedings of the Conference: Stormwater Detention Facilities, Planning, Design, Operation, and Maintenance. Henniker, New Hampshire, Edited by W. DeGroot, published by the American Society of Civil Engineers, New York, August 1982.
Martin, E. and R.A. Miller. “Efficiency of an urban stormwater detention system.” Proceedings of the 4th International Conference on Urban Storm Drainage. Lausanne, Switzerland. August 1987. Water Resources Publications. pp. 143 - 148. 1987.
Martin, E.H. “Mixing and residence times of stormwater runoff in a detention system.” Engineering Foundation Conference: Design of Urban Runoff Quality Controls. Potosi, Missouri. July 10 - 15, 1988. Edited by L. A. Roesner, B. Urbonas and M.B. Sommen. pp. 164 - 179. Published by the American Society of Civil Engineers, New York, June 1989.
Maxted, J. and E. Shaver. “The use of retention basins to mitigate stormwater impacts on aquatic life.” Engineering Foundation Conference: Effects of Watershed Development & Management on Aquatic Ecosystems. Snowbird, Utah. August 4-9, 1996. To be published by the Engineering Foundation, New York, 1997.
Mayer, T., J. Marsalek, and E. Delos Reyes. “Nutrients and metal contaminants status of urban stormwater ponds.” Journal of Lake and Reservoir Management. Vol. 12, no. 3, pp. 348-363. 1996.
McComas, S.R. and D.F. Sefton. “Comparison of stormwater runoff impacts on sedimentation and sediment trace metals for two urban impoundments.” In: Lake and Reservoir Management: Practical Applications, proceedings of the Fourth Annual Conference and International Symposium, October, 1984, North American Lake Management Society, McAfee, New Jersey, 1985.
Metcalf & Eddy, Inc. Wastewater Engineering: Treatment, Disposal, and Reuse. McGraw-Hill Publishing Company, New York, New York. 1991.
Metcalf & Eddy Inc. Handbook: Urban Runoff Pollution Prevention and Control Planning. U.S. Environmental Protection Agency, Office of Research and Development. Cincinnati. OH. EPA/625/R-93/004. 1993.
Metropolitan Washington Council of Governments. Analysis of Urban BMP Performance and Longevity. Prince George's County, Department of Environmental Resources. 1992.
Mikkelsen, P.S., G. Weyer, C. Berry, Y. Walden, V. Colandini, S. Paulsen, D. Grotehusmann, and R. Rohlfing. “Pollution from urban stormwater infiltration.” Water Science and Technology. Vol. 29, no. 1 - 2, pp. 293-302. 1994.
Montoya, B.l. Urban Runoff Discharges From Sacramento, California. CVRWQCB Report Number 87-1SPSS, prepared for the California Regional Water Quality Control Board, Central Valley Region. 1987.
Mugass, R.J. “Home lawn care practices to help protect surface water quality.” North American Lake Management Society (NALMS) Conference presentation. Minneapolis/St. Paul. October 1996.
Musiake, K., J. Okamura, and J. Matsushita. “The urban hydrological system with shallow infiltration facilities - a case study of an area in Tokyo Metropolis.” Proceedings of the 5th International Conference on Urban Storm Drainage. Osaka, Japan. July 1990. pp. 113 - 118. 1990.
Nawang, W.M. and S. Saad “Stormwater infiltration investigation using porous pavement” Proceedings of the 6th International Conference on Urban Storm Drainage. Edited by J. Marsalek and H.C. Torno. Niagara Falls, Ontario. September 12 - 17, 1993. IAWQ, London. Published by Seapoint Publishers, Victoria, B.C. pp. 1092 - 1097. 1993.
4-75
Newman, T.L., W.M. Leo, J.A. Muekker, and R. Gaffoglio. “Effectiveness of street cleaning for floatables control.” Proceedings: Urban Wet Weather Pollution: Controlling Sewer Overflows and Stormwater Pollution. June 16 - 19, 1996. Quebec City, Quebec. Water Environment Federation. Alexandria, VA. 1996.
Niemczynowicz, J. and W. Hogland. “Tests of porous pavement in Lund, Sweden.” Proceedings of the 4th International Conference on Urban Storm Drainage. Lausanne, Switzerland. August 1987. Water Resources Publications. pp. 79 - 80. 1987.
Niemczynowicz, J. “Swedish stormwater detention practices.” Proceedings of the 5th International Conference on Urban Storm Drainage. Osaka, Japan. July 1990. pp. 197 - 202. 1990.
Niemczynowicz, J. “New aspects of urban drainage and pollution reduction towards sustainability.” Wat.Sci.Tech. Vol.30, No.5, pp269-277. 1994.
Nix, S.J. and S.R. Durrans. “Off-line stormwater detention systems.” Water Resources Bulletin. Vol. 32, no. 6, pp. 1329 - 1340. December 1996.
NOVATECH. “International conference on new technologies for urban storm drainage.” (in French and English) GRAIE/Eurydice 92 editors, Lyon, 568 p. 1992.
NOVATECH. “2nd International conference on new technologies for urban storm drainage.” (in French and English) GRAIE/Eurydice 92, Lyon, 670 p. 1995.
Novotny, V., H.M. Sung, R. Bannerman, and K. Baum. “Estimating non-point pollution from small urban watersheds.” Journal of Water Pollution Control Federation, vol. 57, no 4, pp 339-348. 1985.
Oberts, G. “Design considerations for management of urban runoff in wintry conditions.” Proceedings: International Conference on Urban Hydrology under Wintry Conditions. March 19 - 21, 1990. Narvik, Norway. 1990.
Oberts, G. Performance of stormwater ponds and wetlands in winter.” Technical note 16. Watershed Protection Techniques. Vol. 1, no. 2, pp. 64-68. Summer 1994.
Oliver, L.J. and S.G. Grigoropoulis. “Control of storm-generated pollution using a small urban lake.” Journal Water Pollution Control Federation, Vol 53, No. 5, May 1981.
Ontario (Province of). Urban Drainage Design Guidelines (Draft). Urban Drainage Policy Implementation Committee, Technical Sub-Committee No. 3. March 1984.
Payne, J. and A. Davies. “Manual on infiltration methods for stormwater source control.” Proceedings of the 6th International Conference on Urban Storm Drainage. Edited by J. Marsalek and H.C. Torno. Niagara Falls, Ontario. September 12 - 17, 1993. IAWQ, London. Published by Seapoint Publishers, Victoria, B.C. pp. 981 - 986. 1993.
Perkins, M. A. “Managing aquatic plants with fiberglass screens.” In: Restoration of Lakes and Inland Waters. Proceedings of the International Symposium on Inland Waters and Lake Restoration, Portland, Maine, September 1980, published by the U.S. Environmental Protection Agency, Washington. D.C., December 1980.
Petersen, C.R., T. Faarbaek, G.H. Jensen, G. Weyer, S. Fujita, K. Ishikawa, G. Geldof, C. Stenmark, and C.J. Pratt. “Urban stormwater infiltration design practice and technology: state of the art assessment.” Proceedings of the 6th International Conference on Urban Storm Drainage. Edited by J. Marsalek and H.C. Torno. Niagara Falls, Ontario. September 12 - 17, 1993. IAWQ, London. Published by Seapoint Publishers, Victoria, B.C. pp. 969 - 974. 1993.
Pisano, W.C. and H. Brombach. “Solids settling curves: Wastewater solids data can aid design of urban runoff controls.” Water Environment & Technology. Vol. 8, no. 4, pp. 27-33. April 1996.
Pitt, R., J. Ugelow, and J.D. Sartor. Systems Analysis of Street Cleaning Techniques. Prepared for the American Public Works Association and the National Science Foundation, RANN Program, Washington, D.C., March 1976.
Pitt, R. Demonstration of Nonpoint Pollution Abatement Through Improved Street Cleaning Practices. U.S. EPA. Grant No. S-804432. EPA-600/2-79-161. 270 pages. Cincinnati, August 1979.
Pitt, R. and M. Bozeman. Lake Merritt Management Plan. City of Oakland Department of Public Works, Oakland, California, May 1979.
Pitt, R. and G. Shawley. A Demonstration of Non-Point Source Pollution Management on Castro Valley Creek. Alameda County Flood Control and Water Conservation District (Hayward, CA) for the Nationwide Urban Runoff Program, U.S. Environmental Protection Agency, Water Planning Division, Washington, D.C., June 1982.
Pitt, R. and R. Sutherland. Washoe County Urban Stormwater Management Program; Volume 2, Street Particulate Data Collection and Analyses. Washoe Council of Governments, Reno, Nevada, August 1982.
Pitt, R. Characterizing and Controlling Urban Runoff through Street and Sewerage Cleaning. U.S. EPA. Contract No. R-805929012. EPA/2-85/038. PB 85-186500/AS. 467 pages. Cincinnati, June 1985.
Pitt, R. and J. McLean. Toronto Area Watershed Management Strategy Study - Humber River Pilot Watershed Project. Ontario Ministry of the Environment, Toronto, Ontario, June 1986.

4-76
Pitt, R. Small Storm Urban Flow and Particulate Washoff Contributions to Outfall Discharges. Ph.D. dissertation. Dept. of Civil and Environmental Engineering, the University of Wisconsin, Madison, Wisconsin. Listed in Dissertation Abstracts International, University Microfilms International, Vol. 49, No. 1, 1988. November 1987.
Pitt, R. and J. Voorhees. DETPOND 4: A Water Quality Detention Pond Design Program; Model Documentation and Users Manual. Wisconsin Department of Natural Resources, May 1989.
Pitt, R. and K. Dunkers. “Combined treatment of stormwater and lakewater in Lake Rönningesjön, Sweden.” 12th Annual International Symposium, North American Lake Management Society, Cincinnati, Ohio, November 1992.
Pitt, R. “Detention pond design for water quality improvement.” National ASCE Hydraulic Conference. San Francisco, California. July 1993a.
Pitt, R. “The stormwater quality detention pond model (DETPOND).” 26th Annual Water Resources Conference. University of Minnesota. October 1993b.
Pitt, R. and K. Dunkers. “Lake water quality improvements from treatment of stormwater using the Flow Balancing Method.” 66th Annual Water Environment Federation Conference. Anaheim, California. October 1993.
Pitt, R. E., Field, R. I., Lalor, M. M., Adrian, D. D., Barbe', D.. Investigation of Inappropriate Pollutant Entries into Storm Drainage Systems: A User's Guide. Rep. No. EPA/600/R-92/238, NTIS Rep. No. PB93-131472/AS, US EPA, Storm and Combined Sewer Pollution Control Program (Edison, New Jersey), Risk Reduction Engineering Lab., Cincinnati, Ohio. 1993
Pitt, R. “Water quality trends from stormwater controls.” In: Stormwater NPDES Related Monitoring Needs (Edited by H.C. Torno). Engineering Foundation and ASCE. pp. 413-434. 1995a.
Pitt, R. “Preliminary investigation of EquaFlow system for Town Lake, Austin, TX.” Unpublished report prepared for Loomis and Associates and the City of Austin, TX, October 1995b.
Pitt, R. Groundwater Contamination from Stormwater. ISBN 1-57504-015-8. Ann Arbor Press, Inc. Chelsea, Michigan. 219 pages. 1996.
Pitt, R., R. Field, M. Lalor, and M. Brown. “Urban stormwater toxic pollutants: assessment, sources and treatability.” Water Environment Research. Vol. 67, No. 3, pp. 260-275. May/June 1995. Discussion and closure in Vol. 68, No. 4, pp. 953-955. July/August 1996.
Pitt, R. E. and Lalor, M. M. Final Draft Report: Demonstration Project for the Investigation of Inappropriate Pollutant Entries into Storm Drainage Systems. Contract No.68-C9-0033, U.S. Environmental Protection Agency, Risk Reduction Engineering Lab., Cincinnati, Ohio. To be published in 1997.
Pitt, R. “The control of toxicants at critical source areas.” In: Effects of Watershed Development and Management on Aquatic Ecosystems. Engineering Foundation Conference: Effects of Watershed Development & Management on Aquatic Ecosystems. Snowbird, Utah. August 4-9, 1996. To be published in 1997.
Pitt, R., R. Field, and K. Gordon. An Evaluation of Storm Drainage Inlet Devices for Stormwater Quality Treatment. Cooperative agreement CR 819573. U.S. Environmental Protection Agency, Risk Reduction Engineering Lab., Cincinnati, Ohio. To be published in 1997.
Poertner, H.G. Practices in Detention of Urban Stormwater Runoff. American Public Works Association, OWRR Contract No. 14-31-0001-3722, Chicago, 1974.
Poertner, H.G. Stormwater Management in the United States. Office of Water Research and Technology. Dept. of the Interior. Project No. C-5239. September 1980.
Pratt, C.J., G.E.P. Elliott, and G.A. Fulcher. “Suspended solids discharge from highway gully pots in a residential catchment.” The Science of the Total Environment. Vol. 59. pp. 355-364. 1987.
Pratt, C.J., J.D.G. Mantle, and P.A. Schoffield. “Urban stormwater reduction and quality improvement through the use of permeable pavements.” Urban Discharges and Receiving Water Quality Impacts. Pergamon Press, Oxford, 1989, pp. 123-132. 1989.
Pratt, C.J. “Permeable pavements; design and maintenance” Developments in Storm Drainage - A Symposium on Infiltration and Storage of Stormwater in New Developments. Sheffield City. Jan. 1990. Pp. 136 - 151. 1990.
Pratt, C.J. “An assessment of effectiveness of a BMP strategy in urban drainage in the U.K.” Proceedings of the 6th International Conference on Urban Storm Drainage. Edited by J. Marsalek and H.C. Torno. Niagara Falls, Ontario. September 12 - 17, 1993. IAWQ, London. Published by Seapoint Publishers, Victoria, B.C. pp. 951 - 956. 1993.
Pratt, C.J. and J.J.M. Powell. “A new UK approach for the design of sub-surface infiltration systems.” Proceedings of the 6th International Conference on Urban Storm Drainage. Edited by J. Marsalek and H.C. Torno. Niagara Falls, Ontario. September 12 - 17, 1993. IAWQ, London. Published by Seapoint Publishers, Victoria, B.C. pp. 987 - 992. 1993.

4-77
Pratt, C.J., J.D.G. Mantle, and P.A. Schoffield. “UK research into the performance of permeable pavement, reservoir structures in controlling stormwater discharge quantity and quality.” International Conference NOVATECH 95, Lyon, pp. 337-344. 1995.
Pratt, C.J. “Research and development in methods of soakaway design.” Journal of the Chartered Institution of Water and Environmental Management. Vol. 10, no. 1, pp. 47-51. Feb. 1996.
Ranchet, J., F. Penaud, R. Le Grand, A. Constant, P. Obry, and B. Soudieu. (1993). “Comparison of an impervious pavement and a porous pavement from hydraulic and stormwater pollutant removal points of view.” (in French) Bulletin de Liaison des Laboratoires des Ponts et Chaussées, no 188 November/December 1993.
Roberts, B. “Storm-water treatment goes underground.” Civil Engineering. pp. 56-57. July 1996. Robertson, B., R. Pitt, A. Ayyoubi, and R. Field. “A multi-chambered stormwater treatment train.” In: Stormwater
NPDES Related Monitoring Needs (Edited by H.C. Torno). Engineering Foundation and ASCE. pp. 631-640. 1995. Roesner, L.A., B.R. Urbonas and M.B. Sonnen, editors. Design of Urban Runoff Quality Controls. Proceedings of an
Engineering Foundation Conference on Current Practice and Design Criteria for Urban Quality Control, American Society of Civil Engineers, NY. 1989.
Rosted Petersen, C.O., P. Jacobsen, P.S. Mikkelsen. “Design of stormwater infiltration for reduction of combined sewer overflow (CSO).” Water Science and Technology, Vol. 30, no. 1, pp. 53-61. 1994.
Rubin, Alan J. and D.L. Mercer. "Adsorption of free and complexed metals from solution by activated carbon." In: Adsorption of Inorganics at Soli4-Liquid Interfaces. Edited by Marc A. Anderson and Alan J. Rubin. Ann Arbor Science Publishers, Inc., Ann Arbor, Michigan, 1981. pp. 295-326.
Rupperd, Y. “A lamellar separator for urban street runoff treatment.” (in French) Bulletin de Liaison des Laboratoires des Ponts et Chaussées, no 183, pp 85-90.1993.
Salvato, J.A. Environmental Engineering and Sanitation. 4th Ed. John Wiley & Sons. NY. 1992. Sartor, J. and G. Boyd. Water Pollution Aspects of Street Surface Contaminants. U.S. EPA. Contract No. 14-12-921.
EPA-R2-72-081. 236 pages. Washington, D.C., November 1972. Sartor, J.D., G.B. Boyd, and F.J. Agardy. “Water pollution aspects of street surface contaminants.” Journal of Water
Pollution Control Federation, vol. 46, no 3, pp 458-467. 1974. Schmitt, T.G. “Integrated storm water management in urban areas.” European Water Pollution Control. Vol. 6, no. 3,
pp. 14 - 20. May 1996. Schimmenti, F.G. “Stormwater detention basins must control more than runoff.” American City and County.
December 1980. Schumacher, J.W. and R.F. Grimes. “A model public education process for stormwater management.” Public Works.
Vol. 123. pp. 55 - 58. September 1992. Schueler. T. Controlling Urban Runoff: A Practical Manual for Planning and Designing Urban Best Management
Practices. Metropolitan Washington Council of Governments. 280 pgs. 1987. Schueler, T.R. and J. Galli. “The environmental impact of stormwater ponds.” Engineering Foundation Conference:
Urban Runoff and Receiving Systems: An Interdisciplinary Analysis of Impact, Monitoring, and Management. Mt. Crested Butte, Colorado. August 4-9, 1991. Published by the American Society of Civil Engineers, New York, June 1992.
Schueler, T. (editor). “Hydrocarbon hotspots in the urban landscape: can they be controlled?” Watershed Protection Techniques. Vol. 1, No. 1, pp. 3 - 5. Feb. 1994.
Schueler, T. (editor). “Vegetated rock filter treats stormwater pollutants in Florida” Watershed Protection Techniques. Vol. 2, No. 2, pp. 372 - 374. Spring 1996.
Schueler, T. (editor). “Ditches or biological filters? Classifying the pollutant removal performance of open channels” Watershed Protection Techniques. Vol. 2, No. 2, pp. 379 - 383. Spring 1996.
SEMCOG (Southeast Michigan Council of Governments). Detention Basin Maintenance, Program Needs and Financing Options. Technical Bulletin No. 3, Detroit, Michigan, May 1981.
Shaver, Earl. Use of Sand Filters as an Urban Stormwater Management Practice. State of Delaware Department of Natural Resources and Environmental Control.
Smith, W.G. “Water quality enhancement through stormwater detention.” Proceedings of the Conference on Stormwater Detention Facilities, Planning, Design, Operation, and Maintenance, Henniker, New Hampshire, Edited by W. DeGroot, published by the American Society of Civil Engineers, New York, August 1982.
Stahre, P. “Assessment of BMP’s being used in Scandinavia.” Proceedings of the 6th International Conference on Urban Storm Drainage. Edited by J. Marsalek and H.C. Torno. Niagara Falls, Ontario. September 12 - 17, 1993. IAWQ, London. Published by Seapoint Publishers, Victoria, B.C. pp. 939 - 944. 1993.

4-78
Stahre, P. and B. Urbonas. Stormwater Detention for Drainage, Water Quality and CSO Management. Prenticd Hall. Englewood Cliffs. 340 pgs. 1990.
Stanley, D.W. “Pollutant removal by a stormwater dry detention pond.” Water Environment Research. Vol. 68, no. 6, pp. 1076 - 1083. Sept./Oct. 1996.
Stenmark, C. “Local infiltration of urban storm water in cold climate.” Proceedings of the 5th International Conference on Urban Storm Drainage. Osaka, Japan. July 1990. pp. 809 - 814. 1990.
Stenmark, C. “An alternative road construction for stormwater management in cold climates.” Water Science & Technology. Vol. 32, no. 1, pp. 79 - 84. 1995.
Sutherland, R.C. and S.L. Jelen. “Sophisticated stormwater quality modeling is worth the effort.” In: Advances in Modeling the Management of Stormwater Impacts. Edited by W. James. Computational Hydraulics International. Guelph, Ontario. 1996.
Sutherland, R.C. “Studies show sweeping has beneficial impact on stormwater quality.” APWA Reporter. pp. 8 - 23. 1996.
Swaffield, J.A. and L.S. Gallowin. The Engineered Design of Building Drainage Systems. Ashgate publishing, Aldershot. 1992.
Sztruhar, D. and H.S. Wheater. “Experimental and numerical study of stormwater infiltration through pervious parking lots.” Proceedings of the 6th International Conference on Urban Storm Drainage. Edited by J. Marsalek and H.C. Torno. Niagara Falls, Ontario. September 12 - 17, 1993. IAWQ, London. Published by Seapoint Publishers, Victoria, B.C. pp. 1098 - 1103. 1993.
Tenney, S., M.E. Barrett, J.F. Malina, R.J. Charbeneau, and G.H. Ward. An Evaluation of Highway Runoff Filtration Systems. Center for Research in Water Resources. Technical Report CRWR 265. The University of Texas at Austin. 133 pgs. September 1995.
Terstriep, M.L., G.M. Bender, and D.C. Noel. Final Report - NURP Project, Champaign, Illinois: Evaluation of the Effectiveness of Municipal Street Sweeping in the Control of Urban Storm Runoff Pollution. State Water Survey Division, Illinois Dept. of Energy and Natural Resources, Champaign-Urbana, Illinois, December 1982.
Thompson, M.K. and W. James. “Provision of parking lot pavements for surface water pollution control studies.” Modern Methods for Modeling the Management of Stormwater Impacts. Edited by W. James. Computational Hydraulics International, Guelph, Ontario. pp. 381 - 398. 1995.
Tyson, J.M. “Quo Vadis - sustainability?” Water Science and Technology Vol.32, No. 5-6, pp1-5. 1995. Urbonas, B. and P. Stahre. Stormwater: Best Management Practices and Detention. Prentice Hall, Englewood Cliffs,
NJ. 1993. Valiron, F. “Usual techniques for stormwater pollutant removal in urban areas.” (in French) Provisory report for the
Seine-Normandie Water Agency, February 1992, 61 p. 1992. Van Buren, M.A., W.E. Watt, and J. Marsalek. “Enhancing the removal of pollutants by an on-stream pond.” Water
Science and Technology. Vol. 33, no. 4 - 5, pp. 325-332. 1996. Vignoles M., and L. Herremans. “Street cleaning: an alternative to stormwater treatment?” (in French). NOVATECH
International Conference, Lyon, 1992, pp 272-283. 1992. Vignoles M., and L. Herremans. “Metal pollution of sediments contained in runoff water in the Toulouse city.” (in
French). NOVATECH 95, 2nd International Conference on Innovative Technologies in Urban Storm Drainage. May 30 - June 1, 1995. Lyon, France. pp. 611-614. Organized by Eurydice 92 and Graie. 1995.
Vignoles, M. and L. Herremans. “Motorway pollution: total suspended solids in runoff water and settling tank design approach.” 69th Annual Water Environment Federation Technical Exposition and Conference (WEFTEC). Dallas, TX. Water Environment Federation, Alexandria, VA. Vol. 4, parts I and II. Pp. 167-176. 1996.
Virginia Soil and Water Conservation Commission. Virginia Erosion and Sediment Control Handbook . 1980. W&H Pacific (now Stormwater Management). Compost Storm Water Filter (CSF): Answers to Typical Questions.
Stormwater Management, Portland, Oregon. 1992. W&H Pacific (now Stormwater Management). Compost Storm Water Treatment System: Executive Summary.
Stormwater Management, Portland, Oregon. 1992. W&H Pacific (now Stormwater Management). Methods and Results Summary: Compost Storm Water Filter System.
Stormwater Management, Portland, Oregon. 1992. Wada, Y. and H. Miura “Effect and evaluation of storm runoff control by permeable combined infiltration facilities for
controlling storm runoff.” Proceedings of the 5th International Conference on Urban Storm Drainage. Osaka, Japan. July 1990. pp. 789 - 794. 1990.

4-79
Wada, Y. and H. Miura “Prediction and estimation of stormwater runoff control by the combined stormwater infiltration facilities with simulation model.” In: Integrated Stormwater Management. Edited by R. Field, M.L. O’Shea, and K.K. Chin. Lewis Publishers. Boca Raton. pp. 337 - 353. 1993.
Wang, T.S., D.E. Spyridakis, B.W. Mar, and R.R. Horner. Transport Deposition and Control of Heavy Metals in Highway Runoff. WA-R4-39.10, U.S. Dept. of Transportation and Washington State Department of Transportation, Seattle, January 1980.
Water Environment & Technology. “Illinois turns to communities for grassroots watershed work.” pg. 19. March 1996.
Whipple, W., Jr. And J.V. Hunter. “Settleability of urban runoff pollution.” Water Pollution Control Federation Journal. Vol. 53, no. 12. pp. 1726-1731. Dec. 1981.
Wiegand, C., T. Schueler, W. Chittenden, and D. Jellick. “Comparative costs and cost effectiveness of urban best management practices.” Engineering Foundation Conference: Urban Runoff Quality - Impact and Quality Enhancement Technology. Henniker, New Hampshire, edited by B. Urbonas and L. A. Roesner, published by the American Society of Civil Engineers, New York, June 1986.
Wigington, P. J., C. W. Randall, and T. J. Grizzard. “Accumulation of selected trace metals in soils of urban runoff detention basins.” Water Resources Bulletin, Vol. 19, no. 5, pg. 709, October 1983.
Willett, Gerald. Urban Erosion, in National Conference on Urban Erosion and Sediment Control; Institutions and Technology. EPA 905/9-80-002. U.S. Environmental Protection Agency, 1980.
Williams, L.H. “Effectiveness of stormwater detention.” Proceedings of the Conference on Stormwater Detention Facilities, Planning, Design, Operation, and Maintenance, Henniker, New Hampshire, Edited by W. DeGroot, published by the American Society of Civil Engineers, New York, August 1982.
Wind, S. “Three years after - failure or success.” Land and Water, Vol. 40, no. 6, pg. 37. Nov./Dec. 1996. Yamada, K. “Infiltration pitch for individual houses to mitigate storm water impact.” Proceedings of the 6th
International Conference on Urban Storm Drainage. Edited by J. Marsalek and H.C. Torno. Niagara Falls, Ontario. September 12 - 17, 1993. IAWQ, London. Published by Seapoint Publishers, Victoria, B.C. pp. 1110 - 1114. 1993.
Yousef, Y.A., M.P. Wanielista, and H.H. Harper. “Design and effectiveness of urban retention basins.” Engineering Foundation Conference: Urban Runoff Quality - Impact and Quality Enhancement Technology, Henniker, New Hampshire, edited by B. Urbonas and L. A. Roesner, published by the American Society of Civil Engineers, New York, June 1986.
Yousef, Y.A. and L.Y. Lin. “Toxicity of bottom sediments in detention ponds.” Environmental Engineering: Proceedings of the 1990 Specialty Conference. pp. 809 - 816. American Society of Civil Engineering, New York. 1990.
Yu, S.L., S-L. Liao, G.M. Fitch, and S. Long. “Constructed wetlands for stormwater management.” 69th Annual Water Environment Federation Technical Exposition and Conference (WEFTEC). Dallas, TX. Water Environment Federation, Alexandria, VA. Vol. 7, parts I, II, and III. pp. 167-178. 1996.
Yu, S.L., M.A. Kasnick, and M.R. Byearne. “A level spreader/vegetative buffer strip system for urban stormwater management.” In: Integrated Stormwater Management. Edited by R. Field, M.L. O’Shea, and K.K. Chin. Lewis Publishers. Boca Raton. pp. 93 - 103. 1993.