4. utm odourisation seminar cfdflacs and overall conclusion
TRANSCRIPT

STUDY ON EFFECTIVENESS OF COMMERCIAL AND RESIDENTIAL NATURAL GAS ODORISATION
SYSTEM IN PENINSULAR MALAYSIASYSTEM IN PENINSULAR MALAYSIA
SIMULATION STUDY:CFD AND FLACS RESULTSCFD AND FLACS RESULTS
UTM‐MPRC Institute for Oil and Gas( OG)
Tuesday, 29th October, 2013
(IFOG)Universiti Teknologi Malaysia
y 9 3ST Office
COMPUTATIONAL FLUID ANALYSIS (CFD) RESULTS(CFD) RESULTS
Simulation at Selected Pre‐Determined Condition
2

Figures 6.1 and 6.2 below illustrate a simple horizontal main pipe with two sets of branch pipe gas layout arrangement, i.e. vertical and horizontal, that has been modelled to simulate gas transport of natural gas (i e methane) and odorant vapourof natural gas (i.e. methane) and odorant vapour (80 wt% TBM and 20 wt% DMS) mixture.
3

Figure 6.1: A Horizontal Branch Gas Pipe Layout
Figure 6.2: A Vertical Branch Gas Pipe Layout
4

• Table 6.1 below summarises the average mass fraction of TBM and DMS measured at the gas exit points of main pipe and of two branch pipe gas models i e vertical branch and horizontal branchpipe gas models, i.e. vertical branch and horizontal branch.
• Natural gas and odorant flow rates were set at 0.25 kg/s and 0.0025 kg/s, respectively, thus simulating 1 % of odorant concentration (i.e. average mass fraction of 0.0099 kg odorant/kg gas mixture) in flowing gas. T
• he outlet gas flow rates at the main and the branch were set at 90 % g fand 10 % of the inlet gas flow, respectively.
• The simulation was performed assuming high flow gas conditions with steady state flow standard k e turbulent model and default CFDwith steady‐state flow, standard k‐e turbulent model and default CFD values.
5
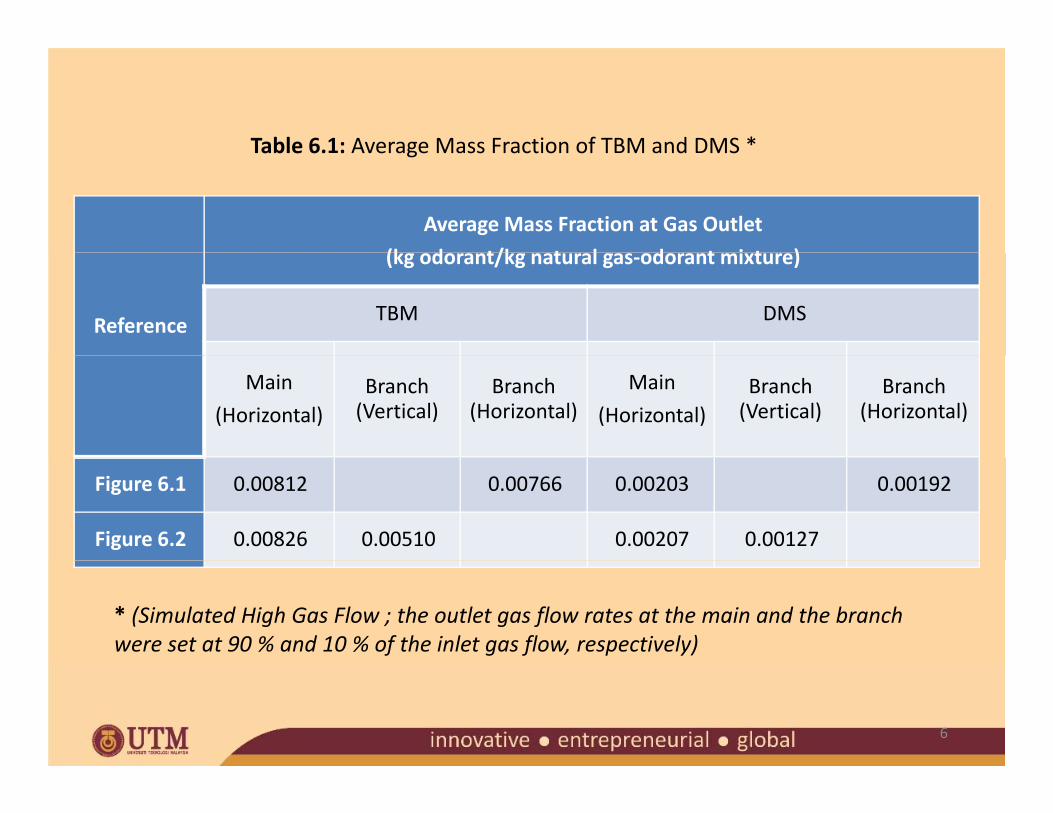
Table 6.1: Average Mass Fraction of TBM and DMS *
Average Mass Fraction at Gas Outlet
(k d t/k t l d t i t )
Table 6.1: Average Mass Fraction of TBM and DMS
Reference
(kg odorant/kg natural gas‐odorant mixture)
TBM DMS
Main
(Horizontal)Branch (Vertical)
Branch (Horizontal)
Main
(Horizontal)Branch (Vertical)
Branch (Horizontal)
Figure 6.1 0.00812 0.00766 0.00203 0.00192
Figure 6.2 0.00826 0.00510 0.00207 0.00127
* (Simulated High Gas Flow ; the outlet gas flow rates at the main and the branch were set at 90 % and 10 % of the inlet gas flow, respectively)
6
• Comparison of the average mass fraction of TBM at the main and branch outlets for both pipe layouts clearly show higher TBMbranch outlets for both pipe layouts clearly show higher TBM concentration at the former, thus indicating more odorant being transported along a horizontal pipe at a high gas flow rate.
Th f ti f TBM f th i tl t f b th i• The average mass fraction of TBM for the main outlet of both pipe layouts is quite similar, however higher TBM concentration at the horizontal branch is demonstrated. This again shows the significant effects of higher TBM specific gravity and pipe elevation on theeffects of higher TBM specific gravity and pipe elevation on the odorant distribution pattern.
• Detailed explanation for this phenomenon has been discussed in h i i Th h i l d dthe previous section. The same phenomenon is also demonstrated for DMS.
7
• Table 6.2 below summarises the average mass fraction of TBM and DMS measured at the gas exit points of main pipe and of two branch pipe gas models, i.e. vertical branch and horizontaltwo branch pipe gas models, i.e. vertical branch and horizontal branch.
• Natural gas and odorant flow rates were set at 0.25 kg/s and 0 0025 k / ti l th i l ti 1 % f d t0.0025 kg/s, respectively, thus simulating 1 % of odorant concentration (i.e. average mass fraction of 0.0099 kg odorant/kg gas mixture) in flowing gas.
• The outlet gas flow rates at the main and the branch were set 50 % and 50 % of the inlet gas flow, respectively.
• The simulation was performed assuming high flow gasThe simulation was performed assuming high flow gas conditions with steady‐state flow, standard k‐ε turbulent model and default CFD values.
8
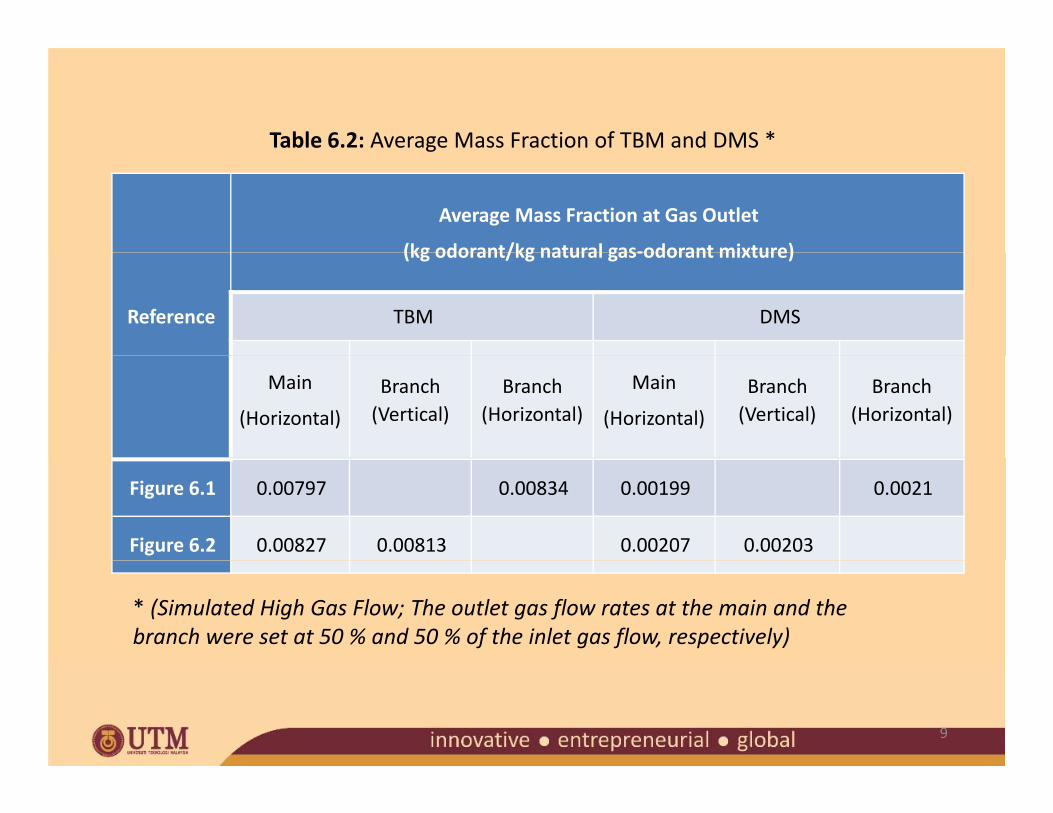
Table 6.2: Average Mass Fraction of TBM and DMS *
Average Mass Fraction at Gas Outlet
(kg odorant/kg natural gas‐odorant mixture)
g
Reference
(kg odorant/kg natural gas‐odorant mixture)
TBM DMS
Main
(Horizontal)
Branch (Vertical)
Branch (Horizontal)
Main
(Horizontal)
Branch (Vertical)
Branch (Horizontal)
Figure 6.1 0.00797 0.00834 0.00199 0.0021
Figure 6.2 0.00827 0.00813 0.00207 0.00203
* (Simulated High Gas Flow; The outlet gas flow rates at the main and the branch were set at 50 % and 50 % of the inlet gas flow, respectively)
9
• Comparison of the average mass fraction of TBM at the main and branch outlets for both pipe layouts clearly show
i l id i l l h i di i if TBMapproximately identical values, thus indicating uniform TBM concentration were present in both horizontal and vertical pipes.
• The average mass fraction of TBM and DMS at the both branch outlets was higher, in particular TBM at vertical branch outlet, than that as compared the predicted values in Table 6.1.
• This shows that as long as the gas flow rate are high enough to carry the odorant along with natural gas, the effects of pipe elevation on the odorant distribution pattern is insignificant.
• Detailed explanation for this phenomenon has been discussed in the previous section.
10
• Table 6.3 below summarises the average mass fraction of TBM and DMS measured at the gas exit points of main pipe and of
b h i d l i i l b h d h i ltwo branch pipe gas models, i.e. vertical branch and horizontal branch.
• Natural gas and odorant flow rates were set at 0.025 kg/s and 0.00025 kg/s, respectively, thus simulating 1 % of odorant concentration (i.e. average mass fraction of 0.0099 kg odorant/kg gas mixture) in flowing gas.
• The outlet gas flow rates at the main and the branch were set at 90 % and 10 % of the inlet gas flow, respectively.
• The simulation was performed assuming low gas flow p g gconditions, steady‐ state flow, laminar model and default CFD values.
11
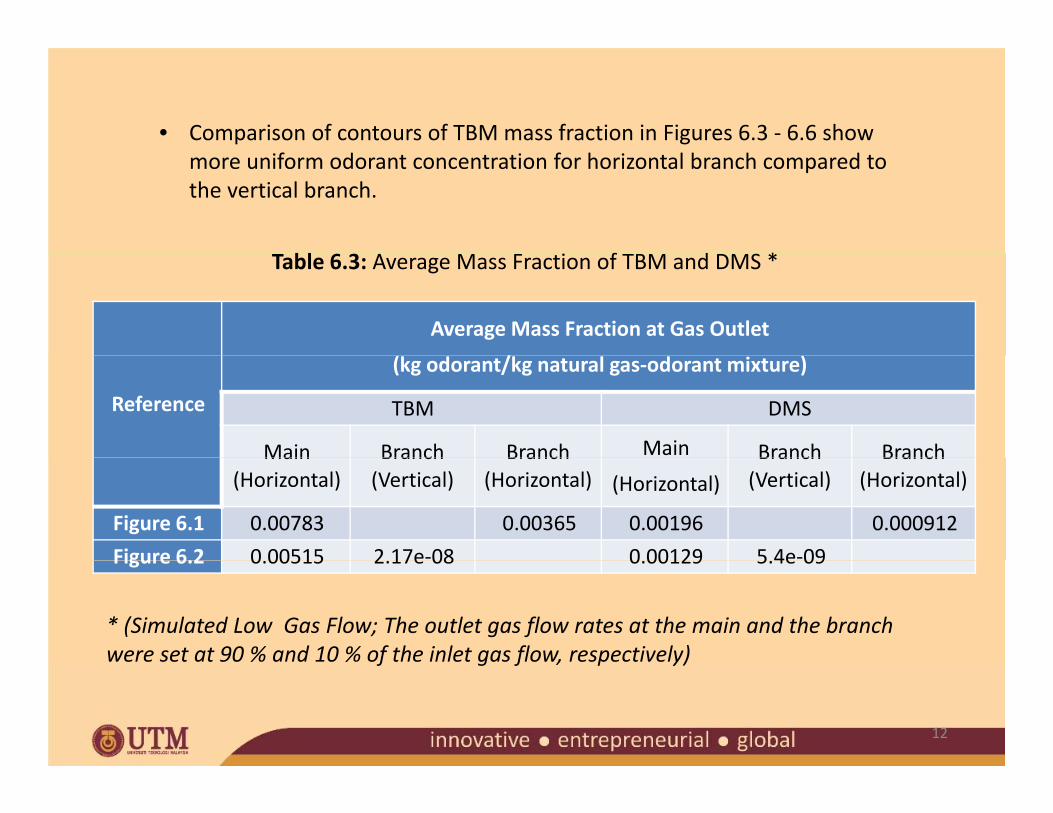
• Comparison of contours of TBM mass fraction in Figures 6.3 ‐ 6.6 show more uniform odorant concentration for horizontal branch compared to the vertical branch.
bl f d *Table 6.3: Average Mass Fraction of TBM and DMS *
Average Mass Fraction at Gas Outlet
/
Reference
(kg odorant/kg natural gas‐odorant mixture)
TBM DMS
Main Branch Branch Main Branch BranchMain (Horizontal)
Branch (Vertical)
Branch (Horizontal) (Horizontal)
Branch (Vertical)
Branch (Horizontal)
Figure 6.1 0.00783 0.00365 0.00196 0.000912
Figure 6.2 0 00515 2 17e‐08 0 00129 5 4e‐09Figure 6.2 0.00515 2.17e 08 0.00129 5.4e 09
* (Simulated Low Gas Flow; The outlet gas flow rates at the main and the branch were set at 90 % and 10 % of the inlet gas flow, respectively)
12
f g f , p y)
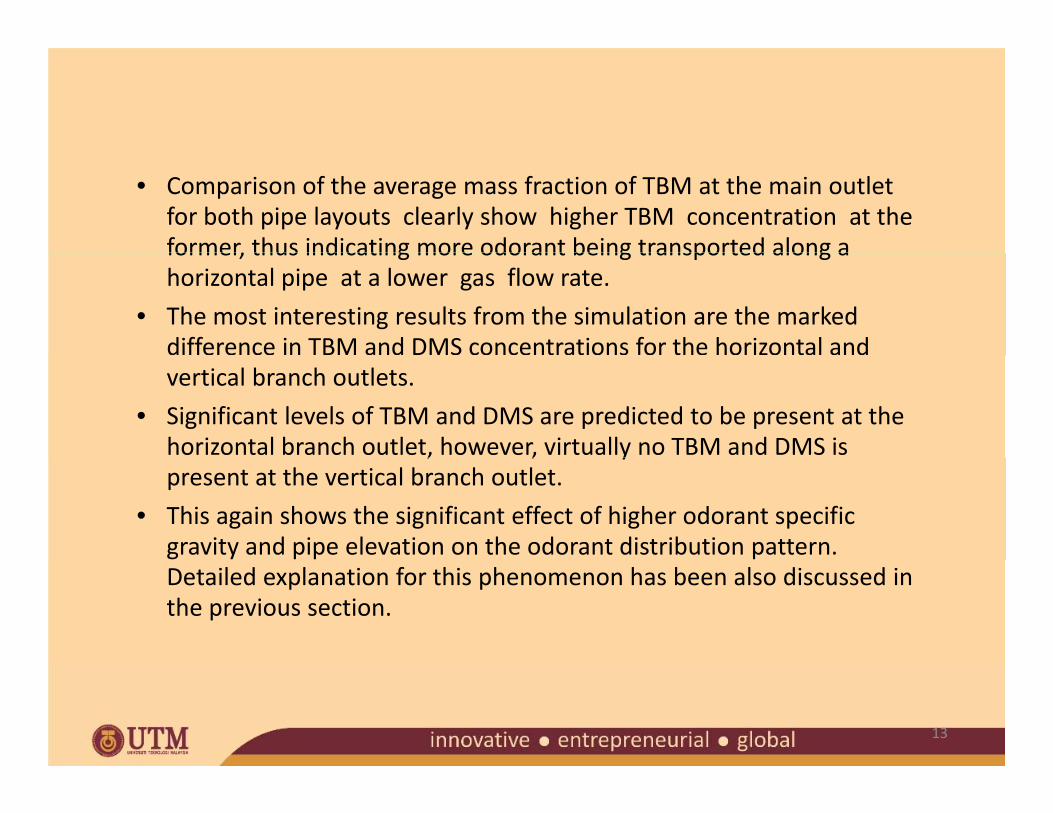
• Comparison of the average mass fraction of TBM at the main outlet for both pipe layouts clearly show higher TBM concentration at the former, thus indicating more odorant being transported along aformer, thus indicating more odorant being transported along a horizontal pipe at a lower gas flow rate.
• The most interesting results from the simulation are the marked difference in TBM and DMS concentrations for the horizontal and vertical branch outlets.
• Significant levels of TBM and DMS are predicted to be present at the horizontal branch outlet, however, virtually no TBM and DMS is , , ypresent at the vertical branch outlet.
• This again shows the significant effect of higher odorant specific gravity and pipe elevation on the odorant distribution pattern. Detailed explanation for this phenomenon has been also discussed in the previous section.
13

• Table 6.4 below summarises the average mass fraction of TBM and DMS measured at the gas exit points of main pipe and of two branch pipe gas models, i.e. vertical branch and horizontal branch.
• Natural gas and odorant flow rates were set at 0.025 kg/s and a u a gas a d odo a o a es e e se a 0 0 5 g/s a d0.00025 kg/s, respectively, thus simulating 1 % of odorant concentration (i.e. average mass fraction of 0.0099 kg odorant/kg gas mixture) in flowing gas. / g g ) g g
• The outlet gas flow rates at the main and the branch were set 50 % and 50 % of the inlet gas flow, respectively.
• The simulation was performed assuming low gas flow• The simulation was performed assuming low gas flow conditions, steady‐ state flow, laminar model and default CFD values
14

Table 6.4: Average Mass Fraction of TBM and DMS *
Reference
Average Mass Fraction at Gas Outlet
(kg odorant/kg natural gas‐odorant mixture)
TBM DMSReference TBM DMS
Main
(Horizontal)
Branch (Vertical)
Branch (Horizontal)
Main
(Horizontal)
Branch (Vertical)
Branch (Horizontal)
Figure 6.1 0.0085 0.0081 0.0021 0.002
Figure 6.2 0.01357 0.0005 0.0034 0.00014
* (Simulated Low Gas Flow; The outlet gas flow rates at the main and the branch were set at 50 % and 50 % of the inlet gas flow, respectively)
15

CFD Conclusion
• The most interesting results from the simulation is the marked increase in TBM and DMS concentrations for the horizontal and in particular vertical branch outlets as compared to the values in Table 6.3.
• This again shows the significant effect of gas flow condition on the odorant distribution pattern. Detailed explanation for this phenomenon has been also discussed in the previous section.
• The analysis of CFD simulation data significantly supports the odorant measurement during the site visit in July and September 2012.
• Two very important factors, i.e. gas consumption rate and pipe gas elevation, which contribute to significant odorant fade especially in pipe gas supply line at high rise buildings such as at Hampshire Park (Ampang) and Harmony Putra Flats (Putra Jaya) have been identified experimentally and computationally.
h l h l d h l• Nevertheless, the CFD simulation indicate that gas consumption rate play a more important role as compared to pipe elevation, i.e. as long as gas consumption rate is high enough, adequate odorant concentration levels can be achieved eventhough at high elevation point of consumption
16
be achieved eventhough at high elevation point of consumption.
FLAME ACCELERATION SIMULATOR (FLACS) RESULTS( )
Case 1: Glenmarie Horizontal Dispersion
Simulation at Selected Pre‐Determined Condition
17

Figure 7.1: The Overall Piping Configuration from Glenmarie odorization Station to Hampshire Park Residence
18
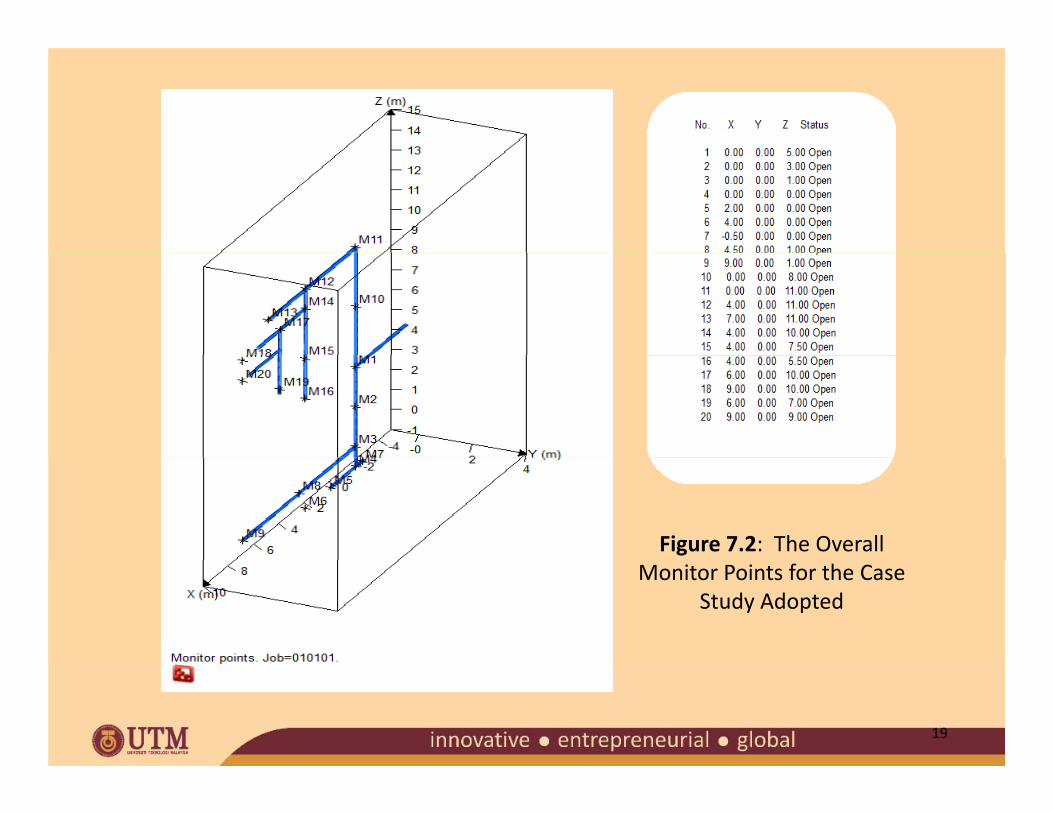
Figure 7.2: The Overall Monitor Points for the Case
Study Adopted
19

20
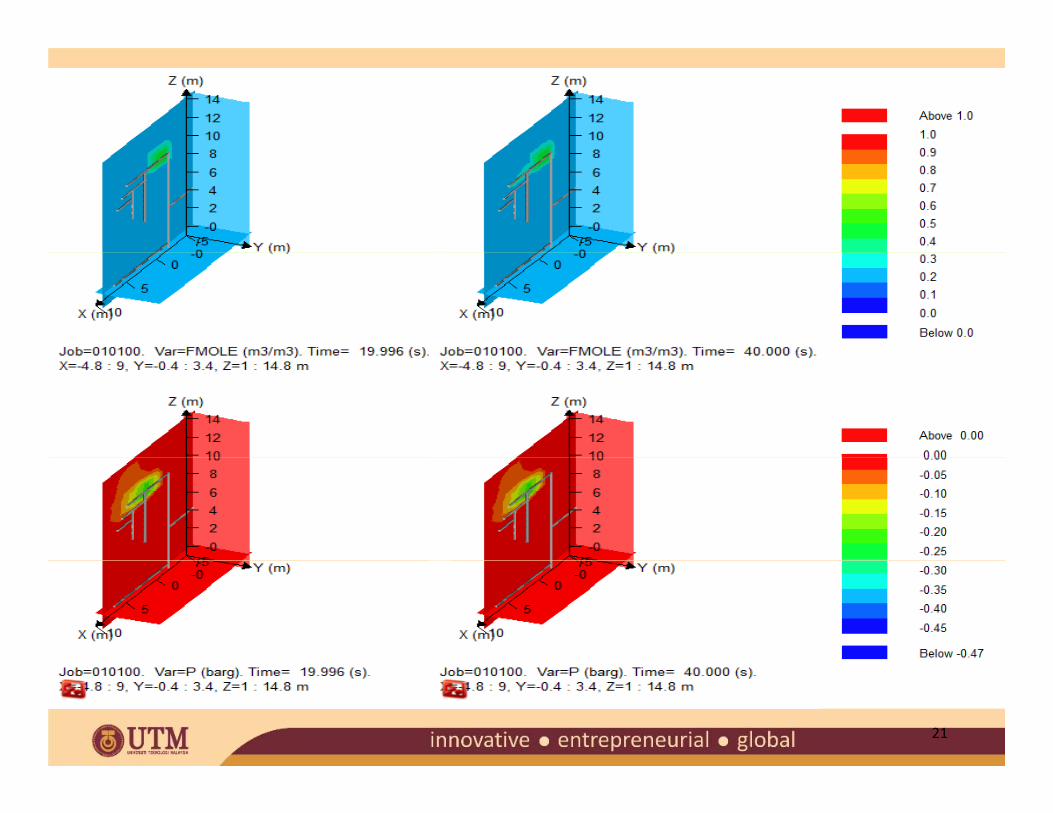
Figure 7.4: Pressure, P and Mole concentration FMOLE profile on Time Step
21

22

FLAME ACCELERATION SIMULATOR (FLACS) RESULTS(FLACS) RESULTS
Case 2 : High‐Rise Building Dispersion
Simulation at Selected Pre‐Determined Condition
23

24
Figure 7.7: Monitor Points of Pipe Configuration
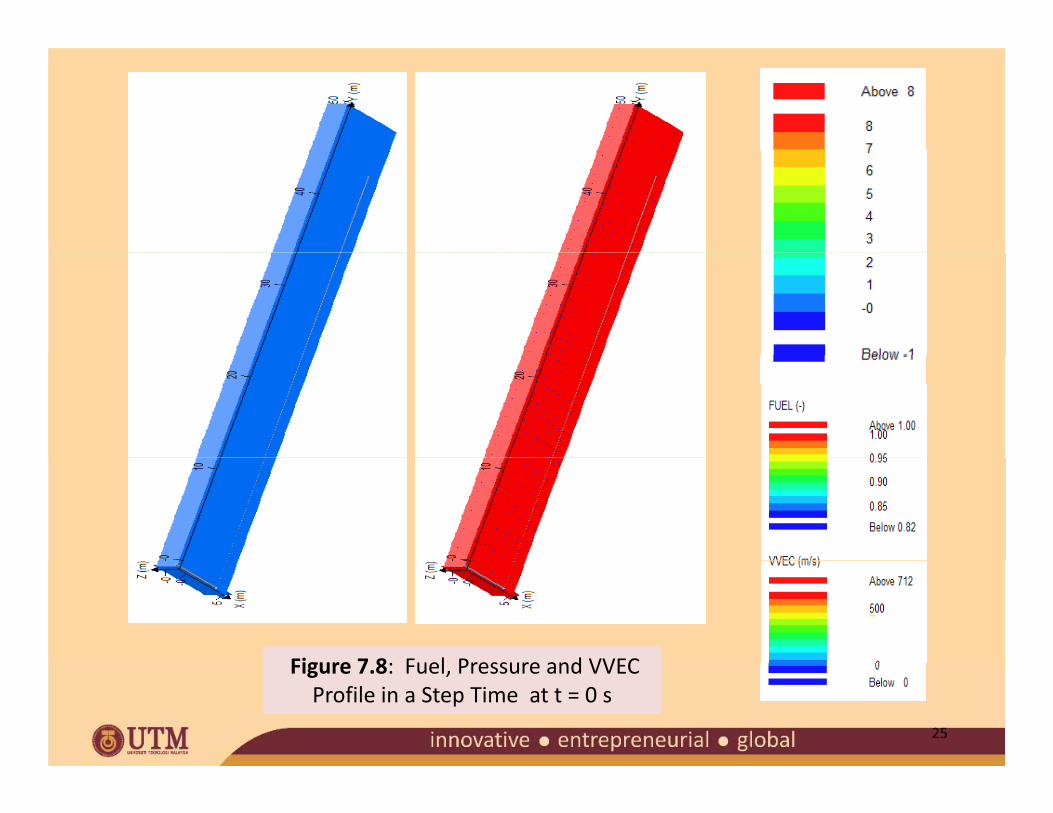
Figure 7 8: Fuel Pressure and VVEC
25
Figure 7.8: Fuel, Pressure and VVEC Profile in a Step Time at t = 0 s
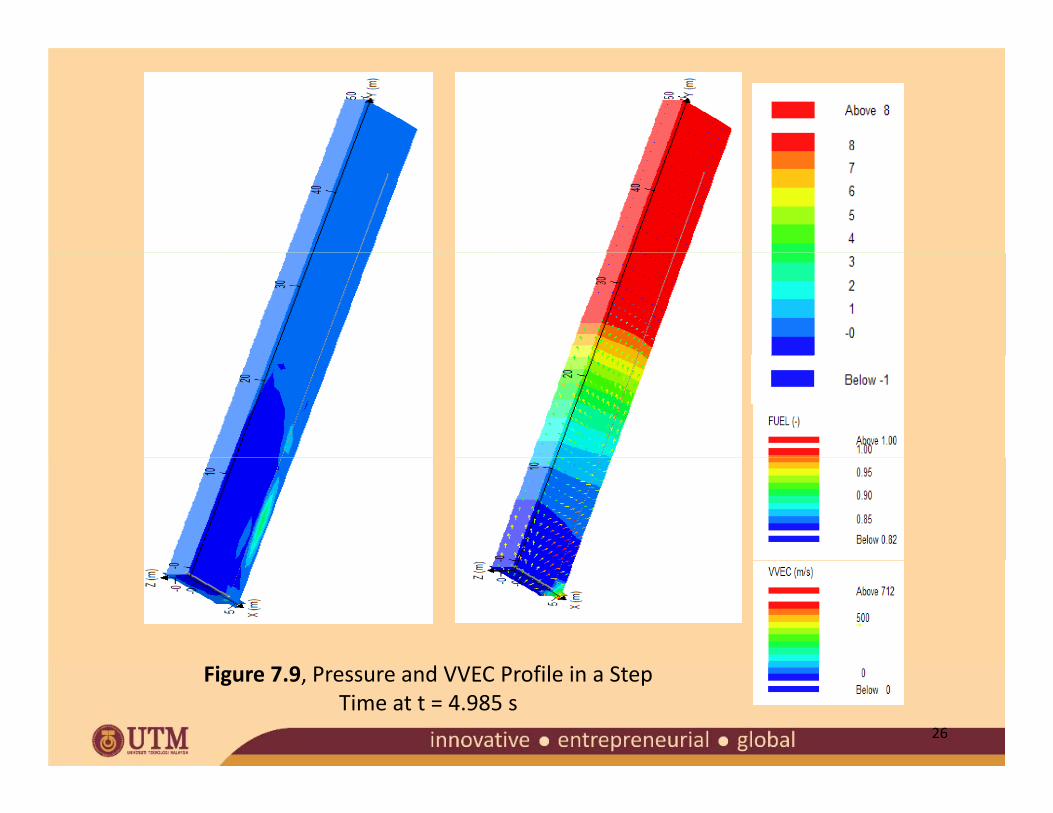
26
Figure 7.9, Pressure and VVEC Profile in a Step Time at t = 4.985 s

Figure 7.10: Monitor points for 15 m Height Building
27

28
Figure 7.11a : Fuel, Pressure and VVEC Profile in a Step Time at t = 0 s for 15 m height building
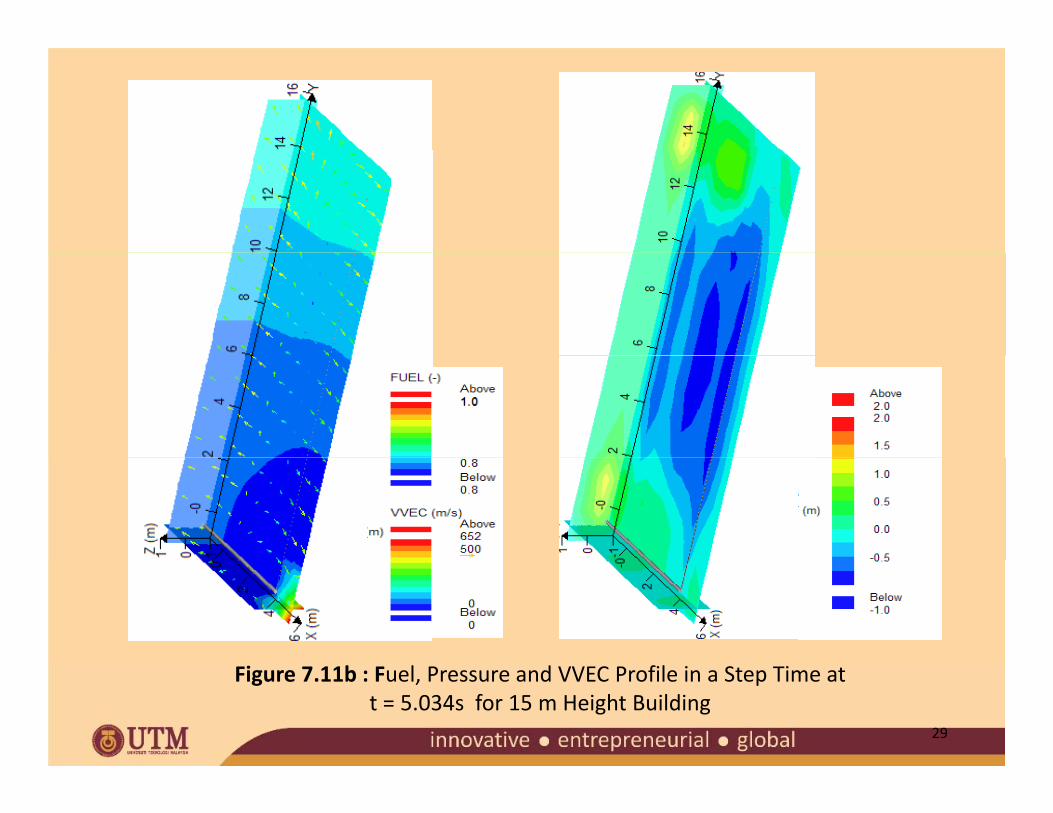
29
Figure 7.11b : Fuel, Pressure and VVEC Profile in a Step Time at t = 5.034s for 15 m Height Building
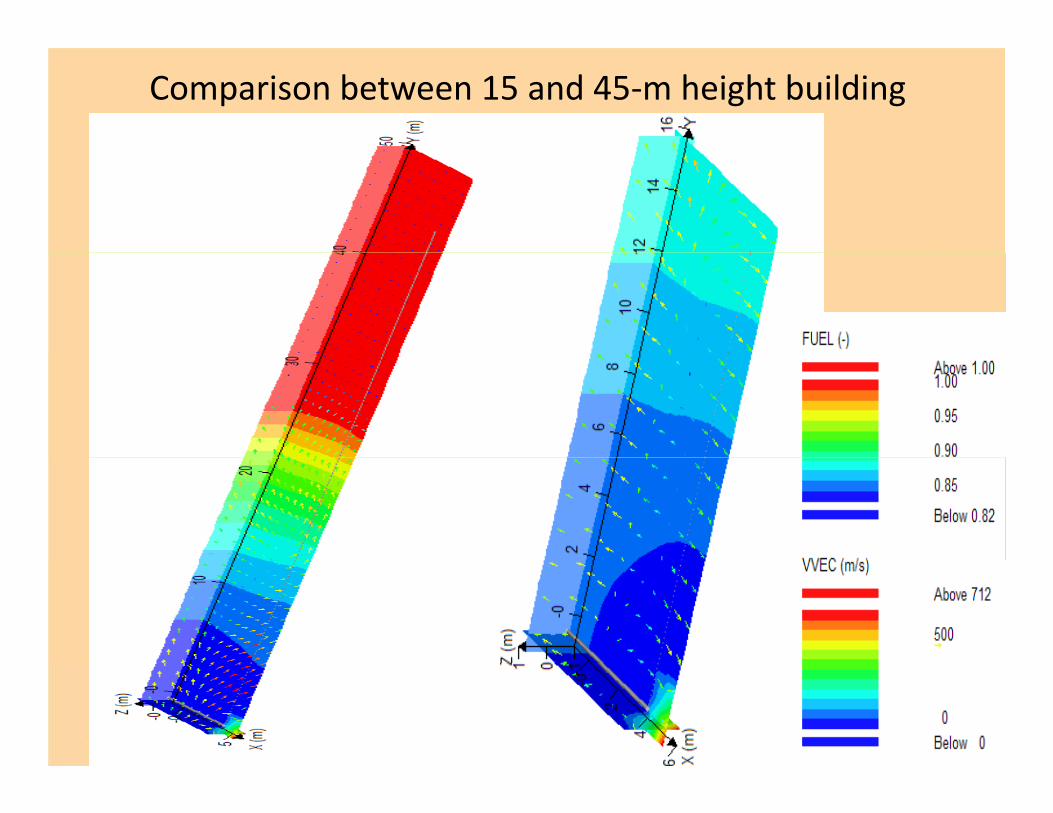
Comparison between 15 and 45‐m height building

Solution for Odor Fade System
•The various factors which affect odorant losses from gas streams in steel pipe include temperature, pressure, gas flow rate and iron oxide concentrationconcentration.
•Generally, the lower the temperature, the greater the odorant loss. This is explicable since the rate of adsorption of gaseous molecules is inversely proportional to temperature [6]proportional to temperature [6].
•Adsorption is directly proportional to pressure at constant temperature. Thus, higher line pressures result in additional adsorption of odorant
l lmolecules.
•At higher flow rates the diffusion of odorant molecules to a pipe surface is less probable, resulting in decreased adsorption and possible subsequent oxidation of the odorant molecules at active sites.
•The iron oxide concentration is a function of the cleanliness of pipe. The cleaner the pipe the smaller the iron oxide concentration.
31
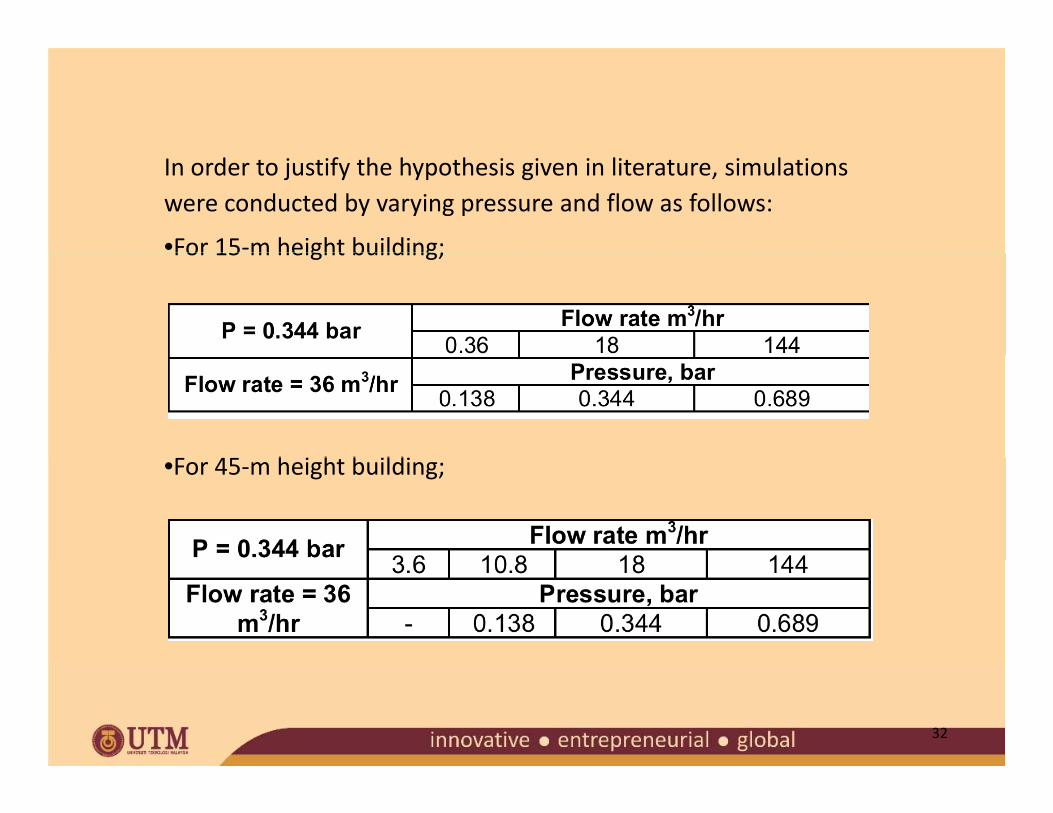
In order to justify the hypothesis given in literature, simulations were conducted by varying pressure and flow as follows:
•For 15‐m height building;For 15 m height building;
F 45 h i h b ildi•For 45‐m height building;
32
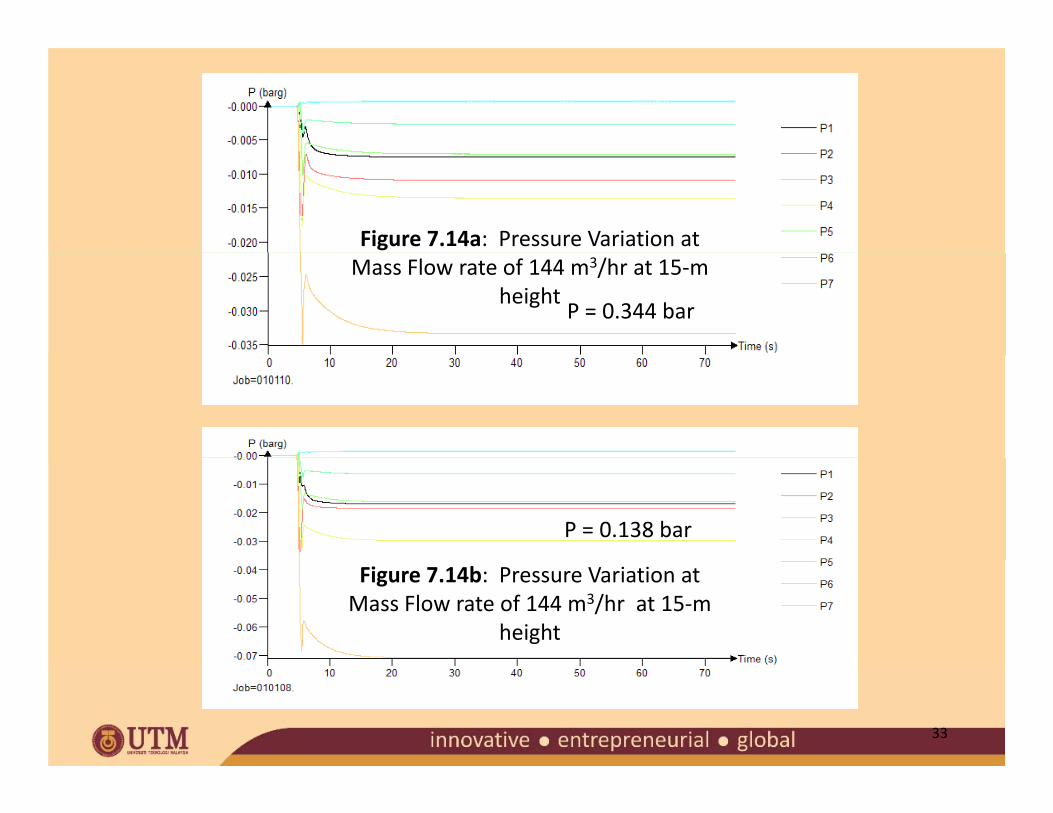
Figure 7.14a: Pressure Variation at Mass Flow rate of 144 m3/hr at 15‐m
heightP = 0.344 bar
P = 0.138 bar
Figure 7.14b: Pressure Variation at Mass Flow rate of 144 m3/hr at 15‐m
height
33

Figure 7.14c: Pressure Variation at Mass Flow rate of 144 m3/hr at 15‐m height
34
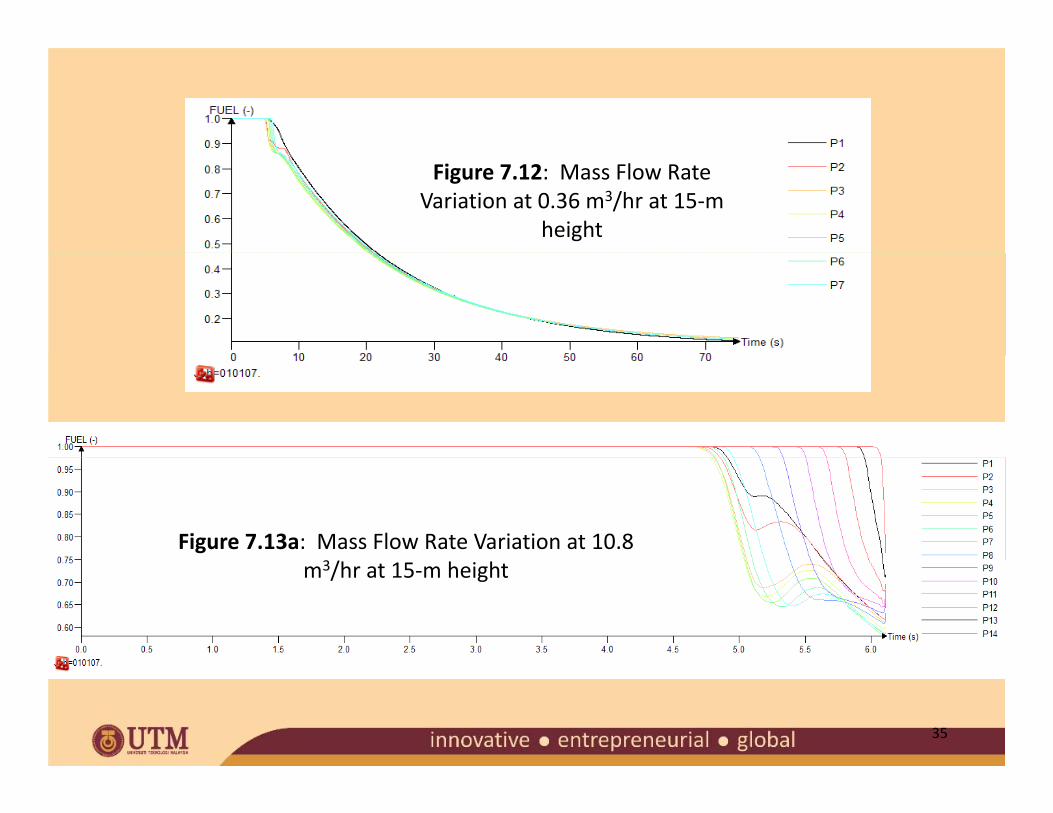
Figure 7.12: Mass Flow Rate Variation at 0.36 m3/hr at 15‐m
height
Figure 7.13a: Mass Flow Rate Variation at 10.8 3/m3/hr at 15‐m height
35
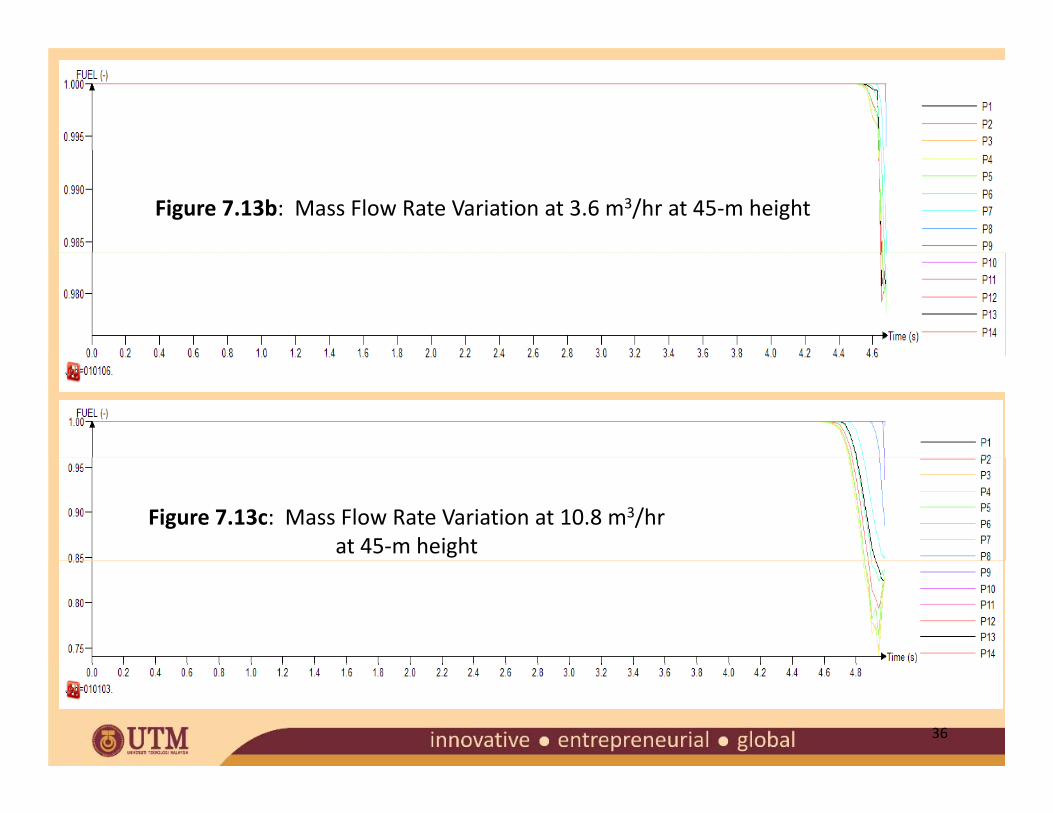
Figure 7.13b: Mass Flow Rate Variation at 3.6 m3/hr at 45‐m height
Figure 7.13c: Mass Flow Rate Variation at 10.8 m3/hr at 45‐m height
36

Figure 7.13d: Mass Flow Rate Variation at 144 m3/hr s at 45‐m height
37

FLACS C l iFLACS Conclusion
•Simulation exercise has been conducted on cases concerning the odor
fade in natural gas pipeline distribution system within Lembah Kelangfade in natural gas pipeline distribution system within Lembah Kelang
regional area.
•Three cases were investigated involving the wide area coverage to include the distribution system for Glenmarie and Serdang odorization Stations;
and case involving high rise building.
A d t b t di t d lt d i it t f•A good agreement between predicted results and in‐situ measurement of
dispersion profile of odorant in gas pipeline was obtained.
•By increasing the gas flow rate in upward sloping pipes, an increasingly y g g p p g p p g y
fine balance between the frictional and gravitational contributions to the
loss of momentum.
38

OVERALL CONCLUSION
The overall conclusion derived on the factual findings via site f f gmeasurement, CFD and FLACS analyses
39
The following conclusions are deduced from detailed findings and factual outcomes obtained from the study conducted yfrom 1st May, 2012 till 31st December, 2012:
•The odorant concentration was found sufficient at odoriser t ti (Gl i ’ d S d ’ l ti ) d idstations (Glenmarie’s and Serdang’s location) and provide adequate sufficiency up to service stations.
•Two important factors were identified to have direct effectTwo important factors were identified to have direct effect towards odorant loss namely rate of gas consumption and altitude level. However, the rate of gas consumption is considered as dominance in contributing highest losses ofconsidered as dominance in contributing highest losses of odorant.
40

• At a lower gas flowrate the loss of odorant is most significant at high elevation consumption point especially at high‐rise residential building.
• From survey conducted, the majority of high‐rise residential gas customers are under utilise the gas facilities that contribute towards lower gas consumption ratetowards lower gas consumption rate.
• The findings indicate that the present odorant concentration at 80 % TBM and 20 % DMS provides adequate natural gas odorization.
• The CFD results qualitatively indicate good agreement with the site‐measurement data.site measurement data.
• The effect of altitude changes towards odorant losses was demonstrated clearly by means of FLACS simulation results.
41

High flow or active gas lines (e.g. SS, RS or AS) experience g g g , plower % odorant loss. In addition, the magnitudes of odorant loss between gas stations are quite significant.
Odorant loss is more prevalent in residential areas where Odorant loss is more prevalent in residential areas where gas consumption rates are relatively lower compared to commercial areas.
Comparison of % odorant loss at different levels of medium (DMC) and high rise flat (PHF) or condominium (SHC) shows the combined effects of low gas consumption and high altitude contribute to even higher odorant loss.
42

RECOMMENDATION
The overall conclusion derived on the factual findings via site f f gmeasurement, CFD and FLACS analyses
43

• Since the gas lower consumption rates are experienced by the majority of the high‐rise building residential customers, it is hi hl d d th t h id ti l t it bhighly recommended that each residential customers unit be installed with natural gas leak detection system.
• It is recommended that further study need to be conducted by y ythe gas utility company (GMB) to look upon possibility of installing Back‐Checked Valve along the pipe route in high‐rise building to provide better retention of odorant at higher levelbuilding to provide better retention of odorant at higher level altitude.
• Extra injection be introduced at level higher than 15‐storey, perhaps located at the roof side of the building.
44

I i d d h h f i i h ld b d i d• It is recommended that the future piping system should be designed with no dead‐end connectivity as such the gas will be trapped and remains stagnant should there be no significant consumption. By having continuous pipe connection with more active customers further downstream, the gas is expected to induce sufficient steadily amount of odorant in the pipe flow regime.
• To integrate scheduled monitoring of odorant levels especially at high‐rise building residential customers.
• To increase the level of usage among high‐rise building residence occupants through continuous promotion of natural gas integrated safety and its continuous benefit.
• The use of CFD and FLACS software could provide additional niche in determining in‐line odorant dispersion and losses at critical region.
45

C O G SACKNOWLEDGEMENTS
The group is extending its sincere gratitude to the Energy Commission (EC) for providing great management and financial assistance, the
staff of Gas Malaysia Berhad (GMB) for their commitment, coordination and enabling data sharing, the staff and project g g, ff p j
members of GASTEG for their full dedication, enthusiasm, hard‐working, discipline and efforts that had enabled the completion of
the project.
46

THANK YOU