40. protocol mrcp concat_sandrasegaran
DESCRIPTION
ddTRANSCRIPT

42 AJR:195, July 2010
is necessary to obtain the following sequenc-es: T1-weighted gradient-echo; T2-weight-ed axial and coronal sequences, usually tur-bo spin-echo (TSE) or a variant of TSE; 2D and 3D MRCP; and T1-weighted 3D gradient-echo before and after gadolinium. S-MRCP is a useful optional sequence. Tables 1 and 2 give the MRI parameters for these sequenc-es on 1.5- and 3-T scanners, respectively. For most patients, it is possible to complete the core sequences and S-MRCP within 20 min-utes. In the following sections, we discuss dif-ferent methods of performing these sequenc-es, while being as vendor-neutral as possible.
Patient PreparationIn our practice, patients fast for 4 hours
before the MRI examination so that the gallbladder is distended and it is possible to adequately assess the exocrine response to secretin. Negative oral contrast is useful to reduce the signal from overlying stomach and duodenum. Pineapple and blueberry juice have been used as oral contrast agents [1–3]. The manganese content of these juic-es results in increased signal on T1-weight-ed images and reduced signal on T2-weight-ed images. We prefer the use of 300 mL of proprietary silicone-coated superparamag-netic iron oxide particle suspension (feru-moxsil, GastroMark, Mallinckrodt Medi-cal) (Fig. 1) taken orally a few minutes before the MRI examination.
State-of-the-Art Pancreatic MRI
Kumaresan Sandrasegaran1
Chen Lin Fatih M. Akisik Mark Tann
Sandrasegaran K, Lin C, Akisik FM, Tann M
1All authors: Department of Radiology and Imaging Science, Indiana University School of Medicine, 550 N University Blvd., UH 0279, Indianapolis, IN 46202. Address correspondence to K. Sandrasegaran ([email protected]).
Gastrointest ina l Imaging • Review
AJR 2010; 195:42–53
0361–803X/10/1951–42
© American Roentgen Ray Society
In the past few years, MRI scanners have become more sophisticated. Current MRI scanners have more than 100 integrated coil elements
and more than 30 independent radiofrequency channels. Shorter scanners with wider bores al-low scanning of obese and claustrophobic pa-tients. Higher field strength (3 T) scanners are increasingly used. Several new sequences have been introduced for performing pancreatic MRI, and 3D T1-weighted and MRCP sequences are routinely used. Secretin-enhanced MR cholang-iopancreatography (S-MRCP) protocols have been developed for a more complete assessment of pancreatic ducts and glandular function. These improvements result in fast sequences with excellent diagnostic quality. We have noted that, with improved image quality and diagnos-tic accuracy, the volume of pancreatic MRI cas-es has substantially increased over the past few years. MRI is used as a problem-solving tool in patients with elevated liver function tests, acute pancreatitis, and pancreatic cancer. In our prac-tice, it is used as the primary investigation for suspected biliopancreatic pain, staging chronic pancreatitis, and diagnosis and follow-up of cystic pancreatic tumors. In this article, we dis-cuss the sequences that form state-of-the-art MRI examination of the pancreas.
MRI SequencesTo fully evaluate the pancreatic parenchy-
ma and the pancreaticobiliary ductal system, it
Keywords: MRCP, MRI, pancreas, secretin
DOI:10.2214/AJR.10.4421
Received February 9, 2010; accepted after revision March 30, 2010.
The Department of Radiology and Imaging Science, Indiana University School of Medicine receives research grants from Siemens Healthcare.
FOCU
S O
N:
OBJECTIVE. The purpose of this article is to discuss the most current techniques used for pancreatic imaging, highlighting the advantages and disadvantages of state-of-the-art and emerging pulse sequences and their application to pancreatic disease.
CONCLUSION. Given the technologic advances of the past decade, pancreatic MRI pro-tocols have evolved. Most sequences can now be performed in one or a few breath-holds; 3D se-quences with thin, contiguous slices offer improved spatial resolution; and better fat and motion suppression allow improved contrast resolution and image quality. The diagnostic potential of MRCP is now almost as good as ERCP, with pancreatic MRI as the main imaging technique to investigate biliopancreatic pain, chronic pancreatitis, and cystic pancreatic tumors at many in-stitutions. In addition, functional information is provided with secretin-enhanced MRCP.
Sandrasegaran et al.Pancreatic MRI
Gastrointestinal ImagingReview
Dow
nloa
ded
from
ww
w.a
jron
line.
org
by 3
9.21
8.29
.138
on
06/0
9/13
fro
m I
P ad
dres
s 39
.218
.29.
138.
Cop
yrig
ht A
RR
S. F
or p
erso
nal u
se o
nly;
all
righ
ts r
eser
ved

AJR:195, July 2010 43
Pancreatic MRI
TABLE 1: Parameters for Pancreatic Imaging on 1.5-T MRI Scanner
Parameter 3D SPGR Dixon T2 2D SSFSE T2 2D STIR T2 2D SSFSE MRCP 2D Slab MRCP 3D MRCP Secretin 3D SPGR FS
Plane of acquisition
Axial Axial Axial Coronal Coronal Coronal Coronal Axial
TR/TE (msec) 7.47/4.76 (in), 2.38 (out) 1,100/90 2,900/132 (TI 150) 1,100/90 2,000/755 2,500/691 2,000/756 5.17/2.52
Flip angle (°) 10 130–50 180 130 180 Variable 1 12
ST/SG (mm) 3.4/— 4.0/4.0 7 4.0/4.0 40 1/— 40 3.0/—
NEX 1 1 1 1 1 2 1 1
RBW (Hz/pixel) 290 475 250 476 300 372 300 300
Phase direction Anterior to posterior Anterior to posterior Anterior to posterior Right to left Right to left Right to left Right to left Anterior to posterior
Echo-train length 1 160 33 192 320 189 256 1
Matrix 256 × 120 256 × 192 256 × 180 256 × 192 256 × 256 384 × 346 256 × 256 256 × 144
Field of view (mm) 400 360 360 360 290 350 290 360
Respiration Breath-hold Breath-hold Breath-hold Breath-hold Breath-hold Navigator Breath-hold Breath-hold
Fat saturation No No Inversion recovery No Fat sat Fat sat Fat sat Fat sat
Concatenation 1 3 4 3 8 1 1 1
Parallel imaging 2 No No No No 3 No 2
Scan time (min:s) 0:12 0:44 0:58 0:31 0:18 3:55 0.03 (9:58) 0:18 (3:28)
Note—These are guidelines for use on a Magnetom Avanto 1.5-T MRI scanner (Siemens Healthcare). The names of the sequences and parameter values may vary with other scanners. Where parallel imaging is used, the number given is the acceleration factor. Parallel imaging is typically performed with GRAPPA (generalized autocalibrating partially parallel acquisition). The scan time given in parentheses is the total scan time for performing the secretin-enhanced MRCP series and the three gadolinium- enhanced series. 3D SPGR Dixon = 3D nonfat-saturated spoiled gradient-echo sequence for chemical shift imaging, SSFSE = half single-shot fast spin-echo sequence, 3D SPGR FS = fat-saturated 3D spoiled gradient-echo T1-weighted sequence for contrast-enhanced imaging, ST/SG = slice thickness and slice gap (2D MRCP and secretin MRCP slabs are single slabs of 40-mm thickness; 3D sequences do not have slice gap), NEX = number of excitations, RBW = receiver bandwidth, FOV = field of view, Navigator = navigator-monitored respiratory triggering, Fat sat = spectral selective fat saturation, Concatenation = number of interleaved acquisitions or number of breath-holds.
TABLE 2: Parameters for Pancreatic Imaging on 3-T MRI Scanner
Parameter 3D SPGR Dixon T2 2D SSFSE T2 2D SSFSE MRCP 2D Slab MRCP 3D MRCP Secretin 3D SPGR FS
Plane of acquisition Axial Axial Coronal Coronal Coronal Coronal Axial
TR/TE (msec) 5.45/2.45 (in), 3.68 (out) 2,000/96 2,000/97 4,500/622 2,400/719 4,500/746 4.19/1.47
Flip angle (°) 9 150 150 160 Variable 180 9
ST/SG (mm) 4.0/— 5/5.2 4/4.4 40/— 1.2/— 40/— 2.6/—
NEX 1 1 1 1 2 1 1
RBW (Hz/pixel) 500 or 780 780 780 383 318 161 350
Phase direction Anterior to posterior Anterior to posterior Right to left Right to left Right to left Right to left Anterior to posterior
Echo-train length 1 168 256 307 101 288 1
Matrix 320 × 224 320 × 224 320 × 256 384 × 306 380 × 380 384 × 306 308 × 210
Field of view (mm) 400 380 350 300 380 300 400
Respiration Breath-hold Breath-hold Navigator Breath-hold Navigator Breath-hold Breath-hold
Fat saturation No SPAIR No Fat sat SPAIR Fat sat SPAIR
Concatenation 1 4 1 8 1 1 1
Parallel imaging 2 2 3 2 2 2 2
Scan time (min:s) 0:16 1.08 1:50 0:36 3:54 0.04 (9.56) 0:19 (3:19)
Note—These are guidelines for use on Magnetom Verio 3-T MRI scanner (Siemens Healthcare). The names of sequences and parameter values may vary with other scanners. Where parallel imaging is used, the number given is the acceleration factor. Parallel imaging is typically performed with GRAPPA (generalized autocalibrating partially parallel acquisition). The scan time given in parentheses is the total scan time for performing the secretin-enhanced MRCP series and the three gadolinium-enhanced series. 3D SPGR Dixon = 3D nonfat-saturated spoiled gradient-echo sequence for chemical shift imaging, SSFSE = half single-shot fast spin-echo sequence, 3D SPGR FS = fat-saturated 3D spoiled gradient-echo T1-weighted sequence for contrast-enhanced imaging, ST/SG = slice thickness and slice gap (2D MRCP and secretin MRCP slabs are single slabs of 40-mm thickness; 3D sequences do not have slice gap), NEX = number of excitations, RBW = receiver bandwidth, FOV = field of view, Navigator = navigator-monitored respiratory triggering, SPAIR = spectral adiabatic inversion recovery, Fat sat = spectral selective fat saturation, Concatenation = number of interleaved acquisitions or number of breath-holds.
Dow
nloa
ded
from
ww
w.a
jron
line.
org
by 3
9.21
8.29
.138
on
06/0
9/13
fro
m I
P ad
dres
s 39
.218
.29.
138.
Cop
yrig
ht A
RR
S. F
or p
erso
nal u
se o
nly;
all
righ
ts r
eser
ved

44 AJR:195, July 2010
Sandrasegaran et al.
T1-Weighted SequencesT1-weighted sequences are useful for as-
sessing hemorrhage, such as within inflamma-tory collections in acute pancreatitis (Fig. 2), and pancreatic fat. Estimation of pancreatic fat is currently not considered part of routine MRI assessment. However, studies in animals and humans have shown that fatty pancreas is associated with increased severity of acute pancreatitis or higher incidence of postopera-tive complications [4–6]. Thus, accurate as-sessment of pancreatic fat content may be useful. Traditionally, 2D gradient-echo se-quences with two TEs have been used. This sequence yields images in which water and fat protons have the same or opposing phases (Fig. 2). Fat content may be estimated by as-sessing the signal drop-off on opposed-phase
images; 3D two-point Dixon techniques (Fig. 3), which acquire thinner, contiguous slic-es within a breath-hold, are preferable to 2D gradient-echo sequences. The signal in two-point Dixon images is adversely affected by magnetic field (B0) and radiofrequency (B1) inhomogeneity, either intrinsic to the system or due to the presence of tissue iron. Three-point Dixon techniques correct for T2* de-cay by using the data from a third echo. The most commonly used three-point Dixon tech-nique is iterative decomposition of water and fat with echo asymmetry and least-squares estimation (IDEAL), which maps field inho-mogeneities and uses asymmetric sampling (unevenly spaced echoes) for maximum sig-nal-to-noise ratio (SNR) [7, 8]. The IDEAL technique is compatible with many pulse se-
quences, including gradient-echo, TSE, or balanced steady-state free precession [9]. Compared with two-point Dixon techniques, three-point Dixon techniques are less affect-ed by field inhomogeneities and can assess fat content of more than 50%, but they also have longer acquisition times. A recent study found no significant differences in hepatic fat content measured by the two techniques [10]. At the time of this writing, three-point Dix-on techniques are not commercially available with all major vendors.
T2-Weighted SequencesMultishot fast spin-echo (TSE) and sin-
gle-shot fast spin-echo (SSFSE) sequences are the most commonly used T2-weighted sequences for pancreatic (and liver) imag-ing. We use both of these sequences. An al-ternative technique is balanced steady-state free precession. Respiratory-gated TSE has been shown to be superior to breath-hold TSE and respiratory-gated SSFSE in detect-ing solid liver lesions, such as metastases [11, 12]. SSFSE sequences have a long echo-train length, which reduces the contrast-to-noise ratio (CNR) of solid liver lesions (which have short T2) because of magnetization transfer effect and T2-filtering produced by multi-ple 180° refocusing pulses [12, 13]. On the other hand, the image quality of SSFSE se-quence is superior to TSE sequences. SSFSE sequences are used to obtain T2-weighted sequences, with a TE of about 100 millisec-onds, and MRCP, with a TE of about 600 milliseconds (Tables 1 and 2). Fat is bright on these sequences, and fat suppression may be required. In addition, T2-weighted se-quences are too long to be acquired within one breath-hold. They may be concatenated
A
Fig. 1—63-year-old woman with known branch-type intraductal papillary mucinous neoplasm.A, Coronal T2-weighted turbo spin-echo 2D slab image from examination performed at outside institution without oral contrast shows stomach contents (arrowhead) are bright and overlie body and tail of pancreas, obscuring main duct. There is 2.5-cm cystic mass (solid arrow) in pancreatic body. There is also N/2 ghosting of stomach (dashed arrows) projected over right hepatic lobe. This artifact is due to filling of k-space over two respiratory cycles. Ghost signal is shifted by one half length of field of view (FOV) in phase-encoding direction (or FOV/4 if parallel imaging with acceleration factor of 2 is used). It is less likely to occur with variable flip-angle techniques.B, Single-shot fast spin-echo image from examination performed at our institution with negative oral contrast administration shows good visualization of cystic mass (arrow) and main pancreatic duct.
B
A
Fig. 2—33-year-old woman with acute pancreatitis with sudden drop in hematocrit.A, Axial T2-weighted image shows large fluid collection (arrow) with low-signal material (arrowhead) in dependent aspect.B and C, Axial T1-weighted in-phase (B) and opposed-phase (C) images show high signal (arrowhead) in dependent aspect of cyst (arrow) indicating blood. Patient was diagnosed with hemorrhagic pseudocyst. Angiography (not shown) did not reveal pseudoaneurysm. In addition, there is reduced liver signal (dashed arrow) on opposed-phase image compared with in-phase image, indicating hepatic steatosis.
CB
Dow
nloa
ded
from
ww
w.a
jron
line.
org
by 3
9.21
8.29
.138
on
06/0
9/13
fro
m I
P ad
dres
s 39
.218
.29.
138.
Cop
yrig
ht A
RR
S. F
or p
erso
nal u
se o
nly;
all
righ
ts r
eser
ved
AJR:195, July 2010 45
Pancreatic MRI
over two or three breath-holds. Alternatively, the sequences may be performed during free breathing with motion correction techniques that will be explained later.
Fat SuppressionTwo different approaches are traditional-
ly used for fat suppression. Chemical shift fat suppression is based on the difference of resonance frequency between fat and water. Before the main sequence, a spectrally selec-tive radiofrequency pulse tuned to the fat fre-quency is applied, followed by spoiler gradi-ent pulses. The frequency of precession of fat protons is dependent on the magnetic field. Therefore, this technique is adversely affect-ed by magnetic field inhomogeneity. Another approach is inversion recovery (IR) fat sup-pression, such as STIR, which is based on the
difference in T1 relaxation times between fat and water. By using an inversion time (TI) of 150–170 milliseconds at 1.5-T MRI, the fat signal can be selectively suppressed. In gen-eral, IR techniques have more homogeneous fat suppression and better CNR compared with spectral fat saturation techniques. On the other hand, they have lower spatial reso-lution, with other MR parameters being the same, or longer acquisition times (Fig. 4).
In the conventional implementation of IR fat suppression, the inversion pulse has a wide fre-quency bandwidth to invert both fat and water spins. Therefore, the water signal is also par-tially suppressed at the TI of fat. This results in a lower SNR, which may affect lesion conspi-cuity. SPAIR (spectral adiabatic inversion re-covery) is a newly developed IR fat suppression technique. In this sequence, the inversion pulse
is spectrally selective and affects only the fat protons. The adiabatic inversion is also insensi-tive to B1 inhomogeneity. The benefits of adia-batic inversion recovery over conventional IR include better SNR and reduced susceptibility artifact, especially at 3 T [14] (Fig. 5). The spe-cific absorption rate (SAR) is higher with adi-abatic inversion recovery compared with con-ventional IR sequences.
In addition to the two techniques of fat suppression discussed, i.e., chemical shift se-lective saturation and inversion recovery, T2-weighted Dixon techniques are being evalu-ated. Three-point Dixon techniques with IDEAL may be used with TSE sequences but require a long acquisition time [15]. A pro-totype three-point Dixon technique in which each TSE readout gradient is replaced with three readout gradient pulses with differ-
A
C
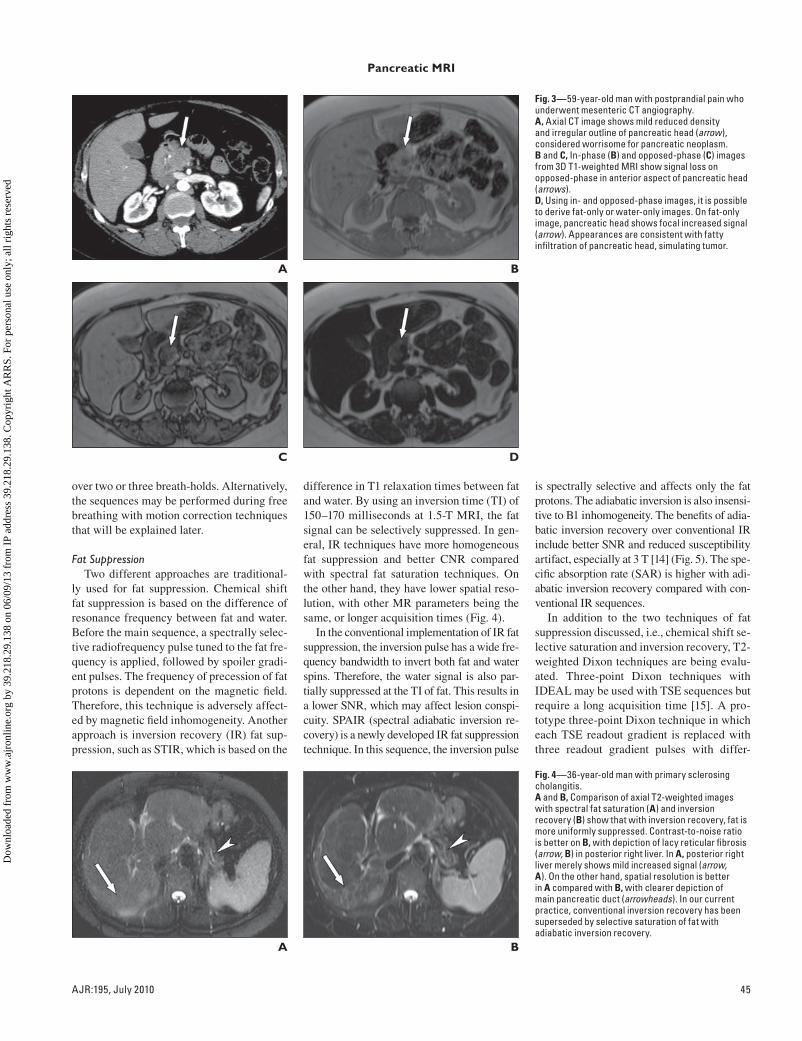
Fig. 3—59-year-old man with postprandial pain who underwent mesenteric CT angiography.A, Axial CT image shows mild reduced density and irregular outline of pancreatic head (arrow), considered worrisome for pancreatic neoplasm.B and C, In-phase (B) and opposed-phase (C) images from 3D T1-weighted MRI show signal loss on opposed-phase in anterior aspect of pancreatic head (arrows).D, Using in- and opposed-phase images, it is possible to derive fat-only or water-only images. On fat-only image, pancreatic head shows focal increased signal (arrow). Appearances are consistent with fatty infiltration of pancreatic head, simulating tumor.
B
D
A
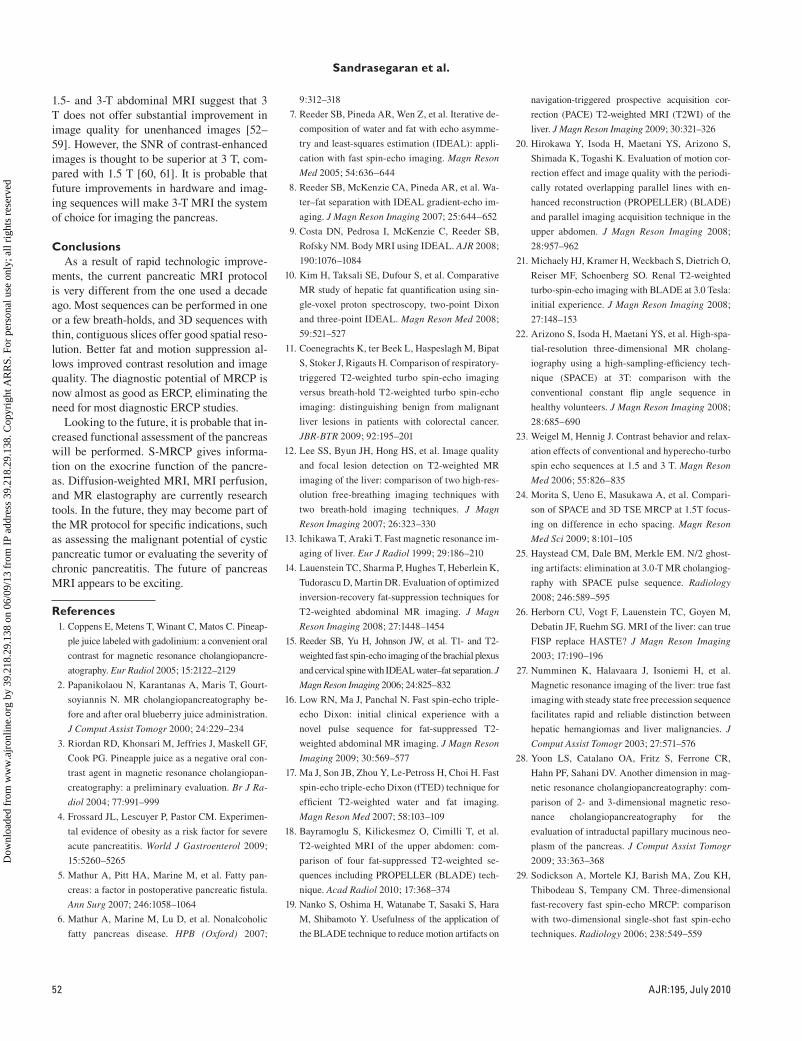
Fig. 4—36-year-old man with primary sclerosing cholangitis.A and B, Comparison of axial T2-weighted images with spectral fat saturation (A) and inversion recovery (B) show that with inversion recovery, fat is more uniformly suppressed. Contrast-to-noise ratio is better on B, with depiction of lacy reticular fibrosis (arrow, B) in posterior right liver. In A, posterior right liver merely shows mild increased signal (arrow, A). On the other hand, spatial resolution is better in A compared with B, with clearer depiction of main pancreatic duct (arrowheads). In our current practice, conventional inversion recovery has been superseded by selective saturation of fat with adiabatic inversion recovery.
B
Dow
nloa
ded
from
ww
w.a
jron
line.
org
by 3
9.21
8.29
.138
on
06/0
9/13
fro
m I
P ad
dres
s 39
.218
.29.
138.
Cop
yrig
ht A
RR
S. F
or p
erso
nal u
se o
nly;
all
righ
ts r
eser
ved

46 AJR:195, July 2010
Sandrasegaran et al.
180°
90°
Water
Fat
180°
90°
Water
Fat
A
C
Fig. 5—41-year-old man with chronic pancreatitis who underwent 3-T MRI.A and B, Line diagrams show conventional inversion recovery (A) and spectral adiabatic inversion recovery (SPAIR) (B) sequences. Gray lines show signal from fat and dashed lines, signal from water. There is reduced water signal in conventional inversion recovery sequence compared with SPAIR.C and D, Comparison of axial images from conventional inversion recovery (C) and SPAIR (D). Susceptibility artifact from bowel gas, seen as dark band in anterior abdomen on inversion recovery image (arrowheads), is not evident on SPAIR sequence.
B
D
A
Fig. 6—Navigator monitoring of respiratory motion.A, In this technique, coronal 2D low-resolution gradient-echo images with small flip angle (to prevent magnetization saturation) are acquired in about 100 milliseconds [62]. These images sample, in real time, motion of right hemidiaphragm.B, This respiratory trace allows synchronization of data acquisition with patient’s respiratory cycle. On initial respiratory cycles, range of motion is determined (large boxes, arrows). On subsequent respiratory cycles, data acquisition is triggered when diaphragm is relatively stationary (small boxes, arrowheads).
B
A
Fig. 7—36-year-old woman with unexplained abdominal pain.A and B, T2-weighted axial images obtained free-breathing without motion correction technique, BLADE (Siemens Healthcare) (A) and with BLADE (B) show substantially improved image quality with BLADE. Currently we use navigator–echo technique for free-breathing sequences, although BLADE is likely to be used more in the future.
B
Dow
nloa
ded
from
ww
w.a
jron
line.
org
by 3
9.21
8.29
.138
on
06/0
9/13
fro
m I
P ad
dres
s 39
.218
.29.
138.
Cop
yrig
ht A
RR
S. F
or p
erso
nal u
se o
nly;
all
righ
ts r
eser
ved

AJR:195, July 2010 47
Pancreatic MRI
ent fat–water phase shifts may, in the future, provide high-quality, fat-suppressed, breath-hold T2-weighted images [16, 17].
Motion SuppressionTechniques of motion suppression during
free breathing include the use of respiratory triggering, respiratory monitoring with naviga-tor pulse, and rotatory k-space sampling. Most T2-weighted SSFSE and 3D MRCP sequences are too long to be performed within a breath-hold and require respiratory triggering. Tradi-tionally, this has been performed using pneu-matic bellows placed around the lower chest to detect respiratory motion. The use of 2D navi-gator pulses is a more recent development. The most commonly used navigator technique is 2D PACE (prospective acquisition correction encoding) (Fig. 6). This technique is further discussed under the section on MRCP.
Rotatory filling of k-space allows inher-ent motion correction capabilities. With these techniques, named PROPELLER (periodical-ly rotated overlapping parallel lines with en-hancement reconstruction) or BLADE (Sie-mens Healthcare), the entire k-space is covered by multiple rectangular regions shaped like blades rotated around the center [18, 19]. Each blade consists of a small number of phase-en-coding lines that can be filled with a multiple echo acquisition after a single excitation. Any in-plane motion that occurs between the acqui-sitions of the two blades can be determined by comparing the k-space data in the overlapping part of two blades and may be corrected. Af-ter repeating the process for all the blades, the full k-space can be created from motion-cor-rected blades to reconstruct an image with re-
duced motion artifacts (Fig. 7). Because of the redundancy in k-space data, these techniques require longer scanning times than conven-tional rectilinear data acquisition. However, the oversampling in the center of the k-space also improves the SNR. Because blade mo-tion correction is based on the assumption of rigid body motion, it is not as effective in cor-recting elastic motion for organs, such as liv-er and pancreas, and also does not correct for through-plane motion. With rotatory k-space filling techniques, image quality is best with wider blades, longer echo train lengths, and oversampling of k-space [20]. Inadequate k-space sampling may result in streak artifacts (Fig. 8). Increasing echo-train length also im-
proves flow suppression. Studies have shown the improved diagnostic quality of upper ab-dominal organs with rotatory k-space filling technique sequences compared with conven-tional breath-hold and navigator-corrected T2-weighted SSFSE sequences [18, 21].
Flip-Angle Modulation TechniquesA limitation of 3D constant flip angle T2-
weighted sequences at 3 T is the high radio-frequency energy deposition. Newer 3D TSE techniques use variable flip angles. Such tech-niques are termed SPACE (sampling perfec-tion with application optimized contrasts us-ing different flip-angle evolutions), XETA (extended echo-train acquisition), or CUBE
A
Fig. 9—71-year-old man with multiple cystic pancreatic lesions seen for follow-up.A and B, Coronal images of free-breathing 3D MRCP performed at 3-T MRI using constant flip angle (single-shot fast spin-echo [SSFSE]) (A) and variable refocusing flip angles (sampling perfection with application optimized contrasts using different flip-angle evolutions [SPACE]) (B). Both sequences show side-branch intraductal papillary mucinous neoplasm (arrowheads). SPACE sequence suggests irregularity of main pancreatic duct (arrow) that was not evident on conventional SSFSE sequence. Specific absorption rate of SPACE sequence was 52% lower than that of conventional SSFSE sequence.
Fig. 8—52-year-old woman with chronic pancreatitis. Axial motion correction technique, BLADE (Siemens Healthcare) image shows streaky artifacts (arrowhead) that degrade image quality. These artifacts arise in process of gridding data acquired from oblique trajectory in k-space and may be improved by oversampling of k-space. In our experience, spatial resolution is lower with BLADE compared with navigator–echo sequence.
B
AFig. 10—54-year-old man with abdominal pain.A, Single-shot fast spin-echo (SSFSE) axial image shows apparent filling defect in distal common bile duct (CBD) (arrowhead). This finding simulates choledocholithiasis but is artifactual and due to sensitivity of this sequence to biliary flow. Flow void is also seen in superior mesenteric vein (arrow).B, Balanced SSFP image at same level shows normal appearance of CBD (arrowhead). Because balanced SSFP is not sensitive to flow voids, vessels appear bright (arrow) on this sequence. This sequence is susceptible to off-resonance effects because it accumulates signal between adjacent TRs. Variation in phases from adjacent TR results in destructive interference that is typically responsible for black-boundary effect seen around organs on balanced SSFP images.
B
Dow
nloa
ded
from
ww
w.a
jron
line.
org
by 3
9.21
8.29
.138
on
06/0
9/13
fro
m I
P ad
dres
s 39
.218
.29.
138.
Cop
yrig
ht A
RR
S. F
or p
erso
nal u
se o
nly;
all
righ
ts r
eser
ved

48 AJR:195, July 2010
Sandrasegaran et al.
(GE Healthcare). Variable refocusing flip-an-gle techniques can maintain higher signal in-tensity in a long echo-train to produce higher SNR [22]. The SAR may be reduced by about 70% at 3 T by using a varying flip angle [23]. A study comparing traditional constant flip-angle 3D MRCP with variable refocused flip-angle MRCP in healthy volunteers imaged on a 3-T MR scanner found significantly better im-age quality of intrahepatic bile ducts with the latter sequence [22] (Fig. 9). The superiority of image quality with the variable refocused flip-angle technique has also been found in healthy subjects scanned at 1.5 T [24], where energy deposition is not a major consideration. This finding may be due to the shorter echo spac-ing, and thus less image blurring, that is pos-sible with variable refocusing flip angles. The advantages and disadvantages of flip-angle modulation techniques over constant flip-angle techniques are shown in Table 3 [25].
Steady-State Free Precession SequencesAlthough TSE and SSFSE are the most
commonly used sequences for T2-weighted
imaging, balanced steady-state free preces-sion sequences (SSFP), such as FIESTA (fast imaging employing steady-state acquisition), trueFISP (fast imaging with steady-state pre-cession) or balanced FFE (fast-field echo) may be used. Balanced SSFP sequences have high SNR. Contrast in these sequences is deter-mined by a ratio of T2/T1. By keeping the TR and TE very short, T1 remains constant, and the principal component of image contrast is
T2. Balanced SSFP techniques are insensitive to flow voids and do not show artificial filling defects in bile ducts because of flow (Fig. 10). Vessels are bright in these sequences. This may be an advantage in pancreatic imaging, showing the proximity of tumor to blood ves-sels, but it also may mask small cystic lesions adjacent to splenic vessels. Balanced SSFP sequences are prone to susceptibility artifact. The TR needs to be kept short and shim per-
TABLE 3: Advantages and Disadvantages of Flip-Angle Modulation Techniques With Constant Flip Angle Turbo Spin-Echo T2-Weighted Sequences
Advantages Disadvantages
Reduced specific absorption rate, especially at 3 T Longer acquisition times
Reduced echo space, less blurring Longer acquisition times
Reduced N/2 ghosting artifacts Longer acquisition times
Isotropic acquisition, allowing multiplanar reconstructions Altered contrast, with partial T1 weighting
Improved flow suppression Increased B1 inhomogeneity artifact
Note—Flip-angle modulation techniques include sampling perfection with application optimized contrasts using different flip-angle evolutions. Variable flip-angle techniques may fill the entire k-space partition in a respiratory cycle. Constant flip-angle 3D techniques may fill the k-space partition in two breathing cycles. If the diaphragmatic positions in the two cycles are different, N/2 ghosting artifacts may occur [25] (Fig. 1).
A
Fig. 11—2D MRCP in 67-year-old woman with intraductal papillary mucinous neoplasm (IPMN).A, Positioning of 40-mm MRCP slabs is performed on axial single-shot fast spin-echo sequence. In our practice, six coronal oblique slabs are used to ensure that entire pancreaticobiliary ductal system is included. C and B indicate slabs.B, 2D MRCP coronal image, corresponding to slab B on image A, shows that cystic lesion in downstream body (arrowhead) communicates with main duct. Duct in pancreatic tail (solid arrow) is not well visualized on this image. Note divisum anatomy (dashed arrow).C, 2D MRCP coronal image, corresponding to slab C on image A, does not optimally show main ductal communication of IPMN in pancreatic body (arrowhead) but shows cystic masses in pancreatic tail (arrow). Dashed arrow indicates divisum anatomy.
CB
A
Fig. 12—74-year-old woman with intraductal papillary mucinous neoplasm.A and B, Coronal image from 2D MRCP (A) and coronal maximum-intensity-projection image from 3D MRCP (B) show that duct in pancreatic tail (arrowhead) and posterior branch of right hepatic duct (arrow) are better visualized on 3D sequence. We perform both 2D and 3D MRCP because 2D may have better image quality in patients with irregular or rapid respiratory cycles.
B
Dow
nloa
ded
from
ww
w.a
jron
line.
org
by 3
9.21
8.29
.138
on
06/0
9/13
fro
m I
P ad
dres
s 39
.218
.29.
138.
Cop
yrig
ht A
RR
S. F
or p
erso
nal u
se o
nly;
all
righ
ts r
eser
ved

AJR:195, July 2010 49
Pancreatic MRI
formed to reduce this artifact. Studies on liver lesions have not found a significant difference in diagnostic ability between balanced SSFP and SSFSE sequences [26, 27].
MRCPMRCP refers to the acquisition of heavi-
ly T2-weighted images, with variants of TSE sequences. These sequences consist of a sin-gle 90° pulse followed by multiple constant refocusing pulses. The refocusing pulses typ-ically have been 180° pulses, although pulses of 130° to 160° are often used to reduce en-ergy deposition, especially at 3-T MRI. Very long echo-trains may be required to acquire all data in a slice within a single TR. How-ever, long echo pulses cause some blurring of the images. The commonly used sequences use partial Fourier technique, in which be-tween 50% and 60% of the k-space is filled by data. The remainder of the k-space is filled by extrapolation using the symmetry of the k-space. Sequences that acquire the entire data set within one TR and use partial Fourier technique are called SSFSE or HASTE; 2D MRCP has long been performed using cor-onal SSFSE slabs. We prefer to acquire 40-mm slabs in multiple coronal oblique planes
to ensure that the entire pancreatic ductal system has been imaged (Fig. 11).
3D MRCPThe 3D TSE sequence can produce high-
spatial-resolution MRCP images (Fig. 12). Thin sections without a slice gap allow bet-ter assessment of small stones, side branch-es of the main pancreatic duct, and intrahe-patic bile ducts [28, 29]. Three-dimensional TSE MRCP may be performed as a series of breath-holds or during free breathing. We acquire 1–2 mm, contiguous slices during free breathing and use the navigator-echo technique to reduce motion effects. The main disadvantage of this technique is the relatively long acquisition time. In addition, navigator-based triggering requires uniform and regular breathing cycles for optimal im-age quality. If the patient has rapid or irregu-lar breathing, the image quality may be im-paired. An alternative method of producing 3D MRCP images is to use a TSE sequence with a 90° flip-back pulse. This sequence is called FRFSE (fast recovery fast spin-echo), DRIVE, or RESTORE. The unique feature of this sequence is that after a long echo-train, the residual transverse magnetization
is refocused into a final spin-echo and then flipped along the z-axis by a −90° fast recov-ery pulse [29, 30]. This accelerates relaxation of the longitudinal magnetization, leading to a reduction in TR without a loss of SNR. It is possible to perform breath-hold 3D MRCP with this sequence. However, the number of slices that may be obtained is substantially less than with respiratory-triggered versions of 3D MRCP.
Secretin-Enhanced MRCPSecretin is a polypeptide hormone secret-
ed by duodenal mucosa in response to lu-minal acid [31]. It induces pancreatic secre-tion of water and bicarbonate. In the first 5–7 minutes, the tone of the sphincter of Oddi is increased. These effects result in temporary distention of the pancreatic ducts. Synthetic human secretin (ChiRhoStim, ChiRhoClin, Inc.) is given IV over 1 minute to avoid po-tential abdominal pain that may occur with a bolus injection. An adult dose of 16 μg (0.2 μg/kg body weight in children) is used. At the commencement of injection, a baseline scan is obtained, followed by coronal SSFSE images (2-second scanning time) every 30 seconds for 10 minutes. In healthy subjects,
A
C
Fig. 13—48-year-old woman with abdominal pain.A–D, MRCP images at 0 (A), 3 (B), 7 (C), and 10 (D) minutes after IV secretin injection. Patient has reverse divisum with ventral duct (arrowhead, B) entering minor papilla. Diagnosis is easier to make on postsecretin images. Reverse divisum may result in isolated ventral chronic pancreatitis. Note progress filling of duodenum (solid arrows, B–D) and proximal small bowel loops (dashed arrow, D) with high-signal fluid.
B
D
Dow
nloa
ded
from
ww
w.a
jron
line.
org
by 3
9.21
8.29
.138
on
06/0
9/13
fro
m I
P ad
dres
s 39
.218
.29.
138.
Cop
yrig
ht A
RR
S. F
or p
erso
nal u
se o
nly;
all
righ
ts r
eser
ved

50 AJR:195, July 2010
Sandrasegaran et al.
the maximal effect of IV secretin is between 7–10 minutes (Fig. 13).
Although S-MRCP is used routinely in all patients undergoing MRCP at our institu-tion, a more selective use may be considered. Secretin is useful in assessing complex duc-tal anomalies, such as annular pancreas (Fig. 14) and anomalous pancreaticobiliary junc-tion [32]. In patients with pancreas divisum, S-MRCP increases the confidence of diagno-sis (Fig. 14), although in many instances the diagnosis is suspected on nonsecretin MRCP. Conventional MRCP is not sensitive to the di-agnosis of mild chronic pancreatitis. S-MRCP helps in assessing early side branch dilation of this condition [33–36] (Fig. 15). With S-MRCP, it is possible to quantitatively or semi-quantitatively assess the exocrine functional reserve of the pancreas (Figs. 13–15). Quan-
titative measurements of exocrine response to secretin have been performed using volumet-ric or signal intensity measurements of fluid released into duodenum after secretin injec-tion [37–40]. We prefer a semiquantitative description of exocrine function [41]. If the maximum output only fills the duodenal bulb, pancreatic exocrine function is considered to be poor. Filling of the bulb and second part of the duodenum is considered suboptimal func-tion. Filling of the entire duodenum or loops of small bowel is considered normal function. In addition, S-MRCP may show pancreatic leak after severe pancreatitis, pancreatic sur-gery, or blunt trauma [42, 43] (Fig. 16).
We have performed more than 4,000 S-MRCP examinations since 2003 and are aware of only two cases of acute pancreati-tis that resulted shortly after secretin use. In
our practice, we use secretin even in patients with mild acute pancreatitis but avoid its use in severe pancreatitis. The major drawbacks of S-MRCP are the 10 minutes of acquisition time and the cost of secretin (estimated to be $300 per adult dose).
Contrast-Enhanced SequencesIf the only indication for the MRI exam-
ination is evaluation of choledocholithiasis, contrast enhancement may not be necessary. For most other indications, the acquisition of gadolinium-enhanced sequences is advisable. The sequence of choice for unenhanced and gadolinium-enhanced series is 3D fat-sup-pressed spoiled gradient-echo. This sequence has many names, such as VIBE (volume in-terpolated breath-hold F-GRE), LAVA (liv-er acquisition with volume acceleration) and THRIVE (T1-weighted high-resolution iso-tropic volume examination), and allows the acquisition of 2- to 5-mm contiguous slices within a 20-second breath-hold.
Typically, gadolinium is injected at 2 mL/s using a power injector and followed with a 20-mL saline flush administered at the same rate. It is usual to acquire the entire liver (and pan-creas) in multiple phases. Timing of the scan may be performed using fixed time delays, real-time bolus tracking, or a test bolus. Traditional-ly, empirical timing has been used with the ar-terial, venous, and delayed phases acquired 25, 60, and 180 seconds, respectively, after com-mencement of contrast infusion (Fig. 17).
Bolus tracking has been primarily used in MR angiography but is used increasingly in abdominal imaging. The delay from onset of infusion to arrival of contrast material in the distal aorta varies from 12 to 30 seconds, with a mean of 17–18 seconds [44, 45]. Thus,
A
Fig. 15—52-year-old woman with suspected chronic pancreatitis.A, Presecretin MRCP image shows apparently normal pancreatogram and postcholecystectomy cholangiogram. Ventral duct (dashed arrow) is not well assessed.B, Image obtained 8 minutes after secretin shows side-branch dilation (arrowheads), indicating mild chronic pancreatitis (diagnosed by dilation of three or more side branches). Exocrine response to secretin is poor, with fluid only filling duodenal bulb (solid arrow). In our experience, exocrine functional deficiencies may be substantially worse than anatomic abnormalities of ducts. Curved ventral duct (dashed arrow) is better visualized after secretin.C, ERCP image confirms findings of chronic pancreatitis with early side-branch dilation (arrowheads).
CB
AFig. 14—46-year-old woman with annular pancreas and chronic pancreatitis.A, Presecretin image shows normal-appearing annular duct (arrowhead). Apparent filling effect at common hepatic duct (arrow) is due to crossing vessel.B, Postsecretin image at 7 minutes after injection shows irregular caliber of annular duct (black arrowhead) with side-branch dilation. Chronic pancreatitis is predominantly confined to annulus, with normal main pancreatic duct (white arrowhead). There is divisum anatomy, with main pancreatic duct crossing common bile duct to enter minor papilla (black arrow). This anatomic variant was not obvious on presecretin image. Despite normal-appearing main duct, exocrine function is considered to be suboptimal because volume of pancreatic fluid is only sufficient to fill duodenal bulb (dashed arrow) and second part of duodenum (white arrow).
B
Dow
nloa
ded
from
ww
w.a
jron
line.
org
by 3
9.21
8.29
.138
on
06/0
9/13
fro
m I
P ad
dres
s 39
.218
.29.
138.
Cop
yrig
ht A
RR
S. F
or p
erso
nal u
se o
nly;
all
righ
ts r
eser
ved

AJR:195, July 2010 51
Pancreatic MRI
it may be expected that bolus tracking would be superior to using fixed delays. In patients without cardiovascular comorbidity, fixed time delays may be satisfactory [46]. How-ever, when delaying with patients with cir-rhosis or hypertension, bolus tracking gives a more reliable arterial phase [44].
There is no consensus on the optimal bo-lus tracking technique. We prefer to monitor the distal aorta at the diaphragmatic hiatus with a bolus tracking sequence and real-time reconstructions. As soon as contrast material arrives, the bolus tracking scan is stopped, and the patient is given breathing instruc-tions. The arterial phase is started 8 seconds later. For a satisfactory arterial phase, there should be good contrast in the aorta, superi-or mesenteric artery, and portal vein and no contrast in the hepatic veins. Lack of contrast in the portal vein suggests that the phase was acquired too early, the most common rea-son for not obtaining a good arterial phase. The timing of the contrast bolus may be less stringent with venous and delayed phases.
The contraindications to the use of gado-linium are severe allergy, pregnancy, and re-
nal dysfunction. When the estimated glom-erular filtration rate (eGFR) is more than 60 mL/min/1.73 m2, we use the standard dose of gadolinium (0.1 mmol/kg). With an eGFR of 30–60 mL/min/1.73 m2, we use a reduced dose, typically one half of the standard dose. We tend not to use gadolinium when the eGFR is less than 30 mL/min/1.73 m2.
1.5- Versus 3-T MRIIn the previous sections, we have alluded
to sequences that tend to be more useful in 3-T MRI, such as variable flip-angle tech-niques for reducing SAR. The main advan-tage of scanning at 3 T is the higher SNR.
Parallel imaging is a technique used more often in 3-T MRI than at 1.5 T. It allows the production of images with adequate field of view and spatial resolution using fewer k-space lines. This is possible because the spa-tial sensitivity information from independent receiver coils may be used to overcome the aliasing effect of acquiring a reduced num-ber of phase encoding lines [47, 48]. As a result, a shorter scanning time, often by a factor of two, may be achieved. Other advan-
tages of parallel imaging include the ability to produce breath-hold images or multipha-sic studies in a short period of time. In addi-tion, parallel imaging techniques can be used to reduce T2 blurring in TSE techniques and reduce SAR and susceptibility effects by al-lowing shorter echo-trains [49].
The main limitation of parallel imaging is the associated reduction in SNR, which is usually not an issue at 3 T, where the overall SNR is higher. Parallel imaging may cause artifacts that sometimes manifest as lines or bands in the middle of images. There are two main types of parallel imaging: image domain–based techniques such as sensitiv-ity encoding (SENSE), and k-space-based techniques such as generalized autocalibrat-ing partially parallel acquisition (GRAPPA). Details of these techniques are discussed elsewhere [48, 50, 51].
The improved availability of radiofrequen-cy coils that are optimal for 3 T has reduced many of the limitations of this technique, such as increased chemical shift and susceptibili-ty artifacts and artifacts due to interference of radiofrequency waves. Studies comparing
A
Fig. 16—24-year-old woman with suspicion of pancreatic ductal disruption after motor vehicle accident.A, Presecretin MRCP image shows probable ductal injury with focal segment of stenosis (solid arrow) and upstream duct dilation (dashed arrow).B, After secretin, there is leakage of exocrine output into large collection (arrowhead).C, ERCP image obtained on same day confirms ductal disruption (arrowhead). In our experience, secretin may be useful to show large ductal leakage postsurgically or after blunt abdominal trauma. However, pressure within pancreatic duct after secretin may not be sufficient to show small leak, and potential leaks may be obscured by surrounding collections. ERCP is superior to secretin MRCP for showing ductal leaks.
CB
A
Fig. 17—72-year-old woman seen for assessment of cystic mass in pancreas.A, Axial T2-weighted image shows possible soft-tissue component (arrowhead) in 2.5-cm cystic mass.B, Axial gadolinium-enhanced image shows enhancing mural nodules (arrowheads), raising concern for malignant change within cystic lesion. Patient underwent radical pancreaticoduodenectomy and was found to have intraductal papillary mucinous neoplasm with carcinoma in situ.
B
Dow
nloa
ded
from
ww
w.a
jron
line.
org
by 3
9.21
8.29
.138
on
06/0
9/13
fro
m I
P ad
dres
s 39
.218
.29.
138.
Cop
yrig
ht A
RR
S. F
or p
erso
nal u
se o
nly;
all
righ
ts r
eser
ved
52 AJR:195, July 2010
Sandrasegaran et al.
1.5- and 3-T abdominal MRI suggest that 3 T does not offer substantial improvement in image quality for unenhanced images [52–59]. However, the SNR of contrast-enhanced images is thought to be superior at 3 T, com-pared with 1.5 T [60, 61]. It is probable that future improvements in hardware and imag-ing sequences will make 3-T MRI the system of choice for imaging the pancreas.
ConclusionsAs a result of rapid technologic improve-
ments, the current pancreatic MRI protocol is very different from the one used a decade ago. Most sequences can be performed in one or a few breath-holds, and 3D sequences with thin, contiguous slices offer good spatial reso-lution. Better fat and motion suppression al-lows improved contrast resolution and image quality. The diagnostic potential of MRCP is now almost as good as ERCP, eliminating the need for most diagnostic ERCP studies.
Looking to the future, it is probable that in-creased functional assessment of the pancreas will be performed. S-MRCP gives informa-tion on the exocrine function of the pancre-as. Diffusion-weighted MRI, MRI perfusion, and MR elastography are currently research tools. In the future, they may become part of the MR protocol for specific indications, such as assessing the malignant potential of cystic pancreatic tumor or evaluating the severity of chronic pancreatitis. The future of pancreas MRI appears to be exciting.
References 1. Coppens E, Metens T, Winant C, Matos C. Pineap-
ple juice labeled with gadolinium: a convenient oral
contrast for magnetic resonance cholangiopancre-
atography. Eur Radiol 2005; 15:2122–2129
2. Papanikolaou N, Karantanas A, Maris T, Gourt-
soyiannis N. MR cholangiopancreatography be-
fore and after oral blueberry juice administration.
J Comput Assist Tomogr 2000; 24:229–234
3. Riordan RD, Khonsari M, Jeffries J, Maskell GF,
Cook PG. Pineapple juice as a negative oral con-
trast agent in magnetic resonance cholangiopan-
creatography: a preliminary evaluation. Br J Ra-
diol 2004; 77:991–999
4. Frossard JL, Lescuyer P, Pastor CM. Experimen-
tal evidence of obesity as a risk factor for severe
acute pancreatitis. World J Gastroenterol 2009;
15:5260–5265
5. Mathur A, Pitt HA, Marine M, et al. Fatty pan-
creas: a factor in postoperative pancreatic fistula.
Ann Surg 2007; 246:1058–1064
6. Mathur A, Marine M, Lu D, et al. Nonalcoholic
fatty pancreas disease. HPB (Oxford) 2007;
9:312–318
7. Reeder SB, Pineda AR, Wen Z, et al. Iterative de-
composition of water and fat with echo asymme-
try and least-squares estimation (IDEAL): appli-
cation with fast spin-echo imaging. Magn Reson
Med 2005; 54:636–644
8. Reeder SB, McKenzie CA, Pineda AR, et al. Wa-
ter–fat separation with IDEAL gradient-echo im-
aging. J Magn Reson Imaging 2007; 25:644–652
9. Costa DN, Pedrosa I, McKenzie C, Reeder SB,
Rofsky NM. Body MRI using IDEAL. AJR 2008;
190:1076–1084
10. Kim H, Taksali SE, Dufour S, et al. Comparative
MR study of hepatic fat quantification using sin-
gle-voxel proton spectroscopy, two-point Dixon
and three-point IDEAL. Magn Reson Med 2008;
59:521–527
11. Coenegrachts K, ter Beek L, Haspeslagh M, Bipat
S, Stoker J, Rigauts H. Comparison of respiratory-
triggered T2-weighted turbo spin-echo imaging
versus breath-hold T2-weighted turbo spin-echo
imaging: distinguishing benign from malignant
liver lesions in patients with colorectal cancer.
JBR-BTR 2009; 92:195–201
12. Lee SS, Byun JH, Hong HS, et al. Image quality
and focal lesion detection on T2-weighted MR
imaging of the liver: comparison of two high-res-
olution free-breathing imaging techniques with
two breath-hold imaging techniques. J Magn
Reson Imaging 2007; 26:323–330
13. Ichikawa T, Araki T. Fast magnetic resonance im-
aging of liver. Eur J Radiol 1999; 29:186–210
14. Lauenstein TC, Sharma P, Hughes T, Heberlein K,
Tudorascu D, Martin DR. Evaluation of optimized
inversion-recovery fat-suppression techniques for
T2-weighted abdominal MR imaging. J Magn
Reson Imaging 2008; 27:1448–1454
15. Reeder SB, Yu H, Johnson JW, et al. T1- and T2-
weighted fast spin-echo imaging of the brachial plexus
and cervical spine with IDEAL water–fat separation. J
Magn Reson Imaging 2006; 24:825–832
16. Low RN, Ma J, Panchal N. Fast spin-echo triple-
echo Dixon: initial clinical experience with a
novel pulse sequence for fat-suppressed T2-
weighted abdominal MR imaging. J Magn Reson
Imaging 2009; 30:569–577
17. Ma J, Son JB, Zhou Y, Le-Petross H, Choi H. Fast
spin-echo triple-echo Dixon (fTED) technique for
efficient T2-weighted water and fat imaging.
Magn Reson Med 2007; 58:103–109
18. Bayramoglu S, Kilickesmez O, Cimilli T, et al.
T2-weighted MRI of the upper abdomen: com-
parison of four fat-suppressed T2-weighted se-
quences including PROPELLER (BLADE) tech-
nique. Acad Radiol 2010; 17:368–374
19. Nanko S, Oshima H, Watanabe T, Sasaki S, Hara
M, Shibamoto Y. Usefulness of the application of
the BLADE technique to reduce motion artifacts on
navigation-triggered prospective acquisition cor-
rection (PACE) T2-weighted MRI (T2WI) of the
liver. J Magn Reson Imaging 2009; 30:321–326
20. Hirokawa Y, Isoda H, Maetani YS, Arizono S,
Shimada K, Togashi K. Evaluation of motion cor-
rection effect and image quality with the periodi-
cally rotated overlapping parallel lines with en-
hanced reconstruction (PROPELLER) (BLADE)
and parallel imaging acquisition technique in the
upper abdomen. J Magn Reson Imaging 2008;
28:957–962
21. Michaely HJ, Kramer H, Weckbach S, Dietrich O,
Reiser MF, Schoenberg SO. Renal T2-weighted
turbo-spin-echo imaging with BLADE at 3.0 Tesla:
initial experience. J Magn Reson Imaging 2008;
27:148–153
22. Arizono S, Isoda H, Maetani YS, et al. High-spa-
tial-resolution three-dimensional MR cholang-
iography using a high-sampling-efficiency tech-
nique (SPACE) at 3T: comparison with the
conventional constant flip angle sequence in
healthy volunteers. J Magn Reson Imaging 2008;
28:685–690
23. Weigel M, Hennig J. Contrast behavior and relax-
ation effects of conventional and hyperecho-turbo
spin echo sequences at 1.5 and 3 T. Magn Reson
Med 2006; 55:826–835
24. Morita S, Ueno E, Masukawa A, et al. Compari-
son of SPACE and 3D TSE MRCP at 1.5T focus-
ing on difference in echo spacing. Magn Reson
Med Sci 2009; 8:101–105
25. Haystead CM, Dale BM, Merkle EM. N/2 ghost-
ing artifacts: elimination at 3.0-T MR cholangiog-
raphy with SPACE pulse sequence. Radiology
2008; 246:589–595
26. Herborn CU, Vogt F, Lauenstein TC, Goyen M,
Debatin JF, Ruehm SG. MRI of the liver: can true
FISP replace HASTE? J Magn Reson Imaging
2003; 17:190–196
27. Numminen K, Halavaara J, Isoniemi H, et al.
Magnetic resonance imaging of the liver: true fast
imaging with steady state free precession sequence
facilitates rapid and reliable distinction between
hepatic hemangiomas and liver malignancies. J
Comput Assist Tomogr 2003; 27:571–576
28. Yoon LS, Catalano OA, Fritz S, Ferrone CR,
Hahn PF, Sahani DV. Another dimension in mag-
netic resonance cholangiopancreatography: com-
parison of 2- and 3-dimensional magnetic reso-
nance cholangiopancreatography for the
evaluation of intraductal papillary mucinous neo-
plasm of the pancreas. J Comput Assist Tomogr
2009; 33:363–368
29. Sodickson A, Mortele KJ, Barish MA, Zou KH,
Thibodeau S, Tempany CM. Three-dimensional
fast-recovery fast spin-echo MRCP: comparison
with two-dimensional single-shot fast spin-echo
techniques. Radiology 2006; 238:549–559
Dow
nloa
ded
from
ww
w.a
jron
line.
org
by 3
9.21
8.29
.138
on
06/0
9/13
fro
m I
P ad
dres
s 39
.218
.29.
138.
Cop
yrig
ht A
RR
S. F
or p
erso
nal u
se o
nly;
all
righ
ts r
eser
ved

AJR:195, July 2010 53
Pancreatic MRI
30. Busse RF, Riederer SJ, Fletcher JG, Bharucha
AE, Brandt KR. Interactive fast spin-echo imag-
ing. Magn Reson Med 2000; 44:339–348
31. Chey WY, Chang TM. Secretin: 100 years later. J
Gastroenterol 2003; 38:1025–1035
32. Motosugi U, Ichikawa T, Araki T, et al. Secretin-
stimulating MRCP in patients with pancreatobil-
iary maljunction and occult pancreatobiliary re-
flux: direct demonstration of pancreatobiliary
reflux. Eur Radiol 2007; 17:2262–2267
33. Czako L. Diagnosis of early-stage chronic pan-
creatitis by secretin-enhanced magnetic reso-
nance cholangiopancreatography. J Gastroenterol
2007; 42[suppl 17]:113–117
34. Sugiyama M, Haradome H, Atomi Y. Magnetic
resonance imaging for diagnosing chronic pancrea-
titis. J Gastroenterol 2007; 42[suppl 17]:108–112
35. Balci NC, Alkaade S, Magas L, Momtahen AJ,
Burton FR. Suspected chronic pancreatitis with
normal MRCP: findings on MRI in correlation
with secretin MRCP. J Magn Reson Imaging
2008; 27:125–131
36. Sai JK, Suyama M, Kubokawa Y, Watanabe S.
Diagnosis of mild chronic pancreatitis (Cam-
bridge classification): comparative study using
secretin injection-magnetic resonance cholang-
iopancreatography and endoscopic retrograde
pancreatography. World J Gastroenterol 2008;
14:1218–1221
37. Lee NJ, Kim KW, Kim TK, et al. Secretin-stimu-
lated MRCP. Abdom Imaging 2006; 31:575–581
38. Bali MA, Sztantics A, Metens T, et al. Quantification
of pancreatic exocrine function with secretin-en-
hanced magnetic resonance cholangiopancreatogra-
phy: normal values and short-term effects of pancre-
atic duct drainage procedures in chronic pancreatitis:
initial results. Eur Radiol 2005; 15:2110–2121
39. Punwani S, Gillams AR, Lees WR. Non-invasive
quantification of pancreatic exocrine function us-
ing secretin-stimulated MRCP. Eur Radiol 2003;
13:273–276
40. Czako L, Endes J, Takacs T, Boda K, Lonovics J.
Evaluation of pancreatic exocrine function by se-
cretin-enhanced magnetic resonance cholang-
iopancreatography. Pancreas 2001; 23:323–328
41. Cappeliez O, Delhaye M, Deviere J, et al. Chronic
pancreatitis: evaluation of pancreatic exocrine
function with MR pancreatography after secretin
stimulation. Radiology 2000; 215:358–364
42. Hellund JC, Skattum J, Buanes T, Geitung JT.
Secretin-stimulated magnetic resonance cholang-
iopancreatography of patients with unclear dis-
ease in the pancreaticobiliary tract. Acta Radiol
2007; 48:135–141
43. Ragozzino A, Manfredi R, Scaglione M, De Ritis
R, Romano S, Rotondo A. The use of MRCP in
the detection of pancreatic injuries after blunt
trauma. Emerg Radiol 2003; 10:14–18
44. Sharma P, Kitajima HD, Kalb B, Martin DR.
Gadolinium-enhanced imaging of liver tumors
and manifestations of hepatitis: pharmacodynam-
ic and technical considerations. Top Magn Reson
Imaging 2009; 20:71–78
45. Earls JP, Rofsky NM, Decorato DR, Krinsky GA,
Weinreb JC. Hepatic arterial-phase dynamic gad-
olinium-enhanced MR imaging: optimization
with a test examination and a power injector. Ra-
diology 1997; 202:268–273
46. Materne R, Horsmans Y, Jamart J, Smith AM,
Gigot JF, Van Beers BE. Gadolinium-enhanced
arterial-phase MR imaging of hypervascular liver
tumors: comparison between tailored and fixed
scanning delays in the same patients. J Magn
Reson Imaging 2000; 11:244–249
47. Pruessmann KP. Encoding and reconstruction in
parallel MRI. NMR Biomed 2006; 19:288–299
48. Glockner JF, Hu HH, Stanley DW, Angelos L,
King K. Parallel MR imaging: a user’s guide. Ra-
dioGraphics 2005; 25:1279–1297
49. Hussain SM, Wielopolski PA, Martin DR. Ab-
dominal magnetic resonance imaging at 3.0 T:
problem or a promise for the future? Top Magn
Reson Imaging 2005; 16:325–335
50. Akisik FM, Sandrasegaran K, Aisen AM, Lin C,
Lall C. Abdominal MR imaging at 3.0 T. Radio-
Graphics 2007; 27:1433–1444
51. Bammer R, Schoenberg SO. Current concepts and
advances in clinical parallel magnetic resonance im-
aging. Top Magn Reson Imaging 2004; 15:129–158
52. Onishi H, Kim T, Hori M, et al. MR cholang-
iopancreatography at 3.0 T: intraindividual com-
parative study with MR cholangiopancreatogra-
phy at 1.5 T for clinical patients. Invest Radiol
2009; 44:559–565
53. Schmidt GP, Wintersperger B, Graser A, Baur-
Melnyk A, Reiser MF, Schoenberg SO. High-res-
olution whole-body magnetic resonance imaging
applications at 1.5 and 3 tesla: a comparative
study. Invest Radiol 2007; 42:449–459
54. Kim SY, Byun JH, Lee SS, Park SH, Jang YJ, Lee
MG. Biliary tract depiction in living potential
liver donors: intraindividual comparison of MR
cholangiography at 3.0 and 1.5 T. Radiology 2010;
254:469–478
55. Koelblinger C, Schima W, Weber M, et al. Gadox-
ate-enhanced T1-weighted MR cholangiography:
comparison of 1.5 T and 3.0 T. Rofo 2009;
181:587–592
56. Ramalho M, Heredia V, Tsurusaki M, Altun E,
Semelka RC. Quantitative and qualitative com-
parison of 1.5 and 3.0 tesla MRI in patients with
chronic liver diseases. J Magn Reson Imaging
2009; 29:869–879
57. Isoda H, Kataoka M, Maetani Y, et al. MRCP im-
aging at 3.0 T vs. 1.5 T: preliminary experience in
healthy volunteers. J Magn Reson Imaging 2007;
25:1000–1006
58. von Falkenhausen MM, Lutterbey G, Morakkaba-
ti-Spitz N, et al. High-field-strength MR imaging
of the liver at 3.0 T: intraindividual comparative
study with MR imaging at 1.5 T. Radiology 2006;
241:156–166
59. Edelman RR, Salanitri G, Brand R, et al. Mag-
netic resonance imaging of the pancreas at 3.0 tesla:
qualitative and quantitative comparison with 1.5
tesla. Invest Radiol 2006; 41:175–180
60. Goncalves Neto JA, Altun E, Elazzazi M, Vaidean
GD, Chaney M, Semelka RC. Enhancement of ab-
dominal organs on hepatic arterial phase: quanti-
tative comparison between 1.5- and 3.0-T mag-
netic resonance imaging. Magn Reson Imaging
2010; 28:47–55
61. Lee VS, Hecht EM, Taouli B, Chen Q, Prince K,
Oesingmann N. Body and cardiovascular MR im-
aging at 3.0 T. Radiology 2007; 244:692–705
62. Asbach P, Klessen C, Kroencke TJ, et al. Mag-
netic resonance cholangiopancreatography using
a free-breathing T2-weighted turbo spin-echo se-
quence with navigator-triggered prospective ac-
quisition correction. Magn Reson Imaging 2005;
23:939–945
Dow
nloa
ded
from
ww
w.a
jron
line.
org
by 3
9.21
8.29
.138
on
06/0
9/13
fro
m I
P ad
dres
s 39
.218
.29.
138.
Cop
yrig
ht A
RR
S. F
or p
erso
nal u
se o
nly;
all
righ
ts r
eser
ved