401 energy efficient dining final paper.docx - mcgill.ca · web viewcarol zastavniouk....
TRANSCRIPT

A Technical and Behavioural Energy Efficiency Assessment of McGill
Cafeteria Operations at Bishop Mountain Hall and Royal Victoria College
Date: Dec 5th, 2012
Team: Tal Cantor
Maida Hadziosmanovic
Harriet Kim
Elizabeth Marsh
Chiara Secules
Kirk Wright
Carol Zastavniouk
Supervisor: Raja Sengupta
Client: Oliver deVolpi (McGill Food and Dining Services)

Executive Summary
McGill Food and Dining Services (MFDS) have, over the past three years, progressed as a leader in sustainable practices at
McGill University. In light of expectations for improvements in overall sustainable management, Executive Chef Oliver deVolpi has
pushed for an assessment of energy efficiency at the Bishop Mountain Hall (BMH) and Royal Victoria College (RVC) cafeterias. This
project aims to determine which technical and behavioural modifications should be made in the Royal Victoria College (RVC) and
Bishop Mountain Hall (BMH) cafeterias in order to increase energy efficiency.
Two key aspects determining energy consumption were addressed: the required energy input of the appliances, and the
frequency and manner of staff use of the appliances. The latter aspect reflects the technical approach of the project which is comprised
of investigating the operations of the appliances, their efficiency, and options for alternate, more energy efficient appliances. The
former reflects the behavioural approach, which is comprised of conducting observations and interviews to assess staff practices of the
use of appliances and the preparation of food. Extensive research conducted allowed us to provide costs and benefits of installing
energy-efficient alternatives, as well as suggest alternative staff practices.
Recommendations were made for each type of appliance analyzed. The behavioural approach identified necessary
improvements in staff practices, which depended on factors such as the type of food being prepared, the meal-time of day, and the
operation and availability of the appliances. Broad recommendations included completely turning off appliances (ones which are not
2

in use for long periods of the day), and reducing preheat times for appliances such as grills, griddles and fryers. The most significant
finding was the need to develop an atmosphere promoting energy efficiency through staff team support.
The technical approach assessed the sustainability of energy sources including natural gas, electricity, and steam. Data on
energy and cost savings of replacing particular appliances with high-efficiency units (Energy Star rated models) were provided. Using
this data and appliance specification data, priority lists of suggested appliance replacements were made.
We hope that our recommendations facilitate the commitment of MFDS to sustainability.
3

Table of Contents
1. Introduction: Project Issues in Broader Context.......................................................................7
1.1. BMH and RVC: Historical and Current Conditions........................................................11
2. Research Question..................................................................................................................12
2.1. Working Definitions........................................................................................................13
3. Methodology...........................................................................................................................14
3.1. Technical Approach.........................................................................................................14
3.2. Behavioural Approach.....................................................................................................16
4. Analysis..................................................................................................................................19
4.1. Behaviour Results & Recommendations.........................................................................19
4.1.1. Grills.....................................................................................................................................................................................19
4.1.2. Griddles.................................................................................................................................................................................20
4.1.3. Fridges and Freezers.............................................................................................................................................................21
4.1.4. Steam Kettles........................................................................................................................................................................22
4

4.1.5. Fryers....................................................................................................................................................................................23
4.1.6. Warmers and Holders...........................................................................................................................................................24
4.1.7. Ovens....................................................................................................................................................................................24
4.1.8. Stoves....................................................................................................................................................................................27
4.1.9. Dishwasher...........................................................................................................................................................................28
4.2. Creating a Culture of Sustainability within MFDS.........................................................30
4.3. Technical Analysis & Recommendations........................................................................32
4.3.1. Assessing Energy Sources: Electricity, Natural Gas, & Steam............................................................................................32
4.3.2. Electricity & Natural Gas: Energy Efficiency......................................................................................................................33
4.3.3. Electricity & Natural Gas: Costs..........................................................................................................................................33
4.3.4. Electricity & Natural Gas: Impacts.......................................................................................................................................34
4.3.5. Electricity & Natural Gas: Results and Recommendations..................................................................................................35
4.3.6. Steam-Run Appliances.........................................................................................................................................................37
4.3.7. Energy Input versus Frequency of Use Analysis..................................................................................................................39
5

4.3.8. Rarely-Used Appliances.......................................................................................................................................................44
4.3.9. Fridges and Freezers.............................................................................................................................................................46
5. Conclusion..............................................................................................................................47
5.1. Key Findings....................................................................................................................47
5.2. Limitations......................................................................................................................48
5.3. Future Studies & Research..............................................................................................51
5.3. Final Statements..............................................................................................................53
6. Works Cited............................................................................................................................54
7. Works Consulted....................................................................................................................58
8. Appendices.............................................................................................................................61
8.1. Appendix A: Graphs........................................................................................................63
8.2. Appendix B: Tables.........................................................................................................68
8.3. Appendix C: Maps...........................................................................................................82
8.4. Appendix D: Further Documentation..............................................................................85
6

1. Introduction: Project Issues in Broader Context
The focus of this report is to determine ways to increase energy efficiency in the McGill University cafeterias of Royal
Victoria Hall and Bishop Mountain Hall. This initiative has been put forth by our client, Executive Chef Oliver deVolpi from MFDS.
MFDS is a sector of McGill Student Life and Learning, operating under a self-financing, mixed business model that includes self-
operated locations which contract food providers (Rhodes 2011, MFDS 2012).
We realize there are greater consequences of this task and its implementation. The concept of energy efficiency goes far
beyond the borders of campus; environmental factors, national and provincial regulations, as well as university policies, have all
contributed to shaping our initiative. The findings in this report may be applied to the greater knowledge base of energy efficient Best
Practices in cafeteria and kitchen facilities.
In an era of rapid globalization and economic development, resource depletion and rising costs of energy will begin to have
limiting effects on our actions and behaviours. These limitations have made it essential for industries to operate under higher levels of
efficiency. An industry that increases its energy efficiency will produce more outputs per unit of energy input (Bergstrom & Randall
2010), thus optimizing resource use and cutting down on operation costs. This sort of increase in energy efficiency can reduce
negative impacts on the environment, particularly greenhouse gas production and the destruction of ecosystems through resource
exploitation.
7

Taking a more local perspective, the commercial food service industry in Canada accounts for 4% of commercial and
institutional energy consumption (Natural Resources Canada 2010). Though this may seem to be a small percentage on a national
scale, the proportion of this industry’s energy consumption in smaller environments, such as university campuses, still has great
significance. With the exception of some medical facilities, dining facilities generally have the largest environmental footprint on
university campuses (Elbaum 2010). In fact, commercial kitchens are typically found to use about five times more energy than any
other part of a university campus (Conrad 2007). Thus, technical and behavioural modifications made to the operations of university
cafeterias can have significant impacts on the overall energy consumption by the campus. As the cafeterias of a university campus are
central hubs of daily student and staff activity, energy efficiency improvements made in these locations have the potential to influence
student and staff day-to-day choices related to resource and energy use (Elbaum 2010).
Governmental ministries have been quick to recognize the necessity for energy efficiency efforts in educational institutions. In
2006, Le Ministère de l’Éducation du Loisir et des Sport (MELS) of Quebec mandated the reduction of energy intensity1 consumption
of post-secondary institutions in Quebec by 14% below 2002-03 figures by the 2010-11 academic year (McGill University 2010).
McGill responded to this mandate by setting its own goal of achieving 12% reductions below 2002-03 levels by the 2010-11 year.
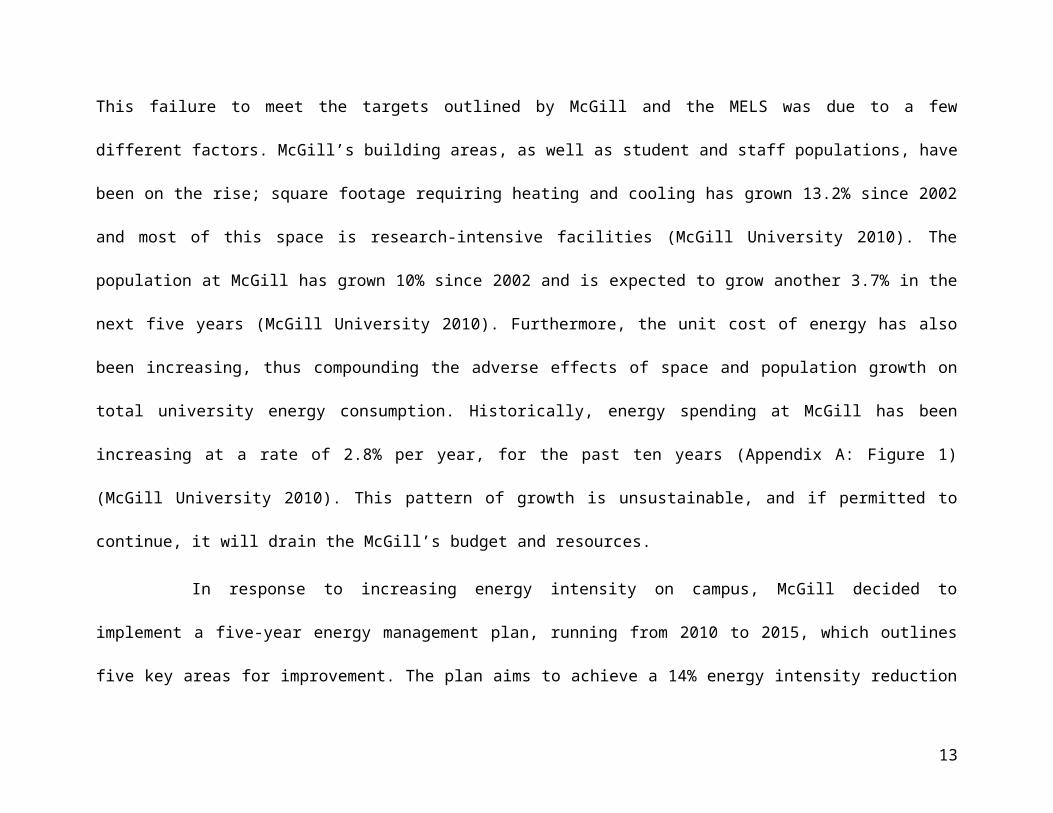
However, by 2010, McGill had only achieved a 5.66% reduction (McGill University 2010). This failure to meet the targets outlined by
McGill and the MELS was due to a few different factors. McGill’s building areas, as well as student and staff populations, have been
on the rise; square footage requiring heating and cooling has grown 13.2% since 2002 and most of this space is research-intensive
1 Energy intensity can be defined by the formula: GJ/$ of floor space (McGill Energy Project: MELS 2012).
8

facilities (McGill University 2010). The population at McGill has grown 10% since 2002 and is expected to grow another 3.7% in the
next five years (McGill University 2010). Furthermore, the unit cost of energy has also been increasing, thus compounding the adverse
effects of space and population growth on total university energy consumption. Historically, energy spending at McGill has been
increasing at a rate of 2.8% per year, for the past ten years (Appendix A: Figure 1) (McGill University 2010). This pattern of growth is
unsustainable, and if permitted to continue, it will drain the McGill’s budget and resources.
In response to increasing energy intensity on campus, McGill decided to implement a five-year energy management plan,
running from 2010 to 2015, which outlines five key areas for improvement. The plan aims to achieve a 14% energy intensity reduction
by 2012-2013 (relative to 2002-03 figures) (McGill University 2010). The five areas of focus are the implementation of an energy
management information system program (EMIS), a lighting and retrofit program, a building energy audit program, a building
recommissioning program, and various energy conservation projects (McGill University 2010). The energy management information
system program will input metering to more accurately quantify energy consumption of steam, electricity and condensate (McGill
University 2010). (As it has not been implemented yet, our project was not able to use any data from metering). The lighting and
retrofit program will replace incandescent lighting with more technologically advanced fluorescent lighting, and will also allow for
greater flexibility of how much illumination is provided at different times of the day (McGill University 2010). The building energy
audit program, which has already covered buildings such as Bronfman, Burnside Hall, and Rutherford Physics, aims to identify and
“provide information on the most significant sources of energy consumption in [the] building, thereby ensuring that energy reduction
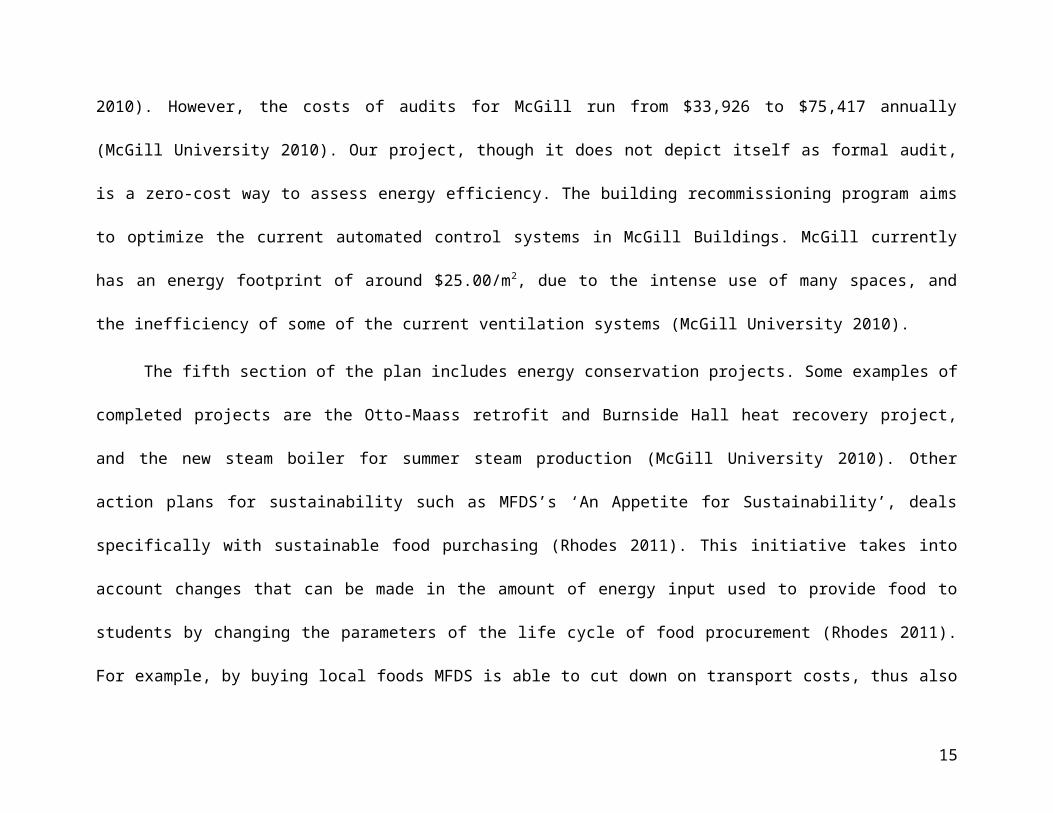
investments are appropriately prioritized and planned” (McGill University 2010). However, the costs of audits for McGill run from
9

$33,926 to $75,417 annually (McGill University 2010). Our project, though it does not depict itself as formal audit, is a zero-cost way
to assess energy efficiency. The building recommissioning program aims to optimize the current automated control systems in McGill
Buildings. McGill currently has an energy footprint of around $25.00/m2, due to the intense use of many spaces, and the inefficiency
of some of the current ventilation systems (McGill University 2010).
The fifth section of the plan includes energy conservation projects. Some examples of completed projects are the Otto-Maass
retrofit and Burnside Hall heat recovery project, and the new steam boiler for summer steam production (McGill University 2010).
Other action plans for sustainability such as MFDS’s ‘An Appetite for Sustainability’, deals specifically with sustainable food
purchasing (Rhodes 2011). This initiative takes into account changes that can be made in the amount of energy input used to provide
food to students by changing the parameters of the life cycle of food procurement (Rhodes 2011). For example, by buying local foods
MFDS is able to cut down on transport costs, thus also reducing energy consumed by the transport vehicles and reducing the total
GHGs emitted. It is also important to note that in economics, demand drives supply, and the larger purchases by an entity are, the
greater the influence it has on what is demanded (Bergstrom and Randall 2010). MFDS can set an example for other university dining
facilities since they are bulk food purchasers, and thus have purchasing power, which can influence the decisions of suppliers.
Our project satisfies the goals of MFDS’s strategic plan because it will add to the research and knowledge base needed to run
more sustainable operations. It will also address the goal of making food service operations more sustainable by creating prioritized
energy-savings suggestions, including appliance replacements and more time-appropriate use of appliances. The project will also
10

assist in achieving financial sustainability so that the “premiums paid on local and sustainable food purchases are absorbed” (Rhodes
2011). Cost savings from increased efficiency will provide funds for more local and sustainable food purchases.
1.1. BMH and RVC: Historical and Current Conditions
The two cafeterias examined in this project are Bishop Mountain Hall (BMH) and Royal Victoria College (RVC) (Appendix
C: Figures 1,2,3). The RVC cafeteria is connected to the RVC residence hall, so there is no distinction between the two areas in
energy billing. The cafeteria in RVC was recently renovated and retrofitted with many new energy efficient appliances within the last
five years. The kitchen in RVC now has a new sensor-run HVAC (heating, ventilation and air-conditioning) system, which accounted
for a significant amount of energy savings at RVC (deVolpi 2012). This is an especially important addition to a commercial kitchen
because of the large discharges of heat and vapour from cooking activities. The appliances in RVC now all run on either electricity or
gas, with the majority running on electricity (Appendix A: Figure 2). The RVC cafeteria was also retrofitted with a new lighting
system, as well as a dishwasher (deVolpi 2012).
BMH is an independent dining hall, which serves the Upper Residence Halls of Molson, McConnell, and Gardiner. The
majority of the building is a kitchen and dining space, with a few small offices in it. Thus, the energy billing for BMH is a fairly
accurate representation of the energy consumption of its cafeteria operations. The cafeteria in BMH is spread out over two floors; the
basement where most of the food preparation occurs, and the second floor, where the food is served. BMH services around the same
number of students as RVC (deVolpi 2012), however, the floor space at BMH is around twice the size as RVC. It should be noted that
11

increased floor space means an increase in area, which would need to be serviced by HVAC systems. BMH is older and less efficient
than RVC (deVolpi 2012). Most of the appliances in BMH have not been updated in decades (deVolpi 2012). Though there are gas
and electricity powered appliances in BMH, there are also many that run directly on steam. While there have been recent installations,
most notably energy efficient models of a walk-in fridge and walk-in freezer, appliance replacements in BMH will be a key focus of
our analysis.
2. Research Question
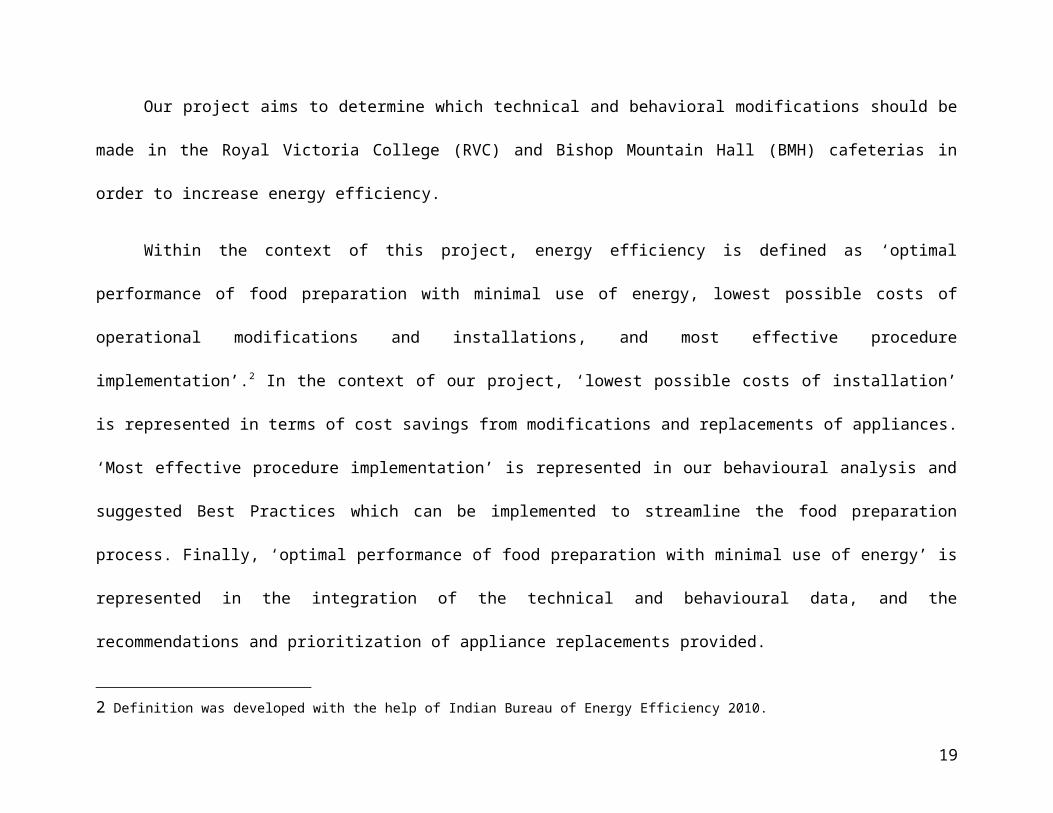
Our project aims to determine which technical and behavioral modifications should be made in the Royal Victoria College
(RVC) and Bishop Mountain Hall (BMH) cafeterias in order to increase energy efficiency.
Within the context of this project, energy efficiency is defined as ‘optimal performance of food preparation with minimal use
of energy, lowest possible costs of operational modifications and installations, and most effective procedure implementation’.2 In the
context of our project, ‘lowest possible costs of installation’ is represented in terms of cost savings from modifications and
replacements of appliances. ‘Most effective procedure implementation’ is represented in our behavioural analysis and suggested Best
Practices which can be implemented to streamline the food preparation process. Finally, ‘optimal performance of food preparation
with minimal use of energy’ is represented in the integration of the technical and behavioural data, and the recommendations and
prioritization of appliance replacements provided.
2 Definition was developed with the help of Indian Bureau of Energy Efficiency 2010.
12
2.1. Working Definitions
Best Practices: A set of guidelines, ethics or ideas that represent the most efficient or prudent courses of action (Campus ERC 2007).
Within the context of kitchen energy efficiency, they are cooking practices that prompt food to be cooked well and in a timely manner,
using the lowest possible amount of energy.
Cooking Energy Efficiency (CEE): The ratio of energy absorbed by the food product to the total energy used by the appliance during
cooking (Energy Star 2012).
Idle Energy Rate (IER): The rate of energy consumption while the appliance is maintaining or holding at a stabilized operating
condition or temperature (Energy Star 2012).
Energy Input: The energy demand [of an appliance] of a particular energy source (i.e. electricity, natural gas, or steam) (Radovic).
Energy input is used as one of the parameters for determining appliance energy efficiency.
13

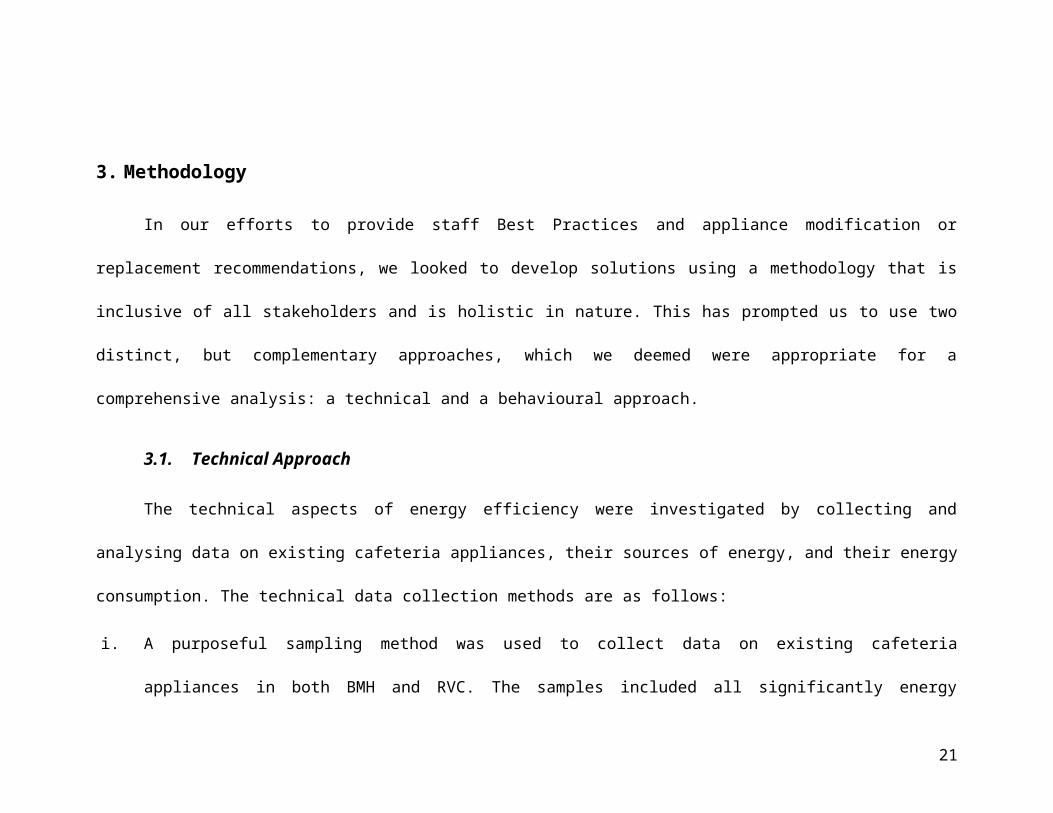
3. Methodology
In our efforts to provide staff Best Practices and appliance modification or replacement recommendations, we looked to
develop solutions using a methodology that is inclusive of all stakeholders and is holistic in nature. This has prompted us to use two
distinct, but complementary approaches, which we deemed were appropriate for a comprehensive analysis: a technical and a
behavioural approach.
3.1. Technical Approach
The technical aspects of energy efficiency were investigated by collecting and analysing data on existing cafeteria appliances,
their sources of energy, and their energy consumption. The technical data collection methods are as follows:
i. A purposeful sampling method was used to collect data on existing cafeteria appliances in both BMH and RVC. The samples
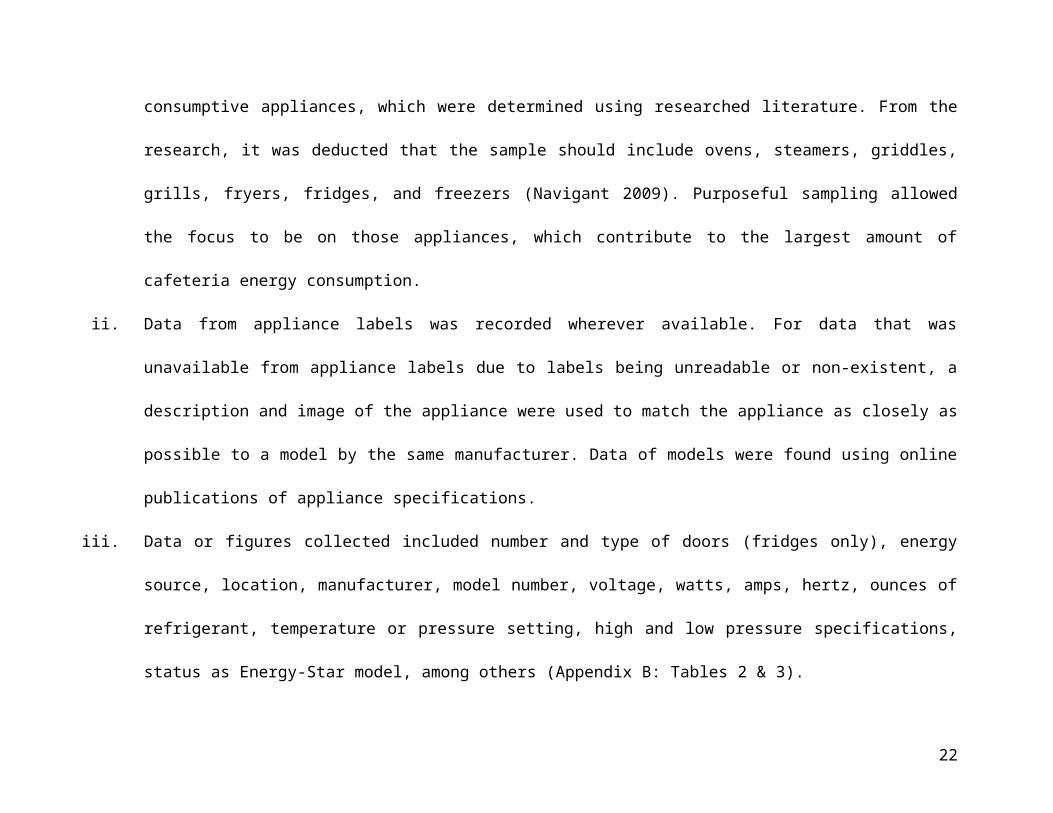
included all significantly energy consumptive appliances, which were determined using researched literature. From the
research, it was deducted that the sample should include ovens, steamers, griddles, grills, fryers, fridges, and freezers
(Navigant 2009). Purposeful sampling allowed the focus to be on those appliances, which contribute to the largest amount of
cafeteria energy consumption.
14
ii. Data from appliance labels was recorded wherever available. For data that was unavailable from appliance labels due to labels
being unreadable or non-existent, a description and image of the appliance were used to match the appliance as closely as
possible to a model by the same manufacturer. Data of models were found using online publications of appliance
specifications.
iii. Data or figures collected included number and type of doors (fridges only), energy source, location, manufacturer, model
number, voltage, watts, amps, hertz, ounces of refrigerant, temperature or pressure setting, high and low pressure
specifications, status as Energy-Star model, among others (Appendix B: Tables 2 & 3).
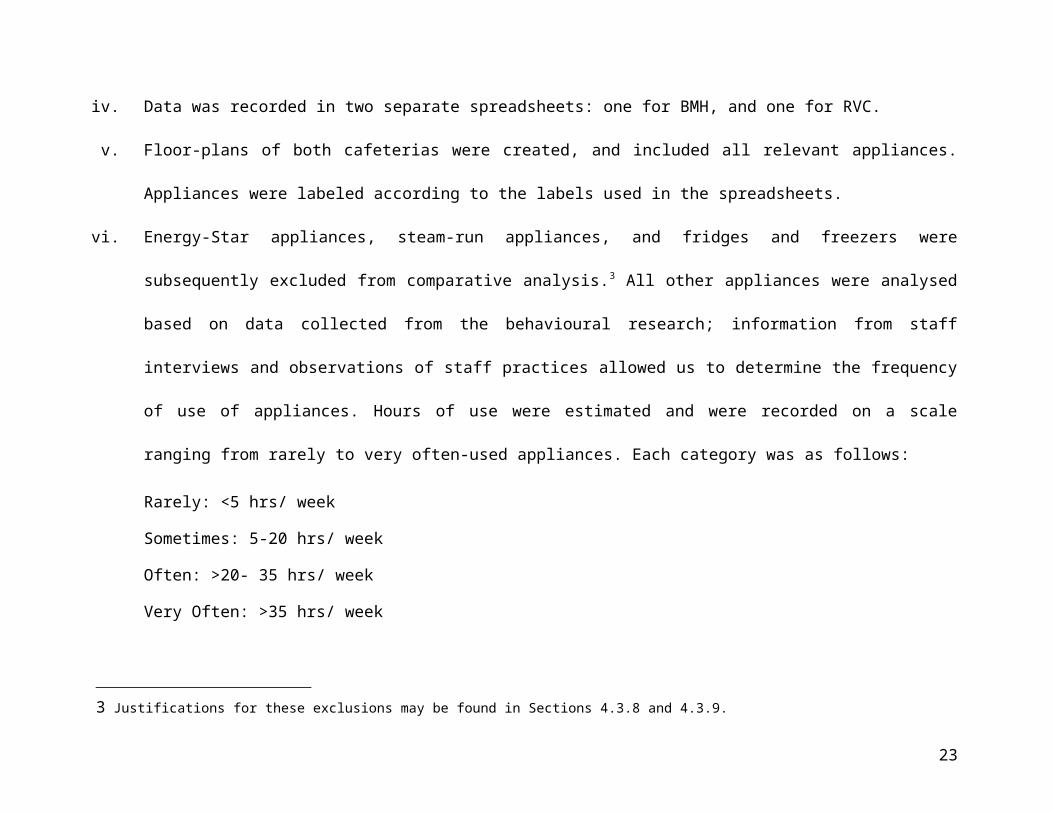
iv. Data was recorded in two separate spreadsheets: one for BMH, and one for RVC.
v. Floor-plans of both cafeterias were created, and included all relevant appliances. Appliances were labeled according to the
labels used in the spreadsheets.
vi. Energy-Star appliances, steam-run appliances, and fridges and freezers were subsequently excluded from comparative
analysis.3 All other appliances were analysed based on data collected from the behavioural research; information from staff
interviews and observations of staff practices allowed us to determine the frequency of use of appliances. Hours of use were
estimated and were recorded on a scale ranging from rarely to very often-used appliances. Each category was as follows:
Rarely: <5 hrs/ week
Sometimes: 5-20 hrs/ week
3 Justifications for these exclusions may be found in Sections 4.3.8 and 4.3.9.
15

Often: >20- 35 hrs/ week
Very Often: >35 hrs/ week
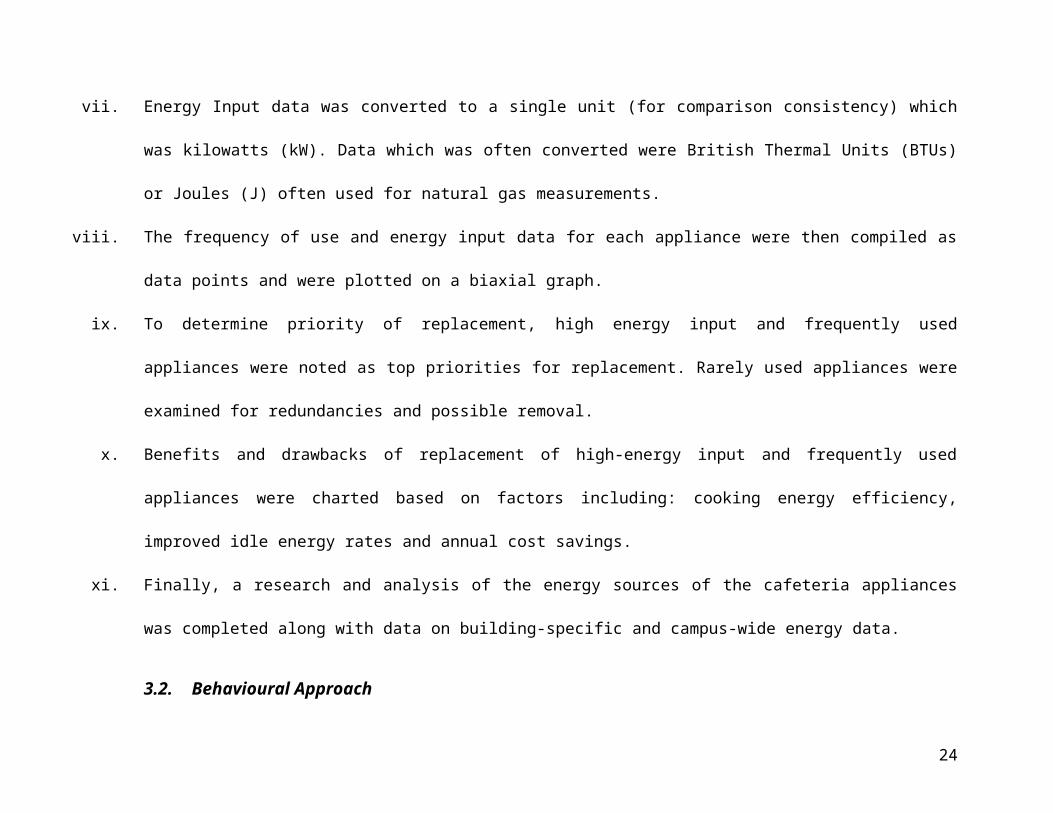
vii. Energy Input data was converted to a single unit (for comparison consistency) which was kilowatts (kW). Data which was
often converted were British Thermal Units (BTUs) or Joules (J) often used for natural gas measurements.
viii. The frequency of use and energy input data for each appliance were then compiled as data points and were plotted on a biaxial
graph.
ix. To determine priority of replacement, high energy input and frequently used appliances were noted as top priorities for
replacement. Rarely used appliances were examined for redundancies and possible removal.
x. Benefits and drawbacks of replacement of high-energy input and frequently used appliances were charted based on factors
including: cooking energy efficiency, improved idle energy rates and annual cost savings.
xi. Finally, a research and analysis of the energy sources of the cafeteria appliances was completed along with data on building-
specific and campus-wide energy data.
3.2. Behavioural Approach
The behavioural aspects of energy efficiency were investigated by observing and analysing staff behaviour regarding the use of
cafeteria appliances at RVC and BMH. Data on hourly usage of appliances per day was collected through formal interviews later
incorporated into the technical methodology. Furthermore, information on how staff operates the appliances was obtained by
16

conducting numerous cafeteria observations and interviews at both cafeterias (Appendix D: Figure 1). The behavioural methodology
is as follows:
i. Observations of the kitchen were conducted during four periods of the day: opening, peak, non-peak, and closing hours as
appliance use differs throughout the working day. It is important to note that peak and non-peak hours vary between the
cafeterias. Both cafeteria schedules assisted in determining these periods. The following types of observations were noted:
a. When and how often particular appliances are used
b. At which settings (e.g. temperature) the appliances are programmed/set to
c. Whether an appliance is turned on when it is not in use
d. Whether the use of the appliance well-suits its purpose
ii. Informal questions were posed to the staff during some of the observations in order to better understand their practices, and the
rationale behind these practices.
iii. Formal one-on-one interviews with staff members were conducted by members of our team. The aim was to conduct a more
in-depth study of staff practices in the cafeterias. We interviewed 13 kitchen staff in total: 6 from BMH and 7 from RVC. The
staff interviewed included general helpers, counter staff, bakers, first cooks, second cooks, sous-chefs, and other kitchen staff
who work on weekdays. The interview was completed using a series of 14 questions. Four were closed-ended questions, and
ten were open-ended questions. Closed-ended questions are easier to respond to and analyse, while still providing important
data. Open-ended questions require the interviewee to answer a question in detail, which is beneficial as it provides
17

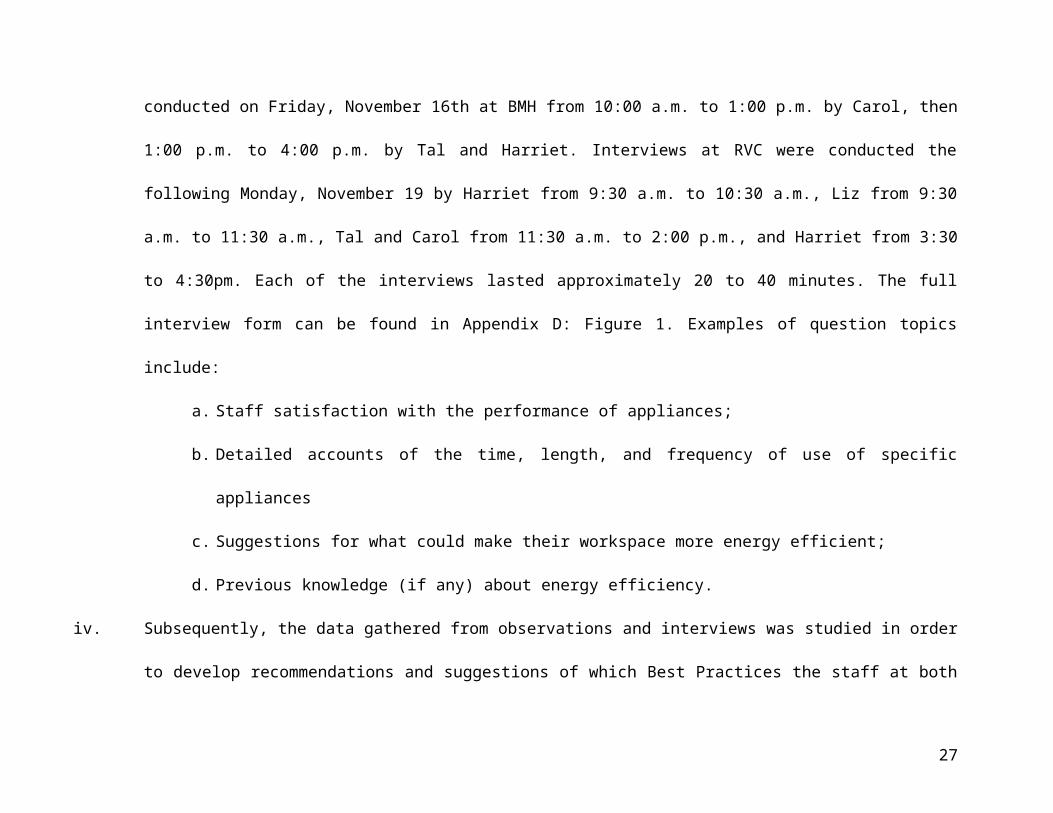
clarification and further understanding of their reasoning. The interviews were conducted on Friday, November 16th at BMH
from 10:00 a.m. to 1:00 p.m. by Carol, then 1:00 p.m. to 4:00 p.m. by Tal and Harriet. Interviews at RVC were conducted the
following Monday, November 19 by Harriet from 9:30 a.m. to 10:30 a.m., Liz from 9:30 a.m. to 11:30 a.m., Tal and Carol
from 11:30 a.m. to 2:00 p.m., and Harriet from 3:30 to 4:30pm. Each of the interviews lasted approximately 20 to 40 minutes.
The full interview form can be found in Appendix D: Figure 1. Examples of question topics include:
a. Staff satisfaction with the performance of appliances;
b. Detailed accounts of the time, length, and frequency of use of specific appliances
c. Suggestions for what could make their workspace more energy efficient;
d. Previous knowledge (if any) about energy efficiency.
iv. Subsequently, the data gathered from observations and interviews was studied in order to develop recommendations and
suggestions of which Best Practices the staff at both cafeterias should implement. Data and information collected was
compared to Best Practices found in the literature. Both observations and interviews were conducted to compensate for
possible bias in the information collected in the interviews.
18
4. Analysis
4.1. Behaviour Results & Recommendations
Recommendations have been made for each type of appliance by comparing current staff practices to researched literature. A
list of Best Practices for each type of appliance can be found in Appendix B: Table 4.
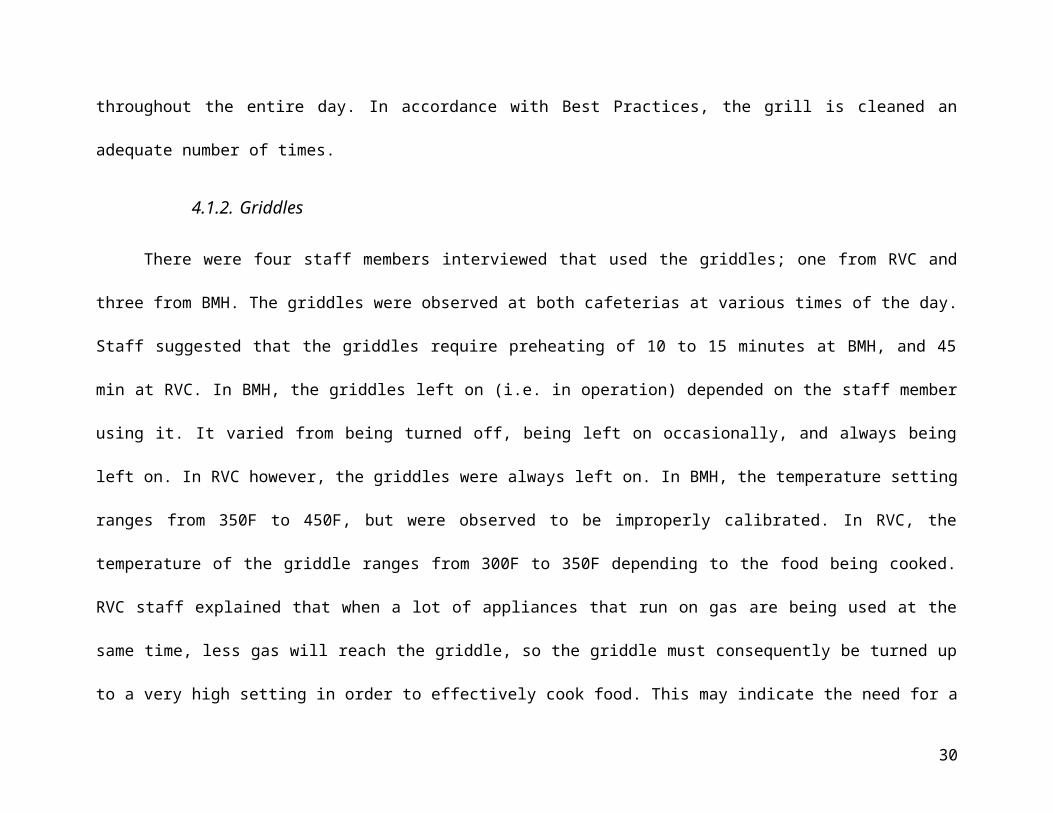
4.1.1. Grills
Staff spoken to informally said that the grill in RVC is on for over 9 hours a day, from around 11:30AM to 9:00PM. One
interviewee spoke about using the grill and explained that while the grill is not used for breakfast, it is turned on at 9:30am in order to
heat it up for the lunch-time peak, which begins at 11:00am. This was explained to be necessary due to the uncertainty of when a
student may request a food item that must be cooked on the grill. The interviewee said it usually preheats for more than an hour and
that the grill is always used at a high temperature setting, despite the fact that there is a medium setting option. This statement was
confirmed through observations. The interviewee also noted that the grill is cleaned about every hour to remove food scraps.
Based on these findings, we recommend that the grill be turned on at the earliest at 10:30AM at the medium setting, and then
turned up to the high setting at 11:00am, just before the lunchtime rush, as it was mentioned by staff that it takes 10 to 15 minutes for
the grill to preheat. Due to the uncertainty of when students will order food off the grill, it is understood that the grill cannot be turned
19

down to a medium setting throughout the entire day. In accordance with Best Practices, the grill is cleaned an adequate number of
times.
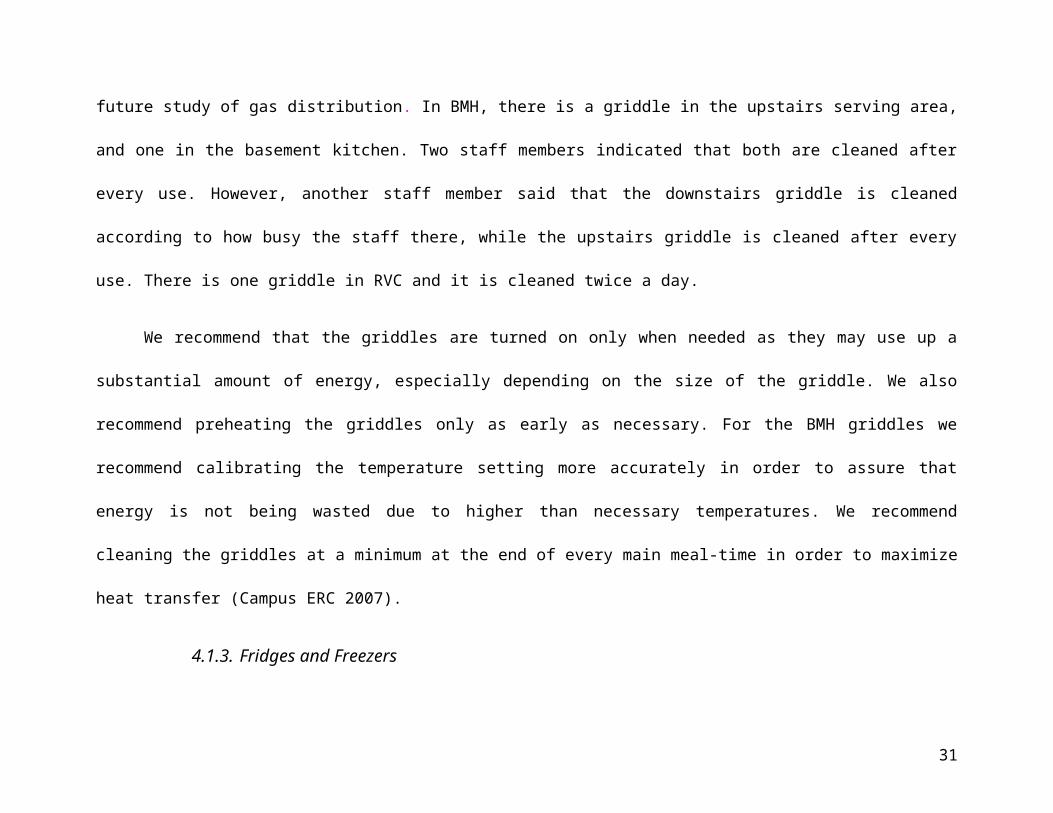
4.1.2. Griddles
There were four staff members interviewed that used the griddles; one from RVC and three from BMH. The griddles were
observed at both cafeterias at various times of the day. Staff suggested that the griddles require preheating of 10 to 15 minutes at
BMH, and 45 min at RVC. In BMH, the griddles left on (i.e. in operation) depended on the staff member using it. It varied from being
turned off, being left on occasionally, and always being left on. In RVC however, the griddles were always left on. In BMH, the
temperature setting ranges from 350F to 450F, but were observed to be improperly calibrated. In RVC, the temperature of the griddle
ranges from 300F to 350F depending to the food being cooked. RVC staff explained that when a lot of appliances that run on gas are
being used at the same time, less gas will reach the griddle, so the griddle must consequently be turned up to a very high setting in
order to effectively cook food. This may indicate the need for a future study of gas distribution. In BMH, there is a griddle in the
upstairs serving area, and one in the basement kitchen. Two staff members indicated that both are cleaned after every use. However,
another staff member said that the downstairs griddle is cleaned according to how busy the staff there, while the upstairs griddle is
cleaned after every use. There is one griddle in RVC and it is cleaned twice a day.
We recommend that the griddles are turned on only when needed as they may use up a substantial amount of energy, especially
depending on the size of the griddle. We also recommend preheating the griddles only as early as necessary. For the BMH griddles we
20
recommend calibrating the temperature setting more accurately in order to assure that energy is not being wasted due to higher than
necessary temperatures. We recommend cleaning the griddles at a minimum at the end of every main meal-time in order to maximize
heat transfer (Campus ERC 2007).
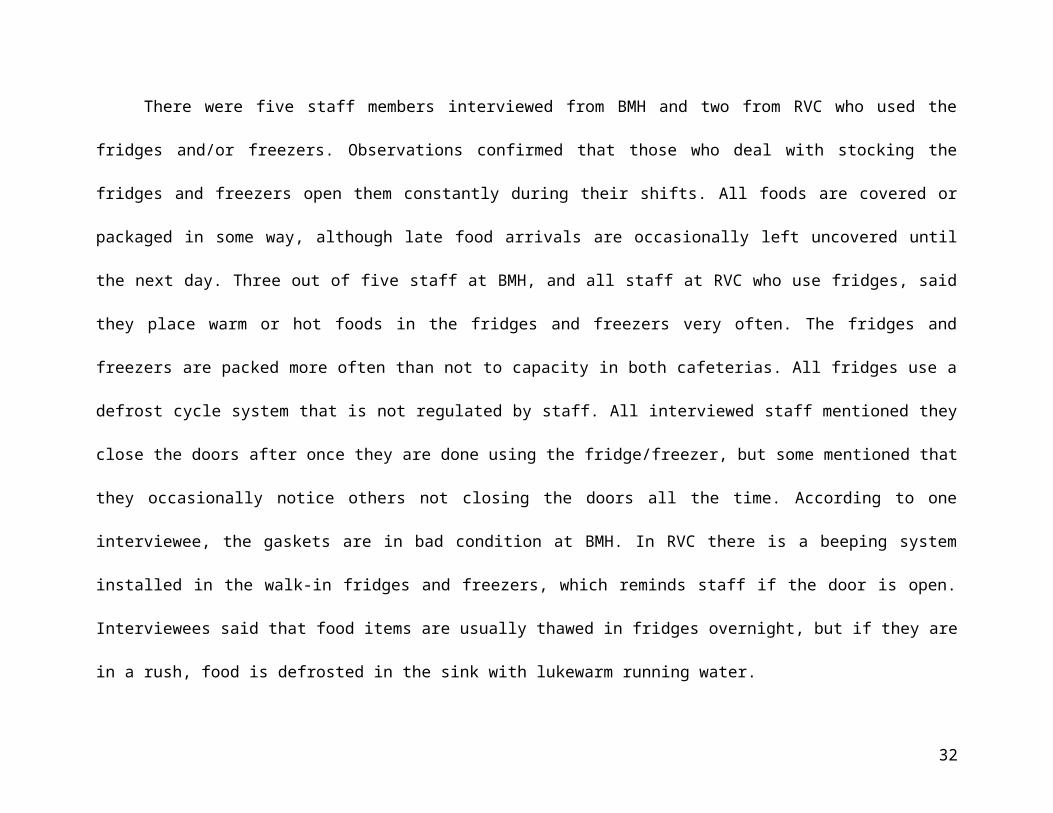
4.1.3. Fridges and Freezers
There were five staff members interviewed from BMH and two from RVC who used the fridges and/or freezers. Observations
confirmed that those who deal with stocking the fridges and freezers open them constantly during their shifts. All foods are covered or
packaged in some way, although late food arrivals are occasionally left uncovered until the next day. Three out of five staff at BMH,
and all staff at RVC who use fridges, said they place warm or hot foods in the fridges and freezers very often. The fridges and freezers
are packed more often than not to capacity in both cafeterias. All fridges use a defrost cycle system that is not regulated by staff. All
interviewed staff mentioned they close the doors after once they are done using the fridge/freezer, but some mentioned that they
occasionally notice others not closing the doors all the time. According to one interviewee, the gaskets are in bad condition at BMH.
In RVC there is a beeping system installed in the walk-in fridges and freezers, which reminds staff if the door is open. Interviewees
said that food items are usually thawed in fridges overnight, but if they are in a rush, food is defrosted in the sink with lukewarm
running water.
We recommend that stocking of fridges and freezers be planned to minimize the number of times that the fridges and freezers
are opened. This could mean stocking the day’s foods that will be used in the front of the walk-in fridges or freezers, so that door
21
opening time is minimized. It could also simply mean stocking foods in a more organized and tidy manner, so that it does not take
long to find particular foods. Food should always be covered before it is placed in the fridge or freezer, in order to increase cooling
efficiency (Campus ERC 2007). This should be arranged with the food delivery companies, or faster packaging techniques may be
developed. The gaskets on the fridge and freezer doors in BMH should be replaced, as the gaskets that are in bad condition make it
more difficult to close the doors. These faulty gaskets and poorly sealed doors also lead to leaking of cool air from the inside (Natural
Resources Canada 2012). As the RVC staff indicated, there is an alarm system on the walk-in fridges to remind them that doors are
opened. We recommend that an small alarm system be installed in more of the fridges and freezers in both cafeterias. Staff should
always plan ahead and consider thawing food items in the fridges, rather than thawing them last-minute using running water. Thawing
more food in the fridge overnight will also aid in keeping the fridge cool (as heat the food item will gain heat in the process of
thawing) (Food Safety and Inspection Service 2010).
4.1.4. Steam Kettles
There were three staff members interviewed who dealt with steam kettles at BMH, and one staff member from RVC.
According to staff, the steam kettles are never left operating while they are not in use. This was confirmed by observation. In BMH,
there is only one steam kettle that has a cover, but it is generally not used. In RVC, the covers are used only while the water is set to
boil. None of the interviewed staff were aware of how often the kettles are flushed. The steam kettles are cleaned after every use at
22
both cafeterias. The ones at BMH undergo a full cleaning (including the removal of mineral deposits) once a year, though RVC staff
were not aware of how often this was done for their steam kettles.
We recommend that covers should be used in order to speed up cooking times (Association for the Education of Young
Children). Covers should be installed as additional parts on those steam kettles that do not already have them, and staff should be
trained to use them in both cafeterias.
4.1.5. Fryers
There are three fryers at BMH and three at RVC. Two people were interviewed from BMH about fryers and one was
interviewed from RVC. One interviewee said that fryers are left on between orders, as they are uncertain about when students will
want food from the fryers. Furthermore it takes about 8 minutes to warm-up the fryers. Another interviewee said that fryers are never
on when they are not in use. The heat setting on the fryers is never adjusted. The oil in the fryers is replaced about every 10 to 14 days.
The baskets of the deep fryers are not often filled to capacity.
We recommend that meters for polar content be installed in the fryers at BMH to make sure that the polar content does not go
above 24 percent (replacing the oil every 10-14 days may not be as often as is necessary) (Gromicko and London 2012). The baskets
of the deep fryer should also be at capacity as often as possible. Fryers should be turned off when not in use, but otherwise adjusted to
a lower temperature in between mass consecutive orders from students.
23
4.1.6. Warmers and Holders
There are two holders in BMH and four in RVC. At BMH, one of the holders is a steam bath that is set between 160F and
180F. There is also another standard upright holder. RVC has an enclosed upright holder, which is set between 160F and 170F. The
holders are on all day from opening to closing in both cafeterias, but are only actually filled and ‘in use’ for about 3 hours per day in
BMH and 3 to 4 hours per day in RVC.
As there are several holders in either cafeteria, we recommend that only one or two holders are used until filled to capacity.
Once filled to capacity, other available holders can be turned on for use. We also recommend that covers (where applicable) are used
for all holders as much as possible to reduce heat loss (Association for the Education of Young Children).
4.1.7. Ovens
Four out of the six staff members interviewed from BMH, and four out of seven staff at RVC use ovens. All of the staff
interviewed who use ovens at BMH use the combination-ovens very often, meaning more 35 hours for a five day week. This indicates
that the ovens are one of the most frequently used appliances in the cafeteria. Staff said the convection oven was used occasionally as
well. In RVC, two of the four staff interviewed who used ovens at RVC use the combination-ovens very often. Of the other two
interviewed, one staff member used the pizza oven and one staff member used the convection oven rarely (less than 5 hours per week).
24

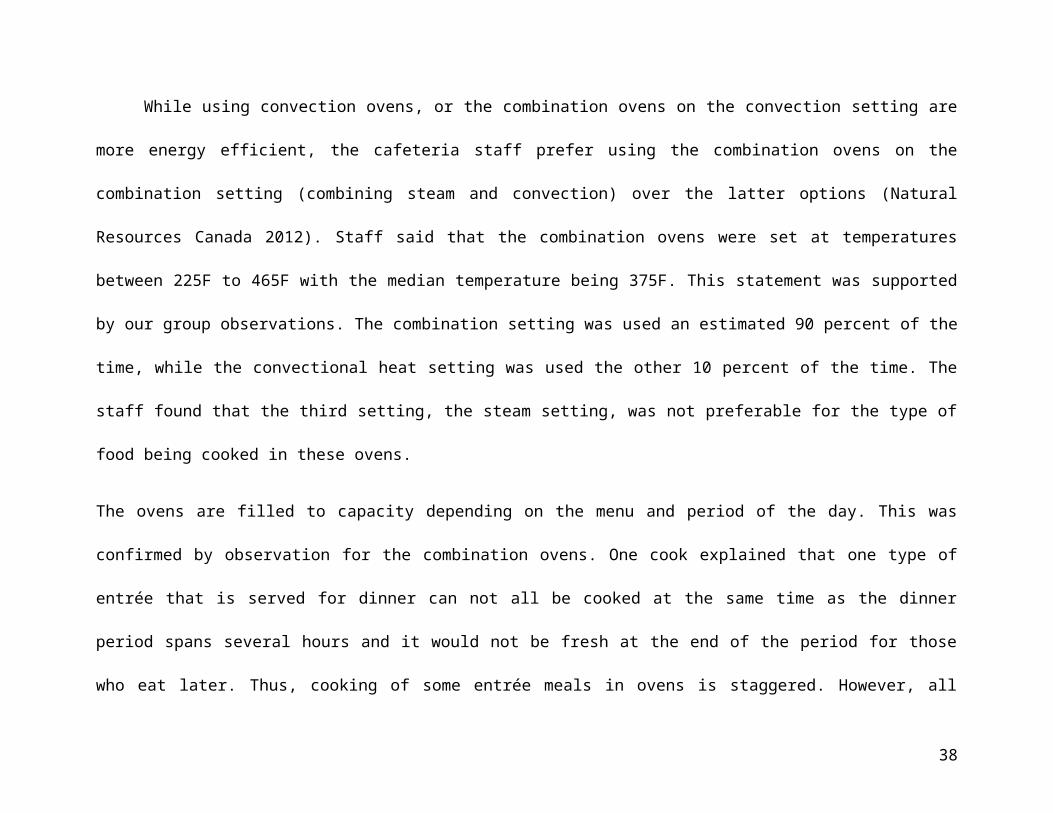
While using convection ovens, or the combination ovens on the convection setting are more energy efficient, the cafeteria staff
prefer using the combination ovens on the combination setting (combining steam and convection) over the latter options (Natural
Resources Canada 2012). Staff said that the combination ovens were set at temperatures between 225F to 465F with the median
temperature being 375F. This statement was supported by our group observations. The combination setting was used an estimated 90
percent of the time, while the convectional heat setting was used the other 10 percent of the time. The staff found that the third setting,
the steam setting, was not preferable for the type of food being cooked in these ovens.
The ovens are filled to capacity depending on the menu and period of the day. This was confirmed by observation for the combination
ovens. One cook explained that one type of entrée that is served for dinner can not all be cooked at the same time as the dinner period
spans several hours and it would not be fresh at the end of the period for those who eat later. Thus, cooking of some entrée meals in
ovens is staggered. However, all interviewees who used ovens said they tried to fill them to capacity if the menu and timing allowed
for it.
All the cooks interviewed said they would open the oven doors multiple times, at least twice during a 20 minute cooking
session. Cooks in RVC noted that they did not have to open the doors as often with the new ovens, which had glass doors, which
allowed them to see how well the food item was cooked. This decreases cooking time because less heat is lost as the doors are not
opened as often (Natural Resources Canada 2012).
25

Oven cleaning is important because a clean oven can transfer heat more efficiently than one with excess food scraps left inside
it (Natural Resources Canada 2012). Three of four BMH staff members interviewed believed that the ovens were cleaned two to three
times a year. However, the RVC staff members interviewed did not have uniform knowledge of the frequency of oven cleaning. Two
out of four staff could not answer, while the other two guessed that cleaning happened twice a year. No one was found to put food in
the oven while the oven was in preheating mode.
Each staff member interviewed about using ovens noted that their usage varied. Three out of four staff from BMH use the
ovens for about 2 hours, at different times before 2:00 p.m. The fourth staff member said oven use varies based on the menu. At RVC,
two cooks use the combination oven very often; one cook uses it for at least 3 hours in the morning, and the second cook uses it from
2:00 p.m. to 8:00 p.m. Two other staff members said they use the convection oven for 2 hours, and the pizza oven for at least 1 hour,
which varies depending on demand. At BMH, two of four of the staff interviewed said that the oven is never left on when not in use.
One staff member said that it is sometimes left on while not in use, and another said that the combination oven was left on for most of
the day. At RVC, three of four staff said that the oven is often left on when not in use, while one staff member disagreed. At BMH, no
staff members said that they used the ovens to keep food warm. At RVC, one staff member said that yes, the ovens were sometimes
used to keep food warm. However, again, the rest of the staff RVC staff interviewed disagreed with this point.
We recommend using convection ovens (or the convection setting of the combination ovens) more often and instead of the
combination ovens (set on the combination setting). As this would reduce the use of combination ovens, it would save energy and
26
water in the process (Campus ERC 2007). We recommend that the interior of the ovens be cleaned at least once a month and up to
once a day in order to reduce food debris that could contribute to the reduction of heat transfer (Food Service Warehouse 2012). We
also recommend loading the ovens to capacity, and even combining the various foods cooked into one oven, while maintaining a two-
inch clearance space. Turning off an oven for several hours can save energy, however is not beneficial if only turned off for a period
of less than an hour (Campus ERC 2007). We recommend that any new ovens purchased should have glass windows, which will help
to reduce the number of times the oven door is opened and will reduce the amount of potential heat loss. The period of time that ovens
are left on while not in use should be minimized.
4.1.8. Stoves
One staff member from BMH and one from RVC interviewed used the stoves. During staff interviews and observations, it was
noted that stoves are used mostly for vegetarian meals, sauces, and soups. The number of burners used ranged from one to three for
about 2 hours a day. The stoves did not seem to be left on for extra time than what was necessary for cooking. Food is not left to steam
after turning off the stove. For the most part, pot size is matched to the type or amount of food being prepared. It was not specified
whether the pot size always matches burner size. Pressure cookers are not used in either cafeteria. Some pots are warped in shape and
may not have full bottom-contact with the burners to achieve maximal heat transfer. When gas burners are set on high, the flames go
much higher than just the bottom of the pans or pots. The gas burners are checked periodically and the colour of the flames are
checked. The flames are mostly blue, and occasionally white or orange.
27

We recommend ensuring the flames are not yellow or uneven in colour, as this indicates an unsatisfactory temperature of the
flame. Burners should be cleaned regularly with a wire brush (Natural Resources Canada 2012). We recommend buying a pressure
cooker if the kitchen is not stocked with one already because pressure cookers use 50 to 75 percent less energy than standard pots
(Natural Resources Canada 2012). We recommend trying to reduce cooking times; for example, grain foods (i.e. rice, quinoa, wheat
berries, rye), lentils, and split peas, may be cooked for ¾ of the regular recommended cooking time. At ¾ of the cooking time, when
the burner is turned off, a lid should be placed on the pot so that the food can continue to cook under the existing heat pressure. It may
need to sit and steam slightly longer past the original recommended cooking time (Campus ERC 2007). We also recommend that
when gas elements are set on high, flame tips should just touch the bottom of pots or pans, rather than reaching higher than them. We
recommend that if new pans are being purchased that they are flat-bottomed, and that during cooking, the pot or pan size is matched to
the burner size for maximum heat transfer (Natural Resources Canada 2012).
4.1.9. Dishwasher
One staff member who works with the dishwasher in RVC, and one staff member from BMH were interviewed. At BMH, the
dishwasher was said to be usually full to capacity. At RVC, the dishwasher was believed to be around 90 percent full on when in
operation. The dishwashers at both cafeterias run for approximately 12 hours, making us aware that their maintenance and use should
be carefully watched in order to minimize energy losses. The dish-washing staff were not sure which settings the dishwashers were set
to, and were unaware of whether or not a water softener was installed. Dishes were found to be pre-rinsed before putting them in the
28

dishwasher. The wash tank of the dishwasher at BMH is set to a temperature of 180F - 190F, however the temperature of the hot water
heater at BMH was observed to be at 140F (65 C) and the shine wash was observed to be at 180F (82C). Staff at RVC were not sure
of the temperature settings. Staff at both BMH and RVC are not sure whether the dishwasher has a booster heater. The dishwasher is
cleaned twice every day at RVC; once after the lunch peak (from 11:00 a.m. to 2:00 p.m.) and once at the end of the night. The
dishwasher at BMH is cleaned once every day.
We recommend that the wash tank of the dishwasher be set at slightly lower temperature, around 160F, in order to conserve
heat (Campus ERC 2007). If the dishwasher has a "sanitizer" setting or booster heater, it is suggested that the temperature on the hot
water tank be reduced to about 120°F. This will significantly reduce water-heating costs (Campus ERC 2007). We recommend
avoiding pre-rinsing dishes before putting them in the dishwasher. Energy is saved if food is scraped off plates instead. Soaking is
generally recommended in cases of burnt or dried-on food. If dishes must be pre-rinsed, it is recommended to use cold water instead of
hot water (Campus ERC 2007). The RVC cleaning schedule fits the suggested frequency of cleaning. We recommend that BMH is
cleaned just as frequently to keep the appliance running more efficiently. We recommend only running the dishwasher at full capacity.
From our observations, we noted that rotating rack toasters were using excessive energy and we recommend they be replaced with
regular electric toasters, which consume less energy (Natural Resources Canada 2012). Furthermore, as a general rule, staff should
know to unplug any small appliances that are not in use.
29
We recommend that staff refer to Best Practice guides, or communicate more often with other staff in order to avoid
discrepancies and repetitions during food preparation activities. We also suggest putting up Best Practice guidelines and posters in the
cafeteria to help guide the staff during their food preparation activities.
4.2. Creating a Culture of Sustainability within MFDS
In addition to suggesting technical and behavioural recommendations to increase energy efficiency, we conducted research on
how to create culture or atmospheres promoting sustainability. This research will provide our client with the tools to create such an
atmosphere and would involve changing the interactions of the cafeteria staff and students.
In the past few years, McGill University has taken many steps towards developing a sustainable future (Vision 2020 McGill).
As a result of students and staff working together with a common vision in mind, McGill now has an Office of Sustainability, a
Sustainability Policy and a Sustainability Projects Fund (Vision 2020 McGill). The result of the collaboration between students and
staff members has created noticeable changes on campus (Vision 2020 McGill). To further such a collaborative and sustainable
community within the RVC and BMH cafeterias, community-based social-marketing techniques may be used.
Community-based social-marketing aims for behavioural change by direct communication and community level initiatives
(Kennedy 2010). Social marketing is the application of traditional marketing techniques to inform the public about issues, while
aiming for particular behavioural changes (Kennedy 2010). To promote a more sustainable future, it is critical to understand how to
encourage both individuals and organizations to adopt activities that promote sustainability. This type of marketing initiative
30
emphasizes direct personal contact among community members and the removal of barriers (Natural Resources Canada 2009). Once
the barriers are identified, marketers may then develop programs that address each of them (Natural Resources Canada 2009).
Consequently, individuals and organizations adopt more sustainable activities, creating more sustainable communities (Natural
Resources Canada 2009).
Based on community-based social-marketing and the expertise of Jonathan Glencross, co-founder of the McGill Food Systems
Project, we recommend designing training sessions for the MFDS staff in community engagement and energy efficient cooking
practices. We found that 85 percent of staff interviewed were interested in attending a training session about energy efficiency. We
have decided to focus on an example of staff training that could be used to evoke behavioural changes. The following will outline an
experimental model in the form of an energy reduction competition between staff-student teams at RVC and BMH.
Our goal through this competition is to build a culture of engagement between the staff and students and have everyone learn
about energy reduction strategies. To begin this process, ENVR 401 student researchers would identify staff interested in acting as
team leaders in the competition, and would identify students through the Rez-Life office that would collaborate with cafeteria staff to
act as co-leaders of the team. The role of the team leaders is threefold: to recruit other staff and students to be part of teams in each
cafeteria; to motivate the staff-student teams during the competition; and to provide feedback to the ENVR 401 team during the
competition.
31
Once the teams are formed, the ENVR 401 group would facilitate training sessions about energy efficiency and Best Practices
for the team leaders. The training would focus first on the greatest inefficiencies in the cafeterias, or the tasks that are most easily
modified. A specific methodology for evaluating behavioural change would be developed (using information from this report and
further input gathered from staff and students). We would also hope to work with the McGill Energy Project to effectively meter
electricity and gas consumption of appliances before, during and after the competition. To maximize accountability and continuity,
feedback to teams should be provided as often and in as much detail as possible during and after the competition. At the end of each
competition strategies that were successful and strategies that failed would be analysed by the participants.
For many of the suggested Best Practices to work, motivation coming from a level beyond the individual will also be
necessary, so that the staff feel that they are part of an important team that has an influence on the rest of the McGill community. We
therefore recommend integrating individual-level changes with a community initiative that promotes a culture of responsibility and
sustainability.
4.3. Technical Analysis & Recommendations
4.3.1. Assessing Energy Sources: Electricity, Natural Gas, & Steam
Both cafeterias rely on three types of energy sources: electricity, steam and natural gas. However, BMH is the only cafeteria
that relies on all three sources, while RVC relies only on electricity and gas (Appendix A: Figures 2, 3)
32

This section will first compare the energy consumption of electrical and gas appliances for each type of appliance. Secondly,
the rates for each energy source will show the costs of running different appliances on both sources. Lastly, the environmental impacts
of each source will be compared in terms of carbon dioxide (CO2) gases produced. These evaluations will allow us to identify the
energy source which best fits the appliance. It should be noted that most appliances, excluding fridges, freezers and warmers, on the
market are available as gas or electricity-run models.
4.3.2. Electricity & Natural Gas: Energy Efficiency
All of the different types of appliances were found to have higher energy consumption (to variable degrees) as gas-run models
compared to electricity-run models. Gas-run models tend to have higher idle energy consumption rates (Fisher 2002). However, in
terms of efficiency of basic energy transfer, natural gas is more efficient (CPS Energy 2012). This is because gas itself releases heat
quicker than electric heating elements, and there is also no energy loss during conversion and transmittance of the energy (CPS
Energy 2012). To view the differences between the natural gas and electricity consumption for running various appliances (Energy
Star 2012), see Appendix B: Table 5
4.3.3. Electricity & Natural Gas: Costs
It is important to compare the differences in prices of natural gas and electricity as this is a factor that will inevitably affect the
client’s decisions when choosing a new appliance. Even though a particular energy source is less efficient in regards to how much is
consumed by the appliance to perform the same task, the different operating costs can determine which one is more cost efficient.
33

McGill is charged a rate of 0.0295$/kWh for electricity (McGill Energy Project: MELS 2012) and a rate of approximately 10.0463
$/GJ for natural gas (GazMétro 2012). These rates and the projected annual energy consumption from Appendix: Table 5 were used to
estimate the annual cost. To view the differences between the costs of running appliances on natural gas and on electricity, see
Appendix B: Table 6.
4.3.4. Electricity & Natural Gas: Impacts
McGill’s electricity is provided by Hydro-Québec. Although considered a renewable resource, it still has impacts on the
environment. Hydroelectric reservoirs, many of which provide most of Quebec’s electricity, cause the decomposition of flooded
biomass, such as trees, resulting in ecosystem damage and increases in GHG emissions (Hydro-Québec 2012). Hydro-Québec releases
the equivalent of 2.04 g of CO2 for every GJ of energy consumed (McGill Energy Project: MELS 2012). McGill’s natural gas is
supplied by Gaz Métro, which receives its supply of gas from Alberta. The emissions related to the process of natural gas extraction
contribute to the formation of acid rain and ground level ozone, which is linked to many health issues (Environment Canada 2007).
Moreover, it is estimated that using a GJ of energy is equivalent to 49,864.34 g of CO2 emitted (McGill Energy Project: MELS 2012).
Though natural gas was said to be more efficient in terms of energy transfer, it is clear that for the specific case of Quebec, because
electricity comes from hydroelectric sources, electricity may be seen as the more sustainable choice for energy supply. See Appendix
B: Table 7 for the different projected CO2 emissions for appliances running on natural gas and electricity.
34

4.3.5. Electricity & Natural Gas: Results and Recommendations
We analyzed the energy consumption, costs, and environmental impacts of running appliances on natural gas versus electricity,
in order to be able to recommend the best-suited energy source for kitchen appliances.
Based on the environmental impacts and projected GHG emissions of natural gas, we recommend favouring appliances
running on electricity. Electricity production by Hydro- Québec has been deduced to have less negative impacts on the environment,
and considerably diminishes the emissions of greenhouse gases, compared to natural gas (Appendix B: Table 7). Furthermore, the
province of Quebec is fortunate to be provided electricity by Hydro-Québec, as it is the largest hydroelectric producer in the world
(Hydro-Québec 2010). This is the key reason why we encourage the use of electrical appliances. It also contributes to the greater goal
of protecting our natural resources and reducing our dependence on fossil fuels.
For all appliances, natural gas models consumed a higher amount of energy (kWh was used as a common unit for comparison)
than the equivalent electricity-run model (Appendix B: Table 5). Appliance groups ordered from highest to lowest energy
consumption differences between gas and electricity are: fryers, ovens, griddles, steamers, and steam kettles.
For all the appliances, the annual cost to run gas models was always higher than running electrical models (Appendix B: Table
6). As we realize that entirely converting the energy sources of the cafeterias to electricity is not feasible in the short-term, we suggest
that this become a long-term goal for the cafeterias. We also suggest that when the steam-run appliances are eventually replaced, that
electricity be considered as the energy source for the new appliances.
35

The following sections show some of the findings of our research.
4.3.5.1. Fryers
All fryers in both BMH and RVC are open deep-fat fryers and run on natural gas, though electrical models do exist on the
market. A gas fryer consumes an equivalence of 47,774.98 kWh (172 GJ) annually, compared to 18,189 kWh for an electrical fryer; a
29,586 kWh difference. It costs $1191.40 more annually to run a fryer off natural gas than electricity.
4.3.5.2. Griddles
It was found that all of the griddles in BMH and RVC run on natural gas, with the exception of one electrical griddle in BMH. A gas
griddle consumes an equivalence of 35,553.47 kWh (128 GJ) annually compared to 17,056 kWh for an electrical fryer; an 18,497
kWh difference. It costs $782.78 more annually to run a griddle natural gas than electricity.
4.3.5.3. Ovens
The majority of the ovens in both cafeterias were dependent on natural gas. A gas oven consumes an equivalence of 30,831.53 kWh
(111 GJ) annually compared to 12,193 kWh for an electrical fryer, an 18,639 kWh difference. It costs $755.45 more annually to run an
oven on natural gas than electricity.
36

4.3.5.4. Steam Kettles
All relevant steam kettles found in both cafeterias were dependent on natural gas. A gas steam kettle consumes an equivalence of
18,276.71 kWh (66 GJ) annually compared to 9,980 kWh for an electrical kettle; an 8,297 kWh difference. It costs $366.64 more
annually to run a steam kettle on natural gas than electricity.
4.3.5.5. Steamers
All steamers found in the two cafeterias were dependent on natural gas. A gas steamer consumes an equivalence of 24,720.77 kWh
(89 GJ) annually compared to 9,241 kWh consumed by an electrical steamer; a 15,480 kWh difference. It costs $366.64 more annually
to run a steamer on natural gas than electricity.
4.3.6. Steam-Run Appliances
Several appliances in BMH currently run on steam, and the hot water that is provided to the building also comes from the
steam lines. The demand for steam in the summer is much lower than during the school year, as the campus population is smaller and
the residence halls are mostly not in operation. This requires an output of only 8,000-15,000 lbs/hour. However, as the minimal
operating output of one large boiler is 20,000-23,000 lbs/hour, all the extra steam produced is emitted into the air and wasted. By
installing a smaller boiler, it is possible to tailor the amount of steam produced more closely to the actual demand, thus reducing
wasted energy (MEP: Powerhouse 2012). However, this new generator does not solve the problem of steam being inherently
inefficient.
37
The McGill powerhouse is one of the largest steam power plants in downtown Montreal and is located in the Ferrier building,
providing steam for many of the buildings in the downtown campus (MEP: Powerhouse 2012). BMH, in particular, relies on this
steam network for hot water and steam energy to run many of the kitchen appliances. Before entering the powerhouse, the water must
go through a purification process that includes water softening, gas removal, and sulfide treatments (MEP: Powerhouse 2012). This
process is inherently inefficient due to the fact that these resource intensive water purification steps, which would otherwise go toward
purifying drinking water, are used during the production of steam. Furthermore, much energy is lost as the three main boilers
(constructed in 1959, 1962 and 1969) and the tunnel network that transports the steam around campus, has an estimated leakage of 15-
20% of total steam supply (MEP: Powerhouse 2012).
Another feature of the unsustainability of steam production is its requirement of natural gas. Most of the consumption of
McGill’s natural gas goes to running the boilers in the steam powerhouse, with smaller amounts going to running gas appliances,
activities in laboratories, and heating for several campus buildings (MEP: Natural Gas 2012). Due to the massive amounts of inputs
necessary to create steam and the large amounts of wasted energy emitted in the form of steam or hot water through flaws in the
system or imprecise calculations of demand versus capacity. As a result of these findings, we believe that in order to contribute to
increasing energy efficiency, cafeterias should minimize their dependence on steam as an energy source. We recognize that this is a
difficult and complex task, especially as the steam network is already in place, and modifying it for another source of energy could
prove to be costly. In the long-term, however, replacement of the steam network at McGill will be necessary.
38
Steam-run technology, dating back to the Industrial revolution, is simply outdated and inefficient. Steam must be maintained at
very high temperatures, and many old steam pipes are poorly insulated, again, allowing for huge amounts of heat loss (UBC
Sustainability 2012). When these steam pipes occasionally break down, there is also no readily available hot water. This would cause
great problems in the BMH cafeteria, which serves hundreds of students.
Therefore, due to the evident inefficiency of steam-run technology, there will be no further analyses of steam-run appliances in
BMH.
4.3.7. Energy Input versus Frequency of Use Analysis
Figures and results of appliance Energy Input vs. Frequency of Use are shown in Appendix A: Figures 4, 5 and Appendix B:
Tables 1, 8, 9.
Energy- Star rated appliances were left out of this analysis as they already meet energy standards of the Government of Canada
(Natural Resources Canada 2011). Energy star rated models are government approved, and recognized as energy efficient appliances.
They are defined by meeting minimum CEE, as well as maximum IER (Natural Resources Canada 2011).
Steam-run appliances are also excluded from this analysis.4
All of the following recommendations were formulated using the collected specification data and behavioural data, while also
using figures of costs and savings of various appliances from Natural Resources Canada (Energy Star 2012). Natural Resources
4 see Section 4.3.6. for justification for the exclusion of steam
39

Canada makes assumptions of $9.02/GJ for natural gas and $0.12/kWh for electricity (Energy Star 2012). These figures were adjusted
to reflect, as closely as possible, those rates applied to McGill.
As McGill is under the D1 General Distribution Service in the Southern Zone (GazMétro 2009), figures of the Natural Gas
Supply Price ($3.48/GJ or 13.186¢/m3) and Compressor Fuel Price (0.462¢/m3) from December 1, 2012 were used to calculate
estimated natural gas prices per unit energy (GazMétro 2009). This calculation was done by adding these figures to GazMétro
transportation (6.927 ¢/m3), load-balancing (4.652 ¢/m3), distribution (11.924 ¢/m3), and inventory-related adjustment (0.915 ¢/m3)
prices (GazMétro 2009). The calculated natural gas rate was 38.066 ¢/m3 or $10.046/GJ.
The electricity rate paid by McGill to Hydro Quebec (as a large user) is 0.0295$/kWh. Calculations were made as follows:
Gas-run Appliances: Estimated Operating Cost x (($10.046/GJ) / ($9.02/GJ)) = Adjusted Estimated Operating Cost
Electricity-run Appliances: Estimated Operating Cost / (($0.12/kWh) / ($0.0295/kWh)) = Adjusted Estimated Operating Cost
Appliances not included in the appliance savings figures in include full ranges and steam kettles. Ranges vary widely in type, and
steam kettles are not presently made for Energy-Star standards. Alternate sources were used to make replacement cost-benefit
analyses.
Using the Priority Appliances tables (Appendix B: Tables 8, 9) and the Appliance Savings figures (Appendix B: Table 12), we
examined the High Energy Input and Very Often Used appliances to determine the costs and benefits of their replacement. Our
40

recommendations for replacements are based on the energy and cost benefits of installing Energy-Star rated appliances. The particular
factors that are examined are energy savings, cost savings, and costs of replacement.
4.3.7.1. BMH Appliance Analysis & Recommendations
Fy123 (Gas fryers) have the highest energy input, 58.57 kW, and are used sometimes (~15hrs/wk). Replacement with an Energy-Star
model is about $2,944, with annual cost savings of $535.69 and annual energy savings of 53 GJ/yr (14,722 kWh/yr).
Gd1 (Gas griddle) has an energy input of 43.34 kW and are used often (~25hrs/wk). Replacement with an Energy-Star model is about
$1,560, with annual cost savings of $158.15 and annual energy savings of 16 GJ/yr (4,444 kWh/yr).
R1 (Range with 1 griddle, 2 burners, and oven) has an energy input 45.1 kW of and is used rarely (2-3 hrs/wk). Energy-star data is not
available for ranges.
O6 (Gas combination oven) has an energy input of 33.68 kW and is used very often (>35hrs/wk). As combination ovens are excluded
from Energy-Star products, exact figures are not available (Energy Star 2011). However, figures for gas ovens will be used for
comparison. Replacement with an Energy-Star model is about $1,550, with annual cost savings of $324.09 and annual energy savings
of 32 GJ/yr (8,888 kWh/yr).
Gd2 (Electric flat griddle) has an energy input of 14.3 kW and is used very often (>35hrs/wk). Replacement with an Energy-Star
model is about $850, with annual cost savings of $80.88 and annual energy savings of 2,595 kWh/yr.
41
W1 (Electric warmer) has an energy input of 1.1 kW and is used very often (>35hrs/wk). Replacement with an Energy-Star model is
about $3,569, with annual cost savings of $261.32 and annual energy savings of 8,382 kWh/yr.
Appliances ordered from the greatest to lowest energy savings are Fy123, O6, W1, Gd1, Gd2. It is clear that the costs of
replacement may affect the follow through of these recommendations. Appliances ordered from greatest to lowest replacement cost
are W1, Fy123, Gd1, O6, Gd2. For BMH, we recommend prioritizing according to energy savings and frequency of use. We
recommend, in order of priority, the replacements of O6, W1, Fy123, Gd2, and Gd1. Recommendations for R1 will be continued in
Section 4.3.8. (rarely-used appliances).
4.3.7.2. RVC Appliance Analysis & Recommendations
R1 (Gas range with 4 burners) has an energy input of 49.78 kW, and is used sometimes (10-15hrs/wk). As ranges are excluded from
Energy-Star standards, exact figures are not available (Energy Star 2011).
SK1 (Gas steam kettle) has an energy input of 49.78 kW, and is used often (20-25hrs/wk). Energy-star data is not available for steam
kettles.
Gd1 (Gas griddle) has an energy input of 43.34 kW, and is used very often (>35 hrs/wk). Replacement with an Energy-Star model is
about $1,560, with annual cost savings of $158.15 and annual energy savings of 16 GJ/yr (4,444 kWh/yr).
SK2 (Gas steam kettle) has an energy input of 49.78 kW, and is used sometimes (~10 hrs/wk). Energy-star data is not available for
steam kettles.
42

S1 (Gas steamer) has an energy input of 36.61 kW, and is used very often (>35 hrs/wk). Replacement with an Energy-Star model is
about $7,256, with annual cost savings of $209.58 and annual energy savings of 50 GJ/yr (13,889 kWh/yr).
O3 (Gas combination oven) has an energy input of 33.68 kW and is used very often (~45hrs/wk). As combination ovens are excluded
from Energy-Star products, exact figures are not available (Energy Star 2011). However, figures for gas ovens will be used for
comparison. Replacement with an Energy-Star model is about $1,550, with annual cost savings of $324.09 and annual energy savings
of 32 GJ/yr (8,888 kWh/yr).
G1 (Gas grill) has an energy input of 26.35 kW and is used very often (>35hrs/wk). Replacement with an Energy-Star model is about
$1,560, with annual cost savings of $158.15 and annual energy savings of 16 GJ/yr (4,444 kWh/yr).
W2 (Electric warmer) has an energy input of 2.8kW and is used very often (>35hrs/wk). Replacement with an Energy-Star model is
about $3,569, with annual cost savings of $261.32 and annual energy savings of 8,382 kWh/yr.
W1 (Electric warmer) has an energy input of 1.1kW and is used very often (>35hrs/wk). Replacement with an Energy-Star model is
about $3,569, with annual cost savings of $261.32 and annual energy savings of 8,382 kWh/yr.
Appliances ordered from the greatest to lowest energy savings are S1, W2/W1, O3, G1/Gd1. It is clear that the costs of
replacement may affect the follow through of these recommendations. Appliances ordered from greatest to lowest replacement cost
are S1, W2/W1, Gd1/G1, O3. For BMH, we recommend prioritizing according to energy savings and frequency of use. We
recommend, in order of priority, the replacements of S1, W2/W1, O3, G1/Gd1. Though data is not available for SK1 and SK2, as they
43
require high energy inputs and are used often and sometimes (respectively), modified behavioural changes should be made to increase
use efficiency (see Section 4.1.4.). Furthermore, modification changes such as adding lids which can reduce simmer energy use by
60% (Fisher 2002).
As figures for R1 are not available, we alternatively recommend modified behavioural changes to increase use efficiency (see Section
4.1.8.).
4.3.8. Rarely-Used Appliances
Rarely-used appliances are examined individually. As they are used so infrequently, it is important to assess their necessity in
the cafeterias. Energy savings can be made if operations carried out on these appliances can be done using other already available
appliances in the cafeterias.
Rarely-used appliances in BMH include: R1, O4, O5.
R1 is both a rarely-used appliance, and has a high energy input. It has a griddle, two burners, and an oven. BMH is already
equipped with a functioning griddle, which is used significantly more often than the small surface area provided by the R1 griddle.
Furthermore, the R1 oven is rarely-used as there are many other available ovens, including both convection and combination ovens in
BMH, which many staff members have made reference to during interviews. Though the burners have been found to be rarely-used as
well, it is possible that their functions are specific to cooking particular foods, for example, oatmeal. While we suggest the removal of
44

R1 due to its high energy input and low frequency of use, we recognize the role of a burner. Further assessment by the client is
necessary to make conclusive judgments.
O4 and O5 are currently part of a range, which includes Gd1.The removal of O4 and O5 would thus require the removal of
Gd1 one as well. Because R1 was recommend for removal, this leaves Gd1 as the only griddle in the basement kitchen of BMH. What
we recommend is the installation of an Energy-Star rated griddle in place of the current range which includes O4, O5, and Gd1. This
would be beneficial because the functions of O4 and O5 may be replaced by other existing ovens, such as the combination oven, O6.
Rarely-used appliances in RVC included: Fy3, O5, O6, O7.
Fy3 is one of 3 fryers in RVC, and is used the least. It is recommended that it be removed, and that its functions be replaced by
the existing fryers, Fy1 and Fy2. With management of cooking times and estimations of food loads for a particular period of the day,
Fy1 and Fy2 may be used efficiently and successfully, while replacing what was previously the rare use of Fy3.
O5 and O6 are also part of a range which includes Gd1. Because Gd1 is used frequently and has been installed recently (during
the renovations of RVC), we recognize that the removal of O5 and O6 would be unreasoned. We therefore strongly urge that the use
of these ovens is regulated and that Best Practices are followed closely (Appendix B: Table 4).
O7 is a salamander, which is primarily used for browning large dishes. It would be beneficial to remove it and use existing
ovens to perform this function instead. Moreover, the browning of dishes contributes primarily to the visual appeal of food, and not
necessarily an improvement in its taste.
45

After considering existing appliances in the cafeterias - ones that may replace some of the functions of these rarely-used
appliances - we gather that they may be removed without much impact on overall food preparation.
4.3.9. Fridges and Freezers
Our recommendations for fridges and freezers are not based on energy consumption rates, but on observations only. Estimates
of energy consumption of these appliances depend on how often their compressors operate. The role of a compressor is to maintain a
constant temperature in the fridge or freezer. As compressor operation is highly variable, depending on how often and for how long
the fridge or freezer is opened, only rudimentary estimates can be made. Furthermore, as fridges contribute to only about 6% of
electricity consumption in a kitchen (Energy Star 2009), mass replacements of non-Energy-Star fridges may not improve energy
efficiency significantly in comparison to other options for appliance replacements presented in this report.
We do suggest, however, that particular modifications to the walk-in fridges and freezers be made. It is beneficial to add strip
curtains to the walk-ins, as they can save about $784.59/yr of operational costs (based on McGill’s rate of $0.0295/kWh) (Energy Star
2009). It is also noted that WF2, WF3, WFr2, and WF4 in BMH have not been updated in over 30 years.
5. Conclusion
5.1. Key Findings
46

Two key aspects determining energy consumption were addressed: the required energy input of the appliances, and the
frequency and manners of staff use of the appliances. The technical approach investigated the operations of the appliances, their
efficiency, and options for alternate, more energy efficient appliances. The behavioural approach conducted observations and
interviews to assess staff practices of the use of appliances and the preparation of food. Extensive research conducted allowed us to
provide costs and benefits of installing energy-efficient alternatives, as well as suggest alternative staff practices.
The most significant finding was the need to develop an culture of sustainability, encompassing education, participation, and
energy efficiency through staff team support. Although the most of the student staff undergo the same turn-over rate as do the students
using the cafeterias every 3 to 4 years, the permanent staff play a key role in maintaining the techniques and practices used in the
cafeterias. Interviews with these employees provided insight on energy efficient practices could be incorporated into the cafeteria
operations. In working with staff and including them in research and the decision-making process, a greater sense of participation and
transparency was felt. It was found that employees were open to having training sessions on how to operate in more energy efficient
manners. This is a promising finding, as it may instigate a community of acceptance for the implementation of Best Practices, and
potentially even a development in sustainable norms and values followed in the cafeterias.
The technical approach assessed the sustainability of energy sources including natural gas, electricity, and steam. Using this
data and appliance specification data, priority lists of suggested appliance replacements were made. Our key findings were the need to
switch from reliance on steam to reliance on gas and electricity. Furthermore, where the options are feasible, we see it fit to invest in
electricity-run models, rather than natural gas-run models of appliances. We found that most appliances which needed high energy
47
inputs and were very frequently used were not Energy Star rated models, and that many were very outdated models. Our prioritized
recommendations for replacements may be found in Appendix B: Tables 8, 9.
5.2. Limitations
During the first month of our project, we met with various stakeholders working on the sustainability movement on campus, in
order to design the scope and feasibility of our project. This included addressing which aspects of the life-cycle of energy we should
focus on. We first met with our client, Chef deVolpi, and stakeholder David Balcombe (see Appendix B: Table 10). After dealing with
many projects that focus on food systems (which are continually being assessed by McGill Food Systems Project and McGill’s Office
of Sustainability), the clients preferred to focus on the aspect of energy use within the constraints of the cafeteria setting. This was
further emphasized in our meetings with Maria Mazzotta and Elana Evans (see Appendix B: Table 10). Subsequently, it was decided
that addressing the full life-cycle analysis of the food served in the cafeterias was not feasible due to the time constraints of the
project. Instead, the focus was decided to be on aspects of energy use in the cafeterias which could be reduced with technical and
behavioural modifications.
After meeting with stakeholders Jerome Conraud (Energy and Utilities Management team), and Marc-Etienne Brunet (see
Appendix B: Table 10), it was determined that an extensive energy audit of all appliances would not possible. Professional firms may
have advantages in completing comprehensive energy efficiency assessments or audits, within shorter time periods. As students who
are not trained as professionals in the field, we carry only fundamental knowledge in the execution and format of formal energy
48
assessments and audits. Furthermore, energy efficiency assessments often require metering instruments (for example, temporary
energy meters on appliances) in order to measure energy consumption. These apparatuses are quite costly (Powershift 2012). As this
project is not supported financially, purchases of such equipment were not possible. This led us to our decision to approach this
project using a user-interface perspective. Jerome Conraud also informed us of McGill Residences Facilities and Buildings
Operations’ plan to complete a full energy audit of McGill cafeterias within the next two years.
Our group had discussed including the water usage in the cafeterias as part of our scope, and this was brought up with Jerome
Conraud as well. He informed us that there are no water meters used within McGill, and that access to billing data is very difficult to
obtain. Additionally, our client wanted us to focus on energy consumption over water usage.
One of the main criticisms of our project was that energy consumption in the cafeterias is highly dependent upon the menu. We
understand that due to differences in the weekly menus, there will be differences in the amount of energy used per day in order to
prepare dishes. However, due to time constraints and lack of influence over food purhasing, we did not investigate this aspect of
energy efficiency.
Our team also met with David Gray-Donald (see Appendix B: Table 10) to determine whether an analysis of the food waste
produced by the cafeterias would be feasible. We were informed that Big Hannah, the industrial composter on campus, is already
running at full capacity, and the only way that composting capacity could increase was if macerators were successfully installed in the
cafeterias. He further informed us that this had already been attempted last year, but that the macerators did not end up being suitable.
We therefore concluded that it was not practical to include food waste in our scope.
49

The technical analysis relied on energy data for old appliances, which was in some cases not available. These appliances are
expected to have labels that state various energy figures. However, some of these labels are physically inaccessible, missing or
illegible. There is no equipment list available for either cafeteria, which hindered our ability to verify all existing appliances. We
compiled a list of all the relevant appliances in the cafeterias, concentrating on appliances that we chose according to energy
consumption. This appliance list was a useful asset to us, particularly for the technical analysis, and may be found in Appendix B:
Tables 2 and 3.
Another limitation was the inability to use energy bills for electricity and gas as a measurement of energy usage. Electricity
bills for McGill are based on the energy usage of entire buildings, and are not broken down by areas within the buildings.
Furthermore, gas bills are not available for public viewing (Conraud Sept. 27th, 2012). Thus, we were unable to use billing as an
analytical tool in our procedure.
A large component of our behavioural analysis relied on interviews with the cafeteria staff. We interviewed 13 staff in total
from both of the cafeterias. Without a full census of all staff, it was difficult to make definite conclusions of each staff member’s use
of appliances. Staff observation, completed several times by each member of the project group in both cafeterias, supplemented the
interviews as a method of estimating the frequency of use of the appliances.
5.3. Future Studies & Research
50
There is constantly room for improvement, especially for projects focusing on sustainability. In determining the scope of our
project, we realized early on that there were many aspects of energy efficiency within MFDS, which we were not able to assess. It is
therefore important to look at potential projects that may be conducted in order to address other energy efficiency and sustainability
matters.
Jerome Conraud is already working on an energy audit to be completed by an external agency, in addition to implementing
meters for both energy and water consumption at McGill. For the future it is important to be able to monitor energy use within an the
institutional setting. The maps of the cafeterias and the appliance lists (see Appendix B: Table 2, 3) may be helpful in the
implementation of meters. Furthermore, these documents may be accessible to students interested in doing applied student research
through the McGill Energy Project.
Future ENVR 401 projects, or even prospective internship positions with MFDS or SPF projects, can look at the life-cycle of
food within the cafeterias. In the past, MFDS has worked with ENVR 401 groups to look at sustainable seafood options and sourcing
options for poultry and tomatoes in Quebec. However, addressing all of the food served has not been carried out yet. MFDS has also
collaborated with students in research groups through the Office of Sustainability, resulting in significant developments in
sustainability like the creation of the McGill Food Systems Project.
Food waste and composting at McGill cafeterias is also a potential undertaking. As previously discussed, the compost
facilities are already filled to capacity from pre-consumer food waste alone, leaving no room for post-consumer food waste. Once
proper macerators are installed, post-consumer food waste may also be added to the composting process. An exciting feature of food
51

waste and composting initiatives is that there are many ways to get involved. According to our client, informative eco-stations are to
be installed. In these stations, students, staff, faculty, and admin can learn about and take part in composting. Furthermore, these
stations will always be in constant need of enhancement and personalizing. Other project ideas include competitions between campus
cafeterias to determine which cafeteria produces the least amount of waste (see Section 4.2: Creating a Culture of Sustainability within
MFDS).
Continuing to build a connection between staff, supervisors, and students, is important when working towards a culture of
sustainability at McGill. Community-building initiatives of this kind are in constant progress. The results of this report will add to the
knowledge base of Best Practices and energy efficiency at McGill University. We hope it contributes to the greater awareness of
sustainability in McGill dining facilities and that it provides a platform from which future projects on different aspects of energy
efficiency can be conducted.
5.3. Final Statements
In light of expectations for improvements in overall sustainable management, we have conducted this project with the hopes
that our technical and behavioural recommendations will properly address the matter of energy efficiency in the BMH and RVC
cafeterias.
52

We believe that in following through with many of these recommendations, the prospective cost savings and premiums will
allow MFDS to purchase even more local and sustainable foods. Most importantly, in the way that both approaches in the
methodology were necessary for a comprehensive study, it is important to continue to take on the same holistic approach while taking
into consideration the social and economic aspects of sustainability. We hope this report adds to the knowledge base of Best Practices
and energy efficiency at McGill University. We hope it contributes to the greater awareness of sustainability in McGill dining
facilities and that it provides a platform from which future projects on different aspects energy efficiency can be conducted.
We would like to thank our client, Executive Chef Oliver deVolpi, for providing us with the means to carry out this project
6. Works Cited
Bergstrom, John C., and Alan Randall. Resource Economics. Northhampton, MA: Edward Elgar Publishing Inc. , 2010.
“Cafeteria/Dining Best Practices.” Campus ERC. Last modified 2007. http://campuserc.org.
“Commercial Kitchens: Best Practices for Going Green.” Food Service Warehouse. Accessed December 1, 2012. http://www.foodservicewarehouse.com.
53

Community-Based Social Marketing; New Society Publishers: Gabriola Island, BC, USA.
Conrad, K. "Green-Thinking Companies Upgrade Their Kitchens: Long Neglected Part of Corporate Campus Gets Energy-Efficient." McClatchy - Tribune Business News (2007).
Conraud, J. (McGill Office of Sustainability) Meeting with office of sustainability stakeholders, Office of Sustainability. September 27, 2012.
“Cooking Under Pressure” Association for the education of young children. Accessed November 12, 2012. http://www.aeyc-sea.org/CCFP%20Forms/Cooking%20Under%20Pressure.pdf.
deVolpi, O. (Executive Chef of MFDS) Meeting with 401 Project stakeholders, McLennan Library. September 11, 2012.
Elbaum, Meredith. "A Not So Common College Commons: Sustainable Dining at Bates College " Journal of Green Building 5, no. 2 (2010): 16-26.
Energy Star. “Commercial Ovens: Energy Star.” Energy Star. 2012. http://www.energystar.gov/index.cfm?fuseaction=find_a_product.showProductGroup&pgw_code=COO.
Energy Star. “Energy Star Guide for Commercial Kitchens.” Natural Resources Canada’s Office of Energy Efficiency. 2012. Accessed November 26, 2012. http://publications.gc.ca/collections/collection_2012/rncan-nrcan/M144-240-2012-eng.pdf.
Energy Star. “Energy Star Guide For Restaurants: Putting Energy Into Profit.” Energy Star. 2009. Accessed December 2, 2012. http://www.energystar.gov/ia/partners/publications/pubdocs/restaurant%20guide%20508%20-%20Dec%202009.pdf?ce7b-91bf
Energy Star. “Energy Star Program Requirements for Commercial Ovens.” Natural Resources Canada. 2011. Accessed November 27, 2012. http://oee.nrcan.gc.ca/sites/oee.nrcan.gc.ca/files/pdf/residential/business/manufacturers/specifications/pdf/Comm-Oven-spec-V-1-1-eng.pdf.
Energy Star. “Energy Star Qualifying Criteria for Commercial Ovens.” Natural Resources Canada. 2011. Accessed November 27, 2012. http://oee.nrcan.gc.ca/equipment/manufacturers/specifications/17076.
Environment Canada, "Benefits and Costs of the Regulatory Framework for Air Emissions," last modified 2007, http://www.ec.gc.ca/default.asp?lang=En&xml=C33CCDD9-3186-4A43-875A-A1D88135164F.
Fisher, Don. 2002. Commercial Cooking Appliance Technology Assessment. Food Service Technology Center Report, Section 9, (accessed November 2012). http://www.fishnick.com/equipment/techassessment/9_kettles.pdf.
54
GazMétro,"Bill Components:Rate-D1,Hydro-Québec last modified 2012, http://www.gazmetro.com/data/media/affaires_d3_janv2012_ang.pdf?culture=en-ca.
Gaz Métro. “Examples of Calculations.” Gaz Métro. 2012. Accessed December 2, 2012. http://www.gazmetro.com/clients-affaires/facturation/tarifs.aspx?contentid=2878&culture=en-ca.
Gaz Métro. “Distribution Rate.” Gaz Métro. 2009. Accessed December 2, 2012. http://www.gazmetro.com/clients-affaires/facturation/tarifs-distribution.aspx?culture=en-ca.
Gray Donald, David. (Sustainability Coordinator) Meeting about Composting Opportunities. MSE Building, Downtown. September 25, 2012.
Gromicko, Nick and Rob London. “Deep Fryer Inspection” International Association of Certified Home Inspectors. Last modified 2012. http://www.nachi.org/deep-fryer-inspection.htm.
Hydro-Québec, "ANNUAL REPORT 2010,"2010, http://www.hydroquebec.com/publications/en/annual_report/pdf/rapport-annuel-2010.pdf.
Hydro-Québec,"Greeenhouse Gas Emission and Hydroelectric Reservoirs,"last modified 2012, http://www.hydroquebec.com/sustainable-development/documentation/ges.html.
Indian Bureau of Energy Efficiency. "Energy Management and Audit." In The National, edited by Ministry of Power, 57-81. New Delhi, India 2010.
Kennedy, A. 2010. Using Community-Based Social Marketing Techniques to Enhance Environmental Regulation. Sustainability, 2(4), 1138-1160.
McGill University. "Energy Management Plan, 2010-2015." edited by Building and Property Committee of the Board of Governors. Montreal: McGill University 2010.
McGill University. "Sustainability: Vision 2020." http://www.mcgill.ca/sustainability/vision2020McKenzie-Mohr D., Smith, W. 1999. Fostering Sustainable Behavior: An Introduction to
MEP: McGill Energy Project. "Energy Infrastructure: Natural Gas ". Montreal McGill University 2012.
MEP: McGill Energy Project. "Natural gas". Montreal McGill University 2012.
MEP: McGill Energy Project. 2012. "Mcgill's Energy in Relation to the Ministry of Education, Leisure and Sports (Mels) Grant." Montreal McGill University.
55

MEP: McGill Energy Project. "Mcgill Energy Bill: Hydro ". 2012. Montreal McGill University.
MEP: McGill Energy Project. "Powerplant ". Montreal McGill University 2012.
(MFDS) McGill Food and Dining Services. “About Us.” McGill University. 2012. http://www.mcgill.ca/foodservices/about.
Navigant Consulting. "Energy Savings Potential and Rd&D Opportunities for Commercial Building Appliances." Washington DC: U.S. Department of Energy: Energy Efficiency and Renewable Energy Building Technologies Program 2009.
.Natural Resources Canada. 2009. "An Overview of Community-Based Social Marketing" http://oee.nrcan.gc.ca/communities-government/transportation/municipal-communities/7867.
Natural Resources Canada. "Major Appliance Requirements: Energy Star Appliances " Natural Resources Canada. 2011. http://oee.nrcan.gc.ca/equipment/manufacturers/12433.
Natural Resources Canada. 2012. Government of Canada: Natural Resources. http://oee.nrcan.gc.ca/home.
Radovic. “Efficency of Energy Conversion.” Accessed November 29, 2012. http://www.ems.psu.edu/~radovic/Chapter4.pdf.
“Restaurant Tips.” Natural Resources Canada. Last modified January 19, 2012. http://oee.nrcan.gc.ca/publications/commercial/4540.
Rhodes, Laura, and Mathieu Laperle. "An Appetite for Sustainability: Strategic Plan 2010-2013." edited by Food and Dining Services. Montreal McGill University 2011.
Roth, Kurt W., Detlef Westphalen, John Dieckmann, Sephir D. Hamilton, and William Goetzler. "Energy Consumption Characteristics of Commerical Building Hvac Systems." In Building Technologies Program, edited by James Brodrick. Cambridge, MA, 2002.
Technology, Summit. "Powersight: Meters for Power, Quality, Energy and Data Logging " last edited 2012. www.powersight.com.
“The Big Thaw: Safe Defrosting Methods for Consumers.” Food Safety and Inspection Service. United States Department of Agriculture. Last modified 2010. http://www.fsis.usda.gov/factsheets/Big_Thaw/index.asp.
UBC Sustainability. “Getting Into How Water.” The University of British Columbia. 2012. Accesed November 28, 2012. http://www.sustain.ubc.ca/campus-sustainability/getting-hot-water.
56

7. Works Consulted
Ahuja, A. (1997). Energy Audits--an integrated approach Consulting - Specifying Engineer 21(3), 52-56.
Brown, Z. B., & Cole, R. J. (2008). Engaging Occupants in Green Building Performance: Addressing the Knowledge Gap. Paper presented at the
ACEEE Summer Study on Energy Efficiency in Buildings. Washington DC.
Conrad, K. (2007). Green-thinking companies upgrade their kitchens: long neglected part of corporate campus gets energy-efficient.
McClatchy - Tribune Business News.
57

Deru, M., Langer, R., Zhivov, A., Liesen, R., Herron, D., & Smith, V. (2012). Extremely Low Energy Design for Army Buildings: Dining
Facility. ASHRAE Transactions, 118(1), 790-815.
Ehrherdt-Martinez, K., Laitner, J. A., & Keating, K. M. (2009). Pursuing Energy Efficient Behavior in a Regulatory Environment:
Motivating Policymakers, Program Administrators, and Program Implementers. CIEE Behavior and Energy Program Berkeley,
California. California Institute for Energy and Environment.
Energy Lens. (2012). How to Use Energy Profiles to Find Energy Waste. http://www.energylens.com/articles/identify-energy-waste.
Gellerd, H., Phillip, H., Arthur, H. R., Satoshi, T., & Fridtjof, U. (2006). Policies for Increasing energy efficiency: thirty years experience in
OECD countries. Energy Policy 34, 556-573.
Go'Energi. (2011). Commercial Kitchen Guidelines: For all staff responsible for energy efficient design, purchasing and working practices in
commercial kitchens. The Danish Energy Saving Trust.
Goetzler, W. J., McDonald, C., & Venkat, G. (2008). Energy Efficiency Portfolio of the Future. Paper presented at the ACEEE Summer Study
on Energy Efficiency in Buildings. Washington, D.C.
Kannan, R., & Boie, W. (2003). Energy Management Practices on SME --case study of a bakery in Germany. Energy Conversion and
Management.
Laitner, J. A., Ehrherdt-Martinez, K., & McKinney, V. (2009). Examining the scale of the Behaviour Energy Efficiency Continuum. ECEEE
2009 Summer Study: Reducing Energy Demand Sustainably.
Lawrence Berkeley National Laboratory (2001). Steam Systems in Industry: Energy Use and Energy Efficiency Improvement Potentials.
Retrieved from http://www.osti.gov/energycitations/servlets/purl/789187-uTGqsP/native/789187.pdf
58

Lockton, D., Cain, R., Harrison, D., Guidicel, S., Nicholson, L., & Jennings, P. (2001). Behaviour Change at Work: empowering energy
efficiency in the workplace through user-centered design Paper presented at the Behaviour, Energy and Climate Change Conference.
Lutzenhiser, L. (1993). Social and Behavioral Aspects of Energy. Use Annual Review of Energy and the Environment 18, 247-289.
Masoso, O. T., & Grobler, L. T. (2010). The Dark Side of Occupants: behaviour on building energy use. Energy and Buildings, 42(2), 173-
177.
National Action Plan for Energy Efficiency (2008). Understanding Cost-Effectiveness of Energy Efficiency Programs: Best Practices,
Technical Methods, and Emerging Issues for PolicyMakers. Energy and Environmental Economics, Inc. and Regulatory Assistance
Project. Retrieved from www.epa.gov/eeactionplan.
Newborough, M., & Probert, S. D. (1988). Evolution of Energy-Efficient Food-Preparation Facilities.
Navigant Consulting. (2009). Energy Savings Potential and R&D Opportunities for Commercial Refrigeration. Washington DC.
Ogendengbe, E. O. B., Kingsley, E., Eteure, R. U., & Rosen, M. A. Feasibility Study of Cafeteria Energy Demand with Integration of a
Downdraft Bio-Digester System. 48th AIAA/ASME/SAE/ASEE Joint Propulsion Conference & Exhibit 10th Annual International Energy
Conversion Engineering Conference: Energhx Research Group: University of Lagos, University of Ontario Institute of Technology.
RISE: Rewarding Internships for Sustainable Employment. (2010). Energy, Water & Waste Audit: A Sustainability Assessment of Keone'ula
Elementary School in Ewa Beach, Oahu, Hawaii. . Oahu, Hawaii. University of Hawaii Retrieved from
http://sustainable.hawaii.edu/Reports/Sustainability%20Audit%20of%20DOE%20K-6%20School.pdf.
59

Romm, J. J. (1995). Worker productivity rises with energy efficiency. Strategic Planning for Energy and the Environment 71-78.
Sitarz, D. (2008). Adapted from: Greening your business: the Hands-on Guide to Creating a Successful and Sustainable Business: US First.
Retrieved from http://www3.usfirst.org/uploadedFiles/Robotics_Programs/Mentors_and_Coaches/Assets/Green_Team_Manual.pdf.
Thurmann, A., & Younger, W. J. (2008). The Handbook of Energy Audits Retrieved from: http://books.google.ca/books?
hl=en&lr=&id=d3LNprzA7DMC&oi=fnd&pg=PR7&dq=energy+audit+restaurants&ots=Xa9x5
LERB&sig=Um3gHMJYjH9Cg0qOfqYfn6IAzuk#v=onepage&q=energy%20audit%20restaurants&f=false
Young, D. (2008). When do energy-efficient appliances generate energy savings? Some evidence from Canada. Energy Policy 36(1), 34-46.
8. Appendices
Appendix A: Graphs
Figure 1: Energy Conservation at McGill and corresponding costs and investments from 2002-2009 (McGill 2010).
Figure 2: Pie-Chart: distribution of energy input by source: RVC
Figure 3: Graph of energy input vs. frequency of use: BMH
Figure 4: Pie Chart: distribution of energy input by source: BMH
Figure 5: Graph of energy input vs. frequency of use: RVC
60

Appendix B: Tables
Table 1: Frequency of use: BMH and RVC
Table 2: Appliance list with specifications: RVC
Table 3: Appliance list with specifications: BMH
Table 4: Best practices
Table 5: Appliance energy consumption: Natural Gas vs. Electricity
Table 6: Cost ($) of running appliances: Natural Gas vs. Electricity
Table 7: Carbon Dioxide emissions: Natural Gas vs. Electricity
Table 8: Prioritized list of replacements: BMH
Table 9: Prioritized list of replacements: RVC
Table 10: List of stakeholders
Table 11: Annual energy savings calculations
Table 12: Appliance Savings Figures (Energy Star 2012)
Appendix C: Maps
Figure 1: Map of RVC
Figure 2: Map of BMH: Basement kitchen
Figure 3: Map of BMH: Main Cafeteria & kitchen
61

Appendix D: Other Documentation
Figure 1: Interview Form for MFDS Staff
Figure 2: Ethics Approval
Figure 3: Gantt Chart
8.1. Appendix A: Graphs
62

Figure 1: Energy Conservation at McGill and corresponding costs and investments from 2002-2009 (McGill 2010).
63

Figure 2: Pie-Chart: distribution of energy input by source: RVC
64
Figure 3: Pie Chart: distribution of energy input by source: BMH
65

Figure 4: BMH Appliances - Energy Input vs. Frequency of Use
66

Figure 5: RVC Appliances - Energy Input vs. Frequency of use
67

8.2. Appendix B: Tables
Table 1: Frequency of Use: BMH and RVC
Cafeteria High Energy Input (>40kW)
Used Very Often (>35hrs / wk)
Used Rarely (<5hrs / wk)
BMH Fy123 O6 R1
BMH Gd1 Gd2 O4
BMH R1 W1 O5
RVC R1 S1 Fy3
RVC SK1 O3 O5
RVC Gd1 G1 O6
RVC SK2 W2 O7
RVC W1
68

Table 2: Appliance list: RVC (blue-highlighted appliances are Energy-Star rated)
LabelDoor type (fridges only)
Avg. Unit Energy Consump-tion (kWh/yr )
Kitchen Appliance Energy Type
Location Description Manufacturer Model # Voltage Watts (F.L.)
Amps HP HZTempera-ture held at:
High Pressure
Low Pressure
Pressure (steamers only)
Frequency of Use / week
F1 solid 1 2300 RVC Fridge Electric Hallway NorLake WR722SSS 115 1230.5 10.7 60 270 PSI 80 PSI
F2sliding glass
RVC Fridge (desserts) Electric
Choquette CKS/pelfield enodis F15PC48D 120 1920 16 60 500 PSI 250 PSI
F32 door solid 4300
RVCFridge Electric
floor level fridge, middle serving front area
Silver King Refrigerator SKPZ60 115 747.5 6.5 60 400 PSI 140 PSI
F4sliding glass RVC Fridge
(squash) Electricfront area, middle Arctica
H3P 38 RO 00 L3 CC 115 241.5 2.1 250 PSi 150 PSI
F5 solid 2300RVC
Fridge Electric Hallway
NorLake/Choquette CKS WR331SSS/0 115 1092.5 9.5 435 PSI 435 PSI 174 PSI
F6sliding glass
RVC 2X Fridge (sandwiches) Electric
student area, sandwich station
Canadian display systems: Toronto 60
F71 door solid 2300 RVC Fridge Electric
Back kitchen area, back wall Habco SE28SX 115 609.5 5.3 60 375 PSIG 140 PSIG
F82 door glass
RVCFridge Electric
Back kitchen area, back wall
True Manufacturing Co. GDM-49 115 1035 9 0.5 60 312 PSIG 140 PSIG
F92 door glass
RVC Fridge (2 doors) Electric
Back kitchen area
True Manufacturing Co. T-49G 115 1046.5 9.1 0.5 60
F101 door solid 2300 RVC Fridge Electric
Back kitchen area Habco SF28SX 115 1150 10 60 360 PSIG 220 PSIG
F112 (1/2) doors solid 2300
RVCFridge Electric Front area, side
True Manufacturing Co. T-23-2 115 874 7.6 0.33 60 7C
F122 door solid 4300 RVC Fridge
drawer Electric Front area Silver King SKR27D 115 256.45 2.23 60 214 PSIG 140 PSIG
F131 door glass RVC DRINK
fridge Electric serving areaTRUE refrigerators GDM-26 115 828 7.2 1 / 3 60
F142 door glass
RVC
milk/yogurt/sandwiches 2 door transparent fridge Electric serving area
TURBO AIR refrigerator manufacturer TGM-48R 115 1253.5 10.9 60 312 140
F15
no door (open airflow)
RVC
open(no door) fridge (pop drinks and assorted) Electric serving area
TRUE refrigerators TAC-48GS 208/230
2496-2760 12 1 60
F16no door (open)
RVCOpen,small sushi fridge Electric serving area
True refrigerators TAC-14GS 115 1598.5 13.9 1 / 2 60 312 140
C1 RVC Salad bar Electric serving area Ranco
F17
curved, sliding glass (x2)
RVC
Display fridge for sandwiches (x2) Electric serving area
Canadian display systems inc. CTR2638 115 1035 9 60 3
F18sliding glass
RVCCake display fridge Electric serving area DELFIELD
F19 RVC Fridge Electric sandwich areaSilver King Refrigerator SKR60 115 60
O1 RVC Oven (3 door oven) Electric front area, side Doyon PIZ3 120/208
KW: 8.2 24 60 427 F
Sometimes (10hrs)
O2RVC
Oven, 2-piece convection Gas
Back kitchen area BLODGETT
Sometimes (15hrs)
69
O3
RVC
2-set Oven (combi) Gas
Back kitchen area BLODGETT BCX14
if gas: hot air: 65,000 BTU/HR boiler: 50,000 BTU/HR total 115,000 BTU/h ~160C
Very often (~45 hs)
O4RVC Oven (for
bread) Electric
serving area where make sandwiches DOYON inc. JAOP6 120/208
KW=14 46
Sometimes (10-15hrs)
H1
RVC Large holder #1 Electric
hallway between back and front kitchens (not walk in) Metro C5 168/169 Very often (35+)
H2
RVC Large holder #2 Electric
hallway between back and front kitchens (not walk in) Metro C5 168/169 Very often (35+)
W1 RVC Warmer Electricserving area (for dinner/lunch) IFW-48 208 1100 60 Very often (50+)
W2RVC
Warmer (Hamburgers) Electric
front area, middle
Hatco Corporation
2800 w = 2.8kw Very often (35+)
H3RVC Warmer
(pizza) Electric front area, sideHatco Corporation
1440 w = 1.44kw 1440 Often (25hrs)
G1 RVC Grill Gasfront area, middle Garland
90,000 btu/h Very often (35+)
Gd1
RVC
Griddle Gasfront area, middle Garland
228000btu or 66.78kw Very often (35+)
O5RVC
Oven (under griddle) Gas
front area, middle Garland
O6RVC
Oven (under griddle) Gas
front area, middle Garland
FY1 RVC Deep fryer #1 Gas
front area, middle Garland
MFDS: 00254, 253, 252
110,000 btu/h Often (20hrs)
FY2 RVC Deep fryer #2 Gas
front area, middle Garland
MFDS: 00254, 253, 252
110,000 btu/h
Sometimes (10hrs)
FY3 RVC Deep fryer #3 Gas
front area, middle Garland
MFDS: 00254, 253, 252
110,000 btu/h Rarely (3hrs)
FY4 RVC Tilt Fryer GasBack kitchen area BLODGETT BLG-4OG 120
125,000 BTU 1.5 Sometimes (6hrs)
S1RVC
Steamer GasBack kitchen area
Cleveland, Steamcraft Ultra 10
125,000 btu Very often (35+)
SK1 RVC Steam Pot GasBack kitchen area BLODGETT RVS32
~150,000 50 PSI Often (20-25hrs)
SK2 RVC Steam Pot GasBack kitchen area BLODGETT
~150,000 50 PSI
Sometimes (10hrs)
O7 RVC Salamander Gas
Back kitchen area Garland 40000 Rarely (2hrs)
R1 RVC 4 burner stove Gas
Back kitchen area Garland
236000
Sometimes (10-15hrs)
RVC Dishwasher Electric side-room Hobart CLPS66E 600 22.6 60
Very often (60+hrs)
RVC
Dishwasher (electrical booster) Electric side-room Hobart CLPS66E 600 33.7
RVC Dishwasher (rating when separated electrical
Electric side-room Hobart CLPS66E 8.2
70
connections are utlized)
WF1
RVC
Walk-in fridge #1 (2-fan) Electric
back kitchen area
Norbec (container) Keeprite refrigeration (evaporation fan)
k1P209ME-S2B-CA6NN
Amotors=208-230v, defrost heaters= 230v ELECTRICAL COMPONENTS--FA motors(QT 2)=208-230 Defrost heaters- face (3)=230 -drain pan (1)=230
watts total= 1890 (unit entering the electrical service) defrost heaters-face=400-drain pan=410
UNIT ENTERING etc. FA motors=1.1 Defrost heaters=min ampicity=10.3 60
4(#1) 6(#4)
WF2
RVC
Walk-in fridge #2 (2-fan) Electric
back kitchen area
Norbec (container) Keeprite refrigeration (evaporation fan)
k1P209ME-S2B-CA6NN
FAmotors=208-230v, defrost heaters= 230v ELECTRICAL COMPONENTS--FA motors(QT 2)=208-230 Defrost heaters- face (3)=230 -drain pan (1)=230
watts total= 1890 (unit entering the electrical service) defrost heaters-face=400-drain pan=410
UNIT ENTERING etc. FA motors=1.1 Defrost heaters=min ampicity=10.3 60
4(#1) 6(#4)
WF3
RVC
Walk-in fridge #3 (1-fan) Electric
back kitchen area
Norbec (container) Keeprite refrigeration (evaporation fan)
k1P209ME-S2B-CA6NN
FAmotors=208-230v, defrost heaters= 230v ELECTRICAL COMPONENTS--FA motors(QT 2)=208-230 Defrost heaters- face (3)=230 -drain pan (1)=230
watts total= 1890 (unit entering the electrical service) defrost heaters-face=400-drain pan=410
UNIT ENTERING etc. FA motors=1.1 Defrost heaters=min ampicity=10.3 60
4(#1) 6(#4)
WFr1RVC
Walk-in Freezer (5-fan) Electric
71

Table 3: Appliance list with specifications: BMH (blue highlighted appliances are Energy-Star rated)
72

LabelDoors (fridges only)
Avg Unit Energy Consumption (kWh/year )
Kitchen Appliance Energy Type
Location Description Manufacturer Model # Voltage Watts (Energy
Consumption)(F.L.) Amps HP HZ Temp. held
atHigh Pressure
Low Pressure
Pressure (only steamers)
Frequency of Use / wk
WFr1BMH Walk-in
Freezer (new) ElectricBasement kitchen Norbec
PP-330-12-L-C1 1400 (total) 12 (total) -8C
WF1
BMHWalk-in Fridge (new) Electric
Basement kitchen Norbec PP-330-12-L
100 (heating); 1300 (lighting); 1400 (total)
1 (heating); 11 (lighting); 12 (total) 5C
WF2BMH Walk-in fridge
(vegtables) ElectricBasement kitchen
Keenrite Products K1800 115 644 5.6 60
WF3,WFr2
BMH Walk-in Fridge + Freezer (meat) Electric
Basement kitchen
Century-E Plus RPM 1745 575 1178.75 2.05 2 60
WF4BMH Walk-in Fridge
(dairy) ElectricBasement kitchen
Brunner Corp. (Canada) Ltd. WC150FL
200-220, 208-230 2280-2622 11.4
Max water pressure: 150 PSIG
2 Solid 4300
BMH
Fridge Electric
Basement kitchen, near back office
FOSTER refrigeration GH50 120 1176
power supply (TOTAL)=9.8 Condensing unit=7.8 Accessories= 2.0 60
Fr 4
2 (residential type)
BMH Stand-up Freezer Electric
Basement kitchen (pastry area) Frigidaire
FFU2124DWIO 115 575 5 60
2206 PSIG 965 PSIG
2 (solid) 9800
BMH
2 -door Stand-up Freezer Electric
Basement kitchen (pastry area)
Commando 90/Foster QL-48-T
DEF/DEG-heat=115 Accessories: 115 Temp. Cond. Unit-comp.congelation 115
Heat=8.1 Access.= 4.2 Total amps=14.3
Heat=60 Access.=60 Temp. Cond. Unit= 60
1 (but part of fridge/freezer 2 door combo) solid door 5200
BMH
Freezer Electric
Basement kitchen, stock room
FOSTER refrigeration MID52
Power=120 1164
Power (total)= 9.7 Condensing unit=8.2 Access= 1.5 Defrost= 3.9 60 -17 345 174
BMH
Fridge (Dairy) Electric 2nd basement
Tecomseh Products of Canada
AK165ET-030-A2 or AKA9442EXD-R22 208-230 V
60 Hz
1 (but part of fridge/freezer 2 door combo) solid door 4300
BMH Fridge (attached to Fr3) Electric
Basement kitchen, stock room
FOSTER refrigeration MID52
Power supply=120 708
Power (total)= 5.9 Condensing unit=5.2 Access= 0.7 60 186 88
73

O1 BMH
2 Oven set, (Double Pastry Oven) Gas
Basement kitchen (pastry area)
Southbend - Silver Star
serial only= CA 10-17 115
11kw per deck (two decks) 6.5/3/0
60/50 1725 1140
Sometimes (10-15hrs)
O2
BMH
Gas oven (ANCIENT) Gas
Basement kitchen (pastry area, edge of kitchen) BLODGETT
961 only 37,000 BTU/hr 981 only 50,000 BTU/hr Double (981/961) 87,000 BTU/hr
Sometimes (10hrs)
O3
BMH Oven (3 horizontal door) Electric
Basement kitchen (pastry area, edge of kitchen)
General Electric
Sometimes (10hrs-15hrs)
R1BMH Oven/griddle/
burner range Gas
Basement kitchen, center island Garland M42 21.5 kw Rarely (2-3 hrs)
Gd1BMH
Griddle Gas
Basement kitchen, center area Garland Often (25hrs)
O4BMH Oven #1
(below griddle) Gas
Basement kitchen, center area Garland Rarely (2hrs)
O5BMH Oven #2
(below griddle) Gas
Basement kitchen, center area Garland Rarely (2hrs)
O6BMH 2-set Oven
(combi) Gas
Basement kitchen, center area Blodgett 100-115
Very often (35hrs)
S1BMH 3 drawer
SteamersDirect Steam
Basement kitchen, center area
Cleveland Range Inc. PSM3 115 9371 0.9 60
Very often (35+hrs)
S2BMH 2 drawer
SteamersDirect Steam
Basement kitchen, center area
Cleveland Range Inc. PSM2 115 9371 0.9 60
Very often (35+hrs)
SK1BMH Steam Kettle
#1 Steam
Basement kitchen, center area
B.H. Hubert & Son Inc.
25 PSI @ 267F Often (15hrs)
SK2BMH Steam Kettle
#2 Steam
Basement kitchen, center area
B.H. Hubert & Son Inc.
25 PSI @ 267F Often (15hrs)
SK3BMH Steam Kettle
#3 Steam
Basement kitchen, center area
Legion Utensils Co. Inc.
30 PSI @ 300F
Very often (35+hrs)
Fy123 BMH (3) Deep Fryers Gas
Basement kitchen Frymaster
Sometimes (15hrs)
H1BMH
Holder Electric
Basement kitchen, center area
Metro C5 3 Series
Very often (50hrs)
2 (glass) BMH Fridge (2 door, dairy) Electric Serving area
TRUE refrigerators T-49G 115 1046.5 9.1 0.5 60 41
2 (glass)
BMH Fridge (2 door, sandwiches & drinks) Electric Serving area
TRUE refrigerators T-49G 115 1046.5 9.1 0.5 60 40
no door (display)
BMHFridge Electric Serving area
TRUE Manufacturing Co. Thac-48 115 1334 11.6 0.5 60
(cover sliding door, icecream)
BMH
Fridge Electric Serving area
Nestle Canada. Coldtech, 1AD Technologies
ISD47-01-BLUE 120 1 60
2 (glass) BMH Fridge Electric Serving areaTRUE refrigerators T-49G 115 1046.5 9.1 0.5 60 4C
1 (glass) BMH Fridge Electric Serving areaKuhl. Technology LC-296F 115 60
1 (glass) BMH Fridge Electric Serving areaTRUE refrigerators GDM-26 115 828 7.2 0.33 60
no door (airflow open)
BMHFridge Electric Serving area
TRUE refrigerators TAC-48GS 208/230 2496-2760 12 1 60
74

no door (display) BMH Fridge Electric Serving area
TRUE refrigerators Thac-48 115 1334 11.6 0.5 60
cooler (holder of smoothies: no door)
BMH
Fridge Electric Serving areaThe Vollrath Co. 36656 120 504 4.2 1 60 12F
sliding door (glass)
BMHFridge Electric Serving area Silver King SKOC48DT 115 448.5 3.9 60 5C
1 solid door 5200 BMH Freezer Electric Serving area
TRUE Refrigerators TWT-27F 115 943 8.3 1 /3 60
2 door floor level (solid door) 4300
BMH
Fridge Electric Serving areaTRUE Refrigerators TWT-60 115 586.5 5.1 1 / 5 60
1 door, glass BMH Fridge Electric Serving area
TRUE refrigerators G4SM-23 115 1150 10 1 60
sliding door (glass)
BMHFridge Electric Serving area
FGL Equipments MEDEA 220 1078 4.9 -14C
sliding door (glass)
BMHFridge Electric Serving area Silver King SKDC48PT 115 448.5 3.9 60
sliding door (glass)
BMH Fridge (curved, glass) Electric Serving area
TRUE refrigerators TCGR-36 115 1012 8.8 1 / 3 60
solid door (2) 4300 BMH Fridge (floor
level) Electric Serving areaTRUE Refrigerators TSSU-60-12 115 897 7.8 1 /3 60
solid door (2) 4300 BMH Fridge (floor
level) Electric Serving areaTRUE Refrigerators TSSU-60-16 115 897 7.8 1/ 3 60
sliding door (glass)
BMH Fridge (pizza, curved) Electric Serving area
TRUE Refrigerators TGCR-36 115 1012 8.8 1 / 3 60
solid door (2) 9800 BMH Freezer
(small) ElectricBack room of serving area
TRUE refrigerators twt-27f 115 954.5 8.3 1 / 3 60
solid door (2) 4300 BMH Fridge
(desserts) ElectricBack room of serving area
TRUE refrigerators twt-60 115 586.5 5.1 1 / 5 60
solid door (2) 4300
BMHFridge (2 doors, dairy products) Electric
Back room of serving area
TRUE refrigerators t-49 115 1058 9.2 1 / 2 60
C1,2BMH
Long buffet salad holder (X2) Electric Serving area INOX-Fab.inc TSB-cl-96-30 120 7, fla=8.1 60
H2BMH
Temperature holding cabinet Electric Serving area
Metro, C58-series C589-SDS-UA 120 2000 60
Gd2 BMH Flat griddle Electric Serving area MIRACLEAN 48X30fld 208/240 14.3 kw 60 Very often (35+)
O7 BMH Oven (conveyer) Electric Serving area Lincoln
1130-000-U-KF005 208 10 kw 48 60
Sometimes (10hrs)
H3 BMH Warmer Electric Serving areaVollrath Company 72717 120 1100 Very often (35+)
DishwasherSteam/Electric
75

Table 4: Best Practices
Appliance Best Practices CitationCombination Ovens
1. Use convection ovens (or the convection part of combo ovens) as much as possible (uses much less energy than steam)2. Reduce use of combination/steam ovens (or use convection mode) → saves energy and water3. If oven use can be combined to using 1 oven in the place of 2 or 3 - turning off oven for several hours can save energy4. Load ovens to capacity whenever possible, but remember to maintain two-inch clearances around pans in standard ovens to ensure proper air circulation. Forced-air convection ovens require less clearance.5. Reduce number of times you open oven door during cooking6. Clean often to reduce heat that needs to be put in (to reduce heat transfer)7. Most foods can be placed in ovens during pre-heating
Natural Resources CanadaFood Service Warehouse
Grills 1. Pre-heat only as early as necessary2.Turn grill off when not in use3. Clean grills everyday
Food Service Warehouse
Griddles 1. Pre-heat only as early as necessary2. Turn griddle off when not in use3. Clean griddle everyday
Campus ERC
Fridges and Freezers
1. Cover liquids and wrap foods stored in the refrigerator. Uncovered foods release moisture and make the compressor work harder2. Allow hot food to cool before setting it inside, it reduces the energy that needs to be used to cool it3. Fridges/freezers need to be filled at a specific capacity; do not overfill fridges (best results when lots of air circulation) but keep freezers full4. Frost buildups reduce efficiency, defrosting frequently will prevent buildups5. Thawing frozen food inside the fridge will reduce the amount of energy the fridge needs to use
Campus ERCNatural Resources Canada
Steam Pots 1. Cover steam pots2. Boilers should be flushed at least once a week3. Check for leaks and fix them
Campus ERC
Stoves 1. Use pressure cookers (use 50~75% less energy) Food Safety and Inspection Service
Dishwasher 1. Set the flow pressure to you 15-25 psi2. Don’t pre-rinse dishes before putting them in the dishwasher. Rather scrape off plates and empty liquids.
Campus ERCNatural Resource Canada
76

Soaking or prewashing is generally recommended in cases of burned-on or dried-on food. If you must rinse dishes, use cold water3. Set the wash tank to160 F4. If the dishwasher has a "sanitizer" setting or booster heater, reduce the temperature on the hot water tank to about 120°F. This will significantly reduce overall water heating costs.5. Clean the filter at the bottom of your dishwasher (make sure it is not clogged with food) regularly to keep the machine running efficiently.6. Set hot water heat at 140 F
Table 5: Appliance energy consumption: Natural Gas vs. Electricity
Table 6: Cost ($) of operating appliances: Natural Gas vs. Electricity
Appliance
Annual cost ($) of
running on
Electricity
Annual cost ($) of
running on Natural
gas
Difference in Costs
($)
Oven 359.69 1115.15 755.45
Steamer 272.61 894.13 621.52
Steam kettle 294.41 661.05 366.64
Fryer 536.58 1728.00 1191.40
77
Base-line Unit
Appliance
Natural gas
Annual energy
consumption
(GJ)
Natural gas
Annual energy
consumption
(kWh)
Electricity
Annual energy
consumption
(kWh)
Difference
(kWh)
Oven 111 30,831.53 12,193 18,639
Steamer 89 24,720.77 9,241 15,480
Steam kettle 66 18,276.71 9,980 8,297
Fryer 172 47,774.98 18,189 29,586
Griddle 128 35,553.47 17,056 18,497

Griddle 503.15 1285.94 782.78
Table 7: Carbon Dioxide emissions: Natural Gas vs. Electricity
Appliance C02 emissions for
Natural Gas (g)
C02 emissions for
Electricity (g)
Difference in CO2
emissions (g)
Oven 5534941.74 89.55 5534852.20
Steamer 4437926.26 67.87 4437858.39
Steam kettle 3281073.57 73.29 3281000.28
Fryer 8576666.48 133.58 8576532.9
Griddle 6382635.52 125.26 6382510.26
Oven 5534941.74 89.55 5534852.20
Table 8: Prioritized list of replacements: BMH
Table 9: Prioritized list of replacements: RVC
78

Table 10: List of stakeholders
Name Group Role
Oliver deVolpi McGill Food and Dining Service (MFDS)
Executive Chef; Primary Client
Raja Sengupta ENVR 401 Project Supervisor
Jancide Fillion MFDS Unit Chef at RVC, contact for RVC kitchen
Rene Picarella MFDS Unit Chef at BMH, contact for BMH kitchen
79

David Balcombe McGill Residences Facilities and Buildings Operations
Associate Director
Jerome Conraud McGill Residences Facilities and Buildings Operations
Energy Manager
Elana Evans McGill Food Systems Project 2011 intern; identified need for energy efficiency assessment of kitchen practices
Marc-Etienne Brunet McGill Energy Project MEP coordinator
Lilith Wyatt Office of Sustainability SPF administrator
Susanna Klassen Office of Sustainability Applied student research & curriculum intern
David Gray-Donald Students’ Society of McGill University
Sustainability Coordinator; Gorilla Compost Coordinator 2010
David Morris Gorilla Composting Coordinator
Maria Mazzotta MFDS 2011-2012; Student services 2012
Food Systems Administrator 2011-2012; Sustainability Adviser 2012
Mathieu LaPerle MFDS Director
80
Table 12: Appliance Savings Figures (Energy Star 2012)
81
Ovens Griddles/Grills Warmers Fryers Steam CookersGas Electric Gas Electric Electric Gas Electric Gas
Baseline unit 111 GJ/yr 12,193 kWh/yr 128 GJ/yr 17,056 kWh/yr 12,326 kWh/yr 172 GJ/yr 18,189 kWh/yr 89 GJ/yrHigh-efficiency unit
79 GJ/yr 10,314 kWh/yr 112 GJ/yr 14,460 kWh/yr 3,944 kWh/yr 118 GJ/yr 17,011 kWh/yr 39 GJ/yr
Energy savings
32 GJ/yr 183 kWh/yr 16 GJ/yr 2,595 kWh/yr 8,382 kWh/yr 53 GJ/yr 1,179 kWh/yr 50 GJ/yr
Operating ANNUAL cost for baseline unit
$1,114.81 $380.06 $1,285.21 $531.49 $384.24 $1,724.01 $566.89 $1,089.20
Operating ANNUAL cost for high-efficiency unit
$790.73 $321.55 $1,127.06 $450.61 $122.92 $1,188.32 $530.02 $458.84
ANNUAL Cost savings
$324.09 $58.51 $158.15 $80.88 $261.32 $535.69 $36.87 $630.35
Water cost savings
n/a n/a n/a n/a n/a n/a n/a $113
Baseline unit cost
$1,500 $850 $1,500 $850 $2,069 $2,894 $2,894 $6,836
High-efficiency unit cost
$1,550 $850 $1,560 $850 $3,569 $2,944 $3,154 $7,256
Cost differential
$50 $0 $60 $0 $1,500 $50 $260 $420
Payback period
0.2 yr 0.0 yr 0.4 yr 0.0 yr 1.4 yr 0.1 yr 1.7 yr 0.7 yr
CEE of high-efficiency unit
> 44% > 70% > 38% > 70% n/a > 50% > 80% > 38%
IER of high-efficiency unit
< 13,715 kJ/hr
< 1.6 kW < 249 kJ/hr per m2
< 0.03 kW/m2
Depends on interior volume
< 9495 kJ/hr < 1kW 6594-13.188 kJ/hr
Gas ElectricityCalculation Units
1.1137 0.245833333

Assumptions: Natural gas at $10.046/GJ; Electricity at $0.0295/kWh; Water at $2.20/m3; 45.4 kg (100 lb.) daily food load (where applicable).
82

8.3. Appendix C: Maps
Figure 1: Map of RVC
83

Figure 2: Map of BMH: Basement Area of Cafeteria (kitchen)
84

85

Figure 3: Map of BMH: 2nd Floor Serving Area of Cafeteria
8.4. Appendix D: Further Documentation
MFDS Staff Interview
1. Where do you work?
BMH RVC Both Other
2. What is your position?
General helpers Counter
Kitchen staff Baker First cook 2nd cook cook’s helpers casual kitchen
Student Counter Dish Driver Other
3. Average weekly hours (including weekends) <10 10-20 20-30 30-40 >40
4. Which time of day do you usually work at? (specify peak hours for each cafeteria) opening hours peak times non-peak times closing hours
5. What station(s) do you work at? What are your main tasks?
86

6. According to your estimations, how often and how long do you use the main equipment (specified by technical analysis) in your area?
7. What do you know about energy efficiency?
8. Which changes (if any) can be made in relation to your practices and use of appliances to save energy?
9. During the time of a normal work period, would you be interested in attending a staff training session about energy efficiency?
yes no
Why or why not?
10. Do you work with or use any appliances that are broken or/and inefficient?
11. What are you satisfied and not satisfied with in relation to the equipment that you work with?
12. Are you satisfied with the current location of your equipment in relation to your working space?
13. Do you think there are kitchen practices (related to staff behavior) that could be changed to be more efficient?
14. Do you have any other questions or concerns about the energy efficiency project conducted by students from the environmental research course?
Figure 1: Interview Form for MFDS staff
87

Figure 2: Ethics Approval
88

Figure 3: Gantt Chart of time spent on various aspects of project
89