42 yourtradingedge …mediaserver.fxstreet.com/reports/be55093b-a63f-4f70-87ae-ee43be63… · gann...
TRANSCRIPT

SWING CHARTS
MAY/JUN 2012 YOURTRADINGEDGE 43
Swing Charts
David Burton explores the trading methodology of WD Gann.
D Gann’s financial astrology and Bible codes are complex, and difficult to learn. However, Gann also taught the basics of three swing charts. The foundation for successful trading when using swing charts (or any methodology) is to have the correct capital and your trading rules in place.
How to make a profitThe first book to study is ‘How to Make Profits in Commodities’ by WD Gann. Studying this book alone in depth could take you twelve months. In my opinion, it is one of the best books ever written. You must obey the 28 rules on page 23 – you will find that, if you break those rules, you lose money. Of course, you must be debt free (which I have been talking about for years).
Swing chartsI have covered three-day swing charts in previous issues of YTE. Here
I describe point swing charts. You do not use all the tools all the time – you have to change tools for different positions in the market. The point swings are used only at the ‘final grand rush’, as Gann calls it, unless the swings are so large that you can use point swings when the market is at lower levels. As an example, Gann used 9-point swings on the Dow Jones Industrial Average (DJIA).
The first thing to look for is the market making higher tops and higher bottoms for an uptrend, and lower tops and lower bottoms for a downtrend. Once the market has made three higher tops and higher bottoms (or lower tops and lower bottoms) you can start to use swing charts. It is best to use parts of a circle for point swings, such as 0.009, 0.09, 9, 90, 900 and so on, which is the same as 90 degrees or a quarter of 360 degrees. Or you might want to use 3.60, 36 or 360, to give a compete circle in price.
You must stay out of the market until conditions prove themselves (and you have not broken any rules). You will still be earning interest and therefore still making money if you are not trading because
W
www.YTEmagazine.com

SWING CHARTS
44 YOURTRADINGEDGE MAY/JUN 2012
conditions are not right.First, you need to get the bigger picture. Figure
1 is the 9 cents (Australian currency) swing chart, which you can draw by hand or plot with a computer. Starting from the 2008 low of 60 cents, a 9 cents or more move up occurs before the swing chart turns up. This is what Gann calls an uptrend. (It would turn down 9 cents or more to create a higher bottom.) Every time the Australian dollar has a very large collapse, you can look to buy it based on swing charts alone. (The reason is that you also collect interest on your money if you are buying through the forex market, because rates are higher in Australia than in the United States, where they keep printing money and creating inflation.)
If you bought on the third higher top, which is a break above 0.7264, and not at the bottom, you would make a lot of money. The stop losses would be below the swings’ bottoms.
If you felt that you wanted to get closer to the market (though I prefer not to, as I play golf and travel), you would use a different swing pricing. In figure 2 I have used 0.045 instead of 0.09 swings. In this way, there are more swings, because 0.045 is one eighth of a circle, taking you closer to the market. Figure 2 shows the low in 2008. If you wanted to get closer still, you could use 0.0225, or one-sixteenth of a circle.
You would buy at, say, 0.7300, with a stop more than 0.0450 away. After the market moves sufficiently in your favour, you move your stop to break even and never move it down at all. The market moved up to 0.8264 before it fell more than 0.0450; it fell 0.0556 to create a low at 0.7706. Your new stop would be moved to below that level, at, say, 0.7690.
Less riskWD Gann’s methods all involve eighths and thirds. You can use these methods to see if the market is in a weak or a strong position, and use the swing point moves to prevent making risky trades. This is where you cut down risk and determine the trend of the market. If you wanted to trade DJIA futures or the S&P 500, you would divide the market into sixteenths or sixty-fourths, depending on how high prices go.
The $A chart shows Gann levels. In my opinion, you do not need Fibonacci levels – Gann’s levels work much better. Plus Fibonacci wasn’t a trader, but Gann was. In addition, Fibonacci has no time cycles – and time is the most important factor of all. Gann levels are
natural levels, because they are all parts of a circle. The retracement levels from 60 cents to 1.1078 are shown on the
chart. The ranges are divided into eighths and thirds to give the levels of support and resistance. If you trade the swing chart around these levels, you can reduce risk. Gann added layers to his charts to cut
FIGURE 1
FIGURE 2
www.YTEmagazine.com
SWING CHARTS
MAY/JUN 2012 YOURTRADINGEDGE 45
down risk, which gave him a 92 per cent success rate. Start with the rules and your capital, and then build your charts.
The astrology cycles were the last thing Gann added, but you do not need them to trade. Gann was also heavily into chart patterns, such as double tops, bottoms, head and shoulders and so on. Studying all the patterns is a lifetime’s work in itself.
If the market is below the 25% level, it is in a weak position and you would go short at just below 98 cents (98 is twice 49 or 14 x 7, so it is an important number as well) using the swing chart. As the market fell, you could add to your position using the levels or swings. It is better to wait for closes below levels, because they are more important than just trading at a level. Once the market broke the 0.9360 or 33.3% retracement it would be in an even weaker position (0.9360 is 26 x 0.0360). If the market broke the 50% level, it would in the weakest position since the low of 60 cents.
Why you do not need lagging indicatorsGann, Livermore and such people did not have any lagging indicators, and I never use them either. I believe that someone who is teaching Gann, but who is using lagging technical indicators, does not understand Gann. All you need are time and price, nothing else.
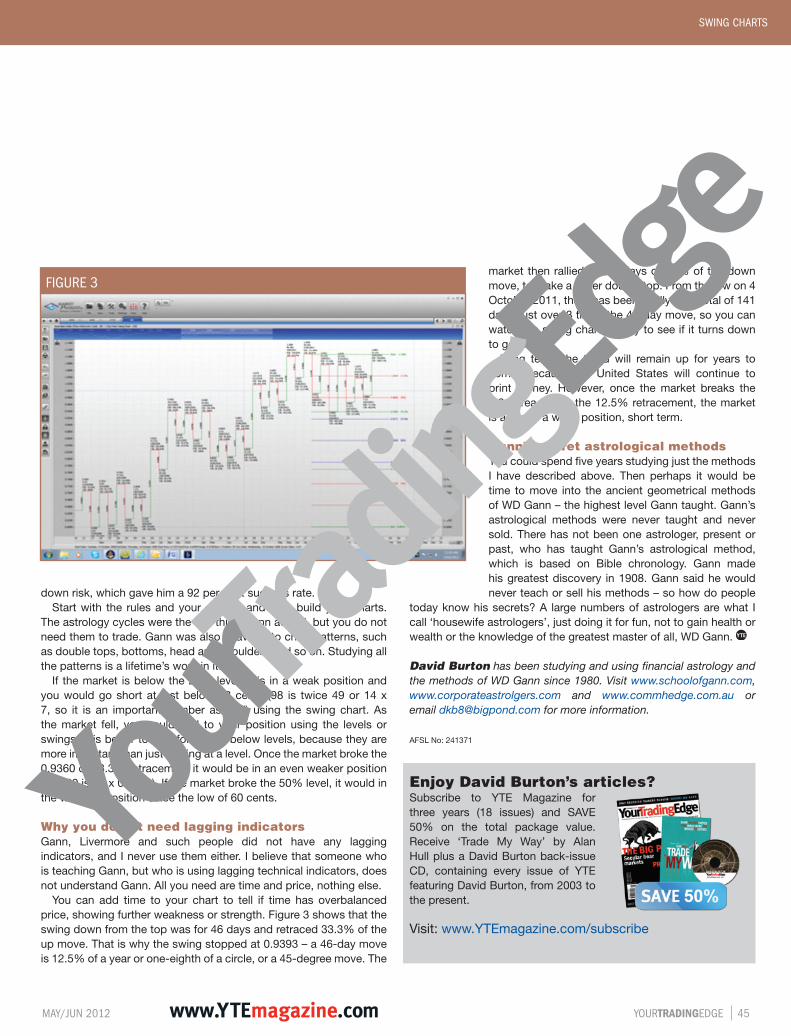
You can add time to your chart to tell if time has overbalanced price, showing further weakness or strength. Figure 3 shows that the swing down from the top was for 46 days and retraced 33.3% of the up move. That is why the swing stopped at 0.9393 – a 46-day move is 12.5% of a year or one-eighth of a circle, or a 45-degree move. The
market then rallied for 23 days or 50% of the down move, to make a lower double top. From the low on 4 October 2011, there has been a rally for a total of 141 days, just over 3 times the 46-day move, so you can watch the swing chart closely to see if it turns down to go short.
Long term, the trend will remain up for years to come, because the United States will continue to print money. However, once the market breaks the 1.04 area below the 12.5% retracement, the market is again in a weak position, short term.
Gann’s secret astrological methodsYou could spend five years studying just the methods I have described above. Then perhaps it would be time to move into the ancient geometrical methods of WD Gann – the highest level Gann taught. Gann’s astrological methods were never taught and never sold. There has not been one astrologer, present or past, who has taught Gann’s astrological method, which is based on Bible chronology. Gann made his greatest discovery in 1908. Gann said he would never teach or sell his methods – so how do people
today know his secrets? A large numbers of astrologers are what I call ‘housewife astrologers’, just doing it for fun, not to gain health or wealth or the knowledge of the greatest master of all, WD Gann.
David Burton has been studying and using financial astrology and the methods of WD Gann since 1980. Visit www.schoolofgann.com, www.corporateastrolgers.com and www.commhedge.com.au or email [email protected] for more information.
AFSL No: 241371
Enjoy David Burton’s articles?Subscribe to YTE Magazine for three years (18 issues) and SAVE 50% on the total package value. Receive ‘Trade My Way’ by Alan Hull plus a David Burton back-issue CD, containing every issue of YTE featuring David Burton, from 2003 to the present.
Visit: www.YTEmagazine.com/subscribe
FIGURE 3
www.YTEmagazine.com