43914 3 supp 1089101 nktmqz - images.nature.com · brown algae, and heterokonts in general, ......
TRANSCRIPT

Supplementary Figures
Supplementary Figure 1. Kmer depth analyses. “pe180”, “pe300_1”, “pe300_2”, and “pe500” represents the kmer frequency distribution of four short insert libraries in S. japonica JA, respectively. “b”, “f”, “g”, “e”, and “w” represents the kmer frequency distribution of the sequencing data in four wild individuals and one cultivated S. japonica individual. The left peak at low frequency represents kmers containing random sequencing errors, whereas the right long tail with high kmer depth likely results from repetitive sequences. The middle distribution represents error-free data and the peak is considered as kmer coverage. The genome size was calculated based on the coverage estimate and total number of non-error kmers.
0 10 20 30 40 50 60
0.0
e+0
01
.5e+
07
3.0
e+
07pe180
kmer depth
coun
t
0 10 20 30 40 50 60
0.0
e+0
01
.5e+
07
3.0
e+
07
pe300_1
kmer depth
coun
t
0 10 20 30 40 50 60
0.0
e+0
01
.5e
+0
73
.0e
+07
pe300_2
kmer depth
coun
t
0 10 20 30 40 50 60
0.0
e+0
01
.5e+
07
3.0
e+
07
pe500
kmer depth
coun
t
0 10 20 30 40 50 60
0.0
e+0
01
.5e+
07
3.0
e+
07b
kmer depth
coun
t
0 10 20 30 40 50 60
0.0
e+0
01
.5e
+0
73
.0e
+07
f
kmer depth
coun
t
0 10 20 30 40 50 60
0.0
e+0
01
.5e+
07
3.0
e+
07
g
kmer depth
coun
t
0 10 20 30 40 50 60
0.0
e+0
01
.5e+
07
3.0
e+
07
w
kmer depth
coun
t
0 10 20 30 40 50 60
0.0
e+0
01
.5e
+0
73
.0e
+07
e
kmer depth
coun
t

Supcytoas agamresp
pplementarometry (FCan internal
metophytes. pectively.
ry Figure M) analysisl standard. X and Y ax
2. Genoms of fluoresa, Chicken
xis show the
me size detscently stainn erythrocye relative fl
ermination ned nuclei uytes. b, sinluorescence
of S. japousing chickngle cells e and the nu
onica by
ken erythrocof S. japo
umber of nu
flow cytes onica uclei,

Supplementary Figure 3. Repetitive elements in S. japonica. (A) The fraction of various types of repetitive elements in the S. japonica JA genome. (B) A phylogenetic tree of FNIP repeats in S. japonica and all of the currently available genomes.

Supplementary Figure 4. Phylogenetic analysis of RT-domains in brown algal RTEs and known RTEs in Repbase. RTEs from brown algae and green algae are highlighted in brown and green, respectively.

Supplemental Figure 5. Comparison of genes with RNA-seq data support (left figures) or without support (right figures) in aspect of (A and B) gene length, (C and D) exon number, (E and F) sum of intron length, and (G and H) average of intron length.A total of 1,534 of 1,738 genes without RNA-seq support have homologues in the Ectocarpus genome.

Suponly
pplementary a subset o
ry Figure 6of sequences
. The alignms was shown
ment of FNn.
IP domains. To reduce
e the figure size,
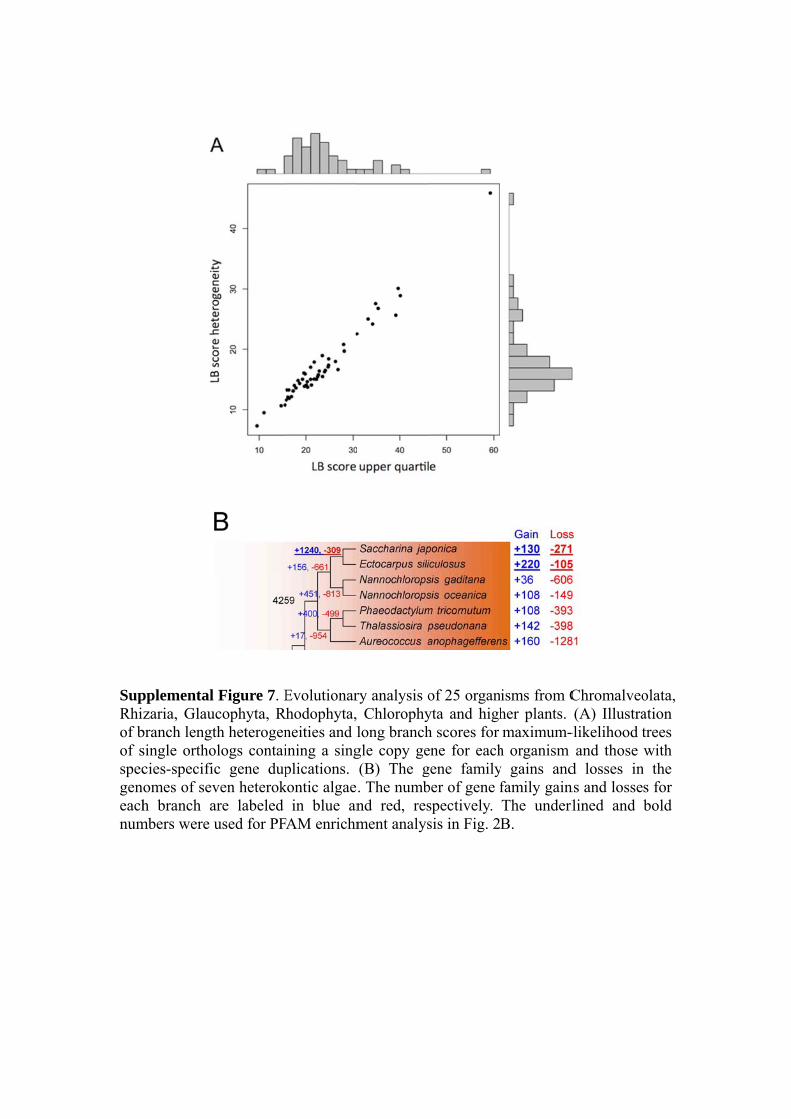
SupRhiof bof sspecgeneachnum
pplemental zaria, Glau
branch lengtsingle orthocies-specificomes of sevh branch a
mbers were u
Figure 7. Eucophyta, Rth heterogenologs contaic gene dupven heterokare labeled used for PF
Evolutionarhodophyta, neities and lining a singplications.
kontic algaein blue an
FAM enrichm
ry analysis o Chlorophylong branchgle copy ge(B) The g. The numbnd red, resment analys
of 25 organyta and highh scores for ene for eachgene familyber of gene fspectively. sis in Fig. 2
isms from Cher plants. maximum-
h organism y gains andfamily gainThe underlB.
Chromalveo(A) Illustra
-likelihood tand those
d losses inns and losselined and
olata, ation trees with
n the s for bold

Sup478grourowdomdomann
pplemental 0 families ups based o
w representmain-based main enrichotated dom
Figure 8. containing
on the gene ts a familyannotation
hment of tain in both
Compariso10 or mo
abundance y, and eac
of clusterhe familiesof the geno
on of gene ore genes. (
in each spech columnred familiess was com
omes.
abundance(A) Familieecies by usi
n represents in (A). F
mpared aga
among 25es were cluing K-means one speFisher’s exinst the to
5 organismsustered intons method; eecies. (B) xact test ofotal numbe
s for o 10 each The
f the r of

Supplemental Figure 9. (A) Analysis of non-synonymous (Ka)/synonymous (Ks) for S. japonica genes against their most similar S. japonica homologs within the same family with gene expansion in S. japonica. The logarithmic values of Ka and Ks with base 10 were displayed. Ks values larger than 2 (represented by a vertical doted line) were considered as saturated substitution rates. (B) Statistics of Protein identities of S. japonica gene pairs (left panel) and those between S. japonica and E. siliculosus (right panel).

Supplementary Figure 10. Diversification of vBPO and vIPO genes from S. japonica. A heat-map representation of the hierarchical clustering analysis of 15 vBPO and 42 vIPO genes obtained from S. japonica. The analysis is performed using sequence similarity scores from pairwise alignments. The dendrogram illustrates the sequence identites between vBPOs and vIPOs.

Supplementary Figure 11. Different life stages of S. japonica and Iodine contents in adult sporophyte. a) Gametophyte and Iodine contents; and b) Juvenile sporophyte used for vHPO gene expression investigation; c) Iodine contents in basal blades, middle blades and distal blades were determined by iodometry and were shown in the light yellow boxes; Iodine contents in gametophyte, three blade parts, holdfast and stipe were determined by Scanning Electron Microscopy (SEM) analyses and were shown in the light blue boxes.

Supplementary Figure 12. Reconstruction the carbon metabolism pathways in 14 algae genomes. M1PDH, mannitol-1-phosphate 5-dehydrogenase; M1Pase, mannitol-1-phosphatase; M2DH, mannitol-2-dehydrogenase; FK, fructokinase; GPI, glucose-6-phosphate isomerase; PGM, phosphoglucomutase; UGP, UDP-glucose- pyrophosphorylase; GT48, b-1,3-glucan synthases (family GT48); KRE6-like proteins, putative 1,6-b-transglucosylases (family GH16); UDP, uridine diphosphate; GDP, guanosine diphosphate; TPS, trehalose-phosphate synthase; TPP, trehalose-phosphate phosphatase; GMD, GDP-mannose 6-dehydrogenase; MC5E, mannuronate C5-epimerase; MPG, mannose-1-phosphate guanylyltransferase; MPI, mannose-6-phosphate isomerase; MS, mannuronan synthase; PMM, phosphomannomutase; FK, l-fucokinase; GFPP, GDP-fucose pyrophosphorylase; GFS, GDP-l-fucose synthetase; GM46D, GDP-mannose 4,6-dehydratase. Nanoc=Nannochloropsis oceanica,Nanga= Nannochloropsis gaditana, Auran= Aureococcus anophagefferens, Ectsi= Ectocarpus siliculosus, Sacja= Saccharina japonica, Thaps= Thalassiosira pseudonana, Phatr= Phaeodactylum tricornutum, Chocr=Chondrus crispus, Cyame= Cyanidioschyzon merolae , Pyrye=Pyropia yezoensis, Galsu=Galdieria sulphuraria, Chlre= Chlamydomonas reinhardtii, Cocsu=Coccomyxa subellipsoidea, Volca=Volvox carteri.

Supplementary Figure 13. Proposed scenario for the evolution of polysaccharide biosynthesis and metabolism in green algae, red algae and stramenopiles. The sucrose and starch pathway in red algae, green algae and Glaucophytes evolved from ancient cyanobacteria via primary endosymbiosis. Brown algae, and heterokonts in general, acquired ancient red algae through secondary endosymbiosis, during which the sucrose and starch pathway was lost, and the laminaran pathway was introduced. The genes involved in the mannitol and alginate pathway in brown algae are very similar to those found in Actinobacteria, indicating the occurrence of horizontal gene transfer (HGT) events. The HGT event showed key genes related to the mannitol and alginate pathway were acquired by the common ancestor of brown algae, Eustigmatophyceae (Nannochloropsis) and Pelagophyceae through multiple HGT events. Other HGT events related to polysaccharide biosynthesis were not considered here. Nanoc=Nannochloropsis oceanica,Nanga= Nannochloropsis gaditana, Auran= Aureococcus anophagefferens, Ectsi= Ectocarpus siliculosus, Sacja= Saccharina japonica, Thaps= Thalassiosira pseudonana, Phatr= Phaeodactylum tricornutum, Chocr=Chondrus crispus, Cyame= Cyanidioschyzon merolae , Pyrye=Pyropia yezoensis, Galsu=Galdieria sulphuraria, Chlre= Chlamydomonas reinhardtii, Cocsu=Coccomyxa subellipsoidea, Volca=Volvox carteri.
Glaucophytes
Green algae Red algae
Planta
Auran Ectsi Sacja
Diatoms
Oomycetes
Primary endosymbiosis
Second endosymbiosis
HGT
Trehalose pathway Sucrose pathway Laminarin pathway Starch pathway Sulfate fucan pathway Mannitol pathway Alginate pathway
Nanoc Nanga
Thaps Phatr
Chocr Pyrye Cyame Glasu
Chlre Cocsu
Volca

Supplementary Figure 14. Phylogenetic analysis of enzymes M1PHD and M1pase corresponding in mannitol synthesis. The abbreviated words begin with and “SJ” in the tree stand for the protein ids for S. japonica. Actinobacteria and Bacteria taxon names were represented by the NCBI protein accession numbers.

Supplementary Figure 15. The KEGG distribution of proteins in S. japonica and E. siliculosus respectively. The x-axis indicates the percentage of a specific category of genes in the species. The signal transduction, glycan biosynthesis and metabolism, membrane transport, cell communication and development pathways were enriched in S. japonica when compared to E. siliculosus.
0 0.05 0.1 0.15 0.2 0.25 0.3
Metabolism of terpenoids and polyketides
Biosynthesis of other secondary…
Metabolism of other amino acids
Environmental adaptation
Development
Xenobiotics biodegradation and…
Nucleotide metabolism
Metabolism of cofactors and vitamins
Cell communication
Signaling molecules and interaction
Energy metabolism
Lipid metabolism
Cell growth and death
Amino acid metabolism
Cell motility
Carbohydrate metabolism
Membrane transport
Glycan biosynthesis and metabolism
Transcription
Transport and catabolism
Signal transduction
Folding, sorting and degradation
Translation
Replication and repair
Enzyme families
S. japonica
E. siliculosus

Supplementary Tables
Supplementary Table 1. Sample and sequencing statistics
ID Taxonomy Type Location Sequencer Library
Size
Read
length
#Reads DOC3 pDOC4
Ja S. japonica FG1 Qingdao, China Illumina 180bp 101bp 173,745,638 32X 29X
Illumina 300bp 101bp 343,890,974 64X 96X
Illumina 500bp 101bp 229,303,234 42X 106X
Illumina 800bp 101bp 12,440,146 2X 9X
Illumina 3kb 101bp 55,051,984 10X 153X
Illumina 5kb 100bp 26,018,116 5X 120X
454 8kb 373bp 1,367,320 0.9X 21X
454 16kb 349bp 1,194,418 0.8X 36X
PacBio / 5kb 1,928,517 20X /
C2 S. japonica FG Dalian, China Illumina 300bp 101bp 246,683,234 45X 68X
C3 S. japonica FG Lianjiang, China Illumina 300bp 101bp 276,867,214 51X 77X
C5* S. longissim FG Japan Illumina 300bp 101bp 212,293,176 39X 59X
C6* S. japonica FG Japan Illumina 300bp 101bp 281,665,262 52X 78X
C8 S. japonica FG Rongcheng,China Illumina 300bp 101bp 94,908,970 17X 26X
C11 S. japonica FG Dalian, China Illumina 300bp 101bp 98,206,724 18X 27X
C12 S. japonica FG Qingdao, China Illumina 300bp 101bp 230,401,208 42X 64X
C13 S. japonica FG Rongcheng,China Illumina 300bp 101bp 82,852,948 15X 23X
C14* S. latissima FG Germany Illumina 300bp 101bp 254,911,106 47X 71X
C15* Saccharina sp. FG Russia Illumina 300bp 101bp 71,700,190 13X 20X
C17* Saccharina sp. FG Russia Illumina 300bp 101bp 82,773,558 15X 23X
B* Saccharina sp. SP2 Russia Illumina 300bp 100bp 158,892,558 29X 44X
E* Saccharina sp. SP Russia Illumina 300bp 100bp 138,363,232 25X 38X
F* Saccharina sp. SP Russia Illumina 300bp 100bp 166,419,490 31X 46X
G* Saccharina sp. SP Russia Illumina 300bp 100bp 206,223,678 38X 57X
W* S. japonica SP Rongcheng,China Illumina 300bp 100bp 157,566,200 29X 44X
Note: FG1 indicates Female Gametophyte; SP2 indicates Sporophyte; DOC3 indicates depth of coverage; pDOC4 indicates physical depth of coverage; * indicates wild species.

Supplementary Table 2. S. japonica genome assembly statistics
Statistics S. japonica
Number of scaffolds 13,327
Total size of scaffolds 543,425, 768
Longest scaffold 1,469,055
Number of scaffolds > 500 nt 13,327
Number of scaffolds > 1K nt 8,872
Number of scaffolds > 10K nt 4,287
Number of scaffolds > 100K nt 1,575
Mean scaffold size 40,776
Median scaffold size 2,394
N50 scaffold length 252,007
L50 scaffold count 628
scaffold %A 24.90
scaffold %C 24.58
scaffold %G 24.56
scaffold %T 24.88
scaffold %N 1.09
Percentage of assembly in scaffolded contigs 85.5%
Percentage of assembly in unscaffolded contigs 14.5%
Average number of contigs per scaffold 2.2
Average length of break (>25 Ns) between contigs in scaffold 444
Number of contigs 29,670
Number of contigs in scaffolds 19,873
Number of contigs not in scaffolds 9,797
Total size of contigs 537,640,579
Longest contig 648,295
Number of contigs > 500 nt 28,287
Number of contigs > 1K nt 22,356
Number of contigs > 10K nt 10,891

Number of contigs > 100K nt 992
Mean contig size 18,121
Median contig size 4,429
N50 contig length 58,867
L50 contig count 2,495

Supplementary Table 3. Sequences used for vHPO phylogenetic analysis
Abbreviation Accession Number
Laminaria digitata VBPO1 CAD37191.1
Laminaria digitata VBPO2 CAD37192.1
Laminaria digitata VBPO3 CAQ51441.1
Laminaria digitata VBPO4 CAQ51442.1
Laminaria digitata VBPO5 CAQ51443.1
Laminaria digitata VBPO6 CAQ51444.1
Laminaria digitata VBPO7 CAQ51445.1
Laminaria digitata VIPO1 CAF04025.1
Laminaria digitata VIPO3 CAQ51446.1
Ectocarpus siliculosus VBPO CBN73942.1
Corallina pilulifera VBPO1 BAA31261.1
Corallina Pilulifera VBPO3 37928252
Corallina officinalis VBPO1 AAM46061.1
Corallina officinalis VBPO2 9256866
Corallina pilulifera VBPO2 BAA31262.1
Chondrus crispus VBPO XP_005719435.1
Gracilaria changii VBPO1 AGE00855.1
Laurencia nipponica VBPO BAP16518.1
Pyropia yezoensis VBPO BAQ02347.1
Mesoflavibacter zeaxanthinifaciens VBPO WP_010516409.1
Citreicella sp. 357 VBPO1 WP_009505876.1
Synechococcus sp. WH 8020 VBPO1 ADO20318.1
Synechococcus sp. CC9311 VBPO2 YP_731869.1
Alteromonas sp. SN2 VBPO1 YP_004466264.1
Acaryochloris sp. CCMEE 5410 VBPO WP_010471680.1
Acaryochloris marina VBPO2 WP_012161787.1
Acaryochloris marina VBPO WP_012165216.1
Acaryochloris marina MBIC11017 VBPO YP_001519261.1
Leptolyngbya sp. VBPO3 WP_023074445.1

Magnaporthe oryzae VCPO2 EHA56362.1
Gaeumannomyces graminis VCPO EJT71764.1
Magnaporthe oryzae VCPO1 ELQ63332.1
Pyrenophora triticirepentis VCPO XP_001933850.1
Alternaria didymospora VCPO CAA72622.1
Curvularia inaequalis VCPO CAA59686.1
Zobellia galactanivorans VIPO1 YP_004735706.1
Zobellia galactanivorans VIPO2 YP_004736527.1

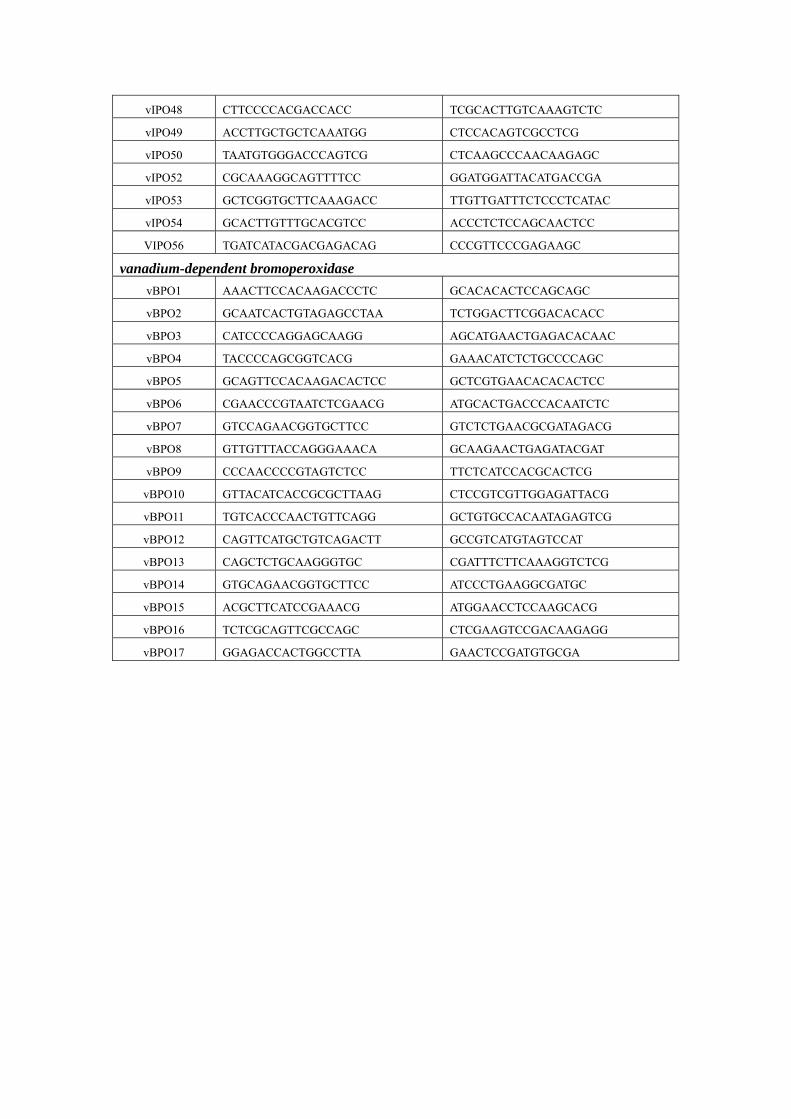
Supplementary Table 4. Primers for real-time PCR of vHPO in S. japonica
Target Forward Reverse beta tubulin
Tublin AGGTGGACGAGCAGATGC GAGGCCCTTAGGAGGTACG
vanadium-dependent iodoperoxidase
vIPO2 GCAAACGACCTTCCAAAC CGTTTCACCGTGTCCTCC
vIPO5 CATCTCACCCGTCGTACC GAAGCCCTTCTCCAGTCC
vIPO6 CGGCAAACGACCTTCG TATCCTCCCTTTCCATCTCC
vIPO8 ACCAACTCATCCGTCGTAC AACACGGGGTCATTGAAGC
vIPO9 CGCCTTAACCATCCCTAGC ACTGGGAGAAAGGTACGTC
vIPO10 GGCCAGACGATCAGACTCG GGTCAGCTCCCATGAACG
vIPO14 CTTTTCACCGGAGCAAGC CGAATTACTGCTCTCCAAGG
vIPO16 CCTTGACGAGGGACGTACC TGTTCATATCGGCGAAACC
vIPO17 TTCTCATCGAGGAAGGAGC CCTCATAACATGCGACACG
vIPO18 ATTTTCACCGGAGCAAGC AAAGACTGCCCTCCAAGG
vIPO19 AAGGATTTCACTCTGGACTC GTATGAAGAGCCATTCGTC
vIPO21 GGCACGACTGATCAAACG CTGGGAGAAAGGTACGTCC
vIPO22 GGAAGACCCGGTGAAGC AGAATCAGGGCAGCACG
vIPO23 AGGAAGTCTCGGAGCTGC CATTCATGGTCGTCCAGG
vIPO24 ATTCAACGGCCCCTACC CCCAGAATCCTCATGACG
vIPO25 CATCCACAACGTCCTACTC CTACCCTCTCCAGCAATTCC
vIPO26 TTTCAACGGCCCCTACC GCGCTCCCCAGAATCC
vIPO28 GGAACCATCCACAACATCC CCACCTTGCTGAACAATAGG
vIPO29 ATGCCATAACCATCCCTGC GGCCATCCAGTACACCTCC
vIPO30 CTGATCCTGATCGAGCAAG GGAGATGCCGTAGTTGACG
vIPO31 CGACTCACCCATCGTACC TCCAGCCCAACAAGAGC
vIPO32 GGAGCTATCGGGGAATCG CAGAGCACTGCCGTCTAAGG
vIPO33 AAGGGATGTGCCTTTCAAC CCCATTCATGTTAGCGAAAC
vIPO34 AAGGCGACTTTGACAAGTG CAACGGCGAGACCTCC
vIPO35 CGACAAGAAATGCAGCTCG CAGAACCCTGTACTGCCAGC
vIPO36 ATCCCACCCGTCGTACC TCGTTGAAGCATTCGAACC
vIPO37 TCCTATACGGCAACCTCG CCTAGACCTCCTGCAAGTCC
vIPO38 GCCAAGCAGACTACCTACA TTCTCGTCGTCGTCCTCC
vIPO39 GCAGACGACCTTCAAAACC GCTTCTCCGAGTCCTCAGC
vIPO40 CCACAGTCCCAACTGTTCC GTCACCGTCAACGAGTCC
vIPO41 GGTAAACAGCTTCGCAAAC GTTGAAAGGCACATCTCTCG
vIPO42 CCTTGACGAGGGATGTACC GTTCATGTTGGCGAAACC
vIPO44 TTCGTAAACGACAAGAAAT CCCTAAACTGACAGCTTCAG
VIPO46 CAACAAACTAGCCACCAAC CTCCCCGAGATGCAACC
vIPO47 AGGGAGAACTCAACAAAAT CTTCCTCGCTGTCGAACC
vIPO48 CTTCCCCACGACCACC TCGCACTTGTCAAAGTCTC
vIPO49 ACCTTGCTGCTCAAATGG CTCCACAGTCGCCTCG
vIPO50 TAATGTGGGACCCAGTCG CTCAAGCCCAACAAGAGC
vIPO52 CGCAAAGGCAGTTTTCC GGATGGATTACATGACCGA
vIPO53 GCTCGGTGCTTCAAAGACC TTGTTGATTTCTCCCTCATAC
vIPO54 GCACTTGTTTGCACGTCC ACCCTCTCCAGCAACTCC
VIPO56 TGATCATACGACGAGACAG CCCGTTCCCGAGAAGC
vanadium-dependent bromoperoxidase
vBPO1 AAACTTCCACAAGACCCTC GCACACACTCCAGCAGC
vBPO2 GCAATCACTGTAGAGCCTAA TCTGGACTTCGGACACACC
vBPO3 CATCCCCAGGAGCAAGG AGCATGAACTGAGACACAAC
vBPO4 TACCCCAGCGGTCACG GAAACATCTCTGCCCCAGC
vBPO5 GCAGTTCCACAAGACACTCC GCTCGTGAACACACACTCC
vBPO6 CGAACCCGTAATCTCGAACG ATGCACTGACCCACAATCTC
vBPO7 GTCCAGAACGGTGCTTCC GTCTCTGAACGCGATAGACG
vBPO8 GTTGTTTACCAGGGAAACA GCAAGAACTGAGATACGAT
vBPO9 CCCAACCCCGTAGTCTCC TTCTCATCCACGCACTCG
vBPO10 GTTACATCACCGCGCTTAAG CTCCGTCGTTGGAGATTACG
vBPO11 TGTCACCCAACTGTTCAGG GCTGTGCCACAATAGAGTCG
vBPO12 CAGTTCATGCTGTCAGACTT GCCGTCATGTAGTCCAT
vBPO13 CAGCTCTGCAAGGGTGC CGATTTCTTCAAAGGTCTCG
vBPO14 GTGCAGAACGGTGCTTCC ATCCCTGAAGGCGATGC
vBPO15 ACGCTTCATCCGAAACG ATGGAACCTCCAAGCACG
vBPO16 TCTCGCAGTTCGCCAGC CTCGAAGTCCGACAAGAGG
vBPO17 GGAGACCACTGGCCTTA GAACTCCGATGTGCGA

Supplementary Table 5. Sequences used for GDP-mannose 6-dehydrogenase phylogenetic analysis
Abbreviation Accession Number
Aureococcus anophagefferens XP_009034949.1
Arabidopsis thaliana AAU90084.1
Blastopirellula marina WP_002650323.1
Chlamydomonas reinhardtii01 BAF46285.1
Chlamydomonas reinhardtii02 XP_001698004.1
Chlamydomonas reinhardtii03 XP_001692910.1
Chondrus crispus XP_005712525.1
Coccomyxa subellipsoidea01 XP_005646910.1
Coccomyxa subellipsoidea02 XP_005648704.1
Cyanidioschyzon merolae01 XP_005539438.1
Cyanidioschyzon merolae02 XP_005535140.1
Frankia sp. EuI1c YP_004014117.1
Fibrobacter succinogenes YP_003249048.1
Galdieria sulphuraria XP_005707347.1
Nannochloropsis gaditana01 EWM24612.1
Nannochloropsis gaditana02 EWM24612.1
Paenibacillus curdlanolyticus WP_006037536.1
Physcomitrella patens EDQ52629.1
Phytophthora infestans EEY67959.1
Prochlorococcus marinus NP_895730.1
Pyropia yezoensis contig_28523_g7013
Thalassiosira pseudonana01 XP_002293725.1
Thalassiosira pseudonana02 XP_002286770.1
Volvox carteri01 EFJ41942.1
Volvox carteri02 EFJ52903.1
Volvox carteri03 EFJ45696.1

Supplementary Table 6. Census of glycoside hydrolases (GH) and
glycosyltransferases (GT) in Saccharina japonica
family genes family genes family genes
GH1 1 GT1 3 GT47 14
GH2 3 GT2 24 GT48 2
GH3 1 GT4 13 GT49 1
GH5 2 GT7 1 GT50 1
GH10 1 GT8 5 GT57 2
GH13 1 GT10 2 GT58 1
GH16 3 GT13 1 GT60 1
GH17 2 GT14 1 GT64 3
GH18 1 GT20 4 GT68 2
GH30 1 GT22 2 GT74 1
GH37 1 GT23 17 GT76 1
GH47 2 GT25 1 GT77 11
GH81 53 GT27 1 GT90 1
GH85 1 GT28 4 GT92 2
GH88 1 GT31 4
GH114 7 GT34 1
GH128 1 GT41 4
total 82 total 131
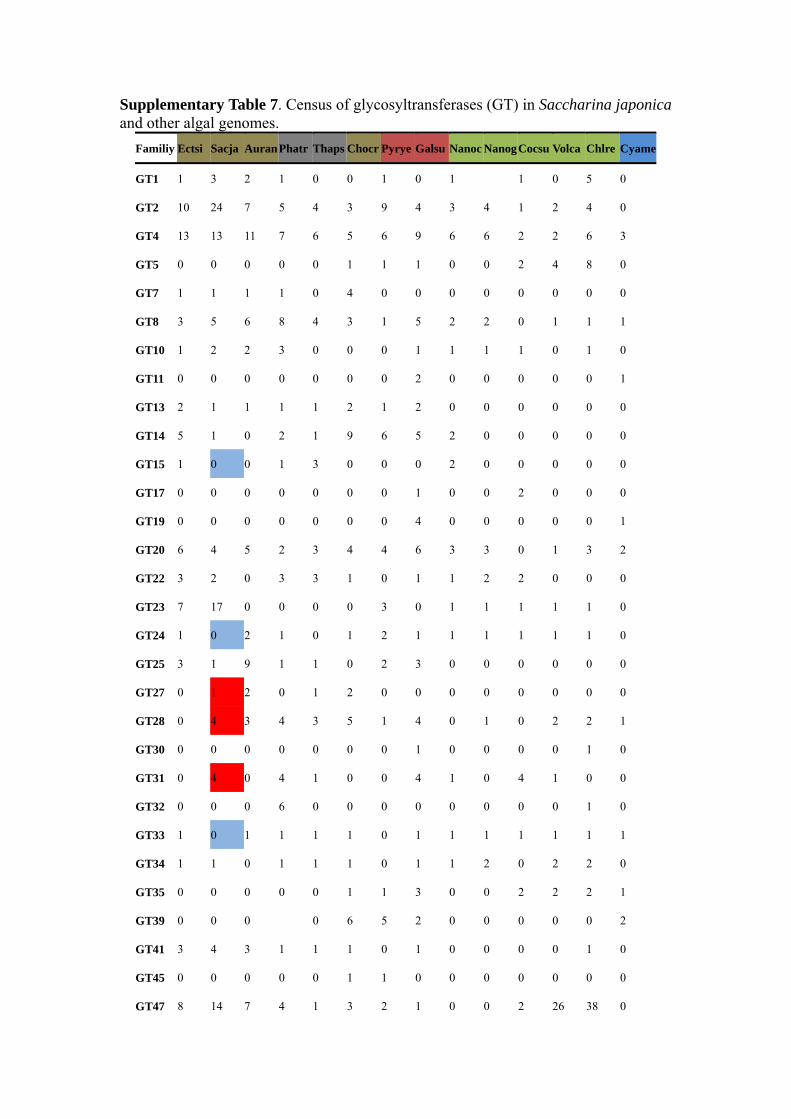
Supplementary Table 7. Census of glycosyltransferases (GT) in Saccharina japonica and other algal genomes.
Familiy Ectsi Sacja Auran Phatr Thaps Chocr Pyrye Galsu Nanoc NanogCocsu Volca Chlre Cyame
GT1 1 3 2 1 0 0 1 0 1 1 0 5 0
GT2 10 24 7 5 4 3 9 4 3 4 1 2 4 0
GT4 13 13 11 7 6 5 6 9 6 6 2 2 6 3
GT5 0 0 0 0 0 1 1 1 0 0 2 4 8 0
GT7 1 1 1 1 0 4 0 0 0 0 0 0 0 0
GT8 3 5 6 8 4 3 1 5 2 2 0 1 1 1
GT10 1 2 2 3 0 0 0 1 1 1 1 0 1 0
GT11 0 0 0 0 0 0 0 2 0 0 0 0 0 1
GT13 2 1 1 1 1 2 1 2 0 0 0 0 0 0
GT14 5 1 0 2 1 9 6 5 2 0 0 0 0 0
GT15 1 0 0 1 3 0 0 0 2 0 0 0 0 0
GT17 0 0 0 0 0 0 0 1 0 0 2 0 0 0
GT19 0 0 0 0 0 0 0 4 0 0 0 0 0 1
GT20 6 4 5 2 3 4 4 6 3 3 0 1 3 2
GT22 3 2 0 3 3 1 0 1 1 2 2 0 0 0
GT23 7 17 0 0 0 0 3 0 1 1 1 1 1 0
GT24 1 0 2 1 0 1 2 1 1 1 1 1 1 0
GT25 3 1 9 1 1 0 2 3 0 0 0 0 0 0
GT27 0 1 2 0 1 2 0 0 0 0 0 0 0 0
GT28 0 4 3 4 3 5 1 4 0 1 0 2 2 1
GT30 0 0 0 0 0 0 0 1 0 0 0 0 1 0
GT31 0 4 0 4 1 0 0 4 1 0 4 1 0 0
GT32 0 0 0 6 0 0 0 0 0 0 0 0 1 0
GT33 1 0 1 1 1 1 0 1 1 1 1 1 1 1
GT34 1 1 0 1 1 1 0 1 1 2 0 2 2 0
GT35 0 0 0 0 0 1 1 3 0 0 2 2 2 1
GT39 0 0 0 0 6 5 2 0 0 0 0 0 2
GT41 3 4 3 1 1 1 0 1 0 0 0 0 1 0
GT45 0 0 0 0 0 1 1 0 0 0 0 0 0 0
GT47 8 14 7 4 1 3 2 1 0 0 2 26 38 0

GT48 3 2 2 1 1 0 0 0 1 1 0 4 7 0
GT49 3 1 2 6 2 0 0 1 1 2 0 8 4 1
GT50 1 1 1 1 1 0 0 0 0 1 0 1 0 0
GT54 1 0 0 0 0 0 0 0 0 0 0 0 0 0
GT57 2 2 1 2 2 2 0 2 1 1 0 2 2 1
GT58 1 1 1 1 1 1 0 1 0 0 0 0 0 0
GT59 1 0 0 0 0 2 0 1 1 1 1 1 1 0
GT60 3 1 4 5 8 0 0 0 5 4 2 1 3 0
GT62 0 0 2 0 0 0 0 0 0 0 0 0 0 0
GT64 2 3 0 3 2 2 0 3 2 0 0 0 1 0
GT65 1 0 0 0 0 0 0 0 0 0 0 0 0 0
GT66 1 0 0 2 2 1 1 0 0 0 1 2 2 1
GT68 0 2 1 2 6 0 0 0 0 1 0 0 0 0
GT69 0 0 1 0 0 0 0 5 2 1 0 2 0 1
GT71 0 0 0 0 0 0 0 0 4 1 2 1 4 2
GT74 1 1 0 0 1 0 0 0 0 0 0 0 0 0
GT75 0 0 3 0 0 0 0 0 0 0 1 3 1 0
GT76 1 1 0 0 0 0 0 0 0 0 0 0 1 0
GT77 1 11 6 7 5 5 4 2 3 1 2 13 16 2
GT78 0 0 0 0 0 1 0 0 2 0 0 0 0 0
GT83 0 0 0 0 0 0 0 1 0 0 0 0 0 0
GT90 0 1 0 10 0 2 1 5 2 0 1 10 31 1
GT92 0 2 0 0 0 1 0 1 0 0 1 0 0 0
total 92 131 86 97 66 71 52 85 50 38 33 94 151 22
Blue boxes stand for the lack families in Saccharina compared to Ectocarpus and red boxes stand for the extra families in Saccharina compared to Ectocarpus. Nanoc=Nannochloropsis oceanica,Nanga= Nannochloropsis gaditana, Auran= Aureococcus anophagefferens, Ectsi= Ectocarpus siliculosus, Sacja= Saccharina japonica, Thaps= Thalassiosira pseudonana, Phatr= Phaeodactylum tricornutum, Chocr=Chondrus crispus, Cyame= Cyanidioschyzon merolae , Pyrye=Pyropia yezoensis, Galsu=Galdieria sulphuraria, Chlre= Chlamydomonas reinhardtii, Cocsu=Coccomyxa subellipsoidea, Volca=Volvox carteri.

Supplementary Table 8. Census of glycoside hydrolases (GH) in Saccharina
japonica and other algal genomes.
Familiy Ectsi Sacja Auran Phatr Thaps Chocr Pyrye Gals Nanoc Nanog CocsuVolca Chlre Cyame
GH1 3 1 1 1 1 0 1 0 3 3 5 3 2 0
GH2 2 3 4 0 1 2 0 1 1 1 3 0 1 0
GH3 1 1 8 3 0 0 0 0 4 4 0 0 0 0
GH5 2 2 3 5 1 1 2 0 8 8 1 1 4 0
GH6 0 0 0 0 0 2 0 0 0 0 0 0 0 0
GH8 0 0 0 0 0 0 0 0 3 2 2 0 0 0
GH9 0 0 0 0 1 0 0 0 5 5 3 3 3 0
GH10 1 1 0 1 0 0 0 0 0 0 0 2 0 0
GH13 0 1 0 0 0 5 4 9 0 0 3 7 11 6
GH14 0 0 0 0 0 1 1 5 0 0 0 2 3 1
GH15 0 0 0 0 0 0 0 3 0 0 0 0 0 0
GH16 6 3 9 6 5 3 2 0 1 1 1 2 4 0
GH17 1 2 0 0 0 0 0 0 0 1 0 0 0 0
GH18 0 1 4 2 16 0 1 0 0 1 0 1 12 0
GH19 0 0 0 0 7 0 0 0 0 0 0 0 0 0
GH20 0 0 5 2 0 0 0 0 0 0 0 0 0 0
GH27 0 0 1 0 0 0 0 1 0 0 1 0 0 0
GH28 0 0 8 3 0 0 0 0 0 0 0 0 1 0
GH29 0 0 1 3 0 0 0 0 0 0 0 0 0 0
GH30 1 1 1 1 1 0 0 2 0 0 1 0 0 0
GH31 1 0 4 1 2 2 2 6 2 2 4 0 2 5
GH32 0 0 4 0 0 0 0 0 0 0 0 3 4 0
GH33 0 0 0 0 0 0 0 0 0 0 1 0 0 0
GH35 0 0 2 1 0 2 2 7 0 0 2 0 0 1
GH36 2 0 0 0 1 3 3 1 0 0 0 0 1
GH37 1 1 1 0 0 1 0 1 2 2 0 1 1 2
GH38 1 0 1 2 1 1 0 2 1 1 0 1 1 0
GH39 0 0 1 0 0 0 0 0 0 0 0 0 0 0
GH43 0 0 2 0 1 0 0 0 0 1 0 0 0 0

GH45 0 0 3 0 0 1 0 0 0 0 0 0 0 0
GH47 5 2 5 1 4 4 1 1 2 3 4 1 0 1
GH54 0 0 5 0 0 0 0 0 0 0 0 0 0 0
GH63 1 0 0 0 0 1 0 0 0 0 0 0 0 0
GH65 0 0 0 0 0 0 0 0 1 0 0 0 0 0
GH67 0 0 2 0 0 0 0 0 0 0 0 0 0 0
GH72 0 0 0 1 0 0 0 0 0 0 0 0 0 0
GH76 0 0 1 0 0 0 0 0 0 0 0 0 0 0
GH77 0 0 0 0 0 1 1 1 0 0 0 2 2 2
GH78 0 0 3 0 4 0 0 0 1 0 0 0 0 0
GH79 0 0 2 0 0 0 0 0 1 0 0 0 0 0
GH81 18 53 1 0 0 0 0 0 1 1 0 1 3 0
GH85 1 1 0 0 0 1 1 1 0 1 0 0 1 1
GH88 6 1 0 0 0 0 0 0 0 0 0 0 0 0
GH89 0 0 0 0 0 0 0 0 0 0 1 0 0 0
GH92 0 0 2 0 0 0 0 0 0 0 0 0 0 0
GH95 1 0 2 0 0 0 0 0 0 0 0 0 0 0
GH97 0 0 0 0 0 0 1 0 0 0 0 0 0 0
GH99 0 0 2 1 0 0 0 0 0 0 0 1 1 0
GH105 0 0 2 0 0 0 0 0 0 0 0 0 0 0
GH109 0 0 0 1 4 0 4 0 0 0 0 0 0 1
GH113 0 0 0 0 0 0 4 0 0 0 0 0 0 0
GH114 0 7 0 0 0 0 0 0 0 0 0 1 2 0
GH125 0 0 0 2 1 0 0 0 0 0 0 1 1 0
GH128 0 1 0 0 0 0 0 0 0 0 1 0 0 0
total 54 82 90 37 50 31 30 43 37 37 33 33 59 21
Blue boxes stand for the lack families in Saccharina compared to Ectocarpus and red boxes stand for the extra families in Saccharina compared to Ectocarpus. Nanoc=Nannochloropsis oceanica,Nanga= Nannochloropsis gaditana, Auran= Aureococcus anophagefferens, Ectsi= Ectocarpus siliculosus, Sacja= Saccharina japonica, Thaps= Thalassiosira pseudonana, Phatr= Phaeodactylum tricornutum, Chocr=Chondrus crispus, Cyame= Cyanidioschyzon merolae , Pyrye=Pyropia yezoensis, Galsu=Galdieria sulphuraria, Chlre= Chlamydomonas reinhardtii, Cocsu=Coccomyxa subellipsoidea, Volca=Volvox carteri.

Supplementary Notes
Supplementary Note 1. Carbon storage and cell wall metabolism The analogous set of genes involved in the polysaccharide biosynthesis
metabolism pathways for mannitol, trehalose, cellulose, laminarin, alginate, sulfate fucan and sucrose in the 14 algal genomes were identified and annotated based on KEGG and previous functional classifications1, 2, 3, 4 (Supplementary Figure 12).
Mannitol is one of the most widespread sugar alcohol compounds widely found in bacteria, fungi, algae, and land plants1. It is known to be involved in osmoregulation, the storage and regeneration of reducing power, and serves as a compatible solute in both land plants and algae2. Genes involved in the mannitol cycle in Ectocarpus were obtained from a previous study3 as reference genes to search against S. japonica and the other algae genomes using BLASTp. A cutoff E-value of <10-10 was set to pare BLAST results to obtain candidate genes. All of the identified proteins were manually curated by searching against the NCBI non-redundant protein database. As shown in Supplementary Figure 12, the complete mannitol cycle was only identified in the stramenopile algae Saccharina, Ectocarpus and Nannochloropsis. One ortholog of M1PHD (55.7% identity to bacteria) and two orthologs of M1pase (>42.0% identity to bacteria), which facilitate mannitol biosynthesis, were identified in the S. japonica genome. One ortholog of M2HD (55.6% identity to bacteria) and one ortholog of FK (50.3% identity to bacteria), which facilitate mannitol hydrolysis, were identified in the S. japonica genome. Phylogenetic trees supported the HGT origin of the mannitol cycle in brown seaweeds (Supplementary Figure 13).
Laminarin is another carbon storage compound in brown algae4. Unlike land plants, brown algae do not store the carbon assimilated by photosynthesis as insoluble starch granules but instead as the soluble 1,3-β-glucan polymer (laminarin) localized to the cytosol5. Genes involved in the biosynthesis of laminarin were compared among all available algal genomes. Our results showed that laminarin could be synthesized in stramenopiles and green algae but not in red algae because the genes needed for the final two steps, a β-1,3-glucan synthase gene from the GT48 family and a KRE6-like gene belonging to the GH16 family, were not found in red algae. These two genes are likely involved in the synthesis of the β- 1,6-linked branches of laminarin4.
Alginate is a major cell wall polymer of brown algae, accounting for up to 45% of the dry weight. It is an unbranched polysaccharide initially synthesized as a β-1,4-D-mannuronic acid chain (M-alginate). The precursor for M-alginate is GDP-mannuronic acid, which is believed to be derived from a four-electron oxidation of GDP-mannose by the enzyme GMD6. The M-alginate is later modified by MC5Es, which convert single residues or large blocks of polymers from D-mannuronic acid into L-guluronic acid (G-alginate). The MC5E genes have been reported in the brown algae Laminaria digitata and E. siliculosus. Among all 14 algal genomes in our study, MC5Es were only found in Ectocarpus and S. japonica, indicating that other stramenopiles as well as red algae and green algae should not be able to synthesize alginate. The identification of 105 MC5E genes in S. japonica has exceeded the

record of 28 of these genes identified in E. siliculosus. Genetic distance analysis of MC5Es showed that 43 of these genes were on seven scaffolds and shared high sequence similarity (>85%), indicating that recent tandem duplication events occurred in MC5E evolution. Phylogenetic analysis of MC5Es and GDPs among the genomes of Ectocarpus, S. japonica and other algae suggests that putative HGT events from Actinobacteria introduced the chimeric pathway to brown algae.
Sulfated fucans are matrix polysaccharides from the cell wall of marine fucalean brown algae, consisting of an α-L-fucose backbone substituted by sulfate ester groups and branched with other monosaccharide residues7. In sulfated fucan metabolism, the E. siliculosus genome possesses two candidate pathways to metabolize GDP-fucose, which is the fucan precursor. One pathway is catalyzed by GDP-mannose 4,6-dehydratase and GDP-L-fucose synthetase, and the other is an alternative salvage pathway that is catalyzed by L-fucokinase (FK) and GDP-fucose pyrophosphorylase. Fucosyltransferases (FTs) from the glycosyltransferase (GT) families (e.g., GT10, GT23, and GT65) can be involved in the polymerization of GDP-fucose into elongating fucan chains in E. siliculosus, and polymerized polysaccharides are sulfated by specific sulfotransferases. Based on the known sulfated fucan pathway, we reconstructed the metabolic pathway for the biosynthesis and remodeling of sulfated fucans in S. japonica and the other 13 algae genomes. Red algae lack candidate genes in two pathways to metabolize GDP-fucose, indicating the absence of sulfated fucans or the existence of an alternative pathway. By comparing the genes involved in the last two steps, FTs (6 in S. japonica, 5 in E. siliculosus, and more than 3 in other algae) and sulfotransferase (24 in S. japonica, 23 in E. siliculosus, and more than 10 in other algae), brown algae showed an obvious advantage in gene numbers, consistent with the sophisticated structure of their cell wall matrix.
Supplementary Note 2. Carbohydrate-active enzymes Carbohydrate-active enzymes (CAZymes) are responsible for the breakdown,
biosynthesis or modification of glycoconjugates, oligo- and polysaccharides8. CAZymes can be subdivided into four functional classes based on their structurally related catalytic modules or functional domains: glycoside hydrolases (GHs), glycosyltransferases (GTs), polysaccharide lyases (PLs), and carbohydrate esterases (CEs). Among them, the key enzymes for the synthesis and remodeling of oligo- and polysaccharides are GHs and GTs, which are classified into more than 200 Carbohydrate-Active enZYme (CAZY) families (http://www.cazy.org/)9. To identify the CAZymes from S. japonica and distinguish the different cell wall polysaccharides in other algae, we performed CAZyme screening in S. japonica and the other 13 algal genomes (Supplementary Tables 6-8). All of the putative proteins were searched against entries in the CAZy database using the dbCAN Web server10, in which HMMer11 was used to query against a collection of custom-made HMM profiles constructed for each CAZy family. The original output was downloaded and parsed manually with the following parameters: 1) E-value <10-10; 2) identity >50%; and 3) alignment length >80 amino acids. All of the identified proteins were then manually curated.
A total of 213 putative CAZymes were identified in S. japonica (Supplementary Table 6) using the CAZy annotation pipeline. The genome of S. japonica encodes 82 genes from 17 GH families and 131 genes from 30 GT families, which represents a higher absolute number of genes than in Ectocarpus but fewer gene families (54

genes from 18 GH families and 92 genes from 32 families of GT). Gene expansion of the GT families was found in GT2, GT23, GT47 and GT77 containing 24, 17, 14 and 11 genes, respectively, in S. japonica, compared with 12, 7, 8 and 1 genes, respectively, in Ectocarpus. These four families are related to cellulose and alginate biosynthesis in brown algae, providing additional evidence for the morphological enhancement of S. japonica. Furthermore, compared with Ectocarpus, S. japonica gains several new GT families, namely GT27, GT28, GT31, GT68, GT90, and GT92, which are described as acetylglucosaminyltransferases or O-α-fucosyltransferases, but lacks other GT families, such as GT15, GT24, GT33, GT54, GT59, GT65, GT66, which each contain a single gene in each family in S. japonica.
Compared with the GH families in Ectocarpus, 4 (GH13, GH18, GH114, GH128) were newly gained and an additional 4 (GH31, GH36, GH63, GH95) were lost in S. japonica. Among them, 7 genes in GH114 were found exclusively in S. japonica. The gene expansion of GH families was found in GH81 (mainly including endo-1,3-β-glucanases). The comparison of gene numbers and families within the GH and GT family groups between the two brown algae provides additional insight into the evolution and diversification of cell wall related polysaccharides in S. japonica.
Supplementary Methods
Sample collection and gametophytes separation
The female gametophytes of 12 S. japonica species used for DNA and RNA sequencing were separated and maintained in the Yellow Sea Fisheries Research Institute Algae Culture Center, Qingdao, China. Methods for gametophyte separation are described as follows: Mature sporophylls with sporangia were collected and cleaned of epibionts and rinsed with filtered seawater. Then, the sorus was excised and maintained in darkness on moist paper towels at 10°C for 1–2 h. Zoospores were subsequently released from the sorus as soon as it was re-immersed in seawater. They were then cultured aseptically in PES medium at 10±1°C and 20 μmol photons m−2 s−1 with a 14:10 h light/dark photoperiod for two weeks. Then, male and female gametophytes were distinguished under a microscope according to size and were preserved separately at 10±1°C and 5 μmol photons m−2 s−1 with a 12:12 h light/dark photoperiod. Mature fronds of Saccharina sp. (B, E, F, G) were collected from the Pacific coast of the Russian Far East (Supplementary Table 1), and sporophytes were cultivated via gametophyte cloning technology in Rongcheng, China. Mature fronds of the late-maturing S. japonica strain W were sampled from Rongcheng, China.
DNA isolation
The DNA extraction protocol was based on the method described by Apt et al. 12
and was optimized for Saccharina. A fresh sample was ground in liquid nitrogen and then incubated in extraction buffer (100 mM Tris-HCl, pH 7.5, 2 M NaCl, 2% CTAB, 50 mM EDTA, pH 7.5, and 50 mM DTT) at 55°C for 2 hours in the presence of RNaseA. After centrifugation for 10 min at 10,000×g, the supernatant was transferred to a new tube, and one-third volume of absolute ethanol and one-ninth volume of 3 M potassium acetate (pH 4.8) was added slowly and mixed by gentle agitation. The mixture was extracted with one volume of phenol-chloroform (1:1, v/v), and then with one volume of chloroform:isoamyl alcohol (24:1, v/v). The DNA was precipitated from the supernatant by the addition of 0.8 volumes of isopropanol,

incubated at 4°C for 30 min, and then collected by centrifugation at 13,000×g for 30 min. The DNA pellet was washed with ice-cold 70% ethanol and then dissolved in an appropriate volume of nuclease-free deionized water (pH 8.0).
RNA isolation
The isolation of high-quality RNA from brown seaweed has always been problematic because of the high content of polyphenolic compounds and polysaccharides in their tissues. The protocol used for RNA extraction was based on the method developed by Bail et al.13 with some modifications. Fresh tissue was ground in liquid nitrogen and immediately incubated in the presence of extraction buffer (100 mM Tris-HCl, pH 8.0, 2 M NaCl, 20 mM EDTA, and 2% CTAB [w/v]), and then 50 mM DTT was added before extraction at a ratio of 1:10 [tissue (w)/buffer (v)]. The mixture was mixed vigorously, incubated at room temperature for 30 min, and then centrifuged for 10 min at 10,000×g. The supernatant was transferred to a new tube, and one-third volume of absolute ethanol and one-ninth volume of 3 M potassium acetate (pH 4.8) was added slowly and mixed by gentle agitation. The mixture was extracted with one volume of chloroform:isoamyl alcohol (24:1, v/v, pH 8.0) and then centrifuged at 12,000×g for 20 min. The supernatant was transferred to a new tube, and RNA was precipitated by the addition of 0.25 volumes of 12 M LiCl followed by overnight incubation at -20°C. The RNA pellet was collected by centrifugation at 14,000×g for 30 min at 4°C. DNase treatment was conducted using RNase-free DNase I (Promega) according to the manufacturer's instructions to eliminate any residual genomic DNA from the preparation. An extraction was then performed by adding phenol-chloroform (1:1, v/v). Following centrifugation, the upper phase was transferred to a fresh tube and extracted with one volume of chloroform:isoamyl alcohol (24:1, v/v). The upper phase was precipitated with 0.3 M NaAc (pH 5.5) and 75% ice-cold ethanol by incubating overnight at -20°C. The RNA pellet was recovered by centrifugation and then washed with ice-cold 70% ethanol and air-dried. Finally, the RNA pellet was dissolved in an appropriate volume of DEPC-treated water.
Determination of Iodine contents in S. japonica sporophytes
Brown algae of Laminariaceae are generally thought to be the strongest iodine accumulators among living organisms, with an average content of 1.0% (up to 5%) of dry weight. Iodine provides these algae an abundant and accessible source for potential chemical defense and antioxidative activity14.
The accumulated iodine content in adult S. japonica sporophytes was assayed by two methods. In the first method, the amount of iodine anion in a dried sample was determined by iodometry after the sample had been burnt to ash. The iodine contents of the basal blades, middle blades and distal blades were 0.26%, 0.66%, 1.34% of dry weight, respectively (Supplementary Figure 11). In the second method, the amount of iodine was determined by scanning electron microscopy (SEM) analyses. Sporophytes of S. japonica (approximately 1 m in length) were rapidly washed in deionized water. Tissue samples were taken from the holdfast, stipe, basal blades, middle blades, and distal blades. Cross-sections and surface parts were cut using a scalpel, immediately cryofixed in liquid nitrogen-chilled isopentane and freeze-dried in a cryostat at -50°C for 5 h15. Ten elements [oxygen (O), sodium (Na), magnesium (Mg), sulfur (S), chlorine (Cl), potassium (K), calcium (Ca), bromine (Br), rhodium (Rh), antimony (Sb), and iodine (I)] were determined by X-ray analysis using SEM

with energy-dispersive spectrometry. The energy levels of the peaks in these spectra provide qualitative data on the elements existence in the sample. The peak amplitudes also provide quantitative data in terms of the percentage concentration of each element. The percentage concentration of iodine was determined at four parts: holdfast and stipe (0.05%), basal blades (0.03%), middle blades (0.06%) and distal blades (0.35%) (Supplementary Figure 12). Overall, the variation tendency in the iodine contents in different parts of adult sporophytes was similar between the two methods, and distal blades contain much more iodine than other parts. These results were similar to the results in L. digitata. Additionally, plantlets of L. digitata (less than 15 cm in length) were very rich in iodine compared with adults16.
Expression analysis of identified vHPO genes in S. japonica
TranscriptionalregulationofvHPOwasshowntobeefficientforswitchingtospecialized iodine metabolism for antioxidative capacities17. The expression of vBPO and vIPO genes was investigated by real-time PCR in gametophytes, juvenile sporophytes and different tissues of adult sporophytes, including holdfast, stipe, basal blades, middle blades, and distal blades. From each RNA sample, 1 μg of RNA was reverse transcribed to cDNA using oligo(dT)18 and the Superscript™ First-Strand synthesis for RT-PCR (Invitrogen) according to the manufacturer's instructions. Primers were designed by using Primer Express TM1.0 (PE Applied Biosystems, Foster City, CA, USA) (Supplementary Table 4). The real-time PCR reactions were performed in a 96-well thermocycler (ABI StepOne Plus) with SYBR green reaction mix from TAKARA for 3 min at 95°C, followed by 40 runs of 10 sec at 95°C and 1 min at 60°C. Each sample was technically duplicated. The specificity of amplification was checked with a dissociation curve obtained by heating the samples from 65°C to 95°C. Triplicate qPCRs were performed for each sample. The 2−ΔΔCT method18 was used to analyze the quantitative real-time PCR data. Average-linkage hierarchical clustering and heat maps were generated in R Bioconductor using the heatmap.2 function (omitting row and column dendrograms) in the gplots package of the R program.
Phylogenetic analysis of GMDs and MC5Es
Homologous protein sequences were aligned with MUSCLE7. Poorly aligned regions were trimmed before the sequences were realigned. The process was repeated until no further improvements could be made. Positions with gaps were removed before construction of phylogenies. ProtTest20 was used to select the best model of protein evolution for each set of proteins. Maximum-likelihood trees were constructed using PhyML v3.021 under the following parameters: 100 bootstrap replicates; a four-category gamma distribution; and the proportion of the variable sites was estimated from the data.
Identification of candidate selective genes
Homozygous SNVs from 9 wild individuals and 8 cultivars were used to identify candidate selective regions. All of the assembled scaffolds were first concatenated and then divided into 200-kb bins. The average number of pairwise nucleotide differences, the average number of segregating sites and Tajima’s D were calculated for each bin. Bins with Z-test scores of Tajima’s D lower or higher than 5% of all bins were identified as candidate selective regions. Protein-coding genes in these selective regions were considered candidate selective genes. Thus, four selective gene groups

(cultivar-neg, cultivar-pos, wild-neg, wild-pos) were generated, which contained 828, 674, 659, and 566 genes, respectively (Supplementary Datas 4-7). Gene Ontology-based annotation of these genes was used for gene set enrichment analysis. TopGO was used to detect Gene Ontology terms and gene families enriched in each of the four groups using a hypergeometric test with Benjamini-Hochberg correction (FDR cutoff of 0.10) with the S. japonica JA annotation as the background.
Supplementary References
1. Iwamoto K, Shiraiwa Y. Salt-regulated mannitol metabolism in algae. Marine biotechnology 7, 407-415 (2005).
2. Iwamoto K, Kawanobe H, Ikawa T, Shiraiwa Y. Characterization of salt-regulated mannitol-1-phosphate dehydrogenase in the red alga Caloglossa continua. Plant physiology 133, 893-900 (2003).
3. Michel G, Tonon T, Scornet D, Cock JM, Kloareg B. Central and storage carbon metabolism of the brown alga Ectocarpus siliculosus: insights into the origin and evolution of storage carbohydrates in Eukaryotes. The New phytologist 188, 67-81 (2010).
4. Cock JM, et al. The Ectocarpus genome and the independent evolution of multicellularity in brown algae. Nature 465, 617-621 (2010).
5. Charrier B, et al. Development and physiology of the brown alga Ectocarpus siliculosus: two centuries of research. The New phytologist 177, 319-332 (2008).
6. Tenhaken R, Voglas E, Cock JM, Neu V, Huber CG. Characterization of GDP-mannose dehydrogenase from the brown alga Ectocarpus siliculosus providing the precursor for the alginate polymer. The Journal of biological chemistry 286, 16707-16715 (2011).
7. Barbeyron T, L'Haridon S, Michel G, Czjzek M. Mariniflexile fucanivorans sp. nov., a marine member of the Flavobacteriaceae that degrades sulphated fucans from brown algae. International journal of systematic and evolutionary microbiology 58, 2107-2113 (2008).
8. Zhao Z, Liu H, Wang C, Xu JR. Comparative analysis of fungal genomes reveals different plant cell wall degrading capacity in fungi. BMC genomics 14, 274 (2013).
9. Cantarel BL, Coutinho PM, Rancurel C, Bernard T, Lombard V, Henrissat B. The Carbohydrate-Active EnZymes database (CAZy): an expert resource for Glycogenomics. Nucleic acids research 37, D233-238 (2009).
10. Yin Y, Mao X, Yang J, Chen X, Mao F, Xu Y. dbCAN: a web resource for automated carbohydrate-active enzyme annotation. Nucleic acids research 40, W445-451 (2012).
11. Eddy SR. A new generation of homology search tools based on probabilistic inference. Genome informatics International Conference on Genome Informatics 23, 205-211 (2009).
12. Apt KE, Clendennen SK, Powers DA, Grossman AR. The gene family encoding the fucoxanthin chlorophyll proteins from the brown alga Macrocystis pyrifera.

Molecular & general genetics : MGG 246, 455-464 (1995). 13. Le Bail A, et al. Normalisation genes for expression analyses in the brown alga
model Ectocarpus siliculosus. BMC molecular biology 9, 75 (2008). 14. Kupper FC, et al. Commemorating two centuries of iodine research: an
interdisciplinary overview of current research. Angewandte Chemie 50, 11598-11620 (2011).
15. Verhaeghe EF, et al. Microchemical imaging of iodine distribution in the brown alga Laminaria digitata suggests a new mechanism for its accumulation. Journal of biological inorganic chemistry : JBIC : a publication of the Society of Biological Inorganic Chemistry 13, 257-269 (2008).
16. Küpper FC, Schweigert N, Ar Gall E, Legendre JM, Vilter H, Kloareg B. Iodine uptake in Laminariales involves extracellular, haloperoxidase-mediated oxidation of iodide. Planta 207, 163-171 (1998).
17. Cosse A, Potin P, Leblanc C. Patterns of gene expression induced by oligoguluronates reveal conserved and environment-specific molecular defense responses in the brown alga Laminaria digitata. The New phytologist 182, 239-250 (2009).
18. Livak KJ, Schmittgen TD. Analysis of relative gene expression data using real-time quantitative PCR and the 2(-Delta Delta C(T)) Method. Methods 25, 402-408 (2001).
19. Edgar RC. MUSCLE: multiple sequence alignment with high accuracy and high throughput. Nucleic acids research 32, 1792-1797 (2004).
20. Abascal F, Zardoya R, Posada D. ProtTest: selection of best-fit models of protein evolution. Bioinformatics 21, 2104-2105 (2005).
21. Guindon S, Delsuc F, Dufayard J-F, Gascuel O. Estimating maximum likelihood phylogenies with PhyML. In: Bioinformatics for DNA Sequence Analysis (ed^(eds). Springer (2009).