4.4 air quality - huntington beach, california · annual arithmetic mean 0.030 ppm (57 μg/m3)...
TRANSCRIPT

City of Huntington Beach 4.4-1 May 2010
4.4 AIR QUALITY
This section focuses on potential long-term local and regional air quality impacts associated with the proposed desalination project. Section 4.9, Construction-Related Impacts, analyzes potential short-term air quality impacts associated with construction activity for the proposed project. Additionally, Section 4.12, Climate Change, analyzes impacts related to greenhouse gases and climate change. Information in this section is based on the Seawater Desalination Project at Huntington Beach – Air Quality Analysis (RBF Consulting 2010a, Appendix E to the SEIR). Refer to Appendix E, Air Quality, for the technical information used in this analysis.
Note: Due to changes in regulatory standards since 2005, information has been added to this section to better describe the regulatory framework in the State and the South Coast Air Basin (SCAB), as well as providing additional impact analysis to demonstrate compliance with existing requirements. Additionally, impacts are analyzed for both the co-located and stand-alone scenarios of the desalination facility operation.
EXISTING CONDITIONS
The proposed project is located within the SCAB. The SCAB is characterized as having a Mediterranean climate (typified as semiarid with mild winters, warm summers, and moderate rainfall). The SCAB is a 6,600-square-mile area bounded by the Pacific Ocean to the west and the San Gabriel, San Bernardino, and San Jacinto mountains to the north and east. The SCAB includes all of Orange County and the nondesert portions of Los Angeles, Riverside, and San Bernardino counties. Additionally, the South Coast Air Quality Management District (SCAQMD) jurisdiction includes the San Gorgonio Pass area of Riverside County.
The general region lies in the semipermanent, high-pressure zone of the eastern Pacific. As a result, the climate is mild and tempered by cool sea breezes. The usually mild climatological pattern is interrupted infrequently by periods of extremely hot weather, winter storms, or Santa Ana winds. The extent and severity of the air pollution problem in the SCAB is a function of the area’s natural physical characteristics (i.e., weather and topography), as well as man-made influences (i.e., development patterns and lifestyle). Factors such as wind, sunlight, temperature, humidity, rainfall, and topography all affect the accumulation and/or dispersion of pollutants throughout the SCAB.
CLIMATE
Moderate temperatures, comfortable humidity, and limited precipitation characterize the climate in the SCAB. The average annual temperature varies little throughout the SCAB, averaging 75°F. However, with a less pronounced oceanic influence, the eastern inland portions of the SCAB show greater variability in annual minimum and maximum temperatures. All portions of the SCAB have recorded temperatures over 100°F in recent years. January is usually the coldest month at all locations while July and August are usually the hottest months of the year. Although the SCAB has a semiarid climate, the air near the surface is moist because of the presence of a shallow marine layer. Except for infrequent periods when dry air is brought into the SCAB by offshore winds, the ocean effect is dominant. Periods with heavy fog are frequent, and low stratus clouds, occasionally referred to as “high fog,” are a characteristic climate feature. Annual average relative humidity is 70% at the coast and 57% in the eastern part of the SCAB. Precipitation in the SCAB is typically 9 to 14 inches annually and is rarely in the form of snow or hail, due to typically warm weather. The frequency and amount of rainfall is greater in the coastal areas of the SCAB. More specifically, the

Seawater Desalination Project at Huntington Beach 4.4 Air Quality Draft Subsequent Environmental Impact Report
City of Huntington Beach 4.4-2 May 2010
City of Huntington Beach (City) enjoys a mild climate. The greatest precipitation in the City occurs in January and February, during which time the rainfall averages 3 inches. The coolest month of the year is typically December, with an average low of 46°F. The warmest month is typically August, with an average high of 80°F (City-Data 2009).
SUNLIGHT
The presence and intensity of sunlight are necessary prerequisites for the formation of photochemical smog. Under the influence of the ultraviolet radiation of sunlight, certain "original," or “primary” pollutants (mainly reactive hydrocarbons and oxides of nitrogen) react to form “secondary” pollutants (primarily oxidants). Since this process is time dependent, secondary pollutants can be formed many miles downwind of the emission sources. Due to the prevailing daytime winds and time-delayed nature of photochemical smog, oxidant concentrations are highest in the inland areas of Southern California.
TEMPERATURE INVERSIONS
Under ideal meteorological conditions and irrespective of topography, pollutants emitted into the air would be mixed and dispersed into the upper atmosphere. However, the Southern California region frequently experiences temperature inversions in which pollutants are trapped and accumulate close to the ground. The inversion, a layer of warm, dry air overlaying cool, moist marine air, is a normal condition in the southland. The cool, damp, and hazy sea air capped by coastal clouds is heavier than the warm, clear air that acts as a lid through which the marine layer cannot rise. The height of the inversion is important in determining pollutant concentration. When the inversion is approximately 2,500 feet above sea level, the sea breezes carry the pollutants inland to escape over the mountain slopes or through the passes. At a height of 1,200 feet, the terrain prevents the pollutants from entering the upper atmosphere, resulting in a settlement in the foothill communities. Below 1,200 feet, the inversion puts a tight lid on pollutants, concentrating them in a shallow layer over the entire coastal basin. Usually, inversions are lower before sunrise than during the daylight hours. Mixing heights for inversions are lower in the summer and more persistent, being partly responsible for the high levels of ozone observed during summer months in the SCAB. Smog in Southern California is generally the result of these temperature inversions combining with coastal day winds and local mountains to contain the pollutants for long periods of time, allowing them to form secondary pollutants by reacting with sunlight. The SCAB has a limited ability to disperse these pollutants due to typically low wind speeds.
The area where the City is located offers clear skies and sunshine; however, it is still susceptible to air inversions. This traps a layer of stagnant air near the ground where it is further loaded with pollutants. These inversions cause haziness, which is caused by moisture, suspended dust, and a variety of chemical aerosols emitted by trucks, automobiles, furnaces, and other sources.
SENSITIVE RECEPTORS
Sensitive receptors are those more susceptible to the effects of air pollution than the general population. Sensitive receptors that are in proximity to localized sources of toxins and carbon monoxide (CO) are of particular concern. Land uses that are considered sensitive receptors include residences, schools, playgrounds, childcare centers, athletic facilities, long-term health care facilities, rehabilitation centers, convalescent centers, and retirement homes.
Seawater Desalination Project at Huntington Beach 4.4 Air Quality Draft Subsequent Environmental Impact Report
City of Huntington Beach 4.4-3 May 2010
REGULATORY SETTING
Regulatory oversight for air quality in the SCAB rests at the regional level with SCAQMD, the California Air Resources Board (CARB) at the state level, and the U.S. Environmental Protection Agency (EPA) Region IX office at the federal level. Applicable laws, regulations, and standards of these three agencies are described as follows.
U.S. ENVIRONMENTAL PROTECTION AGENCY
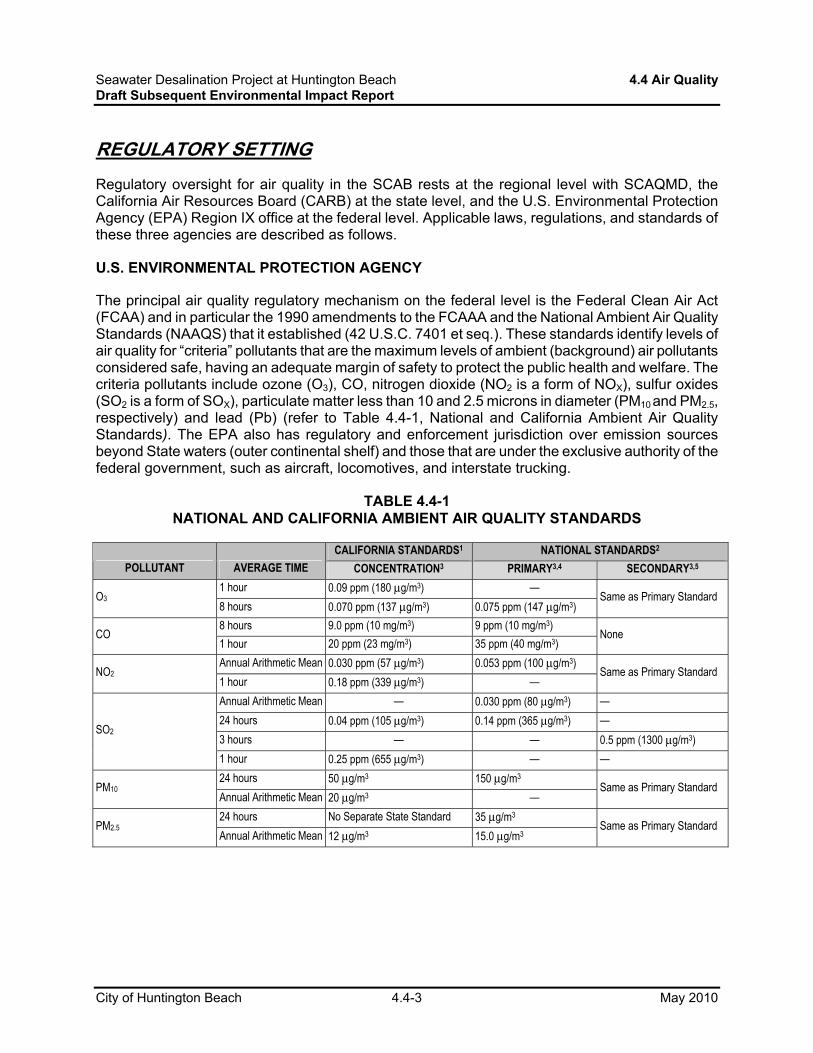
The principal air quality regulatory mechanism on the federal level is the Federal Clean Air Act (FCAA) and in particular the 1990 amendments to the FCAAA and the National Ambient Air Quality Standards (NAAQS) that it established (42 U.S.C. 7401 et seq.). These standards identify levels of air quality for “criteria” pollutants that are the maximum levels of ambient (background) air pollutants considered safe, having an adequate margin of safety to protect the public health and welfare. The criteria pollutants include ozone (O3), CO, nitrogen dioxide (NO2 is a form of NOX), sulfur oxides (SO2 is a form of SOX), particulate matter less than 10 and 2.5 microns in diameter (PM10 and PM2.5, respectively) and lead (Pb) (refer to Table 4.4-1, National and California Ambient Air Quality Standards). The EPA also has regulatory and enforcement jurisdiction over emission sources beyond State waters (outer continental shelf) and those that are under the exclusive authority of the federal government, such as aircraft, locomotives, and interstate trucking.
TABLE 4.4-1 NATIONAL AND CALIFORNIA AMBIENT AIR QUALITY STANDARDS
CALIFORNIA STANDARDS1 NATIONAL STANDARDS2
POLLUTANT AVERAGE TIME CONCENTRATION3 PRIMARY3,4 SECONDARY3,5
1 hour 0.09 ppm (180 μg/m3) — O3
8 hours 0.070 ppm (137 μg/m3) 0.075 ppm (147 μg/m3) Same as Primary Standard
8 hours 9.0 ppm (10 mg/m3) 9 ppm (10 mg/m3) CO
1 hour 20 ppm (23 mg/m3) 35 ppm (40 mg/m3) None
Annual Arithmetic Mean 0.030 ppm (57 μg/m3) 0.053 ppm (100 μg/m3) NO2
1 hour 0.18 ppm (339 μg/m3) — Same as Primary Standard
Annual Arithmetic Mean — 0.030 ppm (80 μg/m3) —
24 hours 0.04 ppm (105 μg/m3) 0.14 ppm (365 μg/m3) —
3 hours — — 0.5 ppm (1300 μg/m3) SO2
1 hour 0.25 ppm (655 μg/m3) — —
24 hours 50 μg/m3 150 μg/m3 PM10
Annual Arithmetic Mean 20 μg/m3 — Same as Primary Standard
24 hours No Separate State Standard 35 μg/m3 PM2.5
Annual Arithmetic Mean 12 μg/m3 15.0 μg/m3 Same as Primary Standard
Seawater Desalination Project at Huntington Beach 4.4 Air Quality Draft Subsequent Environmental Impact Report
TABLE 4.4-1 (CONTINUED)
City of Huntington Beach 4.4-4 May 2010
CALIFORNIA STANDARDS1 NATIONAL STANDARDS2
POLLUTANT AVERAGE TIME CONCENTRATION3 PRIMARY3,4 SECONDARY3,5
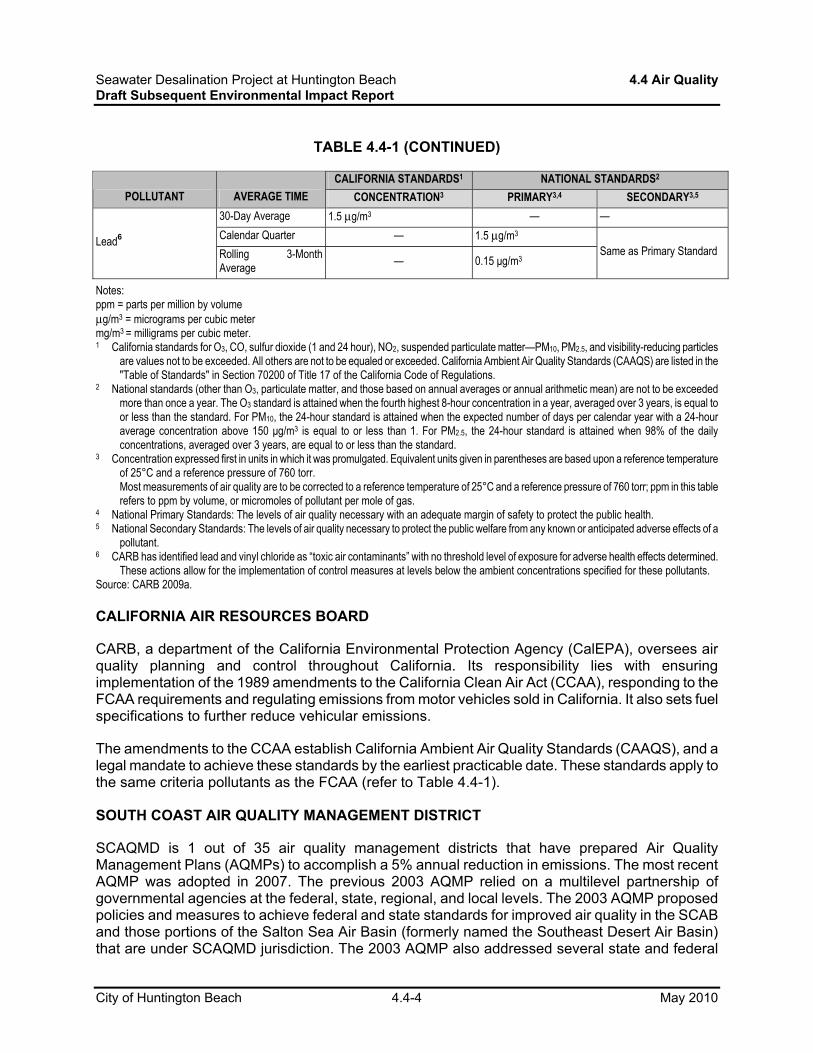
30-Day Average 1.5 μg/m3 — —
Calendar Quarter — 1.5 μg/m3 Lead6 Rolling 3-Month Average
— 0.15 μg/m3 Same as Primary Standard
Notes: ppm = parts per million by volume μg/m3 = micrograms per cubic meter mg/m3 = milligrams per cubic meter. 1 California standards for O3, CO, sulfur dioxide (1 and 24 hour), NO2, suspended particulate matter—PM10, PM2.5, and visibility-reducing particles
are values not to be exceeded. All others are not to be equaled or exceeded. California Ambient Air Quality Standards (CAAQS) are listed in the "Table of Standards" in Section 70200 of Title 17 of the California Code of Regulations.
2 National standards (other than O3, particulate matter, and those based on annual averages or annual arithmetic mean) are not to be exceeded more than once a year. The O3 standard is attained when the fourth highest 8-hour concentration in a year, averaged over 3 years, is equal to or less than the standard. For PM10, the 24-hour standard is attained when the expected number of days per calendar year with a 24-hour average concentration above 150 μg/m3 is equal to or less than 1. For PM2.5, the 24-hour standard is attained when 98% of the daily concentrations, averaged over 3 years, are equal to or less than the standard.
3 Concentration expressed first in units in which it was promulgated. Equivalent units given in parentheses are based upon a reference temperature of 25°C and a reference pressure of 760 torr. Most measurements of air quality are to be corrected to a reference temperature of 25°C and a reference pressure of 760 torr; ppm in this table refers to ppm by volume, or micromoles of pollutant per mole of gas.
4 National Primary Standards: The levels of air quality necessary with an adequate margin of safety to protect the public health. 5 National Secondary Standards: The levels of air quality necessary to protect the public welfare from any known or anticipated adverse effects of a
pollutant. 6 CARB has identified lead and vinyl chloride as “toxic air contaminants” with no threshold level of exposure for adverse health effects determined.
These actions allow for the implementation of control measures at levels below the ambient concentrations specified for these pollutants. Source: CARB 2009a.
CALIFORNIA AIR RESOURCES BOARD
CARB, a department of the California Environmental Protection Agency (CalEPA), oversees air quality planning and control throughout California. Its responsibility lies with ensuring implementation of the 1989 amendments to the California Clean Air Act (CCAA), responding to the FCAA requirements and regulating emissions from motor vehicles sold in California. It also sets fuel specifications to further reduce vehicular emissions.
The amendments to the CCAA establish California Ambient Air Quality Standards (CAAQS), and a legal mandate to achieve these standards by the earliest practicable date. These standards apply to the same criteria pollutants as the FCAA (refer to Table 4.4-1).
SOUTH COAST AIR QUALITY MANAGEMENT DISTRICT
SCAQMD is 1 out of 35 air quality management districts that have prepared Air Quality Management Plans (AQMPs) to accomplish a 5% annual reduction in emissions. The most recent AQMP was adopted in 2007. The previous 2003 AQMP relied on a multilevel partnership of governmental agencies at the federal, state, regional, and local levels. The 2003 AQMP proposed policies and measures to achieve federal and state standards for improved air quality in the SCAB and those portions of the Salton Sea Air Basin (formerly named the Southeast Desert Air Basin) that are under SCAQMD jurisdiction. The 2003 AQMP also addressed several state and federal

Seawater Desalination Project at Huntington Beach 4.4 Air Quality Draft Subsequent Environmental Impact Report
City of Huntington Beach 4.4-5 May 2010
planning requirements and incorporates significant new scientific data, primarily in the form of updated emissions inventories, ambient measurements, new meteorological episodes, and new air quality modeling tools. The 2003 AQMP is consistent with and builds upon the approaches taken in the 1997 AQMP and the 1999 Amendments to the Ozone State Implementation Plan (SIP) for the SCAB for the attainment of the federal ozone air quality standard. However, the 2003 AQMP points to the urgent need for additional emission reductions (beyond those incorporated in the 1997 and 1999 plans) to offset increased emission estimates from mobile sources and meet all federal criteria pollutant standards within the time frames allowed under the FCAA (SCAQMD 2003).
The SCAQMD governing board adopted the 2007 AQMP on June 1, 2007. The 2007 AQMP includes the same updates as the 2003 AQMP and also incorporates significant new scientific data, primarily in the form of updated emissions inventories, ambient measurements, new meteorological episodes, and new air quality modeling tools. As part of the 2007 AQMP, SCAQMD requested that EPA “bump up” the O3 nonattainment status from severe to extreme to allow additional time for the SCAB to achieve attainment of the federal standard. The additional time would provide for implementation of state and federal measures that apply to sources over which SCAQMD does not have control. The 2007 AQMP has been approved by CARB but is undergoing review by EPA.
Emissions that would result from mobile, stationary, and area sources during construction and operation of the proposed project are subject to SCAQMD rules and regulations. The SCAQMD rules applicable to the proposed project may include the following (SCAQMD 2007a):
Regulation IX – Standards for Performance for New Stationary Sources (NSPS): This regulation incorporates, by reference, the provisions of Part 60, Chapter 1, Title 40, of the Code of Federal Regulations. It requires compliance with federal Standards of Performance for industrial-commercial-institutional steam-generating units. The regulation applies to fossil-fuel-fired steam-generating units of more than 73-megawatt (MW) heat input rate.
Regulation XIII – New Source Review: This regulation sets preconstruction review requirements for new, modified, or relocated facilities to ensure that the operation of such facilities does not interfere with progress in attainment of NAAQS and that future economic growth within the SCAQMD is not unnecessarily restricted. The specific air quality goal of this regulation is to achieve no net increases from new or modified permitted sources of nonattainment air contaminants or their precursors. In addition to nonattainment air contaminants, this regulation will also limit emission increases of ammonia, and ozone-depleting compounds (ODCs) from new, modified, or relocated facilities by requiring the use of Best Available Control Technology (BACT).
Regulation XIV – Toxics and Other Noncriteria Pollutants: This regulation includes rules that regulate toxics and other noncriteria pollutants. It provides specifications for maximum individual cancer risk (MICR), cancer burden, and noncancer acute and chronic hazard index (HI) from new permit units, relocations, or modifications to existing permit units that emit toxic air contaminants (TACs). The rules establish allowable risks for permit units requiring new permits pursuant to Rules 201 or 203.
Regulation XX – Regional Clean Air Incentive Market (RECLAIM): RECLAIM is a market incentive program designed to allow facilities flexibility in achieving emission reduction requirements for NOx and SOx under the AQMP using methods that include but are not limited to add-on controls, equipment modifications, reformulated products, operational changes, shutdowns, and the purchase of excess emission reductions.

Seawater Desalination Project at Huntington Beach 4.4 Air Quality Draft Subsequent Environmental Impact Report
City of Huntington Beach 4.4-6 May 2010
Rule 201 – Permit for Construction: This rule establishes an orderly procedure for the review of new and modified sources of air pollution through the issuance of permits. Rule 201 specifies that any facility installing nonexempt equipment that causes or controls the emissions of air pollutants must first obtain a permit to construct from SCAQMD.
Rule 401 – Visible Emissions: This rule establishes the limit for visible emissions from stationary sources. This rule prohibits visible emissions dark or darker than Ringlemann No.1 for periods greater than 3 minutes in any hour.
Rule 402 – Nuisance: This rule prohibits the discharge of air pollutants from a facility that cause injury, detriment, nuisance, or annoyance to the public or damage to business or property.
Rule 403 – Fugitive Dust: This rule requires fugitive dust sources to implement best available control measures for all sources to ensure all forms of visible particulate matter are prohibited from crossing any property line. SCAQMD Rule 403 is intended to reduce PM10 emissions from any transportation, handling, construction, or storage activity that has the potential to generate fugitive dust.
Rule 431.2 – Sulfur Content of Liquid Fuels: The purpose of this rule is to limit the sulfur content in diesel and other liquid fuels for the purpose of both reducing the formation of SOx and particulates during combustion and to enable the use of add-on control devices for diesel-fueled internal combustion engines. The rule applies to all refiners, importers, and other fuel suppliers, such as distributors, marketers, and retailers, as well as to users of diesel, low-sulfur diesel, and other liquid fuels for stationary-source applications in the district. The rule also affects diesel fuel supplied for mobile-source applications.
ATTAINMENT STATUS
An area is designated as "in attainment" when it is in compliance with the NAAQS and/or CAAQS. These standards are set by the EPA or CARB for the maximum level of a given air pollutant that can exist in the outdoor air without unacceptable effects on human health or public welfare.
The criteria pollutants of primary concern that are considered in this air quality assessment include O3, NO2, CO, SO2, PM10, PM2.5, and lead (Pb). Although there are no ambient standards for volatile organic compounds (VOCs) or NOx, they are important because they are precursors to O3.
The entire SCAB is designated as a nonattainment area for both federal and state O3 standards. EPA has classified the SCAB as a “severe” nonattainment area and has mandated that the SCAB achieve attainment no later than 2021.
The SCAB is designated as an attainment area for federal CO standards.
The entire SCAB has not exceeded either federal or state standards for NO2 in the past 5 years, based on published monitoring data. It is designated as an attainment area under the federal and state standards. The state NO2 standard was revised in 2008, but new designations have not been adopted.
The entire SCAB is in attainment with both federal and state SO2 and Pb standards.

Seawater Desalination Project at Huntington Beach 4.4 Air Quality Draft Subsequent Environmental Impact Report
City of Huntington Beach 4.4-7 May 2010
The SCAB is designated as a “serious” nonattainment area for federal PM10 standards and as a nonattainment area for state PM10 standards. In regard to PM2.5 attainment status, the SCAB is designated as a nonattainment area by CARB and the EPA.
The attainment classifications for these criteria pollutants are outlined in Table 4.4-2, SCAB Attainment Classification.
TABLE 4.4-2 SCAB ATTAINMENT CLASSIFICATION
POLLUTANT AVERAGING TIME DESIGNATION/CLASSIFICATION
NATIONALA
O3 8 hour Nonattainment/severe NO2 Annual arithmetic mean Attainment CO 1 hour, 8 hour Attainment Sulfur dioxide (SO2) 24 hour, annual arithmetic mean Unclassifiable Respirable particulate matter (PM10) 24 hour Nonattainment/serious Fine particulate matter (PM2.5) 24 hour, annual arithmetic mean Nonattainment Lead (Pb) Calendar quarter Attainment STATEb
O3 1 hour, 8 hour Nonattainment1
NO2 1 hour, annual arithmetic mean Attainment2 CO 1 hour, 8 hour Attainment Sulfur dioxide (SO2) 1 hour, 24 hour Attainment Respirable particulate matter (PM10) 24 hour, annual arithmetic mean Nonattainment Fine particulate matter (PM2.5) Annual arithmetic mean Nonattainment Lead (Pb)3 30-day average Attainment Sulfates (SO4) 24 hour Attainment Hydrogen sulfide (H2S) 1 hour Unclassified Vinyl chloride3 24 hour Unclassified Visibility-reducing particles 8 hour (10:00 a.m.–6:00 p.m.) Unclassified
Notes: 1 CARB has not issued area classification based on the new state 8-hour standard. The previous classification for the 1-hour O3 standard was
"Extreme." 2 CARB has not issued area classification based on the new state 1-hour and annual standards. 3 CARB has identified Pb and vinyl chloride as TACs with no threshold level of exposure for adverse health effects determined. Sources: aEPA 2009a; bCARB 2009a.
Local Ambient Air Quality
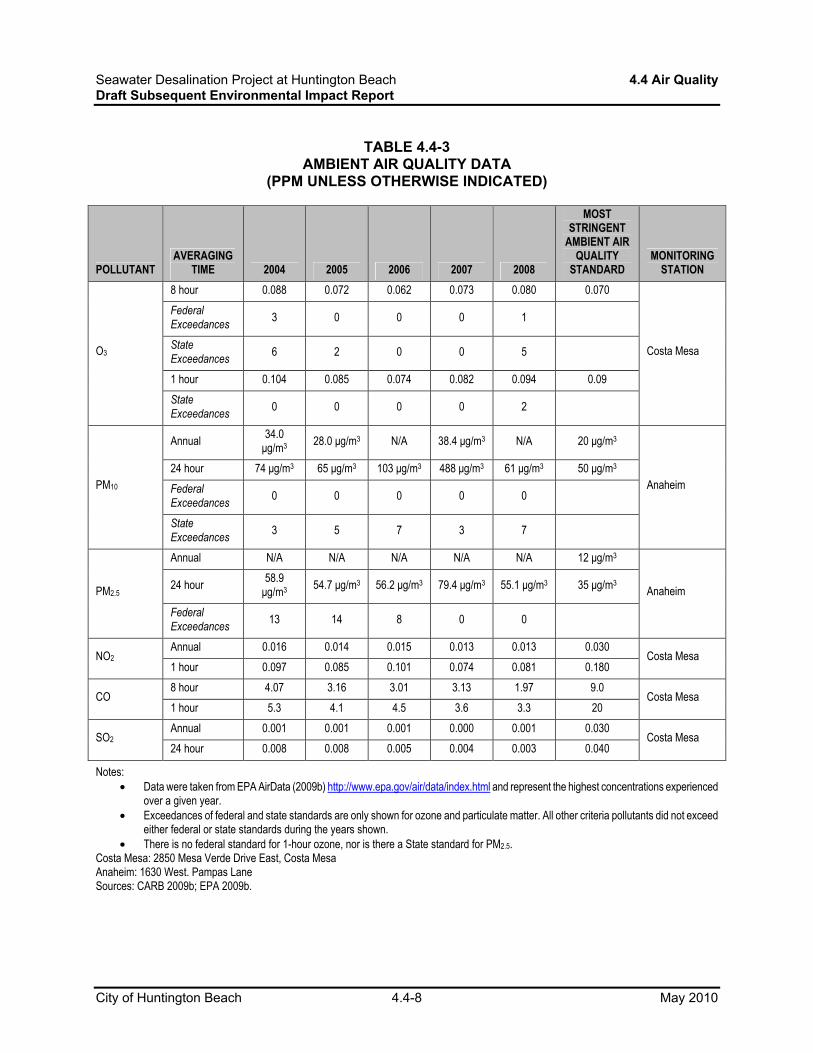
The project area’s local ambient air quality is monitored by the SCAQMD and CARB. CARB monitors ambient air quality at approximately 250 air monitoring stations across the state. Air quality monitoring stations usually measure pollutant concentrations 10 feet above ground level; therefore, air quality is often referred to in terms of ground-level concentrations. The Costa Mesa Monitoring Station, located along Mesa Verde Drive, is the nearest air monitoring station to the project area. The data collected at this station are considered representative of the air quality experienced in the project vicinity. Air quality data from 2004 through 2008 for the Costa Mesa Monitoring Station are provided in Table 4.4-3, Ambient Air Quality Data. Because PM10 and PM2.5 levels were not monitored at the Costa Mesa station, measurements were taken from the Anaheim monitoring station. The following air quality information briefly describes the various types of pollutants.
Seawater Desalination Project at Huntington Beach 4.4 Air Quality Draft Subsequent Environmental Impact Report
City of Huntington Beach 4.4-8 May 2010
TABLE 4.4-3 AMBIENT AIR QUALITY DATA
(PPM UNLESS OTHERWISE INDICATED)
POLLUTANT AVERAGING
TIME 2004 2005 2006 2007 2008
MOST STRINGENT
AMBIENT AIR QUALITY
STANDARD MONITORING
STATION
8 hour 0.088 0.072 0.062 0.073 0.080 0.070
Federal Exceedances
3 0 0 0 1
State Exceedances
6 2 0 0 5
1 hour 0.104 0.085 0.074 0.082 0.094 0.09
O3
State Exceedances
0 0 0 0 2
Costa Mesa
Annual 34.0 μg/m3
28.0 μg/m3 N/A 38.4 μg/m3 N/A 20 μg/m3
24 hour 74 μg/m3 65 μg/m3 103 μg/m3 488 μg/m3 61 μg/m3 50 μg/m3
Federal Exceedances
0 0 0 0 0 PM10
State Exceedances
3 5 7 3 7
Anaheim
Annual N/A N/A N/A N/A N/A 12 μg/m3
24 hour 58.9 μg/m3
54.7 μg/m3 56.2 μg/m3 79.4 μg/m3 55.1 μg/m3 35 μg/m3 PM2.5
Federal Exceedances
13 14 8 0 0
Anaheim
Annual 0.016 0.014 0.015 0.013 0.013 0.030 NO2
1 hour 0.097 0.085 0.101 0.074 0.081 0.180 Costa Mesa
8 hour 4.07 3.16 3.01 3.13 1.97 9.0 CO
1 hour 5.3 4.1 4.5 3.6 3.3 20 Costa Mesa
Annual 0.001 0.001 0.001 0.000 0.001 0.030 SO2
24 hour 0.008 0.008 0.005 0.004 0.003 0.040 Costa Mesa
Notes: • Data were taken from EPA AirData (2009b) http://www.epa.gov/air/data/index.html and represent the highest concentrations experienced
over a given year. • Exceedances of federal and state standards are only shown for ozone and particulate matter. All other criteria pollutants did not exceed
either federal or state standards during the years shown. • There is no federal standard for 1-hour ozone, nor is there a State standard for PM2.5.
Costa Mesa: 2850 Mesa Verde Drive East, Costa Mesa Anaheim: 1630 West. Pampas Lane Sources: CARB 2009b; EPA 2009b.

Seawater Desalination Project at Huntington Beach 4.4 Air Quality Draft Subsequent Environmental Impact Report
City of Huntington Beach 4.4-9 May 2010
Ozone
Ozone (O3) occurs in two layers of the atmosphere. The layer surrounding Earth's surface is the troposphere. The troposphere extends approximately 10 miles above ground level where it meets the second layer, the stratosphere. The stratospheric or "good" ozone layer extends upward from about 10 to 30 miles and protects life on Earth from the sun's harmful ultraviolet rays (UV-B).
“Bad” ozone is what is known as a photochemical pollutant, and it needs VOC, NOx, and sunlight to form. VOC and NOx are emitted from various sources throughout the county. To reduce bad ozone concentrations, it is necessary to control the emissions of these ozone precursors. Significant ozone formation generally requires an adequate amount of precursors in the atmosphere and several hours in a stable atmosphere with strong sunlight. High ozone concentrations can form over large regions when emissions from motor vehicles and stationary sources are carried hundreds of miles from their origins.
While ozone in the upper atmosphere protects Earth from harmful ultraviolet radiation, high concentrations of ground-level ozone can adversely affect the human respiratory system and other tissues. Many respiratory ailments, as well as cardiovascular disease, are aggravated by exposure to high ozone levels. Ozone also damages natural ecosystems, such as forests and foothill communities, and damages agricultural crops and some man-made materials, such as rubber, paint, and plastics. Societal costs from ozone damage include increased medical costs, the loss of human and animal life, accelerated replacement of industrial equipment, and reduced crop yields.
The federal 1-hour O3 standard was revoked in June 2005. The O3 state standard is 0.09 ppm averaged over 1 hour and 0.070 ppm averaged over 8 hours. The 1-hour O3 levels at the Costa Mesa monitoring station ranged from 0.104 ppm in 2004 to 0.074 ppm in 2006. The 1-hour state standard was exceeded on two days from 2004 to 2008. The 8-hour O3 levels at the Costa Mesa monitoring station ranged between 0.088 ppm in 2004 and 0.062 ppm in 2006. The 8-hour state standard was exceeded on 13 days from 2004 to 2008. The SCAB is designated as a nonattainment area for state and federal O3 standards.
Carbon Monoxide
Carbon monoxide (CO) is emitted by mobile and stationary sources as a result of incomplete combustion of hydrocarbons or other carbon-based fuels. CO is an odorless, colorless toxic gas that is formed by the incomplete combustion of fuels. In cities, automobile exhaust can cause as much as 95% of all CO emissions. At high concentrations, CO can reduce the oxygen-carrying capacity of the blood and cause headaches, dizziness, unconsciousness, and even death. It is generally associated with areas of high traffic density. State and federal standards were not exceeded between 2004 and 2008. The SCAB is designated as an attainment area for both federal and state CO standards.
Nitrogen Dioxide
Nitrogen oxides (NOx) are a family of highly reactive gases that are a primary precursor to the formation of ground-level ozone and react in the atmosphere to form acid rain. NO2, often used interchangeably with NOX, is a reddish-brown gas that can cause breathing difficulties at high levels. Peak readings of NO2 occur in areas that have a high concentration of combustion sources (e.g., motor vehicle engines, power plants, refineries, and other industrial operations) in the vicinity.

Seawater Desalination Project at Huntington Beach 4.4 Air Quality Draft Subsequent Environmental Impact Report
City of Huntington Beach 4.4-10 May 2010
NOx can irritate the lungs, cause lung damage, and lower resistance to respiratory infections such as influenza. The effects of short-term exposure are still unclear, but continued or frequent exposure to concentrations that are typically much higher than those normally found in the ambient air may cause increased incidence of acute respiratory illness in children. Health effects associated with NOX are an increase in the incidence of chronic bronchitis and lung irritation. Chronic exposure to NO2 may lead to eye and mucus membrane aggravation, along with pulmonary dysfunction.
State and federal standards were not exceeded between 2004 and 2008. The SCAB is designated as an attainment area for state and federal NO2 standards.
Particulate Matter
Particulate matter pollution consists of very small liquid and solid particles floating in the air. Some particles are large or dark enough to be seen as soot or smoke. Others are so small they can be detected only with an electron microscope. Particulate matter is a mixture of materials that can include smoke, soot, dust, salt, acids, and metals. Particulate matter also forms when gases emitted from motor vehicles and industrial sources undergo chemical reactions in the atmosphere. PM10 refers to particles less than or equal to 10 microns in aerodynamic diameter. PM2.5 refers to particles less than or equal to 2.5 microns in aerodynamic diameter and are a subset, or portion, of PM10.
PM10 and PM2.5 particles are small enough to be inhaled into and lodged in the deepest parts of the lung. Health problems begin as the body reacts to these foreign particles. Acute and chronic health effects associated with high particulate levels include the aggravation of chronic respiratory diseases, heart and lung disease, coughing, bronchitis, and respiratory illnesses in children. Recent mortality studies have shown a statistically significant direct association between mortality and daily concentrations of particulate matter in the air. Nonhealth-related effects include reduced visibility and soiling of buildings.
The state standard for PM10 is 50 micrograms per cubic meter (μg/m3) averaged over 24 hours. The state standard was exceeded on 25 days between 2004 and 2008. The federal standard for PM10 is 150 μg/m3 averaged over 24 hours. The federal standard for PM10 was not exceeded between 2004 and 2008. The SCAB is designated as a nonattainment area for federal and state PM10 standards. Based upon a desire to set clean air goals throughout the state, CARB created a new annual average standard for PM2.5 at 12 micrograms per cubic meter (μg/m3). The SCAB is currently designated as a nonattainment area for federal and state PM2.5 standards.
Sulfur Dioxide
Sulfur dioxide (SO2) is a colorless, pungent gas belonging to the family of sulfur oxide gases (SOX), formed primarily by combustion of sulfur-containing fossil fuels (primarily coal and oil) and during metal smelting and other industrial processes. SO2, often used interchangeably with sulfur oxides (SOX), did not exceed federal or state standards between 2004 and 2008. The SCAB is designated as an attainment area for both state and federal SO2 standards.
The major health concerns associated with exposure to high concentrations of SOx include effects on breathing, respiratory illness, alterations in pulmonary defenses, and aggravation of existing cardiovascular disease. Major subgroups of the population that are most sensitive to SOx include individuals with cardiovascular disease or chronic lung disease (such as bronchitis or emphysema),
Seawater Desalination Project at Huntington Beach 4.4 Air Quality Draft Subsequent Environmental Impact Report
City of Huntington Beach 4.4-11 May 2010
as well as children and the elderly. Emissions of SOx can also damage the foliage of trees and agricultural crops. Together, SOx and NOx are the major precursors to acid rain, which is associated with the acidification of lakes and streams, and accelerated corrosion of buildings and monuments. Sulfur oxides can react to form sulfates, which significantly reduce visibility.
Reactive Organic Gases and Volatile Organic Compounds
Hydrocarbons are organic gases that are formed solely of hydrogen and carbon. There are several subsets of organic gases, including VOCs and reactive organic gases (ROGs). ROGs include all hydrocarbons except those exempted by CARB. Therefore, ROGs are a set of organic gases based on state rules and regulations. VOCs are similar to ROGs in that they include all organic gases except those exempted by federal law. VOCs are, therefore, a set of organic gases based on federal rules and regulations. Both VOCs and ROGs are emitted from the incomplete combustion of hydrocarbons or other carbon-based fuels. Combustion engine exhaust, oil refineries, and oil-fueled power plants are the primary sources of hydrocarbons. Another source of hydrocarbons is evaporation from petroleum fuels, solvents, dry cleaning solutions, and paint.
The primary health effects of hydrocarbons result from the formation of ozone and its related health effects. High levels of hydrocarbons in the atmosphere can interfere with oxygen intake by reducing the amount of available oxygen through displacement. Carcinogenic forms of hydrocarbons are considered TACs, or air toxics. There are no health standards for ROGs separately.
Toxic Air Contaminants
According to Section 39655 of the California Health and Safety Code, a TAC is "an air pollutant which may cause or contribute to an increase in mortality or an increase in serious illness, or which may pose a present or potential hazard to human health." In addition, 189 substances listed as federal hazardous air pollutants (HAPs), pursuant to Section 7412 of Title 42 of the United States Code, are TACs under the state's air toxics program pursuant to Section 39657(b) of the California Health and Safety Code.
TACs can cause various cancers depending on the particular chemicals, type, and duration of exposure. Additionally, some of the TACs may cause short-term and/or long-term health effects. The 10 TACs posing the greatest health risk in California are acetaldehyde, benzene, 1-3 butadiene, carbon tetrachloride, hexavalent chromium, para-dichlorobenzene, formaldehyde, methylene chloride, perchloroethylene, and diesel particulate matter.
IMPACTS
SIGNIFICANCE CRITERIA
In accordance with CEQA, the effects of a project are evaluated to determine if they would result in a significant impact on the environment. An environmental impact report (EIR) is required to focus on these effects and offer mitigation measures to avoid or lesson any significant impacts that are identified. The criteria, or standards, used to determine the significance of impacts may vary depending on the nature of the project. According to CEQA Guidelines (14 CCR 15000 et seq.), air quality impacts resulting from implementation of the project could be considered significant if they cause any of the following to occur:

Seawater Desalination Project at Huntington Beach 4.4 Air Quality Draft Subsequent Environmental Impact Report
City of Huntington Beach 4.4-12 May 2010
• Conflict with or obstruct implementation of the applicable air quality plan
• Violate any air quality standard or contribute substantially to an existing or projected air quality violation
• Result in a cumulatively considerable net increase of any criteria pollutant for which the project region is nonattainment under an applicable federal or state ambient air quality standard (including releasing emissions that exceed quantitative thresholds for ozone precursors)
• Expose sensitive receptors to substantial pollutant concentrations
• Create objectionable odors affecting a substantial number of people.
South Coast Air Quality Management District Thresholds
Under CEQA, the SCAQMD is an expert commenting agency on air quality and related matters within its jurisdiction or impacting its jurisdiction. Under the FCAA, the SCAQMD has adopted federal attainment plans for O3 and PM10. The SCAQMD reviews projects to ensure that they would not 1) cause or contribute to any new violation of any air quality standard, 2) increase the frequency or severity of any existing violation of any air quality standard, or 3) delay timely attainment of any air quality standard or any required interim emission reductions or other milestones of any federal attainment plan.
The SCAQMD CEQA Air Quality Handbook (1993) provides significance thresholds for both construction and operation of projects within the SCAQMD jurisdictional boundaries. Exceedance of the SCAQMD thresholds could result in a potentially significant impact. However, ultimately the lead agency determines the thresholds of significance for impacts (SCAQMD 1993, p. 6-1). If the project proposes development in excess of the established thresholds, as illustrated in Table 4.4-4, SCAQMD Emission Thresholds, a significant air quality impact may occur and additional analysis would be warranted to fully assess the significance of impacts.
In addition, the significance of localized project impacts depends on whether ambient CO levels in the vicinity of the project are above or below state and federal CO standards. If the project causes an exceedance of either the state 1-hour or 8-hour CO concentrations, the project would be considered to have a significant local impact. If ambient levels already exceed a state or federal standard, then project emissions would be considered significant if they increase 1-hour CO concentrations by 1.0 ppm or more, or 8-hour CO concentrations by 0.45 ppm or more.
TABLE 4.4-4 SCAQMD EMISSIONS THRESHOLDS
POLLUTANT (LBS/DAY) PHASE ROG NOX CO SOX PM10 PM2.5
Operational 55 55 550 150 150 55
Source: SCAQMD 1993, p. 6-1.

Seawater Desalination Project at Huntington Beach 4.4 Air Quality Draft Subsequent Environmental Impact Report
City of Huntington Beach 4.4-13 May 2010
Odor-Based Thresholds
Projects emanating objectionable odors near existing sensitive receptors or other land uses where people may congregate could constitute a significant air quality impact to existing uses. Also, residential or other sensitive receptor projects built for the intent of attracting people near existing odor sources could also cause a significant air quality impact. SCAQMD suggests a threshold based on the distance of the odor source from people and complaint records for a facility or similar facility.
SHORT-TERM EMISSIONS
For a discussion of short-term air quality impacts associated with remediation, demolition, grading and construction, refer to Section 4.9, Construction-Related Impacts.
LONG-TERM EMISSIONS
The operation of the proposed project involves three primary activities that would generate air emissions. These activities are:
• Electricity generation by others for consumption to operate the project facilities and equipment
• Electricity generation by others for consumption related to pump station operations
• Mobile source emissions from employee and truck delivery operations.
Mobile sources refer to emissions from motor vehicles, including tailpipe and evaporative emissions. Depending upon the pollutant being discussed, the potential air quality impact may be of either regional or local concern. For example, ROG, NOX, and PM10 are all pollutants of regional concern (NOX and ROG react with sunlight to form O3 or photochemical smog, and PM10 is readily transported by wind currents). However, CO tends to be a localized pollutant, dispersing rapidly at the source.
As previously discussed, the SCAB is a nonattainment area for O3, PM10, and PM2.5 (federal and state). Nitrogen oxides and ROG are regulated O3 precursors (a precursor is defined as a directly emitted air contaminant that, when released into the atmosphere, forms, causes to be formed, or contributes to the formation of a secondary air contaminant for which an ambient air quality standard has been adopted).
Sources of long-term air emissions include machinery, equipment, and vehicles within the project site, as well as indirect emissions from electricity and natural gas consumption. All water pumps associated with the proposed project (including the proposed off-site underground booster pump station) would be electrically powered and would not directly generate air emissions. However, indirect impacts due to electrical consumption factors of the proposed desalination project are analyzed below. No backup electrical generators would be incorporated into the proposed project site, because backup power would be drawn from the electrical power grid and/or AES Huntington Beach Generating Station’s (HBGS's) auxiliary reserve bank.

Seawater Desalination Project at Huntington Beach 4.4 Air Quality Draft Subsequent Environmental Impact Report
City of Huntington Beach 4.4-14 May 2010
Mobile Source Emissions
Motor vehicles including potential employee and truck delivery trips associated with the project would constitute the primary source of pollutant emissions. It is anticipated that the project would result in an estimated worst-case scenario of 28 worker trips per day, traveling an estimated maximum distance of 10 miles each way, and would be the same for both the co-located and stand-alone operating conditions. In addition, truck deliveries have been anticipated to generate approximately 4 trips per day. Project-generated vehicle emissions have been estimated with the EMFAC2007 (version 2.3) emissions model. URBEMIS was not utilized for operational emissions due to the minimal amount of area source and vehicular-related activities associated with the project. Thus, the estimated long-term emissions from mobile sources would be well below the SCAQMD thresholds for CO, ROG, NOx, and PM10. Table 4.4-5, Mobile Source Emissions, illustrates the minimal impacts associated with the project. Mobile source emissions resulting from operation of the proposed desalination facility are anticipated to result in less-than-significant impacts.
TABLE 4.4-5 MOBILE SOURCE EMISSIONS – CO-LOCATED AND STAND-ALONE SCENARIOS
POLLUTANT
MOBILE SOURCE EMISSIONS
(POUNDS/DAY) SCAQMD THRESHOLDS
(POUNDS/DAY) THRESHOLD EXCEEDANCE
(YES/NO)
Carbon Monoxide (CO) 6.27 550 NO
Reactive Organic Gases (ROG) 3.22 55 NO
Nitrogen Oxides (NOx) 0.77 55 NO
Sulfur Oxides (SOx) 0.01 150 NO
Particulate Matter (PM10) 0.16 150 NO
Particulate Matter (PM2.5) 0.12 55 NO
Notes: Emissions calculated utilizing the EMFAC2007 (v2.3) model. Operational emissions calculations can be found in Appendix E, Air Quality.
Carbon Monoxide
The project is not anticipated to result in air quality impacts from CO hotspots. The project does not generate enough vehicular trips to result in a degradation of the level of service (LOS) of roadways in the site vicinity. Therefore, CO hotspots are not anticipated to result from project operations.
Electricity Consumption – Co-Located Operating Condition
The co-located scenario involves the use of 26 pumps and 6 standby pumps, which would be used for seawater intake, reverse osmosis, product water, and membrane cleaning. The proposed project would produce an average annual product water flow of 50 million gallons per day (mgd). The total power use for this plant and pumps along the primary pipeline route is projected to be 28.57 average megawatts (aMWs)1, or 690.25 MW per day. The Longest Pipeline Option would use
1 Average megawatt (aMW) is equivalent to the average number of megawatts over a specified period of time. For
example, over the course of 1 year, 1 aMW is equal to 8,760 megawatt-hours, or 24 hours x 365 days.

Seawater Desalination Project at Huntington Beach 4.4 Air Quality Draft Subsequent Environmental Impact Report
City of Huntington Beach 4.4-15 May 2010
one less off-site pump station than the Primary Pipeline Route. As a result, this alternative would result in 29.68 aMW per hour (high-efficiency design), which is 717.07 MW per day. Emissions associated with the electricity demand under the co-located scenario are indicated in Table 4.4-6, Emissions from Electricity Usage – Co-Located. Importantly, the power use incorporates production of fresh drinking water as well as conveyance and delivery of water for the distribution systems of public water agencies that would purchase water from the project. Emissions from energy consumption would not be considered part of the project’s daily emissions because power generation could occur outside of the SCAB and beyond. Additionally, as shown in Table 4.4-6, the proposed project would avoid energy usage from transport via the State Water Project and would further reduce energy consumption with green building design and on-site solar generation.
TABLE 4.4-6 EMISSIONS FROM ELECTRICITY USAGE – CO-LOCATED
BASELINE DESIGN HIGH-EFFICIENCY DESIGN1
ENERGY SOURCE aMW MWh/day aMW MWh/day
ADDITIONAL REDUCTION2 (MWH/DAY)
NET ENERGY USAGE
(MWH/DAY)
Primary Pipeline Route 33.07 793.74 28.57 690.25 483.72 206.53 Longest Pipeline Option 34.45 826.79 29.68 717.07 483.72 233.35 aMW = average megawatts; MWh/day = megawatt hours per day
Notes: 1. High-efficiency design reduces electricity usage via an energy recovery system for the treatment process. 2. Additional reductions include 450 MWh/year (1.23 MWh/day) for green building; 606 MWh/year (1.66 MWh/day) for on-site solar power generation; and 175,500 MWh/year (481 MWh/day) for avoided electricity usage associated with reductions in imported water into Southern California, as described in the Poseidon Resources, Huntington Beach Desalination Plan Energy Minimization and Greenhouse Gas Reduction Plan, revised February 23, 2010. Source: Operational emissions calculations can be found in Appendix E, Air Quality.
Emissions from a Connection to the State Electrical Grid – Co-Located Operating Condition
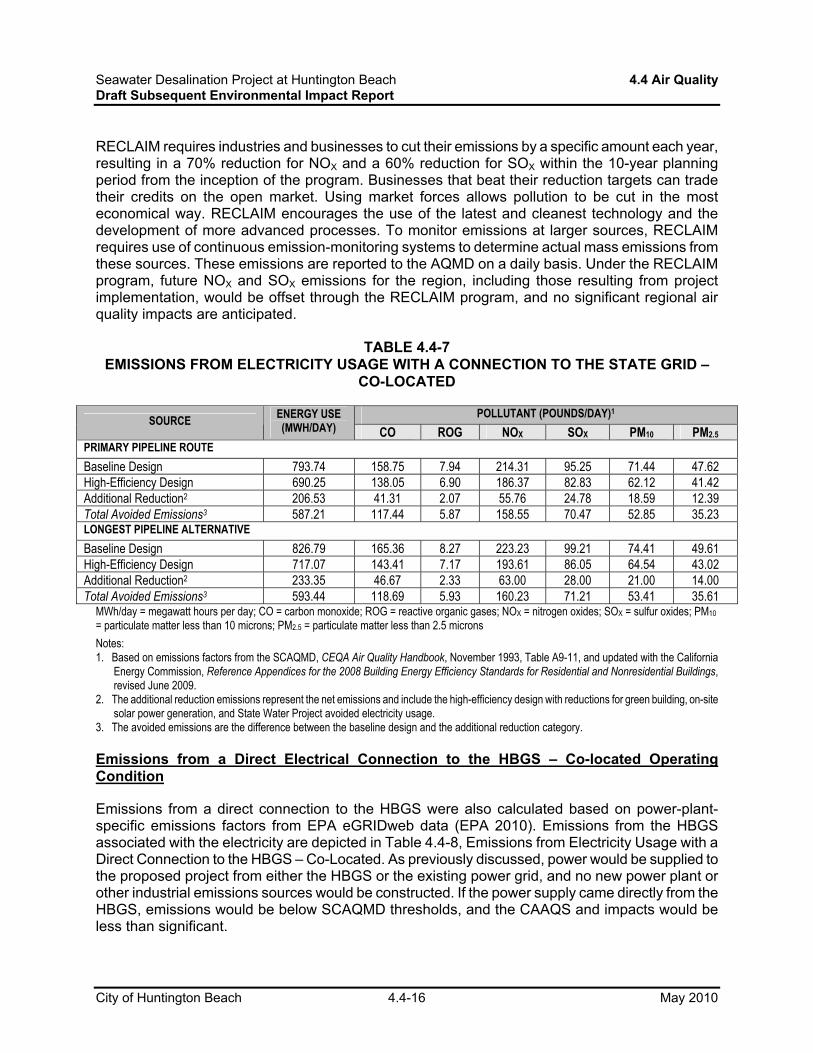
Emissions associated with the electricity demand of the proposed Collocated Operation are depicted in Table 4.4-7, Emissions from Electricity Usage with a Connection to the State Grid – Co-Located. The power use incorporates both production of fresh drinking water as well as conveyance and delivery of water for the regional distribution systems of the public water agencies that would purchase water from the project. It should be noted that emissions from energy consumption are not typically considered part of the project’s daily emissions because power generation could occur outside of the SCAB and beyond. Actual project-related emissions are not possible to attribute to any one plant, since the project’s electrical demand would be met by numerous power plants connected to a regional power supply grid, with some of those plants located outside Southern California. Additionally, emissions from power consumption are regulated by SCAQMD’s RECLAIM program (Koizumi and Garcia, pers. comm. 2010.
The RECLAIM program is California’s first air pollution cap-and-trade program, and it encompasses most of the basin’s largest NOX and SOX stationary sources. It was developed to make significant progress in cleaning up the worst air in the nation. It is a multi-industry program with each facility having annual allocations and declining balances. Developed in the early 1990s, RECLAIM was seen as an innovation compared with previous command-and-control programs. Benefits included lower costs and greater flexibility for industry participants and secured emission reductions with better emissions monitoring for environmental and community interests.
Seawater Desalination Project at Huntington Beach 4.4 Air Quality Draft Subsequent Environmental Impact Report
City of Huntington Beach 4.4-16 May 2010
RECLAIM requires industries and businesses to cut their emissions by a specific amount each year, resulting in a 70% reduction for NOX and a 60% reduction for SOX within the 10-year planning period from the inception of the program. Businesses that beat their reduction targets can trade their credits on the open market. Using market forces allows pollution to be cut in the most economical way. RECLAIM encourages the use of the latest and cleanest technology and the development of more advanced processes. To monitor emissions at larger sources, RECLAIM requires use of continuous emission-monitoring systems to determine actual mass emissions from these sources. These emissions are reported to the AQMD on a daily basis. Under the RECLAIM program, future NOX and SOX emissions for the region, including those resulting from project implementation, would be offset through the RECLAIM program, and no significant regional air quality impacts are anticipated.
TABLE 4.4-7 EMISSIONS FROM ELECTRICITY USAGE WITH A CONNECTION TO THE STATE GRID –
CO-LOCATED
POLLUTANT (POUNDS/DAY)1 SOURCE
ENERGY USE (MWH/DAY) CO ROG NOX SOX PM10 PM2.5
PRIMARY PIPELINE ROUTE
Baseline Design 793.74 158.75 7.94 214.31 95.25 71.44 47.62 High-Efficiency Design 690.25 138.05 6.90 186.37 82.83 62.12 41.42 Additional Reduction2 206.53 41.31 2.07 55.76 24.78 18.59 12.39 Total Avoided Emissions3 587.21 117.44 5.87 158.55 70.47 52.85 35.23 LONGEST PIPELINE ALTERNATIVE Baseline Design 826.79 165.36 8.27 223.23 99.21 74.41 49.61 High-Efficiency Design 717.07 143.41 7.17 193.61 86.05 64.54 43.02 Additional Reduction2 233.35 46.67 2.33 63.00 28.00 21.00 14.00 Total Avoided Emissions3 593.44 118.69 5.93 160.23 71.21 53.41 35.61
MWh/day = megawatt hours per day; CO = carbon monoxide; ROG = reactive organic gases; NOX = nitrogen oxides; SOX = sulfur oxides; PM10 = particulate matter less than 10 microns; PM2.5 = particulate matter less than 2.5 microns Notes: 1. Based on emissions factors from the SCAQMD, CEQA Air Quality Handbook, November 1993, Table A9-11, and updated with the California
Energy Commission, Reference Appendices for the 2008 Building Energy Efficiency Standards for Residential and Nonresidential Buildings, revised June 2009.
2. The additional reduction emissions represent the net emissions and include the high-efficiency design with reductions for green building, on-site solar power generation, and State Water Project avoided electricity usage.
3. The avoided emissions are the difference between the baseline design and the additional reduction category.
Emissions from a Direct Electrical Connection to the HBGS – Co-located Operating Condition
Emissions from a direct connection to the HBGS were also calculated based on power-plant-specific emissions factors from EPA eGRIDweb data (EPA 2010). Emissions from the HBGS associated with the electricity are depicted in Table 4.4-8, Emissions from Electricity Usage with a Direct Connection to the HBGS – Co-Located. As previously discussed, power would be supplied to the proposed project from either the HBGS or the existing power grid, and no new power plant or other industrial emissions sources would be constructed. If the power supply came directly from the HBGS, emissions would be below SCAQMD thresholds, and the CAAQS and impacts would be less than significant.

Seawater Desalination Project at Huntington Beach 4.4 Air Quality Draft Subsequent Environmental Impact Report
City of Huntington Beach 4.4-17 May 2010
TABLE 4.4-8 EMISSIONS FROM ELECTRICITY USAGE WITH A DIRECT CONNECTION TO THE
HBGS – CO-LOCATED
POLLUTANT (POUNDS/DAY)1 SOURCE
ENERGY USE
(MWH/DAY) CO ROG NOX SOX PM10 PM2.5
PRIMARY PIPELINE ROUTE
Baseline Design 793.74 158.75 7.94 60.32 5.16 71.44 47.62 High-Efficiency Design 690.25 138.05 6.90 52.46 4.49 62.12 41.42 Additional Reduction2 206.53 41.31 2.07 15.70 1.34 18.59 12.39 Total Avoided Emissions3 587.21 117.44 5.87 44.63 3.82 52.85 35.23 LONGEST PIPELINE ALTERNATIVE
Baseline Design 826.79 165.36 8.27 62.84 5.37 74.41 49.61 High-Efficiency Design 717.07 143.41 7.17 54.50 4.66 64.54 43.02 Additional Reduction2 233.35 46.67 2.33 17.73 1.52 21.00 14.00 Total Avoided Emissions3 593.44 118.69 5.93 45.10 3.86 53.41 35.61
MWh/day = megawatt hours per day; CO = carbon monoxide; ROG = reactive organic gases; NOX = nitrogen oxides; SOX = sulfur oxides; PM10 = particulate matter less than 10 microns; PM2.5 = particulate matter less than 2.5 microns Notes: 1. Based on emissions factors from the South Coast Air Quality Management District, CEQA Air Quality Handbook, November 1993, Table A9-11,
and updated with the California Energy Commission, Reference Appendices for the 2008 Building Energy Efficiency Standards for Residential and Nonresidential Buildings, revised June 2009, and the U.S. Environmental Protection Agency, eGRIDweb, accessed March 8, 2010 (http://cfpub.gov/egridweb).
2. The additional reduction emissions represent the net emissions and include the high-efficiency design with reductions for green building, on-site solar power generation, and State Water Project avoided electricity usage.
3. The avoided emissions are the difference between the baseline design and the additional reduction category.
Electricity Consumption – Stand-Alone Operating Condition
The stand-alone scenario involves the use of 27 pumps and 7 standby pumps on site, and 1 to 2 off-site pumps. The proposed project would produce an average of 50 mgd. However, under this scenario, the proposed project would assume responsibility for the intake of seawater through HBGS infrastructure.
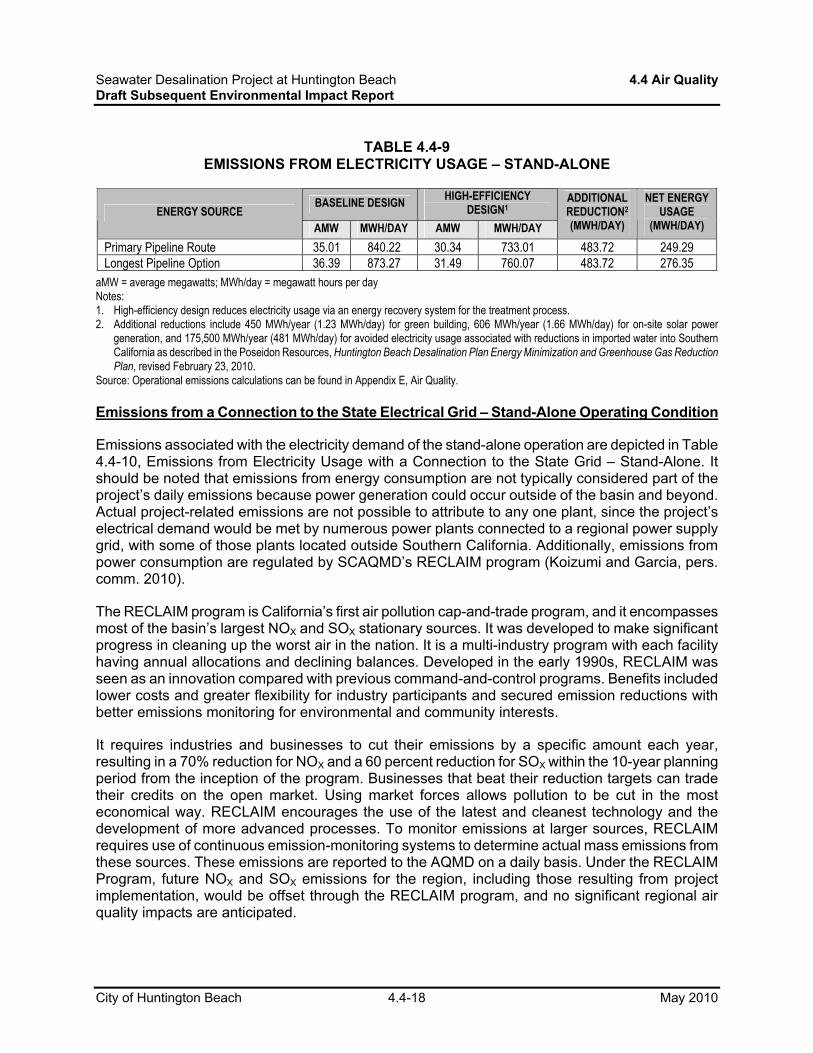
The total power use for this facility is projected to be 30.34 aMW (high-efficiency design), or 733.01 MW per day. The Longest Pipeline Option would use one less off-site pump station than the Primary Pipeline Route. As a result, this alternative would result in 31.49 aMW per hour (high-efficiency design), which is 760.07 MW per day. Emissions associated with the electricity demand under the co-located scenario are indicated in Table 4.4-9, Emissions from Electricity Usage – Stand-Alone. Additionally, as shown in Table 4.4-9, the proposed project operating in the stand-alone condition would avoid energy usage from transport via the State Water Project and would further reduce energy consumption with green building design and on-site solar generation.
Seawater Desalination Project at Huntington Beach 4.4 Air Quality Draft Subsequent Environmental Impact Report
City of Huntington Beach 4.4-18 May 2010
TABLE 4.4-9 EMISSIONS FROM ELECTRICITY USAGE – STAND-ALONE
BASELINE DESIGN HIGH-EFFICIENCY
DESIGN1 ENERGY SOURCE AMW MWH/DAY AMW MWH/DAY
ADDITIONAL REDUCTION2 (MWH/DAY)
NET ENERGY USAGE
(MWH/DAY)
Primary Pipeline Route 35.01 840.22 30.34 733.01 483.72 249.29 Longest Pipeline Option 36.39 873.27 31.49 760.07 483.72 276.35
aMW = average megawatts; MWh/day = megawatt hours per day Notes: 1. High-efficiency design reduces electricity usage via an energy recovery system for the treatment process. 2. Additional reductions include 450 MWh/year (1.23 MWh/day) for green building, 606 MWh/year (1.66 MWh/day) for on-site solar power
generation, and 175,500 MWh/year (481 MWh/day) for avoided electricity usage associated with reductions in imported water into Southern California as described in the Poseidon Resources, Huntington Beach Desalination Plan Energy Minimization and Greenhouse Gas Reduction Plan, revised February 23, 2010.
Source: Operational emissions calculations can be found in Appendix E, Air Quality.
Emissions from a Connection to the State Electrical Grid – Stand-Alone Operating Condition
Emissions associated with the electricity demand of the stand-alone operation are depicted in Table 4.4-10, Emissions from Electricity Usage with a Connection to the State Grid – Stand-Alone. It should be noted that emissions from energy consumption are not typically considered part of the project’s daily emissions because power generation could occur outside of the basin and beyond. Actual project-related emissions are not possible to attribute to any one plant, since the project’s electrical demand would be met by numerous power plants connected to a regional power supply grid, with some of those plants located outside Southern California. Additionally, emissions from power consumption are regulated by SCAQMD’s RECLAIM program (Koizumi and Garcia, pers. comm. 2010).
The RECLAIM program is California’s first air pollution cap-and-trade program, and it encompasses most of the basin’s largest NOX and SOX stationary sources. It was developed to make significant progress in cleaning up the worst air in the nation. It is a multi-industry program with each facility having annual allocations and declining balances. Developed in the early 1990s, RECLAIM was seen as an innovation compared with previous command-and-control programs. Benefits included lower costs and greater flexibility for industry participants and secured emission reductions with better emissions monitoring for environmental and community interests.
It requires industries and businesses to cut their emissions by a specific amount each year, resulting in a 70% reduction for NOX and a 60 percent reduction for SOX within the 10-year planning period from the inception of the program. Businesses that beat their reduction targets can trade their credits on the open market. Using market forces allows pollution to be cut in the most economical way. RECLAIM encourages the use of the latest and cleanest technology and the development of more advanced processes. To monitor emissions at larger sources, RECLAIM requires use of continuous emission-monitoring systems to determine actual mass emissions from these sources. These emissions are reported to the AQMD on a daily basis. Under the RECLAIM Program, future NOX and SOX emissions for the region, including those resulting from project implementation, would be offset through the RECLAIM program, and no significant regional air quality impacts are anticipated.

Seawater Desalination Project at Huntington Beach 4.4 Air Quality Draft Subsequent Environmental Impact Report
City of Huntington Beach 4.4-19 May 2010
TABLE 4.4-10 EMISSIONS FROM ELECTRICITY USAGE WITH A CONNECTION TO THE STATE GRID –
STAND-ALONE
POLLUTANT (POUNDS/DAY)1 SOURCE
ENERGY USE
(MWH/DAY) CO ROG NOX SOX PM10 PM2.5
PRIMARY PIPELINE ROUTE Baseline Design 840.22 168.04 8.40 226.86 100.83 75.62 50.41 High-Efficiency Design 733.01 146.60 7.33 197.91 87.96 65.97 43.98 Additional Reduction2 249.29 49.86 2.49 67.31 29.91 22.44 14.96 Total Avoided Emissions3 590.93 118.19 5.91 159.55 70.91 53.18 35.46 LONGEST PIPELINE OPTION Baseline Design 873.27 174.65 8.73 235.78 104.79 78.59 52.40 High-Efficiency Design 760.07 152.01 7.60 205.22 91.21 68.41 45.60 Additional Reduction2 276.35 55.27 2.76 74.61 33.16 24.87 16.58 Total Avoided Emissions3 596.92 119.38 5.97 161.17 71.63 53.72 35.82
MWh/day = megawatt hours per day; CO = carbon monoxide; ROG = reactive organic gases; NOX = nitrogen oxides; SOX = sulfur oxides; PM10 = particulate matter less than 10 microns; PM2.5 = particulate matter less than 2.5 microns Notes: 1. Based on emissions factors from the South Coast Air Quality Management District, CEQA Air Quality Handbook, November 1993, Table A9-11,
and updated with the California Energy Commission, Reference Appendices for the 2008 Building Energy Efficiency Standards for Residential and Nonresidential Buildings, revised June 2009.
2. The additional reduction emissions represent the net emissions and include the high-efficiency design with reductions for green building, on-site solar power generation, and State Water Project avoided electricity usage.
3. The avoided emissions are the difference between the baseline design and the additional reduction category.
Emissions from a Direct Electrical Connection to the HBGS – Stand-Alone Operating Condition
Emissions from a direct connection to the HBGS were also calculated based on power-plant-specific emissions factors from EPA eGRIDweb data (EPA 2010). Emissions from the HBGS associated with the electricity are depicted in Table 4.4-11, Emissions from Electricity Usage with a Direct Connection to the HBGS – Stand-Alone. If the power supply came directly from the HBGS, emissions would be below SCAQMD thresholds, and the CAAQS and impacts would be less than significant.

Seawater Desalination Project at Huntington Beach 4.4 Air Quality Draft Subsequent Environmental Impact Report
City of Huntington Beach 4.4-20 May 2010
TABLE 4.4-11 EMISSIONS FROM ELECTRICITY USAGE WITH A DIRECT CONNECTION TO THE HBGS –
STAND-ALONE
POLLUTANT (POUNDS/DAY)1 SOURCE
ENERGY USE
(MWH/DAY) CO ROG NOX SOX PM10 PM2.5
PRIMARY PIPELINE ROUTE
Baseline Design 840.22 168.04 8.40 63.86 5.46 75.62 50.41 High-Efficiency Design 733.01 146.60 7.33 55.71 4.76 65.97 43.98 Additional Reduction2 249.29 49.86 2.49 18.95 1.62 22.44 14.96 Total Avoided Emissions3 590.93 118.19 5.91 44.91 3.84 53.18 35.46 LONGEST PIPELINE OPTION
Baseline Design 873.27 174.65 8.73 66.37 5.68 78.59 52.40 High-Efficiency Design 760.07 152.01 7.60 57.77 4.94 68.41 45.60 Additional Reduction2 276.35 55.27 2.76 21.00 1.80 24.87 16.58 Total Avoided Emissions3 596.92 119.38 5.97 45.37 3.88 53.72 35.82
MWh/day = megawatt hours per day; CO = carbon monoxide; ROG = reactive organic gases; NOX = nitrogen oxides; SOX = sulfur oxides; PM10 = particulate matter less than 10 microns; PM2.5 = particulate matter less than 2.5 microns Notes: 1. Based on emissions factors from the South Coast Air Quality Management District, CEQA Air Quality Handbook, November 1993, Table A9-11,
and updated with the California Energy Commission, Reference Appendices for the 2008 Building Energy Efficiency Standards for Residential and Nonresidential Buildings, revised June 2009, and the U.S. Environmental Protection Agency, eGRIDweb, accessed March 8, 2010 (http://cfpub.gov/egridweb).
2. The additional reduction emissions represent the net emissions and include the high-efficiency design with reductions for green building, on-site solar power generation, and State Water Project avoided electricity usage.
3. The avoided emissions are the difference between the baseline design and the additional reduction category.
Chemical Storage Facilities
Various chemicals typically associated with desalination facilities would be stored on site. These chemicals include sodium hypochlorite, ammonia, lime, carbon dioxide, ferric sulfate, polymer, fluoride, sulfuric acid, sodium bi-sulfite, sodium hydroxide, scale inhibitor, and the reverse osmosis membrane-cleaning solution. All chemicals would be stored, handled, and used in accordance with all applicable federal, state, and local standards. These chemicals are food-grade purity compounds typically used in most conventional water treatment facilities. The seawater desalination facility would use the same type and grade of chemicals as any other conventional surface water treatment facility. However, the seawater desalination facility would use fewer chemicals of lower dosages than existing conventional water treatment facilities in Southern California. Chemical storage and the use of chemicals during the desalination process are not anticipated to have significant impacts to air quality in the region. In addition, based on the types of chemicals stored on site and their containment methods, odors are unlikely to emanate from the project site.
Furthermore, the project does not involve any odor-generating sources and is not classified as an odor-generating process (SCAQMD 1993); therefore, the project would not create objectionable odors affecting a substantial number of people.
Seawater Desalination Project at Huntington Beach 4.4 Air Quality Draft Subsequent Environmental Impact Report
City of Huntington Beach 4.4-21 May 2010
Visibility
A visibility analysis of the project’s gaseous emissions is required under the federal Prevention of Significant Deterioration (PSD) permitting program. The analysis addresses the contributions of gaseous emissions (primarily NOx and PM10) to visibility impairment on the nearest Class 1 PSD areas, which are national parks and national wildlife refuges. There are no national parks or refuges in proximity to the project. The nearest Class 1 areas to the project are the Channel Islands National Park, Joshua Tree National Park, Cabrillo National Park, Santa Monica Mountains National Recreation Area, Seal Beach National Wildlife Refuge, and the Salton Sea National Wildlife Refuge (National Park Service 2009). Considering the minimal amount of emissions generated by the operation of the proposed project, modeling was not required and therefore not conducted. Impacts would be less than significant.
Off-Site Pipelines and Underground Pump Stations
Off-site project components would include water transmission pipelines and underground booster pump stations and piping modifications to an existing pump station. The underground pump stations would convey potable water from the desalination site to the regional distribution system. The proposed pump stations would include surge tanks to protect the distribution system from sudden pressure changes, telemetry equipment, flow meters, appurtenances, and diesel-powered electrical generators for emergency backup equipment. The diesel-powered backup generators would be Caterpillar model 3516 units or similar equipment and would supply approximately 7 MW of emergency power for adequate operation of the pump station (in regard to flow and pressure). The largest diesel-powered generator, located on the OC-44 booster station, would require an 8,700-gallon diesel fuel storage tank (assuming a 24-hour emergency period).
All internal combustion engines (ICEs) greater than 50 brake horsepower (bhp) are required to obtain a permit to construct from SCAQMD prior to installation of the engines at the project site. NOX emissions from diesel-fired emergency engines are 200 to 600 times greater, per unit of electricity produced, than new or controlled existing central power plants fired on natural gas. Diesel-fired engines also produce significantly greater amounts of fine particulates and toxics emissions compared with natural gas-fired equipment. For generators to be considered emergency backup generators by SCAQMD, they cannot operate more than 200 hours per year and can only operate in the event of an emergency power failure or for routine testing and maintenance. Further, SCAQMD has provided a list of models of equipment as meeting all applicable air quality requirements and has issued permits to the dealer/distributor of these engines. The diesel-powered generator anticipated for the project, Caterpillar model 3516, is included on the approved list provided by the SCAQMD (2007b).
In addition to applying for a permit to construct from the SCAQMD (Rule 201), it would be necessary to apply for a Special Application for Temporary Emergency Authorization to Operate Electric Backup Generator(s) During Involuntary Power Service Interruptions Permit (SCAQMD 2004). The project would obtain all required air quality permits. Therefore, impacts associated with the operation of diesel-powered generators would be less than significant.
Pump stations as well as water transmissions lines would occasionally require maintenance, which would generate worker trips. Maintenance activities would occur at sporadic instances, and therefore, modeling would be neither required nor conducted since trip generation from such activities would not result in any significant air quality impacts. Water transmission lines would not

Seawater Desalination Project at Huntington Beach 4.4 Air Quality Draft Subsequent Environmental Impact Report
City of Huntington Beach 4.4-22 May 2010
result in criteria pollutant emissions and therefore would not have any significant impacts to air quality.
CONSISTENCY WITH REGIONAL PLANS
The purpose of the consistency finding is to determine whether a project is inconsistent with the assumptions and objectives of the regional air quality plans, and thus, whether it would interfere with the region’s ability to comply with federal and state air quality standards. If a project is inconsistent, local governments need to consider project modifications or inclusion of mitigation to eliminate the inconsistency. It is important to note that even if a project has significant operational or cumulative air quality impacts, it can still be found consistent with the regional air quality conformity under SCAQMD’s planning handbook. Therefore, it is necessary to assess the project’s consistency with the AQMP (SCAQMD 2007a) and the City of Huntington Beach General Plan (1996).
The subject site has a land use and zoning designation of Public (P). Project implementation would not conflict with the General Plan or Zoning Ordinance, nor would it propose to change any designations. As such, projects consistent with local general plans are considered consistent with air-quality-related regional plans, such as the AQMP (SCAQMD 1993, p. 12-2). Accordingly, air quality emissions and related impacts for the proposed desalination project have been locally and regionally accounted for (Nadler, pers. comm. 2002).
As indicated in SCAQMD’s CEQA Air Quality Handbook (1993), there are two main indicators of consistency:
• Whether the project would not result in an increase in the frequency or severity of existing air quality violations or cause or contribute to new violations, or delay timely attainment of air quality standards or the interim emission reductions specified in the AQMP
• Whether the project would exceed the AQMP’s assumptions for 2010 or increments based on the year of project buildout and phase.
Although the SCAQMD’s CEQA Air Quality Handbook (1993) provides significance thresholds, these thresholds are continually updated and provided on the SCAQMD website. SCAQMD provides interim information on its website to supplement the CEQA Air Quality Handbook until the revised handbook is released.
As previously stated, the AQMP is based on the City and County’s General Plan assumptions. Since the proposed desalination project is consistent with these General Plan assumptions, the project would be considered consistent with the AQMP's land use assumptions and goals.
In addition, as previously discussed, the region (Los Angeles County, Orange County, and half of Riverside County) is regulated by SCAQMD’s RECLAIM program. The RECLAIM program, implemented on January 1, 1994, controls the amount of NOx and SOx emissions through financial incentives and involves the trading of emissions credits. The RECLAIM program is designed to guarantee annual reductions in air pollution by requiring industrial and business uses (including power plants) emitting 4 tons or more per year of NOx and SOx to cut their emissions by a specific amount each year. As such, future NOx and SOx emissions for the region, including those resulting

Seawater Desalination Project at Huntington Beach 4.4 Air Quality Draft Subsequent Environmental Impact Report
City of Huntington Beach 4.4-23 May 2010
from project implementation, would be offset through the RECLAIM program, and no significant regional air quality planning impacts are anticipated (SCAQMD 2008).
The proposed project would also require review by the SCAQMD under Regulation XIII (New Source Review), which establishes preconstruction requirements for new or modified facilities to ensure that operation of such facilities does not interfere with progress toward the attainment of Ambient Air Quality Standards (AAQS) without necessarily restricting economic growth. The specific air quality goal of this regulation is to achieve a no net increase from new or modified permitted sources of nonattainment air contaminants or their precursors (SCAQMD 1979). This standard review process administered by SCAQMD would further ensure that the proposed project is consistent with regional air quality plans.
In addition, according to the Southern California Association of Governments (SCAG), the project is consistent with the Regional Comprehensive Plan (RCP). The following policies taken from the RCP (SCAG 2008) apply to the project:
Core Growth Management Policies
3.03 The timing, financing, and location of public facilities, utility systems, and transportation systems shall be used by SCAG to implement the region’s growth policies
3.18 Encourage planned development in location least likely to cause adverse environmental impact
1.11 Through the environmental document review process, ensure that plans at all levels of government (regional, air basin, county, sub-regional and local) consider air quality, land use, transportation and economic relationships to ensure consistency and minimize conflict.
As indicated above, the project is consistent with regional plans and, therefore, would result in less-than-significant impacts.
SUMMARY OF IMPACTS
No significant impacts were identified; therefore, no mitigation measures are required.
MITIGATION MEASURES
LONG-TERM EMISSIONS
None required.
CONSISTENCY WITH REGIONAL PLANS
None required.

Seawater Desalination Project at Huntington Beach 4.4 Air Quality Draft Subsequent Environmental Impact Report
City of Huntington Beach 4.4-24 May 2010
UNAVOIDABLE SIGNIFICANT IMPACTS
None have been identified.