454 pyrosequencing analysis of fungal assemblages from geographically distant, disparate soils
TRANSCRIPT

Diversity 2013, 5, 73-98; doi:10.3390/d5010073
diversity ISSN 1424-2818
www.mdpi.com/journal/diversity
Article
454 Pyrosequencing Analysis of Fungal Assemblages from
Geographically Distant, Disparate Soils Reveals Spatial
Patterning and a Core Mycobiome
Alberto Orgiazzi 1,2
, Valeria Bianciotto 2, Paola Bonfante
1,2, Stefania Daghino
1, Stefano Ghignone
2,
Alexandra Lazzari 1, Erica Lumini
2, Antonietta Mello
2, Chiara Napoli
1, Silvia Perotto
1,
Alfredo Vizzini 1, Simonetta Bagella
3, Claude Murat
4 and Mariangela Girlanda
1,*
1 Department of Life Science and Systems Biology, University of Turin, Torino 10125, Italy;
E-Mails: [email protected] (A.O.); [email protected] (P.B.);
[email protected] (S.D.); [email protected] (A.L.);
[email protected] (C.N.); [email protected] (S.P.); [email protected] (A.V.) 2 Plant Protection Institute (IPP)-Turin UOS, National Research Council (CNR), Torino 10125, Italy;
E-Mails: [email protected] (V.B.); [email protected] (S.G.); [email protected] (E.L.);
[email protected] (A.M.) 3 Department of Scienze della Natura e del Territorio, University of Sassari, Sassari 07100, Italy;
Nucleo di Ricerca sulla Desertificazione—NRD, University of Sassari, Sassari 07100, Italy;
E-Mail: [email protected] 4 INRA, UMR 1136, INRA-Nancy Université, Interactions Arbres/Microorganismes, Champenoux
54280, France; E-Mail: [email protected]
* Author to whom correspondence should be addressed; E-Mail: [email protected];
Tel.: +39-011-670-5968; Fax: +39-011-670-5962.
Received: 20 January 2013; in revised form: 5 February 2013 / Accepted: 6 February 2013 /
Published: 21 February 2013
Abstract: Identifying a soil core microbiome is crucial to appreciate the established
microbial consortium, which is not usually subjected to change and, hence, possibly
resistant/resilient to disturbances and a varying soil context. Fungi are a major part of soil
biodiversity, yet the mechanisms driving their large-scale ecological ranges and distribution
are poorly understood. The degree of fungal community overlap among 16 soil samples from
distinct ecosystems and distant geographic localities (truffle grounds, a Mediterranean
agro-silvo-pastoral system, serpentine substrates and a contaminated industrial area) was
assessed by examining the distribution of fungal ITS1 and ITS2 sequences in a dataset of 454
libraries. ITS1 and ITS2 sequences were assigned to 1,660 and 1,393 Operational
OPEN ACCESS

Diversity 2013, 5 74
Taxonomic Units (OTUs; as defined by 97% sequence similarity), respectively. Fungal
beta-diversity was found to be spatially autocorrelated. At the level of individual OTUs,
eight ITS1 and seven ITS2 OTUs were found in all soil sample groups. These ubiquitous
taxa comprised generalist fungi with oligotrophic and chitinolytic abilities, suggesting that a
stable core of fungi across the complex soil fungal assemblages is either endowed with the
capacity of sustained development in the nutrient-poor soil conditions or with the ability to
exploit organic resources (such as chitin) universally distributed in soils.
Keywords: fungal diversity; fungal communities; metabarcoding; microbiome; biogeography
1. Introduction
Uncovering a core microbiome (the suite of members shared among microbial consortia from similar
habitats) is critical to understanding the stable, consistent components across complex microbial
assemblages [1].
The hunt for the soil core microbiome is connected with explaining the patterns of beta-diversity
(differences in community composition among sites) and, hence, distribution of microorganisms across
geographically separated sites. Soils represent a huge reservoir of biodiversity (one gram of soil being
estimated to contain more than 1010
prokaryotes [2] and approximately 1,000 Gbp of microbial genome
sequences [3]). Therefore, only high-throughput and high-resolution detection methods, such as those
offered by next-generation sequencing (NGS) techniques, can adequately assist in the task of extensively
and intensively investigating patterns of distribution of microbial communities in this environment. A
number of studies taking advantage of such methods have revealed distinct biogeographical patterns in
soil bacterial diversity [4–8]. Most of the current knowledge on microbial diversity patterns in soil,
therefore, concerns bacteria, whereas the fungal communities (mycobiomes) have received little
attention. This is a serious omission, given that fungi comprise a major portion of the biodiversity and
biomass in soils and play crucial roles in maintaining soil processes, which ultimately affect the
functioning of terrestrial ecosystems [9–13].
While the early debate on the forces shaping microbial biogeography has been dominated by the
comparison between macro- and micro-organisms, the focus is now shifting to identifying the
mechanisms determining the biogeographical patterns observed [7]. Lifestyle and dispersal properties
can be critical determinants of spatial patterns [14,15]. Given their unique biological and ecological
features, fungi may therefore deviate from the relationships documented for prokaryotes. For instance,
while bacterial diversity and biomass are mainly correlated with soil pH at different spatial scales [16–20],
the latter environmental factor exerts a weaker influence on fungal community composition [21].
Although the hyphae of some fungal species are subjected to a high turnover [22], hyphae are generally
more persistent in soil than bacterial cells [23,24]. The fungal:bacterial ratio of soil communities may
change in response to physical disturbance, soil nutrient availability and moisture [25,26]. Such key
differences between fungi and bacteria have been shown to lead to distinct diversity and distribution
patterns. For instance, differences in body size between bacteria and fungi translate into different local
abundance and diversity patterns along physico-chemical gradients in soil [27]. In their comparison of

Diversity 2013, 5 75
bacterial and fungal community composition in rhizospheric and bulk soil, Hovatter and colleagues [28]
found that, in contrast to the mechanisms observed for bacteria, almost none of the variability in fungal
communities was explained by geographic coordinates or soil characteristics. Indeed, patterns in fungal
diversity profiles are often difficult to discern, due to high variability overall and low consistency
between replicate samples, e.g., [29].
However, none of the studies focusing on spatial patterns in fungal diversity carried out so far have
taken advantage of the potential of NGS techniques, relying instead on community diversity profiling
tools (e.g., DGGE, ARISA, t-RFLP). Although NGS technologies are not exempt from a number of
potential sources of bias [30], they allow to investigate microbial diversity at an unprecedented level of
resolution. By contrast, while allowing to gain information on how the dominant members of microbial
communities differ in composition across landscapes, diversity profiling techniques suffer from
inherently low levels of taxonomic discrimination [20]. Taxonomic resolution has a critical influence on
the interpretation of both biogeographic patterns and the processes driving such patterns. Indeed,
patterns observed at a given level of taxonomic discrimination might not be found at lower or higher
levels [5,7,14]. Studies on the diversity of soil fungal communities carried out so far by means of NGS
have either focused on a phylogenetically restricted set of taxa (e.g., arbuscular mycorrhizal fungi [31–34])
or have been performed on a restricted (local or regional) spatial scale (e.g., [21,35–44]). To bridge the
gap between local and wide-scale assessments, additional studies are required, encompassing greater
spatial sampling across multiple soil biomes.
To this aim, in this study, we compare the diversity of soil fungal communities (assessed by 454
pyrosequencing of both ITS1 and ITS2 sequences) at distinct localities in Italy and France, separated by
up to 760 km. At both the local and the broader (trans-regional) scale, the studied samples represented a
diverse array of soil and environmental characteristics. Our specific goals were: (1) to assess patterns of
variation of soil fungal communities on a wide spatial scale and (2) to address the occurrence of a set of
fungal OTUs (―core‖ mycobiome) shared by the disparate soils examined at the latter scale.
2. Results and Discussion
2.1. Results
2.1.1. Comparison of the Mycobiomes in the Different Soil Samples
We examined the distribution of fungal ITS1 and ITS2 sequences in a dataset of 454 libraries
assembled from a variety of soil types and distinct geographic localities ([39,41,43] and this study;
Table 1).

Diversity 2013, 5 76
Table 1. Origin of the soil samples examined.
Locality Acronym for
locality/sample Substrate Management
Dominant plant
functional type
Bioclimatic
region [45]
Biogeographical
region [46] References
Montemagno,
Piedmont, Italy WTG 1
White truffle (Tuber magnatum)
grounds —
WTG1 Alluvial natural productive area ECM/non-ECM6 Temperate Continental
WTG2 Alluvial non-productive area ECM/non-ECM Temperate Continental
WTG3 Alluvial natural productive area ECM/non-ECM Temperate Continental
Cahors,
Midi-Pyrenées,
France
BTG 2 Black truffle (Tuber
melanosporum) grounds [39]
BTG1 Limestone ―brûlé‖ (burned) area ECM/non-ECM Temperate Alpine
BTG2 Limestone non-―brûlé‖ (unburned) area ECM/non-ECM Temperate Alpine
Berchidda,
Sardinia, Italy SAR 3
Mediterranean
agro-silvo-pastoral system [43]
SAR1 Granite tilled vineyard non-ECM Mediterranean Mediterranean
SAR2 Granite covered vineyard non-ECM Mediterranean Mediterranean
SAR3 Granite managed meadow non-ECM Mediterranean Mediterranean
SAR4 Granite wooded pasture ECM/ non-ECM Mediterranean Mediterranean
SAR5 Granite cork-oak forest ECM Mediterranean Mediterranean
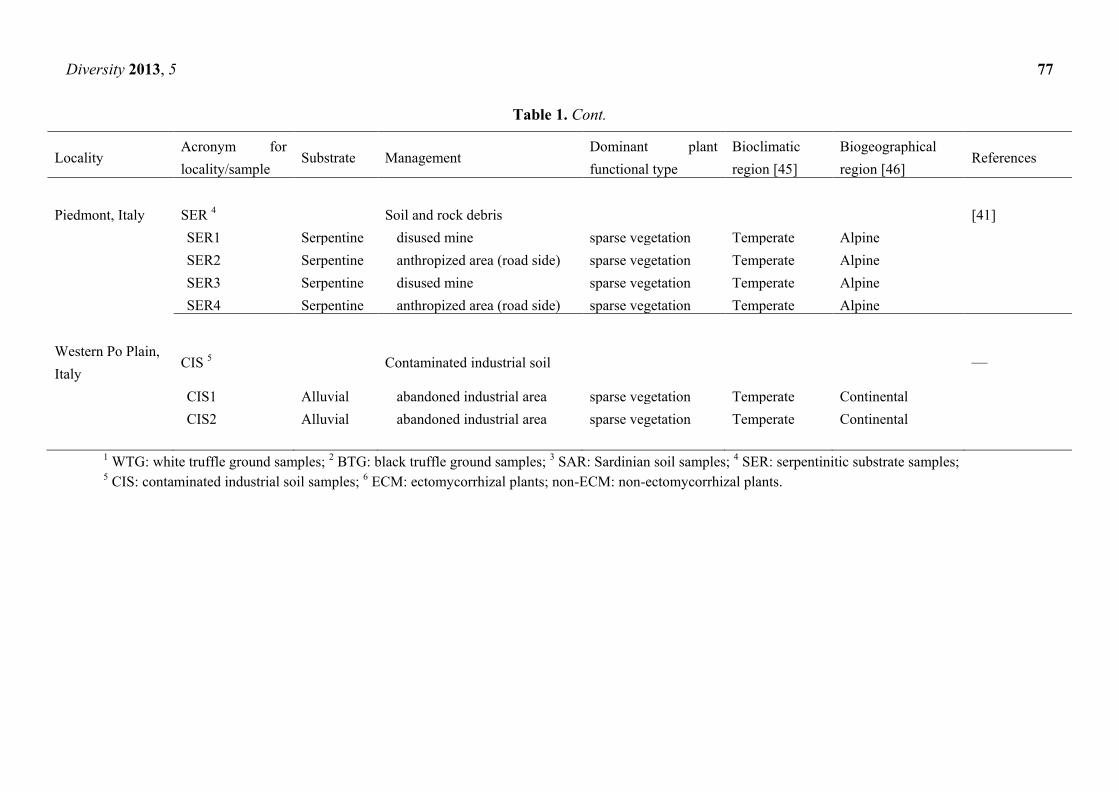
Diversity 2013, 5 77
Table 1. Cont.
Locality Acronym for
locality/sample Substrate Management
Dominant plant
functional type
Bioclimatic
region [45]
Biogeographical
region [46] References
Piedmont, Italy SER 4 Soil and rock debris [41]
SER1 Serpentine disused mine sparse vegetation Temperate Alpine
SER2 Serpentine anthropized area (road side) sparse vegetation Temperate Alpine
SER3 Serpentine disused mine sparse vegetation Temperate Alpine
SER4 Serpentine anthropized area (road side) sparse vegetation Temperate Alpine
Western Po Plain,
Italy CIS 5 Contaminated industrial soil —
CIS1 Alluvial abandoned industrial area sparse vegetation Temperate Continental
CIS2 Alluvial abandoned industrial area sparse vegetation Temperate Continental
1 WTG: white truffle ground samples; 2 BTG: black truffle ground samples; 3 SAR: Sardinian soil samples; 4 SER: serpentinitic substrate samples; 5 CIS: contaminated industrial soil samples; 6 ECM: ectomycorrhizal plants; non-ECM: non-ectomycorrhizal plants.

Diversity 2013, 5 78
Consistently with the findings by other authors [39,43], overall, a higher number of ITS1 than ITS2
sequences were obtained (32,673 and 21,667 reads, respectively). Following quality trimming,
denoising and chimera removal, 16,758 ITS1 and 11,234 ITS2 sequences were subjected to downstream
analyses (Supplementary Material 1). To account for the different sequencing depth per sample, ITS1
and ITS2 datasets were rarefied to even sequencing depth (254 and 158 ITS1 and ITS2 sequences per
sample, respectively). The resulting sequences were assigned to 1,660 ITS1 and 1,393 ITS2 fungal
Operational Taxonomic Units (OTUs), defined using a 97% sequence identity threshold (depending on
the soil sample, 63-385 and 59-338 ITS1 and ITS2 OTUs, respectively; Supplementary Material 1).
Rarefaction analysis for all samples and datasets indicated undersampling of actual richness (Figure 1).
Figure 1. Accumulation curves describing the observed number of ITS1 and ITS2
operational taxonomic units (OTUs) as a function of the sequencing effort per soil plot
(rarefaction index values were calculated at intervals of 10 sequences). WTG: white truffle
grounds; BTG: black truffle grounds; SAR: Sardinian soils; SER: serpentinitic substrate
samples; CIS: contaminated industrial soils.

Diversity 2013, 5
79
When considering the distribution of OTUs across all 16 sampled plots (Supplementary Material 2a),
more than 73% and 80% of all ITS1 and ITS2 OTUs, respectively, were not detected in more than one
soil sample and only approx. 1% of all OTUs was observed in ≥50% of assemblages for both ITS1 and
ITS2. Similarly, all sites revealed a distribution pattern featuring a few widely dispersed OTUs and
many more confined OTUs (at each geographic site, 68.6–89.9% ITS1 and 81.6–91.4% ITS2 OTUs
were retrieved in just one sampled plot, and 0.8–20.2% ITS1 and 1.1–18.1% ITS2 OTUs were retrieved
in all plots) (Supplementary Material 2b).
Principal Components Analysis (PCA) was carried out to compare OTU distribution among the
different soil samples (only OTUs occurring in either all five soil sample groups—WTG, BTG, SAR,
SER and CIS—or all samples within a group, were included in the analyses). In the case of ITS1 OTUs
(Figure 2), the first ordination axis (58.1% of total variance) separated fungal communities in the black
truffle grounds from those in the other sample groups (mainly due to 65 OTUs occurring exclusively in
the black truffle soil samples; Supplementary Material 3), whereas the second axis (13.6% of the total
variation) distinguished the white truffle grounds (that featured seven exclusive OTUs) from the other
sample groups. Similarly for ITS2, the black truffle ground mycobiomes segregated along the first axis
(48.6% tot. var.; 44 exclusive OTUs), while the second axis (20.8% tot. var.) distinguished the white
truffle ground samples (14 exclusive OTUs). In particular, both the ITS1 and ITS2 OTUs segregating the
black truffle ground assemblages from the other mycobiomes included a high proportion of the OTUs
assigned to ectomycorrhizal (ECM) taxa (43.3 and 54.5% of total ECM ITS1 and ITS2 OTUs included
in the analysis, respectively; the ECM OTUs exclusively found in the BTG samples being ITS1 OTUs
108, 113, 132, 220, 285, 323, 415, 482, 501, 528, 542, 700, 884 (assigned to Inocybe, Russula,
Scleroderma, Tomentella, Cenococcum, Pheangium, Trichophaea and Tuber spp.) and ITS2 OTUs
40, 239, 254, 328, 378, 631 (assigned to Hymenogaster, Sarcodon, Scleroderma, Geopora and
Trichophaea spp.)).
Figure 2. Principal Component Analysis of fungal assemblages in WTG (WTG 1-3), BTG
(BTG 1-2), SAR (SAR 1-5), CIS (CIS 1-2) and SER (SER 1-4) soil samples, based on
presence/absence data of ITS1 or ITS2 OTUs occurring in either all five soil sample groups
or all samples within a group. Percentage variance values accounted for by the two first
ordination axes are reported along each axis.

Diversity 2013, 5
80
Figure 2. Cont.
However, when the overall degree of similarity between pairs of soils was examined (Jaccard
indices), each mycobiome generally exhibited higher similarity to the other mycobiomes from the same
sample group than to the mycobiomes from the other groups. This result was constant over different
sequencing depths. Figure 3 illustrates data obtained with the rarified datasets of 150 sequences (150
sequences per sample for both ITS1 and ITS2). The same pattern was observed when singleton OTUs
were excluded from the analysis (data not shown).
Correlations between community and geographic distances were therefore tested by significance by
means of Mantel tests. For both, the ITS1 and ITS2, Mantel correlation between community and
geographic distances was significant (correlation coefficients being 0.43 and 0.28, with associated
probabilities of 0.0002 and 0.008 for ITS1 and ITS2, respectively). Similarly, highly significant
correlations were found for log-transformed distances (p = 0.0001 for both ITS1 and ITS2). Significant
correlations were also obtained, with dissimilarity matrices derived from the other rarefied datasets, as
well by excluding singleton OTUs from the analyses (data not shown).
In spite of their overall dissimilarity, the mycobiomes from different sample groups shared some
features. The phylum-level taxonomic assignment of ITS1 and ITS2 OTUs in each fungal community is
reported in Figure 4. In most soil samples, Ascomycota were represented by the largest number of both
ITS1 and ITS2 OTUs (accounting for 36.7–92.9% of total ITS1 and 38.5–92.9% of total ITS2 OTUs).
However, the mycobiomes of the soil samples with aboveground vegetation dominated by
ectomycorrhizal plants (BTG1-2, WTG1-3 and SAR4-5) featured considerable proportions of OTUs
assigned to Basidiomycota (accounting for 21.6–56.7% and 12.1–51.3% of total ITS1 and total ITS2
OTUs, respectively). Overall, Basidiomycota OTU numbers were significantly higher in the former soil
samples than in the other soil samples (Mann Whitney U test, p = 0.001 for both ITS1 and ITS2).
Comparison between the ITS1 and ITS2 datasets was performed following rarefaction to the same
sequencing depth for both datasets (150 sequences per sample). Consistently, with its higher fungal
specificity, the ITS1F/ITS2 primer pair yielded a lower number of non-fungal sequences than the
ITS3/ITS4 primer pair (six and 269 sequences, respectively). The ITS1F/ITS2 primer pair is reported to
be biased towards amplification of basidiomycetes [47]. However, such a bias was not consistently

Diversity 2013, 5
81
observed for the samples we amplified, as, for instance, no significant difference between the numbers of
basidiomycetous sequences obtained with the ITS1F/ITS2 and the ITS3/ITS4 primers was observed for
samples WTG1,3, BTG1, SAR2,5, SER2 and CIS2 (Supplementary Material 4).
Figure 3. Pairwise Jaccard similarity indices between fungal communities from the same
sample group or the other groups. For both ITS1 and ITS2, Jaccard indices were computed
following rarefaction to 150 sequences per sample for both ITS1 and ITS2, to compare each
fungal community with each of the other fungal communities from either the same sample
group (blue columns) or the other groups (red columns). Mean values (columns) and
standard deviations (bars) are reported for each comparison. Couples of columns marked
with an asterisk indicate a significant difference between indices computed for intra-group
pairwise comparisons and indices computed for inter-group pairwise comparisons (p < 0.05;
Kruskal-Wallis test).

Diversity 2013, 5
82
Figure 4. Proportion of the ITS1 and ITS2 fungal OTUs assigned to different fungal phyla
(according to the NCBI Taxonomy) within each sample (following rarefaction to even
sequencing depth: 254 and 158 ITS1 and ITS2 sequences per sample, respectively). WTG:
white truffle grounds; BTG: black truffle grounds; SAR: Sardinian soils; SER: serpentinitic
substrate samples; CIS: contaminated industrial soils.
2.1.2. Fungal OTUs Shared by the Different Sample Groups
Given that higher beta-diversity was found between rather than within the five sample groups, we
examined patterns of OTU occurrence across the five groups.
Eight ITS1 and seven ITS2 OTUs were found in all groups (Tables 2 and 3, Figure 5). Among such
core OTUs, ITS1 OTU 274 and ITS2 OTU 185 were retrieved from all but one analyzed plots. The other
core OTUs were found in all sample groups, but not in each of their constitutive plots. The less widely
distributed shared OTUs were ITS1 OTU 426 and 472, as well as ITS2 OTU 394, occurring in an
average of 56% and 49% of ITS1 and ITS2 assemblages, respectively (Figure 5).
Diversity 2013, 5
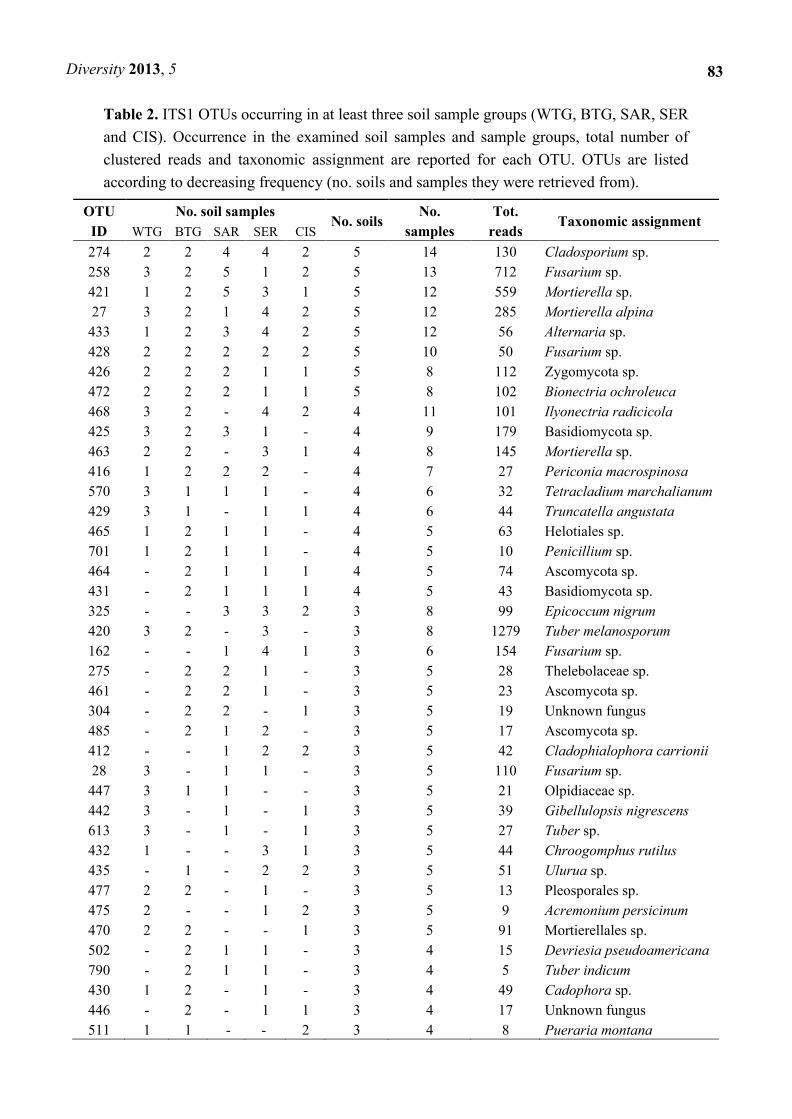
83
Table 2. ITS1 OTUs occurring in at least three soil sample groups (WTG, BTG, SAR, SER
and CIS). Occurrence in the examined soil samples and sample groups, total number of
clustered reads and taxonomic assignment are reported for each OTU. OTUs are listed
according to decreasing frequency (no. soils and samples they were retrieved from).
OTU
ID
No. soil samples No. soils
No.
samples
Tot.
reads Taxonomic assignment
WTG BTG SAR SER CIS
274 2 2 4 4 2 5 14 130 Cladosporium sp.
258 3 2 5 1 2 5 13 712 Fusarium sp.
421 1 2 5 3 1 5 12 559 Mortierella sp.
27 3 2 1 4 2 5 12 285 Mortierella alpina
433 1 2 3 4 2 5 12 56 Alternaria sp.
428 2 2 2 2 2 5 10 50 Fusarium sp.
426 2 2 2 1 1 5 8 112 Zygomycota sp.
472 2 2 2 1 1 5 8 102 Bionectria ochroleuca
468 3 2 - 4 2 4 11 101 Ilyonectria radicicola
425 3 2 3 1 - 4 9 179 Basidiomycota sp.
463 2 2 - 3 1 4 8 145 Mortierella sp.
416 1 2 2 2 - 4 7 27 Periconia macrospinosa
570 3 1 1 1 - 4 6 32 Tetracladium marchalianum
429 3 1 - 1 1 4 6 44 Truncatella angustata
465 1 2 1 1 - 4 5 63 Helotiales sp.
701 1 2 1 1 - 4 5 10 Penicillium sp.
464 - 2 1 1 1 4 5 74 Ascomycota sp.
431 - 2 1 1 1 4 5 43 Basidiomycota sp.
325 - - 3 3 2 3 8 99 Epicoccum nigrum
420 3 2 - 3 - 3 8 1279 Tuber melanosporum
162 - - 1 4 1 3 6 154 Fusarium sp.
275 - 2 2 1 - 3 5 28 Thelebolaceae sp.
461 - 2 2 1 - 3 5 23 Ascomycota sp.
304 - 2 2 - 1 3 5 19 Unknown fungus
485 - 2 1 2 - 3 5 17 Ascomycota sp.
412 - - 1 2 2 3 5 42 Cladophialophora carrionii
28 3 - 1 1 - 3 5 110 Fusarium sp.
447 3 1 1 - - 3 5 21 Olpidiaceae sp.
442 3 - 1 - 1 3 5 39 Gibellulopsis nigrescens
613 3 - 1 - 1 3 5 27 Tuber sp.
432 1 - - 3 1 3 5 44 Chroogomphus rutilus
435 - 1 - 2 2 3 5 51 Ulurua sp.
477 2 2 - 1 - 3 5 13 Pleosporales sp.
475 2 - - 1 2 3 5 9 Acremonium persicinum
470 2 2 - - 1 3 5 91 Mortierellales sp.
502 - 2 1 1 - 3 4 15 Devriesia pseudoamericana
790 - 2 1 1 - 3 4 5 Tuber indicum
430 1 2 - 1 - 3 4 49 Cadophora sp.
446 - 2 - 1 1 3 4 17 Unknown fungus
511 1 1 - - 2 3 4 8 Pueraria montana

Diversity 2013, 5
84
Table 3. ITS2 OTUs occurring in at least three soil sample groups (WTG, BTG, SAR, SER
and CIS). Occurrence in the examined soil samples and sample groups, total number of
clustered reads and taxonomic assignment are reported for each OTU. OTUs are listed
according to decreasing frequency (no. soils and samples they were retrieved from).
OTU ID
No. soil samples
No. soils No. samples Tot. reads Taxonomic assignment
WTG BTG SAR SER CIS
185 2 2 5 4 1 5 14 139 Cladosporium sp.
16 2 2 5 1 1 5 11 475 Fusarium sp.
101 2 2 3 2 1 5 10 65 Fusarium sp.
277 2 2 1 2 1 5 8 131 Tetracladium sp.
260 2 2 1 2 1 5 8 48 Mortierella alpina
246 2 2 1 1 2 5 8 38 Fusarium sp.
394 1 2 1 1 1 5 6 24 Paraphoma chrysanthemicola
478 - 2 4 4 1 4 11 206 Phoma sp.
399 2 2 3 2 - 4 9 100 Helotiales sp.
431 - 1 3 4 1 4 9 50 Alternaria sp.
384 - 2 2 2 2 4 8 15 Penicillium sp.
485 2 2 1 - 1 4 6 417 Tuber sp.
481 2 2 1 - 1 4 6 144 Bionectria ochroleuca
415 - 2 2 1 1 4 6 23 Podospora miniglutinans
402 2 - 1 1 1 4 5 19 Gibellulopsis nigrescens
418 2 1 1 1 - 4 5 14 Exophiala sp.
447 2 2 5 - - 3 9 98 Cryptococcus aerius
53 1 2 4 - - 3 7 311 Chaetomium sp.
433 - 1 3 4 - 3 8 38 Fusarium sp.
449 2 - 2 1 - 3 5 58 Penicillium sp.
440 2 2 2 - - 3 6 44 Metarhizium anisopliae
132 2 1 2 - - 3 5 34 Mortierella sp.
98 1 2 2 - - 3 5 27 Preussia sp.
374 - 2 1 1 - 3 4 10 Ascomycota sp.
521 1 2 1 - - 3 4 5 Hypocreales sp.
3 2 1 - 3 - 3 6 93 Mortierella sp.
516 - 2 - 1 1 3 4 16 Aureobasidium pullulans
68 1 2 - - 1 3 4 47 Mortierella sp.
Figure 5. Heat maps of the OTUs occurring in all localities showing the frequency of each
OTU in each sample group. Each column represents a different sample group; each row
represents a different OTU; the color of the cells represents the frequency of that OTU within
the sample group (percentage of the group samples the OTU was retrieved from).

Diversity 2013, 5
85
The best BLAST hits for each of these core OTUs (Supplementary Material 5) were sequences
identified in a diverse array of soils, continents and regions.
BLAST-based taxonomic assignment for the shared OTUs is reported in Tables 2 and 3. The least
precise identification was obtained for ITS1 OTU 426, which could only be ascribed to Zygomycota.
Five ITS1 and five ITS2 OTUs could instead be ascribed to distinct genera: these were ITS1 OTUs 274
(Cladosporium sp.), 258 (Fusarium sp.), 421 (Mortierella sp.), 433 (Alternaria sp.) and 428 (Fusarium
sp.) and ITS2 OTUs 185 (Cladosporium sp.), 16 (Fusarium sp.), 101 (Fusarium sp.), 277 (Tetracladium
sp.) and 246 (Fusarium sp.). Assignment at the species level was possible for ITS1 OTUs 27
(Mortierella alpina) and 472 (Bionectria ochroleuca) and ITS2 OTUs 260 (M. alpina) and 394
(Paraphoma chrysanthemicola).
Although read numbers were not considered in this study, such ITS core sequences were present
multiple times in each dataset, from 50 to 712 read numbers for the ITS1 core OTUs and from 38 to 475
for the ITS2 ones (Tables 2 and 3).
2.2. Discussion
2.2.1. Soil Mycobiomes Are Spatially Structured Over a Broad Scale
In this study, comparison of the mycobiomes of disparate soils across Italy and France (separated by
0.1 to 760 km) revealed non-random distributions at the examined scales, demonstrating the occurrence
of spatial patterning.
Spatial variation in species assemblages can be explained by either contemporary environmental
conditions (present-day attributes of the environment) or historical contingencies (past events related to
origin, dispersal and extinctions of species) [5,8]. According to the first scenario, high beta-diversity
(i.e., large differences in community composition among sites) is caused by contemporary interactions
among organisms, as well as with their physical and biotic environments [8], and community
composition is regulated by niche partitioning and environmental conditions in a habitat patch (so-called
―species sorting‖, [8]). By contrast, the second hypothesis postulates a dominant role for ―dispersal
limitation‖ of taxa within habitats, and community composition is assumed to be regulated by spatial
proximity to other populations [8]. The relative influence of historical versus environmental factors
seems to be related to the scale of sampling [5,48].
In our study, one of the main environmental factors separating most of the examined soil samples was
the nature of the plant cover. Plants provide both the resources for obligate root-associated pathogenic
and mutualistic symbionts and the organic carbon required for the functioning of the decomposer
subsystem, which is responsive to the nature of organic matter entering the soil [49]. There are,
therefore, direct correlative links between plant and soil fungal community composition (e.g., [50–52].
In our study, several sampling plots (BTG, WTG and SAR4-5 plots) were dominated by ectomycorrhizal
plants, which recruit specific guilds of symbiotic fungal species. Thus, species sorting is suggested by
the clustering and segregation from the other mycobiomes of the fungal consortia in both the black and
white truffle grounds (BTG and WTG). Higher numbers of OTUs assigned to Basidiomycota (including
several ectomycorrhizal fungi) were found in the truffle ground mycobiomes, as well as in the
mycobiomes of the other two samples collected under an ECM-type vegetation (SAR5 and SAR4, the

Diversity 2013, 5
86
Sardinian soil samples collected in an oak forest and wooded pasture, respectively), than in the
remaining fungal consortia. However, the fungal assemblages of the SAR5 and SAR4 samples were
more similar to the mycobiomes of the other Sardinian soil samples, despite strong differences not only
in plant cover, but also in management practices, as in the case of the tilled vineyard, impacted by
pesticides and fertilization. This observation indicates that beta-diversity was, at least to some degree in
this case, decoupled from environmental variability. Indeed, fungal beta-diversity and spatial distance
were found to be significantly correlated. Similarly, in a regional-scale study of Australian desert
ascomycete assemblages, Green and colleagues [53] found that geographic distance was a better
predictor for community turnover than was habitat (as defined by soil and vegetation type). Arbuscular
mycorrhizal fungal community composition in field soils was also shown to be the product of both
dispersal and environmental variables [54]. In different studies, a range of physico-chemical parameters
was found to structure the mycobiomes of soils sampled along a 2,370 km latitudinal gradient in the
southern maritime Antarctic [55], in alpine soils [38], as well as field soils in Texas [56] and Japan [57].
By contrast, Hovatter et al. [28] did not find evidence for either species sorting or dispersal limitation to
be acting on a regional scale, on fungal community composition in the rhizosphere of Lobelia siphilitica
plants or adjacent bulk soil.
As previously mentioned, while differing at the level of OTU composition, the mycobiomes of the
three localities with vegetation dominated by ECM plants (BTG, WTG and SAR4-5) shared higher
numbers of OTUs assigned to Basidiomycota relative to the other fungal consortia. A likely explanation
to this observation is that most if not all ectomycorrhizal species guilds are indeed dominated by
Basidiomycota taxa. This observation indicates, as already reported by other authors (e.g., [14]), that
differentiation among microbial communities can decrease when taxonomic resolution decreases. The
level of microbial taxonomic resolution also influences the interpretation of the processes driving
biogeographic patterns [5,7,14]. In particular, the dominant effect of edaphic control may be manifest
only when assessing sequences at a coarse taxonomic level, and caution is therefore needed in
interpreting the strengths of environment-space relationships when communities are assessed at low
levels of taxonomic resolution [20].
2.2.2. Core Soil Fungi Likely Exhibit Nutritional Versatility
Biogeographic signature patterns may be life history-dependent, depending on traits related to
dispersal and colonization mode/efficiency and generally lifestyle [14]. At the level of individual OTUs,
we found both fungi with a restricted distribution in the studied localities and seemingly soil generalists
(the ―core‖ OTUs). Some of the latter were ubiquitous in all samples within a group, as well as across
groups, while others exhibited different frequencies among the different sample groups, suggesting
either patchy local distributions or insufficient sampling of taxa that are present in low abundance.
Microbial endemism is difficult to assess, because many rare taxa will not be detected in a sample, even
when they are present in the location, falsely suggesting a more restricted distribution than is actually the
case [7]. Widespread distribution is, on the contrary, an obvious feature, although difficult to fully
quantify. Indeed, unequal sampling and undersampling, as well as differences in DNA extraction
efficiency and sequence yield for the different soil samples could underestimate the actual number of
OTUs shared by the soil mycobiomes. For instance, Qin et al. [58] showed that a 3X sequencing depth

Diversity 2013, 5
87
revealed a 25% larger core than did 1X coverage. The distribution of the ―core‖ fungi we identified most
likely extends beyond the sites investigated. The best BLAST hits for the core OTUs were indeed
sequences from numerous and a diverse array of soils and regions (Supplementary Material 5).
Such ―core‖ OTUs encompassed very few unidentified fungi, such as ITS1 OTU 426, which, based
on BLAST results, could only be ascribed to Zygomycota. This is at odds with the general belief that
fungal diversity is largely unknown. Furthermore, in some fungal groups, the high number of
unidentifiable OTUs from environmental sequencing projects likely represent species that have been
described, but for which there are no reference sequences in GenBank [59,60]. However, based on
the estimate of 1.5 million extant fungal species by Hawksworth [61], the odds that an unidentified
OTU represents one of the currently described species for which there are no data in GenBank are about
eighteen-to-one or higher, based on the diversity estimates of O’Brien et al. [62,63]. Since soil is one of
the most bio-diverse environments on earth, it is likely that fungi, such as ITS1 OTU 426, represent truly
undescribed, possibly high-ranking taxa, such as other fungal clades detected from environmental
DNA sequences, e.g., [64,65].
Other core fungal OTUs could only be identified at the genus level. For most of them, the reason was
the unsuitability of the ITS for identifying species in some fungal genera [66] or ambiguous BLAST
matches within a given genus. Species in these genera (Fusarium, Alternaria, Cladosporium,
Mortierella, Tetracladium; Tables 2 and 3) are amongst the most commonly isolated soil fungi [67].
Although the possibility that the ITS1 and ITS2 shared OTUs found in our work could represent
uncultured species within the latter genera cannot be ruled out, it is likely that they encompass species
(such as Fusarium oxysporum or F. solani) found amongst the commonest soil fungi, based on
culture-dependent methods.
Strikingly, the remaining core OTUs, identified at the species level (Mortierella alpina, Bionectria
ochroleuca, Paraphoma chrysanthemicola), are easily culturable fungi [67]. Likewise, several
culturable bacteria were found among the dominant 16S sequences in a large survey (approx. 139,000
sequences) in four randomly chosen soils from distinctly different sites in South and North America,
separated by up to 9,000 km [68]. The ease of cultivation on standard nutritional media has been related
to a copiotrophic strategy (as opposed to oligotrophy), since traditional culturing methods are likely to
select for microorganisms that can grow rapidly in high resource environments [69]. However, microbial
strains may switch from copiotrophic to oligotrophic strategies, depending on the culture conditions and
stage in the lifecycle [70,71], and intermediate/secondary strategies may well exist along the
copiotroph-oligotroph continuum. Most of the core fungal species we identified seem indeed to combine
the capacity to grow well in simple nutrient-rich media, with either oligotrophic abilities or the capacity
of utilizing refractory compounds, such as chitin, an abundant N source in soils. Relatively high growth
rates on silica gel containing no added carbon or even in distilled water on carefully cleaned glassware
(―oligocarbonotrophy‖, [72]) have, for instance, been reported for Gliocladium roseum (=Bionectria
ochroleuca), as well as several Fusarium, Penicillium, Cladosporium and Phoma (Paraphoma =
Phoma) species [73–76]. Very good chitin decomposition capacity (often with relatively little variation
in this capacity between isolates) and/or mycoparasitic behavior are well known for Mortierella alpina
and Bionectria ochroleuca [67]. Multiple substrate utilization, together with the ability to scavenge low
levels of nutrients, would confer an obvious ecological advantage in soil. Bulk (non-rhizospheric),
sub-litter soil is indeed regarded as an environment poor in available organic carbon, since much organic

Diversity 2013, 5
88
material entering it has already been partially exploited and, as a consequence, readily available
substrates have been removed. Organic materials in this environment are therefore composed of
refractory compounds, persisting for long periods [77].
It is generally assumed that, due to such predominant low nutrient conditions, microbes mostly live in
the soil as dormant propagules and that the soil microbiome is mainly composed of survivors, their
numbers being maintained via periods of transient activity (when fresh organic matter enters the
ecosystem), concluded by the restoration of the dormant condition [77]. However, both
oligocarbonotrophy and the capacity of utilizing refractory compounds, such as chitin, would permit
continuous growth in soil, allowing the microorganisms endowed with such abilities to utilize new
nutrient sources more effectively than microorganisms relying largely on spores for survival. The former
biota would fit a concept of autochthonous species (S-selected, capable of sustained development in soil
and little affected by fluctuations in resource availability), as opposed to zymogenous (R-selected)
species that burst into sporadic activity when presented by a suitable resource, then return to a quiescent
state after sporulation or the formation of resting structures [77]. Collectively, the ecological traits
outlined above are compatible with both the likely truly resident nature and the widespread occurrence
of the ―core‖ identified fungi. Dead and alive mycelia and insects comprise a significant proportion of
soil biomass everywhere, and interestingly, chitinolytic bacteria assigned to Chitinophaga have also
been found to be prevalent in dissimilar soils [68]. The widespread occurrence of the ―core fungi‖ could
therefore be related to the universal distribution and abundance of organic resources suitable for
exploitation by them.
3. Experimental Section
3.1. Study Sites
Published and unpublished fungal ITS1 and ITS2 sequences from 16 soil samples were examined.
These samples had been collected either in environmentally different plots at a single geographic site or
in environmentally similar soils at different geographic sites (Table 1).
Two geographic sites encompassed white (Tuber magnatum) and black (T. melanosporum) truffle
grounds. Three plots were sampled from a white truffle ground (WTG) in Italy. Two of the plots
corresponded to productive areas, where fruit bodies were collected; one plot to a nearby non-productive
area [78–80]. The sequences obtained by Mello et al. [39] from inside and outside ―brûlé‖ (burned) soils
in a French black truffle ground (BTG) were also analyzed.
Sequences from a Mediterranean site located in the island of Sardinia (Italy) were also studied [43,81,82].
Five plots, each corresponding to a specific vegetation type, were sampled at this site. Vegetation types
were a tilled vineyard (SAR1), a covered vineyard (SAR2), a managed meadow (SAR3), a wooded
pasture (SAR4) and a cork-oak (Quercus suber) semi-natural forest (SAR5).
Four sites located in the Western Alps in Italy (one plot per site each), characterized by serpentine
substrates (SER), were sampled [41]. Two corresponded to disused asbestos mines, and the two other
were pristine ophiolitic sites with serpentine rocks and fibrous asbestos outcrops.

Diversity 2013, 5
89
Finally, two contaminated industrial soils (CIS), located on the alluvial deposits of a river bank in the
Western Po Plain (Italy), were sampled. Due to the past industrial activities, these soils featured a mixed
pollution from organic (mainly nonylphenols) and inorganic (metals) contaminants [83].
3.2. Sampling, DNA Extraction, PCR and Pyrosequencing
Sequences were obtained from several soil cores samples (5 cm diameter and 20 cm depth) in each
plot (two cores per plot). Samples were independently packed in ice upon collection and transported to
the laboratory. Soil cores were then sieved (2 mm) to remove fine roots and large organic debris and
stored at −80 °C before use for DNA extraction.
Genomic DNA was extracted from two 500 mg aliquots (three for the SER samples) of each soil
sample using the FastDNA SPIN for Soil Kit (Q-Biogene, Rome, Italy), following a modified protocol
described by Luis et al. [84]. The two DNA samples extracted per soil core were independently
amplified using two primer sets fused with the 454 pyrosequencing adapters A
(GCCTCCCTCGCGCCATCAG) and B (GCCTTGCCAGCCCGCTCAG). These primer pairs target
the non-coding nuclear rDNA ITS region, which has been chosen as the universal DNA barcode marker
for fungi [65]. The first primer pair (ITS1F (5'-(A)CTTGGTCATTTAGAGGAAGTAA-3')/ITS2
(5'-(B)GCTGCGTTCTTCATCGATGC-3')) is fungal-specific for the ITS1 region and amplifies a
fragment of c. 400 bp. The second set (ITS3 (5'-(A)GCATCGATGAAGAACGCAGC-3')/ITS4
(5'-(B)TCCTCCGCTTATTGATATGC-3')) is eukaryote-specific for the ITS2 region and amplifies a
fragment of c. 350 bp. The choice of a universal primer set (ITS3- ITS4) for the ITS2 spacer was due to
the fact that fungal-specific primers targeting this ITS subregion are only available for some fungal phyla
(Ascomycota and Basidiomycota) [85]. Polymerase chain reaction (PCR) mixes contained 17.1 μL of
sterile water, 2.5 μL 10X of reaction buffer (Sigma), 2.5 μL of each deoxyribonucleotide triphosphate
(dNTP 2.0 μM), 0.5 μL of each primer (10μM), 0.4 μL of DNA polymerase (High Fidelity Taq, Roche)
and 2 μL of DNA template in a final volume of 25 μL. The DNA was amplified using a T3000 thermal
cycler (Biometra, Göttingen, DE). The following program was used: initial denaturation at 94 °C for
3 min, followed by 35 cycles of denaturation at 94 °C for 45 s, annealing at 50 °C for 45 s, extension at
72 °C for 1 min and a final extension at 72 °C for 7 min. The PCR products obtained with the two primer
pairs were purified with the Agencourt®
AMPure®
Kit (Beckman Coulter, CA, USA). The quality of
these samples was assessed through (i) gel electrophoresis of 5 μl subsamples on 1.5% agarose gel, (ii)
evaluation of the AD260/280 ratio calculated using the ND-1000 Spectrophotometer NanoDrop®
(Thermo Scientific, Wilmington, DE) and (iii) analysis with the Experion™ System (Bio-Rad, Hercules,
CA, USA), using a DNA1K Chip. At this stage, the different amplicons obtained from each studied plot
were pooled before sequencing.
Pyrosequencing was performed by BMR Genomics s.r.l. (Padua, Italy) using 15 out of the 16
available lanes in the 454 Genome Sequencer FLX System (454 Life Science Branford, CT, USA), by
means of the GS FLX Standard Reagent Series Kit. The obtained number of sequences differs among
samples, since in some cases, the 1/16th line has been used to sequence other genomic regions [43]. For
the second white truffle ground soil sample (WTG2), problems during pyrosequencing occurred, leading
to an absence of reads for the ITS2 subregion.
Diversity 2013, 5
90
3.3. Processing of Pyrosequencing Data
The ITS1 and ITS2 454 datasets were processed with the QIIME (Quantitative Insights Into Microbial
Ecology, [86]) pipeline. Both ITS1 and ITS reads were subjected to denoising, quality trimming and
chimera removal. During denoising, sequences exhibiting a quality score lower than 30 and length
shorter than 200 bp were trimmed. The cleaned sample files were merged into a single ITS1 or ITS2
Fasta file (keeping the sample information in each read entry) and subjected to downstream processing.
This cleaned dataset was clustered into molecular Operational Taxonomic Units (OTUs) with a 97%
identity threshold, by using the USEARCH algorithm, which also implements a native de novo chimera
identification and removal feature. The taxonomic correlate to this sequence identity cutoff in the fungal
ITS regions approximates the species level, e.g., [35,37,41,43]. To assess sampling efficiency,
rarefaction curves were generated by means of the Analytic Rarefaction 1.3 software [87], using 10
specimens as a ―step parameter‖ for calculation.
Following OTU picking and chimera removal in QIIME, the longest sequence from each cluster was
selected as the OTU representative sequence to be used for used for taxonomic identification of the
OTU. Taxonomy assignment to OTUs was carried out by querying with the BLASTN algorithm the
OTU representative sequences against the GenBank and UNITE databases. Taxonomic assignment of
each read was defined as the longest common path in the taxonomic tree from the database matches. We
took a conservative approach to OTU species-level assignment. OTUs were only assigned at species
level if i) the query sequence matched database sequences from fungal isolates (including at least one
vouchered specimen) with E-values ≤10−100
and percentage sequence identity ≥97% and ii) at the lowest
E-values; there were no contradictions among different species within the same genus. Blast results were
inspected manually to remove inconsistencies: a match with a single sequence assigned to a genus
represented by several species in the reference database was not considered, since we suspected
misidentification of the database sequence. As the ITS region has limited value for differentiating
species within Fusarium and Penicillium [66,88], OTUs assigned to these taxa were only identified to
the genus level.
3.4. Statistical Analysis
Given the differences in the sequencing effort among the analyzed samples, as well as between the
ITS1 and ITS2 datasets (Figure 1, Supplementary Material 1), four rarefied datasets were generated with
the multiple_rarefaction function in QIIME in order to remove sample heterogeneity before diversity
assessment. Such rarefied datasets contained 50, 100 or 150 sequences per sample for both the ITS1 and
ITS2 regions, as well as the lowest number of sequences per sample obtained for either the ITS1 or the
ITS2 region (254 and 158 ITS1 and ITS2 sequences per sample, respectively; Supplementary Material 1).
The number of reads included in a given OTU is taken into consideration in most pyrosequencing
studies of microbial communities, as a proxy for the abundance of the associated molecular species.
However, PCR primers currently used in fungal pyrosequencing studies have been shown to introduce
different types of biases, pointing to problems of ―competition‖ between DNA fragments of different
taxonomic groups/lengths [47,89]. Furthermore, ITS copy numbers exhibit wide variation among both
distinct fungal species and different isolates of a given species and even throughout the lifecycle of a
Diversity 2013, 5
91
single isolate [90,91]. In phylogenetically diverse bacteria, the rRNA operon copy number per genome
can fluctuate in response to resource availability in the environment [92]. Taken together, these
observations caution against using read numbers as an estimate of actual abundance in nature when
dealing with environmental samples [93,94]. We therefore decided not to take read numbers into
consideration. Hence, data from the QIIME OTU table files were reduced to binary data (OTUs were
counted as present or absent) in Excel.
Beta-diversity was estimated using Jaccard indices for pairwise comparisons—determined as the
ratio of the number of OTUs shared and the total number of OTUs in both samples. Jaccard indices were
computed for each of the four rarefied datasets. The fungal assemblages retrieved in the different soil
samples were also compared by means of Principal Components Analysis (PCA), with ―standardized‖
option, carried out using the SYNTAX 2000 package. Correlations with the original variables were also
analyzed with the ―Mixed (Rohlf) biplot‖ option. Since replication is imperative [95], only OTUs
occurring in either all five soil sample groups (WTG, BTG, SAR, SER and CIS) or all samples within a
group were included in the analyses. The Jaccard indices were also used to calculate Mantel statistics
(correlation coefficients) between community and geographic distance matrices. Community distance D
was computed as the equivalent of the inverse of similarity as expressed by the Jaccard index J (D = 1 – J).
Geographic distance matrices were calculated using both straight line distances and using
log-transformed distances [28]. Mantel analyses (simple Mantel tests with 10,000 iterations) were
performed in ZT [96].
Comparisons between the ITS1 and ITS2 datasets were performed following rarefaction to 150
sequences per sample for both regions. Since the ITS1F/ITS2 primer pair is reported to be biased
towards amplification of basidiomycetes [47], differences in the proportions of basidiomycetous
sequences in the ITS1 and ITS2 datasets were tested for significance by means of the chi-square test
(degrees of freedom = 1) performed with the XLSTAT software (Addinsoft; [97]).
4. Conclusions
To our knowledge, this study represents the largest attempt so far to comprehensively identify
patterns of soil fungal beta-diversity at multiple scales over long distances, taking advantage of the high
resolution of NGS techniques, at a relatively narrow taxonomic breadth. By means of comparative
analysis of pyrosequencing data, we have found evidence of spatial distance acting on the assembly of
soil fungal communities. We have also uncovered a core mycobiome shared by unlike soil types. The
ecological features of the generalist fungal species we identified are consistent with the potential for
continuous, active growth in the oligotrophic soil environment. Technical advances in NGS, as well as
more extensive sampling, will allow to unearth further core taxa. The analysis of soil fungal
metagenomes and metatranscriptomes (e.g., [40,98]) will contribute to deciphering fungal strategies in
soil, increasing our understanding of microbial ecology in this environment.
Supplementary Materials
Supplementary materials can be accessed at:
http://www.mdpi.com/1424-2818/5/1/73/s1.
Diversity 2013, 5
92
Acknowledgments
Support by the FP7 project EcoFINDERS (FP7-264 465), the Piedmont Region (Regione Piemonte)
and the University of Turin (grant ex-60%) is gratefully acknowledged. We are grateful to the
anonymous referees for their useful comments and suggestions.
References
1. Shade, A.; Handelsman, J. Beyond the Venn diagram: the hunt for a core microbiome. Environ.
Microbiol. 2012, 14, 4–12.
2. Curtis, T.P.; Sloan, W.T. Exploring microbial diversity—A vast below. Science 2005, 309,
1331–1333.
3. Vogel, T.M.; Simonet, P.; Jansson, J.K.; Hirsch, P.R.; Tiedje, J.M.; van Elsas, J.D.; Bailey, M.J.;
Nalin, R.; Philippot, L. TerraGenome: a consortium for the sequencing of a soil metagenome.
Nat. Rev. Microbiol. 2009, 7, 252–252.
4. Green, J.; Bohannan, B.J.M. Spatial scaling of microbial biodiversity. Trends Ecol. Evol. 2006, 21,
501–507.
5. Martiny, J.B.H.; Bohannan, B.J.M.; Brown, J.H.; Colwell, R.K.; Fuhrman, J.A.; Green, J.L.;
Horner-Devine, M.C.; Kane, M.; Krumins, J.A.; Kuske, C.R.; et al. Microbial biogeography:
putting microorganisms on the map. Nature Rev. Microbiol. 2006, 4, 102–112.
6. Prosser, J.I.; Bohannan, B.J.M.; Curtis, T.P.; Ellis, R.J.; Firestone, M.K.; Freckleton, R.P.; Green, J.L.;
Green, L.E.; Killham, K.; Lennon, J.J.; et al. The role of ecological theory in microbial ecology.
Nature Rev. Microbiol. 2007, 5, 384–392.
7. Hanson, C.A.; Fuhrman, J.A.; Horner-Devine, M.C.; Martiny, J.B.H. Beyond biogeographic
patterns: processes shaping the microbial landscape. Nat. Rev. Microbiol. 2012, 10, 497–506.
8. Lindström, E.S.; Langenheder, S. Local and regional factors influencing bacterial community
assembly. Environ. Microbiol. Rep. 2012, 4, 1–9.
9. Dighton, J. Fungi in Ecosystem Processes; Mycology Series; Marcel Dekker Inc.: New York &
Basel, USA & Switzerland, 2003.
10. Coleman, M. From Another Kingdom. The amazing world of Fungi; Royal Botanic Garden:
Edinburgh, UK, 2010; p 176.
11. Gianinazzi, S.; Gollotte, A.; Binet, M.N.; van Tuinen, D.; Redecker, D.; Wipf, D. Agroecology: the
key role of arbuscular mycorrhizas in ecosystem services. Mycorrhiza 2010, 20, 519–530.
12. Jeffery, S.; Gardi, C.; Jones, A.; Montanarella, L.; Marmo, L.; Miko, L.; Ritz, K.; Peres, G.;
Römbke, J.; van der Putten, W.H. European Atlas of Soil Biodiversity; European Commission,
Publications Office of the European Union: Luxembourg, Luxembourg, 2010; p 128.
13. Fisher, M.C.; Henk, D.A.; Briggs, C.J.; Brownstein, J.S.; Madoff, L.C.; McCraw, S.L.; Gurr, S.J.
Emerging fungal threats to animal, plant and ecosystem health. Nature 2012, 484, 186–194.
14. Bissett, A.; Richardson, A.E.; Baker, G.; Wakelin, S.; Thrall, P.H. Life history determines
biogeographical patterns of soil bacterial communities over multiple spatial scales. Mol. Ecol.
2010, 19, 4315–4327.
Diversity 2013, 5
93
15. Ragon, M.; Fontaine, M.C.; Moreira, D.; López-García, P. Different biogeographic patterns of
prokaryotes and microbial eukaryotes in epilithic biofilms. Mol. Ecol. 2012, 21, 3852–3868.
16. Fierer, N.; Jackson, R.B. The diversity and biogeography of soil bacterial communities. Proc. Natl.
Acad. Sci. USA 2006, 103, 626–631.
17. Lauber, C.L.; Hamady, M.; Knight, R.; Fierer, N. Pyrosequencing-based assessment of soil pH as a
predictor of soil bacterial community composition at the continental scale. Appl. Environ.
Microbiol. 2009, 75, 5111–5120.
18. Philippot, L.; Cuhel, J.; Saby, N.P.A.; Chèneby, D.; Chronáková, A.; Bru, D.; Arrouays, D.;
Martin-Laurent, F.; Simek, M. Mapping fine-scale spatial patterns of size and activity of the
denitrifier community. Environ. Microbiol. 2009, 11, 1518–1526.
19. Dequiedt, S.; Saby, N.P.A.; Lelievre, M.; Jolivet, C.; Thioulouse, J.; Toutain, B.; Arrouays, D.;
Bispo, A.; Lemanceau, P.; Ranjard, L. Biogeographical patterns of soil molecular microbial biomass
as influenced by soil characteristics and management. Global Ecol. Biogeogr. 2011, 20, 641–652.
20. Griffiths, R.I.; Thomson, B.C.; James, P.; Bell, T.; Bailey, M.; Whiteley, A.S. The bacterial
biogeography of British soils. Environ. Microbiol. 2011, 13, 1642–1654.
21. Rousk, J.; Baath, E.; Brookes, P.C.; Lauber, C.L.; Lozupone, C.; Caporaso, J.G.; Knight, R.; Fierer,
N. Soil bacterial and fungal communities across a pH gradient in an arable soil. ISME J. 2010, 4,
1340–1351.
22. De Vries, F.T.; Bååth, E.; Kuyper, T.W.; Bloem, J. High turnover of fungal hyphae in incubation
experiments. FEMS Microbiol. Ecol. 2009, 67, 389–396.
23. Martin, J.P.; Haider, K. Biodegradation of 14
C-labeled model and cornstalk lignins, phenols, model
phenolase humic polymers, and fungal melanins as influenced by a readily available carbon source
and soil. Appl. Environ. Microbiol. 1979, 38, 283–289.
24. Amelung, W.; Lobe, I.; Du Preez, C.C. Fate of microbial residues in sandy soils of the South
African highveld as influenced by prolonged arable cropping. Eur. J. Soil Sci. 2002, 53, 29–35.
25. Strickland, M.S.; Rousk, J. Considering fungal:bacterial dominance in soils—Methods, controls,
and ecosystem implications. Soil Biol. Biochem. 2010, 42, 1385–139.
26. De Vries, F.T.; van Groenigen, J.W.; Hoffland, E.; Jaap, B. Nitrogen losses from two grassland
soils with different fungal biomass. Soil Biol. Biochem. 2011, 43, 997–1005.
27. Kaspari, M.; Stevenson, B.S.; Shik, J.; Kerekes, J.F. Scaling community structure: how bacteria,
fungi, and ant taxocenes differentiate along a tropical forest floor. Ecology 2010, 91, 2221–2226.
28. Hovatter, S.R.; Dejelo, C.; Case, A.L.; Blackwood, C.B. Metacommunity organization of soil
microorganisms depends on habitat defined by presence of Lobelia siphilitica plants. Ecology 2011,
92, 57–65.
29. Ranjard, L.; Lejon, D.P.H.; Mougel, C.; Schehrer, L.; Merdinoglu, D.; Chaussod, R. Sampling
strategy in molecular microbial ecology: Influence of soil sample size on DNA fingerprinting
analysis of fungal and bacterial communities. Environ. Microbiol. 2003, 5, 1111–1120.
30. Gihring, T.M.; Green, S.J.; Schadt, C.W. Massively parallel rRNA gene sequencing exacerbates the
potential for biased community diversity comparisons due to variable library sizes. Environ.
Microbiol. 2012, 14, 285–290.
Diversity 2013, 5
94
31. Davison, J.; Opik, M.; Zobel, M.; Vasar, M.; Metsis, M.; Moora, M. Communities of arbuscular
mycorrhizal fungi detected in forest soil are spatially heterogeneous but do not vary throughout the
growing season. Plos One 2012, 7, e41938.
32. Öpik, M.; Metsis, M.; Daniell, T.J.; Zobel, M.; Moora, M. Large-scale parallel 454 sequencing
reveals host ecological group specificity of arbuscular mycorrhizal fungi in a boreonemoral forest.
New Phytol. 2009, 184, 424–437.
33. Lumini, E.; Orgiazzi, A.; Borriello, R.; Bonfante, P.; Bianciotto, V. Disclosing arbuscular
mycorrhizal fungal biodiversity in soil through a land-use gradient using a pyrosequencing
approach. Environ. Microbiol. 2010, 12, 2165–2179.
34. Dumbrell, A.J.; Ashton, P.D.; Aziz, N.; Feng, G.; Nelson, M.; Dytham, C.; Fitter, A.H.; Helgason, T.
Distinct seasonal assemblages of arbuscular mycorrhizal fungi revealed by massively parallel
pyrosequencing. New Phytol. 2011, 190, 794–804.
35. Buée, M.; Reich, M.; Murat, C.; Morin, E.; Nilsson, R.H.; Uroz, S.; Martin, F. 454 pyrosequencing
analyses of forest soils reveal an unexpected high fungal diversity. New Phytol. 2009, 184,
449–456.
36. Lim, Y.W.; Kim, B.K.; Kim, C.; Jung, H.S.; Kim, B.S.; Lee, J.H.; Chun, J. Assessment of soil
fungal communities using pyrosequencing. J. Microbiol. 2010, 48, 284–289.
37. Tedersoo, L.; Nilsson, R.H.; Abarenkov, K.; Jairus, T.; Sadam, A.; Saar, I.; Bahram, M.; Bechem, E.;
Chuyong, G.; Koljalg, U. 454 Pyrosequencing and Sanger sequencing of tropical mycorrhizal fungi
provide similar results but reveal substantial methodological biases. New Phytol. 2010, 188,
291–301.
38. Lentendu, G.; Zinger, L.; Manel, S.; Coissac, E.; Choler, P.; Geremia, R.A.; Melodelima, C.
Assessment of soil fungal diversity in different alpine tundra habitats by means of pyrosequencing.
Fungal Divers. 2011, 49, 113–123.
39. Mello, A.; Napoli, C.; Murat, C.; Morin, E.; Marceddu, G.; Bonfante, P. ITS-1 versus ITS-2
pyrosequencing: a comparison of fungal populations in truffle grounds. Mycologia 2011, 103,
1184–1193.
40. Baldrian, P.; Kolarik, M.; Stursova, M.; Kopecky, J.; Valaskova, V.; Vetrovsky, T. Active and total
microbial communities in forest soil are largely different and highly stratified during
decomposition. ISME J. 2012, 6, 248–258.
41. Daghino, S.; Murat, C.; Sizzano, E.; Girlanda, M.; Perotto, S. Fungal diversity is not determined by
mineral and chemical differences in serpentine substrates. Plos One 2012, 7, e44233.
42. Danielsen, L.; Thürmer, A.; Meinicke, P.; Buée, M.; Morin, E.; Martin, F.; Pilate, G.; Daniel, R.;
Polle, A.; Reich, M. Fungal soil communities in a young transgenic poplar plantation form a rich
reservoir for fungal root communities. Ecol. Evol. 2012, 2, 1935–1948.
43. Orgiazzi, A.; Lumini, E.; Nilsson, R.H.; Girlanda, M.; Vizzini, A.; Bonfante, P.; Bianciotto, V.
Unravelling soil fungal communities from different Mediterranean land-use backgrounds. Plos One
2012, 7, e34847.
44. Xu, L.H.; Ravnskov, S.; Larsen, J.; Nilsson, R.H.; Nicolaisen, M. Soil fungal community structure
along a soil health gradient in pea fields examined using deep amplicon sequencing. Soil Biol.
Biochem. 2012, 46, 6–32.

Diversity 2013, 5
95
45. Rivas-Martínez, S.; Penas, A.; Díaz, T.E. Bioclimatic Map of Europe Cartographic Service.
University of León, Spain, 2004. Available online: http://www.globalbioclimatic.org/ (accessed on
18 February 2013).
46. European Commission. Council Directive 92/43/EEC on the conservation of natural habitats and of
wild fauna and flora. Eur. Commun. Gazette 1992, 206, 1–50.
47. Bellemain, E.; Carlsen, T.; Brochmann, C.; Coissac, E.; Taberlet, P.; Kauserud, H. ITS as an
environmental DNA barcode for fungi: an in silico approach reveals potential PCR biases. BMC
Microbiol. 2010, 10, 189–197.
48. Martiny, J.B.H.; Eisen, J.A.; Penn, K.; Allison, S.D.; Horner-Devine, M.C. Drivers of bacterial
β-diversity depend on spatial scale. Proc. Natl. Acad. Sci. USA 2011, 108, 7850–7854.
49. Wardle, D.A.; Bardgett, R.D.; Klironomos, J.N.; Setälä, H.; van der Putten, W.H.; Wall, D.H.
Ecological linkages between aboveground and belowground biota. Science 2004, 304, 1629–1633.
50. Christensen, M. Species diversity and dominance in fungal communities. In The Fungal
community: Its Organization and Role in the Ecosystem; Wicklow, D.T., Carroll, G.C., Eds.;
Marcel Dekker: New York, NY, USA, 1981; pp. 201–232.
51. Nielsen, U.N.; Osler, G.H.R.; Campbell, C.D.; Burslem, D.F.R.P.; van der Wal, R. The influence of
vegetation type, soil properties and precipitation on the composition of soil mite and microbial
communities at the landscape scale. J. Biogeogr. 2010, 37, 1317–1328.
52. Bahram, M.; Polme, S.; Koljalg, U.; Zarre, S.; Tedersoo, L. Regional and local patterns of
ectomycorrhizal fungal diversity and community structure along an altitudinal gradient in the
Hyrcanian forests of northern Iran. New Phytol. 2012, 193, 465–473.
53. Green, J.L.; Holmes, A.J.; Westoby, M.; Oliver, I.; Briscoe, D.; Dangerfield, M.; Gillings, M.;
Beattie, A.J. Spatial scaling of microbial eukaryote diversity. Nature 2004, 432, 747–750.
54. Lekberg, Y.; Koide, R.T.; Rohr, J.R.; Aldrich-Wolfe, L.; Morton, J.B. Role of niche restrictions and
dispersal in the composition of arbuscular mycorrhizal fugal communities. J. Ecol. 2007, 95,
95–105.
55. Dennis, P.G.; Rushton, S.P.; Newsham, K.K.; Lauducina, V.A.; Ord, V.J.; Daniell, T.J.; O’Donnell,
A.G.; Hopkins, D.W. Soil fungal community composition does not alter along a latitudinal gradient
through the maritime and sub-Antarctic. Fungal Ecol. 2012, 5, 403–408.
56. Rice, W.C.; Gowda, P.H. Influence of geographical location, crop type and crop residue cover on
bacterial and fungal community structures. Geoderma 2011, 160, 271–280.
57. Bao, Y.; Morimoto, S.; Takada-Hoshino, Y.; Okada, H.; Oba, H.; Takemoto, S.; Niwa, S.;
Ohigashi, K.; Suzuki, C.; Nagaoka, K.; et al. Combined analyses of bacterial, fungal and nematode
communities in andosolic agricultural Soils in Japan. Microbes Environ. 2012, 27, 72–79.
58. Qin, J.; Li, R.; Raes, J.; Arumugam, M.; Burgdorf, K.S.; Manichanh, C.; Nielsen, T.; Pons, N.;
Levenez, F.; Yamada, T.; et al. A human gut microbial gene catalogue established by metagenomic
sequencing. Nature 2010, 464, 59–65.
59. Brock, P.M.; Doring, H.; Bidartondo, M.I. How to know unknown fungi: The role of a herbarium.
New Phytol. 2009, 181, 719–724.
60. Nagy, L.G.; Petkovits, T.; Kovács, G.M.; Voigt, K.; Csaba, V.l.; Papp, T. Where is the unseen
fungal diversity hidden? A study of Mortierella reveals a large contribution of reference collections
to the identification of fungal environmental sequences. New Phytol. 2011, 191, 789–794.

Diversity 2013, 5
96
61. Hawksworth, D.L. The magnitude of fungal diversity: the 1.5 million species estimate revisited.
Mycol. Res. 2001, 105, 1422–1432.
62. O’Brien, H.E.; Parrent, J.L.; Jackson, J.A.; Moncalvo, J.M.; Vilgalys, R. Fungal community
analysis by large-scale sequencing of environmental samples. Appl. Environ. Microbiol. 2005, 71,
5544–5550.
63. Hibbett, D.S.; Ohman, A.; Glotzer, D.; Nuhn, M.; Kirk, P.; Nilsson, N.R.H. Progress in molecular
and morphological taxon discovery in Fungi and options for formal classification of environmental
sequences. Fung. Biol. Rev. 2011, 25, 38–47.
64. Schadt, C.W.; Martin, A.P.; Lipson, D.A.; Schmidt, S.K. Seasonal dynamics of previously
unknown fungal lineages in tundra soils. Science 2003, 301, 1359–1361.
65. Porter, T.M.; Schadt, C.W.; Rizvi, L.; Martin, A.P.; Schmidt, S.K.; Scott-Denton, L.; Vilgalys, R.;
Moncalvo, J.M. Widespread occurrence and phylogenetic placement of a soil clone group adds a
prominent new branch to the fungal tree of life. Mol. Phylogenet. Evol. 2008, 46, 635–644.
66. Schoch, C.L.; Seifert, K.A.; Huhndorf, S.; Robert, V.; Spouge, J.L.; Levesque, C.A.; Chen, W.
Nuclear ribosomal internal transcribed spacer (ITS) region as a universal DNA barcode marker for
Fungi. Proc. Natl. Acad. Sci. USA 2012, 16, 6241–6246.
67. Domsch, K.H.; Gams, W.; Anderson, T.-H. Compendium of Soil Fungi, 2nd ed.; IHW-Verlag and
Verlagsbuchhandlung: Eching, Germany, 2007.
68. Fulthorpe, R.R.; Roesch, L.F.W.; Riva, A.; Triplett, E.W. Distantly sampled soils carry few species
in common. ISME J. 2008, 2, 901–910.
69. Fierer, N.; Bradford, M.A.; Jackson, R.B. Toward an ecological classification of soil bacteria.
Ecology 2007, 88, 1354–1364.
70. Hirsch, P.; Bernhard, M.; Cohen, S.; Ensign, J.; Jannasch, H.; Koch, A.; Marshall, K.; Matin, A.;
Poindexter, J.; Rittenberg, S.; et al. Life under conditions of low nutrient concentrations: group
report. In Strategies of Microbial Life in Extreme Environments; Shilo, M., Ed.; Dahlem Konferenzen
Life Sciences Research Report: Weinheim, Germany, 1979; pp. 323–339.
71. Gottschal, J. Some reflections on microbial competitive ness among heterotrophic bacteria. Anton.
Leeuw. 1985, 51, 473–494.
72. Wainwright, M. Oligotrophic growth of fungi-stress or natural state? In Stress Tolerance of Fungi;
Jennings, D.H., Ed.; Marcel Dekker: New York, NY, USA, 1993; pp 127–144.
73. Tribe, H.T.; Mabadeje, S.A. Growth of moulds on media prepared without organic nutrients. Trans.
Br. Mycol. Soc. 1972, 58, 127–137.
74. Wainwright, M. Metabolic diversity of fungi in relation to growth and mineral cycling in soil-a
review. Trans. Br. Mycol. Soc. 1988, 90, 159–170.
75. Parkinson, S.M.; Wainwrigh, M.; Killham, K. Observations on oligotrophic growth of fungi on
silica gel. Mycol. Res. 1989, 93, 529–534.
76. Bergero, R.; Girlanda, M.; Varese, G.C.; Intili, D.; Luppi, A.M. Psychrooligotrophic fungi from
Arctic soils of Franz Joseph Land. Polar Biol. 1998, 21, 361–368.
77. Cooke, R.C.; Rayner, A.D.M. Ecology of Saprotrophic Fungi; Addison-Wesley Educational
Publishers Inc.: London & New York, UK & USA, 1984.
Diversity 2013, 5
97
78. Murat, C.; Vizzini, A.; Bonfante, P.; Mello, A. Morphological and molecular typing of the
below-ground fungal community in a natural Tuber magnatum truffle-ground. FEMS Microbiol.
Lett. 2005, 245, 307–313.
79. Zampieri, E.; Mello, A.; Bonfante, P.; Murat, C. PCR primers specific for the genus Tuber reveal the
presence of several truffle species in a truffle-ground. FEMS Microbiol. Lett. 2009, 297, 67–72.
80. Zampieri, E.; Murat, C.; Cagnasso, M.; Bonfante, P.; Mello, A. Soil analysis reveals the presence of
an extended mycelial network in a Tuber magnatum truffle-ground. FEMS Microbiol. Ecol. 2010,
71, 43–49.
81. Lagomarsino, A.; Benedetti, A.; Marinari, S.; Pompili, L.; Moscatelli, M.C.; Roggero, P.P.; Lai, R.;
Ledda, L.; Grego, S. Soil organic C variability and microbial functions in a Mediterranean
agro-forest ecosystem. Biol. Fertil. Soils 2011, 47, 283–291.
82. Bagella, S.; Caria, M.C. Vegetation series: a tool for the assessment of grassland ecosystem
services in Mediterranean large-scale grazing systems. Fitosociologia 2011, 48, 47–54.
83. Girlanda, M.; Favero-Longo, S.E.; Lazzari, A.; Segreto, R.; Perotto, S.; Siniscalco, C. Indigenous
microfungi and plants reduce soil nonylphenol contamination and stimulate resident microfungal
communities. Appl. Microbiol. Biot. 2009, 82, 359–370.
84. Luis, P.; Walther, G.; Kellner, K.; Martin, F.; Buscot, F. Diversity of laccase genes from
Basidiomycetes in a forest soil. Soil Biol. Biochem. 2004, 36, 1025–1036.
85. Toju, H.; Tanabe, A.S.; Yamamoto, S.; Sato, H. High-coverage ITS primers for the DNA-based
identification of Ascomycetes and Basidiomycetes in environmental samples. Plos One 2012, 7,
e4086.
86. Caporaso, J.G.; Kuczynski, J.; Stombaugh, J.; Bittinger, K.; Bushman, F.D.; Costello, E.K.; Fierer,
N.; Gonzalez Pena, A.; Goodrich, J.K.; Gordon, J.I.; et al. QIIME allows analysis of
high-throughput community sequencing data. Nature Methods 2010, 7, 335–336.
87. Holland, S.M. Analytic rarefaction. Available online: http://www.uga.edu/strata/software/
(accessed on 18 February, 2013).
88. Watanabe, M.; Yonezawa, T.; Lee, K.; Kumagai, S.; Sugita-Konishi, Y.; Goto, K.; Hara-Kudo, Y.
Molecular phylogeny of the higher and lower taxonomy of the Fusarium genus and differences in
the evolutionary histories of multiple genes. BMC Evol. Biol. 2011, 11, 322.
89. Porter, T.M.; Golding, G.B. Factors that affect large subunit ribosomal DNA amplicon sequencing
studies of fungal communities: Classification method, primer choice, and error. Plos One 2012, 7,
e35749.
90. Pukkila, P.J.; Skrzynia, C. Frequent changes in the number of reiterated ribosomal-RNA genes
throughout the life-cycle of the basidiomycete Coprinus cinereus. Genetics 1993, 133, 203–211.
91. Rooney, A.P.; Ward, T.J. Evolution of a large ribosomal RNA multigene family in filamentous
fungi: birth and death of a concerted evolution paradigm. Proc. Natl. Acad. Sci. USA 2005, 102,
5084–5089.
92. Klappenbach, J.A.; Dunbar, J.M.; Schmidt, T.M. RRNA operon copy number reflects ecological
strategies of bacteria. Appl. Environ. Microbiol. 2000, 66, 1328–1333.
93. Amend, A.S.; Seifert, K.A.; Bruns, T.D. Quantifying microbial communities with 454
pyrosequencing: does read abundance count? Mol. Ecol. 2010, 19, 5555–5565.
Diversity 2013, 5
98
94. Medinger, R.; Nolte, V.; Pandey, R.V.; Jost, S.; Ottenwalder, B.; Schlotterer, C.; Boenigk, J.
Diversity in a hidden world: potential and limitation of next-generation sequencing for surveys of
molecular diversity of eukaryotic microorganisms. Mol. Ecol. 2010, 19 (Suppl. 1), 32–40.
95. Prosser, J.I. Replicate or lie. Environ. Microbiol. 2010, 12, 1806–1810.
96. Van de Peer, Y.; Bonnet, E. ZT: A software tool for simple and partial Mantel tests. J. Stat. Soft.
2002, 7, 1–12.
97. XLSTAT. Available online: http://www.xlstat.com/ (accessed on 18 February, 2013).
98. Damon, C.; Lehembre, F.; Oger-Desfeux, C.; Luis, P.; Ranger, J.; Fraissinet-Tachet, L.; Marmeisse,
R. Metatranscriptomics reveals the diversity of genes expressed by eukaryotes in forest soils. Plos
One 2012, 7, e28967.
© 2013 by the authors; licensee MDPI, Basel, Switzerland. This article is an open access article
distributed under the terms and conditions of the Creative Commons Attribution license
(http://creativecommons.org/licenses/by/3.0/).