49652 - github pages
TRANSCRIPT

TEAM#49652 Page 1 of 28
1
For office use only
T1 ________________
T2 ________________
T3 ________________
T4 ________________
Team Control Number
49652
Problem Chosen
C
For office use only
F1 ________________
F2 ________________
F3 ________________
F4 ________________
2016
MCM/ICM
Summary Sheet
Finding The Optimal Investment Strategy
Based on the MPT and Q-value-based Method
In order to improve the educational performance of the undergraduates in the
United States, we establish a mathematical model based on the Markowitz Portfolio
Theory and adopt the Q-value-based method to give the 1 to N optimized and
prioritized candidate list of the colleges.
We screen out nine evaluation indicators with the method of correlation analysis
and clustering analysis, such as completion rate of the students, proportion of students
receiving the federal student loan and so on.
The most significant factor we focus on is the return on the charitable investment
(ROI), which has the positive relationship with students’ burden level and the
effectiveness of the donation. More specifically, students’ burden level is measured by
the tuition fee and percentage of students who receive a Pell Grant or a federal student
loan, while the effectiveness of the donation is related to the graduation rate, future
income and tuition fee. Moreover, ROI follows the principle of diminishing marginal
utility.
With the definition of ROI and the Markowitz Portfolio model, we can calculate
the Q-value of each college. Then, we use the Q-value-based method to make the
optimal charitable investment strategy. We add the memory factor to the ROI
calculation formula and obtain the variation trend of investment in the next few years
to get the time duration. What’s more, we test our model by sensitivity analysis. In the
test, we change the minimum investment amount to judge whether the strategy for the
investment changes a lot.
In the end, we extend our model by analyzing the impact of the disciplines
distribution on our result. Taking racial justice into consideration, we increase the
priority of the schools which mainly serve for black or native people.
Keywords: Markowitz Portfolio Theory, Q-value-based method, ROI, Justice

TEAM#49652 Page 2 of 28
2
Contents
1. Introduction: .......................................................................................................... 3
1.1 Overview ............................................................................................................................. 3
1.2 Our work ............................................................................................................................. 3
1.3 How the funding works ....................................................................................................... 4
2. Nomenclature and assumptions .............................................................................. 4
2.1Nomenclature ....................................................................................................................... 4
2.2 Assumptions ........................................................................................................................ 5
3 Data processing and selecting indicator .................................................................. 6
3.1 Data preprocessing .............................................................................................................. 6
3.2 Clustering analysis .............................................................................................................. 6
3.3 Major index selecting .......................................................................................................... 6
3.4 Indicators for the model improvement ................................................................................ 7
4. Model 1: The Maximizing ROI model based on the MPT ................................... 7
4.1 How to build the model ....................................................................................................... 7
4.2 Markowitz Portfolio Theory ............................................................................................... 8
4.3 Q-value-based method theory ............................................................................................. 9
4.4 First-year model implementation and the result ................................................................ 10
4.5 Prediction and analysis of the investment for the next four years ..................................... 13
4.7 Time period analysis ......................................................................................................... 18
5. Model 2: the ROI model based on the perspective of justification.................... 19
6. Sensitivity test ......................................................................................................... 21
7. Final remarks ......................................................................................................... 23
7.1 Strengths ........................................................................................................................... 23
7.2 Weakness: .......................................................................................................................... 24
7.3 Further model develop and improvement ......................................................................... 24
7.4 Conclusions ....................................................................................................................... 25
8. References ............................................................................................................... 26

TEAM#49652 Page 3 of 28
3
1. Introduction:
1.1 Overview
As the Lumina Foundation insists, for individual Americans, the consequences of
not completing postsecondary education are increasingly dire. Nowadays, more and
more large charities attach great importance to the high-level education.
We try the best to develop the appropriate model and give the optimal investment
strategy for the Goodgrant Foundation. The Goodgrant Foundation is a charitable
organization that wants to help improve college students’ educational performance in
the United States. In this report, we will detail a series of generic mathematical
models that choose the group of school of the most investment value according to the
database. As well as the optimal charitable investment strategy for the Goodgrant
Foundation, we give the definition of the return on investment(ROI) as the
decision-making basis for other charity organization.
The Gates Foundation[1]
specifically focuses on increasing opportunities for low
income students and students from diverse racial and cultural backgrounds.
Differently, the Lumina Foundation[2]
is working to improve the number of highly
educated people. These strategies are made by the large grant organizations based on
the analysis of college students’ current situation and do have obtained certain
achievements.
However, without copying these policy of other charities, we try to find and
establish the strategy from the investor’s perspective. Contacting the economic
principle and utilizing the economics model, our team gives the strategy to make the
highest ROI by donating money to the groups of schools which worth the investment
value, instead of these schools which need the investment.
1.2 Our work
The attached file provides various institution data. We transform the complicated
and unordered information into readable and exploitable form by computer program
of data processing. According to the model demand, we remove duplicate information,
correct the obvious error during the period of data cleaning. We use the cluster
analysis and the hierarchical analysis method to get the choice of major factors which
greatly influence the charitable investment decision. We build the ROI model, give
the definition of related variables and use the Markowitz Portfolio Theory to get the
optimal solution. In order to get the mean-variance efficient portfolios and the capital
market line, we separate the investment into two parts, one is the scholarship for
students and the another one is for the improvement of school infrastructure. Take the
tangent portfolio as the choice for the year investment. We consider the diminishing

TEAM#49652 Page 4 of 28
4
marginal utility and use the Q-value-based method[6]
to make the model close to the
reality. The marginal utility is of convex function which shows reduced susceptibility
to the same incentives. This effect makes us do the diversified choices to get the
highest ROI. Moreover, the attenuation utility shows the change of situation of the
college and we use the phenomenon to predict the time duration to have significant
positive effect on student educational performance.
1.3 How the funding works
Three kinds of influence exist:
Embodied in scholarship for outstanding students, motivating the students to
have better academic performance
Embodied in subsidies for needy students who require financial support,
letting more students finish the college study
Embodied in donations for improving the studying condition, such as setting
up the database and increasing the number of Multi-media classrooms.
2. Nomenclature and assumptions
2.1Nomenclature
The list of nomenclature used in this report
Abbreviation Description
𝑅𝑂𝐼𝑘 Return on investment in 𝑘𝑡ℎ year
𝑆𝑘 Sum of total income in 𝑘𝑡ℎ year
𝑃𝑘 total amount of the donation in 𝑘𝑡ℎ year
Θ𝑖𝑘 Income of the school i in 𝑘𝑡ℎ year
λ𝑖𝑘 Return on venture investment of the school i in 𝑘𝑡ℎ
year
λ𝑓𝑘
Return on risk-free investment in 𝑘𝑡ℎ year
effik
Level of effectiveness for the investment of the school i
in 𝑘𝑡ℎ year

TEAM#49652 Page 5 of 28
5
burik Level of burden of the school i in 𝑘𝑡ℎ year
𝑈𝐺𝐷𝑆𝑖k Total amount of the students
RET_FTik Retention rate of the students
Gradrateik Completion rate of the students
earn10ik Capability to make profit of the students
AVERAGENPT4ik Average tuition of the college i in 𝑘𝑡ℎ year
PCTFLOAN𝑖k Percent of students receiving a federal student loan
PCTPELLik Percentage of students receiving a Pell Grant
2.2 Assumptions
The amount of the charitable investment for each college has the minimum limit.
The amount of the funding is an integer multiple of USD 50,000.
Removing the colleges with plentiful missing data from the choice list will not
affect the accuracy of the final result.
There is no emergency which suddenly changes the condition of the college
educational performance.
The strategy of great charitable organization is appropriate and of reference value
The data is accurate and shows the real condition of the college.
The provided data is sufficient to judge the educational performance.
The investment to the college follows the principle of diminishing marginal
utility.
We only consider how to make the investment strategy. The colleges are able to
use the funding appropriately and efficiently.
No money remains to the next period for future use.

TEAM#49652 Page 6 of 28
6
3 Data processing and selecting indicator
3.1 Data preprocessing
The attached data file and the online EPIDS Database provide us with data of
7804 colleges and universities in the United States. The data includes various aspects
of the colleges’ information. We choose the 2977 candidate schools given in the file as
the choice for our charitable investment. After determining the scope of candidate
schools, we firmly believe that we should focus on the schools with complete data and
good fame. We delete these closed schools and the colleges whose data is completely
insufficient from the list of candidates, in order to get the final list. The rest 2600
colleges, with ample information, make up our choice scope of the investment
decision. Noticing that some of the data is missing, we adapt the interpolation method
to fill the data according to the correlation.
3.2 Clustering analysis
We get a total of 1721 kinds of elements covering all aspects of data for each
college. It is meaningless to take all of the aspects in to consideration. We use the R
language to do the clustering[3]
analysis of the data categories. The factors mirror the
condition of the colleges from six major aspects:
school basic information (tuition, scale, courses);
quality of the freshmen;
quality of the graduates;
satisfaction of the students;
burden if the students;
social evaluation.
Among the six major kinds of the data, we select 12 representative data to further
analyze whether the college is worth the investment.
Average tuition UG25abv C150_4_POOLED_SUPP
PCTPELL [7]
md_earn_wne_p10 gt_25k_p6
RET_FT4 GRAD_DEBT_MDN10YR_SUPP SAT_AVG_ALL
PCTFLOAN RPY_3YR_RT_SUPP UGDS
3.3 Major index selecting
First of all, we study the factors which Gates Foundation and other large charity
organization attach great importance to in their donating strategy. We calculate the
TEAM#49652 Page 7 of 28
7
correlation of the 14 elements and the 2015 large-scale charity funding scheme.We
can see that the large charity organization focus on RET_FT4, gt_25k_p6,
SAT_AVG_ALL, RPY_3YR_RT_SUPP, md_earn_wne_p10, C150_4_POOLED_SUP.
Three of the six elements, md_earn_wne_p10, RPY_3YR_RT_SUPP, gt_25k_p6 all
show the same aspect of the graduates. We select the md_earn_wne_p10 as the
representative to evaluate the capacity of making profit. There remain four key
elements: C150_4_POOLED_SUP, RET_FT4, SAT_AVG_ALL, md_earn_wne_p10,
RET_FT4.
Combining the document literature and our own experience, we recognized that
the student’s need for charitable fund also depend on the PCTFLOAN and PCTPELL.
Both of the two rates reflect the burden of students in the college. What’s more, the
amount of the Average tuition determines the extent of help fixed number of subsidies
give to each student, this is also the key factors affecting the efficiency of the
investment.
In conclusion, we get seven aspects of the reference data that play an important
role in measuring the efficiency of the investment.
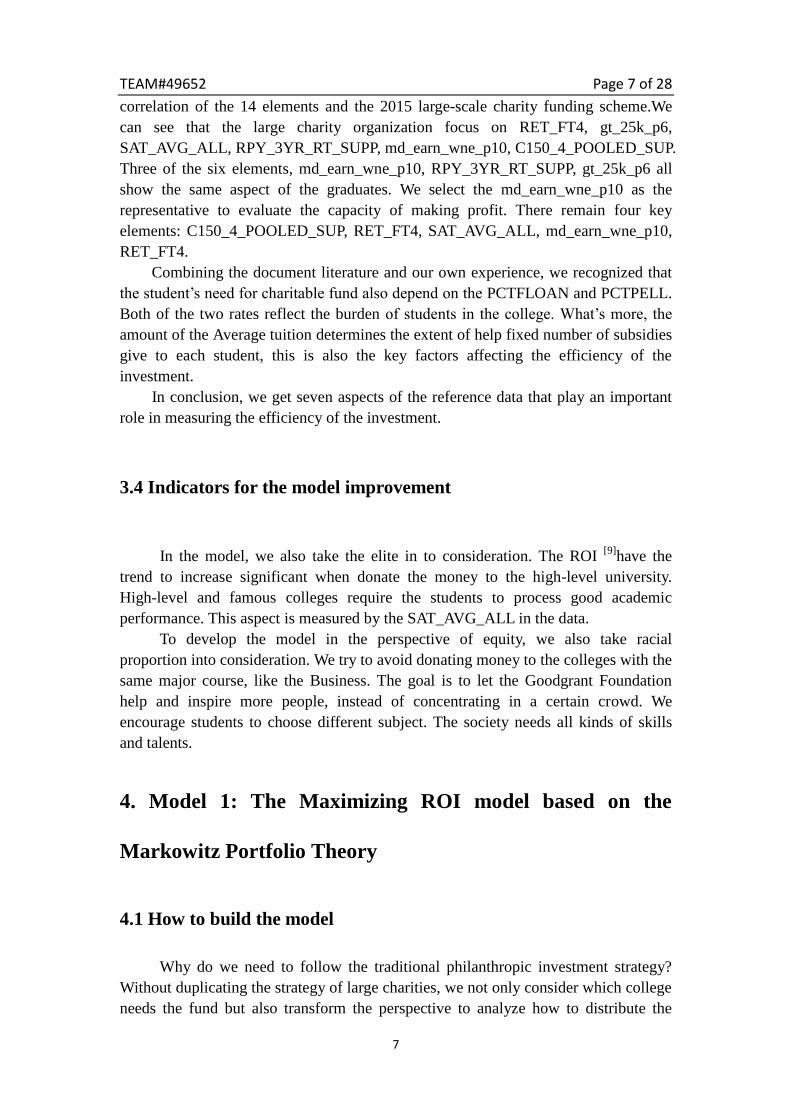
3.4 Indicators for the model improvement
In the model, we also take the elite in to consideration. The ROI [9]
have the
trend to increase significant when donate the money to the high-level university.
High-level and famous colleges require the students to process good academic
performance. This aspect is measured by the SAT_AVG_ALL in the data.
To develop the model in the perspective of equity, we also take racial
proportion into consideration. We try to avoid donating money to the colleges with the
same major course, like the Business. The goal is to let the Goodgrant Foundation
help and inspire more people, instead of concentrating in a certain crowd. We
encourage students to choose different subject. The society needs all kinds of skills
and talents.
4. Model 1: The Maximizing ROI model based on the
Markowitz Portfolio Theory
4.1 How to build the model
Why do we need to follow the traditional philanthropic investment strategy?
Without duplicating the strategy of large charities, we not only consider which college
needs the fund but also transform the perspective to analyze how to distribute the
TEAM#49652 Page 8 of 28
8
US100 million, in order to optimize the return on investment and achieve full use of
the funds to afford maximizing social benefits. We start from the perspective of
investor and change the task into making investment portfolio decisions. The aim is to
maximize the rate of return under the same level of risk. We consider two forms of
philanthropic investment, one for the personal students and one for the college
construction. One the one hand, the former one is of high risk due to the
indeterminacy. The student who receives the scholarship may drop out of school or
abuse the money. On the another hand, if the student benefits from the scholarship,
like being motivated and being able to complete the whole college study, the personal
investment is of relatively high return. The second kind of investment for construction
of the college, such as building database, expanding the library, can steadily benefit
all of the students. The function is stable and it takes a long period to have significant
positive influence. We think the former kind of investment is investing in risk assets.
Similarly, the investment for college construction is kind of risk-free assets
investment. So we change the question to analyze the portfolio in the background of
the above explain.
Two parts of the considerations in the charitable investment, the return rate and
the risk, exactly coincided with the hypothesis of Markowitz Portfolio Theory. So, we
can use the Markowitz Portfolio Theory to help us find the optimal strategy. What’
more, according to the discussion of the principle of diminishing marginal utility, we
already know it is not a good choice to make the decision for US100 million at one
time. We take the diminishing marginal utility of the one-school investment into
consideration and adopt the Q-value-based method to establish dynamic programming
model.[4] Separate the one-year investment into several stages and make the decision
respectively. Then we get the yearly optimal investment strategy and use the same
way to get the strategy for the next five years. In the last, by comparing the strategies
of different years, we judge the time duration that the money should be provided to
have a significant positive effect on students’ performance.
4.2 Markowitz Portfolio Theory
What is MPT[5]
? The concept behind MPT is that the assets in an investment
portfolio should not be chose merely individually, each on its own character. It is
important for us to consider how each asset might change in price relative to how
every other asset in the portfolio might change in price.
When we make an investment decision, it is a tradeoff between risk and expected
return. An efficient portfolio is said to be having a combination of at least two stocks
considering the minimum variance portfolio. MPT gives us the way to select a
portfolio with the highest possible expected return under a given amount of risk.
We decide to make a choice from N assets 𝑸 ( ).
We have the expected return for each asset as 𝑖 and the correlation coefficient
𝑖 between the returns on asset 𝐐 and 𝑸 , then we get the covariance matrix .
We definite the matrix ,

TEAM#49652 Page 9 of 28
9
If the amount of the investment is fixed, then the question to find the portfolio with
the highest rate is equal to find the weight vector which shows the distribution of
the investment. To find the portfolio with highest possible expected return under a
given amount of risk is equal to find the lowest risk under a given expected return .
(1)
s.t. (2)
(3)
With arithmetical operation, we can get the , which is called the mean-variance
frontier portfolio
We definite , , , ,
( ) , ( ) to simplify the expression of .
(4)
For each , we can find a . Give the with different value, we can get the
mean-variance frontier.
We try to find the relationship of the frontier portfolio’s variance . To make it easy
to understand, we define ( ), (
).
Then we can get the expression of the .
( )
( ) (5)
Every possible combination of the mean-variance frontier portfolio can be plotted in
risk-expected return space. Take the risk-free invest into consideration, the return rate
of the risk-free invest is 𝑓.Then we can get the tangent portfolio. And this portfolio
is the one we choose for the optimal strategy.
4.3 Q-value-based method theory
Q-value-based method[10]
is a kind of fair model for quota allocation which is
presented by an American mathematician in 1880. The main algorithm of the method
is to use the Q-value which is calculated by us to allocate the additional quota to the
candidate who has the highest Q-value. After one allocation, we recalculate the
Q-value and repeat the process until all quotas has been allocated. Through
Q-value-based method, we can allocate all of our investment reasonably and fairly.
In this case, we can get the Q-value from the Markowitz Portfolio Theory.

TEAM#49652 Page 10 of 28
10
According the basic economy theory, the efficiency of the investment will decrease
when the number of investment increases. Here we use infinitesimal dividing
modeling method to divide our contribution into many small parts, so that when we
invest the small part to a target school, the Q-value of the school can be assumed to be
constant. Then we allocate the small parts to the schools with Q-value method and
then we can achieve reasonable allocation.
4.4 First-year model implementation and the result
Seeking for the one-year optimal investment strategy, we consider the ROI as the
return rate resulting from the investment. The aim is to evaluate the efficiency of the
charitable investment. And in the model, we define the ROI as the measure of rates of
return on money donated to the group of school. It follows that:
𝑹𝑶𝑰 𝑺
𝑷 (6)
The total amount of the money is US100 million and the income of the portfolio
is the sum of the income resulting from each single invests.
𝑺 ∑ 𝜣 𝟔
= (7)
Then for each school , if the amount of the investment is 𝛗 ,and the
proportion of the risk-free investment is 𝑎, then the expression of the 𝜣 follows :
𝜣 ( ) 𝝋
𝝋
𝒇 (8)
Here, as we have made the explain fin the assumption, the rate is not the main
point of the discussion. The value of the 𝚯 equals to 𝝋
And how is the defined?Our team firmly believes that the ROI of the charitable
investment is closely related to the student’s burden level and the effectiveness of the
donation.
𝒖
∗ 𝒆𝒇𝒇 (9)
buri1 is measured by the students’ economic burden in the college, with the rate
showed an inverse relationship to 𝑷𝑪𝑻𝑷𝑬𝑳𝑳 . Likewise, the increase of the
𝐏𝐂𝐓𝐅𝐋𝐎𝐀𝐍 reduce the value of 𝐮
. The 𝐀𝐕𝐄𝐑𝐀𝐆𝐄𝐍𝐏𝐓𝟒 shows the level of
the tuition and is the main reason of the students’ economic burden. Increasing the
number of the investment has a positive effect to relieve the students’ economic
pressure. However, the number of students 𝑼𝑮𝑫𝑺 shows the proportion of the
students who can get the money. So, if the current investment amount is 𝝋 ,
𝒖 ( 𝑷𝑪𝑻𝑷𝑬𝑳𝑳
)( 𝑷𝑪𝑻𝑭𝑳𝑶𝑨 ) ∗ 𝑨𝑽𝑬𝑹𝑨𝑮𝑬 𝑷𝑻𝟒
𝝋
𝑼𝑮𝑫𝑺
(10)
Then the effectiveness of the investment is measured by the effective degree of
TEAM#49652 Page 11 of 28
11
unit investment. It has a positive relationship with 𝑮 𝒕𝒆 ,𝑹𝑬𝑻_𝑭𝑻
and the
scale of the school. The ability of the students to make profit shows the quality of the
college graduates which is the significant factor of the 𝒆𝒇𝒇 And the higher the
tuition is, the more the money student need to pay for the college, the less the
effectiveness is. So,
𝒆𝒇𝒇
𝒆 𝒌
𝑨𝑽𝑬𝑹𝑨𝑮𝑬 𝑷𝑻𝟒 ∗ (𝑼𝑮𝑫𝑺
∗ 𝑮 𝒕𝒆 ∗ 𝑹𝑬𝑻_𝑭𝑻
) (11)
We can get all the numerical value of the parameters from the data given in the
attached file. We calculate the numeric value of the 𝜣 for the 2600 schools.
And we get the matrix defined before in the passage. 𝜣 𝜣
𝜣 𝟔
By processing data from 2007 to 2013, we can figure out the return rate of investment
for different colleges and get the covariance matrix [8].
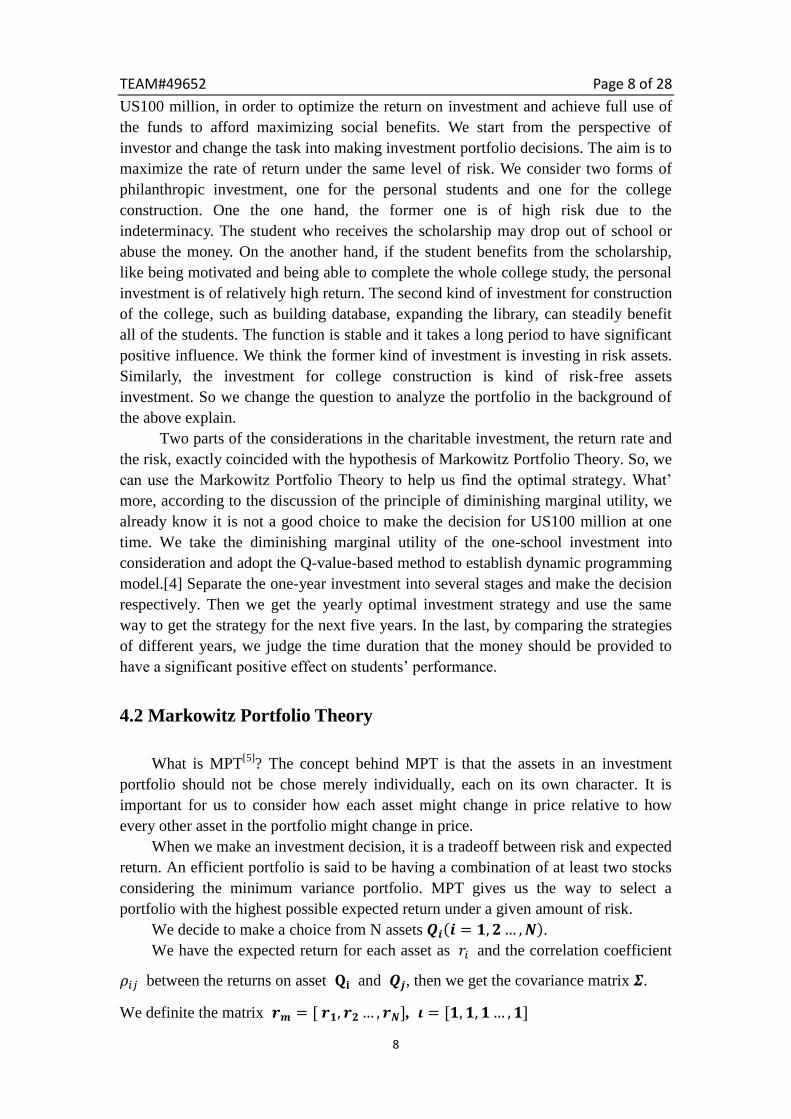
In order to get the optimal investment strategy and maximize the efficiency, we
adopt the Q-value-based method to separate the investment into 20 stages. At each
stage, we make the decision of the allocation of US 500,000. Then use the Markowitz
portfolio model to get the mean-variance frontier, and further get the tangent
portfolio.
According to the assumption, the minimum number of the investment is US
50,000. We choose the college due to ranking the weight of the vector .
Table 1. First stage of the investment
Ranking University 𝚯
1 Texas A & M University-College Station 16.0704
2 University of California-Berkeley 15.8561
3 University of Michigan-Ann Arbor 15.8299
4 University of California-Los Angeles 15.8021
5 University of Florida 15.7845
6 The University of Texas at Austin 15.7393
7 Texas A & M University-College Station 15.8949
8 University of Illinois at Urbana-Champaign 15.6311
9 University of Maryland-College Park 15.6033
10 University of Washington-Seattle Campus 15.6447
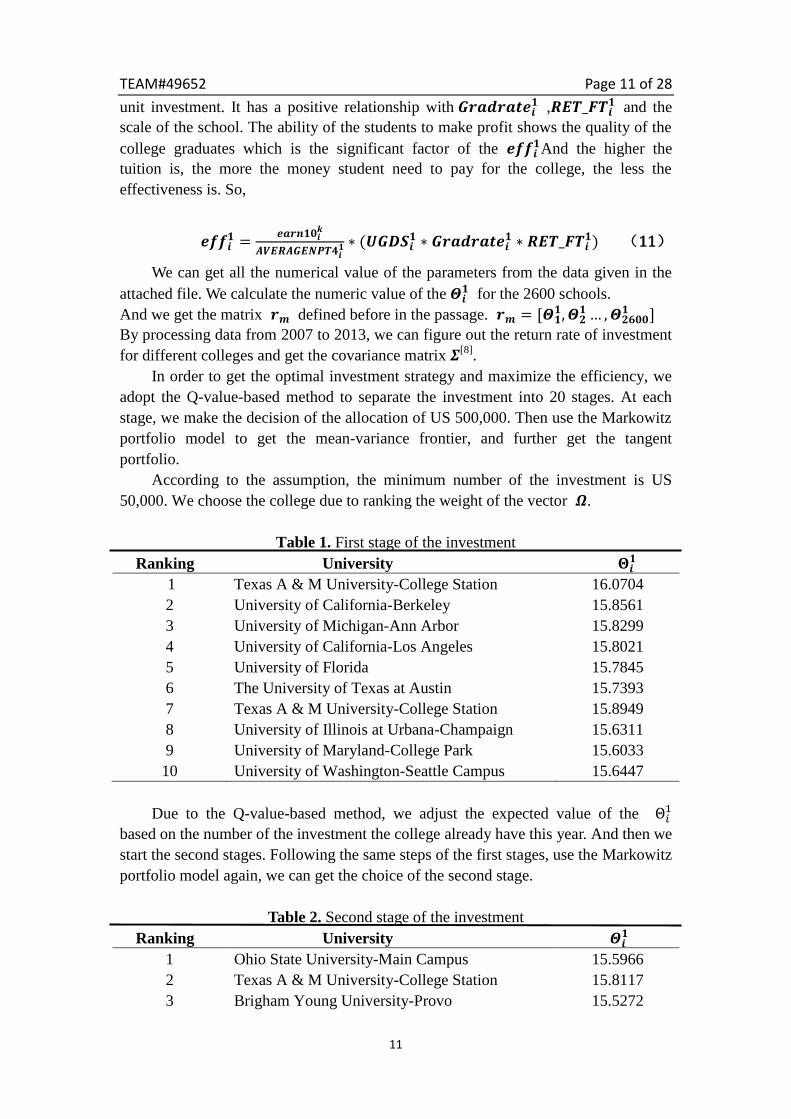
Due to the Q-value-based method, we adjust the expected value of the Θ𝑖1
based on the number of the investment the college already have this year. And then we
start the second stages. Following the same steps of the first stages, use the Markowitz
portfolio model again, we can get the choice of the second stage.
Table 2. Second stage of the investment
Ranking University 𝜣
1 Ohio State University-Main Campus 15.5966
2 Texas A & M University-College Station 15.8117
3 Brigham Young University-Provo 15.5272
TEAM#49652 Page 12 of 28
12
4 University of Wisconsin-Madison 15.5243
5 Texas A & M University-College Station 15.7486
6 Harvard University 15.351
7 Texas A & M University-College Station 15.6976
8 Georgia Institute of Technology-Main Campus 15.3861
9 University of California-Berkeley 15.6404
10 Michigan State University 15.4814
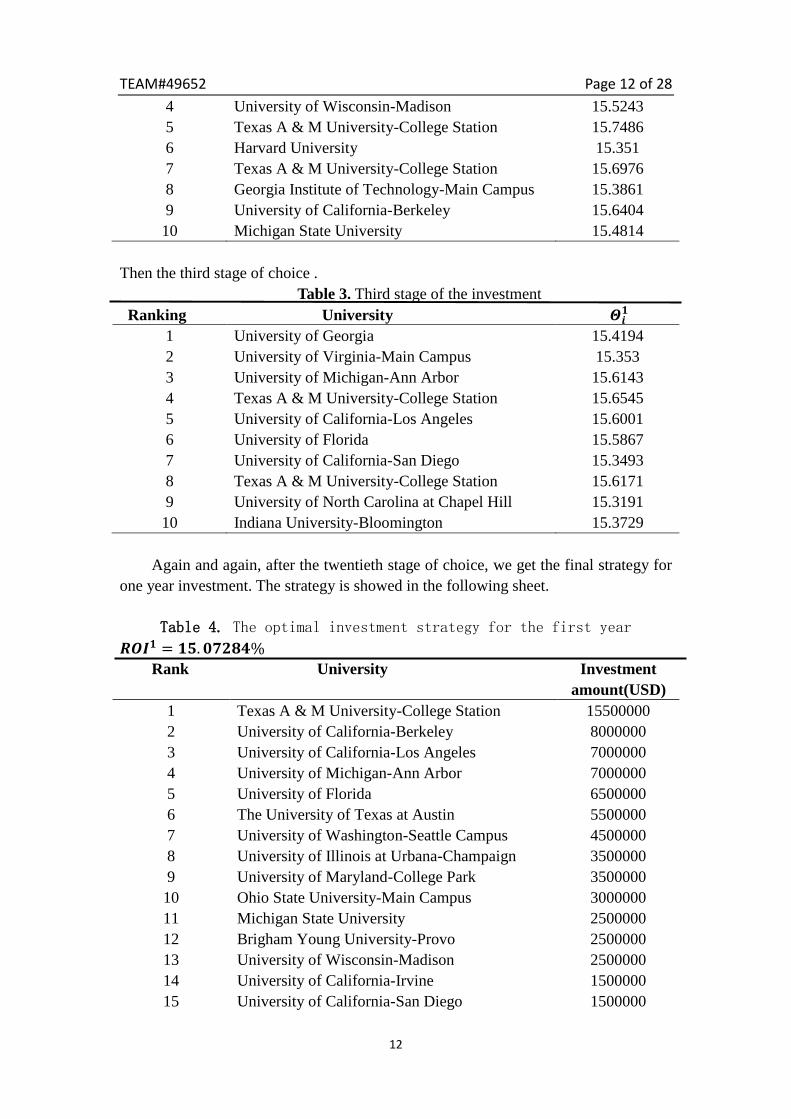
Then the third stage of choice .
Table 3. Third stage of the investment
Ranking University 𝜣
1 University of Georgia 15.4194
2 University of Virginia-Main Campus 15.353
3 University of Michigan-Ann Arbor 15.6143
4 Texas A & M University-College Station 15.6545
5 University of California-Los Angeles 15.6001
6 University of Florida 15.5867
7 University of California-San Diego 15.3493
8 Texas A & M University-College Station 15.6171
9 University of North Carolina at Chapel Hill 15.3191
10 Indiana University-Bloomington 15.3729
Again and again, after the twentieth stage of choice, we get the final strategy for
one year investment. The strategy is showed in the following sheet.
Table 4. The optimal investment strategy for the first year
𝑹𝑶𝑰 𝟓. 𝟕 𝟖𝟒%
Rank University Investment
amount amount(USD)
1 Texas A & M University-College Station 15500000
2 University of California-Berkeley 8000000
3 University of California-Los Angeles 7000000
4 University of Michigan-Ann Arbor 7000000
5 University of Florida 6500000
6 The University of Texas at Austin 5500000
7 University of Washington-Seattle Campus 4500000
8 University of Illinois at Urbana-Champaign 3500000
9 University of Maryland-College Park 3500000
10 Ohio State University-Main Campus 3000000
11 Michigan State University 2500000
12 Brigham Young University-Provo 2500000
13 University of Wisconsin-Madison 2500000
14 University of California-Irvine 1500000
15 University of California-San Diego 1500000

TEAM#49652 Page 13 of 28
13
16 De Anza College 1500000
17 University of Central Florida 1500000
18 Georgia Institute of Technology-Main Campus 1500000
19 University of Georgia 1500000
20 Indiana University-Bloomington 1500000
21 Pennsylvania State University-Main Campus 1500000
22 University of California-Davis 1000000
23 Harvard University 1000000
24 Rutgers University-New Brunswick 1000000
25 University of North Carolina at Chapel Hill 1000000
26 Virginia Polytechnic Institute and State
University 1000000
27 University of Virginia-Main Campus 1000000
28 Purdue University-Main Campus 1000000
29 Arizona State University-Tempe 500000
30 California Polytechnic State University-San
Luis Obispo 500000
31 University of California-Santa Barbara 500000
32 San Diego State University 500000
33 University of Southern California 500000
34 University of Connecticut 500000
35 University of Delaware 500000
36 Florida State University 500000
37 Louisiana State University and Agricultural &
Mechanical College 500000
38 University of Minnesota-Twin Cities 500000
39 Princeton University 500000
40 Columbia University in the City of New York 500000
41 Cornell University 500000
42 New York University 500000
43 North Carolina State University at Raleigh 500000
44 University of Pennsylvania 500000
45 Clemson University 500000
46 James Madison University 500000
47 Stanford University 500000
4.5 Prediction and analysis of the investment for the next four years
Our contributions need a kind of continuity of certain period of time, while
repeated investment will decrease the efficiency of investment. Therefore we need to
introduce a factor to remember the investment the school has achieved which will
decrease the ROI after a yearly contribution. When we take this factor into account
and adopt the same allocation strategy as we used before, we will get the investment

TEAM#49652 Page 14 of 28
14
of the next five years.
strategy for the second year:
Table 5. The optimal investment strategy for the second year
𝑹𝑶𝑰 𝟓. 𝟓𝟕%
Rank University Investment
amount amount(USD)
1 Texas A & M University-College Station 15500000
2 University of California-Berkeley 7500000
3 University of California-Los Angeles 7000000
4 University of Michigan-Ann Arbor 7000000
5 University of Florida 6500000
6 The University of Texas at Austin 5500000
7 University of Washington-Seattle Campus 4500000
8 University of Illinois at Urbana-Champaign 3500000
9 University of Maryland-College Park 3500000
10 Ohio State University-Main Campus 3000000
11 Michigan State University 2500000
12 Brigham Young University-Provo 2500000
13 University of Wisconsin-Madison 2500000
14 University of California-Irvine 1500000
15 De Anza College 1500000
16 University of Central Florida 1500000
17 Georgia Institute of Technology-Main Campus 1500000
18 University of Georgia 1500000
19 Indiana University-Bloomington 1500000
20 Pennsylvania State University-Main Campus 1500000
21 University of Alaska Anchorage 1000000
22 University of California-Davis 1000000
23 University of California-San Diego 1000000
24 Harvard University 1000000
25 Rutgers University-New Brunswick 1000000
26 University of North Carolina at Chapel Hill 1000000
27 Virginia Polytechnic Institute and State
University 1000000
28 University of Virginia-Main Campus 1000000
29 Purdue University-Main Campus 1000000
30 Arizona State University-Tempe 500000
31 California Polytechnic State University-San
Luis Obispo 500000
32 University of California-Santa Barbara 500000
33 San Diego State University 500000
34 University of Southern California 500000

TEAM#49652 Page 15 of 28
15
35 University of Connecticut 500000
36 University of Delaware 500000
37 Florida State University 500000
38 Louisiana State University and Agricultural &
Mechanical College 500000
39 University of Minnesota-Twin Cities 500000
40 Princeton University 500000
41 Columbia University in the City of New York 500000
42 Cornell University 500000
43 New York University 500000
44 North Carolina State University at Raleigh 500000
45 University of Pennsylvania 500000
46 Clemson University 500000
47 James Madison University 500000
48 Stanford University 500000
strategy for the third year
Table 6. The optimal investment strategy for the third year
𝑹𝑶𝑰𝟑 𝟒. 𝟗𝟓𝟕𝟕𝟑%
Rank University Investment
a amount(USD)
1 Texas A & M University-College Station 13000000
2 University of California-Berkeley 8000000
3 University of California-Los Angeles 7000000
4 University of Florida 6500000
5 University of Michigan-Ann Arbor 6500000
6 The University of Texas at Austin 5500000
7 University of Washington-Seattle Campus 4500000
8 University of Illinois at Urbana-Champaign 4000000
9 University of Maryland-College Park 3500000
10 Ohio State University-Main Campus 3500000
11 Brigham Young University-Provo 3000000
12 University of Wisconsin-Madison 3000000
13 Michigan State University 2500000
14 De Anza College 2000000
15 University of Georgia 2000000
16 Indiana University-Bloomington 2000000
17 Pennsylvania State University-Main Campus 2000000
18 University of Alaska Anchorage 1500000
19 University of California-Davis 1500000
20 University of California-San Diego 1500000
21 University of Central Florida 1500000
22 Georgia Institute of Technology-Main Campus 1500000
TEAM#49652 Page 16 of 28
16
23 Harvard University 1500000
24 University of North Carolina at Chapel Hill 1500000
25 University of Virginia-Main Campus 1500000
26 Purdue University-Main Campus 1500000
27 Florida State University 1000000
28 University of Minnesota-Twin Cities 1000000
29 Rutgers University-New Brunswick 1000000
30 Virginia Polytechnic Institute and State
University 1000000
31 California State University-Fullerton 500000
32 University of Colorado Boulder 500000
33 Yale University 500000
34 Georgetown University 500000
35 Iowa State University 500000
36 Boston University 500000
37 CUNY Bernard M Baruch College 500000
38 Vanderbilt University 500000
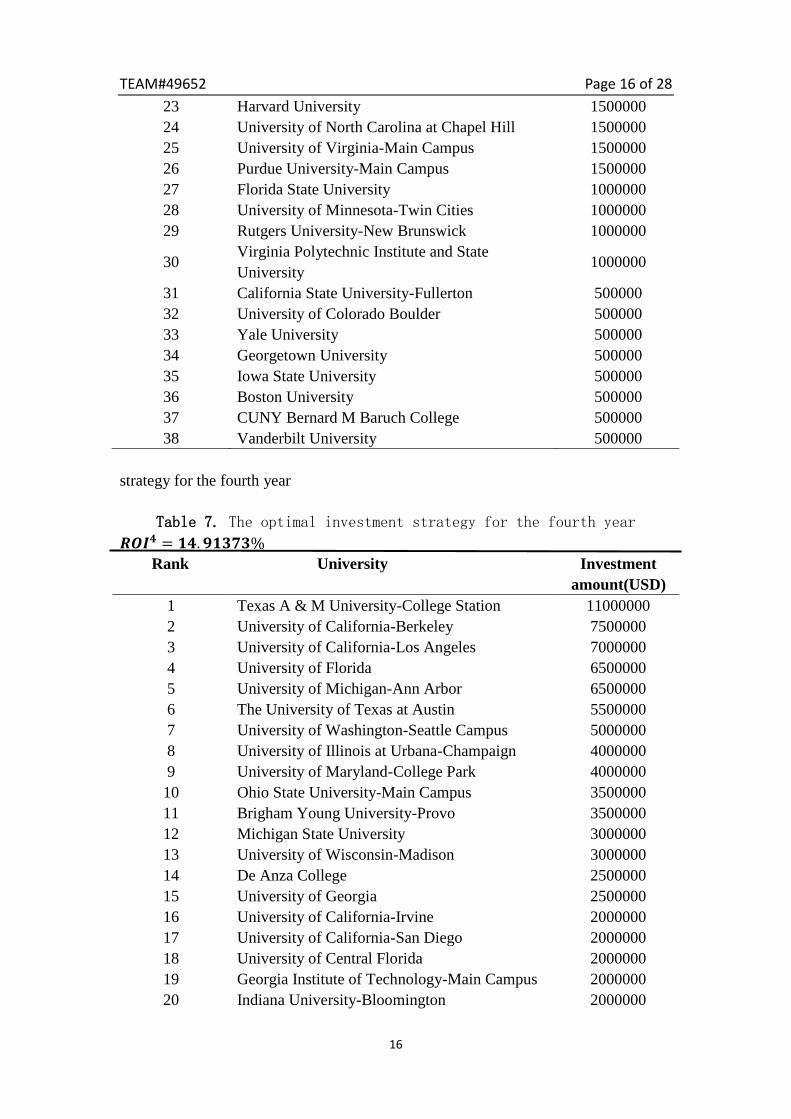
strategy for the fourth year
Table 7. The optimal investment strategy for the fourth year
𝑹𝑶𝑰𝟒 𝟒. 𝟗 𝟑𝟕𝟑%
Rank University Investment
amount amount(USD)
1 Texas A & M University-College Station 11000000
2 University of California-Berkeley 7500000
3 University of California-Los Angeles 7000000
4 University of Florida 6500000
5 University of Michigan-Ann Arbor 6500000
6 The University of Texas at Austin 5500000
7 University of Washington-Seattle Campus 5000000
8 University of Illinois at Urbana-Champaign 4000000
9 University of Maryland-College Park 4000000
10 Ohio State University-Main Campus 3500000
11 Brigham Young University-Provo 3500000
12 Michigan State University 3000000
13 University of Wisconsin-Madison 3000000
14 De Anza College 2500000
15 University of Georgia 2500000
16 University of California-Irvine 2000000
17 University of California-San Diego 2000000
18 University of Central Florida 2000000
19 Georgia Institute of Technology-Main Campus 2000000
20 Indiana University-Bloomington 2000000

TEAM#49652 Page 17 of 28
17
21 Pennsylvania State University-Main Campus 2000000
22 University of Virginia-Main Campus 2000000
23 University of California-Davis 1500000
24 Rutgers University-New Brunswick 1500000
25 Virginia Polytechnic Institute and State
University 1500000
26 University of Southern California 1000000
27 Cornell University 1000000
28 University of Pennsylvania 1000000
29 University of Arizona 500000
30 California State University-Long Beach 500000
31 University of South Florida-Main Campus 500000
32 Northwestern University 500000
33 University of Notre Dame 500000
34 University of Iowa 500000
35 University of Missouri-Columbia 500000
strategy for the fifth year
Table 8. The optimal investment strategy for the fifth year
𝑹𝑶𝑰𝟒 𝟒. 𝟖𝟔 𝟑 %
Rank University Investment
amount amount(USD)
1 Texas A & M University-College Station 9000000
2 University of California-Berkeley 7500000
3 University of California-Los Angeles 6500000
4 University of Florida 6000000
5 University of Michigan-Ann Arbor 6000000
6 The University of Texas at Austin 5000000
7 University of Washington-Seattle Campus 5000000
8 University of Illinois at Urbana-Champaign 4000000
9 University of Maryland-College Park 4000000
10 Ohio State University-Main Campus 3500000
11 Brigham Young University-Provo 3500000
12 University of Georgia 3000000
13 Michigan State University 3000000
14 University of Wisconsin-Madison 3000000
15 University of California-Irvine 2500000
16 Georgia Institute of Technology-Main Campus 2500000
17 Indiana University-Bloomington 2500000
18 University of California-Davis 2000000
19 University of California-San Diego 2000000
20 University of Central Florida 2000000

TEAM#49652 Page 18 of 28
18
21 Harvard University 2000000
22 University of North Carolina at Chapel Hill 2000000
23 Pennsylvania State University-Main Campus 2000000
24 Purdue University-Main Campus 2000000
25 University of Alaska Anchorage 1500000
26 Florida State University 1500000
27 Rutgers University-New Brunswick 1500000
28 Virginia Polytechnic Institute and State
University 1500000
29 De Anza College 1000000
30 University of Minnesota-Twin Cities 1000000
31 The University of Alabama 500000
32 University of South Carolina-Columbia 500000
33 George Mason University 500000
The following graph reveals the change of investment of the top 5 schools in the
next five years.
Figure 1. The change of investment of the top 5 schools in the next five years
We find that the investment will be evenly contributed as time flows. Our
contribution will become more balanced. This result reflects our assumption that
repeated investment will lead to low efficiency.
4.7 Time period analysis
We also make the investment change in the next 9 years.

TEAM#49652 Page 19 of 28
19
Figure 2. The investment to the top 4 schools in the following 5 years
We conclude that about seven years, our investment will have evident change
and our plan will improve the balance of education resources. This change shows the
significant positive effect on the college students’ educational performance. And the
time period that her money should be provided is Seven years.
5. Model 2: the ROI model based on the perspective of
justification
When we calculate the ROI of every school, we ignore the distribution of the
discipline. Meanwhile, we have not taken whether the school is predominantly
serving for the black or native people. To make our contribution more fairly, we need
to take these indexes into account.
Firstly, we analyze the correlation between the contributions and the discipline
distribution. Here we classify the disciplines into Humanities, Science and
Engineering, Business and Others. We use the proportion of graduates of every
subject to represent the discipline distribution of every school.
We make the contributions vector: contribution, proportion of humanity vector:
humanity, proportion of science and engineering: business, vector proportion of
business vector proportion of others vector: others. By calculating the correlation
between contribution and liberal, science and others, we can judge whether the
distribution of disciplines will affect our contributions.
The formula of the correlation coefficient is as follows:
TEAM#49652 Page 20 of 28
20
))(()()(
))((
1
22
1
22
1
1 1
22
1
n
i
i
n
i
i
n
i
ii
n
i
n
i
ii
n
i
ii
ynyxnx
yxnyx
yyxx
yyxx
r
(12)
Table 9. Correlation between contribution and disciplines
Correlation humanity science business others
contribution -0.156 0.134 -0.095 0.045
We find that contributions and discipline distribution only have a weak
correlation, so that our contribution is nearly fair to every discipline.We find that we
fail to give our contributions to the school which is predominantly serving for the
back and native people. To make our contribution fairer for races or regions, we can
change our former strategy to calculate Q-value. We can raise the priority for these
schools by introducing a coefficient: bn. If the school is mainly serving for black or
native people, the assignment can be larger than 1. Otherwise, the assignment of bn is
1.
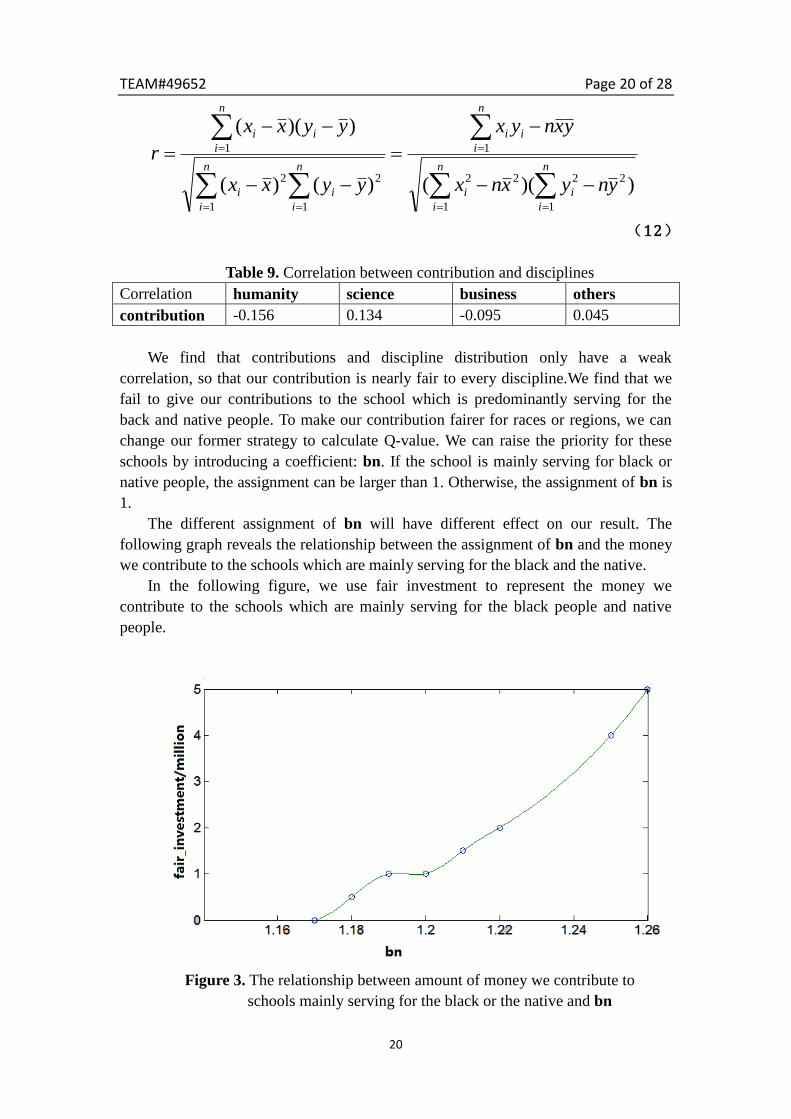
The different assignment of bn will have different effect on our result. The
following graph reveals the relationship between the assignment of bn and the money
we contribute to the schools which are mainly serving for the black and the native.
In the following figure, we use fair investment to represent the money we
contribute to the schools which are mainly serving for the black people and native
people.
Figure 3. The relationship between amount of money we contribute to
schools mainly serving for the black or the native and bn

TEAM#49652 Page 21 of 28
21
We conclude from the figure that we need to set the coefficient larger than 1.17
or we will make no change. Meanwhile, we find that when the coefficient is smaller
than 1.27, there is only one school serving for the native (UAA) can be contributed.
When the coefficient keeps growing, most of the money will go to UAA. It reflects
that most schools which is serving for the black or the native have too low ROI. As a
result, the assignment of 1.2 is a reasonable choice. Based on the choice of the bn,
another optimal investment strategy is available with the same steps in the Model 1.
6. Sensitivity test
In previous section, we assume that the minimum investment amount is 1 million
dollars. This assumption of this value is based on experience. Therefore, we need to
change the value of minimum investment amount to see whether it is rational. To save
space, we only listed the top 5 universities.
Table 10. Rank of the investment on universities (min_investment=250,000)
Rank University Investment amount ROI
1 TAMU 16250000 15.0889
2 UCB 8250000 15.0822
3 UCLA 7250000 15.0788
4 UM 7250000 15.0887
5 UFL 6750000 15.0848
Table 11. Rank of the investment on universities (min_investment=500,000)
Rank University Investment amount ROI
1 TAMU 15500000 15.109
2 UCB 8000000 15.0923
3 UCLA 7000000 15.0901
4 UM 7000000 15.1
5 UFL 6500000 15.0967
Table 12. Rank of the investment on universities (min_investment=1,000,000)
Rank University Investment amount ROI

TEAM#49652 Page 22 of 28
22
1 TAMU 15000000 15.1226
2 UCB 7000000 15.135
3 UCLA 6000000 15.1378
4 UFL 6000000 15.1215
5 UM 6000000 15.1483
Table 13. Rank of the investment on universities (min_investment=1,250,000)
Rank University Investment amount ROI
1 TAMU 13750000 15.1578
2 UCB 6250000 15.1698
3 UCLA 6250000 15.1254
4 UM 6250000 15.1357
5 UFL 5000000 15.1756
Table 14. Rank of the investment on universities (min_investment=2,000,000)
Rank University Investment amount ROI
1 TAMU 10000000 15.276
2 UCB 6000000 15.182
3 UCLA 4000000 15.2535
4 UFL 4000000 15.2381
5 UM 4000000 15.2649
Table 15. Rank of the investment on universities (min_investment=2,500,000)
Rank University Investment amount ROI
1 TAMU 7500000 15.3712
2 UCB 5000000 15.235
3 UCLA 5000000 15.1915
4 UM 5000000 15.2024
5 UC Davis 2500000 14.882

TEAM#49652 Page 23 of 28
23
Figure 4. ROI curve of different minimum investment amount
By comparing the above tables, we find that the top 5 universities are almost
identical, which means that our model is insensitive to the change of the minimum
investment amount. However, the funds invested in the universities vary from year to
year.
What’s more, it can be seen from Figure 1 that selecting 1,000,000 dollars as the
minimum investment amount not only has a high ROI, but also simplify the allocation
of funds.
7. Final remarks
7.1 Strengths
We make full use of the datum from the database provided by IPEDS,
including the historical datum from 2007 to 2013. As a result, we do have a
more comprehensive assessment of the schools. We try the best to include
more potential effective indicators in the process of modeling in order to
have a comprehensive strategy.
We combine the charitable investment with the economic theory. View the
task with the prospective from the investor. The model based on the MPT
and Q-value-based method is effective in finding the optimal investment
strategy.

TEAM#49652 Page 24 of 28
24
We make use of Q-value-based method to allocate the contribution
reasonably. We combine Q-value method and Markowitz Mean-Variance
Model with each other to avoid the weakness of Q-value based method that
lacks criteria for evaluation and the weakness of MPT that ignores the
influence of investment on the change of Q-value.
We take some indexes like the distribution of courses of the college and the
racial justice into consideration in order to ensure the justification of the
strategy.
We introduce the memory factor to adjust the Q-value according to the
historical investment so our contribution will become more appropriate in
the next five years.
7.2 Weakness:
Some of the colleges lack part of the dat. We have to fill them by analyzing
the relation with other datum. However, these hypothetical data may not
reflect the real educational performance of these colleges.
The formula of efficiency and burden is mainly based on our study of large
amounts of documents and combined with our experimental hypothesis.
Therefore, it may lack accuracy.
Our model takes the risk-free investment into consideration. However, with
insufficient relevant data, it is a challenge for us to calculate the exact
return rate of the risk-free charitable investment.
7.3 Further model develop and improvement
Since the volatility of different colleges’ ROI and the correlation between
colleges are inconspicuous, we need to optimize our index of risk. We could take the
uncertainty of the performance of the student who achieved our contribution into the
risk analysis in the future. By using the data of the income distribution, we can
analyze the uncertainty of the investment more reasonably.
Since we have little data about the college’s reflection to the charitable
investment, the influence to the colleges is based on the analysis of documents and
our conjecture. In the future development of the model, we should observe the effects
of the investment in order to better understand the college transforming process.

TEAM#49652 Page 25 of 28
25
7.4 Conclusions
We establish the model to find the optimal charitable investment. Firstly, we
handle the data from the attached fire and choose the major factors. Then we establish
the model for highest ROI based on the MPT and Q-value-based method. In order to
take the fairness in to considerable, we add the racial rate and colleges’ category to the
new model. We get the strategy for the Goodgrant Foundation in the coming five
years according to some valuable kinds of data. Finally ,we know that the time period
of the money should be provided to have significant good influence to the educational
performance is 7 years.
TEAM#49652 Page 26 of 28
26
8. References
[1]http://www.gatesfoundation.org/What-We-Do/US-Program/Washington-State/Educ
ation-Pathways
[2]https://www.luminafoundation.org/files/resources/2013-lumina-strategic-plan.pdf
[3] Xu R,Wunsch D. Survey of clustering algorithms[J]. IEEE Trans on Neural
Networks, 2005, 16(3): 645-678.
[4] Wu H, Zeng Y, Yao H. Multi-period Markowitz’s Mean-Variance Portfolio
Selection with State-dependent Exit Probablity. Economic Modelling, 2014,36:69-78
[5] Harry Markowitz. Portfolio Selection[J]. The Journal of Finance, 1952,7:77-91
[6] Huntley I D, James D J G. Mathematical Modelling [M]. Oxford: Oxford
University Press, 1990.
[7] http://www.simpletuition.com/pell-grant/
[8] https://collegescorecard.ed.gov
[9]Boyd J, Epanchinniell R, Siikamäki J. Conservation Planning: A Review of Return
on Investment Analysis[J]. Review of Environmental Economics & Policy, 2015, 9.
[10] Yang Y M, Sha F. The Multi-Attributes Seat Apportionment Model with Time
Series and Its Application[J]. Mathematics in Practice & Theory, 2012, 42(6):95-102.

TEAM#49652 Page 27 of 28
27
A letter to the Chief Financial Officer
Dear Mr. Alpha Chiang:
As is universally acknowledged, a rational university investment strategy is critical
for the improvement of educational performance of the undergraduates. In order to
achieve the goal of the Goodgrant Foundation, we establish a mathematical model
based on the Markowitz Portfolio Theory.
To begin with, the ROI of the charitable investment we proposed is proportional to
school size, students’ burden level and the effectiveness of the donation. More
specifically, we use the number of students to represent school size. Students’ burden
level includes the tuition fee and percentage of students who receive a Pell Grant or a
federal student loan, while the effectiveness of the donation is composed of
graduation rate, future wage and tuition fee. Moreover, ROI will decrease with the
increasement of the investment. The reduction extent is proportional to amount of
contributions and is inversely proportional to the number of smart students, while the
number of smart students is proportional to the graduation rate and retention rate.
The modeling method we employ is as follows: first of all, we use the correlation
analysis and cluster analysis to screen out six evaluation indicators, which are selected
with the consideration of avoiding the focus of other large grant organizations.
Then, we take advantage of the Q-value based method and establish a mathematical
model based on the Markowitz Portfolio Theory model to give a 1 to N optimized and
prioritized candidate list of schools. With regard to the time duration after which the
donations start to work, we introduce the historical investment factor to the ROI
calculation formula. And the years when the rankings of the universities vary a lot
from the first year’s is defined as the required time.
The major result of our optimal investment strategy is as follows, while the time
duration is around 7 years. (To save space, we only list the top five universities)
Table .Rank of the investment on universities (min_investment=500,000)
Rank University Investment amount ROI
1 TAMU 15500000 15.109
2 UCB 8000000 15.0923
3 UCLA 7000000 15.0901
4 UM 7000000 15.1
5 UFL 6500000 15.0967

TEAM#49652 Page 28 of 28
28
It is obvious that the top five universities enjoy a high reputation, which means that
investing these universities will have the highest likelihood of improving the
performance of the undergraduates.
One of the advantages of our model is that we make full use of all kinds of data of the
IPEDS database, including the data of the last six years. In this case we make a full
assessment of the situations of the universities and find out as many effective
indicators as possible to quantify the benefit of the donation meanwhile.
Another advantage of our model is universally applicable. Due to the fact that we
introduce the historical investment factor in the ROI calculation formula, we can
apply the model across both long term and short term investment. Therefore, our
model has high practical value.
We hope that our model and candidate list of schools we proposed can be of
remarkably use to you.
Sincerely yours,
Team 49652