4fqufncfs 'jobodjbm %bub bt pg +vof %fqbsunfou pg #boljoh 5fybt %fqbsunfou pg 4bwjoht boe...
TRANSCRIPT
Texas Department of BankingTexas Department of Savings and Mortgage Lending
September 2014
Financial Data as of June 30, 2014

TABLE OF CONTENTS
Economic Review and Outlook…………..…………………………... 1
Performance Summary and Profile of Texas Banking System…. 8
Performance Summary of United States Banking System…...…. 11
National Economic Trends……………………………………………. 17
Economic Reports and Forecasts………………………………….... 19
United States………………………………………………………. 19
State of Texas……………………………………………………… 24
Federal Reserve Bank Survey………………………………………… 28
Acknowledgements…………………………………………………….. 31
Symbols Used Throughout this Report:
Improving or strong conditions Deteriorating or weak conditions Mixed conditions Interest item
Abbreviations Used Throughout this Report:
FDIC – Federal Deposit Insurance Corporation OCC – Office of the Comptroller of the Currency FRB – Federal Reserve Board
2601 North Lamar Blvd. Austin, Texas 78705
This publication is also located on the Texas Finance Commission website: www.fc.texas.gov
For more information about this publication, you may contact Wendy Rodriguez, Director of Strategic Support with the Texas Department of Banking by telephone at (512) 475-1320 or by email [email protected].

ECONOMIC REVIEW AND OUTLOOK TEXAS BANKING SYSTEM
1
Source: FDIC
BANKING SYSTEM OVERVIEW The national economic outlook was recently addressed by Federal Reserve officials as they downgraded their expectations for U.S. economic growth in 2015, suggesting that they again overestimated the strength of the recovery. They further indicated interest rates will remain low after the bond-buying program ends. Media reports suggest that the Federal Reserve’s actions may draw concerns that the nation’s economic potential is faltering. However with little signs of a recession as unemployment remains well below the national average and job growth is strong, Texas’ outlook is brighter. Economic indicators suggest that the state’s economy will continue this trend for the rest of 2014. With the economy performing better, banks and thrifts in Texas have improved their balance sheets, specifically experiencing an improvement in earnings and asset quality. Loan demand over the last year has also improved. Construction of most types of commercial real estate — especially industrial buildings and offices — is now pulling ahead of where it was at the peak of the market in 2008. The continued job growth virtually across all sectors is aiding this renewed boom and the resurrection of the state bird – the construction crane. Another sign of improving conditions is the decline in problem banks; those receiving an overall CAMELS rating of “3,” “4,” or “5.”. The FDIC reports that nationally there are 60% less problem institutions today than at the peak of the first quarter in 2011. Of the 304 state banks and thrifts regulated by the Texas Department of Banking and the Texas Department of Savings and Mortgage Lending, less than 5% are classified as problem institutions as of September 2014. This is down from 20% at the peak in 2010. While balance sheets are improving, bankers are tackling regulatory challenges as provisions of Dodd-Frank are being implemented and present new constraints. The persistent drought and low-interest rate environment also continue testing financial institutions. The challenge for banks and savings banks to comply and stay abreast of the changing regulatory environment has proven difficult for smaller institutions. Even strong healthy banks are reporting that they are considering selling to larger institutions to improve the economies of scale and the ability to manage the regulatory burden. As mergers and consolidations continue, communities may see fewer options for financial services. The overall banking and thrift activity in Texas demonstrates that consolidations and mergers are continuing, with 35 fewer institutions as of June 30, 2014 compared to the same period in 2013 (see page 9). An analysis of the number of state banks in the state’s system shows that since 2007, there are 54 fewer state-chartered banks; however, the volume of assets under supervision has increased by $139 billion in the same time period. Saving banks increased by eight institutions since 2007, with assets growing by $1.3 billion.
Economic Review and Outlook: Texas Banking System Texas State Banking System Report

2
STATE-CHARTERED BANKING PROFILE (DEPARTMENT OF BANKING) The number of Texas state-chartered banks continued their downward trend during the first half of 2014, with 274 banks as of June 30, 2014 as compared to 283 banks at year-end 2013. The decline was predominantly due to nine mergers, five of which were mergers into other state banks, two merged into national banks, one merged with an out-of-state state-chartered bank, and one with a Texas state savings bank. In May 2014, one state-chartered bank closed voluntarily. In contrast, there was only one addition to the number of state-chartered banks in the first half of 2014 - the conversion of American Momentum Bank, College Station, Texas. Although there were several mergers causing a decline in the number of Texas state-chartered banks, the overall asset size increased due to a combination of internal asset growth, acquisition of national banks, and the charter conversion of American Momentum Bank. In this regard, the Texas state-chartered banking system grew from $216.5 billion at year-end 2013 to $225.5 billion by June 30, 2014. Of the increase in assets, $6.2 billion was due to normal asset growth, $1.5 billion was from acquisitions of national banks, and $0.9 billion was a result of a charter conversion. In a similar fashion to assets, the number of branch and loan/deposit production facilities increased despite the decline in the number of state banks. For example, the number of bank branches increased by 44 during the first half of the year to 2,314; similarly, the number of loan/deposit production facilities increased by eight to 126. STATE-CHARTERED THRIFT PROFILE (DEPARTMENT OF SAVINGS AND MORTGAGE LENDING) Increased profitability occurred in 50% of the thrift institutions since mid-2013, due to an increase in the volume of loans, and a decreased provision for loan loss. Only 6.67% of the thrift charters were unprofitable at mid-year 2014, which is exactly the same as mid-year 2013. Nonperforming loans and other real estate foreclosed decreased in state-chartered thrifts during the past twelve months from 5.56% of total assets to 4.28%. Based on institution specific information obtained through examinations, a majority of nonperforming assets in the industry were purchased as troubled as a business strategy and not organically originated. As such, they are generally subject to loss sharing agreements or other federal government agency guarantees and therefore do not pose a material supervisory risk. Past due and nonaccrual loans, and foreclosed real estate continue to be monitored closely by state and federal regulators. State-chartered thrift assets under the Department’s jurisdiction totaled $10.6 billion as of June 30, 2014, which represents an increase of 7.68% or $757.8 million from last year. The total number of state-chartered savings banks remains at thirty at mid-2014. The Department continues to receive and process applications. During the year, there have been seven branch office applications, two merger/reorganization applications, and various other types of applications. TEXAS ECONOMIC PROFILE The Texas economy reflects job gains and economic growth, which have positioned it to perform well and remain an economic leader. The overall cost of living and tax environment in Texas continues to favorably influence businesses and population growth. Several reasons for the shift in population include increasing employment opportunities, a lower cost of living, and less expensive land and homes. For businesses, the opportunities are in the abundance of land, business-friendly laws, and low taxes. Population
The State Demographer has indicated that Texas’ population increases by 1,000 people every day of the year, and will continue to grow with expectations of it doubling by 2060. Most recently, Kiplinger, a Washington, D.C. based publisher of business forecasts and personal finance advice, set out to
Economic Review and Outlook: Texas Banking System Texas State Banking System Report

3
determine which towns in the state were more affordable based on economic health and affordability. Clearly, Texas has a lower cost of living that is enticing to new residents.
Job Growth
With a diverse economy, experiencing notable growth in all non-agricultural sectors, Texas added jobs in 11 major industries including: • professional and business services • trade • transportation and utilities • leisure and hospitality • education and health services • construction
• mining and logging • government • financial activities • information • other services • manufacturing
This prosperity relates to strong job growth with Texas adding approximately 28% more jobs than the nation in July 2014. Texas is credited with being a business-friendly state, which has boosted a wide range of business activity over the years and resulted in more jobs for the state. Reports indicate that Texas has been creating or attracting middle- and high-wage jobs at a far faster pace than the rest of the country taken as a whole. The fastest-growing sector of the state’s economy continues to be the energy industry. Fracking and other new drilling techniques have allowed Texas oil production to expand. However, the professional and business services sector has experienced significant growth in the last several months signifying that job opportunities in this sector have grown and businesses are hiring. The state’s unemployment rate continues to steadily improve and is at 5.1% as of July 2014. This is a 1.3% improvement over July 2013. Overall, the national unemployment rate improved as well, and stands at 6.2%. For over seven years, the unemployment rate in the state has been below the national rate. Tax Revenue
Sales tax revenue for the state continues in an upward trend as increased spending continues. The Texas Comptroller of Public Accounts reports that businesses related to oil and natural gas mining have contributed to the increased sales tax revenue. Consumer spending has risen as well, but not to the level of business spending. For fiscal year 2014, sales tax collections were 5.3% higher than the same period in 2013. Housing
Construction continues on a positive trend with a growth rate of 1.6% over the previous 12-month period ending July 2014. Building permits increased for single-family homes by 12.2% and multi-family by 16% for the same period. For the same period, a total of 90,777 permits were issued, a 9% increase over the previous year. The median listed home price for July 2014 was $189,000. Realtytrac reflects that as of August 2014, one in every 2,683 homes in Texas are in foreclosure status, which is better than the national rate of one in every 1,126 homes. Of the 50 states, Florida has the worst foreclosure rate at one in every 400 homes.
Economic Review and Outlook: Texas Banking System Texas State Banking System Report

4
PERSISTENT DROUGHT Texas experienced the second worst drought in its history in 2011, with approximately 80% of the state in an exceptional drought condition. After three years, the drought persists and with about 81% of the state in some level of drought, and approximately 14% in an extreme drought condition. The most recent Seasonal Drought Outlook from the National Weather Service predicts drought conditions are likely to improve in most of Texas by the end of the year. Governor Rick Perry renewed his Emergency Disaster proclamation, certifying that exceptional drought conditions posed a threat of imminent disaster in specified counties in Texas. The proclamation, originally issued on July 5, 2011, has been renewed every month since then. Texas’ water supply concerns continue and are widespread. The lack of precipitation and the increase in
population are challenging various cities across the state. As of August 20, 2014, the Texas Commission on Environmental Quality reported that 25.5% of the state’s community water systems were under voluntary or mandatory water restrictions. As a result, the Texas Water Development Board is approving several cost-effective financial assistance programs. The board’s efforts to improve water conditions include an approval for $26.98 million to fund waste and water improvement projects. Consequently, Texas ranchers are suffering due to the lack of rainfall. Beef supplies continue to decline as ranchers reduced the size of their herds. In July,
the U.S. Department of Agriculture reported an increase in the average price of beef, reaching a record high of $5.56 per pound. Rising beef prices are helping ranchers stay profitable despite the current drought conditions.
Texas State Economic Review and Outlook: Texas Banking System Banking System Report

5
Another industry facing water challenges is the oil and gas industry as fracking involves the use of millions of gallons of fresh water to extract oil and gas from underground rock formations. As a result, cities like Denton concerned about its water will allow residents to vote on banning hydraulic fracturing in the November elections. According to the State Climatologist, Nielson-Gammon, recent computer-model forecasts on El Niño are not as promising as those seen in early May. El Niño occurs when water currents change to above-normal sea-surface temperatures in the equatorial Pacific Ocean. When an El Niño forms, it tends to bring above normal rain in the southern U.S. The Climate Prediction Center gives an El Niño a 65% chance for developing during the fall and early winter, and if developed, it is not anticipated to be strong. SUPERVISORY CONCERNS The Texas Department of Banking and the Texas Department of Savings and Mortgage Lending monitor events that affect the financial services industry on an ongoing basis. Whether it is a Texas or Washington issue, both Departments actively work with federal counterparts and trade associations to ensure that the industry receives the best possible supervisory support in order to maintain a safe and sound financial services industry. The financial services industry can be affected by a number of things, including monetary policy, regulatory burden, technological advances, and even Mother Nature as discussed previously. Monetary Policy
The Federal Reserve has kept the federal-funds rate near zero since December 2008 and in mid-September 2014 confirmed that they intend on rates remaining low for a “considerable time.” The Fed’s effort to boost the post-financial-crisis economy has left financial institutions searching for other ways to generate revenue as the low interest rate environment will continue to compress interest margins. The monitoring of bank activity in new markets or products is an interest to both Departments to ensure that institutions are managing the risks associated with these new endeavors. Additionally, financial institutions must evaluate interest rate risk as they continue extending fixed rate assets in this environment. Strategic risk is also evaluated by examination staff when assessing new product lines that are outside a financial institution’s business plan. Regulatory Burden
Further straining to financial institutions are the numerous regulations being issued as a result of the Dodd-Frank Wall Street Reform and Consumer Protection Act (Dodd-Frank or the Act). Though the state banking system is considered sound, bank management and boards are facing the burdensome task of complying with mounting new regulations. Bankers across the state have voiced their frustration with the cost associated with these mandates. Management is distracted and overwhelmed by Dodd-Frank, which can divert the institution from what is important. With various outstanding proposals to reform parts of Dodd-Frank remaining to be implemented, financial institutions will likely be faced with more regulations in the future. For now, the Ability-to-Repay and Qualified Mortgage (QM) Standards have some community bankers expressing that they will no longer be offering mortgage loans or will be reducing their presence in the mortgage lending arena. Each Department continues to monitor modifications and other releases related to Dodd-Frank that may impact regulated entities.
Other Items Reviewed At Examinations
Bank Secrecy Act/Anti-Money Laundering Capital Levels Fraud Internal Watch Lists Overdraft Protection Programs Tax Liens Other Risk Areas:
o Fair Lending o Deceptive Trade Practices
Economic Review and Outlook: Texas Banking System Texas State Banking System Report

6
Information Technology and Cyber Risk
Strong information technology and cyber risk management has become a critical area in any service provider’s business. Assessing and managing security risk is a task not only for employees, but for executive management and the board. The cost of a cybercrime can be exorbitant, financially taxing and damaging to a regulated entity. The Texas Department of Banking has become a leader in the industry devoting a considerable amount of time and effort to the issue and spearheading several initiatives to heighten the awareness and promote executive leadership in cyber security. When appropriate, the Department of Banking issues cyber security alerts to help banks avert a breach. This topic is spreading across the nation, which has led to more workshops and discussions on the subject. In September 2014, the Conference of State Bank Supervisors (CSBS) launched an “Executive Leadership of Cybersecurity” initiative to help promote and encourage bank CEOs and senior bank executives to engage in the management of cybersecurity risks. Other Concerns
The Justice Department launched Operation Choke Point, which pursued banks that allowed payments to be processed for certain businesses determined to be operating outside the law. Although the FDIC announced it would be deleting a listing of 30 specific high-risk merchants from one of its four guidances issued in 2009, there are fears that regulators will continue to criticize financial institutions for banking any business previously listed. Federal regulators have said that banks are making the decision to cease business relationships with these businesses at their discretion. Financial institutions are encouraged to adhere to BSA/AML regulations and conduct their due diligence to detect suspicious flows of funds and to report those suspicious funds flows. The judgment to do business with a customer is best left to the management and directors of individual banks. “Patent trolls”, also known as patent assertion entities or non-practicing entities, continue to receive attention on Capitol Hill. Companies continue to buy broadly worded patents with the intent of suing other companies for illegally infringing on these patents. Patent trolls tend to prey more on small businesses. At this time, states have limited power to address the issue. DEPARTMENTAL SUPERVISORY MEASURES BEING TAKEN Each Department concentrates on specific areas of risks by monitoring current events to mitigate potential risk as early as possible and lessen a negative impact on regulated entities. Below, each Department has detailed the areas in which supervisory staff is currently monitoring. Texas Department of Banking
Assessing interest rate risk to determine if banks are extending the duration of their investment portfolio to improve net interest margins;
Monitoring reductions in internal and external audit functions, loan review and training programs to reduce overhead costs;
Emphasizing cyber-security risks to senior bank managers; Conducting targeted reviews of new product lines as banks seek additional sources of revenue; Initiating enforcement actions early in the detection of deteriorating trends; Continuing frequent on-site examinations of problem institutions; Communicating and coordinating joint enforcement actions and other supervisory activities with
other federal regulators; Placing monthly calls to state banks to obtain industry input on prevailing economic conditions; Expanding off-site monitoring to more closely follow-up on examination concerns; Utilizing a risk-focused examination process to free up resources for problem institutions; Monitoring state, national, and world political and economic events impacting the industry such as
federal programs designed to stabilize the financial markets and new regulations; Performing targeted reviews of specific troubled areas; and,
Texas State Economic Review and Outlook: Texas Banking System Banking System Report
7
Increasing internal communication and training to improve examiner awareness of pertinent issues.
Texas Department of Savings and Mortgage Lending
Participating in regular conference calls and close coordination with other state and federal regulators;
Engaging in regular correspondence with state savings banks regarding institution-specific issues and industry issues;
Performing targeted examinations of high risk areas of state savings banks; Issuing enforcement actions and placing supervisory agents when deemed necessary; Conducting off-site monitoring of each institution’s activity (i.e., regulatory correspondence and
approvals, independent audit reports, reports of examination, and institution responses to examination comments, criticisms and recommendations);
Developing regular assessments of each institution’s activities, strengths and weaknesses, and revising the Department’s plan of examination and monitoring for the institution, including the downgrading of institutions, if deemed necessary, by the Department and the FDIC;
Monitoring local, state, national and world political and economic events impacting the industry; Participating in FDIC Compliance examinations of each institution; and, Monitoring interest rate risk and requests further information or action as deemed necessary.
Economic Review and Outlook: Texas Banking System Texas State Banking System Report
PERFORMANCE SUMMARY AND PROFILE TEXAS BANKING SYSTEM
8
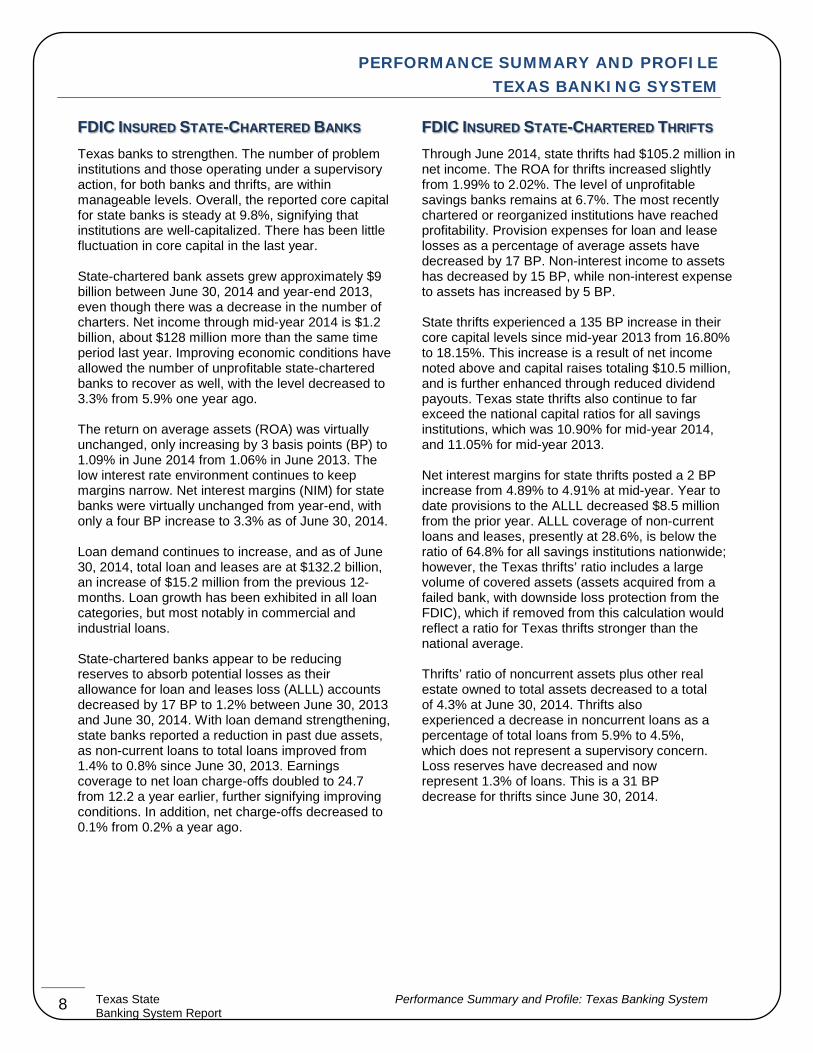
FDIC INSURED STATE-CHARTERED BANKS Texas banks to strengthen. The number of problem institutions and those operating under a supervisory action, for both banks and thrifts, are within manageable levels. Overall, the reported core capital for state banks is steady at 9.8%, signifying that institutions are well-capitalized. There has been little fluctuation in core capital in the last year. State-chartered bank assets grew approximately $9 billion between June 30, 2014 and year-end 2013, even though there was a decrease in the number of charters. Net income through mid-year 2014 is $1.2 billion, about $128 million more than the same time period last year. Improving economic conditions have allowed the number of unprofitable state-chartered banks to recover as well, with the level decreased to 3.3% from 5.9% one year ago. The return on average assets (ROA) was virtually unchanged, only increasing by 3 basis points (BP) to 1.09% in June 2014 from 1.06% in June 2013. The low interest rate environment continues to keep margins narrow. Net interest margins (NIM) for state banks were virtually unchanged from year-end, with only a four BP increase to 3.3% as of June 30, 2014. Loan demand continues to increase, and as of June 30, 2014, total loan and leases are at $132.2 billion, an increase of $15.2 million from the previous 12-months. Loan growth has been exhibited in all loan categories, but most notably in commercial and industrial loans. State-chartered banks appear to be reducing reserves to absorb potential losses as their allowance for loan and leases loss (ALLL) accounts decreased by 17 BP to 1.2% between June 30, 2013 and June 30, 2014. With loan demand strengthening, state banks reported a reduction in past due assets, as non-current loans to total loans improved from 1.4% to 0.8% since June 30, 2013. Earnings coverage to net loan charge-offs doubled to 24.7 from 12.2 a year earlier, further signifying improving conditions. In addition, net charge-offs decreased to 0.1% from 0.2% a year ago.
FDIC INSURED STATE-CHARTERED THRIFTS Through June 2014, state thrifts had $105.2 million in net income. The ROA for thrifts increased slightly from 1.99% to 2.02%. The level of unprofitable savings banks remains at 6.7%. The most recently chartered or reorganized institutions have reached profitability. Provision expenses for loan and lease losses as a percentage of average assets have decreased by 17 BP. Non-interest income to assets has decreased by 15 BP, while non-interest expense to assets has increased by 5 BP.
State thrifts experienced a 135 BP increase in their core capital levels since mid-year 2013 from 16.80% to 18.15%. This increase is a result of net income noted above and capital raises totaling $10.5 million, and is further enhanced through reduced dividend payouts. Texas state thrifts also continue to far exceed the national capital ratios for all savings institutions, which was 10.90% for mid-year 2014, and 11.05% for mid-year 2013. Net interest margins for state thrifts posted a 2 BP increase from 4.89% to 4.91% at mid-year. Year to date provisions to the ALLL decreased $8.5 million from the prior year. ALLL coverage of non-current loans and leases, presently at 28.6%, is below the ratio of 64.8% for all savings institutions nationwide; however, the Texas thrifts’ ratio includes a large volume of covered assets (assets acquired from a failed bank, with downside loss protection from the FDIC), which if removed from this calculation would reflect a ratio for Texas thrifts stronger than the national average.
Thrifts’ ratio of noncurrent assets plus other real estate owned to total assets decreased to a total of 4.3% at June 30, 2014. Thrifts also experienced a decrease in noncurrent loans as a percentage of total loans from 5.9% to 4.5%, which does not represent a supervisory concern. Loss reserves have decreased and now represent 1.3% of loans. This is a 31 BP decrease for thrifts since June 30, 2014.
Texas State Performance Summary and Profile: Texas Banking System Banking System Report
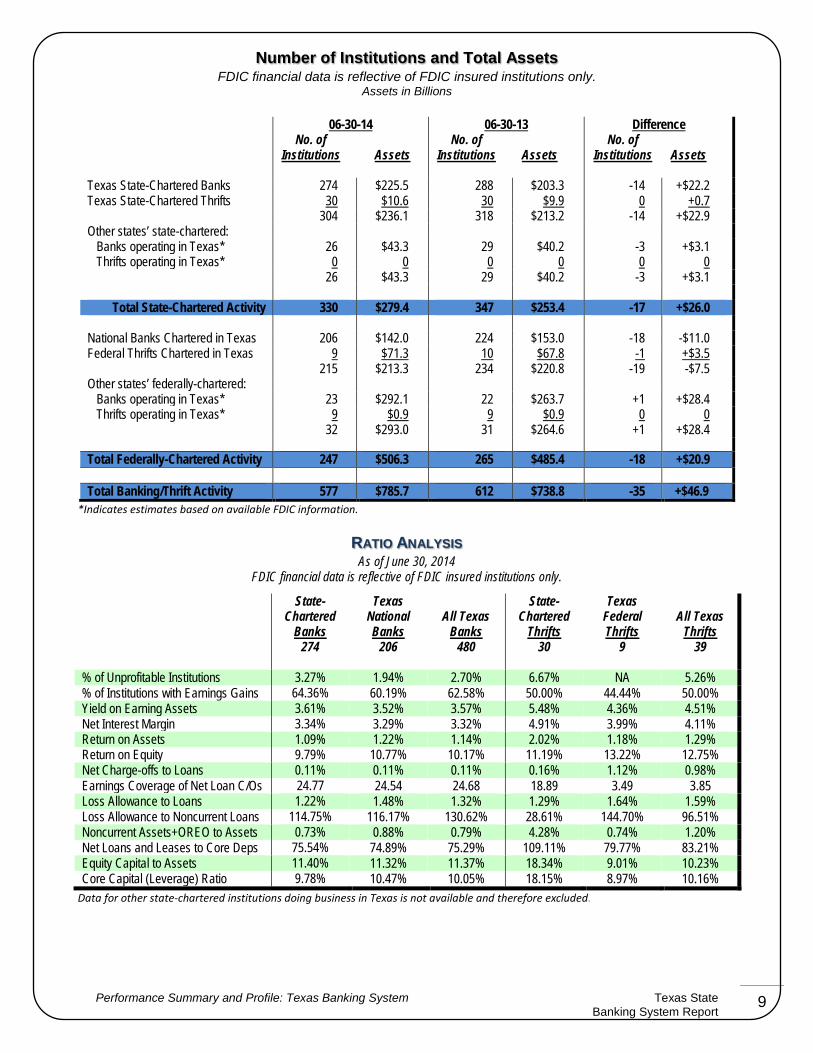
Number of Institutions and Total Assets FDIC financial data is reflective of FDIC insured institutions only.
Assets in Billions
9
*Indicates estimates based on available FDIC information.
RATIO ANALYSIS As of June 30, 2014
FDIC financial data is reflective of FDIC insured institutions only.
State-Chartered
Banks 274
Texas National Banks
206
All Texas Banks
480
State-Chartered
Thrifts 30
Texas Federal Thrifts
9
All Texas Thrifts
39
% of Unprofitable Institutions 3.27% 1.94% 2.70% 6.67% NA 5.26% % of Institutions with Earnings Gains 64.36% 60.19% 62.58% 50.00% 44.44% 50.00% Yield on Earning Assets 3.61% 3.52% 3.57% 5.48% 4.36% 4.51% Net Interest Margin 3.34% 3.29% 3.32% 4.91% 3.99% 4.11% Return on Assets 1.09% 1.22% 1.14% 2.02% 1.18% 1.29% Return on Equity 9.79% 10.77% 10.17% 11.19% 13.22% 12.75% Net Charge-offs to Loans 0.11% 0.11% 0.11% 0.16% 1.12% 0.98% Earnings Coverage of Net Loan C/Os 24.77 24.54 24.68 18.89 3.49 3.85 Loss Allowance to Loans 1.22% 1.48% 1.32% 1.29% 1.64% 1.59% Loss Allowance to Noncurrent Loans 114.75% 116.17% 130.62% 28.61% 144.70% 96.51% Noncurrent Assets+OREO to Assets 0.73% 0.88% 0.79% 4.28% 0.74% 1.20% Net Loans and Leases to Core Deps 75.54% 74.89% 75.29% 109.11% 79.77% 83.21% Equity Capital to Assets 11.40% 11.32% 11.37% 18.34% 9.01% 10.23% Core Capital (Leverage) Ratio 9.78% 10.47% 10.05% 18.15% 8.97% 10.16%
Data for other state-chartered institutions doing business in Texas is not available and therefore excluded.
06-30-14 06-30-13 Difference No. of
Institutions
Assets
No. of Institutions
Assets
No. of Institutions
Assets
Texas State-Chartered Banks 274 $225.5 288 $203.3 -14 +$22.2 Texas State-Chartered Thrifts 30 $10.6 30 $9.9 0 +0.7
304 $236.1 318 $213.2 -14 +$22.9 Other states’ state-chartered: Banks operating in Texas* 26 $43.3 29 $40.2 -3 +$3.1 Thrifts operating in Texas* 0 0 0 0 0 0
26 $43.3 29 $40.2 -3 +$3.1
Total State-Chartered Activity 330 $279.4 347 $253.4 -17 +$26.0 National Banks Chartered in Texas 206 $142.0 224 $153.0 -18 -$11.0 Federal Thrifts Chartered in Texas 9 $71.3 10 $67.8 -1 +$3.5
215 $213.3 234 $220.8 -19 -$7.5 Other states’ federally-chartered: Banks operating in Texas* 23 $292.1 22 $263.7 +1 +$28.4 Thrifts operating in Texas* 9 $0.9 9 $0.9 0 0
32 $293.0 31 $264.6 +1 +$28.4
Total Federally-Chartered Activity 247 $506.3 265 $485.4 -18 +$20.9 Total Banking/Thrift Activity 577 $785.7 612 $738.8 -35 +$46.9
Performance Summary and Profile: Texas Banking System Texas State Banking System Report

Comparison Report Select Balance Sheet and Income/Expense Information
FDIC financial data is reflective of FDIC insured institutions only. June 30, 2014
10
State Banks* State Thrifts End of Period
% of Total Assets
End of Period
% of Total Assets
Number of Institutions 274 30 Number of Employees (full-time equivalent) 42,381 2,095 (In millions) Total Assets $225,509 $10,631 Net Loans and Leases $130,324 57.79% $7,911 74.41%
Loan Loss Allowance $1,605 0.71% $103 0.97%
Other Real Estate Owned $545 0.24% $94 0.88%
Goodwill and Other Intangibles $4,679 2.07% $43 0.40%
Total Deposits $184,243 81.70% $7,899 74.30%
Federal Funds Purchased and Repurchase Agreements
$3,132 1.39% $8 0.08%
Other Borrowed Funds $5,170 2.29% $650 6.11%
Equity Capital $25,723 11.41% $1,950 18.34%
Memoranda:
Noncurrent Loans and Leases $1,110 0.49% $361 3.40%
Earning Assets $204,107 90.51% $9,863 92.78%
Long-term Assets (5+ years) $69,797 30.95% $3,822 35.95%
Year-to Date
% of Avg. Assets
Year-to Date
% of Avg. Assets
Total Interest Income $3,618 3.20% $264 2.53% Total Interest Expense $267 0.24% $27 0.26% Net Interest Income $3,351 2.98% $237 2.27% Provision for Loan and Lease Losses $81 0.08% -$1 -0.01% Total Noninterest Income $1,424 1.26% $52 0.50% Total Noninterest Expense $3,101 2.76% $175 1.68% Securities Gains $22 0.02% -$2 -0.02% Net Income $1,211 1.08% $105 1.01% Memoranda: Net Loan Charge-offs $68 0.06% Cash Dividends $572 0.50% $6 0.06% *Excludes branches of state-chartered banks of other states doing business in Texas. As of June 30, 2014, there are an estimated twenty six out-of-state state-chartered institutions with $43.3 billion in assets. No branches of state-chartered thrifts of other states conducted business in Texas as of June 30, 2014.
Texas State Performance Summary and Profile: Texas Banking System Banking System Report

PERFORMANCE SUMMARY UNITED STATES BANKING SYSTEM
11
Federal Deposit Insurance Corporation Quarterly Banking Profile Second Quarter 2014 - www.fdic.gov Lower Expenses Contribute to
Improvement in Earnings – The impact of the rise in medium- and long-term interest rates in second quarter 2013 remained evident in year-over-year earnings comparisons in second quarter 2014. The negative effect on noninterest income, particularly income from mortgage lending and from trading, was greater at large banks, while the positive implications of a steeper yield curve for net interest margins, combined with strengthening loan growth, were more significant for smaller institutions. The 6,656 FDIC-insured institutions filing financial results for second quarter 2014 reported combined net income of $40.2 billion. This is $2 billion (5.3%) more than the industry reported in second quarter 2013. Net operating revenue (the sum of net interest income and total noninterest income) was $1.5 billion (0.9%) lower than in second quarter 2013, as a decline in noninterest income from mortgage sales, securitization and servicing outweighed an increase in net interest income. Earnings benefited from lower expenses for loan-loss provisions, goodwill impairment, and payrolls. A majority of banks—57.5%—reported year-over-year increases in quarterly earnings, and only 6.8% of banks were unprofitable, down from 8.4% a year ago. This is the lowest proportion of unprofitable institutions since first quarter 2006. The average return on assets for the quarter was 1.07%, slightly above the 1.06% average in the year-ago quarter.
Performance Summary: United States Banking System Texas State Banking System Report

12
Revenues Decline From Year-Ago Level for Fourth Consecutive Quarter – Net interest income posted the largest year-over-year increase in 14 quarters, rising by $2 billion (1.9%), as interest-earning assets were 6.4% above year-ago levels. Almost 72% of all institutions reported year-over-year growth in quarterly net interest income. The average net interest margin fell to 3.15% from 3.25% in second quarter 2013. This is the lowest quarterly margin for the industry since third quarter 1989. Margin pressure was most evident at large banks. Nine of the ten largest banks reported lower quarterly margins than a year ago, whereas 55.2% of all banks reported year-over-year margin increases. Noninterest income was $3.6 billion (5.3%) lower than a year earlier, as income from sales, securitization, and servicing of 1-to-4 family residential mortgages fell by $3.7 billion (42.5%). Trading income declined for a fourth consecutive quarter, falling by $721 million (10.1%). Reduced expenses outweighed the weakness in revenues compared with the year before. Banks set aside $6.6 billion in provisions for loan and lease losses during the quarter, a $1.9 billion (22.4%) decline from second quarter 2013 and the lowest quarterly provision total since second quarter 2006. Expenses for goodwill impairment totaled $192 million, down from $4.4 billion in second quarter 2013, when two institutions reported large impairment charges. Expenses for salaries and employee benefits were $399 million (0.8%) lower as the industry reported 37,282 fewer employees than the year before. Itemized litigation expenses were $2 billion higher than in second quarter 2013.
Charge-Offs Fall to Seven-Year Low – Loan losses declined year over year for a 16th consecutive quarter, falling to $9.9 billion from $14.1 billion in second quarter 2013. This is the lowest quarterly net charge-off total for the industry since second quarter 2007. The decline was led by 1-to-4 family residential mortgage loans, where net charge-offs fell by $2.2 billion (74.7%). Net charge-offs were down year over year in all major loan categories except auto loans, where charge-offs increased $31 million (10.4%). Slightly more than half of all banks (50.8%) reported lower quarterly net charge-offs than in second quarter 2013.
Noncurrent Loan Rate Falls to Six-Year Low – Noncurrent loan balances improved for a 17th
consecutive quarter, falling by $13.4 billion (6.9%) during the three months ended June 30, 2014. Noncurrent balances declined in all major loan categories except auto loans, where they increased by $28 million (3.2%). The largest decline occurred in noncurrent 1-to-4 family residential mortgages, which fell by $8 billion (6.4%). Noncurrent real estate loans secured by nonfarm nonresidential
Texas State Performance Summary: United States Banking System Banking System Report

13
properties fell by $1.9 billion (9.6%), and noncurrent real estate construction loans declined by $1.2 billion (15.9%). At the end of the quarter, the industry’s noncurrent loan rate was 2.24%, the lowest level since second quarter 2008.
Reserve Coverage of Noncurrent Loans Improves for Seventh Consecutive Quarter – Loan-loss
reserves declined for a 17th consecutive quarter, as charge-offs removed more from reserves than banks added in provisions. Reserve balances fell by $4.1 billion (3.1%) during the quarter, as net charge-offs exceeded loss provisions by $3.3 billion. More than one-third of all banks (38.3%) reduced their loan-loss reserves. Despite the decline in reserves, the industry’s coverage ratio of reserves to noncurrent loans and leases rose from 67.8% to 70.5%, thanks to the larger reduction in noncurrent loan balances. This is the seventh consecutive quarter that the coverage ratio has improved. The ratio is at its highest level since year-end 2008.
Rebound in Securities Values Bolsters Equity Growth – Equity capital rose by $34.2 billion (2%)
during the quarter. Retained earnings added $17.6 billion to equity growth. Lower interest rates produced a $20 billion increase in unrealized gains on available-for-sale securities, which also contributed to the growth in equity. In addition, goodwill increased by $3.8 billion (1.3%). Tier 1 regulatory capital, unaffected by changes in unrealized securities gains and goodwill, increased by $19.8 billion (1.4%). The average equity-to-asset ratio rose from 11.23% to 11.26%, the highest level in almost two years. The average Tier 1 leverage ratio rose from 9.54% to 9.57%, the highest level for this regulatory capital ratio since risk-based capital standards were enacted in 1991. Insured institutions declared $22.6 billion in dividends in second quarter of 2014, up from $20.9 billion in second quarter 2013. At the end of the quarter, 98.4% of all insured institutions, representing 99.8% of all insured institution assets, met or exceeded the requirements for the highest regulatory capital category as defined for Prompt Corrective Action purposes.
Increase in Loan Balances Is
Largest Since 2007 – Total assets increased by $263.1 billion (1.8%), as loan and lease balances grew by $178.5 billion (2.3%), investment securities portfolios rose by $58.6 billion (1.9%), and balances at Federal Reserve banks increased by $28.2 billion (2.3%). The growth in loan balances was the largest quarterly increase since fourth quarter 2007 (excluding a change in accounting rules in first quarter 2010). Loan growth was led by commercial and industrial loans (up $49.9 billion, 3.1%), 1-to-4 family
Performance Summary: United States Banking System Texas State Banking System Report

14
residential mortgages (up $22.7 billion, 1.2%), credit card balances (up $20 billion, 3%), and auto loans (up $10.9 billion, 3%). All major loan categories posted increases during the quarter except home equity lines of credit (down $4.4 billion, 0.9%). Loans to small businesses and farms rose by $8.2 billion (1.3%), the largest quarterly increase since banks began reporting small-business loan data on a quarterly basis in 2010. Banks’ holdings of available-for-sale securities increased by $13.9 billion (0.6%), as a result of a $20 billion increase in their market values; the book value of the industry’s available-for-sale portfolio registered a slight $6.1 billion decline. In contrast, banks increased their portfolios of held-to-maturity securities by $44.7 billion (8.3%). Unfunded loan commitments increased by $132.2 billion (2.1%), the largest quarterly increase since first quarter 2010. Growth in unfunded commitments was led by a $44.5 billion (2.8%) increase in unfunded commercial and industrial loan commitments.
Large Denomination Noninterest-Bearing Deposits Post Strong Growth – Total deposits
increased by $172.4 billion (1.5%) in the quarter. Growth was led by balances in accounts larger than $250,000, which increased by $157.5 billion (3.2%). Balances in domestic deposit accounts of $250,000 or less declined by $13.5 billion (0.3%). Noninterest-bearing accounts in domestic offices were up $115 billion (4.3%), while deposits in foreign offices rose by $35.8 billion (2.6%). Nondeposit liabilities increased by $56.5 billion (3%), as banks increased their borrowings from Federal Home Loan Banks by $45.6 billion (11.6%). Almost 90% of the growth in FHLB advances consisted of short-term borrowings (maturing or repricing in one year or less). Banks also increased their unsecured nondeposit borrowings that mature in one to three years by $17.5 billion (21.7%). Almost 90% of the $228.9 billion increase in liabilities during the quarter consisted of liabilities maturing or repricing in one year or less.
"Problem List" Shrinks to Smallest Level in Over Five Years – The number of insured institutions
filing quarterly financial reports declined from 6,730 to 6,656 in the second quarter. Mergers absorbed 61 institutions during the quarter, while seven institutions failed. No new charters were added in the quarter. The number of institutions on the FDIC’s “Problem List” declined from 411 to 354. This is the smallest number of “problem” institutions since the end of first quarter 2009, and is 60% below the most recent peak level of 888 “problem” institutions at the end of first quarter 2011. Total assets of “problem” institutions declined from $126.1 billion to $110.2 billion. The number of full-time equivalent employees at FDIC-insured institutions increased from 2,058,867 to 2,060,002, but remained below the year-earlier level of 2,097,284.
Texas State Performance Summary: United States Banking System Banking System Report

Snapshot Stock Performance Southwest Regional Banks
September 2014
15
Name Last Trade 52 Wk Range PE EPS Mkt
Cap Div/Shr Div Yld
ACNB Corporation 09/18 19.35 16.65 21.00 11.86 1.57 1165.2M 0.76 4.00% BancFirst Corporation 09/18 66.90 50.62 68.00 18.23 3.57 1.03B 1.24 2.00%
Banco Bilbao Vizcaya Argentaria 09/18 12.56 10.81 13.60 84.86 0.27 73.9B 0.34 2.80% BOK Financial Corporation 09/18 68.71 60.59 71.10 15.76 4.42 4.76B 1.60 2.40% Cass Information Sys, Inc. 09/18 45.54 44.96 68.81 22.77 2.00 525.3M 0.80 1.70% CoBiz Incorporated 09/18 11.71 9.19 12.45 17.12 0.65 468.48M 0.16 1.40% Commerce Bancshares, Inc. 09/18 46.86 40.37 47.65 16.98 2.75 4.29B 0.90 2.00% Comerica, Inc. 09/18 52.22 38.56 53.50 17.82 2.88 9.44B 0.80 1.60% Community Shores Bank Corp 09/18 2.70 2.15 4.95 10.80 0.24 3.96M N/A N/A Cullen Frost Bankers, Inc. 09/18 80.88 68.01 81.70 20.53 3.85 5.09B 2.04 2.70% Enterprise Fin Serv Corp 09/18 17.43 16.38 20.96 13.67 1.49 344.64M 0.21 1.20% First Community Corp S C 09/18 10.69 9.70 11.37 16.12 0.71 71.2M 0.24 2.30% First Financial Bankshares, Inc. 09/18 30.00 28.26 33.76 22.81 1.29 1.91B 0.56 1.90% Great Southern Bancorp, Inc. 09/18 32.10 25.87 33.77 12.11 2.45 439.42M 0.80 2.60% Guaranty Fed Bancshares, Inc. 09/18 12.32 10.12 13.42 8.88 1.66 52.66M 0.20 1.60% Heartland Financial USA, Inc. 09/18 24.27 22.38 30.06 14.11 1.70 448.19M 0.40 1.70% International Bancshares Corp 09/18 27.04 21.14 28.00 11.96 2.11 1.81B 0.50 2.00% Landmark Bancorp, Inc. 09/18 22.68 18.10 23.98 12.84 1.56 71.99M 0.76 3.60% Liberty Bancorp, Inc. 09/18 14.95 11.90 15.50 16.25 0.92 43.91M 0.12 0.80% Mackinac Financial Corp 09/18 11.47 8.38 15.06 12.48 1.00 63.39M 0.20 1.70% Metrocorp Bancshares, Inc. 09/18 15.06 9.05 15.63 N/A 0.64 N/A 0.08 0.50% MidWest One Finl Group, Inc. 09/18 23.78 22.50 29.30 10.66 2.20 199.73M 0.58 2.40% OmniAmerican Bancorp, Inc. 09/18 25.93 20.46 26.15 44.71 0.57 272.94M 0.20 0.80% Osage Bancshares, Inc. 09/18 11.32 7.50 11.50 N/A 0.24 N/A 0.34 4.50% Prosperity Bancshares, Inc. 09/18 60.57 55.99 67.68 15.16 3.80 4.22B 0.96 1.70% QCR Holdings, Inc. 09/18 17.99 15.65 18.20 9.81 1.95 142.62M 0.08 0.50% Southwest Bancorp, Inc. 09/18 16.62 14.11 18.77 16.01 0.95 328.96M 0.16 1.10% Texas Capital Bancshares, Inc. 09/18 58.23 44.49 67.08 21.50 2.52 2.51B N/A N/A UMB Financial Corporation 09/18 57.99 51.86 68.27 20.25 2.84 2.64B 0.90 1.60% West Bancorp Incorporated 09/18 14.93 13.1 16.64 13.43 1.06 239.07M 0.48 3.30% Zions Bancorp 09/18 29.87 26.79 33.33 16.79 1.51 6.06B 0.16 0.60% Source: Yahoo Finance (September 2014) NA – Indicates information was not available.
Performance Summary: United States Banking System Texas State Banking System Report

Previous Year Snapshot Stock Performance Southwest Regional Banks
September 2013
16
Name Last Trade 52 Wk Range PE EPS Mkt
Cap Div/Shr Div Yld
ACNB Corporation 09/11 16.70 14.8 17.74 10.75 1.55 99.88M 0.76 4.50% BancFirst Corporation 09/11 52.35 39.13 53.73 15.53 3.37 800.22M 1.24 2.40%
Banco Bilbao Vizcaya Argentaria 09/11 10.55 7.55 10.57 14.51 0.73 60.50B 0.41 4.10%
BOK Financial Corporation 09/11 64.55 50.89 69.36 13.11 4.92 4.44B 1.52 2.30% Cass Information Sys, Inc. 09/11 52.70 35.05 62.57 25.96 2.03 606.16M 0.72 1.40% CoBiz Incorporated 09/11 9.30 6.35 11.00 14.93 0.62 367.10M 0.12 1.30% Commerce Bancshares, Inc. 09/11 43.43 34.69 47.53 15.35 2.83 3.94B 0.90 2.10% Comerica, Inc. 09/11 40.79 27.72 43.49 14.90 2.74 7.54B 0.68 1.60% Community Shores Bank Corp 09/11 3.00 0.15 4.00 0.82 3.66 4.40M N/A N/A Cullen Frost Bankers, Inc. 09/11 69.93 53.37 76.36 18.50 3.78 4.22B 2.00 2.90% Enterprise Fin Serv Corp 09/11 16.64 12.17 18.99 9.56 1.74 303.46M 0.21 1.30% First Community Corp S C 09/11 10.70 8.00 11.16 13.37 0.80 56.63M 0.20 2.30% First Financial Bankshares, Inc. 09/11 57.34 34.66 63.99 23.79 2.41 1.82B 1.04 1.80% Great Southern Bancorp, Inc. 09/11 26.99 22.60 31.81 10.37 2.60 368.36M 0.72 2.70% Guaranty Fed Bancshares, Inc. 09/11 11.89 6.41 14.50 13.44 0.88 32.48M 0.00 0.00% Heartland Financial USA, Inc. 09/11 27.92 22.40 30.99 10.99 2.54 472.80M 0.40 1.40% International Bancshares Corp 09/11 21.75 16.92 25.85 14.70 1.48 1.46B 0.40 1.90% Landmark Bancorp, Inc. 09/11 19.21 18.00 22.50 10.05 1.91 56.38M 0.76 3.80% Liberty Bancorp, Inc. 08/23 12.12 10.01 12.12 11.54 1.05 36.84M 0.10 0.80% Mackinac Financial Corp 09/10 9.51 6.46 10.09 13.78 0.69 52.82M 0.08 0.80% Metrocorp Bancshares, Inc. 09/11 10.70 8.70 11.45 17.48 0.61 196.51M 0.08 0.80% MidWest One Finl Group, Inc. 09/11 25.12 19.31 28.48 11.85 2.12 212.69M 0.50 2.10% OmniAmerican Bancorp, Inc. 09/11 23.00 21.16 26.61 39.72 0.58 244.56M N/A N/A Osage Bancshares, Inc. 11/30 11.32 7.5 11.50 N/A 0.24 N/A 0.34 4.50% Prosperity Bancshares, Inc. 09/11 60.12 38.56 61.78 17.52 3.43 3.63B 0.86 1.40% QCR Holdings, Inc. 09/11 15.95 11.4 16.96 7.88 2.02 92.62M 0.08 0.50% Southwest Bancorp, Inc. 09/11 14.64 9.57 16.18 23.73 0.62 288.29M 0.00 0.00% Texas Capital Bancshares, Inc. 09/11 45.26 36.75 52.17 15.80 2.86 1.85B N/A N/A UMB Financial Corporation 09/11 53.22 40.27 62.20 19.14 2.78 2.16B 0.86 1.50% West Bancorp Incorporated 09/11 12.77 9.75 14.50 13.90 0.92 203.92M 0.44 3.50% Zions Bancorp 09/11 29.08 19.03 31.40 23.37 1.30 5.37B 0.16 0.60% Source: Yahoo Finance (September 2013) NA – Indicates information was not available.
Texas State Performance Summary: United States Banking System Banking System Report

NATIONAL ECONOMIC TRENDS
17
Source: Federal Reserve Bank of St. Louis, National Economic Trends.
September 2, 2014.
National Economic Trends Texas State Banking System Report

18
Source: Federal Reserve Bank of St. Louis, National Economic Trends. September 2, 2014.
Texas State National Economic Trends Banking System Report

ECONOMIC REPORTS AND FORECASTS UNITED STATES
19
Federal Reserve Bank, Dallas National Update August 2014 - www.dallasfed.org
Economy – Economic indicators released over the past two months present a picture of modest growth thus far in 2014. In its first estimate, second-quarter gross domestic product (GDP) growth came in at an annualized 4 percent, putting first-half average growth at 0.9 percent. Job gains decelerated slightly from June to July, but payrolls are still expanding at a healthy pace. Meanwhile, the unemployment rate increased slightly to 6.2 percent in July.
Output Growth Rebounds in Second Quarter – Among major components, the lone negative contributor to real GDP growth in the second quarter was net exports, subtracting 0.6 percentage points. Real personal consumption expenditures (PCE) added the most to growth (1.69 percentage points). Positive contributions from residential (0.2 percentage points) and nonresidential fixed investment (0.7) were a welcome turnaround from weaker contributions in the prior quarter that were caused by unusually harsh winter weather. The volatile inventory investment component contributed 1.66 percentage points, which indicates downside risk to growth if upheld in future estimates.
The estimate of strong second-quarter output growth contrasts with the contractionary growth of the first quarter. As can be seen in the chart above, the downward revision to first-quarter real GDP growth was mostly the result of a drop in real PCE. This was due largely to an overestimate of expenditures on medical services in the first and second releases (the possibility of which was suggested in May’s National Economic Update).
Wage Growth to Accelerate over Next Four Quarters – The payroll survey showed modest improvement in labor market conditions. Total nonfarm employment grew by 209,000 in July. Private sector nonfarm payrolls increased by 198,000, while the government sector added 11,000 jobs. Additionally, the strong gains over the previous two months were revised upward by 15,000. Since the start of 2014, nonfarm payroll gains have averaged 230,000 per month. According to the household survey, the headline unemployment rate increased 0.1 percentage points from June. However, this coincided with an increase in the labor force participation rate from 62.8 to 62.9 percent. Based on quarterly averages, the unemployment rate has fallen 1.3 percentage points over the past year—the largest year-to-year decrease since the 1980s—and is at levels not seen since late 2008.
This downward progress has given rise to discussion among analysts about how much slack (excess labor supply) remains in the labor market and how well the headline rate communicates slack, which is often measured by wage growth. Some question whether the longer-term unemployed (six months or more) fail to exert a restraining influence on wage growth—and thus poorly represent slack—because firms overlook them. Some also question whether those employed
Economic Reports and Forecasts: United States Texas State Banking System Report

20
part-time for economic reasons (the underemployed) do exert a restraining influence on wage growth because they may be willing to trade lower wages for more hours, among other things. The issue is particularly relevant because the short-term unemployment rate has fallen below its longer-run average, while the headline unemployment rate and the combined rate (those unemployed and underemployed) are above their respective averages. Given the different measures of unemployment shown, how useful is the headline unemployment rate by itself as a measure of slack? If the headline rate substantially misrepresents slack in the labor market, there should be a breakdown in the historical relationship between it and wage inflation. Accounting for inflation expectations, the recent data show wage inflation moving in line (or in curve) with the headline unemployment rate. Assuming no significant deviation from the relationship, wage inflation will likely accelerate close to 0.5 percentage points by second quarter 2015. This suggests that there is plenty of room for the unemployment rate to fall before wage inflation takes off. The chart at the top of the next page gives further credence to this forecast. It shows the year-to-year change in the National Federation of Independent Business survey, which asks what percent of small businesses, on net, plan to raise worker compensation. It also shows the year-to-year change in year-over-year growth in wages and salaries of civilian workers, measured by the Bureau of Labor Statistics’ Employment Cost Index. The strong relationship between these two series suggests wage growth will accelerate by roughly half a percentage point during the next four quarters.
Texas State Economic Reports and Forecasts: United States Banking System Report

21
Outlook is Positive – The economic outlook for the remainder of 2014 is positive, according to both
public and private sector forecasts. The Blue Chip consensus and Federal Reserve Board forecasts show that the unemployment rate is expected to continue its decline. The Blue Chip consensus projects 3.1 percent annualized output growth over the second half, and the Blue Chip and Federal Reserve Board forecasts call for 2.9% and 3.1% growth, respectively, in 2015. With expectations of solid economic growth over the coming year or so, labor market slack will likely be further diminished and wage growth and inflation will accordingly continue to edge higher
Economic Reports and Forecasts: United States Texas State Banking System Report

U.S. ECONOMY AT A GLANCE U.S. BUREAU OF LABOR STATISTICS
22
Data Series Feb 2014
Mar 2014
Apr 2014
May 2014
June 2014
July. 2014
Unemployment Rate (1) 6.7 6.7 6.3 6.3 6.1 6.2
Change in Payroll Employment (2) 222 203 304 229 (P) 298 (P) 209
Average Hourly Earnings (3) 24.29 24.32 24.33 24.38 (P) 24.44 (P) 24.45
Consumer Price Index (4) 0.1 0.2 0.3 0.4 0.3 0.1
Producer Price Index (5) 0.2 0.3 (P) 0.5 (P) -0.2 (P) 0.4 (P) 0.1
U.S. Import Price Index (6) 1.1 0.5 (R) -0.6 (R) 0.3 (R) 0.1 (P) -0.2 Footnotes: (1) In %, seasonally adjusted. Annual averages are available for not seasonally adjusted data. (2) Number of jobs, in thousands, seasonally adjusted. (3) Average hourly earnings for all employees on private nonfarm payrolls. (4) All items, U.S. city average, all urban consumers, 1982-84=100, 1-month% change, seasonally adjusted. (5) Finished goods, 1982=100, 1-month% change, seasonally adjusted. (6) All imports, 1-month% change, not seasonally adjusted. (R) Revised. (P) Preliminary.
Data Series 2nd Qtr 2014
3rd Qtr 2014
4th Qtr 2014
1st Qtr 2014
2nd Qtr 2014
Employment Cost Index (1) 0.4 0.5 0.5 0.3 0.7
Productivity (2) 0.5 3.6 3.3 -4.5 (R) 2.3
Footnotes: (1) Compensation, all civilian workers, quarterly data, 3-month % change, seasonally adjusted. (2) Output per hour, nonfarm business, quarterly data, % change from previous quarter at annual rate, seasonally
adjusted. (R) Revised. Data extracted on: September 4, 2014
Texas State Economic Reports and Forecasts: United States Banking System Report

THE FEDERAL RESERVE BOARD THE BEIGE BOOK – MARCH 5, 2014 EXCERPT
23
Reports from the twelve Federal Reserve Districts indicated that economic activity has expanded since the previous Beige Book report; however, none of the Districts pointed to a distinct shift in the overall pace of growth. The New York, Cleveland, Chicago, Minneapolis, Dallas, and San Francisco Districts characterized their growth rates as moderate; Philadelphia, Atlanta, St. Louis, and Kansas City reported modest growth. Boston reported that business activity appeared to be improving, and Richmond reported further strengthening. Philadelphia, Atlanta, Chicago, Kansas City, and Dallas explicitly reported that contacts in their Districts generally remained optimistic about future growth; most of the other Districts cited various examples of ongoing optimism from specific sectors. General consumer spending grew in most Districts at rates ranging from slight to moderate, with few changes in the pace of growth compared with the last Beige Book. Most Districts reported a continued expansion of auto sales, noting record-high levels for several markets within the Philadelphia and Dallas Districts; however, in some parts of the New York and Philadelphia Districts sales began to fall back from their relatively high levels. Tourism activity was reported to have increased across much of the nation, with many Districts reporting higher hotel booking and occupancy rates. Activity among nonfinancial service sectors improved overall. District reports on manufacturing were mixed--divided almost evenly into one of three characterizations of the sector's activity: expanding, contracting, or unchanged. Among Districts reporting on their firms' near-term expectations, the manufacturing outlook remained generally upbeat, with New York, Philadelphia, Richmond, and Atlanta reporting increased optimism. Since the previous Beige Book, residential real estate activity, particularly sales of existing homes and construction of new homes, generally expanded or held steady in about half of the Districts. About half of the Districts also reported some growth in construction and in sales or leasing of nonresidential properties. Overall, loan demand rose in eight Districts and held steady in one. Credit standards were largely unchanged. Six Districts reported improving credit quality, falling delinquency rates, or both. Reports regarding farm products were mixed; for some crops, high anticipated harvests have put downward pressure on prices and expected farm incomes. Generally, oil and gas production and demand for related activities continued to edge up from already high levels, while total coal production mostly held steady. Trends in employment, wages, and prices were relatively unchanged in the Federal Reserve Districts, with greater wage pressures reported in sectors where shortages of skilled labor persisted.
Economic Reports and Forecasts: United States Texas State Banking System Report

ECONOMIC REPORTS AND FORECASTS STATE OF TEXAS
24
Federal Reserve Bank, Dallas Regional Economic Update August 2014 - www.dallasfed.org
Texas Economy – The regional economy picked up pace in the second quarter, with payroll employment growing at a faster rate than in the first quarter. The Texas Business Outlook Surveys (TBOS) point to an uptick in activity in June and July. The July Beige Book continued to note healthy growth and optimism in outlooks. A strong energy sector, brisk activity in commercial real estate and lower economic uncertainty all seem to be helping Texas.
Texas Employment Growth Accelerates – Texas employment grew an annualized 4.7% in May and 2.4% in June, down from the strong 5.8% growth seen in April. Nevertheless, job creation accelerated to 4.3% in the second quarter, up from 2.4% in the first. This is the strongest growth since third quarter 2005 and is above the robust 3.9% growth seen in first quarter 2012. Texas continues to add jobs at a faster clip than the U.S., and the differential of Texas job growth over the U.S. has increased to 1.3%age points this year from 0.9%age points last year. In the first half of 2014, Texas job creation was broad based, with the state’s lead over U.S. job growth extending to all major sectors except construction, manufacturing and miscellaneous services. Although manufacturing employment growth has been sluggish year to date, job creation in chemical manufacturing—tied to the booming energy sector—has bucked the trend. The unemployment rate held steady at 5.1% in June, the lowest since August 2008.
Texas Business Outlook Surveys (TBOS) Suggest Stronger Growth – The TBOS headline indexes rose in July from their June readings, suggesting a slight acceleration in growth in the manufacturing, services and retail sectors. Moreover, the quarterly averages of the headline indexes for all three surveys were not only higher in the second quarter compared with the first, but also significantly above second quarter 2013 levels.
Home Sales Flat to Up Slightly – Existing-home sales rose 2.1% in June, following a 0.9% increase in May. Six-month moving averages also show that sales are holding steady or picking up slightly both in the state and in most major Texas metros.
Texas State Economic Reports and Forecasts: State of Texas Banking System Report
25
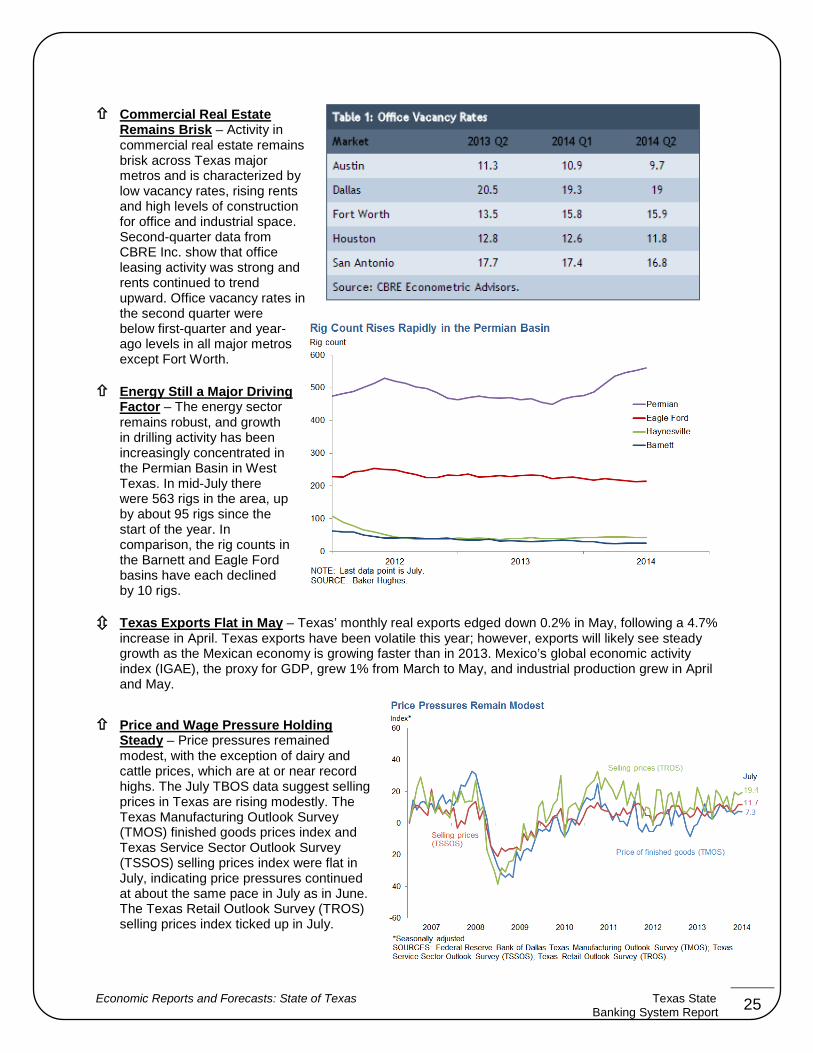
Commercial Real Estate Remains Brisk – Activity in commercial real estate remains brisk across Texas major metros and is characterized by low vacancy rates, rising rents and high levels of construction for office and industrial space. Second-quarter data from CBRE Inc. show that office leasing activity was strong and rents continued to trend upward. Office vacancy rates in the second quarter were below first-quarter and year-ago levels in all major metros except Fort Worth.
Energy Still a Major Driving Factor – The energy sector remains robust, and growth in drilling activity has been increasingly concentrated in the Permian Basin in West Texas. In mid-July there were 563 rigs in the area, up by about 95 rigs since the start of the year. In comparison, the rig counts in the Barnett and Eagle Ford basins have each declined by 10 rigs.
Texas Exports Flat in May – Texas’ monthly real exports edged down 0.2% in May, following a 4.7% increase in April. Texas exports have been volatile this year; however, exports will likely see steady growth as the Mexican economy is growing faster than in 2013. Mexico’s global economic activity index (IGAE), the proxy for GDP, grew 1% from March to May, and industrial production grew in April and May.
Price and Wage Pressure Holding Steady – Price pressures remained modest, with the exception of dairy and cattle prices, which are at or near record highs. The July TBOS data suggest selling prices in Texas are rising modestly. The Texas Manufacturing Outlook Survey (TMOS) finished goods prices index and Texas Service Sector Outlook Survey (TSSOS) selling prices index were flat in July, indicating price pressures continued at about the same pace in July as in June. The Texas Retail Outlook Survey (TROS) selling prices index ticked up in July.
Economic Reports and Forecasts: State of Texas Texas State Banking System Report
26
Labor shortages and modest upward pressure on wages continue, and the July Beige Book noted that wage pressures remained strongest for skilled workers in high-demand sectors such as energy and construction. There were also reports of modest upward pressures in airlines, high tech, fabricated metals, primary metals and transportation equipment manufacturing. The wage and benefits indexes for TMOS and TSSOS were flat in July, but indexes are above year-ago levels, indicating wage pressures are higher than this time last year.
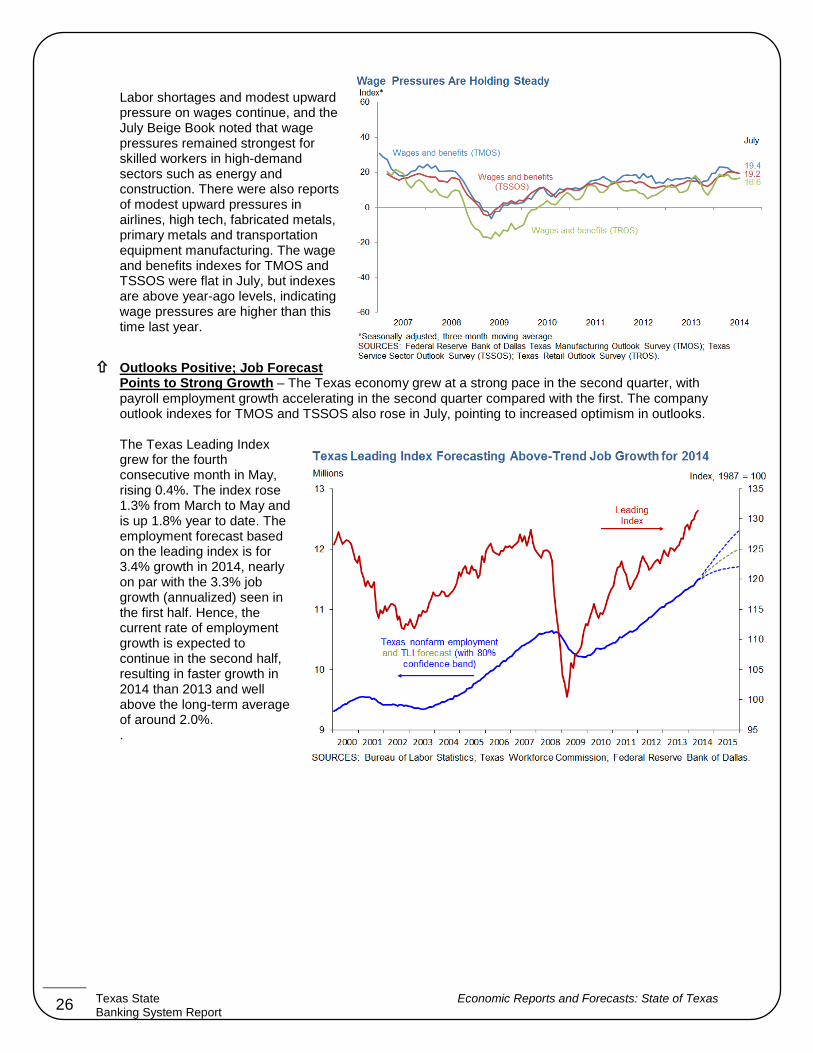
Outlooks Positive; Job Forecast Points to Strong Growth – The Texas economy grew at a strong pace in the second quarter, with payroll employment growth accelerating in the second quarter compared with the first. The company outlook indexes for TMOS and TSSOS also rose in July, pointing to increased optimism in outlooks.
The Texas Leading Index grew for the fourth consecutive month in May, rising 0.4%. The index rose 1.3% from March to May and is up 1.8% year to date. The employment forecast based on the leading index is for 3.4% growth in 2014, nearly on par with the 3.3% job growth (annualized) seen in the first half. Hence, the current rate of employment growth is expected to continue in the second half, resulting in faster growth in 2014 than 2013 and well above the long-term average of around 2.0%. .
Texas State Economic Reports and Forecasts: State of Texas Banking System Report

TEXAS ECONOMIC STATISTICS U. S. BUREAU OF LABOR STATISTICS
27
Data Series Feb
2014 Mar
2014 Apr
2014 May 2014
June 2014
July 2014
Labor Force Data
Civilian Labor Force (1) 12,917.1 12,958.4 12,981.2 12,999.0 12,985.6 (5) 12,979.5
Employment (1) 12,185.1 12,246.2 12,304.0 12,330.9 12,329.6 (5) 12,313.3
Unemployment (1) 732.1 712.2 677.2 668.2 656.0 (5) 662.2
Unemployment Rate (2) 5.7 5.5 5.2 5.1 5.1 (5) 5.1
Nonfarm Wage and Salary Employment
Total Nonfarm (3) 11,407.5 11,413.0 11,475.4 11,530.9 11,561.2 (P) 11,607.8
12-month% change 2.8 2.8 3.1 3.4 3.4 (P)3.5
Mining and Logging (3) 299.5 302.3 308.1 311.0 313.6 (P) 315.1
12-month% change 5.4 5.7 6.9 7.4 7.7 (P) 7.8
Construction (3) 630.8 626.6 632.9 636.1 633.8 (P) 637.8
12-month% change 4.0 3.0 3.7 4.3 3.3 (P) 3.8
Manufacturing (3) 879.3 879.4 881.9 883.6 885.1 (P) 886.0
12-month% change 0.9 0.9 1.3 1.5 1.5 (P) 1.9
Trade, Transportation, and Utilities (3) 2,289.8 2,292.3 2,309.2 2,322.8 2,333.2 (P) 2,337.6
12-month% change 3.1 3.3 3.6 3.9 4.2 (P) 4.1
Information (3) 203.0 204.8 207.2 208.0 206.5 (P) 208.5
12-month% change 2.4 3.0 3.8 4.0 2.9 (P) 3.5
Financial Activities (3) 693.9 692.0 696.0 699.9 704.7 (P) 708.3
12-month% change 2.7 2.2 2.6 2.9 3.2 (P) 3.3
Professional & Business Services (3) 1,488.8 1,493.6 1,512.5 1,517.6 1,521.3 (P) 1,531.6
12-month% change 3.1 3.2 4.4 4.6 4.5 (P) 3.4
Education & Health Services (3) 1,510.3 1,510.5 1,515.7 1,526.0 1,528.6 (P) 1,191.5
12-month% change 2.6 2.4 2.6 3.2 3.2 (P) 4.3
Leisure & Hospitality (3) 1,176.5 1,174.6 1,179.7 1,188.2 1,186.5 (P) 1,191.5
12-month% change 4.5 4.2 4.4 4.7 4.2 (P) 4.3
Other Services (3) 405.1 405.2 402.3 402.8 398.9 (P) 404.3
12-month% change 3.0 2.9 2.4 2.1 0.7 (P) 1.9
Government (3) 1,830.5 1,831.7 1,829.9 1,834.9 1,849.0 (P) 1,853.2
12-month% change 1.6 1.6 1.4 1.7 2.3 (P) 1.8
Mass layoffs
Layoff events, all industries (4)
Initial claimants, all industries (4)
Footnotes (1) Number of persons, in thousands, seasonally adjusted. (2) In percent, seasonally adjusted.
(3) Number of jobs, in thousands, seasonally adjusted. (4) See about the data.
Economic Reports and Forecasts: State of Texas Texas State Banking System Report

FEDERAL RESERVE BANK SURVEY: SENIOR LOAN OFFICER OPINION SURVEY
28
The July 2014 Senior Loan Officer Opinion Survey on Bank Lending Practices addressed changes in the standards and terms on, and demand for, bank loans to businesses and households over the past three months. This summary is based on the responses from 75 domestic banks and 23 U.S. branches and agencies of foreign banks. The July survey results showed a continued easing of lending standards and terms for many types of loan categories amid a broad-based pickup in loan demand. Domestic banks generally continued to ease their lending standards and various terms for commercial and industrial (C&I) loans. In contrast, foreign banks reported little change in standards and in most of the surveyed terms for C&I loans on net. Domestic respondents, meanwhile, also reported having eased standards on most types of commercial real estate (CRE) loans on balance. Although many banks reported having eased standards for prime residential real estate (RRE) loans, respondents generally indicated little change in standards and terms for other types of loans to households. However, a few large banks had eased standards, increased credit limits, and reduced the minimum required credit score for credit card loans. Banks also reported having experienced stronger demand over the past three months, on net, for many more loan categories than on the April survey.
The survey included a set of special questions on the effects on the approval rates for home-purchase loans of the Ability-to-Repay and Qualified Mortgage Standards under the Truth in Lending Act (the ATR/QM rule), which came into effect early this year. The majority of banks reported that the new rule has had no effect on the approval rate of prime conforming mortgages, in part because those loans qualify for a safe harbor under the exemption for loans that meet the underwriting criteria of the government-sponsored housing enterprises (GSEs). In contrast, about half of the respondents indicated that the ATR/QM rule has reduced approval rates on applications for prime jumbo home-purchase loans and nontraditional mortgages.
Responses to a set of annual questions on the level of standards indicated that lending conditions had eased, on net, over the past year for many loan categories. As was the case in the July 2013 survey, domestic and foreign banks generally reported that standards for most categories of C&I loans were either easier than or near the midpoints of their ranges over the past decade. After reporting that standards had eased on the quarterly surveys over the course of the past year, domestic banks also generally indicated that standards on most types of CRE loans were now easier than or near the midpoints of their ranges. However, despite shifts toward somewhat more accommodative credit policies for most types of loans to households, moderate to large fractions of banks continued to report that the levels of standards for all types of RRE and credit card loans were at least somewhat tighter than the midpoints of their bank's longer-term ranges.
Business Lending
C&I Loans – As has been the case in each of the past three surveys, a small percentage of domestic respondents reported having eased standards on C&I loans, both to large and middle-market firms and to small firms, over the past three months. In contrast, moderate to large fractions of banks reported having eased various price and nonprice terms on C&I loans on net. Of the terms included in the survey, banks continued to report the most widespread easing on spreads of C&I loan rates over banks' costs of funds. In addition, for all firm sizes, a significant fraction of banks reported having reduced the cost of credit lines and decreased
the use of interest rate floors on balance. Although a more moderate fraction indicated having eased loan covenants, close to one-third of the large banks in the sample reported having done so for loans extended to large and middle-market firms over the past three months. Most domestic respondents that reported having eased either standards or terms on C&I loans over the past three months continued to cite more-aggressive competition from other banks or nonbank lenders as an important reason for having done so. Smaller numbers of banks also attributed their easing to a more favorable or less uncertain economic outlook or to an
Texas State Federal Reserve Bank Survey: Senior Loan Officer Opinion Survey Banking System Report

29
increased tolerance for risk. On the demand side, a significant fraction of banks reported having experienced stronger demand for C&I loans from firms of all sizes on balance. To explain the reported increase in loan demand, banks cited a wide range of customers' financing needs, particularly those related to investment in plant or equipment, accounts receivable, inventories, or mergers or acquisitions. Most foreign survey respondents reported that C&I lending standards had remained basically unchanged, though several indicated having eased some terms. Only a few foreign banks reported stronger demand, while none reported
weaker demand.
Commercial Real Estate Lending – A modest net fraction of domestic respondents reported that they had eased standards on construction and land development loans and loans secured by nonfarm nonresidential properties over the past three months. However, respondents indicated that standards for loans secured by multifamily residential properties were unchanged on net. For all three types of CRE loans, reports of stronger demand continued to outnumber reports of weaker demand.
Lending to Households
Residential Real Estate Lending – A moderate net fraction of domestic banks reported having eased their standards on prime residential mortgages, on net, while most indicated that standards on nontraditional mortgages and home equity lines of credit (HELOCs) were relatively little changed. Banks reported having experienced stronger demand, on balance, for prime residential mortgages for the first time since a year ago, and for HELOCs for the first time since the October 2013 survey.
ATR/QM Rule – The July survey included a set of special questions regarding the effects of the new ATR/QM rule on the approval rate for applications of various types of home-purchase loans. Only a small fraction of large banks indicated in the survey that the new rule has affected their approval rates for prime conforming mortgages, while a more substantial share of the other respondents reported that the rules were lowering their approval rates on such loans. In addition, among the banks reporting that the rules had no effect on their approval rates, about half indicated that lending policies would have been tighter without the safe harbor for mortgages that pass the GSEs' automated underwriting models. In contrast, more than half of the respondents indicated that the ATR/QM rule has reduced approval rates on applications for prime jumbo home-purchase loans. Among
the institutions indicating lower approval rates for such loans, most reported that each of the following provisions were important reasons for the lower approval rates: the ATR provisions that require mortgage originators to evaluate income and to assess credit history, assets, and debt payments; and the QM provision that caps the borrower's back-end debt-to-income ratio at 43%. Finally, more than half of the 36 respondents that originate nontraditional mortgages also indicated lower approval rates on nontraditional home-purchase loans due to the ATR/QM rule.
Consumer Lending – A modest net fraction of domestic respondents indicated that they were more willing to make consumer installment loans relative to three months ago. Most banks, however, reported that standards and the surveyed terms on various types of consumer loans were little changed. A few large banks reported having eased lending standards, increased credit limits, and lowered minimum required credit scores on credit card loans. Meanwhile, moderate fractions of banks reported having experienced stronger demand for each of the three types of consumer loans in the survey--credit card loans, auto loans, and other consumer loans. Only a few respondents reported that demand had weakened for any of these types of loans.
Levels of Lending Standards
The July survey included a set of special questions that asked respondents to describe the current level of lending standards at their bank, rather than changes in standards over the survey period. Specifically, for each loan category surveyed, respondents were asked to consider the range over which their bank's
Federal Reserve Bank Survey: Senior Loan Officer Opinion Survey Texas State Banking System Report

30
standards have varied between 2005 and the present and then to report where the current level of standards for such loans resides relative to the midpoint of that range. Domestic banks and foreign institutions generally reported that lending standards on different kinds of C&I loans to large and middle-market firms (investment-grade syndicated loans, below-investment-grade syndicated loans, and other loans to large and middle-market firms) were currently at levels that were easier than or near the midpoints of the ranges that those standards have occupied since 2005. In particular, close to half of the large banks and foreign institutions reported that standards for syndicated loans to below-investment-grade firms were easier than the midpoint of their longer-term range. In contrast, a similar fraction of the other domestic respondents indicated that their standards on such loans were tighter than the midpoint of their range. Compared with the July 2013 survey, however, a smaller fraction of the large domestic respondents reported that standards on syndicated loans to below-investment-grade firms were easier than the midpoint of their longer-term range, while at other domestic banks and foreign institutions, this share was relatively little changed. The majority of domestic respondents indicated that lending standards on loans both to small firms, with annual sales of less than $50 million, and very small firms, with annual sales of less than $5 million, were near the midpoints of their ranges since 2005.
Regarding the level of standards for CRE loans, domestic banks reported that the current level of standards on loans secured by multifamily properties and loans secured by nonfarm nonresidential properties were generally easier than or near the midpoints of their ranges. However, nearly half of the respondents reported that standards on construction and land development loans were tighter than the midpoints of their longer-term ranges. Compared with the results in the July 2013 survey, these results indicate an easing of credit conditions for all three types of CRE loans from the corresponding levels reported a year ago. With respect to RRE loans, moderate to large net fractions of domestic banks reported that lending standards for all six categories of RRE loans included in the survey (prime conforming mortgages, mortgages guaranteed by the Federal Housing Administration or the U.S. Department of Veterans Affairs, prime jumbo mortgages, subprime mortgages, nontraditional mortgages, and HELOCs) remained at least somewhat tighter than the midpoints of the ranges that those standards have occupied since 2005. However, these results still indicate a net easing of credit conditions for RRE loans from the even tighter levels reported in the July 2013 survey. As for consumer loans, a majority of the domestic respondents indicated that standards were near the midpoints of their longer-term ranges for prime credit card, prime auto, and other consumer loans. Compared with the results in the July 2013 survey, a smaller fraction of banks reported that their standards were tighter than their midpoints. Among the moderate number of banks that offer subprime auto loans, some indicated that standards for those loans were easier than the midpoint of their range since 2005, but, on net, standards on such loans were tighter than the midpoint of that range. Likewise, standards on subprime credit cards also appeared to have remained tighter than the midpoint of the range since 2005, on net.
Texas State Federal Reserve Bank Survey: Senior Loan Officer Opinion Survey Banking System Report

ACKNOWLEDGEMENTS & RESOURCES
31
Breitbart Texas, online news Federal Deposit Insurance Corporation, Washington, D.C. Federal Reserve Bank of Dallas, Dallas, TX Federal Reserve Bank of St. Louis, St. Louis, MO Federal Reserve Board, Washington D.C. Forbes, online Houston Chronicle, Houston, TX Kiplinger, Washington DC Office of the Governor, Rick Perry, Austin, TX RealtyTrac, Irvine, CA StateImpact NPR, Austin TX Texas A&M AgriLife Extension Service, College Station, TX Texas Commission on Environmental Quality, Austin, TX Texas Comptroller of Public Accounts, Austin, TX Texas Department of Agriculture, Austin, TX Texas Department of Banking, Austin, TX Texas Railroad Commission, Austin, TX Texas Water Development Board, Austin, TX Texas Department of Savings and Mortgage Lending, Austin, TX The Climate Prediction Center, College Park, MD The Perryman Group, Waco, Texas The Texas Tribune, Austin, TX United States Department of Agriculture, Washington, D.C. U.S. Drought Monitor, Lincoln, NE U.S. Bureau of Labor Statistics, Washington, D.C. Wall Street Journal, New York, NY Yahoo Finance
Acknowledgements Texas State Banking System Report