4.n traffic and circulation - city of brisbane. environmental setting, impacts, and mitigation...
TRANSCRIPT

4. Environmental Setting, Impacts, and Mitigation Measures
4.N Traffic and Circulation
Brisbane Baylands 4.N-1 ESA / 206069 Draft EIR June 2013
4.N Traffic and Circulation
4.N.1 Introduction This section analyzes the impacts of Project Site development on the existing and future transportation and circulation system in the vicinity of the Project Site under four distinct scenarios: the Developer-Sponsored Plan (DSP), the Developer-Sponsored Plan – Entertainment Variant (DSP-V), the Community Proposed Plan (CPP), and the Community Proposed Plan – Recology Expansion Variant (CPP-V). Transportation-related issues of concern that are addressed include traffic on local and regional roadways, transit, bicycles, pedestrians, parking, freight loading, and construction-related activities. Transportation impacts are assessed for Project Site development scenarios for weekday AM and PM commute periods for existing and cumulative1 conditions. Impacts of events at the proposed arena under the DSP-V scenario are also examined separately for weekday PM peak period conditions. This section also identifies feasible mitigation measures that would reduce or avoid significant impacts.
4.N.2 Environmental Setting This subsection describes existing transportation facilities serving the Project Site and conditions for motor vehicle, bicycle, and pedestrian travel, as well as for public transit.
Roadway Network
This subsection describes the freeways and streets that provide vehicle access and circulation within the Project Site and vicinity (see Figure 4.N-1 and Figure 4.N-2). With the exception of the freeways, each of the facilities described in this subsection also provides the primary means of bicycle and pedestrian circulation (described in greater detail in the subsections describing travel by those modes).
Freeways
Regional vehicle access to the Project Site is provided by three freeways:
US Highway 101 (US 101) is a facility that operates near the Pacific coastline between Los Angeles and Olympia, Washington. Near the Project Site, US 101 is a limited-access eight-lane freeway that connects Brisbane and the Peninsula with San Francisco and Marin County to the north and San Jose to the south. US 101 borders the eastern portion of the Project Site and has southbound on- and off-ramps at Bayshore Boulevard, Beatty Avenue, and Lagoon Way, and northbound on- and off-ramps at Sierra Point Parkway and Harney Way.
1 Cumulative conditions represents the future analysis year 2030 used for assessment of future year impacts for
Project site development that includes background traffic and transit trips (generated by growth from other nearby development projects and regional travel demand) and planned roadway network improvements.

San Francisco City and County
San Mateo County
Brisbane Lagoon
Beatty Ave
Lagoon Way
Sierra Point Pkwy
0 1000
Feet
San Francisco
Bay
Executive Park
KinderMorganEnergyTank Farm
KinderMorganEnergyTank Farm
Project Site
Not a Part of Proposed Project
Existing Caltrain
Brisbane Baylands . 206069Figure 4.N-1
Transportation Study AreaSOURCE: UPC, 2011
CalTrainBayshore
Station
U.S
. 101
4.N-2

SanFrancisco
Bay
IceHouse
Hill
Brisbane
Lagoon
Beatty AveCandlestick Point/U.S. 101 Interchange
Sierra Point/U.S. 101 Interchange
Tu
nn
el Ave
Lagoon Way
Valley Dr
Old
Cou
nty
Rd
KinderMorganEnergyTank Farm
KinderMorganEnergyTank Farm
Bay
shor
e B
lvd
Geneva Ave
U.S
. 101S
ierra Poin
t Pkw
y
San Francisco City and CountySan Mateo County
San Francisco City and CountySan Mateo County
Guadalupe Canyon Pkw
y
Harney W
y
Brisbane Baylands . 206069Figure 4.N-2
Existing RoadwaysSOURCE: UPC, 2011
0 1000
Feet
Project Site
Not a Part of Proposed Project
4.N-3
4. Environmental Setting, Impacts, and Mitigation Measures
4.N Traffic and Circulation
Brisbane Baylands 4.N-4 ESA / 206069 Draft EIR June 2013
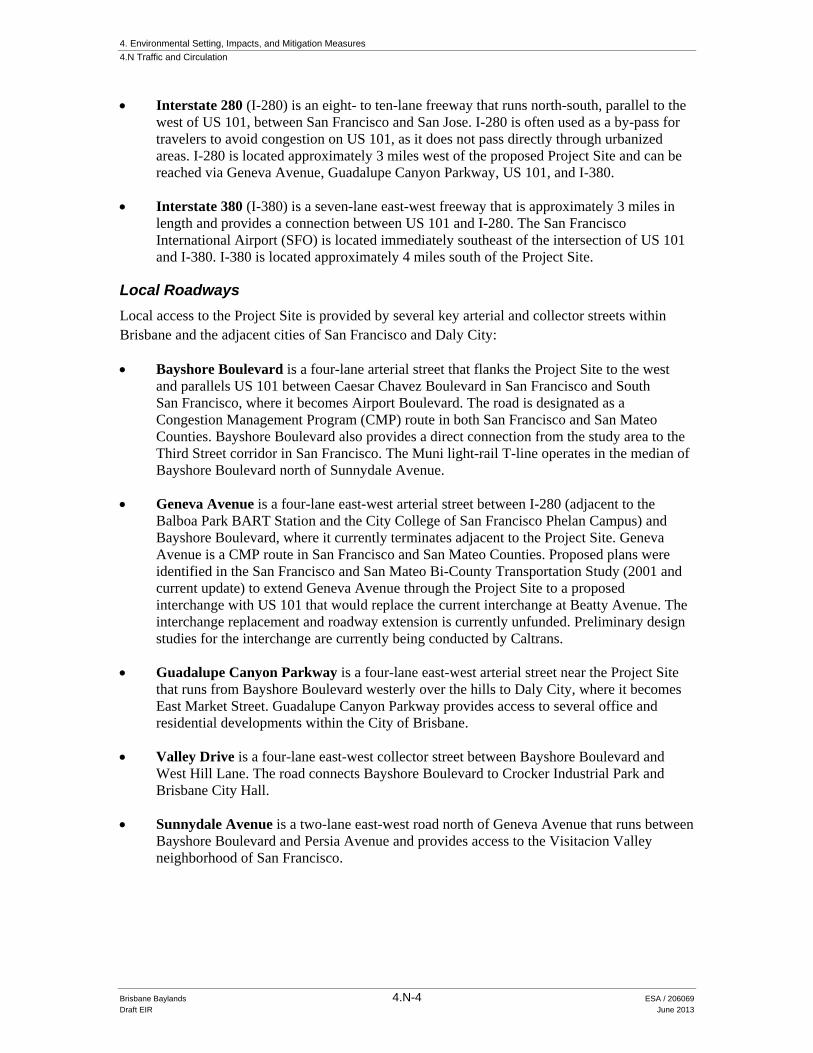
Interstate 280 (I-280) is an eight- to ten-lane freeway that runs north-south, parallel to the west of US 101, between San Francisco and San Jose. I-280 is often used as a by-pass for travelers to avoid congestion on US 101, as it does not pass directly through urbanized areas. I-280 is located approximately 3 miles west of the proposed Project Site and can be reached via Geneva Avenue, Guadalupe Canyon Parkway, US 101, and I-380.
Interstate 380 (I-380) is a seven-lane east-west freeway that is approximately 3 miles in length and provides a connection between US 101 and I-280. The San Francisco International Airport (SFO) is located immediately southeast of the intersection of US 101 and I-380. I-380 is located approximately 4 miles south of the Project Site.
Local Roadways
Local access to the Project Site is provided by several key arterial and collector streets within Brisbane and the adjacent cities of San Francisco and Daly City:
Bayshore Boulevard is a four-lane arterial street that flanks the Project Site to the west and parallels US 101 between Caesar Chavez Boulevard in San Francisco and South San Francisco, where it becomes Airport Boulevard. The road is designated as a Congestion Management Program (CMP) route in both San Francisco and San Mateo Counties. Bayshore Boulevard also provides a direct connection from the study area to the Third Street corridor in San Francisco. The Muni light-rail T-line operates in the median of Bayshore Boulevard north of Sunnydale Avenue.
Geneva Avenue is a four-lane east-west arterial street between I-280 (adjacent to the Balboa Park BART Station and the City College of San Francisco Phelan Campus) and Bayshore Boulevard, where it currently terminates adjacent to the Project Site. Geneva Avenue is a CMP route in San Francisco and San Mateo Counties. Proposed plans were identified in the San Francisco and San Mateo Bi-County Transportation Study (2001 and current update) to extend Geneva Avenue through the Project Site to a proposed interchange with US 101 that would replace the current interchange at Beatty Avenue. The interchange replacement and roadway extension is currently unfunded. Preliminary design studies for the interchange are currently being conducted by Caltrans.
Guadalupe Canyon Parkway is a four-lane east-west arterial street near the Project Site that runs from Bayshore Boulevard westerly over the hills to Daly City, where it becomes East Market Street. Guadalupe Canyon Parkway provides access to several office and residential developments within the City of Brisbane.
Valley Drive is a four-lane east-west collector street between Bayshore Boulevard and West Hill Lane. The road connects Bayshore Boulevard to Crocker Industrial Park and Brisbane City Hall.
Sunnydale Avenue is a two-lane east-west road north of Geneva Avenue that runs between Bayshore Boulevard and Persia Avenue and provides access to the Visitacion Valley neighborhood of San Francisco.
4. Environmental Setting, Impacts, and Mitigation Measures
4.N Traffic and Circulation
Brisbane Baylands 4.N-5 ESA / 206069 Draft EIR June 2013
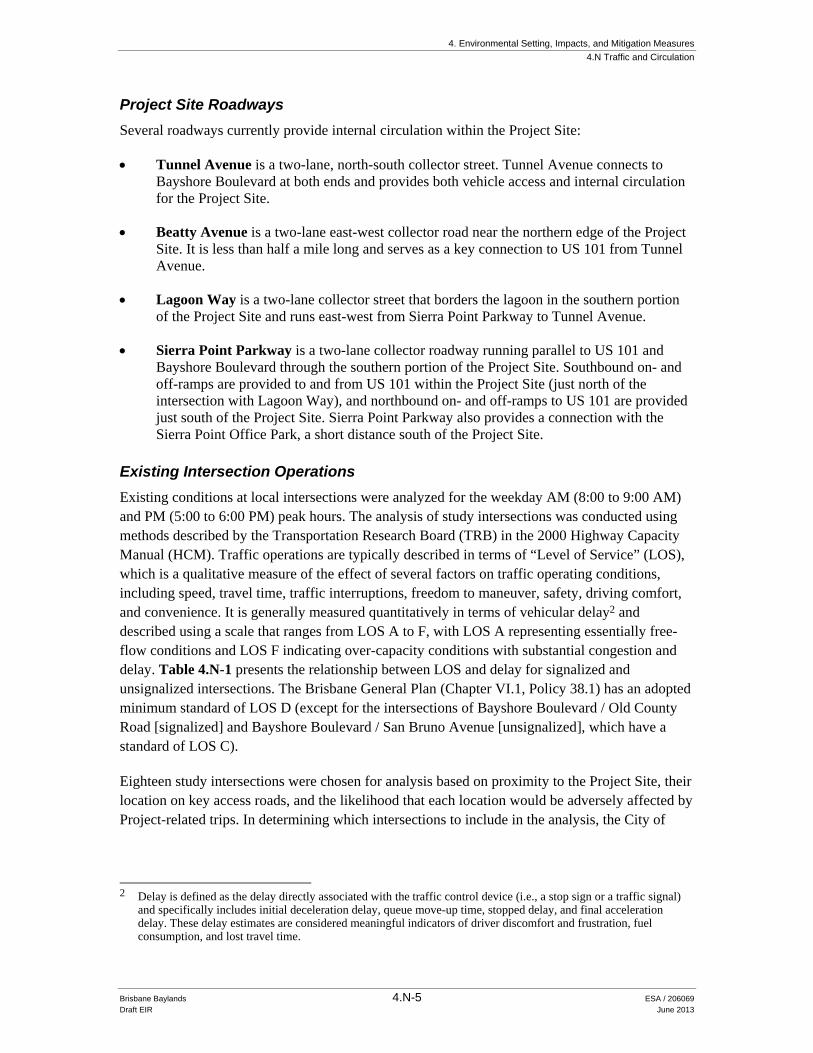
Project Site Roadways
Several roadways currently provide internal circulation within the Project Site:
Tunnel Avenue is a two-lane, north-south collector street. Tunnel Avenue connects to Bayshore Boulevard at both ends and provides both vehicle access and internal circulation for the Project Site.
Beatty Avenue is a two-lane east-west collector road near the northern edge of the Project Site. It is less than half a mile long and serves as a key connection to US 101 from Tunnel Avenue.
Lagoon Way is a two-lane collector street that borders the lagoon in the southern portion of the Project Site and runs east-west from Sierra Point Parkway to Tunnel Avenue.
Sierra Point Parkway is a two-lane collector roadway running parallel to US 101 and Bayshore Boulevard through the southern portion of the Project Site. Southbound on- and off-ramps are provided to and from US 101 within the Project Site (just north of the intersection with Lagoon Way), and northbound on- and off-ramps to US 101 are provided just south of the Project Site. Sierra Point Parkway also provides a connection with the Sierra Point Office Park, a short distance south of the Project Site.
Existing Intersection Operations
Existing conditions at local intersections were analyzed for the weekday AM (8:00 to 9:00 AM) and PM (5:00 to 6:00 PM) peak hours. The analysis of study intersections was conducted using methods described by the Transportation Research Board (TRB) in the 2000 Highway Capacity Manual (HCM). Traffic operations are typically described in terms of “Level of Service” (LOS), which is a qualitative measure of the effect of several factors on traffic operating conditions, including speed, travel time, traffic interruptions, freedom to maneuver, safety, driving comfort, and convenience. It is generally measured quantitatively in terms of vehicular delay2 and described using a scale that ranges from LOS A to F, with LOS A representing essentially free-flow conditions and LOS F indicating over-capacity conditions with substantial congestion and delay. Table 4.N-1 presents the relationship between LOS and delay for signalized and unsignalized intersections. The Brisbane General Plan (Chapter VI.1, Policy 38.1) has an adopted minimum standard of LOS D (except for the intersections of Bayshore Boulevard / Old County Road [signalized] and Bayshore Boulevard / San Bruno Avenue [unsignalized], which have a standard of LOS C).
Eighteen study intersections were chosen for analysis based on proximity to the Project Site, their location on key access roads, and the likelihood that each location would be adversely affected by Project-related trips. In determining which intersections to include in the analysis, the City of
2 Delay is defined as the delay directly associated with the traffic control device (i.e., a stop sign or a traffic signal)
and specifically includes initial deceleration delay, queue move-up time, stopped delay, and final acceleration delay. These delay estimates are considered meaningful indicators of driver discomfort and frustration, fuel consumption, and lost travel time.

4. Environmental Setting, Impacts, and Mitigation Measures
4.N Traffic and Circulation
Brisbane Baylands 4.N-6 ESA / 206069 Draft EIR June 2013
TABLE 4.N-1 LEVEL OF SERVICE (LOS) DEFINITIONS FOR SIGNALIZED AND UNSIGNALIZED INTERSECTIONS
Unsignalized Intersections Level of
Service (LOS)
Signalized Intersections
Description
Average Total Vehicle Delay
(Seconds)
Average Control Vehicle Delay
(Seconds)
Description
No delay for stop-controlled approaches.
10.0 A 10.0 Free Flow or Insignificant Delays: Operations with very low delay, when signal progression is extremely favorable and most vehicles arrive during the green light phase. Most vehicles do not stop at all.
Operations with minor delay.
>10.0 and 15.0 B >10.0 and 20.0 Stable Operation or Minimal Delays: Generally occurs with good signal progression and/or short cycle lengths. More vehicles stop than with LOS A, causing higher levels of average delay. An occasional approach phase is fully utilized.
Operations with moderate delays.
>15.0 and 25.0 C >20.0 and 35.0 Stable Operation or Acceptable Delays: Higher delays resulting from fair signal progression and/or longer cycle lengths. Drivers begin having to wait through more than one red light. Most drivers feel somewhat restricted.
Operations with increasingly
unacceptable delays.
>25.0 and 35.0 D >35.0 and 55.0 Approaching Unstable or Tolerable Delays: Influence of congestion becomes more noticeable. Longer delays result from unfavorable signal progression, long cycle lengths, or high volume to capacity ratios. Many vehicles stop. Drivers may have to wait through more than one red light. Queues may develop, but dissipate rapidly, without excessive delays.
Operations with high delays, and
long queues.
>35.0 and 50.0 E >55.0 and 80.0 Unstable Operation or Significant Delays: Considered to be the limit of acceptable delay. High delays indicate poor signal progression, long cycle lengths and high volume-to-capacity ratios. Individual cycle failures are frequent occurrences. Vehicles may wait through several signal cycles. Long queues form upstream from intersection.
Operations with extreme congestion,
and with very high delays and long
queues unacceptable to most drivers.
>50.0 F >80.0 Forced Flow or Excessive Delays: Occurs with oversaturation when flows exceed the intersection capacity. Represents jammed conditions. Many cycle failures. Queues may block upstream intersections.
SOURCE: Transportation Research Board, 2000

4. Environmental Setting, Impacts, and Mitigation Measures
4.N Traffic and Circulation
Brisbane Baylands 4.N-7 ESA / 206069 Draft EIR June 2013
Brisbane incorporated input received from the City and County of San Francisco, City of Daly City, and County of San Mateo. The following intersections were included in the analysis:
1. Geneva Avenue & Bayshore Boulevard 2. Guadalupe Canyon Parkway & Bayshore Boulevard 3. Valley Drive & Bayshore Boulevard 4. Old County Road & Bayshore Boulevard & Tunnel Avenue 5. San Bruno Avenue & Bayshore Boulevard 6. Sierra Point Parkway & US 101 Northbound Ramps 7. Lagoon Way & Tunnel Avenue 8. Lagoon Way & Sierra Point Parkway 9. Beatty Road & Alana Way 10. Harney Way & Alana Way & Thomas Mellon Drive 11. Jamestown Avenue & Third Street 12. Tunnel Avenue & Bayshore Boulevard 13. Blanken Avenue & Tunnel Avenue 14. Blanken Avenue & Bayshore Boulevard 15. Sunnydale Avenue & Bayshore Boulevard 16. Geneva Avenue & Carter Street 17. Geneva Avenue & Mission Street 18. E. Market Street & Orange Street
Figure 4.N-3 shows the location of each study intersection, and Figure 4.N-4 shows existing intersection lane configurations and traffic control devices (stop signs or signals). Traffic counts used for analyzing intersection levels of service were taken in 2007. Subsequent traffic counts taken in November 2012 confirmed that volumes in pre-recession 2007 were higher than current volumes. Thus, the use of pre-recession 2007 traffic counts in this EIR results in a more conservative analysis of Project impacts than would re-running traffic models based on 2010 or 2012 traffic counts. Pre-recession traffic counts will also provide a more accurate depiction of future background traffic volumes as they would be reflective of traffic generated by post-recession economic activity. As a result, impact analyses based on the 2007 traffic counts provide an appropriate, conservative baseline for the purposes of the traffic impact analyses undertaken in this EIR. As shown in Table 4.N-2, under Existing Conditions, all of the study intersections are operating at acceptable levels during the AM and PM peak hours.
Freeway Mainline Operations
Freeway mainline existing operations were evaluated using the 2000 HCM volume-to-capacity ratio method, per City/County Association of Governments of San Mateo County (C/CAG) guidelines. Under this method, the peak hour volume on a segment in each direction is compared to the segment’s vehicle carrying capacity and a volume-to-capacity (v/c) ratio is calculated. The capacity is estimated as the number of lanes multiplied by 2,200 vehicles per hour per lane for four-lane freeway segments and 2,300 vehicles per hour per lane for segments with six or more lanes. For this EIR, the freeway free-flow speed was determined to be 65 miles per hour. Table 4.N-3 presents LOS ratings based on the maximum v/c ratio for freeways with a 65 mile per hour free flow speed.

Executive Park
Brisbane Lagoon
Beatty Ave
AlanaWay
Lagoon WayValley Drive
Sierra P
oint Pkw
y
Main St
Bayshore B
lvd
Car
ter S
t
Miss
ion
St
Geneva Ave
Sunnydale Ave
Shw
erin
Str
eet
Tunnel Ave
San Francisco City and County
San Mateo County
Orange St
San Francisco
Bay
Guadalupe Canyon Pkwy
1
2
3
4
5
6
87
9
10
13
12
11
14
16
17
18
15
Brisbane Baylands . 206069Figure 4.N-3
Traffic Analysis LocationsSOURCE: UPC, 2011
Project Site
Not a Part of Proposed Project
Existing Caltrain
Study Intersection
1. Geneva Ave & Bayshore Blvd
2. Guadalupe Canyon Pkwy & Bayshore Blvd
3. Valley Drive & Bayshore Blvd
4. Old County Rd & Bayshore Blvd & Tunnel Ave
5. San Bruno Ave & Bayshore Blvd
6. Sierra Point Pkwy & U.S. 101 Ramps
7. Lagoon Way & Tunnel Ave
8. Lagoon Way & Sierra Point Pkwy
9. Beatty Road & Alana Way
10. Harney Way & Alana Way & Thomas Mellon Dr
11. Jamestown Ave & Third Street
12. Tunnel Ave & Bayshore Blvd
13. Blanken Ave & Tunnel Ave
14. Blanken Aven & Bayshore Blvd
15. Sunnydale Ave & Bayshore Blvd
16. Geneva Ave & Carter Street
17. Geneva Ave & Mission Street
18. Market Street & Orange Street
#
0 2000
Feet
4.N-8

1
7
TUN
NEL
AV
E
LAGOON RD
BAYS
HO
RE B
LVD
GENEVA AVE
2 3
BAYS
HO
RE B
LVD
SAN BRUNO AVE
4
8
BAYS
HO
RE B
LVD
5
9
SIER
RA P
OIN
T PK
WY
BEATTY AVE
US
101
NB
RAM
PS
SIERRA POINT PKWY
6
10
HARNE Y WAY
THO
MA
S M
ELLO
N C
R 11
THIR
D S
T
JAMESTOWN AVE
US 101 SB RAMPS
12
BAYS
HO
RE B
LVD
TUNNEL AVE
13
TUN
NEL
AV
E
14
BAYS
HO
RE B
LVD 15
BAYS
HO
RE B
LVD
SUNNYDALE AVE
GENEVA AVE
16
CART
ER S
T 17
MIS
SIO
N S
T
GENEVA AVE GUADALUPE CANYON PKWY
18
ORA
NG
E ST
TUNNEL AVEOLD COUNTY RD
ALANA WAY
BLANKEN AVE
BAYS
HO
RE B
LVD
GUADALUPE CANYON PKWY
BAYS
HO
RE B
LVD
VALLEY DR
SIER
RA P
OIN
T PK
WY
LAGOON RD
TRAFFIC ANALYSIS LOCATION LANE GEOMETRIESFIGURE 4.N-3
SF06-0272 Brisbane Baylands\Graphics\for DEIR
Figure 4.N-4Traffic Analysis Location Lane Geometries
SOURCE: Fehr & Peers, 2012Brisbane Baylands . 206069
4.N-9

4. Environmental Setting, Impacts, and Mitigation Measures
4.N Traffic and Circulation
Brisbane Baylands 4.N-10 ESA / 206069 Draft EIR June 2013
TABLE 4.N-2 INTERSECTION LEVEL OF SERVICE – EXISTING CONDITIONS
Intersection Control Peak Hour Delay
Level of Service (LOS)
1. Geneva Avenue & Bayshore Boulevard (Daly City)
Signal AM 25 C
PM 23 C
2. Guadalupe Canyon Pkwy. & Bayshore Blvd. Signal AM 15 B
PM 13 B
3. Valley Drive & Bayshore Boulevard Signal AM 16 B
PM 13 B
4. Old County Rd. – Tunnel Ave. & Bayshore Blvd. Signal AM 31 C
PM 30 C
5. San Bruno Avenue & Bayshore Boulevard Side-street stop AM 29 D(EB)
PM 27 D(EB)
6. Sierra Point Parkway & US 101 Ramps Side-street stop AM 20 C(NB)
PM 10 A(NB)
7. Lagoon Way & Tunnel Avenue All-way stop AM <10 A
PM <10 A
8. Lagoon Way & Sierra Point Parkway All-way stop AM 11 B(WB)
PM 13 B(NB)
9. Beatty Road & Alana Way Side-street stop AM 11 B(EB)
PM 10 A(SB)
10. Harney Way & Alana Way & Thomas Mellon Dr. (San Francisco)
Side-street stop AM <10 A
PM <10 A
11. Jamestown Avenue & Third Street (San Francisco)
Signal AM 20 B
PM 18 B
12. Tunnel Avenue & Bayshore Boulevard (San Francisco)
Signal AM 27 C
PM 20 B
13. Blanken Avenue & Tunnel Avenue (San Francisco)
All-way stop AM 10 A
PM <10 A
14. Blanken Avenue & Bayshore Boulevard (San Francisco)
Signal AM 10 A
PM 11 B
15. Sunnydale Avenue & Bayshore Boulevard (San Francisco)
Signal AM 19 B
PM 20 B
16. Geneva Avenue & Carter Street (San Francisco)
Signal AM 23 C
PM 31 C
17. Geneva Avenue & Mission Street (San Francisco)
Signal AM 18 B
PM 20 C
18. E. Market Street & Orange Street (Daly City)
All-way stop AM 12 B(EB)
PM <10 A NOTE: The LOS/Delay for Side-Street Stop-Control intersections represents the worst movement or approach; for Signalized and All-Way
Stop-Control, the LOS/Delay represents overall intersection. Shaded Bold typeface indicates an unacceptable LOS E or worse. EB = eastbound, WB = westbound, NB = northbound, SB = southbound SOURCE: Fehr & Peers Transportation Consultants, July 2007. As previously discussed, baseline traffic counts were conducted in 2007
and, based on updated 2012 counts, remain an appropriate reflection of baseline conditions for the purposes of this analysis.

4. Environmental Setting, Impacts, and Mitigation Measures
4.N Traffic and Circulation
Brisbane Baylands 4.N-11 ESA / 206069 Draft EIR June 2013
TABLE 4.N-3 LEVEL OF SERVICE DEFINITIONS FOR FREEWAY SEGMENTS
Level of Service (LOS)a Description
Maximum Volume-to-Capacity Ratio
A Free flow operations with average operating speeds at, or above, the speed limit. Vehicles are unimpeded in their ability to maneuver.
0.30
B Free flow operations with average operating speeds at the speed limit. Ability to maneuver is slightly restricted. Minor incidents cause some local deterioration in operations.
0.50
C Stable operations with average operating speeds near the speed limit. Freedom to maneuver is noticeably restricted. Minor incidents cause substantial local deterioration in service.
0.71
D Speeds begin to decline slightly with increasing flows. Freedom to maneuver is more noticeably restricted. Minor incidents create queuing.
0.89
E Operations at capacity. Vehicle spacing causes little room to maneuver but speeds exceed 50 miles per hour (mph). Any disruption to the traffic stream can cause a wave of delay that propagates throughout the upstream traffic flow. Minor incidents cause serious breakdown of service with extensive queuing. Maneuverability is extremely limited.
1.00
F Operations with breakdowns in vehicle flow. Volumes exceed capacity causing bottlenecks and queue formation.
N/A
a Freeway mainline LOS based on a 65 miles per hour (mph) free-flow speed. N/A = not applicable SOURCE: Transportation Research Board, 2000
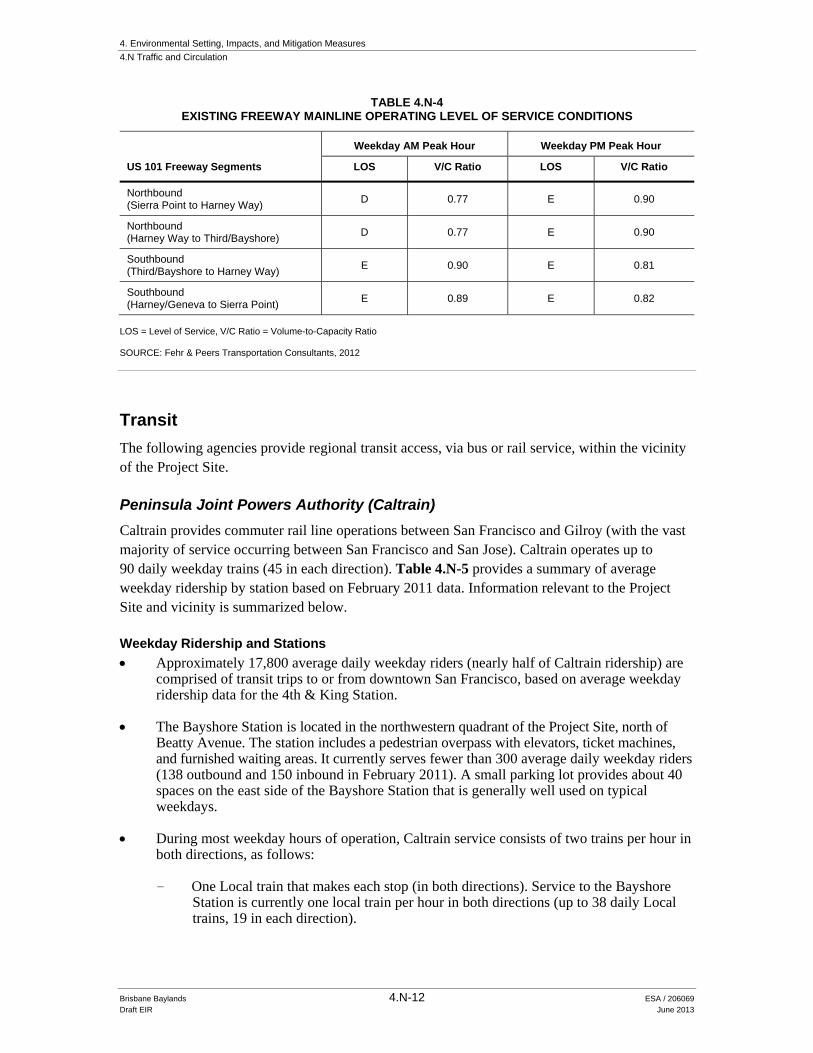
Freeway mainline analysis was conducted at the following four segments, selected on the basis of proximity to the Project Site and the likelihood that each location would be adversely affected by a substantial number of Project-related trips:
US 101 northbound—between Sierra Point Parkway and Harney Way
US 101 northbound—between Harney Way and Third Street/Bayshore Boulevard
US 101 southbound—between Third Street/Bayshore Boulevard and Alana Way
US 101 southbound—between Alana Way and Sierra Point Parkway
As shown in Table 4.N-4, all analysis segments currently experience LOS E or LOS F conditions during the commute periods—either in the AM or PM peak hours, with the segment of US 101 southbound between Third Street/Bayshore Boulevard and Sierra Point Parkway experiencing LOS E conditions during both the AM and PM peak hours.
4. Environmental Setting, Impacts, and Mitigation Measures
4.N Traffic and Circulation
Brisbane Baylands 4.N-12 ESA / 206069 Draft EIR June 2013
TABLE 4.N-4 EXISTING FREEWAY MAINLINE OPERATING LEVEL OF SERVICE CONDITIONS
US 101 Freeway Segments
Weekday AM Peak Hour Weekday PM Peak Hour
LOS V/C Ratio LOS V/C Ratio
Northbound (Sierra Point to Harney Way)
D 0.77 E 0.90
Northbound (Harney Way to Third/Bayshore)
D 0.77 E 0.90
Southbound (Third/Bayshore to Harney Way)
E 0.90 E 0.81
Southbound (Harney/Geneva to Sierra Point)
E 0.89 E 0.82
LOS = Level of Service, V/C Ratio = Volume-to-Capacity Ratio SOURCE: Fehr & Peers Transportation Consultants, 2012
Transit
The following agencies provide regional transit access, via bus or rail service, within the vicinity of the Project Site.
Peninsula Joint Powers Authority (Caltrain)
Caltrain provides commuter rail line operations between San Francisco and Gilroy (with the vast majority of service occurring between San Francisco and San Jose). Caltrain operates up to 90 daily weekday trains (45 in each direction). Table 4.N-5 provides a summary of average weekday ridership by station based on February 2011 data. Information relevant to the Project Site and vicinity is summarized below.
Weekday Ridership and Stations
Approximately 17,800 average daily weekday riders (nearly half of Caltrain ridership) are comprised of transit trips to or from downtown San Francisco, based on average weekday ridership data for the 4th & King Station.
The Bayshore Station is located in the northwestern quadrant of the Project Site, north of Beatty Avenue. The station includes a pedestrian overpass with elevators, ticket machines, and furnished waiting areas. It currently serves fewer than 300 average daily weekday riders (138 outbound and 150 inbound in February 2011). A small parking lot provides about 40 spaces on the east side of the Bayshore Station that is generally well used on typical weekdays.
During most weekday hours of operation, Caltrain service consists of two trains per hour in both directions, as follows:
- One Local train that makes each stop (in both directions). Service to the Bayshore Station is currently one local train per hour in both directions (up to 38 daily Local trains, 19 in each direction).

4. Environmental Setting, Impacts, and Mitigation Measures
4.N Traffic and Circulation
Brisbane Baylands 4.N-13 ESA / 206069 Draft EIR June 2013
TABLE 4.N-5 EXISTING CALTRAIN AVERAGE WEEKDAY RIDERSHIP a
Station
Northbound Southbound Total
On Off On Off On Off
San Francisco 0 8,902 8,897 0 8,897 8,902
22nd Street 23 970 1,014 16 1,036 966
Bayshore (within Project Site) 18 132 120 18 138 150
South San Francisco 119 269 246 140 365 410
San Bruno 175 222 229 177 403 399
Millbrae 334 2,306 2,266 326 2,600 2,632
Burlingame 304 345 371 278 675 623
San Mateo 630 689 716 588 1,347 1,276
Hayward Park 128 157 160 136 288 293
Hillsdale 1,182 682 701 1,176 1,883 1,858
Belmont 202 160 167 207 369 367
San Carlos 477 476 460 478 937 954
Redwood City 1,408 700 699 1401 2,106 2,101
Menlo Park 776 523 535 826 1,312 1,349
Palo Alto 2,766 1,289 1,262 2,910 4,028 4,199
California Avenue 615 285 280 609 895 894
San Antonio 406 66 72 389 478 455
Mountain View 3,038 294 330 3,063 3,368 3,358
Sunnyvale 1,690 101 97 1,626 1,787 1,727
Lawrence 438 97 93 442 531 540
Santa Clara 603 54 52 585 656 639
College Park 43 52 31 87 74 139
San Jose Diridon 2,596 36 84 2,677 2,681 2,713
Tamien 571 71 6 438 577 510
Capitol 18 3 1 17 19 20
Blossom Hill 65 3 3 46 68 49
Morgan Hill 106 0 0 91 106 91
San Martin 43 1 0 36 43 36
Gilroy 113 0 0 111 113 111
TOTAL 18,885 18,885 18,894 18,894 37,779 37,779
a February 2011 Caltrain passenger counts. Service level of up to 90 daily weekday trains reflects service provided prior to 2011 service
cuts that reduced service to 86 daily weekday trains due to an operating funds deficit. SOURCE: Caltrain, February 2011

4. Environmental Setting, Impacts, and Mitigation Measures
4.N Traffic and Circulation
Brisbane Baylands 4.N-14 ESA / 206069 Draft EIR June 2013
- One Limited train that stops only at designated stations. Limited trains currently do not stop at the Bayshore Station, given the low ridership demand compared to other stations, and also the station location on one of the few four-track segments on the Caltrain line.
During peak commute periods, additional “Baby Bullet” trains (express trains that skip most stations, including Bayshore Station) provide two additional trains per hour in both directions, for a total of four trains per hour in the peak-commute directions: one Local, one Limited, and two Baby Bullet trains.3
Existing Caltrain Capacity, Demand, and Supply
Per-Train Capacity is 650 passengers.
Service Capacity at Bayshore Station (one train per hour in each direction stopping at Bayshore Station) is 1,300 passengers per hour (during all hours of service).
Peak Hour Capacity (including those trains that pass through the Bayshore Station without stopping) is 6,500 passengers (based on a total of 10 trains in operation during the peak 60-minute AM and PM periods in both directions).
During the AM and PM commute periods, a total of four trains per hour operate in both directions (increasing to a “peak hour” service level of five trains in each direction during the AM and PM Peak Hours).
Demand (based on February 2011 ridership data) varies by type of service:
- Average passengers per train:
Baby Bullet trains: 547 passengers Limited trains: 472 passengers Local trains: 278 passengers
- Peak passengers per train (the maximum number of passengers at a single point on the line during AM and PM peak commute periods):
Northbound AM: 355 passengers (unused capacity of 295 passengers) Southbound AM: 286 passengers (unused capacity of 364 passengers) Northbound PM: 305 passengers (unused capacity of 345 passengers) Southbound PM: 389 passengers (unused capacity of 261 passengers)
Supply of Unused Seat Capacity (Bayshore Station service) is estimated to be about 800 seats per hour (based on average ridership on Local trains that provide hourly service to Bayshore Station).
Supply of Unused Seat Capacity (all trains passing through Project Site) is estimated to be about 3,345 seats per hour during the AM peak hour and 3,080 seats per hour during the PM peak hour. This estimate is based on five peak-hour trains in both directions, including those trains that do not stop at Bayshore Station:
3 The provision of Baby Bullet service was made possible following the construction of several four-track segments
(each about 2 miles long) on the Caltrain line, allowing Baby Bullet trains to pass Local trains (and also allowing Limited trains to pass Local trains). One of the four-track segments is about 2 miles in length, extending from the Tunnel portal just north of Bayshore Station to the northern half of Brisbane Lagoon, within the Project Site.

4. Environmental Setting, Impacts, and Mitigation Measures
4.N Traffic and Circulation
Brisbane Baylands 4.N-15 ESA / 206069 Draft EIR June 2013
- Northbound AM: 1,525 vacant seats during peak hour - Southbound AM: 1,820 vacant seats during peak hour - Northbound PM: 1,775 vacant seats during peak hour - Southbound PM: 1,305 vacant seats during peak hour
San Mateo County Transit District (SamTrans)
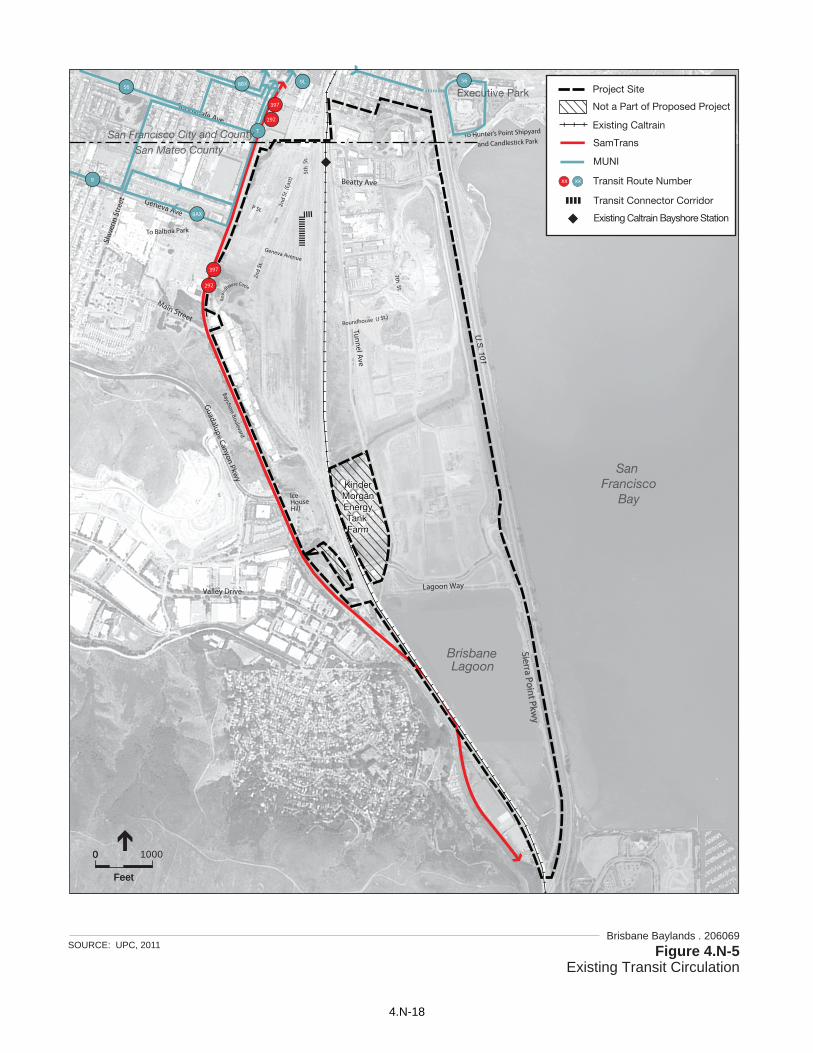
SamTrans provides bus service to locations in San Mateo County, as well as limited service to select locations in San Francisco including the Transbay Temporary Terminal. SamTrans provides the following two local bus routes along Bayshore Boulevard, bordering the west side of the Project Site:
Route #292 provides service from downtown San Francisco, through Brisbane, to South San Francisco, San Francisco International Airport, and Burlingame, and ends at Hillsdale Shopping Center in San Mateo. In Brisbane along the Project Site’s western edge, the bus stops on Bayshore Boulevard at Geneva Avenue, Guadalupe Canyon Parkway, and Valley Drive. It also stops at the Park-n-Ride lot located at Old County Road and Bayshore Boulevard, just outside the Project Site boundary. This service provides about 43 buses per weekday between the hours of 5:00 AM and 2:00 AM with headways of approximately 20 minutes during peak periods. There are approximately 4,000 weekly boardings of Route #292, which is the fourth highest ridership in the SamTrans system.
Route #397 provides “night owl” service from downtown Brisbane to downtown San Francisco, San Francisco International Airport, Burlingame, San Mateo, Belmont, San Carlos, Redwood City, and Palo Alto. In Brisbane, it stops at the Park-n-Ride lot located at Old County Road and Bayshore Boulevard and it provides connections to the Caltrain Palo Alto Station to the south and the Transbay Terminal to the north. This service provides about three buses in each direction between the hours of 1:30 AM and 5:00 AM.
San Francisco Bay Area Rapid Transit District (BART)
BART provides regional heavy-rail rapid transit service, serving approximately 360,000 average weekday boardings on the BART system. The Balboa Park Station, located 2.5 miles west of the Project Site via Geneva Avenue, serves about 26,000 average weekday riders (13,000 boardings and 13,000 exits).
San Francisco Municipal Transit (Muni)
Muni provides bus and light rail service, primarily within the borders of the City and County of San Francisco, serving approximately 700,000 average weekday boardings on the Muni system.
Muni service near the Project Site includes light rail and bus service that operates along the Third Street corridor, connecting downtown San Francisco, Mission Bay, and southeastern San Francisco. T-line service terminates at Third Street and Sunnydale Avenue (bordering the northwest corner of the Project Site, approximately 1,000 feet west of the Bayshore Caltrain Station). Routes include the following:
Muni Route 8X and 8BX (about seven buses per hour) operates in an “L-shaped” alignment, with two legs that serve Visitacion Valley and Sunnydale Muni Station:

4. Environmental Setting, Impacts, and Mitigation Measures
4.N Traffic and Circulation
Brisbane Baylands 4.N-16 ESA / 206069 Draft EIR June 2013
- The east-west leg provides service from San Francisco City College / Phelan Loop (approximately 3 miles west of the Project Site) and Balboa Park BART Station (approximately 2.5 miles west of the Project Site) and Visitacion Valley, including a stop within a 900-foot walk to/from the Sunnydale Station (located at the intersection of Bayshore Boulevard and Sunnydale Avenue, about 1,000 feet west of the Bayshore Caltrain Station).
- The north-south leg provides service on the San Bruno Avenue corridor between Sunnydale Station area and downtown San Francisco (approximately 6 miles north of the Project Site).
Muni Route 9-San Bruno and Route 9L-San Bruno Limited (10 buses per hour) operate between Visitation Valley (including service on the segment of Geneva Avenue between Santos and Scherwin Streets) and downtown San Francisco via the Sunnydale Station and San Bruno Avenue corridor (sharing that portion of the route with Route 8X and 8BX).
Muni Route 56 provides local community shuttle bus service between the Executive Business Park (east of US Highway 101) and Visitacion Valley via an east-west route north of the Project Site.
Muni Line T-Third Street light-rail line (six trains per hour) operates between Sunnydale Station (located 1,000 feet west of the Bayshore Caltrain Station) and the downtown San Francisco along the Third Street corridor, including service to the Bayview and Mission Bay neighborhoods as well as the San Francisco waterfront (via The Embarcadero) and the Market Street Muni Metro stations (after entering the downtown subway south of Market Street). The following extensions of the T-Third line are planned or proposed:
- The planned northern extension of the T-Third line (Central Subway project) will extend service directly north to Chinatown via Fourth and Stockton Streets (scheduled for completion prior to 2020). Funding has been secured for the Central Subway and construction is underway.
- The proposed southern extension of the T-Third line would extend the line approximately 1,000 feet east to provide a direct transfer-point with the Bayshore Caltrain Station. Funding has not been secured for the proposed southern extension to serve the Project Site.
Brisbane-Crocker Park BART Shuttle
The Brisbane-Crocker Park BART Shuttle (described in more detail on pages 4.N-24 -4.N-25) runs between the Balboa Park BART Station and the Brisbane-Crocker Industrial Park via Geneva Avenue and Bayshore Boulevard. The shuttle operates adjacent to the Project Site on Bayshore Boulevard and provides afternoon-only connections to the Bayshore Caltrain Station within the Project Site.
Summary
A summary of service provided by each public transit agency is provided in Table 4.N-6 and shown in Figure 4.N-5.

4. Environmental Setting, Impacts, and Mitigation Measures
4.N Traffic and Circulation
Brisbane Baylands 4.N-17 ESA / 206069 Draft EIR June 2013
TABLE 4.N-6 EXISTING PUBLIC TRANSIT SERVICE CHARACTERISTICS
Weekday
Frequency Saturday
Frequency Nearest Stop(s) to
Project Site
San Francisco Muni Bus and Light-Rail Routes
Route 8AX, 8BX, 8X Bayshore Express: Express bus service between San Francisco City College and downtown San Francisco via Balboa Park BART Station, Geneva Avenue (west of Santos Street), Visitacion Valley, Sunnydale Station, Bayshore Boulevard, San Bruno Avenue and US Highway 101 (north of Silver Avenue).
7 -9 minutes 15 minutes 900-foot walk from Sunnydale Station
(Bayshore Boulevard at Sunnydale
Avenue)
Route 9, 9L San Bruno: Local, Express, and Commuter Express Route connecting Visitacion Valley and Sunnydale Station with San Francisco neighborhoods including Bernal Heights, Mission District, and downtown San Francisco, via the San Bruno Avenue corridor.
6 minutes (local + limited
combined)
Sunnydale Station (Bayshore Boulevard
at Sunnydale Avenue)
Route 56 Rutland: Community service route serving Visitacion Valley and Executive Park and linking to the T-Third Muni Metro and Express Routes.
30 minutes 30 minutes Sunnydale Station (Bayshore Boulevard
at Sunnydale Avenue)
T-Third Street Light-Rail: Serves San Francisco’s easternmost neighborhoods in a north/south alignment via Third Street, including the Bayview neighborhood, Mission Bay, South of Market area (SOMA), and downtown San Francisco (with continuing service as K-line west of Embarcadero Station, and transfer opportunities to Muni lines operating on Market Street corridor).
10 minutes (15 minutes evenings)
12 minutes (20 minutes evenings)
Sunnydale Station (Bayshore Boulevard
at Sunnydale Avenue)
SamTrans Bus Routes
Route #292 Caltrain Connection: This multi-city line provides local bus service linking Hillsdale Shopping Center, San Mateo, Burlingame, San Francisco International Airport, United Airlines Maintenance Base, South San Francisco, Brisbane, and San Francisco. It stops at most Caltrain stations along its route.
20-40 minutes
(60 minutes evenings)
30 minutes (60 minutes evenings)
Sunnydale Station (Bayshore Boulevard
at Sunnydale Avenue)
Route #397 All-Nighter: A multi-city line connecting San Francisco, South San Francisco, San Francisco International Airport, Burlingame, San Mateo, Belmont, San Carlos, Redwood City, and Palo Alto, Route #397 runs only from 1:30 AM to 5:00 AM.
60 minutes 60 minutes Sunnydale Station (Bayshore Boulevard
at Sunnydale Avenue)
Caltrain Service
Caltrain: Commuter rail service between Gilroy and San Francisco (with majority of trains providing service to San Jose, northern Santa Clara County, San Mateo County, and downtown San Francisco) with key transfer points to other transit lines at 4th & King, Millbrae, Palo Alto, Mountain View, and San Jose stations.
60 minutes (serving
Bayshore Station)
120 minutes (serving
Bayshore Station)
Bayshore Station (Tunnel Avenue at
the border of Brisbane and San
Francisco)
Lagoon WayValley Drive
Sierra Point Pkwy
0 1000
Feet
Guadalupe Canyon Pkwy
Main Street
Geneva Ave
Sunnydale Ave
Shw
erin
Str
eet
Tunnel Ave
397
292
292
9
T
8AX
397
To Hunter’s Point Shipyard
and Candlestick Park
To Balboa Park
U.S
. 101
Bayshore Boulevard
P St.
.tS ht 5
7th St.
Roun
dhouse Circle
(J St.)
2nd
St. (
East
)
2nd
St.
Roundhouse
Geneva Avenue
Ice HouseHill
56568BX 9L
Beatty Ave
San Francisco City and County
San Mateo County
Brisbane Lagoon
Sierra Point Pkwy
0
Feet
San Francisco
Bay
Executive Park
KinderMorganEnergyTank Farm
KinderMorganEnergyTank Farm
Brisbane Baylands . 206069Figure 4.N-5
Existing Transit CirculationSOURCE: UPC, 2011
Project Site
Not a Part of Proposed Project
Existing Caltrain
SamTrans
MUNI
Transit Route Number
Transit Connector Corridor
Existing Caltrain Bayshore Station
xx xx
4.N-18

4. Environmental Setting, Impacts, and Mitigation Measures
4.N Traffic and Circulation
Brisbane Baylands 4.N-19 ESA / 206069 Draft EIR June 2013
Bicycle Facilities
Bicycles may travel on all public roads except where they are specifically prohibited on designated highway or freeway segments. Dedicated bicycle facilities, known as “bikeways,” are often provided to help facilitate bicycle travel. The three main types of bikeways defined by the Caltrans Highway Design Manual (Chapter 1000, Bikeway Planning and Design) are:
Class I Bicycle Paths, or multiuse trails, provide for bicycle travel on a paved right-of-way that is separated from motor vehicle travel. Bicycle paths are often located along waterfronts, railroad rights-of-way (active and abandoned), through parks, or stream and river channels. In most cases, sidewalks cannot be considered Class I bicycle paths unless they are of an appropriate design, separation is provided from adjacent roadways (such as a landscape strip or raised divider), and intersection or driveway crossings are limited.
Class II Bicycle Lanes, in which lane striping is used to delineate a travel lane (generally 5 feet wide, and a minimum of 4 feet wide) for exclusive use of bicyclists on a roadway. Typically, Class II bicycle lanes are provided in both directions along a street and accompanied by signage and lane markings consistent with Caltrans standards.
Class III Bicycle Routes are facilities in which bicyclists share travel lanes with motorists, and are designated by signage only. As defined by Caltrans, Class III bicycle routes should direct cyclists to the superior through route. In order to achieve the best conditions for bicyclists and motorists to share travel lanes, curb lanes that are wider than standard are often provided, unless roadway volumes are relatively low such that additional width is unnecessary.
Another type of bikeway, not included in Caltrans classification standards, is the “bicycle boulevard.” There is no standard definition for “bicycle boulevards,” but in general, they are streets on which bicycles have priority over other modes. They can have several features such as forced right turns for vehicles (but not for bicycles and pedestrians), special signage, “flipped stop signs” (cross-street stops instead of the street with the bicycle boulevard), and street closures. These measures are intended to minimize automobile volumes and speeds.
Figure 4.N-6 shows existing and planned bikeways within or near the Project Site.
Regional Bicycle Facilities
The San Francisco Bay region enjoys one of the most extensive and interconnected bicycle networks in the nation. The key regional facility serving the Project Site is the San Francisco Bay Trail, an interconnected, multiuse bicycle path that follows the Bay shoreline and will eventually encircle the Bay from San Jose in the south to Napa in the north. Bay Trail segments near the Project Site include Class I bicycle path segments at Candlestick Point to the north (connecting with Class III facilities that continue north to downtown San Francisco) and Sierra Point to the south (connecting with additional Class I and II facilities that circulate past the Genentech campus and through South San Francisco).
The northern portion of the Project Site contains a gap in the Bay Trail network. Although bicyclists can travel west from the Bay shoreline and use Tunnel Avenue to travel north-south through the Project Site, this alignment is not officially designated as part of the Bay Trail.

Sierra P
oint Pkw
y
Figure 3-3Former Landfill Site and Former Railyard Site
(Regulatory Remediation Areas)
0 1000
Feet
Beatty Ave
Lagoon WayValley Drive
Guadalupe C
anyon Pkw
y
Main Street
Geneva Ave
Tunnel Ave
Sunnydale Ave
Shw
erin
Str
eet
San Francisco City and County
San Mateo County
Brisbane Lagoon
San Francisco
Bay
Executive Park
KinderMorganEnergyTank Farm
KinderMorganEnergyTank Farm
Brisbane Baylands . 206069Figure 4.N-6
Existing and Planned Bicycle Route NetworkSOURCE: UPC, 2011; Fehr and Peers, 2012
Project Site
Not a Part of Proposed Project
CalTrainBayshore
Station
Existing Caltrain
Class I Multi-Use Path - Existing
Class II Bicycle Lane - Existing
Class III Bicycle Route - Existing
Class I Multi-Use Path - Planned
Class II Bicycle Lane - Planned
Class III Bicycle Route - Planned
Unclassified On-Street - Planned
U.S
. 101
4.N-20

4. Environmental Setting, Impacts, and Mitigation Measures
4.N Traffic and Circulation
Brisbane Baylands 4.N-21 ESA / 206069 Draft EIR June 2013
Within the southern portion of the Project Site, Class II bicycle lanes are provided for the Bay Trail segment on Sierra Point Parkway (south of Lagoon Way).
Local Facilities
The following roadways provide bicycle circulation near the Project Site:
Bayshore Boulevard provides north-south circulation connecting Brisbane with San Francisco to the north and South San Francisco to the south. Bayshore Boulevard is striped with Class II bicycle lanes north of Geneva Avenue (within the San Francisco city limits), as well as south of Geneva Avenue (within Brisbane) where rumble strips are installed between the bikeway and outside travel lane. Within Brisbane, relatively high travel speeds may discourage the use of Brisbane Boulevard by inexperienced bicyclists.
An east-west bicycle facility is provided on Guadalupe Canyon Parkway (between Bayshore Boulevard and Mission Blue Drive), providing a connection between Bayshore Boulevard and newer residential developments in the Brisbane hills. This bikeway includes a Class II bicycle lane in the westward direction only (traveling uphill from Bayshore Boulevard), while eastbound (downhill) bicyclists share a travel lane with motor vehicles (i.e., Class III bicycle route).
Geneva Avenue is a Class III bicycle route providing east-west circulation between Bayshore Boulevard and Balboa Park BART Station. West of the Balboa Park BART Station, an additional east-west connection to San Francisco State University is provided by a Class III bicycle route on Holloway Street.
Valley Drive is not a designated bicycle route, but as noted earlier, bicyclists are permitted to travel on all public roads unless specifically prohibited. Valley Drive provides the most direct connection for bicyclists traveling between Bayshore Boulevard, Brisbane City Hall, Crocker Business Park, and Guadalupe Canyon Parkway.
Old County Road is not a designated bicycle route, but it provides the most direct connection for bicyclists traveling between the Project Site (via Tunnel Avenue) and Central Brisbane.
Sunnydale and Visitacion Avenues are not designated as bicycle routes, but provide direct east-west connections west of Bayshore Boulevard to the Visitacion Valley and Excelsior neighborhoods of San Francisco.
According to the 2011 American Community Survey, 1.0 percent of Brisbane residents commute to work by bicycle on a regular basis, which is lower than the San Mateo County average of 1.2 percent, the San Francisco average of 3.1 percent, and the Bay Area regional average of 1.8 percent.4 This mode split does not include commuters that travel by bicycle to transit stations (such as the Bayshore Caltrain Station). This factor could have a substantial effect on the overall rate of bicycling because Brisbane neighborhoods, including the Project Site, are all located within convenient bicycling distance of the Caltrain station. Because the Census data are based on the journey to work, they also exclude shopping, recreation, school, and other discretionary trips.
4 Bay Area regional average based on Metropolitan Transportation Commission (MTC) 2000 Bay Area Travel
Survey.

4. Environmental Setting, Impacts, and Mitigation Measures
4.N Traffic and Circulation
Brisbane Baylands 4.N-22 ESA / 206069 Draft EIR June 2013
Project Site Facilities
Class II bicycle lanes are provided on Lagoon Way and Sierra Point Parkway (south of Lagoon Way). Sierra Point Parkway is designated as part of San Francisco Bay Trail and connects with Bay Trail segments to the south of the Project Site in South San Francisco. Within the Project Site, bicyclists traveling between Bay Trail segments to the north and south of the Project Site currently use Class II bicycle lanes on Lagoon Way and Class III bicycle routes on Tunnel and Beatty Avenues to circulate through the site, although those roads are not officially designated as Bay Trail segments. Installation of a Class I bicycle path between Lagoon Way and Beatty Drive is planned as part of the San Francisco Bay Trail Regional Development Plan to eliminate the current gap in the official Bay Trail alignment. The path would connect existing Bay Trail segments to the north and south of the Project Site but is currently unfunded.
Bicycle Support Facilities
Bicycle support facilities include bicycle parking facilities (such as racks or secure enclosures), as well as shower and locker facilities to encourage bicycle commuting, and measures to facilitate bicyclists’ use of transit. Near the Project Site, regional support facilities include intermodal links with Caltrain rail service and Muni bus service. Local support facilities include bicycle racks at some local destinations along Bayshore Boulevard, although such facilities are currently scarce. At the northwest edge of the Project Site, the Bayshore Caltrain Station includes bicycle lockers to facilitate bicycle commuting, and bicyclists are allowed to take their bikes on designated train cars. In addition, bicycles can be transported on racks on the front of buses (Muni and SamTrans), and on BART trains (with some restrictions).
Pedestrian Facilities
Types of pedestrian facilities include:
Sidewalks along roadways
Curb ramps and crosswalks at intersections
Pedestrian signals at controlled locations
Pedestrian paths, including those that provide pedestrian circulation between buildings and within parking lots
Pedestrian bridges, such as the bridge that provides a pedestrian overpass that connects the east and west sides of the Caltrain station
Regional Facilities
The San Francisco Bay Trail is a regional facility that provides pedestrian access along the Bay shoreline. North of the Project Site, at Candlestick Point in San Francisco, and south of the Project Site, at Sierra Point in South San Francisco, a dedicated bicycle/pedestrian pathway is provided for the Bay Trail. However, due to a lack of pathway connections through the Project Site, a gap currently exists in the trail facility.

4. Environmental Setting, Impacts, and Mitigation Measures
4.N Traffic and Circulation
Brisbane Baylands 4.N-23 ESA / 206069 Draft EIR June 2013
Local Facilities
Within San Francisco and the developed areas of Brisbane, sidewalks are provided along most streets, and crosswalks are provided at many crossing locations. Key exceptions include segments of Bayshore Boulevard, which lacks sidewalks south of Geneva Avenue, and along several of the streets serving Candlestick Point.
Project Site Facilities
Pedestrian paths are provided along the lagoon at the southern end of the Project Site. The rest of the Project Site currently lacks dedicated pedestrian facilities. Internal roadways provide vehicle and truck access within the site, and to/from the US 101 freeway, but do not include sidewalks. As noted above, the northern portion of the Project Site represents a gap in the San Francisco Bay Trail.
Transportation Demand Management
There are two Transportation Management Associations that operate in the Brisbane area providing a variety of Transportation Demand Management (TDM) programs: the Peninsula Traffic Congestion Relief Alliance and the Transportation Management Association of San Francisco. Individual employers and employees on the Project Site would be eligible to participate in the TDM programs of both agencies.
Regional Programs
The Peninsula Traffic Congestion Relief Alliance (the ALLIANCE) is a public agency organized as a Joint Powers Authority to serve as San Mateo County’s Transportation Demand Management (TDM) Agency. Its mission is “to reduce the number of single occupant vehicles traveling in, to or through San Mateo County, reducing vehicle emissions that result in improved air quality.” The ALLIANCE is funded by:
The City/County Association of Governments of San Mateo County (C/CAG)
The San Mateo County Transportation Authority
The Bay Area Air Quality Management District (BAAQMD)
The Metropolitan Transportation Commission (MTC)
As noted above, the ALLIANCE is a public agency organized as a Joint Powers Authority. It is governed by a board of 18 elected officials, one from each of the 17 cities and counties that are ALLIANCE members. The ALLIANCE offers a wide variety of commuter programs including:
Coordination with employers to provide commuter shuttles from BART and Caltrain to within easy walking distance of many San Mateo County employers (e.g., many business parks). There are currently 15 to 19 shuttle-type services in operation; some are commuter-only, some are commuter and residential, and some are residential and shopping shuttles serving major shopping destinations. There is one shuttle that serves Brisbane – the Crocker Industrial Park Shuttle – described in more detail below.
Personalized commute planning to help employees find alternatives to driving alone.

4. Environmental Setting, Impacts, and Mitigation Measures
4.N Traffic and Circulation
Brisbane Baylands 4.N-24 ESA / 206069 Draft EIR June 2013
Free Transit Tickets for new riders of BART, Caltrain, SamTrans, or the Santa Clara Valley Transportation Authority (VTA).
An Emergency Ride Home Program.
Rebates for new vanpool participants.
Cash incentives for new carpools.
Bike Parking at Half Cost: The ALLIANCE will order and pay half the cost of new bike racks and lockers (up to $500 per unit), as well as up to $200 for installation.
A Bike and Pedestrian Safety Program that offers free onsite employee trainings for employers.
Local Programs
As noted above, the ALLIANCE offers a variety of commuter programs including coordinating with employers to provide commuter shuttles from BART and Caltrain to within easy walking distance of many San Mateo County employers (e.g., many business parks). The Brisbane-Crocker Park BART Shuttle bus service (see Figure 4.N-7), managed by the ALLIANCE, provides service between the Balboa Park BART Station and Brisbane via Geneva Avenue and Bayshore Boulevard, including a stop at the T-line terminus. The shuttle operates adjacent to the Project Site on Bayshore Boulevard and provides afternoon-only connections to the Bayshore Caltrain Station within the Project Site.
The shuttle provides commute-oriented service between the Balboa Park BART Station and Brisbane employment locations on the west side of Bayshore Boulevard. It is operated by a private contractor (hired by the ALLIANCE). It is funded by the following sources:
75 percent of funding is grants from ALLIANCE supporters (i.e., City/County Association of Governments of San Mateo County [C/CAG], San Mateo Transportation Authority, and Bay Area Air Quality Management District ]BAAQMD]).
25 percent of funding is from employer contributions.
Figure 4.N-7Crocker Industrial Park Shuttle

4. Environmental Setting, Impacts, and Mitigation Measures
4.N Traffic and Circulation
Brisbane Baylands 4.N-25 ESA / 206069 Draft EIR June 2013
In order to ride the shuttle, passengers must present a shuttle pass, which is distributed by their employer. Employers sign up on behalf of their employees and receive the passes from the operator; they are charged according to the number of employee riders they have. There are three tiers of pass prices depending on the number of employees signed up (these are total monthly prices to buy all the passes, not per-pass costs):
Small (1-19 employees) Medium (20-99 employees) Large (100+ employees)
An employee of a company that is not participating in the shuttle program is able to buy a pass independently. The cost varies depending on the number of employers participating at any given time. This is a discounted price aided by grant funding and other finances. Free service is provided to Brisbane residents.
Additional information concerning the Brisbane-Crocker Industrial Park Shuttle is as follows:
Prior to 2002, the shuttle served the Bayshore Station. However, when the station was reconfigured in 2002, no area was created for a bus turnaround at the new station.
A separate shuttle that specifically serves the Bayshore Station via the Project Site has been proposed, but not yet funded.
The weekday morning (AM) commute service consists of eight shuttles from the Balboa Park BART station between 5:45 and 8:50 AM. Three of the shuttles stop at the Sunnydale Station (1,000 feet west of the Bayshore Caltrain Station). All shuttles continue to the Industrial Park employers and then serve the residential stops before returning to the Caltrain and BART stations.
The weekday afternoon (PM) commute service is provided between 3:00 and 7:30 PM.
Daily ridership has varied in recent years, averaging between 300 and 500 daily boardings.
Project Site Programs
Individual employers and employees are eligible to participate in the regional and local TDM programs described above, including the Brisbane-Crocker Park BART Shuttle bus service that operates on Bayshore Boulevard. Although Recology is a unique use that is not subject to traditional TDM requirements, Recology offers a commuter benefit program even though most employees arrive between 5:00 and 6:00 AM and most trips are truck pickup/dropoff.
Parking
Parking in the Project Site Vicinity
In general, where on-street parking in the study area is permitted, it is generally unrestricted (other than weekly street cleaning), and is typically permitted on both sides of the street. The exceptions include:

4. Environmental Setting, Impacts, and Mitigation Measures
4.N Traffic and Circulation
Brisbane Baylands 4.N-26 ESA / 206069 Draft EIR June 2013
Bayshore Boulevard where no parking is allowed south of MacDonald Avenue.
MacDonald Avenue where some parking has been eliminated due to the center-running T-Third light rail and some pockets have metered parking.
Sierra Point Parkway where no parking is allowed.
There are no Residential Permit Parking areas within the study area.
Parking on the Project Site
On the primary roadways within the Project Site, such as Tunnel and Beatty Avenues, parking is accommodated on the soft shoulder of the roadway.
4.N.3 Regulatory Setting Development within the Project Site must comply with federal, state, regional, and local regulations. This subsection discusses these requirements to the extent that they will affect the way Project Site development occurs. The subsection provides an overview of key state, regional, and local agencies with traffic and circulation-related policy and regulatory authority over the Project Site, and a summary of the plans and policies of those agencies. These plans and policies include the Brisbane General Plan, the San Mateo County Congestion Management Program, the San Francisco / San Mateo Bi-County Transportation Study, the San Mateo County Comprehensive Bicycle and Pedestrian Plan, the San Francisco General Plan, the Better Streets Plan, the San Francisco Bicycle Plan, the San Francisco Bay Trail Plan, and the Transit First Policy.
State Regulations
Interstate freeways and State Routes are under the jurisdiction of the California Department of Transportation (Caltrans), which sets standards, policies, and strategic plans for the more than 45,000 miles of California’s highway and freeway lanes, including US 101 adjacent to the Project Site. Caltrans administers its services through its six primary programs: Aeronautics, Highway Transportation, Mass Transportation, Transportation Planning, Administration, and the Equipment Service Center. Under the Transportation Planning program, Caltrans runs the State of California’s bicycle program. The Bicycle Facilities Unit, acting as Caltrans’ bicycle division, provides policy, funding, planning, and technical expertise in bicycle transportation in consultation with federal, state, and local transportation agencies, Caltrans headquarters and district staff, legislative staff, and the public (Caltrans, 2007).
The Caltrans Local Assistance Procedures Manual, Chapter 11, describes the various procedures and establishes design standards required to process federal- and state-funded local transportation projects. The Caltrans Highway Design Manual establishes uniform policies and procedures to carry out the highway design functions of Caltrans.
The California Complete Streets Act of 2008 (Assembly Bill 1358) requires cities and counties making substantive revisions to the circulation element of their general plans to include modifications

4. Environmental Setting, Impacts, and Mitigation Measures
4.N Traffic and Circulation
Brisbane Baylands 4.N-27 ESA / 206069 Draft EIR June 2013
to plan for complete streets. The act states: “In order to fulfill the commitment to reduce greenhouse gas emissions, make the most efficient use of urban land and transportation infrastructure, and improve public health by encouraging physical activity, transportation planners must find innovative ways to reduce vehicle miles traveled (VMT) and to shift from short trips in the automobile to biking, walking and use of public transit.” California Government Code Section 65302(b)(2)(A) requires that, upon any substantial revision of a community’s general plan circulation element, the circulation element must be amended to plan for “a balanced, multimodal transportation network that meets the needs of all users of the streets, roads, and highways for safe and convenient travel in a manner that is suitable to the rural, suburban, or urban context of the general plan.” Subsection B defines “users of streets, roads, and highways” as “bicyclists, children, persons with disabilities, motorists, movers of commercial goods, pedestrians, users of public transportation, and seniors.”
Regional Regulations
City/County Association of Governments (C/CAG) of San Mateo County
C/CAG is an association of 21 San Mateo County cities and the County of San Mateo that work together to address issues of regional concern (such as transportation, air quality, and hazardous waste disposal). C/CAG serves as the Congestion Management Agency (CMA) for San Mateo County, and in this capacity is responsible for developing, adopting, and updating a bi-annual Congestion Management Program (CMP) and administering the Countywide Transportation Plan.
San Mateo County Congestion Management Program (CMP)
Adopted as a response to requirements in 1990’s Propositions 111 and 108, the 2005 San Mateo County CMP provides mitigation measures and procedures for anticipated increases in countywide roadway congestion. Administered by the CMA within the San Mateo C/CAG, the goal of the CMP “…is to help the C/CAG promote countywide solutions to transportation problems based upon cooperation and mutual support” (C/CAG, 2011). In addition to specifying the roadway network and establishing LOS criteria for measuring congestion on the network, the bi-annual CMP includes evaluative performance measures, a land-use impact analysis program, a 7-year Capital Improvement Program designed to maintain or improve transit performance and traffic LOS, and a TDM program. The CMP’s TDM program is used to mitigate the impacts related to an increase of at least 100 project-related net new peak-hour vehicle trips. TDM measures, which give developers trip credits for each measure implemented, include:
Provide secure bicycle storage
Provide showers and changing rooms
Operate a dedicated shuttle service during the peak period to a rail station or an urban residential area; alternatively, the development could buy into a shuttle consortium
Charge employees for parking
Subsidize transit tickets for employees
Subsidize pedestrian/bicyclists who commute to work
Create preferential parking for carpoolers

4. Environmental Setting, Impacts, and Mitigation Measures
4.N Traffic and Circulation
Brisbane Baylands 4.N-28 ESA / 206069 Draft EIR June 2013
San Mateo County Comprehensive Bicycle and Pedestrian Plan
C/CAG, with support from the San Mateo County Transportation Authority (SMCTA), has developed the San Mateo County Comprehensive Bicycle and Pedestrian Plan (CBPP) to address the planning, design, funding, and implementation of bicycle and pedestrian projects of countywide significance (C/CAG, 2011). The CBPP updates the prior San Mateo County Comprehensive Bicycle Route Plan (2000) and expands the earlier plan by adding a pedestrian component. The following are the relevant goals and policies:
Goal 2: More People Riding and Walking for Transportation and Recreation
Policy 2.6: Serve as a resource to county employers on promotional information and resources related to bicycling and walking.
Goal 4: Complete Streets and Routine Accommodation of Bicyclists and Pedestrians
Policy 4.1: Comply with the complete streets policy requirements of Caltrans and the Metropolitan Transportation Commission concerning safe and convenient access for bicyclists and pedestrians, and assist local implementing agencies in meeting their responsibilities under the policy.
Policy 4.5: Encourage local agencies to adopt policies, guidelines, standards and regulations that result in truly bicycle-friendly and pedestrian-friendly land use developments, and provide them technical assistance and support in this area.
Policy 4.6: Discourage local agencies from removing, degrading or blocking access to bicycle and pedestrian facilities without providing a safe and convenient alternative.
The CBPP establishes eight Focus Areas for pedestrians. While no specific projects are outlined in the plan, the CBPP defers to local agencies (such as the City of Brisbane) to identify other pedestrian projects, such as new sidewalks, crossing improvements, and improved streetscape design. The following Focus Areas are applicable to potential pedestrian improvements in the Project Site vicinity:
Downtown Area Improvements. Projects consist of improvements to pedestrian environments and connections on streets and corridors where there would be a substantial benefit from enhanced facilities. Sidewalks should ideally include a planted/furniture zone, a wide pedestrian through zone, and a frontage zone.
Major Barrier Crossings. Barrier crossings are defined as improved connections across physical barriers to walking and may include traditional grade-separated crossings of freeways, railroads, and waterways, in addition to large arterials.
Safe Routes to School. Safe Routes to School improvements facilitate walking and bicycling access to schools in San Mateo County. The area within a 1-mile radius of a school is considered the highest priority for Safe Routes to School infrastructure improvements.
4. Environmental Setting, Impacts, and Mitigation Measures
4.N Traffic and Circulation
Brisbane Baylands 4.N-29 ESA / 206069 Draft EIR June 2013
Safe Routes to Transit. Pedestrian access to transit hubs is critical for encouraging transit ridership. Stations that are isolated by freeways or busy arterials or have no safe or convenient walkways between residential areas and transit stops should be prioritized.
Access to County/Regional Activity Centers. Many county and regional activity centers would benefit from improved walking connections. These include major hospitals, civic uses, employment districts, and parks, as well as rural town centers and neighborhood shopping / commercial districts. Projects would generally consist of new sidewalks, intersection improvements, and crossing improvements.
Regional Trails. Regional trails provide key recreational and commute opportunities for pedestrians. All Class I paths identified in the County Bicycle Network are also considered Pedestrian Focus Areas, including the Bay Trail.
San Francisco County Transportation Authority (SFCTA)
General Responsibilities
The primary purpose of the San Francisco County Transportation Authority (SFCTA) is to administer and oversee the 2003 Proposition K half-cent local transportation sales tax program and New Expenditure Plan. Created in 1989, the SFCTA also has several other responsibilities: it is designated as the San Francisco CMA, it prepares and administers the San Francisco CMP, it tracks transportation system performance, it prepares a long-range Countywide Transportation Plan, and it serves as the San Francisco Program Manager for Transportation Fund for Clean Air (TFCA) grants.
San Francisco / San Mateo Bi-County Transportation Study
The San Francisco / San Mateo Bi-County Transportation Study was originally undertaken in 2001 to anticipate and address development-related transportation challenges expected to occur over the next 20 years in San Francisco and San Mateo Counties. The study was updated in 2012 and released by the San Francisco County Transportation Authority, with the purpose of reevaluating transportation improvements needed to address future growth demands. The study takes a broad look at the totality of proposed development with the purpose of identifying regional, multimodal transportation project investments that will be needed to support future growth and existing neighborhoods. It aims to build broad consensus on such a project list toward creating a multi-jurisdictional and shared public and private funding strategy and prioritization. The study presents four primary goals and objectives:
Support local and regional strategic priorities with aligned transportation and land use investments and policies;
Provide strong multimodal connections that facilitate safe travel within, among, and through neighborhoods;
Support strong transit service; and
Maximize cost-effectiveness and minimize implementation risks.

4. Environmental Setting, Impacts, and Mitigation Measures
4.N Traffic and Circulation
Brisbane Baylands 4.N-30 ESA / 206069 Draft EIR June 2013
Key proposed land developments within the vicinity of the Project Site and identified in the draft 2012 document include:
San Francisco
- Hunters Point Shipyard (Phase 2)
2,650 dwelling units
5.2 million square feet of research & development, commercial, and community uses
- Candlestick Point
7,600 dwelling units
1.2 million square feet of office, commercial, community, and hotel uses
- Visitacion Valley / Schlage Lock Site
1,250 dwelling units
120,000 square feet of commercial, community uses
- Executive Park
1,600 dwelling units
Demolition of 230,000 square feet of office buildings and conversion to residential use
San Mateo County
- Brisbane Baylands5
800 dwelling units
7.5 million square feet of commercial, research & development, entertainment, hotel, office, and other uses
- East Daly City / Cow Palace6
- 1,700 dwelling units
- 550,000 square feet of commercial uses
5 The 2012 study notes that “at the time of the Bi-County needs assessment, the best information known about the
Brisbane Baylands was the potential for some additional housing. New information since the assessment was completed has become available, including the option for up to 4,400 new housing units, but this information is not reflected in the assessment.”
6 The 2012 study notes that the “Cow Palace site is currently under the ownership of the California Department of Food and Agriculture but may be transferred from State ownership for development purposes. The fair share calculated within the Bi-County Study for that site applies, even if ownership changes.”

4. Environmental Setting, Impacts, and Mitigation Measures
4.N Traffic and Circulation
Brisbane Baylands 4.N-31 ESA / 206069 Draft EIR June 2013
The draft 2012 document identifies a 20-year, $548 million (in 2010 dollars) transportation improvement program, including the following projects in the vicinity of the Project Site:
Traffic Calming Program (initiate 2010-2015);
Full Harney-Geneva Bus Rapid Transit Line (initiate 2015- 2020) (Item A on map);
US 101 Candlestick Interchange Re-Configuration (initiate 2020-2025) (Item B on map);
Geneva Avenue Extension (initiate 2015-2020) (Item C on map);T-Third Light Rail Extension (Segment “S”) (initiate 2020-2025) (Item D on map).
Bayshore Caltrain Station Re-Configuration (initiate 2015- 2020) (Item E on map); and
Bicycle-Pedestrian Connections Project (initiate 2015-2020) (Item F on map).
As noted in the 2012 study, the study “does not actually represent a funding commitment by any agency or private interest; such commitments, if made, would be called for under future implementation steps. Instead, the Study represents a consensus approach among the public partners to project development and funding for the Bi-County transportation investment program and a commitment to continue efforts and discussions on Bi-County funding beyond the report.”
The report further notes that the “level of required funds to implement the Bi-County program is ambitious for either the public or private sector to gather individually in the specified timeframe. But by combining public and private sources, the Bi-County partners can increase dramatically the prospects for funding the projects according to the specified schedule.” A combination of potential public and private funding sources are identified in the November 2012 report “to serve as a starting point for discussions about sharing costs among the Bi-County public and private partners.”
Association of Bay Area Governments (ABAG)
General Responsibilities
The Association of Bay Area Governments (ABAG) is the regional planning agency for the nine-county San Francisco Bay region. Created in 1961 as California’s first council of governments, ABAG’s purpose is to facilitate communication, cooperation, and coordination among the region’s local governments in creating policies and development frameworks that will benefit the region as a whole. ABAG serves as the state-designated clearinghouse for reviewing state and federal projects within the region and administers numerous regional planning programs, including the San Francisco Bay Trail Project.

4. Environmental Setting, Impacts, and Mitigation Measures
4.N Traffic and Circulation
Brisbane Baylands 4.N-32 ESA / 206069 Draft EIR June 2013
Bay Trail Regional Development Plan
The San Francisco Bay Trail is a planned 400-mile recreational corridor that will encircle the waterfront region of the San Francisco and San Pablo Bays. The Bay Trail consists of a network of hiking and bicycling trails that will connect the shorelines of all nine Bay Area counties. ABAG adopted the Bay Trail Regional Development Plan in 1989 in response to Senate Bill 100.
The 2005 Gap Analysis Study prepared by ABAG for the entire Bay Trail area attempted to identify the remaining gaps in the Bay Trail system; classify the gaps by phase, county, and benefit ranking; develop cost estimates for individual gap completion; identify strategies and actions to overcome gaps; and present an overall cost and timeframe for completion of the Bay Trail system. Within the Project Site, the 2005 Gap Analysis Study proposes to connect existing Bay Trail segments that are located within and north of the Project Site by completing the trail from its current southern gap terminus at Sierra Point Parkway, along the eastern edge of the Project Site and then extending the trail along the waterfront of Candlestick Point State Recreation Area.
Metropolitan Transportation Commission (MTC)
General Responsibilities
The Metropolitan Transportation Commission (MTC) is the federally designated Metropolitan Planning Organization and state-designated Regional Transportation Planning Agency for the Bay Area. The majority of federal, state, and local financing available for transportation projects is allocated at the regional level by MTC.
Regional Transportation Plan
The current regional transportation plan, known as Transportation 2035 Plan: Change in Motion, was adopted by MTC on April 22, 2009. Transportation 2035 specifies a detailed set of investments and strategies throughout the region from 2010 through 2035 to maintain, manage, and improve the surface transportation system. The plan specifies how anticipated federal, state, and local transportation funds will be spent in the Bay Area during the next two decades. Most of this “committed funding” will go toward maintaining and/or enhancing the region’s existing transportation infrastructure.
One Bay Area
One Bay Area is a new initiative meant to coordinate efforts among the region’s nine counties and 101 towns and cities to create a more sustainable future. A consortium of regional agencies—MTC, ABAG, BAAQMD, and the Bay Conservation and Development Commission (BCDC)—unveiled the initiative on April 22, 2010. One major effort now underway is the development of Plan Bay Area, the region’s long-range plan for sustainable land use, transportation, and housing. Plan Bay Area is one of the Bay Area region’s most comprehensive planning efforts to date. It is a joint effort designed to produce a more integrated land use/transportation plan. The transportation component of Plan Bay Area will draw on lessons learned from MTC’s most recent long-range regional transportation plan, Transportation 2035 Plan: Change in Motion. That plan anticipated many elements of Plan Bay Area’s broader, more integrated focus on housing and sustainable

4. Environmental Setting, Impacts, and Mitigation Measures
4.N Traffic and Circulation
Brisbane Baylands 4.N-33 ESA / 206069 Draft EIR June 2013
communities. MTC’s performance-based planning approach will also focus on measurable outcomes to help ensure that high returns are achieved on regional transportation investments.
FOCUS
FOCUS is a regional development and conservation strategy that promotes a more compact land use pattern for the Bay Area. It unites the efforts of four regional agencies into a single program that links land use and transportation by encouraging the development of complete, livable communities in areas served by transit, and promotes conservation of the region’s most significant resource lands. Through FOCUS, regional agencies will support local governments' commitment to these goals by working to direct existing and future incentives to Priority Development Areas and Priority Conservation Areas. Priority Development Areas are locally identified infill development opportunity areas near transit. Priority Conservation Areas are regionally significant open spaces for which there exists a broad consensus for long-term protection. These areas have been identified based on criteria that are consistent with the Bay Area's regional goals. FOCUS is led by ABAG and MTC, with support from BAAQMD and BCDC—in partnership with congestion management agencies, transit providers, and local governments throughout the Bay Area. It is partially funded by a Blueprint Grant from the State of California Business, Transportation, and Housing Agency.
Bay Area Air Quality Management District (BAAQMD)
BAAQMD is the regional agency with the authority to develop and enforce regulations for the control of air pollution throughout the Bay Area. The Clean Air Plan is BAAQMD’s plan for reducing the emissions of air pollutants that lead to ozone. BAAQMD has also published CEQA Guidelines for the purpose of evaluating the air quality impact of projects and plans. One of the criteria that the BAAQMD CEQA Guidelines describe is that plans, including General Plans, must demonstrate reasonable efforts to implement transportation control measures included in the Clean Air Plan that identify local governments as the implementing agencies. On-road motor vehicles are the largest source of air pollution in the Bay Area. To address the impact of vehicles, the California Clean Air Act requires air districts to adopt, implement, and enforce transportation control measures.
Local Regulations
City of Brisbane
Incorporated in 1961, the City of Brisbane has local jurisdiction over the Project Site, with the exception of the northern portion of the Recology site which is located in San Francisco. The Project Site is served by a transportation network that includes the US 101 freeway, Caltrain, and SamTrans buses. Streets proposed as part of Project Site development would be subject to City of Brisbane standards.
City of Brisbane General Plan
The Transportation Element of the City of Brisbane General Plan, adopted in 1994, details a congestion and traffic demand management program designed to minimize the negative effects of

4. Environmental Setting, Impacts, and Mitigation Measures
4.N Traffic and Circulation
Brisbane Baylands 4.N-34 ESA / 206069 Draft EIR June 2013
traffic within the city. Through roadway improvements, emphasis on multi-modal trip distribution, and land use considerations, it sets forth a comprehensive set of policies to guide development for a 20-year period. Roadway improvements that will directly affect Project Site traffic conditions include the following:
1. Geneva Avenue will be extended through the Project Site from Bayshore Boulevard to the US 101/Candlestick Point interchange. Although the precise alignment is not yet known, extension of this roadway is intended to benefit local traffic operations as well as the Project Site’s connectivity to adjacent cities and areas west of Bayshore Boulevard.
2. The new Tunnel Avenue Bridge, which is located above the railroad tracks at the northwestern edge of Brisbane Lagoon, was identified in the General Plan as needing seismic retrofitting. It has been reconstructed to meet seismic standards and widened to accommodate truck traffic, thus improving site access for emergency vehicles and relieving congestion on nearby Bayshore Boulevard, which currently acts as the City’s primary connection to US 101.
The 1994 General Plan further envisioned that a Caltrain station would be constructed near the northwestern corner of Brisbane Lagoon, adjacent to the Tunnel Avenue overpass. Construction of the Caltrain station was intended to increase central Brisbane’s connectivity to other Bay Area cities and relieve local traffic conditions. However, the proximity to the Bayshore Caltrain Station makes it unlikely that such a station will be constructed because Caltrain intends to minimize the number of train stops in order to provide faster service. In addition, while the Bayshore Station was previously located within San Francisco, the platforms were replaced within the past 5 years and now extend more than 500 feet into Brisbane, thus providing greater access to the Project Site. Provision of an additional Caltrain station is not included in Project site development.
The following policies and programs are identified in the Transportation Element of the General Plan:
Levels of Service
Policy 38: Maintain a level of service on arterial streets that allows Brisbane residents and businesses to comfortably travel across town and to gain access to US 101.
Policy 38.1: The level of service for all arterial streets within the City shall not be less than LOS “D” except for the intersections on Bayshore Boulevard at Old County Road and San Bruno Avenue, which shall not be less than LOS “C.” The two intersections having LOS “C” shall not be degraded below that level as a result of increased impacts from other intersections within the City and such impacts shall be mitigated as necessary to maintain the LOS “C” standard at the identified intersections.
North-South and East-West Corridors
Policy 39: Plan for an additional east-west corridor to redirect non-destination traffic away from Bayshore Boulevard and to provide more direct access to US 101.
Policy 39.2: Establish an alternative access route to the Tunnel Avenue overcrossing for emergency vehicles.

4. Environmental Setting, Impacts, and Mitigation Measures
4.N Traffic and Circulation
Brisbane Baylands 4.N-35 ESA / 206069 Draft EIR June 2013
Street Standards
Policy 41: Require a minimum unobstructed street width of 20 feet, as required by the Uniform Fire Code.
Policy 42: In addition to the above, develop residential and commercial City street standards that take into account the following factors as they apply to all streets, but particularly to hillside streets:
- Grade - Topography - Average lot frontage size - Number of lots and potential intensity of development - Maximum block length - Maximum length of cul-de-sac streets - Length of street in relation to number of units served - Turnarounds - Parking - Secondary access
Local Residential Streets
Policy 44: Maintain and improve local residential streets to accommodate safe access for emergency vehicles and evacuation routes for residents.
Policy 46: Develop a 10-year improvement program for improvements to existing hillside streets to include street widening, turn-arounds and the feasibility of secondary emergency access.
Policy 46.1: Post and actively enforce the 25 mile per hour (mph) maximum speed limit in Central Brisbane, investigate creating 10-15 mph speed limit zones where appropriate, and promote a public awareness campaign regarding speed limits.
Arterial Streets
Policy 47: Maintain traffic flow on arterial streets.
Truck Routes
Policy 48: Maintain truck routes to avoid impacts on residential areas.
Improvements
Policy 49: Establish standards for the improvements of existing streets and the construction of new streets to provide a high level of service.
Policy 50: In the design of internal circulation systems for new development or expansions of existing uses, provide for adequate emergency access around all buildings.
Policy 51: Utilize gas tax, sales tax and other funding sources to implement circulation improvements.
Transit
Policy 52: Seek opportunities to install and improve transit facilities and establish multi-modal connections.

4. Environmental Setting, Impacts, and Mitigation Measures
4.N Traffic and Circulation
Brisbane Baylands 4.N-36 ESA / 206069 Draft EIR June 2013
Policy 53: Encourage SamTrans to install bus turn-offs and shelters and to upgrade service levels.
Policy 54: Plan for park-and-ride facilities at the Caltrain Station and other major transit stops.
Transportation Management
Policy 55: Continue participation in sub-regional and regional transportation agencies.
Policy 56: Maintain as much on-street parking in residential Brisbane as can be accommodated safely.
Policy 57: Improve parking opportunities in the Central Brisbane business district and all other commercial areas.
Bicycle Routes
Policy 58: Provide bicycle access to all areas of the City.
Policy 59: Connect Brisbane's bikeway system to the County bikeway network.
Policy 60: Provide for the safety of bicyclists by dedicating bicycle routes where possible, by installing appropriate signing and striping, and by maintaining the pavement.
Program 60a: Install as many Class II bikeways as can safely be accommodated and are economically feasible.
Program 60b: Require new development and redevelopment to plan for and construct bicycle routes and parking facilities.
Policy 61: All new arterial streets and any existing arterials that are improved should provide for bicycle transportation.
Program 61a: As a part of the annual budget and Capital Improvement Program development, seek opportunities to upgrade existing and to install new bicycle routes.
Bicycle Facilities
Policy 62: Provide or require bicycle parking facilities at major destination points.
Program 62a: Include bicycle lockers in park-and-ride facilities.
Program 62b: Encourage business and employment centers to provide bicycle parking facilities for their employees.
Program 62c: Design bicycle facilities to meet California Department of Transportation standards.
Bicycle Education and Information
Policy 63: Provide public information on bicycle transportation.
Program 63a: Establish a public information program on bicycle transportation.
Program 63b: Establish an education program on safe bicycle use for students.
Program 63c: Make bicycle network maps available to citizens.
Program 63d: Promote bicycle use through City publications and at special events.

4. Environmental Setting, Impacts, and Mitigation Measures
4.N Traffic and Circulation
Brisbane Baylands 4.N-37 ESA / 206069 Draft EIR June 2013
Pedestrians
Policy 64: Provide safe pedestrian facilities throughout the City.
Program 64a: As part of the annual budget and Capital Improvement Program preparation, seek opportunities to upgrade and expand the system of pedestrian sidewalks, walkways and trails.
Program 64b: Study the possibility of signage on City walkways.
Policy 65: In conjunction with street improvement projects, provide facilities for pedestrians.
Program 65a: Develop safe pedestrian access in Crocker Park.
Policy 66: In conjunction with new development, provide pedestrian amenities within the project to connect with other areas of the City.
Program 66a: Consider an occasional bench along sidewalks, walkways and trails.
Policy 67: Develop and promote a traffic safety education program for the schools.
Policy 68: Continue to provide a crossing guard program.
Land Use Decisions
Policy 69: Consider potential traffic impacts and emergency evacuation in making land use decisions.
Policy 70: Establish standards and criteria for the number of trips per acre that are generated by specific land uses, and establish development capacity for vacant sub-areas in relation to the capacity of arterial streets and public transit to accommodate the trips generated by the uses.
Policy 71: For vacant sub-areas without existing infrastructure, require circulation plans and traffic impact analyses to be submitted as a part of any development application.
Policy 72: Consider the impacts of transit facilities and Transportation Management Programs in making land use decisions.
Policy 73: Actively participate in the development and implementation of the San Mateo County-wide Transportation Plan and the Congestion Management Plan (especially the land use impact part thereof) to improve circulation systems, to develop alternatives to automobile dependence for land use proposals and to assist in making transportation-sensitive land use decisions.
Policy 74: Developers and property owners who wish to build on their land where City streets do not currently exist shall dedicate right-of-way and improve the streets to City standards at their own expense.
Policy 75: Ensure access to properties in making land use decisions.
Policy 76: Ensure that all land use development applications for a primary or secondary dwelling unit have adequate and legal access which complies with City street standards. Where a building site does not front directly on a public street, legal and adequate access, which complies with City street standards, shall be provided from the public street to the building site.

4. Environmental Setting, Impacts, and Mitigation Measures
4.N Traffic and Circulation
Brisbane Baylands 4.N-38 ESA / 206069 Draft EIR June 2013
Policy 77: Discourage the establishment of new private streets, private roadways and accessways.
Policy 78: Encourage the improvement of existing private streets, private roadways and easement accessways to City standards and the dedication of the right-of-way to the City after improvements are installed.
Policy 78.1: Require exactions and develop an impact fee program for new development and improvements to property to improve and maintain substandard streets to minimum safety standards.
Policy 79: Monitor land use decisions under consideration by adjacent jurisdictions and their potential effect on Brisbane's streets. Comment through the public process in that jurisdiction and County-wide, and request mitigations as appropriate.
Policy 80: Monitor regional developments and their effects on US 101 and Bayshore Boulevard to evaluate circulation impacts. Comment through the public process and request mitigations as appropriate.
Bicycle Policies, Programs, and Funding
The Brisbane General Plan outlines six bicycle policies (described in the previous subsection). In November 2006, under Resolution No. 2006-53, the City of Brisbane adopted the San Mateo County Comprehensive Bicycle Route Plan and the City of Brisbane Addendum thereto. This qualified the City of Brisbane for bicycle transportation funds, which helped it complete the Bayshore Bikeway Class II project. Through its policies, the City seeks to promote the use of bicycles as a viable mode of transportation, encourage the inclusion of bicycle facilities at major destination points and existing and future roadways, and provide public information on bicycle transportation. In addition, the City also plans to continue seeking federal, state, and regional bicycle program funds.
Provisions for Parking, Street Design, and Transportation Demand Management
Development of the Project Site is subject to City of Brisbane General Plan and zoning code requirements with regard to minimum parking requirements and street design standards, and is also subject to Transportation Demand Management (TDM) program requirements established by C/CAG. The site’s public streets will be under the jurisdiction of the City of Brisbane, as will be the segment of the San Francisco Bay Trail that runs through the site. Existing and proposed freeway on- and off-ramps adjacent to the Project Site are under the jurisdiction of Caltrans.
City of Brisbane Municipal Code
Chapter 10.52 of the City of Brisbane Municipal Code sets forth the City’s Transportation System Management Program (TSMP). Section 10.52.060 provides that each employer within San Mateo County that is subject to the BAAQMD Regulation 13, Rule 1 (regional employer-based trip reduction rule) shall conform to the employer-based reduction requirements established and enforced by BAAQMD. Moreover, each employer of 25 or more employees shall follow the progression of current and new rules under Regulation 13 so as to be prepared to comply with new mandates that may come into effect for such employer’s worksite.

4. Environmental Setting, Impacts, and Mitigation Measures
4.N Traffic and Circulation
Brisbane Baylands 4.N-39 ESA / 206069 Draft EIR June 2013
City of Daly City
Incorporated in 1911, Daly City borders Brisbane to the west and has jurisdictional control over a portion of Geneva Avenue near the Cow Palace (east of Santos Street to Bayshore Boulevard), a portion of Bayshore Boulevard (north of Geneva Avenue to just south of Sunnydale Avenue), and the western portion of Guadalupe Canyon Parkway (where the name changes to East Market Street). Daly City is served by a transportation network that includes the US 101 and I-280 freeways, and transit service operated by SamTrans and the San Francisco Bay Area Rapid Transit District (BART).
City and County of San Francisco
The City and County of San Francisco is located immediately north of Brisbane on the northern tip of the San Francisco Peninsula and has jurisdictional control over several key transportation facilities near the Project Site, including portions of Bayshore Boulevard (north of Sunnydale Avenue) and Geneva Avenue (west of Santos Street). In addition, the San Francisco Municipal Transportation Agency operates the Muni transit system that includes T-line light rail service on the Third Street corridor that currently terminates near the Project Site at Bayshore Boulevard and Sunnydale Avenue. Long-term plans call for the T-line to be extended to the Bayshore Caltrain Station, but the precise alignment has not been determined. Additional transportation facilities serving San Francisco include the US 101, I-80, and I-280 freeways; and transit services operated by BART, SamTrans, and Caltrain. The City and County of San Francisco has published Transportation Impact Analysis Guidelines for Environmental Review that contains criteria for determining the significance of impacts on transportation facilities in San Francisco (San Francisco Planning Department, 2002).
Peninsula Joint Powers Authority
The rail right-of-way, and overcrossings, that runs through the Project Site are under the jurisdiction of the Peninsula Joint Powers Authority, the agency that manages Caltrain for the counties of Santa Clara, San Mateo, and San Francisco.
4.N.4 Impacts and Mitigation Measures
Significance Criteria
General Criteria
Based on CEQA Guidelines Appendix G, a project would cause adverse impacts related to transportation and traffic if it would:
Conflict with an applicable plan, ordinance, or policy establishing a measure of effectiveness for the performance of the circulation system, taking into account all modes of transportation including mass transit and non-motorized travel and relevant components of the circulation system, including but not limited to intersections, streets, highways and freeways, pedestrian and bicycle paths, and mass transit;

4. Environmental Setting, Impacts, and Mitigation Measures
4.N Traffic and Circulation
Brisbane Baylands 4.N-40 ESA / 206069 Draft EIR June 2013
Conflict with an applicable congestion management program, including but not limited to level-of-service standards and travel demand measures, or other standards established by the county congestion management agency for designated roads or highways;
Result in a change in air traffic patterns, including either an increase in traffic levels, obstructions to flight, or a change in location, that results in substantial safety risks;
Substantially increase hazards due to a design feature (e.g., sharp curves or dangerous intersections) or incompatible uses;
Result in inadequate emergency access; or
Conflict with adopted policies, plans, or programs regarding public transit, bikeways, or pedestrian facilities, or otherwise substantially decrease the performance or safety of such facilities.
Specific measures of effectiveness are used in this section to evaluate the performance of the circulation system in light of Project Site development. To determine whether development of the Baylands would “conflict with an applicable plan, ordinance, or policy establishing a measure of effectiveness for the performance of the circulation system,” or “conflict with adopted policies, plans, or programs regarding public transit, bikeways, or pedestrian facilities, or otherwise substantially decrease the performance or safety of such facilities,” the EIR evaluates certain Project Site development-related impacts in terms of quantitative transportation thresholds, which have been adapted from the Brisbane General Plan Transportation Element, prior City of Brisbane transportation impact analyses, the C/CAG CMP Guidelines, and the Candlestick Point-Hunters Point Shipyard EIR, based on the City’s guidance. The thresholds used in the analysis are intended to quantitatively evaluate the impacts of the four Project Site development scenarios on the circulation system consistent with the broad Appendix G criteria set forth above.
Parking Issues
CEQA does not require analysis of parking impacts. Accordingly, the parking analysis, which presents supply, forecasted demand, and planning code requirements, where addressed in this EIR, is included for informational purposes only.
A parking deficit is considered to be a social effect, rather than a physical impact on the environment. Therefore, because CEQA only requires disclosure and analysis of a project’s physical impacts, an EIR is not required to analyze parking. An EIR should, however, address any secondary physical impacts that are triggered by a social impact (CEQA Guidelines Section 15131(a)). Therefore, while the social inconvenience of a parking deficit, i.e., hunting for scarce parking spaces, is not an environmental impact, such a hunt may trigger secondary physical environmental impacts, including increased traffic congestion at intersections and the accompanying air quality, safety, and noise impacts.7 Arguably, however, the absence of a ready supply of parking spaces, combined with available alternatives to auto travel (e.g., transit service,
7 While it can be reasonably inferred that these secondary effects could result from a lack of sufficient parking
spaces, reducing parking requirements is also sometimes suggested as a means of increasing transit ridership.

4. Environmental Setting, Impacts, and Mitigation Measures
4.N Traffic and Circulation
Brisbane Baylands 4.N-41 ESA / 206069 Draft EIR June 2013
taxis, bicycles or travel by foot) and a relatively dense pattern of urban development, may induce drivers to seek and find alternative parking facilities, shift to other modes of travel, or change their overall travel habits.
Impact Assessment Methodology
This subsection presents the methodology for developing Existing (2010) plus Project and Cumulative (2030) Without Project conditions, and information considered in the travel demand and impact analysis.8 Specifically, the following are addressed:
Analysis approach, including analysis years and comparison of traffic conditions following Project Site development to Existing and to Cumulative Without Project conditions;
Cumulative Without Project transportation improvements, identifying those transportation improvements that are assumed to be in place for Cumulative Without Project conditions;
Methodology for development of traffic forecasts for Cumulative Without Project conditions;
Proposed transportation improvements assumed to be completed under Existing plus Project conditions and included in assessment of travel demand and impact analysis;
Project travel demand, including methodology and results of the travel demand forecasts for the four development scenarios; and
Transit capacity utilization analysis methodology.
Analysis Approach
The analysis of the impacts associated with development of the Project Site was conducted for two conditions: Existing (2010) and Cumulative (2030) conditions. For Existing plus Project and Cumulative With Project conditions, the analysis was conducted for each of the four Project Scenarios: Developer-Sponsored Project (DSP), Developer-Sponsored Project – Entertainment Variant (DSP-V), Community Proposed Plan (CPP), and Community Proposed Plan – Recology Expansion Variant (CPP-V). In addition to the analyses conducted for all four scenarios, a specific analysis of a special event (sold-out arena) under the DSP-V scenario was analyzed.
Travel Demand Forecasting
The Cumulative Without Project travel demand forecasts use the Candlestick Point/Hunters Point Study (CPHPS) forecasts, developed using the SFCTA CHAMP 3 Model as a part of the analysis for the Candlestick Point-Hunters Point Shipyard EIR (San Francisco Planning Department, 2009). The study intersections analyzed in the CPHPS EIR have considerable overlap with the
8 The analysis scenarios for future conditions are hereinafter named as follows: “Cumulative Without Project” for
Cumulative (2030) conditions without Project site development, and “Cumulative With Project” for Cumulative (2030) conditions with Project site development.

4. Environmental Setting, Impacts, and Mitigation Measures
4.N Traffic and Circulation
Brisbane Baylands 4.N-42 ESA / 206069 Draft EIR June 2013
Project Site study intersections due to the proximity of the two development areas. A set of forecasts consistent with this methodology were developed for this EIR by backing out the trips generated by the land uses for each of the development scenarios assumed for the CPHPS EIR and then adding in the newly calculated trips.
For the impact analysis for future conditions, substantial transportation network changes (associated with City and regional initiatives, and development of the Project Site) would occur prior to 2030, as described below. The cumulative development program assumed in these forecasts includes large projects such as CPHPS (over 10,000 housing units, 2.5 million square feet of research and development, and almost 1 million square feet of local- and regional-serving retail), Executive Park, Schlage Lock site, India Basin Shoreline, and Visitacion Valley. These projects represent at least 20 years of development.
Traffic counts used for analyzing intersection levels of service were taken in 2007. Although the counts conducted for this study were not done in December 2010 at the issuance of the revised EIR Notice of Preparation, they and the studies based on them throughout the report are still an accurate reflection of baseline conditions for the purposes of this analysis. Traffic counts taken in November 2012 confirmed that volumes in pre-recession 2007 were higher than current volumes. Thus, the use of pre-recession 2007 traffic counts in this EIR results in a more conservative analysis of Project impacts than would re-running traffic models based on post-recession 2010 or 2012 traffic counts.
Baseline
Project Site development impacts were determined by comparing existing and future conditions assuming Project Site buildout to existing and future conditions without Project site development, as follows:
1. Baseline scenario: Existing (2010) conditions were compared to Existing (2010) conditions with Project site development (“Existing plus Project”), evaluating impacts and proposing needed mitigation measures;9 and
2. Cumulative scenario: Cumulative (2030) conditions with Project site development (“Cumulative With Project”) were compared to Cumulative (2030) conditions without Project site development (“Cumulative Without Project”), providing an evaluation of cumulative impacts and the relative contribution of Project scenarios to those cumulative traffic impacts, along with needed mitigation measures.
The significance criteria presented above were applied for the analysis.
9 Mitigation measures for Existing Plus Project conditions are proposed in relation to Project Site development
impacts from baseline conditions, while mitigation measures for Cumulative With Project conditions are proposed in relation to Project Site development’s contribution to cumulative impacts.

4. Environmental Setting, Impacts, and Mitigation Measures
4.N Traffic and Circulation
Brisbane Baylands 4.N-43 ESA / 206069 Draft EIR June 2013
Cumulative Without Project Transportation Improvements
In addition to improvements proposed as part of Project Site development, as described under “Proposed Transportation Improvements” below, the analysis assumes completion of certain planned and reasonably foreseeable roadway and transit improvements in the vicinity of the Project Site by 2030 that, although not part of the project description set forth in Chapter 3 of this EIR, could affect roadway levels of service. These improvements would be completed by the City of Brisbane and the City and County of San Francisco directly or through other development project approvals.
Roadway Improvements
Roadway improvements were identified as mitigation measures in the EIRs prepared for the Bayview Hunters Point Redevelopment Plan, the Visitacion Valley Redevelopment Program, the Candlestick Point-Hunters Point Shipyard Phase II Development, and the Executive Park Development Plan. Implementation of these improvements is also identified as conditions of approval placed on the development projects by the San Francisco Planning Department and the Office of Community Investment and Infrastructure (Successor Agency to the San Francisco Redevelopment Agency, “Successor Agency”). Should these approved projects not be developed, the possibility exists that associated transportation improvements would not be constructed. However, impacts and mitigation associated with Project Site development on current transportation facilities are identified herein, and those impacts and mitigations do not rely on the future transportation improvements. In the event the nearby developments do not proceed but Project Site development does, mitigation measures would be the same as those identified in the Existing plus Project impacts and mitigation subsection of this EIR. In addition, Project Site development would still be required to meet the performance standards set forth in other mitigation measures in this EIR, even in the absence of roadway improvements anticipated to be constructed by other approved development projects in the area.
In addition, there are two regional roadway improvements (Bayshore Avenue & Sunnydale Avenue intersection improvements and Harney Way widening) currently being designed and analyzed to accommodate the travel demand associated with areawide projects in both San Francisco and San Mateo Counties. These improvements, requiring approval by the City of Brisbane, are being studied through their own CEQA environmental review process. Implementation of these regional improvements would be based on fair-share funding measures through inter-jurisdictional study and cooperation, such as the ongoing inter-jurisdictional Bi-County Transportation Study effort led by the SFCTA. Within San Francisco, the Planning Department and the Office of Community Investment and Infrastructure will require project developer fair-share contributions to these identified funding needs as a condition of development approval, or as a condition of any Owner Participation Agreement. Should these facilities not be constructed in a timely manner relative to development of the Baylands, Project Site development would still be required to meet the performance standards set forth by mitigation measures in this EIR.

4. Environmental Setting, Impacts, and Mitigation Measures
4.N Traffic and Circulation
Brisbane Baylands 4.N-44 ESA / 206069 Draft EIR June 2013
Improvements assumed in the Cumulative Without Project transportation analysis are as follows (see Figure 4.N-8):
Bayshore Boulevard & Tunnel Avenue Intersection – The Visitacion Valley Redevelopment Program called for improvements to the signal timing plan and to redistribute green time from the southbound left-turn movement to the northbound / southbound through movements.
Blanken Avenue & Tunnel Avenue Intersection – At this existing all-way stop-control intersection, the Candlestick Point-Hunters Point Shipyard Phase II Development Plan calls for restriping the northbound and southbound approaches to provide dedicated left-turn lanes adjacent to shared through/right-turn lanes. The Visitacion Valley Redevelopment Program calls for reconfiguration to signalize this intersection. In addition, the approaches to the intersection would be restriped to provide for two travel lanes for each approach. The Candlestick Point-Hunters Point Shipyard Development Project was officially approved and expected to be under fair-share funding obligations for implementation of these improvements.
Bayshore Boulevard & Blanken Avenue Intersection – The Visitacion Valley Redevelopment Program calls for restriping of the westbound approach of Blanken Avenue at Bayshore Boulevard to two lanes, thus providing for an exclusive left-turn lane and an exclusive right-turn lane.
Bayshore Avenue & Sunnydale Avenue Intersection – The Visitacion Valley Redevelopment Program calls for reconfiguration of this signalized intersection to extend the southbound left-turn pocket by 100 feet. In addition, the program calls for improvements to the signal timing plan to redistribute green time from the northbound / southbound left-turn movements to the eastbound/westbound through movements. The westbound and eastbound approaches will be restriped to provide two travel lanes: a shared left-through and an exclusive right-turn lane.
Harney Way Widening – The existing four-lane Harney Way would be widened as part of the Candlestick Point-Hunters Point Shipyard Development Plan to the north and south of its existing alignment, and would be rebuilt to contain between two and three travel lanes in each direction, turn pockets, two Bus Rapid Transit-only lanes, Class I and Class II bicycle facilities, new sidewalks, and a landscaped area.
Geneva Avenue/Harney Way Extension – Geneva Avenue, which currently ends at Bayshore Boulevard west of the Project Site, would be extended east to meet Harney Way, improving east/west access in the area. The Geneva Avenue extension would have three eastbound and three westbound travel lanes between Bayshore Boulevard and a new interchange with US 101 (see below). Currently, the nearest east/west access road is Blanken Avenue, which is designed as a neighborhood collector roadway and could not accommodate the additional east/west traffic generated by area projects. The lead agency for this project is the City of Brisbane.
New US 101 Interchange at Geneva Avenue/Harney Way – In conjunction with the extension of Geneva Avenue (see above), the existing Harney Way interchange is proposed to be redesigned as a diamond interchange, subject to review and approval by Caltrans. Caltrans and the City of Brisbane are the lead agencies for this project. Two alternatives are currently being assessed; one with Geneva Avenue/Harney Way crossing under US 101, and the other with Geneva Avenue/Harney Way crossing over US 101.

SanFrancisco
Bay
IceHouse
Hill
Brisbane
Lagoon
Beatty AveCandlestick Point/U.S. 101 InterchangeImprovements
Geneva Ave Extentsion*
Sierra Point/U.S. 101 InterchangeImprovements
Tu
nn
el Ave
Lagoon Way
Valley Dr
Old
Cou
nty
Rd
KinderMorganEnergyTank Farm
KinderMorganEnergyTank Farm
Bay
shor
e B
lvd
Geneva Ave
Sunnydale Ave
Blanken Ave
U.S
. 101S
ierra Poin
t Pkw
y
San Francisco City and CountySan Mateo County
San Francisco City and CountySan Mateo County
Guadalupe Canyon Pkw
y
Brisbane Baylands . 206069Figure 4.N-8
Assumed Roadway and Interchange ImprovementsSOURCE: Wallace Roberts & Todd, LLC, 2010; Bi-County Study Partner Agencies, 2012; ESA, 2012
0 1000
Feet
Project Site
Not a Part of Proposed Project
* DSP/DSP-V Geneva Ave Extension shown; CPPP/CPP-V alignment shown on Figure 4.N-13
Improvements Assumed in Cumulative 2030 Transportation Analysis
A U.S. 101 Interchange / Geneva Avenue / Harney Way
B Bayshore Boulevard / Blanken Avenue Intersection
C Bayshore Avenue / Sunnydale Avenue Intersection
D Harney Way Widening
E Geneva Avenue Extension / Harney Way Extension
F Blanken Avenue / Tunnel Avenue Intersection
A E
D
B F
C
4.N-45

4. Environmental Setting, Impacts, and Mitigation Measures
4.N Traffic and Circulation
Brisbane Baylands 4.N-46 ESA / 206069 Draft EIR June 2013
At the time of publication of the Brisbane Baylands Draft EIR, the Geneva Avenue/Harney Way crossing of US 101 was proposed to have six eastbound lanes (three left-turn lanes and three through lanes) and six westbound lanes (three left-turn lanes and three through lanes) for a total of 12 lanes. The intersections of the northbound and southbound ramps with Geneva Avenue/Harney Way would be signalized. For both alternatives, a new bypass to the existing northbound Third Street off-ramp would be constructed with the extension, diverting traffic on the existing off-ramp from the northbound mainline and improving conditions at the weave section where the new proposed northbound on-ramp from Harney Way would join the mainline traffic.
Transit Improvements
Transit improvement projects within or near the Project Site assumed in the Cumulative Without Project transportation analysis include:
T-Third Line Extension: Proposed extension of the T-Third line from the Sunnydale Station to provide a direct connection to Caltrain at the Bayshore Station.
Geneva Avenue Bus Rapid Transit (BRT): Proposed transit service between the Balboa Park BART Station and Hunters Point Shipyard via Geneva Avenue and the Bayshore Intermodal Station. This proposed physical improvement is not yet funded, and capital costs (for bus acquisition) and operational funds have not been secured at this time, but they would include contributions from adjacent development projects (particularly segments to be implemented with planned redevelopment of the CPHPS site).
Bayshore Intermodal Station Access Study Improvements: Proposed reconfiguration of the Bayshore Caltrain Station to accommodate the proposed BRT. Two intermodal station redesign alternatives are described as “feasible alternatives” in the Bayshore Intermodal Station Access Study (San Francisco County Transportation Authority, 2012) to accommodate the proposed extension of the Muni T-line light-rail line from its current terminus at the Sunnydale Station to serve the Bayshore Caltrain Station. These proposed improvements would cost an estimated $200 million to $300 million and are not yet funded. The two feasible alternatives (identified for further consideration) are:
- Alternative 1: Move Caltrain platform 150 feet south, with elevated BRT via Beatty Street to accommodate intermodal transfers (see Figure 4.N-9).
- Alternative 2: Move Caltrain platform 300 feet south, with elevated BRT via the proposed Geneva Avenue overpass (see (see Figure 4.N-10).
Improvements Described in the Candlestick Point-Hunters Point Shipyard EIR: Planned and/or proposed service improvements in the vicinity of the Project Site (see Figure 4.N-11), although none beyond those described above would directly serve the Project Site.
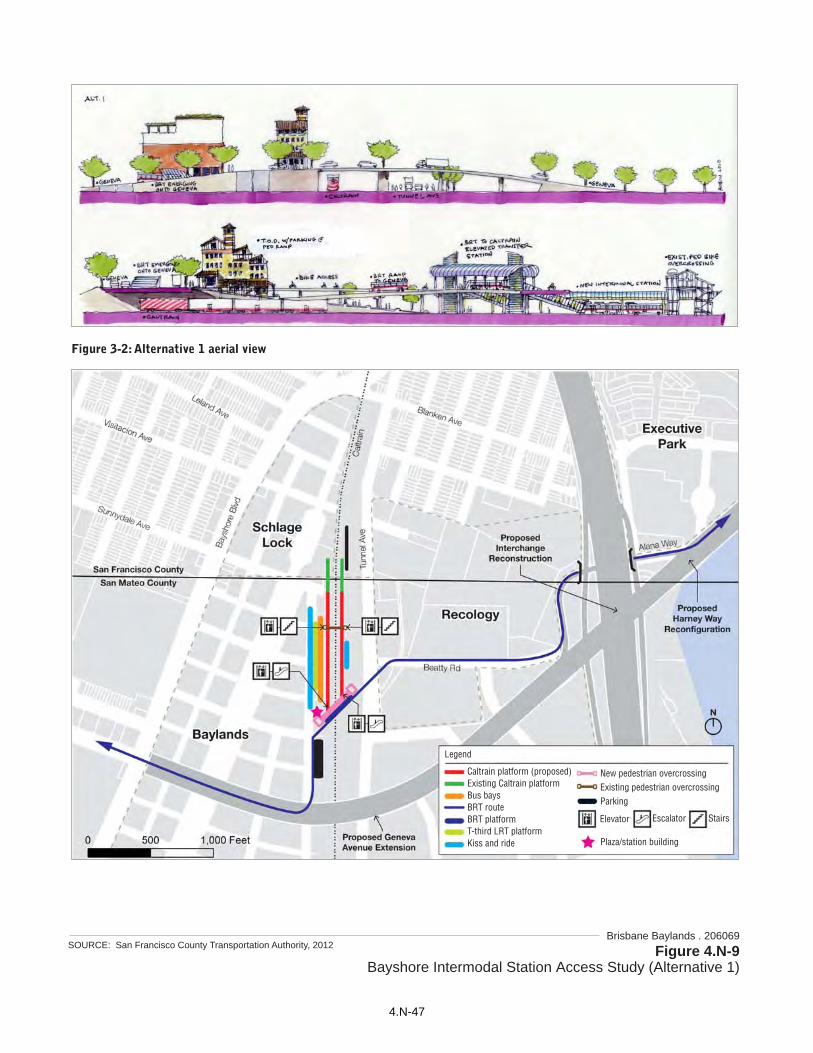
CHAPTER THREEBrisbane Baylands . 206069
Figure 4.N-9Bayshore Intermodal Station Access Study (Alternative 1)
SOURCE: San Francisco County Transportation Authority, 2012
Caltrain platform (proposed)Existing Caltrain platformBus baysBRT routeBRT platformT-third LRT platformKiss and ride
New pedestrian overcrossingExisting pedestrian overcrossingParking
Elevator Escalator Stairs
Plaza/station building
Legend
4.N-47

CHAPTER THREE Brisbane Baylands . 206069Figure 4.N-10
Bayshore Intermodal Station Access Study (Alternative 2)SOURCE: San Francisco County Transportation Authority, 2012
Caltrain platform (proposed)Existing Caltrain platformBus baysBRT routeBRT platformT-third LRT platformKiss and ride
Existing pedestrian overcrossingPlaza/Pedestrian connectionParking
Elevator Ramp Stairs
Plaza/station building
Legend
4.N-48

280
101
280
PAUL
INNES
AV
BAYSHORE
BLVD HA
RNEY
WAYALANA
WY
SOUTHBASIN
INDIA BASIN
ISLAIS CREEK CHANNEL
BAYSHORE
BLVD
ST
GILMAN
CRISP
3RD
AV
INGERSON
AV
GRIFFITH
PALOU
CARGOWAY
EVANSAV
HUNTERSPO
INTBLVD
AV
SILVER
STOAKDALE
26THST
CESAR CHAVEZ
PENNSYLVANIA
AV
TSANAI DNI
25TH
(ARMY)
ST
3RD
ST
EVANS IL
LINOIS
ST
ST
AV
AV
AMADOR ST
JENN
INGS
ST
DRTN
I OP
ELDD
IM
HUDSONAV
AV
AVAV
SPEAR
ST
AV
CARROLL
INGA
LLS
ST
AV
WY
ALA
NA
EXECUTIVE PARK
BLANKENAV
AVBEATTY
AV
INDUSTRIA
L
JERROLD
AVST
PHELPS
SILVER
AV
BAYSHO
RE
BLVD
22ND STCALTRAINSTATION
MINNESOTA
MISSISS
IPPI
TEXA
S
MISSO
URI
CONNEC
TICU
T
ARK
ANSA
SWISCO
NSIN
CARO
LINA
DEHARO
RHODEISL
AND
POTR
ERO
BRYA
NT
FOLSOM
NESS
VAN
SOUTH
HARR
ISON
24THST
PRECITA AV
BERNAL HEIGHTS BLVD
CORTLAND AV
ST
BACON
SANBRU
NO
DWIGHT
ST
MANSELL
ST
ARLETARAYMONDLELAND
AV
AV
AV
AV
AV
VISITACION
GENEVA AV
BURKE AV
CUSTERDAVIDSON
RANKIN
QUINTST
AV
AV
STGALVEZ AV
FAIRFAX
AVINNESKIRKWOODLA SALLEMcKINNONNEWCOMB
AVAV
AV
AV
ARMSTRONG
QUESADA
REVERESHAFTERTHOMASUNDERWOODVANDYKEWALLACEYOSEMITE
BANCROFT
DONNER
EGBERT
FITZGERALD
HOLLISTERJAMESTOWN
JENN
INGS
HAWES
ST
STKEITH
ST
LANE
ST
AV
AV
AVAV
AVAV
AV
AV
AVAV
AV
AV
AV
AV
AV
CASHMERE ST
LA
SALLE
AV
MENDELL
ST
NEWHA
LL
ST
QUINT
ST
ST
NAPOLE
ON
TOLAND
ST
UPTONST
STMARIN
20TH STSH
OTW
ELL
TREA
T
ALA
BAMA
FLORIDA
YORK
HAMPS
HIRE
PERALT
AAV
RIPLEY ST
BARN
EVELD
AV
LOOMIS
ST
BRIDGEVIEW
DR
THORNTON AV
AV
TOPEKA
AV
WILLIAMS
AV
CARROLL
ST
NEW
HAL
L
KEY
AV
AV
CONTE
LE
ALEMA
NYBLV
D
JARBOE ST
TOMPKINS AV
AVOGDEN
AVCRESCENT
ST
SWEENY
ST
SILLIMAN ST
FELTON
ST
BURROWS
ST
WAYLAND
WOOLSEY
ST
SCHWERIN
ST
ST
RUTLAN
D
GIRARD
ST
BRUSSELS
GOETTN
GEN
STST
SUNNYDALE
JAMESTOW
NAV
To SunsetDistrict
48
48
48
23
23
44
44
24
24
24
54
54
54
54
23
48
T
T
T
GenevaBRT / TPSto BalboaPark BART
To Castro &
To SunsetDistrict
To RichmondDistrict
To SunsetDistrict
To Downtown &J,K,L,M,N Light Rail Lines
Palou AvenueTransit PriorityTreatment
PALOUAV
HarneyBRT
Candlestick PointBRT Stops
Hunters PointShipyardTransit Center
Harney BRT
NewDowntownExpress BusRoute
BayshoreTransitCenter
HuntersPointShipyardBRT Stops
TRANSIT CEN
TER
Palou AvenueTransit PreferentialTreatment
29
29
29
29
101
54
BF
D
D
C
E
G
A
OakdaleCaltrainStation
City and County of San FranciscoSan Mateo County
LEGEND
Bus Rapid Transit
Existing Light RailT
New / Modified MUNIBus Routes in MixedFlow Lanes
Downtown Express Bus
Proposed Transit Stop
A
PROPOSED TRANSIT IMPROVEMENTS
Brisbane Baylands . 206069Figure 4.N-11
Long Term CPHPS Transit Service (Planned)SOURCE: Fehr and Peers, 2012
0 2000
Feet
4.N-49

4. Environmental Setting, Impacts, and Mitigation Measures
4.N Traffic and Circulation
Brisbane Baylands 4.N-50 ESA / 206069 Draft EIR June 2013
Bicycle Improvements
Brisbane has six bicycle policies outlined in its General Plan. These policies are general goals rather than specific projects. The San Mateo County CBPP outlines the following improvements in Brisbane and Daly City within the vicinity of the Project Site:
Class II bicycle lanes in both directions of travel along Geneva Avenue west of Bayshore Boulevard. The Geneva Avenue extension would continue these bicycle lanes to the US 101 interchange.
Class II bicycle lanes in both directions of travel along Old County Road and Visitacion Avenue west of Bayshore Boulevard providing access to Central Brisbane.
Class III bicycle route along San Bruno Avenue between Visitacion Avenue and Bayshore Boulevard.
Other Project Site-adjacent bicycle facilities improvements to be constructed by the City and County of San Francisco (as identified in the San Francisco Bicycle Plan) or through project mitigation proposed by the CPHPS project include the following:
CPHPS Project: The CPHPS project includes construction of the regionally adopted Bay Trail in the southeastern portion of San Francisco and incorporation of the Blue Greenway, a network of enhanced pedestrian and bicycle links through the eastern portion of San Francisco to the waterfront. Trail improvements include a pedestrian and bicycle trail along the shoreline with connections to the existing and new parks, from the western boundary of Candlestick Point near the Harney Way/US 101 interchange, through the State Recreation Area, Yosemite Slough, and Hunters Point Shipyard shoreline to India Basin.
San Francisco Bicycle Plan Project 5-5 (near-term): Cesar Chavez Bicycle Lanes will involve the installation of Class II bicycle lanes in both directions on Bicycle Route #25 on Cesar Chavez Street between Kansas Street (near US 101) and Mississippi Street (near I-280). To accommodate the bicycle lanes, one of the two eastbound travel lanes will be removed.
San Francisco Bicycle Plan Project 5-13 (near-term): San Bruno Bicycle Lanes will involve the installation of Class II bicycle lanes in both directions on Bicycle Route #25 on San Bruno Avenue between Silver Avenue and Paul Avenue. To accommodate the bicycle lanes, on-street parking would need to be removed in the segment between Silliman Street and Silver Avenue.
Cumulative Without Project Traffic Forecasts
Cumulative Without Project conditions were developed via a two-step process that used (1) the SFCTA travel demand model (SF-CHAMP) to determine background traffic growth on roadways in the vicinity of the Project Site, and (2) traffic volume overlays to reflect traffic volume turning movements associated with nearby developments that are not fully reflected in the SF-CHAMP model output.

4. Environmental Setting, Impacts, and Mitigation Measures
4.N Traffic and Circulation
Brisbane Baylands 4.N-51 ESA / 206069 Draft EIR June 2013
SF-CHAMP Model Growth Projections
Forecasts of Cumulative Without Project traffic volumes were estimated based on cumulative development and growth identified by the SF-CHAMP travel demand model. The SF-CHAMP model is an activity-based travel demand model that has been “validated” to existing conditions, meaning that the model’s predicted travel volumes and patterns match observed travel volumes and patterns within a specified tolerance for the base year. The SF-CHAMP model is updated regularly and is designed to include traffic volumes and patterns at the southern periphery of the San Francisco. It can thus be used to forecast future transportation conditions in and around San Francisco, including in Brisbane. The model predicts daily person-trips based on assumptions of growth in population, housing units, and employment from Association of Bay Area Governments (ABAG), which are then allocated to different periods of time throughout the day using time-of-day sub-models. The SF-CHAMP model predicts future person-trips by mode for auto, transit, pedestrian, and bicycle trips. The SF-CHAMP model also provides forecasts of vehicular traffic on regional freeways, major arterials, and local roadway networks, and considers available roadway capacity, origin-destination demand, and congested travel speeds when assigning the future travel demand.
The SF-CHAMP model divides San Francisco into approximately 981 geographic areas, known as Traffic Analysis Zones (TAZs). The SF-CHAMP model also includes zones outside of the San Francisco, such as Brisbane, for which data are obtained through the current Metropolitan Transportation Commission (MTC) model. For each TAZ, the SF-CHAMP model estimates the travel demand based on TAZ population and employment growth assumptions for 2030 developed by ABAG,10 determines the origin and destination and travel mode (i.e., auto, transit, walk and bicycle) for each trip, and then assigns those trips to the transportation system (roadway network and transit lines). The SF-CHAMP output is developed based on weekday daily and 3-hour AM and PM peak periods. The ABAG land use and socioeconomic database and growth forecasts provide forecasts of economic and population growth for San Francisco, as well as for the remaining eight Bay Area counties. Within San Francisco, the San Francisco Planning Department is responsible for allocating ABAG’s countywide growth forecast to each SFCTA Model TAZ, based upon existing zoning and approved plans, using an area’s potential zoning capacity and the anticipated extent of redevelopment of existing uses.
The increase in vehicle trips between Existing Conditions and Cumulative Without Project conditions was based on a comparison between model output that represents baseline conditions and model output for future year 2030 conditions.
Local Development Traffic and Transit Overlays
In the Project Site vicinity, several development proposals have recently been approved or are in environmental review. While these projects had been included as part of the growth projections in the SF-CHAMP model, to account for the localized effects of traffic and transit demand, the trip
10 The ABAG growth assumptions are presented in ABAG’s “Projections” series, and the SF-CHAMP model used for
this analysis used ABAG’s Projections 2007. Although not the most recent estimates, ABAG’s 2007 projections still provide accurate forecasts for the purposes of this analysis, as they align with the 2007 baseline counts conducted for the study.

4. Environmental Setting, Impacts, and Mitigation Measures
4.N Traffic and Circulation
Brisbane Baylands 4.N-52 ESA / 206069 Draft EIR June 2013
generation associated with those projects was extracted from the SF-CHAMP model output and replaced by more detailed travel demand estimates used in the environmental review of these projects, which include:
Visitacion Valley Redevelopment Program (residential, commercial, community-serving cultural/institutional/educational space, and infill development along Bayshore Boulevard and along Leland Avenue);
Executive Park Development Plan (conversion of office space to residential, neighborhood-serving commercial, and subsurface parking);
Candlestick Point/Hunters Point Shipyard (residential, regional-serving commercial, office, and arena);
Hunters Point Shipyard Phase I and II (residential, neighborhood-serving commercial, office, hotel, and stadium);
India Basin Shoreline (residential, neighborhood-serving commercial, office, and hotel); and
Daly City Cow Palace (residential, community-serving commercial, office, and research and development/industrial).
To make travel demand associated with these approved projects consistent with that included in the previous EIRs, travel demand and vehicle assignments were obtained from technical analyses conducted for the EIRs for these projects. Trip generation associated with Project site development that had been estimated in those EIRs was extracted from the adopted cumulative forecasts.
Proposed Transportation Improvements
The transportation improvements described in this subsection are included in the February 2011 Draft Brisbane Baylands Specific Plan (“Specific Plan”), which proposes the DSP and DSP-V development scenarios. Because the Concept Plans for the CPP and CPP-V scenarios focus on land use and do not provide the detailed roadway and infrastructure planning that is required for a specific plan, analysis of transportation impacts for the CPP and CPP-V scenarios uses the roadway configurations shown on the CPP and CPP-V conceptual plans as the starting point for analysis, based on the assumption that certain basic roadway and transit improvements would be the same for all four development scenarios. This assumption is reasonable, as the only substantive difference in the roadway improvements between DSP/DSP-V and CPP/CPP-V scenarios is that the frontage road would not continue to provide access to Geneva Avenue under the CPP/CPP-V scenarios. As a result, this frontage road was not assumed in the CPP and CPP-V scenarios.
Roadway Improvements
The majority of roadways internal to the Project Site would be new and would follow the City of Brisbane’s street design standards, as well as the Caltrans and American Association of State Highway and Transportation Officials Design Manuals. The City standards reflect typical

4. Environmental Setting, Impacts, and Mitigation Measures
4.N Traffic and Circulation
Brisbane Baylands 4.N-53 ESA / 206069 Draft EIR June 2013
roadway speeds of approximately 25 miles per hour on local and collector streets and 35 miles per hour or higher on arterial roads, such as Geneva Avenue. Bulb-outs are included at intersections within streets in all locations where on-street parking is included. All roads would include on-street parking except for Tunnel Avenue, Sierra Point Parkway, and the 70-foot-wide residential area streets where the Muni light rail transit (LRT) operates and ground-floor retail is not proposed (DSP and DSP-V scenarios). Figure 4.N-12 shows the proposed roadway system for the DSP and DSP-V development scenarios.
Figures 4.N-13 and 4.N-14 show the conceptual roadway system used to analyze traffic impacts for the CPP and CPP-V development scenarios, respectively. For the traffic impact analysis, the roadway network for each scenario was assumed in distribution and assignment of Project trips. Roadways internal to the Project Site and new intersections with the external circulation system were not analyzed due to the inability to compare Project conditions to non-Project conditions.
For existing roadways internal to the Project Site, the following improvements would be made for all four development scenarios, except as noted:
A frontage road named “Sierra Point Parkway” would be constructed along the eastern edge of the Project Site, extending the existing Sierra Point Parkway northward to link with Geneva Avenue (DSP and DSP-V scenarios only).
Beatty Road access would be maintained and would provide a linkage to Tunnel Avenue (DSP, DSP-V, and CPP scenarios only). Under the CPP-V scenario, Beatty Road would be closed to make room for the Recology expansion.
A realigned Tunnel Avenue would terminate at a “T” intersection with Lagoon Way after connecting with streets in the East Geneva and Visitacion Green districts. Primary access to these districts, however, would be from the extended Sierra Point Parkway rather than Tunnel Avenue.
Tunnel Avenue would provide access to the Visitacion Valley and Little Hollywood neighborhoods in San Francisco as well as the neighborhoods along Geneva Avenue. Access to and from Central Brisbane would primarily be from Lagoon Way, with its intersection at Tunnel Avenue reconfigured to provide a through way from Old County Road to US 101. Roadway improvements would continue to permit the safe movement of tanker trucks between the Kinder Morgan Energy Tank Farm and US 101.
Transit Improvements
Proposed Transit Facilities
Development of the Project Site would rely upon a number of transit improvements being implemented by regional transit agencies that would enhance existing and proposed transit services operating within, or adjacent to, the Project Site. Figure 4.N-15 and Figure 4.N-16 illustrate the proposed transit improvements that would complement Project Site development under the DSP/DSP-V and CPP/CPP-V scenarios, respectively.

Valley Drive
Sierra P
oint Pkw
y
0 1000
Feet
Guadalupe C
anyon Pkw
y
Main Street
Geneva Ave
Sunnydale Ave
Shw
erin
Str
eet
Tunnel Ave
San Francisco City and County
San Mateo County
Brisbane Lagoon
San Francisco
Bay
Executive Park
Bayshore Boulevard
U.S
. 101
Bays
hore
Bou
leva
rd
Creek Parkway
Tun
nel A
venu
e
Icehouse
Hill
Sierra Point Parkw
ay
R St.
S St.
Q St.
P St.
O St.
Geneva Ave.
M St.
L St.
2nd St.
G St.
E St.
Roundhouse Arc
D St. (West) D St. (East)
G St
E St.
C St.
B St.
.tS ht 5. t S ht 5
3rd
St
6th St.
7th St.8th St
M St.
N St.
J St.
H St.
F St.
K St.
Roun
dhouse Circle
4th
St.
A St.
2nd
St. (
Wes
t)
1st S
t.
(J St.)
P St.8th St.
L St.
7th St. (East)
7th St. (West)
I St
E St.
G St.
2nd
St. (
East
) Beatty Ave
Lagoon Way
74’ Lagoon Way
80’ Connector
64’ R&D Area without Curbs
66’ Office Area
56’ R&D Area - Quad
88’ Retail Main Street
107’ Office Area
87’ Sierra Point Parkway
64’ Tunnel Avenue
70’ Creek Park Way
74’ Roundhouse Circle
40’ Residential Area
56’ Residential - Promenade
78’ Residential - Promenade
64’ Residential - Townhomes
68’ Residential - Flats
68’ Residential - Townhomes
Geneva Avenue
64’ R&D Area without Curbs (Potential)
70’ Residential Flats (MUNI)
78’ Neighborhood Retail Street (MUNI)
Sunnydale Avenue (per SF Standards)
Project Site
Not a Part of Proposed Project
Existing Caltrain
KinderMorganEnergyTank Farm
KinderMorganEnergyTank Farm
Brisbane Baylands . 206069Figure 4.N-12
DSP/DSP-V Project Site Road Network ImprovementsSOURCE: UPC, 2011
CalTrainBayshoreStation
4.N-54
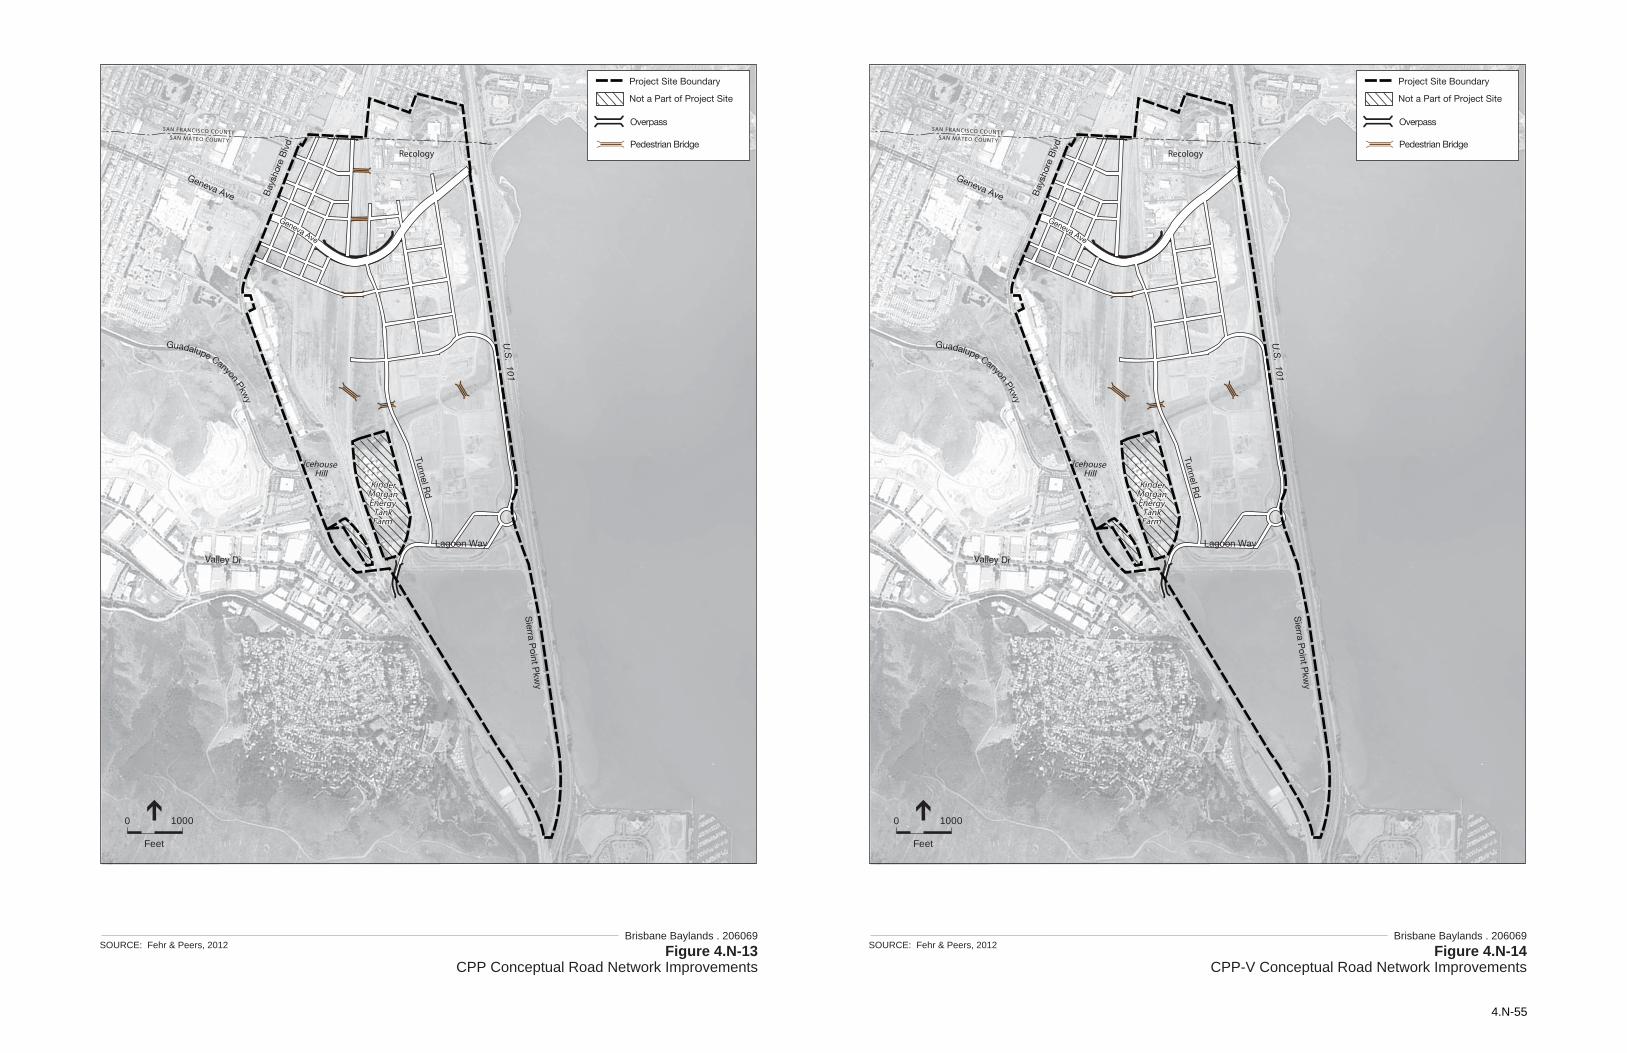
SAN FRANCISCO COUNTYSAN MATEO COUNTY
IcehouseHill
Recology
SAN FRANCISCO COUNTYSAN MATEO COUNTY
IcehouseHill
Recology
Overpass
Pedestrian Bridge
Project Site Boundary
Not a Part of Project Site
Overpass
Pedestrian Bridge
Project Site Boundary
Not a Part of Project Site
Brisbane Baylands . 206069Figure 4.N-13
CPP Conceptual Road Network ImprovementsSOURCE: Fehr & Peers, 2012
KinderMorganEnergy
TankFarm
KinderMorganEnergy
TankFarm
0 1000
Feet
Brisbane Baylands . 206069Figure 4.N-14
CPP-V Conceptual Road Network ImprovementsSOURCE: Fehr & Peers, 2012
KinderMorganEnergy
TankFarm
KinderMorganEnergy
TankFarm
0 1000
Feet
Lagoon Way
Valley Dr
Bay
shor
e B
lvd
Geneva Ave
U.S
. 101
Tunnel Rd
Guadalupe Canyon Pkwy
Sierra P
oint Pkw
y
Geneva Ave
Lagoon Way
Valley Dr
Bay
shor
e B
lvd
Geneva Ave
U.S
. 101
Tunnel Rd
Guadalupe Canyon Pkwy
Sierra P
oint Pkw
y
Geneva Ave
4.N-55

This page intentionally left blank

DRAFT SPECIFIC PLAN February 2011
Brisbane Baylands Speci�c Plan 6. Circulation176
397
292
292
9AX
T
9AX
397
T
San FranciscoSan Mateo County
BRISBANE LAGOON
To Hunter’s Point Shipyardand Candlestick Park
To Balboa Park
Intermodal Station
PlatformCaltrain
1/4 Mile
1/2 Mile
*
*
U.S. 101
Bays
hore
Bou
leva
rd
Bayshore Boulevard
Sunnydale Ave
P St.
.tS ht5
7th St.Roun
dhouse Circle
(J St.)
2nd
St. (
East
)
2nd
St.
Roundhouse
Lagoon Way
Tunnel Avenue
Sierra Poin
t Parkway
Guadalupe Canyon Pkw
ay.Valley Dr.
Main St.
Geneva Avenue
Icehouse Hill
SamTrans Proposed
MUNI Rail Proposed
MUNI Existing
Caltrain & Freight
BRT Proposed
SamTrans Existing
Transit Route Number
Transit Connector Corridor
xx xx
Project Site Boundary
Not a Part of Project Site
KinderMorganEnergyTank Farm
KinderMorganEnergyTank Farm
Brisbane Baylands . 206069Figure 4.N-15
DSP/DSP-V Proposed Transit CirculationSOURCE: Wallace Roberts & Todd, 2011; Universal Paragon Corporation, 2011
0 1200
Feet
4.N-57

CALTRAIN
SAN FRANCISCO COUNTYSAN MATEO COUNTY
Vis i tac ion Creek
L a g o o n
IcehouseHill
Recology
SamTrans Proposed
MUNI Rail Proposed
MUNI Existing
Caltrain & Freight Existing
BRT Proposed
SamTrans Existing
Transit Route Number
Overpass
Pedestrian Bridge
xx xx
Project Site Boundary
Not a Part of Project Site
Multi-Modal Transit Hub
Brisbane Baylands . 206069Figure 4.N-16
CPP/CPP-V Proposed Transit CirculationSOURCE: Dyett & Bhatia, 2008; Fehr and Peers, 2012
KinderMorganEnergy
TankFarm
KinderMorganEnergy
TankFarm
0 1200
Feet
397
292
Lagoon Way
Valley Dr
Bay
shor
e B
lvd
Geneva Ave
U.S
. 101
Tunnel Rd
Guadalupe Canyon Pkwy
Sierra P
oint Pkw
y
Potential Areafor Transit Hub
4.N-58

4. Environmental Setting, Impacts, and Mitigation Measures
4.N Traffic and Circulation
Brisbane Baylands 4.N-59 ESA / 206069 Draft EIR June 2013
Transit circulation features would include the following:
Transit services would be focused at the Bayshore Caltrain Station, located at the north end of the Project Site bordering San Francisco, and would be connected with other portions of the Project Site via Tunnel Avenue. The Bayshore Station would be upgraded to serve as an inter-modal transit hub to accommodate more frequent Caltrain service and allow convenient transfers between Caltrain, the proposed bus rapid transit on the Geneva Avenue corridor between the Balboa Park BART Station and Hunters Point Shipyard, the proposed new southern terminus of the Muni T-Third light rail line, and other Muni and San Mateo County Transit District (SamTrans) bus routes that could use the multi-modal transit hub.
In addition, transit services would be available from the Sunnydale Muni Station, located at Bayshore Boulevard and Sunnydale Avenue approximately 1,000 feet west of the Bayshore Station. The Sunnydale Muni Station serves the Muni T-Line and Muni bus routes 8X, 8BX, 9 and 9L.
The Geneva Avenue extension design would reserve a right-of-way to accommodate long-term planned Muni BRT service.
Funding for the proposed transit facilities has not been secured, and is subject to negotiation, but has been proposed to include a “Bi-County” funding agreement between the two counties (San Francisco and San Mateo) and neighboring cities (Brisbane, Daly City, and San Francisco).
Additional transit and related improvements that may become elements of a Transportation Demand Management program but are not currently contemplated in existing transportation studies and plans may be developed in the future, depending on future demand and funding availability. Examples of transit and related improvements that could be implemented include shuttle bus service connecting the Project Site with key employment centers and transit stops, creation of a transit center within the Project Site that would enable efficient and convenient transfers among Caltrain/SamTrans buses/Muni LRT and buses and for attended bicycle parking, and the inclusion of major BRT stops within the Project Site that include information kiosks and real-time transit updates. Other potential improvements are described under “Transportation Demand Management (TDM) Program” below.
The effectiveness of these potential additional improvements cannot be determined due to the lack of information on their locations, service capacities, and planning horizons as well as uncertainty related to implementation by other agencies. Therefore, additional transit and related improvements that would be considered speculative are not considered in this document.
Proximity of Proposed Land Uses to Transit Facilities
Convenient transit access is frequently defined based on provision of transit services within a walking distance of up to one-third mile from a transit stop. Specifically:
Ridership studies at other Caltrain stations found higher rates of Caltrain ridership where employment sites are provided within one-third mile of a Caltrain station (with rates of Caltrain ridership found to be three times higher than the rate of Caltrain ridership for employment sites located more than one-half mile from the station).

4. Environmental Setting, Impacts, and Mitigation Measures
4.N Traffic and Circulation
Brisbane Baylands 4.N-60 ESA / 206069 Draft EIR June 2013
Employment sites located from one-third to one-half mile from a Caltrain station were found to have rates of Caltrain ridership roughly 40 percent lower than those land uses located within one-third mile of a Caltrain station.
Given the location of the key transit facilities at the north end of the site, the land use plans for each Project scenario cluster a significant portion of proposed development near proposed transit facilities, as follows:
Proposed land uses north of Geneva Avenue would be within one-third mile of the Bayshore Station (existing Caltrain and proposed intermodal station) and Sunnydale Muni Station, as well as the proposed Geneva Avenue BRT.
Proposed land uses south and southeast of Geneva Avenue would be within one-third mile of the proposed Geneva BRT. However, those land uses, south of Geneva Avenue, would be farther than one-third mile from the Caltrain and T-line stations. Therefore, a lower rate of transit use is likely for those sites south of Geneva Avenue.
Proposed land uses in the southern half of the Project Site would be more than one-half mile from the Bayshore intermodal station.
Proposed Transit Access
Each of the Project site development scenarios proposes a network of pedestrian and bicycle paths across the Project Site. Pedestrian circulation would include sidewalks or single- or multi-use paths adjacent to roadways within the Project Site. Development of the Project Site also would establish streetscape standards and guidelines to ensure the provision of these facilities (e.g., by providing for continuous sidewalks along streets and enhanced pedestrian crossings at key intersections). Enhanced pedestrian street crossings within the Project Site would include elements that provide traffic calming effects and reduced distances at pedestrian crossings.
Each of the scenarios includes at least one pedestrian overcrossing over the Caltrain right-of-way and Tunnel Avenue to minimize lengthy internal travel distances for pedestrians and bicyclists.
Bicycle Circulation Improvements
The Transportation and Circulation Element of the Brisbane General Plan (1994) outlines policies and programs aimed toward diversifying the City’s transportation network and establishing maximum land use intensities given each roadway’s capacity (see Subsection 4.N.3, Regulatory Setting, for bicycle-related policies and programs).
The bicycle circulation plan component of the DSP and DSP-V development scenarios includes a comprehensive system of on- and off-street bicycle routes. Through a combination of east-west and north-south on-street bicycle lanes and off-street multiuse paths, bicyclists would have access to any part of the Project Site, including open space and natural resources. Because the same level of detail is not available for the CPP and CPP-V scenarios, and based on the intent of the CPP and CPP-V development scenarios to provide similar or better opportunities for alternative transportation modes as the DSP and DSP-V scenarios, it was assumed that the bicycle network would be the same for all four development scenarios.

4. Environmental Setting, Impacts, and Mitigation Measures
4.N Traffic and Circulation
Brisbane Baylands 4.N-61 ESA / 206069 Draft EIR June 2013
The DSP and DSP-V development scenarios would provide for the following bicycle circulation system improvements (shown in Figure 4.N-17) within the Project Site:
Class I (off-street) single- or multi-use paths on the west side of Sierra Point Parkway between the existing on-street Bay Trail terminus and the existing Sierra Point Parkway southbound ramp to N Street and on the east side of Tunnel Avenue from Lagoon Way to the boundary of the Project Site (just south of Beatty Road)
Class II (on-street) bicycle lanes in both directions on both sides of N Street and 8th Street between Sierra Point Parkway and Beatty Road to the existing unimproved Bay Trail terminus at Alana Way, on the Geneva Avenue extension from Bayshore Boulevard to 8th Street, on P Street (neighborhood retail street), on 7th Street (main retail street), on 5th Street between P Street and Sunnydale Avenue, on 2nd Street and Roundhouse Circle, on Creek Parkway, on Lagoon Way, and on Tunnel Avenue
Consistent with the Brisbane General Plan and the San Mateo County Bicycle and Pedestrian Plan, the DSP and DSP-V development scenarios would provide a comprehensive circulation system designed to accommodates multiple travel modes. In addition to the motor vehicle, transit, and pedestrian network, a bicycle circulation system would enhance the planned roadway network and connect land uses within the development. The DSP and DSP-V development scenarios’ bicycle network would connect the Project Site with local and regional pedestrian networks, most notably the San Francisco Bay Trail.
Class II bicycle facilities (bike lanes) or multiuse paths would be provided adjacent to most of the Project Site’s roadways, creating a comprehensive network of on- and off-street bicycle facilities that would connect bicyclists with every destination point in the Project Site. In addition, a segment of the San Francisco Bay Trail would be constructed adjacent to Frontage Road, connecting the Bay Trail terminus at Sierra Point Parkway/US 101 Southbound Ramps with the terminus at Alana Road/Beatty Road. This segment of the Bay Trail would be a 12-foot-wide multiuse path with landscaping and would be buffered from the roadway by an 8-foot-wide landscaped bioswale.
Table 4.N-7 below summarizes the DSP and DSP-V scenarios’ proposed bicycle infrastructure. While this level of detail regarding proposed bicycle infrastructure is not available for the CPP or CPP-V scenarios, and based on the intent of the CPP and CPP-V scenarios to provide similar or better opportunities for alternative transportation modes as the DSP and DSP-V scenarios, it is assumed that certain basic bicycle circulation improvements proposed in the Specific Plan for the DSP and DSP-V scenarios such as bicycle lanes on collector and arterial streets and multiuse paths, would also apply to the CPP and CPP-V scenarios, as noted in Table 4.N-7. A detailed pedestrian circulation plan for the CPP and CPP-V scenarios would be prepared as part of the required specific plan should either of these Concept Plan scenarios be approved (see Mitigation Measures 4.N-10 and 4.N-11).
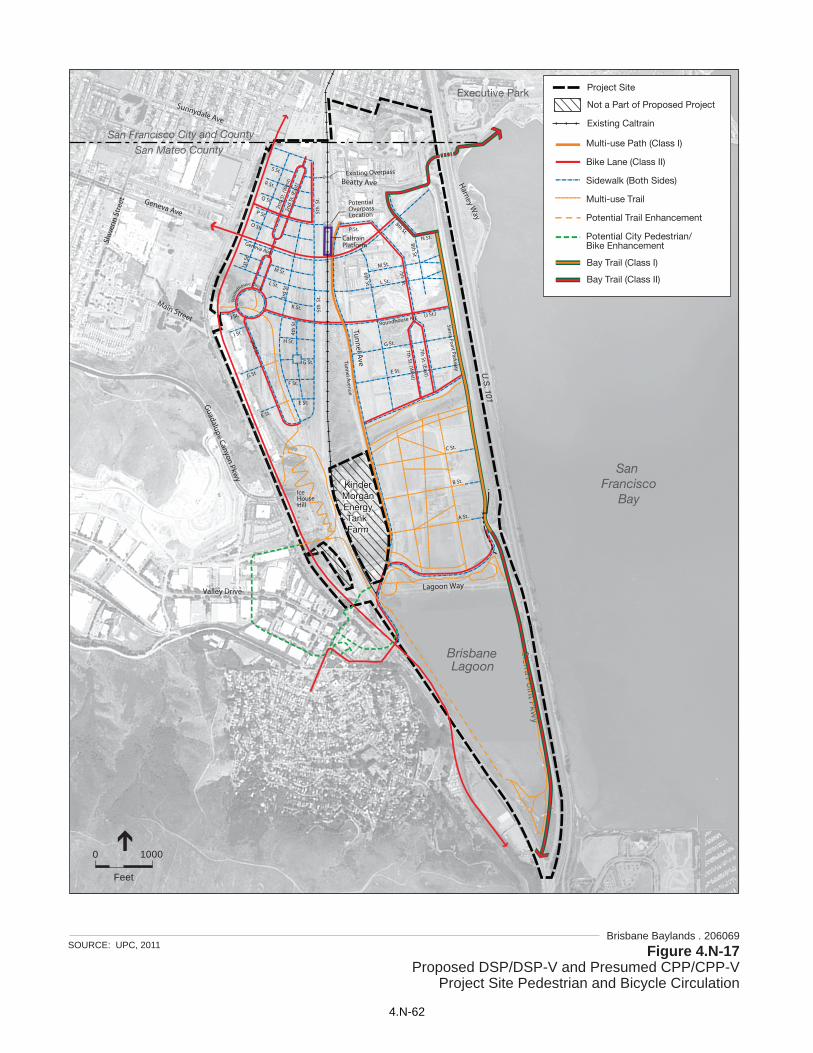
Beatty Ave Harney Way
Lagoon WayValley Drive
Sierra Point Pkwy
0 1000
Feet
Guadalupe Canyon Pkwy
Main Street
Geneva Ave
Sunnydale Ave
Shw
erin
Str
eet
Tunnel Ave
San Francisco City and County
San Mateo County
Brisbane Lagoon
San Francisco
Bay
Executive Park
Ice HouseHill
U.S
. 101
Tun
nel A
venu
e
Sierra Point Parkw
ay
Existing Overpass
Potential OverpassLocation
R St.
S St.
Q St.
P St.
O St.
Geneva Ave.
M St.
L St.
2nd St.
G St.
E St.
Roundhouse Arc
G St
E St.
C St.
B St.
.tS ht 5. t S ht 5
3rd
St
6th St.
7th St.
8th St
M St.
N St.
J St.
H St.
F St.
K St.
Roun
dhouse Circle
4th
St.
A St.
2nd
St. (
Wes
t)
1st S
t.
(J St.)
P St.
8th St.
L St.
7th St. (East)
7th St. (West)
I St
E St.
G St.
2nd
St. (
East
)
Multi-use Path (Class I)
Bike Lane (Class II)
Sidewalk (Both Sides)
Multi-use Trail
Potential Trail Enhancement
Potential City Pedestrian/Bike Enhancement
Bay Trail (Class I)
Bay Trail (Class II)
Project Site
Not a Part of Proposed Project
Existing Caltrain
PlatformCaltrain
KinderMorganEnergyTank Farm
KinderMorganEnergyTank Farm
Brisbane Baylands . 206069Figure 4.N-17
Proposed DSP/DSP-V and Presumed CPP/CPP-VProject Site Pedestrian and Bicycle Circulation
SOURCE: UPC, 2011
4.N-62

4. Environmental Setting, Impacts, and Mitigation Measures
4.N Traffic and Circulation
Brisbane Baylands 4.N-63 ESA / 206069 Draft EIR June 2013
TABLE 4.N-7 BICYCLE COMPONENTS OF THE DSP AND DSP-V SCENARIOS
Street Street
Classification Design Speed Bicycle Facilities
Sierra Point Parkway Arterial 35 12-foot-wide multiuse path
Geneva Avenue Extension Arterial 35 5-foot-wide bicycle lanes in each directiona,b
Residential Collector 25 5- to 6-foot-wide bicycle lanes in each directiona
Roundhouse Arc Road Collector 25 8-foot-wide bicycle lanes in each directiona
Roundhouse Circle Collector 25 6-foot-wide bicycle lanes in each directiona
Tunnel Avenue Collector 25 6-foot-wide bicycle lanes in each direction; 12-foot-wide multiuse path
Lagoon Way Collector 25 5- to 6-foot-wide bicycle lanes in each direction
Creek Parkway Collector 25 6-foot-wide bicycle lanes in each directiona
Retail Main Street Collector 25 6-foot-wide bicycle lanes in each directiona
Office/R&D Collector 25 6-foot-wide bicycle lanes in each directiona
Neighborhood Retail Local Street 25 5-foot-wide bicycle lanes in each directiona
NOTE: Components applying to all four development scenarios are indicated in bold type.
a The design guidelines for this roadway recommend bicycle racks be provided to serve nearby destinations; however, because they are part of the guidelines (and not included as a standard), installation of bicycle racks in these locations is optional.
b During peak hours, the bicycle lanes would be open to through vehicular traffic. Five-foot-wide bicycle lanes would be provided adjacent to the curb, next to the sidewalk.
SOURCE: UPC, 2011; ESA 2013
Pedestrian Circulation Improvements
The Transportation and Circulation Element of the Brisbane General Plan (1994) outlines policies and programs aimed toward diversifying the City’s transportation network and establishing maximum land use intensities given each roadway’s capacity (see Subsection 4.N.3, Regulatory Setting, for pedestrian-related policies and programs).
The pedestrian circulation plan component of the DSP and DSP-V Concept Plan scenarios provides for sidewalks or single- or multi-use paths adjacent to every roadway within the Project Site, allowing complete pedestrian access. The Specific Plan for the DSP and DSP-V scenarios also includes streetscape standards and guidelines for the design of these facilities. In addition to continuous sidewalks along all streets, key intersections would be provided with enhanced pedestrian street crossings, such as bulb-outs, which are designed to calm traffic speeds and reduce crossing distances for pedestrians.
The DSP and DSP-V scenarios include a number of off-street trails (which may be unpaved) designed primarily for pedestrian use. Trails would be located on both sides of Lagoon Way, throughout Lagoon Park, on both sides of Visitacion Creek Park East, on the east side of Visitacion Creek Park West, throughout South Visitation Park, on Icehouse Hill down toward Lagoon Park, and through Roundhouse Green to Bayshore Boulevard. Sidewalks would be provided on all streets where such off-street facilities are not provided.

4. Environmental Setting, Impacts, and Mitigation Measures
4.N Traffic and Circulation
Brisbane Baylands 4.N-64 ESA / 206069 Draft EIR June 2013
The Caltrain right-of-way and Tunnel Avenue currently are at a lower elevation than the majority of the Project Site and create physical barriers to pedestrian and vehicular access. The DSP and DSP-V scenarios include at least one pedestrian overcrossing over these areas to facilitate circulation for pedestrians and bicycles. An overcrossing already exists at the current Bayshore Caltrain station. In one Caltrain Station improvement scenario, this would remain and an additional overcrossing would be constructed as part of the Bayshore intermodal transit station, to be located just north of Geneva Avenue. In an alternative Caltrain Station improvement scenario, the existing overcrossing would be moved from its current location to the location of the intermodal transit station.
Consistent with policies in the Brisbane General Plan, the DSP and DSP-V scenarios provide a comprehensive circulation system that accommodates multiple modes of travel, including a pedestrian circulation system that enhances the planned roadway network and connects land uses within the development. In addition, the pedestrian network would connect the Project Site with local and regional pedestrian networks, most notably the San Francisco Bay Trail.
Sidewalks would range from 6 to 15 feet in width and would generally be buffered from adjacent roadways by parked vehicles and/or landscaping. The pedestrian circulation system for the DSP and DSP-V scenarios is shown in Figure 4.N-17. Streetscape design guidelines and standards are consistent with typical design standards. The streetscape design guidelines and standards contained in the Specific Plan for the DSP and DSP-V scenarios are unique for each roadway within the development, with the stated aim of scaling roadways and orienting development to pedestrians. Inclusion of landscape amenities such as trees, attractive light fixtures, and street furniture is also proposed. For a detailed list of pedestrian components included in each roadway, see Table 4.N-8.
A 12-foot-wide multiuse path would be constructed on the east side of Sierra Point Parkway between the Bay Trail terminus at Sierra Point Parkway and Beatty Road, and on the west side of Frontage Road between its northwestern curve away from US 101 to the existing unimproved Bay Trail terminus at Alana Road. This path, which would become a part of the existing San Francisco Bay Trail and thus connect the Project Site with regional pedestrian and bicycle facilities, would be buffered from Frontage Road by an 8-foot-wide landscaped bioswale, and from US 101 by a landscaped area.
As noted above regarding proposed bicycle circulation improvements, the level of detail related to pedestrian circulation improvements proposed in the Specific Plan for the DSP and DSP-V Concept Plan scenarios is not currently available for the CPP and CPP-V scenarios. However, certain pedestrian circulation features proposed under the DSP and DSP-V scenarios also would apply to the CPP and CPP-V scenarios. These are noted in Table 4.N-8 below. A detailed pedestrian circulation plan for the CPP and CPP-V scenarios would be provided as part of preparation of the specific plan that would be required should either of these Concept Plan scenarios be selected (see Mitigation Measures 4.N-10 and 4.N-11).

4. Environmental Setting, Impacts, and Mitigation Measures
4.N Traffic and Circulation
Brisbane Baylands 4.N-65 ESA / 206069 Draft EIR June 2013
TABLE 4.N-8 PEDESTRIAN COMPONENTS OF THE DSP AND DSP-V SCENARIOS
Street Street
Classification Design Speed Pedestrian Facilities
Sierra Point Parkway Arterial 35 12-foot-wide multiuse path
Geneva Avenue Extension Arterial 35 10- to 11-foot-wide sidewalks
On-street parking
Street and pedestrian lights
Residential Collector 25 10-foot-wide sidewalks
On-street parking
Street lights
Roundhouse Arc Road Collector 25 6-foot-wide sidewalks
On-street parking
Street lights
Roundhouse Circle Collector 25 10- and 15-foot-wide sidewalks
On-street parking
Street and pedestrian lights
Tunnel Avenue Collector 25 6-foot-wide sidewalks; 12-foot-wide multiuse path
Street lights
Lagoon Way Collector 25 6-foot-wide sidewalks
On-street parking
Street lights
Creek Parkway Collector 25 6-foot-wide sidewalks
On-street parking
Street lights
Retail Main Street Collector 25 14-foot-wide sidewalks
On-street parking
Street and pedestrian lights
Office/R&D Collector 25 8-foot-wide sidewalks
On-street parking
Street lights
Neighborhood Retail Local Street 25 10-foot-wide sidewalks
On-street parking
Street lights
Residential Local Street 25 6- to 8-foot-wide sidewalks
On-street parking
Street lights
Office/R&D Local Street 25 6-foot-wide sidewalks
On-street parking
Street lights
NOTE: Features applying to all development scenarios are shown in bold type. SOURCE: UPC, 2011; ESA, 2013

4. Environmental Setting, Impacts, and Mitigation Measures
4.N Traffic and Circulation
Brisbane Baylands 4.N-66 ESA / 206069 Draft EIR June 2013
Transportation Demand Management (TDM) Program
Development of the Project Site would include preparation and implementation of a Transportation Demand Management (TDM) program designed to reduce use of single-occupant vehicles and to increase the use of rideshare, transit, bicycle, and pedestrian modes for trips to and from, as well as within the Project Site. A draft TDM program, adapted from the Specific Plan prepared for the DSP and DSP-V scenarios, has been developed with aims to reduce automobile traffic. A similar plan would be implemented for the CPP or CPP-V scenario should either be selected; however, the TDM program for the CPP or CPP-V scenario would differ from the TDM program for the DSP and DSP-V scenarios since some measures/strategies described below, such as those that apply to residential units, would not be applicable,
In San Mateo County, the Congestion Management Program requires that new development expected to generate more than 100 peak hour trips incorporate measures necessary to reduce the net number of trips. Because development is expected to occur in several phases, TDM plans would be prepared for each applicable development project as it undergoes permit review. A wide range of TDM measures are available; implementation would earn credits toward the mitigation of overall traffic impacts from future development. The proposed Specific Plan for the DSP and DSP-V scenarios includes the following policy related to transportation demand management, which is relevant for all Project Site development scenarios:
Policy 6-14: Require, as applicable, employers and home owner associations located in the Planning Area to implement applicable TDM-related measures to reduce vehicle trips, particularly during commute hours.
Additional measures are available as described in the City/County Association of Governments of San Mateo County’s Guidelines for the Implementation of the Land Use Component of the Congestion Management Program.
The TDM program would highlight the demand management qualities of overall Project Site development, including:
Jobs-Housing Linkage. By providing a range of job types (retail, research, hospitality, office, etc.) and a range of housing types from affordable apartments to single-family townhomes (DSP and DSP-V scenarios only) in proximity to those jobs, developments within the Project Site would maximize the potential job/housing “matches” onsite (DSP and DSP-V scenarios only) and with the 11,500 residential dwelling units proposed north of the Project Site within San Francisco. Large employers would be encouraged to offer relocation assistance to employees who agree to become Brisbane residents.
Streets Designed for Alternative Transportation Modes. All new streets and intersections within the Project Site would be designed in consideration for the convenience and the safety of pedestrians and bicyclists. Project Site development would provide extensive Class I, II, and III bicycle routes within the Project Site and a “Safe Routes to School” program. Exclusive bike lanes and frequent bus rapid transit service provided by existing transit agencies and operating in dedicated lanes with signal priority constructed as part of Project Site development would offer convenient alternatives to driving to, from, and within the Project Site. Additional transit service would include extended Muni routes, increased Muni

4. Environmental Setting, Impacts, and Mitigation Measures
4.N Traffic and Circulation
Brisbane Baylands 4.N-67 ESA / 206069 Draft EIR June 2013
frequencies, and enhanced connections to the regional network (BART and Caltrain). Project Site development would provide rights-of-way for BRT route and stations/stops.
Encouraging Walking. People tend to walk more when destinations are within close proximity, along flat routes with easy street crossings, and through interesting areas with storefronts, street furniture, and other pedestrian-oriented amenities. Project Site development would place approximately 50 percent of development within one-quarter mile (5-minute walking distance) and up to 90 percent of development within one-half mile (10-minute walking distance) of transit and neighborhood retail services integrated into residential blocks. All streets leading to the Caltrain intermodal station and BRT stops would have sidewalks and crosswalks. A comprehensive way-finding signage program would support the network of walkways and shared-use paths, encouraging pedestrian and bicycle trips.
The program would also include a menu of TDM tools including the following strategies:
Implementation and Monitoring Strategies
Designate a TDM Coordinator. The TDM program includes a designated full-time TDM Coordinator in charge of the following activities:
- Promote and manage implementation of the TDM program.
- Establish modal split goals.
- Develop a program to accomplish the goals mutually agreed upon with the City of Brisbane.
- Develop an information package of transportation services on Project Site.
- Monitor and update, as appropriate, the TDM program each year as the basis for updating the modal split status and the TDM program.
- Conduct employees and visitor travel surveys on a biannual basis.
- Coordinate with 511.org to establish a rideshare matching program.
- Coordinate parking management and the shuttle bus program.
- Help people plan their trips and work with transportation agencies and others to promote transit, vanpooling, carpooling and carsharing, bicycling, and walking.
Promote TDM Program. Organize and conduct a Transportation Day Fair annually. The fair would include representatives from local and regional transportation agencies, the Bicycle Coalition, 511.org, and carshare companies, and provide information about transit, ridesharing, and bicycling. The TDM Coordinator would promote attendance at these events by providing incentives for employees and residents to attend the fair, such as free transit fast passes, free bicycles, and food and drink.
Provide a centralized kiosk/booth with a computer terminal in a conveniently accessible area in each major building where employees could obtain maps, schedules, and regional transit information (such as 511.org); enroll in web-based “car sharing”/”ride sharing”; and reserve car sharing vehicles.
Publish a quarterly newsletter with semi-regular update on transit and travel issues within the Project site development area, containing highlighted program elements and benefits and contact information.

4. Environmental Setting, Impacts, and Mitigation Measures
4.N Traffic and Circulation
Brisbane Baylands 4.N-68 ESA / 206069 Draft EIR June 2013
Create a dedicated intranet/website/page containing relevant transit and parking information and related links.
Transit Strategies
Work with major employers to provide employees with an “Eco Pass” (transit pass) which would allow unlimited transit use in San Francisco or comparable benefits on other transit systems. The Eco Pass could be purchased at a discount bulk rate on a monthly and/or annual basis and then be made available to all employees who work on the Project Site.
Include the cost of “Eco Passes” (transit passes) in homeowners’ dues (DSP and DSP-V scenarios only). Eco Passes would allow unlimited transit use in San Francisco and/or comparable benefits on other transit systems. The Eco Pass would offer a group discount (transit pass costs, while mandatory, would be priced significantly lower than individual passes because they are mandatory), a steady funding stream for enhanced transit service, and a “self selection” incentive.
Provide a shuttle bus connecting the Project Site with Executive Park, the housing development on the Schlage Lock site, and the Balboa Park BART Station.
Work with SamTrans, the Caltrain Joint Powers Board, and SFMTA to provide transit shelters at the bus stops adjacent to buildings.
Install “Next Bus” or similar technology at a prominent location to provide transit users with real-time transit and shuttle bus arrival time information.
Develop a transit center within the Project Site to enable efficient and convenient transfers among Caltrain/SamTrans buses/Muni LRT and buses while providing a central location for transportation brochures and other information to be distributed and for attended bicycle parking.
At major BRT stops throughout the Project Site, include information kiosks and real-time transit updates.
Support Strategies
Include participation in the Commuter Benefits program for tax-free paycheck deductions of transit and bicycle commuter expenses.
Work with major employers to encourage compressed work weeks, flex time, and telecommuting.
Include a maximum permitted of one off-street parking space per residential unit within a one-quarter-mile radius of a transit station or BRT stop, as well as maximum permitted ratios for other development type.
Promote carpools/vanpools. The TDM program would provide a Rideshare matching program by 511 Regional Rideshare Program, provide free parking for carpool/vanpool vehicles, and designate preferential carpool/vanpool parking spaces at parking facilities closest to the elevator(s) or main entrance to a building.
Work with major employers to provide guaranteed ride home services for employees when an alternative means of travel is not available.

4. Environmental Setting, Impacts, and Mitigation Measures
4.N Traffic and Circulation
Brisbane Baylands 4.N-69 ESA / 206069 Draft EIR June 2013
Maintain a sufficient number of dedicated “car sharing” (e.g., City CarShare, ZipCar, or similar vendor) parking spaces.
Investigate and implement, where feasible, “site license” arrangement with City CarShare or another vendor that would allow reduced cost memberships to the employees and residents.
Parking Strategies
Residential parking (DSP and DSP-V scenarios only) would be “unbundled” and sold or leased separately from units. Unbundling parking makes the cost of parking visible to households and may encourage some residents to save money by opting for a single off-street space or no dedicated parking. Unbundled parking would also serve as a “self selection” incentive for residents who prefer to live in car-free or car-reduced neighborhoods.
Additional parking management strategies such as residential permit parking (DSP and DSP-V scenarios only), time of day restrictions, parking technologies, and parking way-finding would also be considered as needed to supplement other parking strategies.
Bicycle Strategies
Install at least the Leadership in Energy and Environmental Design (LEED)-level required number of bicycle parking spaces in or near each building. Provide bicycle support facilities that would include parking facilities for both residential and commercial developments (such as racks, indoor/long-term parking, lockers, and showers), attended bicycle parking, and repair facilities at major destinations. Provide a shared bicycle program.
Parking
As stated above, parking conditions described in this subsection are as presented in the Specific Plan prepared for the DSP and DSP-V Concept Plan scenarios. The same level of detail is not currently available for the CPP and CPP-V scenarios; however, it is assumed that parking provisions under the CPP and CPP-V scenarios would meet existing City standards, except where those standards would be modified as part of TDM program implementation.
For the DSP and DSP-V scenarios, private parking would be on-parcel with entrances prohibited on primary streets. Visitor parking is proposed to be accommodated on-street. Where podium or structured parking is proposed, it would be wrapped with active uses and not exposed to the street. The Specific Plan prepared for the DSP and DSP-V scenarios proposes parking ratios for each use on a per-square-foot or per-dwelling-unit basis. Parking standards for retail and mid- and high-rise office uses are also based on proximity to transit in the proposed Specific Plan for the DSP and DSP-V scenarios. Distances are from transit station entrance to building entrance, considering access to Muni T-Third and BRT and Caltrain. The following parking standards are proposed in the Specific Plan for the DSP and DSP-V scenarios:
Roundhouse District
- Residential High Density – 1 space per dwelling unit; 1 space per 1,000 square feet ground floor retail
- Residential Medium Density – 1 space per dwelling unit; 2.5 spaces per 1,000 square feet ground floor retail

4. Environmental Setting, Impacts, and Mitigation Measures
4.N Traffic and Circulation
Brisbane Baylands 4.N-70 ESA / 206069 Draft EIR June 2013
- Commercial Retail Single Use – 3 spaces per 1,000 square feet
East Geneva District
- Commercial Retail– 2.5 spaces per 1,000 square feet (one-quarter mile to transit); 3.0 spaces per 1,000 square feet (one-half mile to transit); 3.5 spaces per 1,000 square feet (more than one-half mile to transit)
- Office High Rise/Mid-Rise – 2.0 spaces per 1,000 square feet (one-quarter mile to transit); 2.5 spaces per 1,000 square feet (one-half mile to transit); 3.0 spaces per 1,000 square feet (more than one-half mile to transit)
- Hotel/Conference Center – 1space per room; 1 space per 1,000 square feet for other uses
East Geneva Entertainment Variant
- Multiplex/Cinema - 3.3 spaces per 1,000 square feet; 2.5 spaces per 1,000 square feet ground floor retail or other uses
- Theater - 2.0 spaces per 1,000 square feet; 2.5 spaces per 1,000 square feet ground floor retail or other uses
- Arena - 3.0 spaces per 1,000 square feet; 2.5 spaces per 1,000 square feet ground floor retail or other uses
Icehouse District
- Townhomes High Density - 1.5 spaces per unit
- Townhomes Medium Density – 2.0 spaces per unit
- School – Per Brisbane & Jefferson Unified School District Standards
Visitacion Green North District
- Office 1 – 2.0 spaces per 1,000 square feet (one-quarter mile to transit); 2.5 spaces per 1,000 square feet (one-half mile to transit); 3.0 spaces per 1,000 square feet (more than one-half mile to transit)
- Research & Development 1 – 2.0 spaces per 1,000 s.f. (one-quarter mile to transit); 2.5 spaces per 1,000 square feet (one-half mile to transit); 2.5 spaces per 1,000 square feet (more than one-half mile to transit)
- Light Industrial – 1 space per 1,000 square feet
- Industrial Wastewater Treatment - 1 space per 1,000 square feet of Administration Building
Visitacion Green South District
- Office 2 – 2.0 spaces per 1,000 square feet (one-quarter mile to transit); 2.5 spaces per 1,000 square feet (one-half mile to transit); 3.0 spaces per 1,000 square feet (more than one-half mile to transit)
- Research & Development 2 – 2.0 spaces per 1,000 square feet (one-quarter mile to transit); 2.5 spaces per 1,000 square feet (one-half mile to transit); 2.5 spaces per 1,000 s.f. (more than one-half mile to transit)

4. Environmental Setting, Impacts, and Mitigation Measures
4.N Traffic and Circulation
Brisbane Baylands 4.N-71 ESA / 206069 Draft EIR June 2013
By comparison, existing City zoning standards require the following number of spaces:
Multi-Family Residential
- 0 bedroom or bachelor apartments: 1 off-street parking space
- 1 and 2 bedroom units: 1½ garage spaces per living unit
- Over 2 bedrooms: 2 garage spaces per living unit
Commercial
- Administrative offices: 1 space per 300 square feet (3.3 spaces per 1,000 square feet)
- Professional offices: 1 space per 250 square feet (4.0 spaces per 1,000 square feet)
- Retail stores, restaurants: 1 space per 300 square feet (3.3 spaces per 1,000 square feet)
- Industrial: minimum of 2 spaces for every 3 employees on the shift having the largest number of employees, but not less than 1 space for each 1000 square feet of gross floor area
Specific information on the number and location of parking spaces on each development parcel within the Project Site would be developed as specific projects are proposed pursuant to the selected development scenario. As site-specific development projects are proposed within the Project Site, specific parking issues such as number and location of parking spaces, ingress and egress, and internal access within parking areas would be reviewed as part of the planning review process to ensure that adequate parking is provided.
Project Travel Demand
This subsection presents the travel demand methodology used in this EIR. The proposed land uses and development intensities used to determine travel demand are set forth in Tables 3-2A through 3-2C of this document.
Person and Vehicle Trip Generation
The transportation effects associated with the travel demand generated by Project Site development scenarios were determined by calculating the daily person trips generated by the different types of land uses proposed for each Project Site development scenario and the portion of those trips that would occur during the AM and PM peak hours. After determining the number of person trips generated by the development of Project Site development scenarios, the trips were distributed to geographical origins/destination areas, including five San Francisco areas (downtown, the rest of Superdistrict 1, Superdistrict 2, Superdistrict 3, Superdistrict 4) and three other regions in the Bay Area (South Bay, East Bay, and North Bay).
11 The mode split analysis then determined the portion
of these trips made via automobile, transit, or any other mode of transportation, based upon the
11 Superdistricts are travel analysis zones established by the Metropolitan Transportation Commission (MTC).
San Francisco is divided into four Superdistricts delineated to capture the different travel characteristics that are associated with the various street network, transit opportunities, and geographical constraints of different areas of San Francisco.

4. Environmental Setting, Impacts, and Mitigation Measures
4.N Traffic and Circulation
Brisbane Baylands 4.N-72 ESA / 206069 Draft EIR June 2013
origin/destination of the trips, the purpose of the trips, and the availability of various modes of transportation. Finally, automobile occupancy rates were determined, to yield the average number of individuals in a vehicle, and, thus, determine the number of vehicles that would be traveling to and from the Project Site during the morning and afternoon peak hours and over the course of the day.
Project Site development-generated vehicle trips were initially estimated based on the trip rates obtained from the Institute of Transportation Engineers (ITE) Trip Generation (ITE, 2008), which provides daily, AM, and PM peak hour vehicle trip generation rates for all uses except for the Recology site (recycling center land use). Trip generation calculation for the Recology site was based on the trip generation study for the Recology Master Plan (Recology, 2011). The ITE Trip Generation has been used by local jurisdictions throughout the county to estimate vehicle trips to be generated by development projects. As explained below, however, the ITE trip rates would not be suitable to Project Site development unless appropriate adjustments are made to account for the scale, mix, and availability of transit for Project Site development. The estimated AM and PM peak hour vehicle trips were therefore adjusted to account for internal trips, pass-by trips, and non-pass-by trips, as follows:
Internal Trips. Internal trips are generated and remain within the Project Site and do not affect the adjacent system. To account for the trip-making patterns of Project Site development, a state-of-the-practice trip generation forecasting method was used. This method was originally developed by Fehr & Peers and others for the U.S. Environmental Protection Agency (U.S. EPA) and has been endorsed for use in project-specific and planning-level analyses by a number of jurisdictions, including Caltrans. This method is commonly referred to as the “4D” method and generally accounts for the following factors that may influence travel behavior:
- Development scale – the amount of trips generated increases as the amount of development increases;
- Density of the project – the higher the project’s density, the less vehicular traffic generated per unit of development;
- Diversity of uses – an appropriate mix of uses can lead to internalization of trips and trip-linking within a project site; and
- Design of project – a walkable, pedestrian- and bicycle-oriented circulation system can help to reduce automobile dependence within a project site.
The general concept behind the 4D method is that development projects that deviate from a base case (in this case, ITE trip generation rates, which represent a “national average”) with respect to the four bulleted variables above exhibit different traffic generation patterns. Elasticities have been derived from travel behavior surveys from the Bay Area to help estimate how traffic generation changes as a function of changes in the 4Ds. Those elasticities are used to adjust the base case trip generation to account for Project site development’s density, diversity, and pedestrian/bicycle friendliness (i.e., design) compared to typical suburban developments reflected in the ITE trip generation rates. Applying the 4D method resulted in a percentage reduction in trip generation from the base case (i.e., ITE Trip Generation), and yielded an estimated net external trips.

4. Environmental Setting, Impacts, and Mitigation Measures
4.N Traffic and Circulation
Brisbane Baylands 4.N-73 ESA / 206069 Draft EIR June 2013
Pass-By Trips. Pass-by trips are trips made as intermediate stops on the way from an origin outside of a project site to a primary trip destination that is also outside of a project site. Pass-by trips are attracted from traffic passing through a site on an adjacent street, thereby adding no extra trips to the surrounding roadway systems. For example, retail-oriented developments such as shopping centers, discount stores, and restaurants attract a portion of their trips from traffic passing the site on the way from an origin to an ultimate destination. Thus, a portion of the traffic associated with these retail uses may not add “new” traffic to the adjacent street system. Pass-by trips were removed from the estimated net external trips using the methodologies and rates established by the ITE Trip Generation Handbook.
Non-Pass-By Trips. Non-pass-by trips are trips that include primary and diverted linked trips. Diverted linked trips are trips that are attracted from the traffic volume on roadways within the vicinity of the generator, but that require a diversion from that roadway to another roadway to gain access to the site. While diverted linked trips add traffic to streets adjacent to a site, they may not add traffic to the area’s major travel routes. Diverted linked trips were removed from the estimated net external trips using the methodologies and rates established by the ITE Trip Generation Handbook.
It is also likely that the job opportunities provided by future development would cause shifts in live-work patterns. For example, an individual currently living in the city of San Mateo and working in San Francisco may find it more convenient to work at the Project Site to save commute time. This change would not cause an increase in traffic volumes on the adjacent freeway because this individual would be on the adjacent freeway with or without development of the Project Site. For the purpose of this EIR, a conservative approach was taken to not include any reduction caused by this potential shifts in origin-destination pairs.
The travel demand analysis assumes implementation of the improvements to transit service under each of the development scenarios, as described above. Transit improvements would be in addition to those currently proposed as part of the Sam Francisco Municipal Transportation Agency (SFMTA) Transit Effectiveness Program.
Project Site development is intended to achieve the TDM goals by providing improved transit options as well as a detailed package of TDM measures as described above. Due to uncertainty pertaining to quantifying the effectiveness of implementing the proposed TDM strategies, the travel demand analysis does not assume additional trip reduction due to specific TDM strategies beyond those associated with internal, pass-by, and diverted linked trips as described above.
Project Trip Generation by Mode
The steps in determining Project site development’s trip generation by mode include:
1. Trip Generation. The number of weekday person trips generated by development of the Project Site was calculated using the 4D methodology. This process calculates the number of person trips generated by each of the four Project Site development scenarios (based on ITE rates), and estimates the percentage of those trips that occur as internal, pass-by, or diverted linked trips to the Project Site. The remaining external trips are then taken and used in the Project Site development offsite impact analysis.
4. Environmental Setting, Impacts, and Mitigation Measures
4.N Traffic and Circulation
Brisbane Baylands 4.N-74 ESA / 206069 Draft EIR June 2013
2. Trip Purpose. The net external trips calculated in Step 1 were separated into work and non-work trips based on relative distributions contained in the 4D methodology.
3. Trip Distribution and Assignment. Once the trips were calculated by purpose, they were distributed to the four quadrants of San Francisco (Superdistricts 1, 2, 3, and 4), East Bay, North Bay, South Bay/Peninsula, and out of the region, based on the origin and destination of each trip. The trip distribution and assignment assumptions for the net new Project Site development trips were derived from output of several resources, including the MTC Regional Travel Demand Model, the SF-CHAMP model, the Bay Area Travel Survey 2000 (BATS 2000), the C/CAG Travel Demand Model, the CPHPS EIR, and the SF Transportation Impact Analysis Guidelines. From these sources, a recommended trip distribution to be used for this EIR was proposed. The following sources were evaluated:
a. Metropolitan Transportation Commission Trip distribution results for the City of Brisbane were taken from the MTC Regional Travel Demand Model.
b. Candlestick/Hunters Point EIR (MTC/TA hybrid travel demand model results) The Candlestick/Hunters Point project is located adjacent to and north of the Project Site to the east of US 101. The trip distribution identified for the Candlestick/ Hunters Point project was developed based on information obtained from the SF-CHAMP model for the TAZs included within the Candlestick/Hunters Point project boundaries in combination with information from the MTC regional demand model for areas outside of San Francisco. The similar style of development proposed as part of Project site development and the geographical proximity make this a relevant comparison.
c. Bay Area Travel Survey 2000 (BATS 2000) The BATS 2000 study involved an extensive data collection effort that provided an introspective into how Bay Area residents commuted and traveled around the region. The information is based on census tracts; data for the neighboring census tract representing the City of Brisbane were used for the comparison. These results are based strictly on current travel patterns.
d. C/CAG Travel Demand Model The C/CAG Travel Demand Model was used to evaluate a direct analysis of the Brisbane trip distribution. Land use inputs were adjusted to include Project Site development. A “select zone” analysis was conducted to track the trips both coming from and traveling to the Project Site.
e. San Francisco Transportation Impact Analysis Guidelines The City and County of San Francisco developed matrices that prescribe trip distributions based on types of use and trip purpose. The values are based on extensive data research completed especially for San Francisco. Superdistrict 3 in the southeastern quadrant of San Francisco (consisting of the Visitacion Valley, Mission, and Bayview areas) is adjacent to the Project Site and provides a comparable trip distribution analysis because of its proximity to the Project Site.
Table 4.N-9 compares the aggregated daily trip distribution for the various sources discussed above. Table 4.N-10 and Table 4.N-11 represent the individual distributions for work trips and non-work trips. These trip purposes are presented separately because some analyses identify completely separate trip patterns for the two types of trips. Trip distributions and assignments apply across all four development scenarios.

4. Environmental Setting, Impacts, and Mitigation Measures
4.N Traffic and Circulation
Brisbane Baylands 4.N-75 ESA / 206069 Draft EIR June 2013
TABLE 4.N-9 PROJECT SITE DEVELOPMENT TRIP DISTRIBUTION – ALL TRIPS, ALL DEVELOPMENT SCENARIOS
Destination MTC
Candlestick Point/Hunters
Point EIR BATS 2000 C/CAG Travel
Demand ModelSF
Guidelines Proposed Trip
Distribution
SF SD 1 7% 5% 6% 11% 12% 7%
SF SD 2 3% 8% 9% 4% 13% 7%
SF SD 3 31% 38% 19% 19% 38% 28%
SF SD 4 3% 3% 1% 9% 8% 4%
Brisbane 21% 27%
17% 6% - 16%
Daly City/Colma 7% 4% 7% - 7%
North Bay 1% 2% 1% 1% 3% 2%
South Bay 20% 6% 35% 31% 15% 17%
East Bay 7% 11% 8% 12% 11% 12%
TOTAL 100% 100% 100% 100% 100% 100%
SOURCE: Fehr & Peers, 2012
TABLE 4.N-10
PROJECT SITE DEVELOPMENT TRIP DISTRIBUTION – WORK TRIPS, ALL DEVELOPMENT SCENARIOS
Destination MTC/TA
Hybrid Results
Candlestick Point/Hunters
Point EIR BATS 2000 C/CAG Travel
Demand ModelSF
Guidelines Proposed Trip
Distribution
SF SD 1 8% 5% 5% - 9% 7%
SF SD 2 4% 10% 8% - 11% 7%
SF SD 3 22% 28% 22% - 25% 24%
SF SD 4 3% 4% 1% - 8% 4%
Brisbane 8% 22%
11% - - 13%
Daly City/Colma 12% 3% - - 7%
North Bay 3% 4% 2% - 6% 3%
South Bay 21% 8% 33% - 28% 18%
East Bay 19% 19% 14% - 15% 17%
Total 100% 100% 100% 100% 100% 100%
SOURCE: Fehr & Peers, 2012
TABLE 4.N-11
PROJECT SITE DEVELOPMENT TRIP DISTRIBUTION – NON-WORK TRIPS, ALL DEVELOPMENT SCENARIOS
Destination MTC/TA
Hybrid Results
Candlestick Point/Hunters
Point EIR BATS 2000 C/CAG Travel
Demand ModelSF
Guidelines Proposed Trip
Distribution
SF SD 1 6% 5% 7% - 13% 7%
SF SD 2 3% 6% 9% - 14% 7%
SF SD 3 34% 44% 15% - 45% 34%
SF SD 4 3% 3% 2% - 7% 4%
Brisbane 24% 30%
22% - - 18%
Daly City/Colma 6% 4% - - 6%
North Bay 1% 1% 1% - 1% 1%
South Bay 19% 5% 37% - 9% 16%
East Bay 4% 7% 3% - 9% 7%
TOTAL 100% 100% 100% 100% 100% 100%
SOURCE: Fehr & Peers, 2012

4. Environmental Setting, Impacts, and Mitigation Measures
4.N Traffic and Circulation
Brisbane Baylands 4.N-76 ESA / 206069 Draft EIR June 2013
4. Mode Share. A similar approach used for Step 3 was employed for the mode share. The analysis takes into consideration that mode split often varies by trip purpose. The person trips were assigned to travel modes in order to determine the number of auto, transit/shuttle, and other alternative mode trips (e.g., walk, bicycle) that would be generated by Project Site development. Mode share was evaluated and compared among several resources. The CPHPS EIR, the SF Guidelines, and the BATS 2000 (described above) were applicable, and each provided data on both work and non-work mode splits. The following sources were also evaluated and compared: the American Community Survey 2005-2009, the Census 2010, and travel characteristics of comparable transit-oriented developments in California. From these sources, a recommended mode split to be used for this EIR was proposed.
a. Census 2010 The census is conducted every ten years and targets all residents of the United States. In the past, the census included two forms, a long form and a short form. In 2000, the short form was sent to all U.S. households, while the long form was sent to about one in six households. The long form includes additional socioeconomic questions including questions about journey to work. Beginning in 2010, however, the decennial census included only the short form, while the long form questions will be collected by the American Community Survey.
b. American Community Survey (2005-2009) The American Community Survey is an ongoing statistical survey by the U.S. Census Bureau. It is sent to about 250,000 addresses per month and collects information about individual and household characteristics including mode of transportation to work. The survey was initiated in 1995 in order to supplement the decennial census and enable more frequent data collection.
c. Travel Characteristics of Transit Oriented Development (TOD) in California (2004) This report by Hollie Lund, Robert Cervero, and Richard Wilson provides a measurement of travel behavior in California TODs. Surveys were conducted around stations for a variety of transit types. Of particular interest to this analysis is the survey data of residents living near three Caltrain stations: Broadway, Mountain View, and Palo Alto. Because Project Site development is planned around the Bayshore Caltrain Station, mode share data from these residents is included in the tables below.
Based on the mode share data in the above-cited sources, mode splits for work trips and non-work trips generated by the proposed development scenarios were set for the purpose of this EIR. That is, the mode split for work trips was assumed to be 80 percent by automobiles, 15 percent by transit, and 5 percent by walking, bicycling, and other modes, and the mode split for non-work trips was assumed to be 70 percent by automobiles, 10 percent by transit, and 20 percent by walking, bicycling, and others.
5. Auto Person and Vehicle Trips. Auto person trips are calculated by subtracting transit trips from all external person trips for each destination zone. The number of vehicle trips was determined from the SF Guidelines based on independent average vehicle occupancies for work and non-work trips to Superdistrict 3, which was selected due to its proximity of the Project site. For the purpose of this EIR, the average vehicle occupancy for work trips is 1.32, and 2.36 for non-work trips.
12
12 The average vehicle occupancies of “work trips to SD3” and “visitors trips to SD3 – all other” from Tables E-5 and
E-15 of the SF Guidelines were taken to derive the average work and non-work vehicle occupancies by origin. The weighted average of work and non-work trips average vehicle occupancies was calculated using work/non-work split developed from the trip distribution step.

4. Environmental Setting, Impacts, and Mitigation Measures
4.N Traffic and Circulation
Brisbane Baylands 4.N-77 ESA / 206069 Draft EIR June 2013
6. Transit Trip Assignment. After estimating the transit mode share of Project-related trips among each of the districts, the numbers of transit riders were assigned to specific transit routes serving or proposed to serve the study area.
The result of Steps 1 to 6 above is a projected person and vehicle trip generation, by land use and by mode, for the weekday daily, AM, and PM peak hours.
Table 4.N-12 and Table 4.N-13 present the daily person trip generation for the four proposed development scenarios by land use category. The greatest number of daily person trips would occur under the CPP scenario at approximately 264,000 daily trips. The DSP scenario, though it has the largest amount of new development, would generate approximately 112,000 fewer daily trips than the CPP scenario due to internal capture of travel within the Project Site and increased use of pedestrian, bicycle, and transit modes of travel. Despite the CPP and CPP-V scenarios being less intense than the DSP and DSP-V scenarios in terms of the total amount of new development, the CPP and CPP-V propose 2,210,000 square feet of mixed commercial/office/retail, which is approximately four times the amount proposed under the DSP and eight times the amount proposed under the DSP-V, resulting in the higher daily trips for the CPP and CPP-V scenarios.
Table 4.N-14 and Table 4.N-15 presents the peak hour vehicle trip generation for Project Site development by land use category. Similar to the daily trip generation, the CPP scenario would generate the greatest number of peak hour vehicle trips during both the AM and PM peak hours. The DSP scenario would generate 484 and 1,234 fewer trips than the CPP scenario during the AM and PM peak hours, respectively.
Table 4.N-16 summarizes peak hour person trips for each of the proposed development scenarios by mode and vehicle trips for the weekday daily, AM, and PM peak hours. Under the DSP and DSP-V scenarios, an average of 27 percent of weekday AM and PM peak hour person trips would be internal or linked trips that would remain within the Project Site and would occur primarily by walking and bicycling. Under the CPP and CPP-V scenarios, an average of 19 percent of weekday AM and PM peak hour person trips would be internal or linked trips. External trips would occur via automobile, transit, and bicycle.
Table 4.N-17 presents the distribution of the weekday AM and PM trips to and from San Francisco and areas outside of San Francisco. The majority of trips would occur to and from areas within the boundaries of San Francisco, with a greater portion of work trips occurring by transit than non-work trips. Within San Francisco, the greatest number of trips would occur between the Project Site and Superdistrict 3, consisting of the Visitacion Valley, Mission, Mission Bay, Noe Valley, Glen Park, and Bayview districts. Superdistrict 1 represents the downtown core of San Francisco and consists of the Financial District, SOMA, North Beach, and Chinatown districts. Superdistrict 2 consists of the Richmond, Haight, Pacific Heights, and Marina districts, while Superdistrict 4 includes the Sunset, West Portal, and Parkmerced districts.

4. Environmental Setting, Impacts, and Mitigation Measures
4.N Traffic and Circulation
Brisbane Baylands 4.N-78 ESA / 206069 Draft EIR June 2013
TABLE 4.N-12 PROJECT DAILY PERSON TRIP GENERATION – DSP AND DSP-V
Land Use Size Units
ITE Land Use
Codea
Rate or
Eqn.b
Person-Trip Generation
Total Net Vehicle Tripse
Raw Trips Totalc
Total Net Tripsd
Percent Reduction
Developer-Sponsored Plan (DSP)
Non-Residential General Retail 566 ksff 820 Eqn 38,778 20,449 47% 6,852 General Office 2,651 ksf 710 Eqn 30,789 25,105 18% 10,543 Research &
Development 3,328 ksf 760 Eqn 33,043 26,943 18% 11,315
Hotel 369 rooms 310 Rate 5,577 4,790 14% 2,412 Public / Civic /
Cultural 28 ksf 814 Rate 2,312 1,615 30% 541
Conference / Exhibition
21 ksf 814 Rate 1,746 1,220 30% 409
Schools High School 1,000 students 530 Rate 3,164 2,753 13% 1,151 Elementary School 300 students 520 Rate 716 623 13% 260 Residential Apartment 3,950 units 232 Eqn 27,963 19,967 29% 7,524 Multi-Family 484 units 220 Eqn 5,655 4,038 29% 1,521
Grand Total 149,743 107,503 28% 42,528
Developer-Sponsored Plan – Entertainment Variant (DSP-V)
Non-Residential General Retail 283 ksf 820 Eqn 24,192 12,706 47% 4,258 General Office 2,252 ksf 710 Eqn 26,569 21,607 19% 9,071 Research &
Development 2,599 ksf 760 Eqn 26,396 21,466 19% 9,012
Hotel 719 rooms 310 Rate 10,632 9,111 14% 4,585 Public / Civic /
Cultural 28 ksf 814 Rate 2,262 1,574 30% 527
Conference / Exhibition
74 ksf 814 Rate 5,896 4,102 30% 1,374
Entertainment Movies/Theater 10 screens 445 Rate 3,173 2,719 14% 1,368 Live Theater 5,500 seats 441 Rate 1,991 1,706 14% 859 Arena g 630 ksf 460 Rate 872 748 14% 376 Schools High School 1000 students 530 Rate 3,095 2,674 14% 1,119 Elementary School 300 students 520 Rate 700 605 14% 253 Residential Apartment 3,950 units 232 Eqn 27,358 20,173 26% 7,578 Multi-Family 484 units 220 Eqn 5,532 4,022 27% 1,513
Grand Total 138,668 103,213 26% 41,893
a Institute of Transportation Engineers, Trip Generation, 8th Edition (2008). b Trip Generation generally provides both average rates and fitted curve equations for forecasting trip generation. The choice of which
method to use is described in the Trip Generation Handbook. The analysis described in this table is consistent with the ITE methodology. When available, rates are based on “peak hour of adjacent street traffic.”
c Results are based on ITE trip generation methodology. d Results are based on MXD trip reduction analysis tool developed by Fehr & Peers. e Mode split for work trips is assumed to be 80% auto, 15% transit, and 5% walk/bike/others, whereas mode split for non-work trips is
assumed to be 70% auto, 10% transit, and 20% walk/bike/others. f ksf = thousand square feet. g No special event is assumed in the daily trip generation for the arena. SOURCE: Fehr & Peers, 2012

4. Environmental Setting, Impacts, and Mitigation Measures
4.N Traffic and Circulation
Brisbane Baylands 4.N-79 ESA / 206069 Draft EIR June 2013
TABLE 4.N-13 PROJECT DAILY PERSON TRIP GENERATION – CPP AND CPP-V
Land Use Size Units
ITE Land Use
Codea Rate or Eqn.b
Person-Trip Generation Total Net Vehicle Tripse
Raw Trips Totalc
Total Net Tripsd
Percent Reduction
Community Proposed Plan (CPP)
Non-Residential General Retail 2,210 ksff 820 Eqn 99,029 66,630 33% 22,243 General Office 993 ksf 710 Eqn 15,232 13,609 11% 5,659 Research & Develop. 2,007 ksf 760 Eqn 23,004 20,553 11% 8,547 Industrial / Warehouse 366 ksf 151 Rate 1,786 1,645 8% 823 Hotel 1,990 rooms 310 Rate 31,704 29,205 8% 14,615 Public / Civic / Cultural 189 ksf 814 Rate 16,308 14,533 11% 4,852 Conference /
Exhibition 275 ksf 814 Rate 23,723 21,142 11% 7,058
Entertainment Entertainment /
Cultural. 611 ksf 814 Rate 52,831 47,081 11% 15,717
Schools High School - students 530 Rate - - - - Elementary School - students 520 Rate - - - - Residential Apartment - Units 232 Eqn - - - - Multi-Family - Units 220 Eqn - - - -
Grand Total 263,617 214,398 19% 79,514
Community Proposed Plan – Recology Expansion Variant (CPP-V)
Non-Residential General Retail 2,210 ksf 820 Eqn 100,553 67,720 33% 22,562 General Office 993 ksf 710 Eqn 15,466 13,832 11% 5,743 Research & Develop. 1,672 ksf 760 Eqn 20,110 17,984 11% 7,467 Industrial/Warehouse 366 ksf 151 Rate 1,814 1,672 8% 836 Hotel 1,500 rooms 310 Rate 24,265 22,367 8% 11,180 Public / Civic / Cultural 189 ksf 814 Rate 16,559 14,771 11% 4,921 Conference /
Exhibition 275 ksf 814 Rate 24,088 21,487 11% 7,159
Resource Recoveryg 752 ksf - - - - - 636 Entertainment Entertainment /
Cultural 611 ksf 814 Rate 53,644 47,852 11% 15,943
Schools High School - students 530 Rate - - - - Elementary School - students 520 Rate - - - - Residential Apartment - Units 232 Eqn - - - - Multi-Family - Units 220 Eqn - - - -
Grand Total 256,499 207,685 19% 76,447
a Institute of Transportation Engineers, Trip Generation, 8th Edition (2008). b Trip Generation generally provides both average rates and fitted curve equations for forecasting trip generation. The choice of which
method to use is described in the Trip Generation Handbook. The analysis described in this table is consistent with the ITE methodology. When available, rates are based on “peak hour of adjacent street traffic.”
c Results based on ITE trip generation methodology. d Results based on MXD trip reduction analysis tool developed by Fehr & Peers. e Mode split for work trips is assumed to be 80% auto, 15% transit, and 5% walk/bike/others, whereas mode split for non-work trips is
assumed to be 70% auto, 10% transit, and 20% walk/bike/others. f ksf = thousand square feet. g Daily trip generation for the proposed expansion of the Recology recovery site is based on the trip generation study for the Recology
Master Plan conducted by Arup, 2011.
SOURCE: Fehr & Peers, 2012

4. Environmental Setting, Impacts, and Mitigation Measures
4.N Traffic and Circulation
Brisbane Baylands 4.N-80 ESA / 206069 Draft EIR June 2013
TABLE 4.N-14 PROJECT PEAK HOUR VEHICLE TRIP GENERATION – DSP AND DSP-V
Land Use Size Units
ITE Land Use
Codea Rate or Eqn.b
Net Vehicle Tripsc
AM Peak Hour PM Peak Hour
Total Trips In Out
Total Trips In Out
Developer-Sponsored Plan (DSP)
Non-Residential General Retail 566 ksfd 820 Eqn 195 119 76 437 214 223 General Office 2,651 ksf 710 Eqn 1,848 1,626 222 1,949 331 1,618 Research & Develop. 3,328 ksf 760 Eqn 1,940 1,610 330 1,470 221 1,250 Hotel 369 rooms 310 Rate 169 103 66 173 92 81 Public / Civic / Cultural 28 ksf 814 Rate 35 17 18 32 18 14
Conference / Exhibition
21 ksf 814 Rate 26 13 14 24 14 11
Schools High School 1,000 students 530 Rate 235 160 75 82 38 43 Elementary School 300 students 520 Rate 76 42 34 28 14 14 Residential Apartment 3,950 units 232 Eqn 686 130 556 621 385 236 Multi-Family 484 units 220 Eqn 141 28 113 130 84 45
Grand Total 5,351 3,848 1,504 4,946 1,411 3,535
Developer-Sponsored Plan – Entertainment Variant (DSP-V)
Non-Residential General Retail 283 ksf 820 Eqn 129 79 50 269 132 137 General Office 2,252 ksf 710 Eqn 1,615 1,421 194 1,630 277 1,353 Research & Develop. 2,599 ksf 760 Eqn 1,561 1,296 265 1,177 176 1,000 Hotel 719 rooms 310 Rate 329 201 128 330 175 155
Public / Civic / Cultural
28 ksf 814 Rate 35 17 18 32 18 14
Conference / Exhibition
74 ksf 814 Rate 90 43 47 82 46 36
Entertainment Movies/Theater 10 screens 445 Rate 0 0 0 106 48 58 Live Theater 5,500 seats 441 Rate 0 0 0 86 43 43 Arena e 630 ksf 460 Rate 0 0 0 38 19 19 Schools High School 1000 students 530 Rate 234 159 75 80 38 42 Elementary School 300 students 520 Rate 75 41 34 28 14 14 Residential Apartment 3,950 units 232 Eqn 685 130 555 701 435 266 Multi-Family 484 units 220 Eqn 137 27 110 138 90 48
Grand Totalf 4,890 3,414 1,476 4,697 1,511 3,185
a Institute of Transportation Engineers, Trip Generation, 8th Edition (2008). b Trip Generation generally provides both average rates and fitted curve equations for forecasting trip generation. The choice of which
method to use is described in the Trip Generation Handbook. The analysis described in this table is consistent with the ITE methodology. When available, rates are based on “peak hour of adjacent street traffic.”
c Results based on ITE trip generation methodology and MXD trip reduction analysis tool developed by Fehr & Peers. d ksf = thousand square feet. e Trip generation rates assume that special events at the arena do not occur during AM or PM peak hours. Under a scenario where a
special event starts and ends within the PM peak hour, the PM peak hour trips are projected to be 2,303 trips (2,285 inbound and 18 outbound trips).
f For the Entertainment Variant with special event scenario, the grand total PM trip generation is projected to be 7,132 trips (3,896 inbound and 3,235 outbound trips).
SOURCE: Fehr & Peers, 2012

4. Environmental Setting, Impacts, and Mitigation Measures
4.N Traffic and Circulation
Brisbane Baylands 4.N-81 ESA / 206069 Draft EIR June 2013
TABLE 4.N-15 PROJECT PEAK HOUR VEHICLE TRIP GENERATION – CPP AND CPP-V
Land Use Size Units
ITE Land Use
Codea Rate or Eqn.b
Net Vehicle Tripsc
AM Peak Hour PM Peak Hour
Total Trips In Out
Total Trips In Out
Community Proposed Plan (CPP)
Non-Residential General Retail 2,210 ksf d 820 Eqn 587 358 229 1,446 708 737 General Office 993 ksf 710 Eqn 957 842 115 866 147 719 Research & Develop. 2,007 ksf 760 Eqn 1,426 1,184 242 1,105 166 939 Industrial/Warehouse 366 ksf 151 Rate 51 30 21 85 43 42 Hotel 1,990 rooms 310 Rate 1,026 626 400 1,048 555 492
Public / Civic / Cultural
189 ksf 814 Rate 314 151 163 286 160 126
Conference / Exhibition
275 ksf 814 Rate 457 219 238 417 233 183
Entertainment
Entertainment / Cultural.
611 ksf 814 Rate 1,017 488 529 928 520 408
Schools High School - students 530 Rate - - - - - - Elementary School - students 520 Rate - - - - - - Residential Apartment - Units 232 Eqn - - - - - - Multi-Family - Units 220 Eqn - - - - - -
Grand Total 5,835 3,898 1,937 6,180 2,533 3,647
Community Proposed Plan – Recology Expansion Variant (CPP-V)
Non-Residential General Retail 2,210 ksf 820 Eqn 594 362 232 1,460 715 745 General Office 993 ksf 710 Eqn 968 852 116 875 149 726 Research & Develop. 1,672 ksf 760 Eqn 1,233 1,023 210 961 144 817
Industrial / Warehouse
366 ksf 151 Rate 51 30 21 86 44 42
Hotel 1,500 rooms 310 Rate 782 477 305 798 423 375
Public / Civic / Cultural
189 ksf 814 Rate 317 152 165 289 162 127
Conference / Exhibition
275 ksf 814 Rate 462 222 240 421 236 185
Resource Recoverye 752 ksf - - 47 25 22 20 10 10 Entertainment
Entertainment/ Cultural
611 ksf 814 Rate 990 455 535 937 525 412
Schools High School - students 530 Rate - - - - - - Elementary School - students 520 Rate - - - - - - Residential Apartment - units 232 Eqn - - - - - - Multi-Family - units 220 Eqn - - - - - -
Grand Total 5,444 3,598 1,846 5,847 2,408 3,439
a Institute of Transportation Engineers, Trip Generation, 8th Edition (2008). b Trip Generation generally provides both average rates and fitted curve equations for forecasting trip generation. The choice of which
method to use is described in the Trip Generation Handbook. The analysis described in this table is consistent with the ITE methodology. When available, rates are based on “peak hour of adjacent street traffic.”
c Results based on ITE trip generation methodology and MXD trip reduction analysis tool developed by Fehr & Peers. d ksf = thousand square feet. e AM and PM peak hour trip generation for the proposed expansion of the Recology recovery site is based on the trip generation study for
the Recology Master Plan conducted by Arup, 2011. SOURCE: Fehr & Peers, 2012
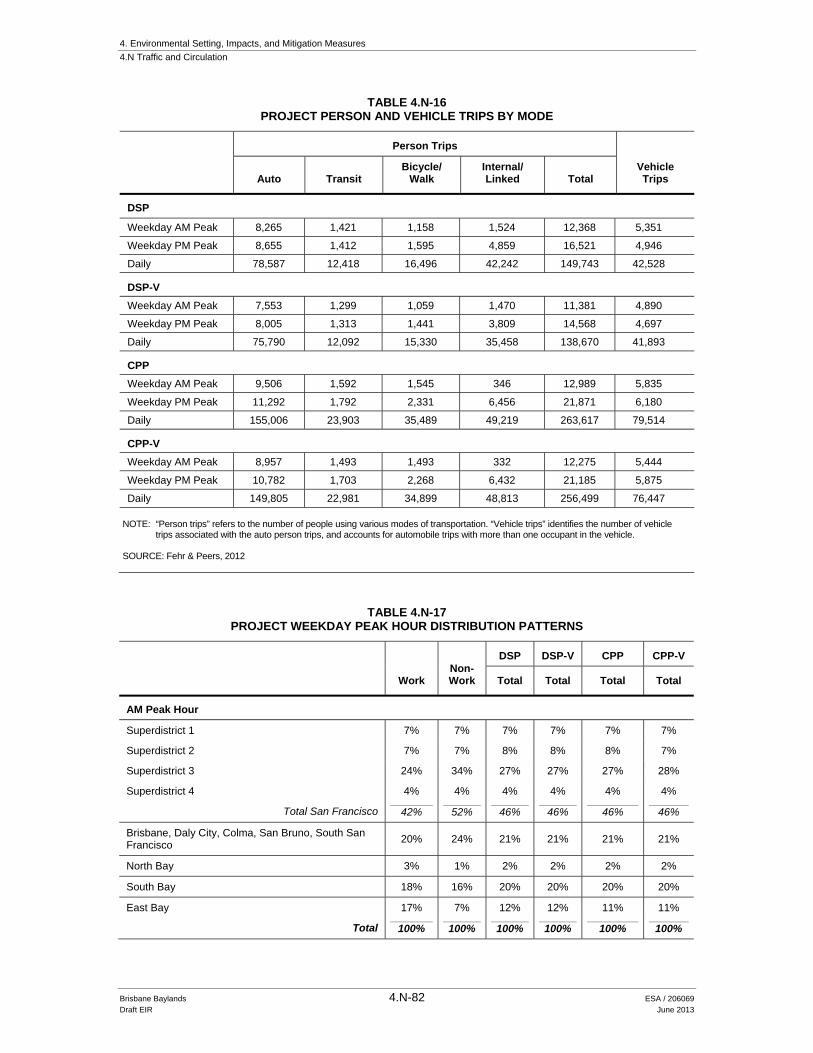
4. Environmental Setting, Impacts, and Mitigation Measures
4.N Traffic and Circulation
Brisbane Baylands 4.N-82 ESA / 206069 Draft EIR June 2013
TABLE 4.N-16 PROJECT PERSON AND VEHICLE TRIPS BY MODE
Person Trips
Vehicle Trips Auto Transit
Bicycle/ Walk
Internal/ Linked Total
DSP
Weekday AM Peak 8,265 1,421 1,158 1,524 12,368 5,351
Weekday PM Peak 8,655 1,412 1,595 4,859 16,521 4,946
Daily 78,587 12,418 16,496 42,242 149,743 42,528
DSP-V
Weekday AM Peak 7,553 1,299 1,059 1,470 11,381 4,890
Weekday PM Peak 8,005 1,313 1,441 3,809 14,568 4,697
Daily 75,790 12,092 15,330 35,458 138,670 41,893
CPP
Weekday AM Peak 9,506 1,592 1,545 346 12,989 5,835
Weekday PM Peak 11,292 1,792 2,331 6,456 21,871 6,180
Daily 155,006 23,903 35,489 49,219 263,617 79,514
CPP-V
Weekday AM Peak 8,957 1,493 1,493 332 12,275 5,444
Weekday PM Peak 10,782 1,703 2,268 6,432 21,185 5,875
Daily 149,805 22,981 34,899 48,813 256,499 76,447 NOTE: “Person trips” refers to the number of people using various modes of transportation. “Vehicle trips” identifies the number of vehicle
trips associated with the auto person trips, and accounts for automobile trips with more than one occupant in the vehicle. SOURCE: Fehr & Peers, 2012
TABLE 4.N-17 PROJECT WEEKDAY PEAK HOUR DISTRIBUTION PATTERNS
Work Non-Work
DSP DSP-V CPP CPP-V
Total Total Total Total
AM Peak Hour
Superdistrict 1 7% 7% 7% 7% 7% 7%
Superdistrict 2 7% 7% 8% 8% 8% 7%
Superdistrict 3 24% 34% 27% 27% 27% 28%
Superdistrict 4 4% 4% 4% 4% 4% 4%
Total San Francisco 42% 52% 46% 46% 46% 46%
Brisbane, Daly City, Colma, San Bruno, South San Francisco
20% 24% 21% 21% 21% 21%
North Bay 3% 1% 2% 2% 2% 2%
South Bay 18% 16% 20% 20% 20% 20%
East Bay 17% 7% 12% 12% 11% 11%
Total 100% 100% 100% 100% 100% 100%

4. Environmental Setting, Impacts, and Mitigation Measures
4.N Traffic and Circulation
Brisbane Baylands 4.N-83 ESA / 206069 Draft EIR June 2013
TABLE 4.N-17 (Continued) PROJECT WEEKDAY PEAK HOUR DISTRIBUTION PATTERNS
Work Non-Work
DSP DSP-V CPP CPP-V
Total Total Total Total
PM Peak Hour
Superdistrict 1 7% 7% 7% 7% 8% 8%
Superdistrict 2 7% 7% 8% 8% 8% 8%
Superdistrict 3 24% 34% 28% 28% 29% 29%
Superdistrict 4 4% 4% 4% 4% 4% 4%
Total San Francisco 42% 52% 47% 47% 49% 49%
Brisbane, Daly City, Colma, San Bruno, South San Francisco
20% 24% 21% 21% 22% 22%
North Bay 3% 1% 2% 2% 2% 2%
South Bay 18% 16% 19% 19% 19% 18%
East Bay 17% 7% 10% 11% 10% 10%
Total 100% 100% 100% 100% 100% 100%
SOURCE: Fehr & Peers, 2012
For trips outside of the immediate Project area and San Francisco, the highest share of work and non-work trips would be to the South Bay followed by the East Bay. For northern San Mateo County, which includes the areas immediately adjacent to the Project Site (cities of Brisbane, Daly City, San Bruno, and South San Francisco), 20 percent of work and 24 percent of non-work trips would have an origin or destination in this zone.
As described above, the mode split for work trips was assumed to be 80 percent by automobiles, 15 percent by transit, and 5 percent by walking, bicycling and other modes. The mode split for non-work trips was assumed to be 70 percent by automobiles, 10 percent by transit, and 20 percent by walking, bicycling, and other modes.
Arena Trip Generation (DSP-V Scenario only)
The number of person trips made by spectators to the proposed arena in the DSP-V scenario was analyzed for a special event. Trip generation was estimated based on the proposed 17,000 seats and a sell-out condition. The arena would be used for theater productions, concerts, speaking engagements, educational events, or sporting events. It is anticipated that up to 150 events per year could occur at the arena (e.g., Wednesday, Friday, and Saturday every week per year). Assuming an approximate weekday evening start time of about 7:00 PM, the weekday PM peak hour (5:00 to 6:00 PM) was analyzed for pre-event conditions to address transportation impacts associated with possible sold-out events occurring at the arena. Although no specific program has been developed for events at the arena, sell-out events with 17,000 attendees occurring during weekday evenings would likely be infrequent.

4. Environmental Setting, Impacts, and Mitigation Measures
4.N Traffic and Circulation
Brisbane Baylands 4.N-84 ESA / 206069 Draft EIR June 2013
The analysis of a sold-out event at the arena assumes that only regularly scheduled transit service would be provided and that only a small number of attendees would arrive by private charter bus. The analysis assumes that 15 to 20 percent of attendees would arrive by transit. Therefore, of the 17,000 spectators, 3,400 would be expected to arrive by transit and 13,600 would be expected to arrive via automobile. Table 4.N-18 summarizes the number of people onsite by mode of access and the number of pre-event transit and vehicle trips associated with a sell-out event. The number of vehicular trips was determined by dividing the number of attendees who arrive via automobile by the average vehicle occupancy rate. The average vehicle occupancy for spectators in a comparable arena in Candlestick Point was assumed to be 3.0 spectators per vehicle in the Candlestick Point-Hunters Point Shipyard Development Plan EIR. Assuming similar average vehicle occupancy for a sold-out event at the arena, the 13,600 people arriving via automobile would generate an additional 4,533 vehicles to the arena.
TABLE 4.N-18 PERSON AND VEHICLE TRIPS BY MODE FOR DSP-V WITH SELL-OUT EVENT AT ARENA
Person Trips
Vehicle Trips Auto Transit
Bicycle/ Walk
Internal/ Linked Total
DSP-V
Weekday PM Peak 8,005 1,313 1,441 3,809 14,568 4,697
Arena
Pre- Sell-Out Event 13,600 3,400 - - 17,000 4,533
Weekday PM Peak 6,800 1,700 - - 8,500 2,267
DSP-V with Sell-Out Event (Total)
Weekday PM Peak 14,805 3,013 1,441 3,809 23,068 6,964
SOURCE: Fehr & Peers, 2012
A technical paper prepared for presentation to the ITE found that approximately 25 percent of the total number of spectators at the comparable arena in Candlestick Point had been assumed to arrive within the one hour prior to the event start time, 50 percent would arrive within the second hour, and the remaining 25 percent would arrive within the third hour prior to the event start time (Farran and Menaker, 1997). Assuming similar arrival rates for the proposed arena, 2,267 vehicles and 1,700 transit trips would arrive between 5:00 and 6:00 PM for an event that begins at 7:00 PM. Consistent with the arrival time distribution assumed for the proposed arena within Candlestick Point, all employees would arrive earlier and would not affect the 5:00 to 6:00 PM peak hour. For purpose of this analysis, the geographic location of the attendees was assumed to be similar to that of the comparable arena in Candlestick Point, with 40 percent of attendees arriving from the South Bay, 16 percent from the East Bay, 14 percent from within San Francisco, 10 percent from the North Bay, and 20 percent from locations outside the Bay Area.

4. Environmental Setting, Impacts, and Mitigation Measures
4.N Traffic and Circulation
Brisbane Baylands 4.N-85 ESA / 206069 Draft EIR June 2013
Loading Demand
In the absence of loading demand rates specific to Brisbane and the close proximity of Brisbane to San Francisco Superdistrict 3, it is reasonable to use demand rates published in the SF Guidelines for the same land use types to calculate the demand associated with each analysis scenario. Daily truck trips were calculated and then converted to average hourly demand (based on a 9-hour day and a 25-minute average stay), and to peak hour demand by applying a peaking factor of 1.25. Table 4.N-19 presents the projected number of trucks generated by the land uses proposed for Project scenarios on a daily basis, and the demand for loading dock spaces during the peak hour of loading activities.
TABLE 4.N-19 PROJECT LOADING DEMAND
Project Daily Truck Generation Peak Hour Loading
Dock Space Demand
DSP 1,418 82
DSP-V 1,252 72
CPP 1,587 92
CPP-Va 1,485 86
a CPP-V excludes Recology site demand due to unique truck activity at the site that is atypical of normal loading activities. Unique truck activity was captured in the traffic impact analysis.
SOURCE: Fehr & Peers, 2012
Transit Capacity Utilization Analysis Methodology
Based on the transit impact criteria, as defined by the City of Brisbane, the impact of additional transit ridership that would be generated by development of the Project Site was assessed based on transit capacity. This analysis incorporated a “Transit Capacity Utilization” methodology used by the City and County of San Francisco. The methodology refers to transit riders as a percentage of the capacity of a transit line, or group of lines combined and analyzed as cordons or screenlines across which transit lines travel.13
Regional Transit Screenlines
Regional transit capacity, based on the anticipated distribution of Project Site development-related trips via BART and Caltrain, was evaluated where regional transit services enter San Francisco, at the following two screenline locations:
East Bay (BART only)
South Bay (BART and Caltrain only).
13 The San Francisco analysis methodology does not distinguish between peak direction and reverse peak direction
trips (because the focus of the analysis in San Francisco is typically geared toward assessing transit capacity utilization outbound from downtown San Francisco (the peak commute direction during the PM peak hour). The likely trip pattern for Project Site development trips within San Francisco would include a substantial number of “reverse peak” transit trips, so in that regard the screenline methodology may overstate the Project Site development impact at the San Francisco transit screenlines.

4. Environmental Setting, Impacts, and Mitigation Measures
4.N Traffic and Circulation
Brisbane Baylands 4.N-86 ESA / 206069 Draft EIR June 2013
All of the regional transit operators except BART have a 1-hour load factor standard of 100 percent, which would indicate that all seats are full. BART has a peak period load factor standard of 115 percent, which indicates that all seats are full and an additional 15 percent of the seating capacity is standees (i.e., 1.15 passengers per seat). The regional screenline analysis, where applied for this study, is based on the methodology prescribed for San Francisco projects (as described in the CPHPS EIR).
San Francisco Muni Transit Screenlines
San Francisco transit capacity was evaluated based on the Existing and Cumulative Without Project ridership volumes and screenline capacities at the four standard San Francisco screenline locations (described in the CPHPS EIR).
The San Francisco Muni capacity methodology includes seated passengers and an appreciable number of standing passengers per vehicle (the number of standing passengers is between 30 and 80 percent of the seated passengers depending upon the specific transit vehicle configuration). The maximum loads, including both seated and standing passengers, vary by vehicle type and are 45 passengers for a 30-foot bus, 63 passengers for a 40-foot bus, 94 passengers for a 60-foot bus, and 119 passengers for a light-rail vehicle. The percent utilization of capacity was then calculated by comparing the ridership demand to the capacity provided. Muni has established a capacity utilization standard of 85 percent.
Project Trip Distribution and Assignment of Transit Trips
Based on the trip generation and trip assignment forecast that identified the origin and destination pattern for travel demand generated by Project Site development, the distribution and assignment pattern for transit trips was extrapolated as summarized on the following tables:
Transit trip distribution by origin/destination is shown in Table 4.N-20;
Transit trip distribution by transit corridor is shown in Table 4.N-21;
Transit trip distribution by transit operator and corridor is shown in Table 4.N-22;
Daily transit trip assignment is shown in Table 4.N-23; and
PM peak hour transit trip assignment is shown in Table 4.N-24.
The DSP and DSP-V scenarios would generate a higher portion of transit trips to and from downtown San Francisco (located within San Francisco Superdistrict 1 as defined for transportation analysis purposes) compared to the CPP and CPP-V scenarios as the result of trips to work in downtown San Francisco by Baylands residents in the DSP and DSP-V scenarios.

4. Environmental Setting, Impacts, and Mitigation Measures
4.N Traffic and Circulation
Brisbane Baylands 4.N-87 ESA / 206069 Draft EIR June 2013
TABLE 4.N-20 TRANSIT TRIP DISTRIBUTION BY ORIGIN/DESTINATION
Origin/Destination
Proposed Project Scenarios (% Distribution)
DSP DSP-V CPP CPP-V
Brisbane, Daly City, Colma, San Bruno, South San Francisco 18% 18% 20% 20%
Rest of Peninsula & South Bay 18% 18% 20% 20%
East Bay 10% 10% 11% 11%
North Bay 0% 0% 0% 0%
San Francisco Superdistrict 1 (Northeast SF) 19% 19% 8% 8%
San Francisco Superdistrict 2 (Northwest SF) 6% 6% 8% 8%
San Francisco Superdistrict 3 (Southeast SF) 25% 25% 28% 28%
San Francisco Superdistrict 4 (Southwest SF) 4% 4% 5% 5%
Total 100% 100% 100% 100%
a Transit trip distribution for the CPP and CPP-V scenarios was derived from motor vehicle trip distribution. b Transit trip distribution for the DSP and DSP-V scenarios applied the same method, but with a higher rate of transit ridership to/from
downtown San Francisco (located within Superdistrict 1) given the proposed residential land uses under the DSP and DSP-V scenarios.
SOURCE: Nelson\Nygaard, 2012
TABLE 4.N-21 TRANSIT TRIP DISTRIBUTION BY TRANSIT CORRIDOR
Transit Corridor
Proposed Project Scenarios (% Distribution)
DSP DSP-V CPP CPP-V
San Francisco (via Caltrain) 25% 25% 16% 16%
San Francisco (via Muni T-line) 13% 13% 14% 14%
San Francisco (via Muni San Bruno Avenue buses) 4% 4% 4% 4%
San Francisco CP/HP (via Proposed Muni CP/HP BRT) 8% 8% 10% 10%
San Francisco & Daly City, Colma (via Muni Geneva and transfers) 13% 13% 15% 15%
Subtotal San Francisco & Daly City/Colma 63% 63% 59% 59%
Brisbane (via Alliance shuttle) 2% 2% 1% 1%
San Mateo County (via SamTrans) 1% 1% 1% 1%
San Mateo County & South Bay (via Caltrain) 24% 24% 28% 28%
Subtotal Peninsula & South Bay (excluding Daly City/Colma) 27% 27% 30% 30%
East Bay (via Muni Geneva corridor and BART) 10% 10% 11% 11%
East Bay (via South San Francisco Ferry) 0% 0% 0% 0%
Subtotal East Bay 10% 10% 11% 11%
North Bay (via Caltrain to Golden Gate ferry or bus) 0% 0% 0% 0%
TOTAL 100% 100% 100% 100%
SOURCE: Nelson\Nygaard, 2012

4. Environmental Setting, Impacts, and Mitigation Measures
4.N Traffic and Circulation
Brisbane Baylands 4.N-88 ESA / 206069 Draft EIR June 2013
TABLE 4.N-22 TRANSIT TRIP DISTRIBUTION BY TRANSIT OPERATOR AND CORRIDOR
Operator and Corridor
Proposed Project Scenarios (% Distribution)
DSP DSP-V CPP CPP-V
Caltrain (to/from north) 25% 25% 16% 16%
Caltrain (to/from south) 24% 24% 28% 28%
Total Caltrain 49% 49% 44% 44%
Muni (Geneva to/from west) 23% 23% 26% 26%
Muni (T-line to/from north) 13% 13% 14% 14%
Muni (San Bruno Avenue to/from north) 4% 4% 4% 4%
Muni (to/from Candlestick Point/Hunters Point) 8% 8% 10% 10%
Total Muni 48% 48% 54% 54%
SamTrans (via direct service to Project Site) 1% 1% 1% 1%
Alliance Shuttle 2% 2% 1% 1%
South San Francisco Ferry 0% 0% 0% 0%
TOTAL 100% 100% 100% 100%
SOURCE: Nelson\Nygaard, 2012
TABLE 4.N-23 DAILY TRANSIT TRIP ASSIGNMENT BY TRANSIT OPERATOR AND CORRIDOR
Transit Operator and Corridor
Proposed Project Scenarios (Trips)
DSP DSP-V CPP CPP-V
Caltrain (to/from north) 3,105 3,023 3,824 3,677
Caltrain (to/from south) 2,980 2,902 6,693 6,435
Total Caltrain 6,085 5,925 10,517 10,112
Muni (Geneva to/from west and BART) 2,856 2,781 6,215 5,975
Muni (T-line to/from north) 1,614 1,572 3,346 3,217
Muni (San Bruno Avenue to/from north) 497 484 956 919
Muni (to/from Candlestick Point/Hunters Point) 993 967 2,390 2,298
Total Muni 5,961 5,804 12,908 12,410
SamTrans (via direct service to Project Site) 124 121 239 230
Alliance Shuttle 248 242 239 230
South San Francisco Ferry 0 0 0 0
TOTAL 12,418 12,092 23,903 22,981
SOURCE: Nelson\Nygaard, 2012

4. Environmental Setting, Impacts, and Mitigation Measures
4.N Traffic and Circulation
Brisbane Baylands 4.N-89 ESA / 206069 Draft EIR June 2013
TABLE 4.N-24 TRANSIT TRIP ASSIGNMENT (PM PEAK HOUR TRIPS)
Transit Operator and Corridor
Proposed Project Scenarios (PM Peak Trips)
DSP DSP-V CPP CPP-V
Caltrain (inbound from north) 104 107 119 114
Caltrain (outbound to north) 249 222 168 159
TOTAL (Caltrain NORTH) 353 328 287 272
Caltrain (inbound from south) 100 102 208 199
Caltrain (outbound to south) 239 213 293 278
SCREENLINE (Caltrain SOUTH) 339 315 502 477
Total Caltrain 692 643 788 749
Muni (Muni Geneva inbound from west) 96 98 193 185
Muni (Muni Geneva outbound to west) 229 204 272 258
TOTAL (Muni Geneva WEST) 325 302 466 443
Muni (T-line inbound from north) 54 55 104 100
Muni (T-line outbound to north)) 129 115 147 139
TOTAL (Muni Third Street T-Line) 184 171 251 238
Muni (San Bruno Avenue inbound from north) 17 17 30 28
Muni (San Bruno Avenue outbound to north) 40 35 42 40
TOTAL (Muni San Bruno Avenue) 56 53 72 68
SCREENLINE (Muni Third Street / San Bruno Avenue) 240 223 323 307
Muni (inbound from Candlestick Point/Hunters Point) 33 34 74 71
Muni (outbound to Candlestick Point/Hunters Point) 80 71 105 99
TOTAL (Muni to/from Candlestick Point/Hunters Point) 113 105 179 170
Total Muni 678 630 968 920
SamTrans (Bayshore inbound from south) 4 4 7 7
SamTrans (Bayshore outbound to south) 10 9 10 10
SamTrans (Bayshore total) 14 13 18 17
Alliance Shuttle inbound from Brisbane (west of Bayshore) 8 9 7 7
Alliance Shuttle outbound to Brisbane (west of Bayshore) 20 18 10 10
Alliance Shuttle 28 26 18 17
South San Francisco Ferry 0 0 0 0
TOTAL INBOUND 416 426 744 711
TOTAL OUTBOUND 996 887 1,048 992
TOTAL PEAK HOUR TRANSIT TRIPS 1,412 1,313 1,792 1,703
SOURCE: Nelson\Nygaard, 2012
Project Impacts and Mitigation Measures
The impact analysis below is presented as (1) a combined assessment (i.e., “Existing plus Project and Cumulative With Project”) if the impact determination for Project Site development would be the same for both the baseline (2010) and Cumulative (2030) contexts, or (2) as separate assessments (i.e., “Existing plus Project,” followed by “Cumulative With Project”) if the Project Site development impact determination would be different for the baseline (2010) context versus

4. Environmental Setting, Impacts, and Mitigation Measures
4.N Traffic and Circulation
Brisbane Baylands 4.N-90 ESA / 206069 Draft EIR June 2013
the cumulative (2030) context. Throughout the following analysis, “Project Site development” is used to refer to development of the Project Site under any of the four proposed development scenarios. Where impacts differ by scenario, the distinction is noted.
Conflict with an Applicable Plan, Ordinance, or Policy Establishing a Measure of Effectiveness for the Performance of the Circulation System
Traffic Conditions (Existing plus Project)
Impact 4.N-1: Would the Project result in a substantial increase in traffic under Existing plus Project conditions at intersections in the vicinity of the Project Site?
An intersection level of service analysis was prepared for traffic operations at 18 intersections for Existing conditions. Impacts under each of the four development scenarios were assessed by comparing Existing conditions with the Existing plus Project conditions and applying the roadway performance standards established by the City of Brisbane.14
Table 4.N-25 and Table 4.N-26 present a comparison of the intersection LOS analysis for Existing and Existing plus Project conditions for the weekday AM and PM peak hours, respectively. The tables show that 17 of the 18 study intersections currently operate at acceptable levels of service, and that the following 12 study intersections would continue to operate acceptably under Existing plus Project conditions.15
2. Guadalupe Canyon Parkway & Bayshore Boulevard 3. Valley Drive & Bayshore Boulevard 6. Sierra Point Parkway & US 101 Southbound Ramps 7. Lagoon Way & Tunnel Avenue 8. Lagoon Way & Sierra Point Parkway 11. Jamestown Avenue & Third Street 13. Blanken Avenue & Tunnel Avenue 14. Blanken Avenue & Bayshore Boulevard 15. Sunnydale Avenue & Bayshore Boulevard 16. Geneva Avenue & Carter Street 17. Geneva Avenue & Mission Street 18. E. Market Street & Orange Street
14 LOS standards for the City of Brisbane are LOS D for signalized and unsignalized intersections with the exception
of Old County Road & Bayshore Boulevard and San Bruno Avenue & Bayshore Boulevard, where the standard is LOS C.
15 The analysis of Existing plus Project conditions assumes typical traffic conditions (i.e., not those conditions when the proposed arena under the DSP-V scenario would have a weekday evening sell-out event). Traffic impacts resulting from an infrequent occurrence of a weekday evening special event at the arena are described separately in Impact 4.N-5.
Impact Significance by Scenario (before Mitigation)
DSP DSP-V CPP CPP-V
SU SU SU SU
SU = Significant Unavoidable SM = Significant but Mitigable LTS = Less than Significant - = no impact

4. Environmental Setting, Impacts, and Mitigation Measures
4.N Traffic and Circulation
Brisbane Baylands 4.N-91 ESA / 206069 Draft EIR June 2013
TABLE 4.N-25 INTERSECTION LEVEL OF SERVICE – EXISTING AND EXISTING PLUS PROJECT CONDITIONS – WEEKDAY AM PEAK HOUR
Intersectiona
Existing DSP DSP-V CPP CPP-V
Impact LOS after MitigationDelayb LOS Delay LOS Delay LOS Delay LOS Delay LOS
1 Geneva Avenue/ Bayshore Boulevard
25 C >80 F >80 F 62 E 60 E SU D
2 Guadalupe Canyon Pkwy/ Bayshore Boulevard
15 B 26 C 25 C 18 B 18 B - -
3 Valley Drive/ Bayshore Boulevard
16 B 21 C 20 C 19 B 19 B - -
4 Old County Road/ Bayshore Boulevard
31 C 45 D 41 D 50 D 46 D SMd/SUe C
5 San Bruno Avenue/ Bayshore Boulevard
29 D(EB) >50 F(EB) >50 F(EB) 37 E(EB) 37 E(EB) LTS -
6 Sierra Point Parkway/ US 101 NB Ramps
20 C(NB) 21 C(NB) 20 C(NB) 20 C(NB) 19 C(NB) - -
7 Lagoon Way/Tunnel Avenue <10 A 12 B(NB) 11 B(NB) 14 B(NB) 13 B(NB) - -
8 Lagoon Way/Sierra Point Pkwy
<10 A(WB) 14 B(NB) 13 B(NB) 12 B(NB) 12 B(WB) - -
9 Beatty Road/Alana Way/ US 101 SB Ramps
10 B(EB) >50 F(WB) >50 F(WB) >50 F(WB) >50 F(WB) SU D
10 Harney Way/Alana Wy/ Thomas Mellon Drive
<10 A 19 C(NB) 17 C(NB) >50 F(NB) >50 F(NB) SU D
11 Jamestown Avenue/Third Street
19 B 17 B 17 B 17 B 17 B - -
12 Tunnel Avenue/ Bayshore Boulevard
27 C 74 E 66 E 76 E 66 E SU D
13 Blanken Avenue/ Tunnel Avenue c <10 A 13 B(SB) 13 B(SB) 17 C(SB) 15 C(NB) - -
14 Blanken Avenue/ Bayshore Boulevard
<10 A <10 A <10 A 11 B 11 B - -
15 Sunnydale Avenue/ Bayshore Boulevard
19 B 29 C 28 C 25 C 24 C - -
16 Geneva Avenue/Carter Street 28 C 39 D 37 D 39 D 37 D - -

4. Environmental Setting, Impacts, and Mitigation Measures
4.N Traffic and Circulation
Brisbane Baylands 4.N-92 ESA / 206069 Draft EIR June 2013
TABLE 4.N-25 (Continued) INTERSECTION LEVEL OF SERVICE – EXISTING AND EXISTING PLUS PROJECT CONDITIONS – WEEKDAY AM PEAK HOUR
Intersectiona
Existing DSP DSP-V CPP CPP-V
Impact LOS after MitigationDelayb LOS Delay LOS Delay LOS Delay LOS Delay LOS
17 Geneva Avenue/Mission Street
18 B 31 C 28 C 32 C 29 C - -
18 E. Market Street/Orange Street
12 B(EB) 14 B(EB) 13 B(EB) 14 B(EB) 14 B(EB) - -
a Intersections operating at unacceptable level of service (LOS) conditions highlighted in bold. b Delay in seconds per vehicle. For Side Street STOP-controlled intersections, delay and LOS presented for worst approach. Worst approach indicated in ( ). c The intersection of Blanken Avenue & Tunnel Avenue would be adversely affected under the DSP-V with weekday evening sell-out event at the arena. d DSP and DSP-V scenarios only. e CPP and CPP-V scenarios only. f DSP-V scenario only. g DSP, CPP, and CPP-V scenarios only. - = No Impact LTS = Less than Significant SM = Significant but Mitigable SU = Significant Unavoidable
SOURCE: Fehr & Peers, 2012

4. Environmental Setting, Impacts, and Mitigation Measures
4.N Traffic and Circulation
Brisbane Baylands 4.N-93 ESA / 206069 Draft EIR June 2013
TABLE 4.N-26 INTERSECTION LEVEL OF SERVICE – EXISTING AND EXISTING PLUS PROJECT CONDITIONS – WEEKDAY PM PEAK HOURa
Intersectiona
Existing DSP DSP-V CPP CPP-V
Impact LOS after Mitigation Delayb LOS Delay LOS Delay LOS Delay LOS Delay LOS
1 Geneva Avenue/ Bayshore Boulevard
24 C >80 F 79 E 72 E 69 E SU D
2 Guadalupe Canyon Pkwy/ Bayshore Boulevard
13 B 16 B 16 B 16 B 16 B - -
3 Valley Drive/ Bayshore Boulevard
13 B 16 B 16 B 14 B 14 B - -
4 Old County Road/ Bayshore Boulevard
30 C 43 D 42 D 54 D 51 D SMd/SUe C
5 San Bruno Avenue/Bayshore Boulevard
27 D(EB) 45 E(EB) 44 E(EB) 37 E(EB) 37 E(EB) LTS -
6 Sierra Point Parkway/ US 101 NB Ramps
<10 A(NB) 12 B(NB) 12 B(NB) 12 B(NB) 12 B(NB) - -
7 Lagoon Way/ Tunnel Avenue <10 A 11 B(WB) 11 B(WB) 13 B(NB) 13 B(NB) - -
8 Lagoon Way/Sierra Point Pkwy
12 B(NB) 17 C(EB) 15 C(NB) 14 B(NB) 14 B(NB) - -
9 Beatty Road/Alana Way/ US 101 SB Ramps
<10 A(SB) >50 F(EB) >50 F(EB) >50 F(EB) >50 F(EB) SMd/SUe D
10 Harney Way/ Alana Way/ Thomas Mellon Drive
<10 A >50 F(EB) >50 F(EB) >50 F(EB) >50 F(EB) SMd/SUe D
11 Jamestown Avenue/ Third Street
18 B 16 B 16 B 16 B 16 B - -
12 Tunnel Avenue/ Bayshore Boulevard
20 B >80 F >80 F >80 F >80 F SU D
13 Blanken Avenue/ Tunnel Avenue c <10 A 12 B(NB) 12 B(NB) 16 C(NB) 14 B(NB) - -
14 Blanken Avenue/ Bayshore Boulevard
11 B 11 B 11 B 13 B 13 B - -
15 Sunnydale Avenue/ Bayshore Boulevard
20 C 30 C 31 C 26 C 25 C - -

4. Environmental Setting, Impacts, and Mitigation Measures
4.N Traffic and Circulation
Brisbane Baylands 4.N-94 ESA / 206069 Draft EIR June 2013
TABLE 4.N-26 (Continued) INTERSECTION LEVEL OF SERVICE – EXISTING AND EXISTING PLUS PROJECT CONDITIONS – WEEKDAY PM PEAK HOURa
Intersection
Existing DSP DSP-V CPP CPP-V
Impact LOS after Mitigation Delayb LOS Delay LOS Delay LOS Delay LOS Delay LOS
16 Geneva Avenue/ Carter Street
31 C 30 C 31 D 32 C 32 C - -
17 Geneva Avenue Mission Street
20 C 43 D 38 D 54 D 48 D - -
18 E. Market Street/Orange Street
<10 A <10 A(WB) <10 A(WB) <10 A(WB) <10 A(WB) - -
a Intersections operating at unacceptable level of service (LOS) conditions highlighted in bold. b Delay in seconds per vehicle. For Side Street STOP-controlled intersections, delay and LOS presented for worst approach. Worst approach indicated in ( ). c The intersection of Blanken Avenue & Tunnel Avenue would be adversely affected under the DSP-V with weekday evening sell-out event at the arena. d DSP and DSP-V scenarios only. e CPP and CPP-V scenarios only. f DSP-V scenario only. g DSP, CPP, and CPP-V scenarios only. - = No Impact LTS = Less than Significant SM = Significant but Mitigable SU = Significant Unavoidable
SOURCE: Fehr & Peers, 2012

4. Environmental Setting, Impacts, and Mitigation Measures
4.N Traffic and Circulation
Brisbane Baylands 4.N-95 ESA / 206069 Draft EIR June 2013
Below is a discussion of the significant impacts found at study intersections based on the significance thresholds presented previously. Mitigation measures are recommended.
Impact at San Bruno Avenue & Bayshore Boulevard (Intersection 5)
The unsignalized intersection of San Bruno Avenue & Bayshore Boulevard (#5) currently operates at LOS D on the eastbound approach during the AM and PM peak hours, which is worse than the LOS C standard established by the Brisbane General Plan for this intersection.16 The eastbound left-turn movement incurs the most delay at this side street stop-controlled intersection, causing the intersection operate below the LOS standard. With implementation of any of the proposed development scenarios, the intersection would operate at LOS E or F. However, the intersection does not meet the criteria for the Caltrans peak hour signal warrant under Existing plus Project conditions, and Project Site development would add less than 5 percent of trips to the critical movement on the eastbound approach. Therefore, the impact on the intersection of San Bruno Avenue & Bayshore Boulevard under Existing plus Project conditions would be less than significant for all proposed development scenarios.
Impact at Geneva Avenue and Bayshore Boulevard (Intersection 1)
At the signalized intersection of Geneva Avenue & Bayshore Boulevard, intersection operating conditions would worsen in the AM peak hour from LOS C under Existing conditions to LOS F under Existing plus Project with the DSP or DSP-V scenario and to LOS E with the CPP or CPP-V scenario, resulting in a significant impact. In the PM peak hour, the intersection would worsen from LOS C to LOS F with implementation of the DSP scenario and to LOS E for the DSP-V, CPP, and CPP-V scenarios.
Vehicular traffic to and from the Project Site generated by the development scenarios was distributed to Bayshore Boulevard site access points based on Project site development land use layout and internal circulation system.
Conclusion: At the signalized intersection of Geneva Avenue & Bayshore Boulevard (#1), the addition of Project-generated traffic to existing volumes under each development scenario (DSP, DSP-V, CPP, and CPP-V) would result in significant AM and PM peak hour traffic impacts. Mitigation Measure 4.N-1a below is recommended.
Mitigation
Mitigation Measure 4.N-1a: Prior to issuance of the first building occupancy permit for new development within the Project Site other than relocation or improvement of an existing use, the eastbound approach on Geneva Avenue to Bayshore Boulevard shall be restriped to create one additional through lane. One of the existing two right-turn lanes shall also be modified to become a
16 As noted in Section 4.I, Land Use and Planning, each of the Project Site development scenarios are inconsistent
with the General Plan in that they result in levels of service in excess of General Plan standards.
Mitigation Measure Applicability by Scenario
DSP DSP-V CPP CPP-V
= measure applies - = measure does not apply
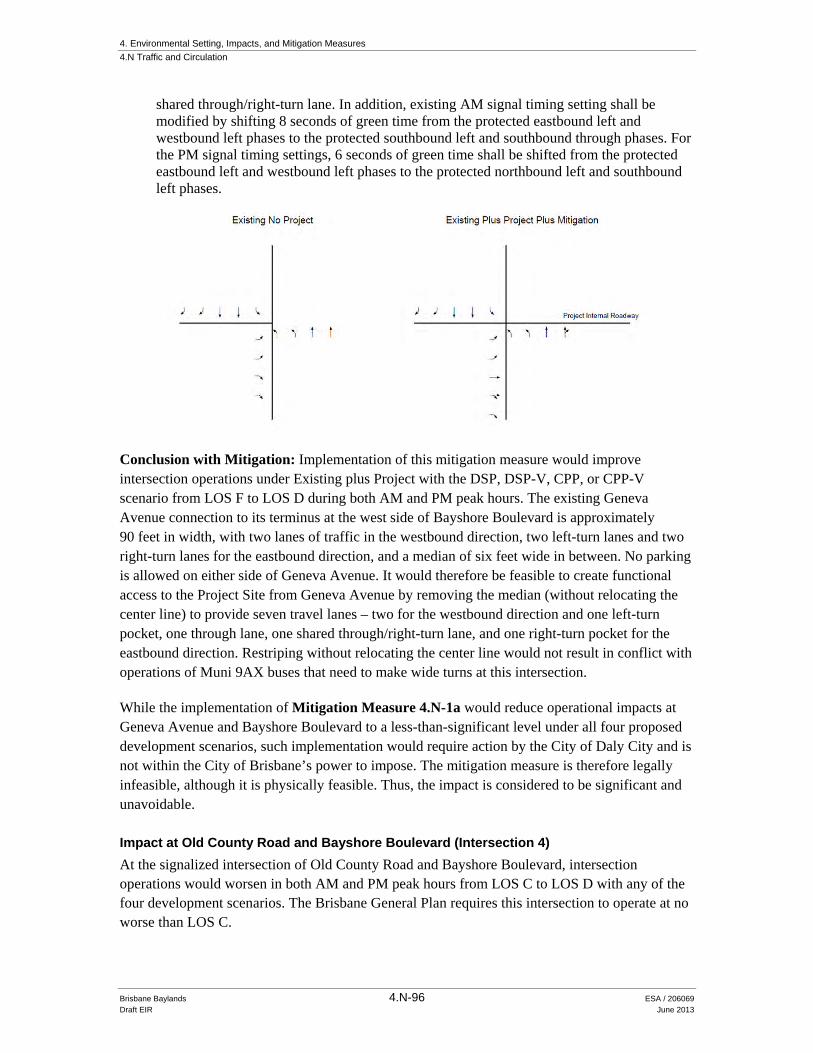
4. Environmental Setting, Impacts, and Mitigation Measures
4.N Traffic and Circulation
Brisbane Baylands 4.N-96 ESA / 206069 Draft EIR June 2013
shared through/right-turn lane. In addition, existing AM signal timing setting shall be modified by shifting 8 seconds of green time from the protected eastbound left and westbound left phases to the protected southbound left and southbound through phases. For the PM signal timing settings, 6 seconds of green time shall be shifted from the protected eastbound left and westbound left phases to the protected northbound left and southbound left phases.
Conclusion with Mitigation: Implementation of this mitigation measure would improve intersection operations under Existing plus Project with the DSP, DSP-V, CPP, or CPP-V scenario from LOS F to LOS D during both AM and PM peak hours. The existing Geneva Avenue connection to its terminus at the west side of Bayshore Boulevard is approximately 90 feet in width, with two lanes of traffic in the westbound direction, two left-turn lanes and two right-turn lanes for the eastbound direction, and a median of six feet wide in between. No parking is allowed on either side of Geneva Avenue. It would therefore be feasible to create functional access to the Project Site from Geneva Avenue by removing the median (without relocating the center line) to provide seven travel lanes – two for the westbound direction and one left-turn pocket, one through lane, one shared through/right-turn lane, and one right-turn pocket for the eastbound direction. Restriping without relocating the center line would not result in conflict with operations of Muni 9AX buses that need to make wide turns at this intersection.
While the implementation of Mitigation Measure 4.N-1a would reduce operational impacts at Geneva Avenue and Bayshore Boulevard to a less-than-significant level under all four proposed development scenarios, such implementation would require action by the City of Daly City and is not within the City of Brisbane’s power to impose. The mitigation measure is therefore legally infeasible, although it is physically feasible. Thus, the impact is considered to be significant and unavoidable.
Impact at Old County Road and Bayshore Boulevard (Intersection 4)
At the signalized intersection of Old County Road and Bayshore Boulevard, intersection operations would worsen in both AM and PM peak hours from LOS C to LOS D with any of the four development scenarios. The Brisbane General Plan requires this intersection to operate at no worse than LOS C.

4. Environmental Setting, Impacts, and Mitigation Measures
4.N Traffic and Circulation
Brisbane Baylands 4.N-97 ESA / 206069 Draft EIR June 2013
As discussed above, Old County Road is one of the six proposed major access points on Bayshore Boulevard for Project Site-generated trips. Most vehicular traffic to and from the Project Site has been distributed to these six Bayshore Boulevard access points based on Project site development land use layout and internal circulation system.
Conclusion: At the signalized intersection of Old County Road and Bayshore Boulevard (#4), the addition of Project Site development-generated traffic to existing volumes under each development scenario (DSP, DSP-V, CPP, and CPP-V) would result in significant AM and PM peak hour traffic impacts. Mitigation Measure 4.N-1b below is recommended.
Mitigation
Mitigation Measure 4.N-1b: Prior to issuance of the first building occupancy permit for new development other than improvement or relocation of an existing use, the intersection of Bayshore Boulevard and Old County Road shall be improved, including modifications to the tunnel to provide additional lanes and modify signal timing to improve intersection operations to achieve, at a minimum, LOS C during both AM and PM peak hours under the DSP and DSP-V scenarios and ensure that LOS remains at LOS D or better under the CPP and CPP-V scenarios.
Conclusion with Mitigation: An evaluation of engineering design considerations to mitigate traffic impacts at this intersection indicated that needed improvements might not be feasible without removal of the existing median at this location. Even with removal of the median, improvements at this intersection under the CPP and CPP-V scenarios would result in LOS D traffic conditions. Thus, to provide flexibility for the design of needed improvements at this intersection, a performance standard rather than a prescriptive mitigation measure is proposed.
Implementation of this mitigation measure would improve operations at the intersection under Existing plus Project conditions with the DSP and DSP-V scenarios to acceptable levels (LOS C) during both AM and PM peak hours. Under the CPP and CPP-V scenarios, LOS would remain at LOS D, exceeding the LOS C standard. Therefore, with the inclusion of Mitigation Measure 4.N-1b, operational impacts at Old County Road & Bayshore Boulevard would be less than significant under the DSP and DSP-V scenarios and significant and unavoidable under the CPP and CPP-V scenarios.
Impact at Alana Way and Beatty Road & US 101 Southbound Ramps (Intersection 9)
At the existing interchange, which includes the all-way stop-controlled intersection of Alana Way, Beatty Road, and US 101 Southbound Ramps, intersection operations would worsen in both AM and PM peak hours from LOS B and LOS A, respectively, to LOS F under Existing plus Project conditions under all four development scenarios. Project Site development-generated trips originating from US 101 southbound would exit at the interchange at Alana Way and Beatty Road and result in substantial increase in traffic volumes on the critical westbound through movement.
Mitigation Measure Applicability by Scenario
DSP DSP-V CPP CPP-V
= measure applies - = measure does not apply

4. Environmental Setting, Impacts, and Mitigation Measures
4.N Traffic and Circulation
Brisbane Baylands 4.N-98 ESA / 206069 Draft EIR June 2013
Conclusion: At the unsignalized intersection of Alana Way, Beatty Road, and US 101 Southbound Ramps (#9), the addition of Project Site development-generated traffic to existing volumes under each development scenario (DSP, DSP-V, CPP, and CPP-V) would result in significant AM and PM peak hour traffic impacts. Mitigation Measure 4.N-1c below is therefore recommended.
Mitigation
Mitigation Measure 4.N-1c: Prior to issuance of the first building occupancy permit for new development other than for improvement or relocation of an existing use, the intersection of Alana Way/Beatty Road/US 101 Southbound Ramps shall be signalized and longer green time shall be allowed for the eastbound/westbound traffic than for the northbound/southbound traffic. In addition, the southbound (Alana Way) approach shall be restriped to provide an additional exclusive right-turn pocket, and the westbound (off-ramp) approach shall be restriped to provide an additional through lane to increase the capacity at the off-ramp.
Conclusion with Mitigation: While implementation of this mitigation measure would improve the operations at this intersection from LOS F to acceptable (LOS C) levels for both the AM and PM peak hours under the DSP and DSP-V scenarios, operations under the CPP and CPP-V scenarios improve, but remain at an unacceptable LOS E. Therefore, with the inclusion of Mitigation Measure 4.N-1c, operational impacts at the Alana Way, Beatty Road, and US 101 Southbound Ramps would be less than significant under the DSP and DSP-V scenarios and would be significant and unavoidable under the CPP and CPP-V scenarios. However, implementation of this recommended mitigation measure is beyond Brisbane’s jurisdiction and requires Caltrans approval. This measure is therefore legally infeasible, although it is physically feasible As a result, operational impacts at the Alana Way, Beatty Road, and US 101 Southbound Ramps are considered to be significant and unavoidable.
Impact at Alana Way, Harney Way, and Thomas Mellon Drive (Intersection 10)
At the existing side-street stop-controlled intersection of Alana Way/Harney Way/Thomas Mellon Drive, intersection operations would worsen during AM peak hour from LOS A to LOS F under Existing plus Project with either the CPP or CPP-V scenario. Intersection operations would also worsen during PM peak hour from LOS A to LOS F under Existing plus Project with all four development scenarios. Based on traffic model runs for each of the four development scenarios, Project Site development-generated trips originating from US 101 southbound would exit at the interchange at Alana Way/Beatty Road and result in substantial increase in traffic volumes on the critical westbound through movement.
The poor operating conditions at the Alana Way/Harney Way/Thomas Mellon Drive intersection under Existing plus Project conditions would be due to increased delays at the eastbound right-turn movement. The capacity provided by the existing westbound shared through/right lane would not be able to accommodate the increase in US 101 northbound on-ramp traffic.
Mitigation Measure Applicability by Scenario
DSP DSP-V CPP CPP-V
= measure applies - = measure does not apply

4. Environmental Setting, Impacts, and Mitigation Measures
4.N Traffic and Circulation
Brisbane Baylands 4.N-99 ESA / 206069 Draft EIR June 2013
Conclusion: At the unsignalized intersection of Alana Way/Harney Way/Thomas Mellon Drive (#10), the addition of Project Site development-generated traffic to existing volumes would result in significant AM and PM peak hour traffic impacts. Each development scenario would result in a significant PM peak hour impact at this intersection, and the CPP and CPP-V scenarios would also result in a significant AM peak hour impact. Mitigation Measure 4.N-1d is recommended.
Mitigation
Mitigation Measure 4.N-1d: Prior to issuance of the first building occupancy permit for new development other than for relocation or improvement of an existing use, the eastbound approach to the Alana Way/Harney Way/Thomas Mellon Drive intersection shall be restriped to provide an additional right-turn lane. Harney Way shall be widened to the south of its existing alignment to accommodate this change.
Conclusion with Mitigation: Implementation of this mitigation measure would improve operations at this intersection to LOS C under Existing plus Project with the DSP and DSP-V scenarios. The operations under the CPP and CPP-V scenarios would remain at LOS F. This mitigation measure is consistent with the Harney Way widening project that was assumed under the Cumulative Year 2030 conditions. With implementation of Mitigation Measure 4.N-1d, operational impacts at Alana Way/Harney Way/Thomas Mellon Drive intersection would be less than significant under the DSP and DSP-V scenarios and would be significant and unavoidable for the CPP and CPP-V scenarios. Since this intersection is within San Francisco, however, it is not within the power of Brisbane to impose. Therefore, due to legal infeasibility, its implementation cannot be assumed under Existing plus Project conditions, even though the mitigation measure is consistent with the Harney Way widening project in San Francisco. Therefore, impacts at the Alana Way/Harney Way/Thomas Mellon Drive intersection are considered to be significant and unavoidable.
Impact at Tunnel Avenue and Bayshore Boulevard (Intersection 12)
The existing Tunnel Avenue/Bayshore Boulevard intersection is signalized at the northbound and southbound approaches and is stop-controlled on the westbound approach. The intersection operating conditions would worsen in the AM peak hour from LOS C under Existing conditions to LOS E under Existing plus Project condition for all four development scenarios. In the PM peak hour, the intersection would worsen from LOS B to LOS F under each of the four development scenarios.
Conclusion: At the signalized intersection of Tunnel Avenue & Bayshore Boulevard (#12), the addition of Project Site development -generated traffic to existing volumes would result in significant AM and PM peak hour traffic impacts. Each development scenario would result in a significant PM peak hour impact, and the DSP, DSP-V, and CPP scenarios would result in a significant AM peak hour impact. Mitigation Measure 4.N-1e below is recommended.
Mitigation Measure Applicability by Scenario/Variant
DSP DSP-V CPP CPP-V
= measure applies - = measure does not apply

4. Environmental Setting, Impacts, and Mitigation Measures
4.N Traffic and Circulation
Brisbane Baylands 4.N-100 ESA / 206069 Draft EIR June 2013
Mitigation
Mitigation Measure 4.N-1e: Prior to issuance of the first building occupancy permit for new development other than for relocation or improvement of an existing use, a signal phase shall be provided for the westbound right approach at the intersection of Tunnel Avenue & Bayshore Boulevard, and signal timing settings for the AM and PM peak periods shall be modified by changing the southbound left phase from the existing permitted to protected phase, and shifting 20 seconds of green time from the northbound and southbound movements to each of the southbound left and westbound right phases.
Conclusion with Mitigation: Implementation of this mitigation measure would improve operations at the intersection to acceptable (LOS D) levels in the AM peak hour with the DSP and DSP-V scenarios and in the PM peak hour with the DSP-V scenario. Under the CPP scenario, both AM and PM operations would remain at an unacceptable LOS F. Under the CPP-V scenario, both AM and PM operations would remain at an unacceptable LOS E. Therefore, with implementation of Mitigation Measure 4.N-1e, operational impacts at Tunnel Avenue and Bayshore Boulevard would be less than significant under the DSP-V scenario. The impacts would be significant and unavoidable for the DSP, CPP, and CPP-V scenarios. However, the intersection of Tunnel Avenue & Bayshore Boulevard is located within San Francisco, and implementation of the recommended mitigation measure would require San Francisco’s approval. While the mitigation measure may be physically feasible, because Brisbane cannot compel San Francisco to accept proposed improvements, the measure’s approval cannot be ensured and therefore the measure is legally infeasible. Therefore, impacts at Tunnel Avenue and Bayshore Boulevard are considered to be significant and unavoidable.
Impact at Blanken Avenue and Tunnel Avenue (Intersection 13)
Impacts of the DSP, CPP, and CPP-V Scenarios
The addition of Project Site development-related trips from the DSP, CPP, and CPP-V scenarios to the existing all-way stop-controlled intersection would not deteriorate its existing operating conditions to unacceptable levels. Therefore, Project Site development under the DSP, CPP, or CPP-V scenarios would result in a less-than-significant impact at the intersection of Blanken Avenue & Tunnel Avenue during both the AM and PM peak hours.
Impacts of the DSP-V Scenario (Sold-Out Arena Event)
On days when no sold-out events are occurring at the arena, Project Site development under the DSP-V scenario would result in a less-than-significant impact at the intersection of Blanken Avenue & Tunnel Avenue during both the AM and PM peak hours. The following analysis evaluates intersection conditions on days when sold-out arena events are occurring.
The majority of arena-bound traffic would use a portion of US 101 to reach the arena within the Project Site on event days. Traffic from the south would predominantly use northbound US 101 and reach the site via Harney Way, while traffic from the north would predominantly use
Mitigation Measure Applicability by Scenario
DSP DSP-V CPP CPP-V
= measure applies - = measure does not apply

4. Environmental Setting, Impacts, and Mitigation Measures
4.N Traffic and Circulation
Brisbane Baylands 4.N-101 ESA / 206069 Draft EIR June 2013
southbound US 101 and I-280 and reach the site via Geneva Avenue, Bayshore Boulevard, and Tunnel Avenue (or via J Street [Roundhouse Circle] to cross toward the west side of the Project Site). For a special event that begins at 7:00 PM, traffic flow on the site’s roadways would be geared toward inbound flow during the PM peak hour.
Table 4.N-27 presents a comparison of intersection LOS operating conditions for Project Site development during weekday PM peak hour conditions without a sell-out event to conditions with a sell-out event at the arena. Only the intersections along the access routes that would be primarily affected by arena traffic are listed. Assuming that the special event is sold out and that 50 percent of the attendants would arrive at the site within the second hour prior to the event start at 7:00 PM, the intersection operating conditions at Blanken Avenue/Tunnel Avenue would worsen in the PM peak hour from LOS B under the DSP-V on non-event days to LOS C on event days. The intersection of Blanken Avenue/Tunnel Avenue is located within San Francisco and its signal control is within the control of SFMTA.
TABLE 4.N-27 INTERSECTION LEVEL OF SERVICE – EXISTING PLUS PROJECT WITH THE DSP-V SCENARIO
NO EVENT AND SOLD-OUT ARENA EVENT – WEEKDAY PM PEAK HOUR
Intersection
DSP-V with No Arena Event DSP-V with
Sold-Out Arena Event
Delaya LOSb Delaya LOSb
1 Geneva Avenue/Bayshore Boulevard 79 E 77 E
4 Old County Road/Bayshore Boulevard 42 D 48 D
5 San Bruno Avenue/Bayshore Boulevard 44 E 44 E
9 Beatty Road/Alana Way/US 101 SB Ramps >50 F(EB) >50 F(EB)
10 Alana Way/Harney Way/Thomas Mellon Drive >50 F(EB) >50 F(EB)
12 Tunnel Avenue/Bayshore Boulevard >80 F >80 F
13 Blanken Avenue/Tunnel Avenue 12 B(NB) 15 C(SB)
a Delay in seconds per vehicle. b Intersections operating at Level of Service (LOS) E or LOS F conditions highlighted in bold.
SOURCE: Fehr & Peers, 2013
Traffic associated with a sell-out event at the arena would exacerbate traffic operations at six intersections that would operate at LOS E or LOS F conditions under Existing plus Project with the DSP-V scenario without an event during the PM peak hour:
1. Geneva Avenue & Bayshore Boulevard (LOS E to LOS E)
4. Old County Road & Bayshore Boulevard (LOS D to LOS D)
5. San Bruno Avenue & Bayshore Boulevard (LOS E to LOS E)
9. Beatty Road & Alana Way & US 101 Southbound Ramps (LOS F to LOS F)
10. Alana Way & Harney Way & Thomas Mellon Drive (LOS F to LOS F)
12. Tunnel Avenue & Bayshore Boulevard (LOS F to LOS F)

4. Environmental Setting, Impacts, and Mitigation Measures
4.N Traffic and Circulation
Brisbane Baylands 4.N-102 ESA / 206069 Draft EIR June 2013
Conclusion: Although at the unsignalized intersection of Blanken Avenue and Tunnel Avenue (#13), Project Site development (DSP-V scenario only) would result in the PM peak hour LOS going from B to C due to weekday evening events at the arena. Because existing congestion at intersections 1, 4, 5, 9, 10, and 12 would be exacerbated by the DSP-V scenario, a significant impact would result. Impacts under the DSP, CPP and CPP-V would be less than significant. Mitigation Measure 4.N-1f below is recommended.
Mitigation
Mitigation Measure 4.N-1f: Prior to issuance of the building occupancy permit for an arena within the Project Site, the arena operator shall develop a Transportation Management Plan (TMP) for coordination with the San Francisco Municipal Transportation Agency (SFMTA), the San Francisco Police Department, and the City of Brisbane, developing incentives to increase transit ridership to the arena, and deploying traffic control officers at the unsignalized intersection of Blanken Avenue and Tunnel Avenue to approximate traffic control with traffic signals of LOS C.
The final arena TMP shall be approved by the City of Brisbane and developed in cooperation with SFMTA. Preparation of the TMP shall be fully funded by the arena operator and shall be completed in time for implementation on opening night of the arena.
Conclusion with Mitigation: Implementation of this mitigation measure would improve the operating conditions at the intersection to acceptable (LOS C) levels by approximating operating conditions if the intersection were signalized. Implementation of this mitigation measure would facilitate entrance and exit to the arena site for vehicles that choose Tunnel Avenue as the gateway into and out of the arena site, as well as maintain orderly traffic operations and reduce intrusion onto Bayshore Boulevard and/or neighborhood streets. Traffic delays could still occur at the other adversely affected intersections; these impacts are described under Impacts 4.N-1a through 4.N-1e above. Implementation of Mitigation Measure 4.N-1f would reduce the impact on the existing operating conditions at the intersection of Blanken Avenue/Tunnel Avenue during the PM peak hour resulting from a sold-out weekday evening event to a less-than-significant level. Implementation of this measure would entail actions being taken by San Francisco, however, which the City of Brisbane cannot compel. Therefore, while the mitigation measure may be physically feasible, because Brisbane cannot require San Francisco to accept proposed improvements, the mitigation measure is legally infeasible. This impact is therefore considered to be significant and unavoidable.
Intersection Spacing along the Geneva Avenue Extension (DSP and DSP-V Scenarios)
The Specific Plan prepared for the DSP and DSP-V scenarios proposes the following three intersections with full turning movements along the Geneva Avenue extension, including the roadway links between:
Bayshore Boulevard and “2nd Street” (approximately 600 feet between roadway centerlines):
Mitigation Measure Applicability by Scenario
DSP DSP-V CPP CPP-V
- - -
= measure applies - = measure does not apply

4. Environmental Setting, Impacts, and Mitigation Measures
4.N Traffic and Circulation
Brisbane Baylands 4.N-103 ESA / 206069 Draft EIR June 2013
“5th Street” and Tunnel Avenue, along either side of the Caltrain overpass (approximately 400 feet between roadway centerlines); and
“7th Street” and 8th Street west of US 101 (approximately 400 feet between roadway centerlines).
The close spacing of these intersections could cause traffic to queue up at one intersection along Geneva Avenue and back up into another intersection, even if each intersection met applicable LOS standards on its own. Such an interaction between two intersections would constitute a significant impact.
Conclusion: Because of the close spacing of certain intersections along the Geneva Avenue extension, traffic queuing up at one intersection along Geneva Avenue would back up into another intersection, creating congestion under the DSP and DSP-V development scenarios. Mitigation Measure 4.N-1g below is therefore recommended.
Mitigation
Mitigation Measure 4.N-1g: Approval of any tentative map providing for spacing of less than 1,200 feet between full-access intersections along the Geneva Avenue extension shall require that the interactions of green and red signal timing at any one intersection along the Geneva Avenue extension shall not affect operations at any other intersection along the extension, by backing traffic waiting for a green signal at one intersection along the Geneva Avenue extension into another intersection along the extension. Should full-access intersections along the Geneva Avenue extension with spacing of less than 1,200 feet be proposed, a microsimulation of all proposed intersections along the extension (e.g., Synchro, VISSUM) shall be undertaken to analyze interactions of green and red signal timing and demonstrate that operations at any one intersection along the Geneva Avenue extension would not affect operations at any other intersection along the extension.
Conclusion with Mitigation: While implementation of this mitigation measure would ensure that efforts are made to eliminate any adverse interactions of signal timing at closely spaced full-access intersections along the Geneva Avenue extension, it is unknown if this performance standard can, in fact, be met, or whether the elimination of one or more full turning movement intersection along the Geneva Avenue extension would result in other significant adverse impacts. Therefore, this impact is significant and unavoidable.
Elimination of Beatty Road in the CPP and CPP-V Scenarios
As show in Figures 3-11 through 3-14 in Chapter 3, Project Description, of this EIR, Beatty Avenue would provide access to a small area of land east of the Caltrain tracks between the existing Recology site and the Geneva Avenue extension under the DSP and DSP-V scenarios, whereas, Beatty Avenue would be eliminated under the CPP and CPP-V scenarios. Thus, proposed land uses east of the Caltrain tracks between the existing Recology site and the Geneva Avenue extension in the CPP scenario would not be able to take access from Beatty Avenue, and
Mitigation Measure Applicability by Scenario
DSP DSP-V CPP CPP-V
- -
= measure applies - = measure does not apply

4. Environmental Setting, Impacts, and Mitigation Measures
4.N Traffic and Circulation
Brisbane Baylands 4.N-104 ESA / 206069 Draft EIR June 2013
would instead be required to take access from north/south local street intersecting with Geneva Avenue to the south. In the CPP-V scenario, the Recology expansion would encompass the entire area east of the Caltrain tracks and north of the Geneva Avenue extension. Should Beatty Avenue be abandoned prior to the completion of Geneva Avenue extension, non-Recology lands east of the Caltrain tracks between the existing Recology site and the future Geneva Avenue extension would be left without access until the Geneva Avenue extension was completed, and traffic that would have otherwise used Beatty Avenue would be forced onto other streets, adversely affecting traffic flow. As a result, the City would not be able to make the necessary findings required for abandonment of Beatty Avenue prior to the completion of Geneva Avenue extension.
Conclusion: Depending on the relative timing of abandonment of Beatty Avenue and completion the Geneva Avenue extension, non-Recology lands east of the Caltrain tracks between the existing Recology site and the future Geneva Avenue extension would be left without access, which would constitute a significant impact and require mitigation.
Mitigation
Mitigation Measure 4.N-1h: Access via public street(s) to non-Recology lands east of the Caltrain tracks shall be maintained at all times prior to the completion of the proposed Geneva Avenue extension.
Conclusion with Mitigation: Implementation of this mitigation measure would ensure that non-Recology lands east of the Caltrain tracks between the existing Recology site and the future Geneva Avenue extension would have access and would avoid adverse effects of re-routing traffic onto other roadways, thus reducing the impact to a less-than-significant level.
__________________________
Impact 4.N-2: Would implementation of the Project contribute to significant existing traffic delays at freeway mainline segments?
Freeway mainline level of service analysis was conducted for four locations on US 101. Freeway ramp analysis was prepared for six locations on US 101. For freeway mainline and ramp analyses, analysis was undertaken at locations where Project Site development would change operations from LOS D or better under Existing conditions to LOS E or LOS F with Project Site development. At locations that operate at LOS E or LOS F under Existing conditions and would continue to operate at LOS E or LOS F under Existing plus Project conditions, Project Site development-related trips, as a percentage of total traffic volumes on the facility, were reviewed to determine whether the increase would contribute considerably to total volumes on the facility.
Mitigation Measure Applicability by Scenario
DSP DSP-V CPP CPP-V
- -
= measure applies - = measure does not apply
Impact Significance by Scenario (before Mitigation)
DSP DSP-V CPP CPP-V
SU SU SU SU
SU = Significant Unavoidable SM = Significant but Mitigable LTS = Less than Significant - = no impact

4. Environmental Setting, Impacts, and Mitigation Measures
4.N Traffic and Circulation
Brisbane Baylands 4.N-105 ESA / 206069 Draft EIR June 2013
Table 4.N-28 presents the results of the freeway mainline section analysis for Existing and Existing plus Project conditions. Each of the four development scenarios would cause the following freeway mainline segments to degrade from an acceptable LOS condition (LOS E or better) to an unacceptable LOS F under one or more of the development scenarios:
US 101 southbound mainline from Third Street / Bayshore Boulevard (AM peak hour) to Harney Way under all four development scenarios.
US 101 northbound mainline from Sierra Point to Harney Way (PM peak hour) under the CPP and CPP-V development scenarios.
US 101 northbound mainline from Harney Way to Third Street / Bayshore Boulevard (PM peak hour) under all four development scenarios.
TABLE 4.N-28 US 101 MAINLINE SEGMENT LEVEL OF SERVICE –
EXISTING AND EXISTING PLUS PROJECT CONDITIONS
Freeway Segment (by direction)
Existing Existing
Plus DSP Existing
Plus DSP-V Existing
Plus CPP Existing
Plus CPP-V
LOS V/C LOS V/C LOS V/C LOS V/C LOS V/C
Weekday AM Peak Hour
NB—Sierra Point to Harney Way D 0.77 E 0.81 E 0.81 E 0.82 E 0.81
NB—Harney Way to Third/Bayshore D 0.77 E 0.79 E 0.79 E 0.81 E 0.81
SB—Third/Bayshore to Harney Way E 0.90 F 1.01 F 1.00 F 1.01 F 1.00
SB—Harney/Geneva to Sierra Point E 0.89 E 0.90 E 0.90 E 0.92 E 0.92
Weekday PM Peak Hour
NB—Sierra Point to Harney Way E 0.90 E 0.91 E 0.92 F 0.95 F 0.95
NB—Harney Way to Third/Bayshore E 0.90 F 1.00 F 0.99 F 1.01 F 1.00
SB—Third/Bayshore to Harney Way E 0.81 E 0.84 E 0.84 E 0.89 E 0.89
SB—Harney/Geneva to Sierra Point E 0.82 E 0.86 E 0.86 E 0.88 E 0.88
Segments operating at LOS F conditions highlighted in bold LOS determination for freeway mainline segments were based on HCM 2000 LOS V/C Methodology per C/CAG guidelines. Freeway directions: NB = Northbound; SB = Southbound SOURCE: Fehr and Peers, 2012
All other study segments would continue to operate no worse than an acceptable LOS E.
Conclusion: Impacts at three freeway mainline segments would be significant under each of the four proposed development scenarios. To minimize the potential for an increase in Project Site

4. Environmental Setting, Impacts, and Mitigation Measures
4.N Traffic and Circulation
Brisbane Baylands 4.N-106 ESA / 206069 Draft EIR June 2013
development-generated vehicles and impacts on freeway mainline LOS conditions, implementation of a TDM program (Mitigation Measure 4.N-13)17 would be required.
Conclusion with Mitigation: Mitigation Measure 4.N-13 would reduce the impact but not to a less-than-significant level. There is no mitigation available to reduce this impact to a less-than-significant level. Therefore, impacts on freeway mainline operations would be significant and unavoidable under all four development scenarios.
__________________________
Traffic Conditions (Cumulative With Project)
Cumulative (2030) No Project conditions, which represent baseline conditions for the analysis of cumulative impacts, assume that in addition to improvements proposed by Project Site development scenarios, certain roadway improvements that are not part of Project Site development that could affect traffic circulation in the Project Site vicinity would be completed by others. (See “Impact Assessment Methodology” above for descriptions of improvements proposed by Project Site development scenarios and improvements that are not part of Project Site development.) These latter improvements would be completed through area development approvals within Brisbane and San Francisco or directly by one of those two city governments. Also relevant to analysis of future conditions is the assumption that signal timing for all signalized study intersections would follow the existing signal timing settings, except for the intersections of Blanken Avenue/Tunnel Avenue, Tunnel Avenue/Bayshore Boulevard, and Sunnydale Avenue/Bayshore Boulevard. Signal timing changes are proposed as mitigation at these three intersections as part of the Visitacion Valley Redevelopment Project and are assumed to be implemented under Cumulative Without Project conditions.
The extension of Geneva Avenue from its current terminus at Bayshore Boulevard eastward to the US 101 Southbound ramps would divert part of existing and future (generated by other development projects) traffic volumes on Bayshore Boulevard to the Geneva Avenue extension for access to US 101. The diversion of traffic from Bayshore Boulevard would result in operational improvements at intersections in the immediate vicinity of Geneva Avenue & Bayshore Boulevard and along Bayshore Boulevard, without consideration of Project Site development-generated trips. Table 4.N-29 (AM Peak Hour) and Table 4.N-30 (PM Peak Hour) compare intersection peak hour LOS with the Geneva Avenue extension to conditions without the extension, under Cumulative Without Project conditions.
17 Mitigation Measure 4.N-13 reads as follows: “Prior to issuance of the first building occupancy permit for new
development other than improvement or relocation of an existing use within the Project Site, the developer(s) and/or tenants of Project Site land uses shall prepare, submit to the City/County Association of Governments of San Mateo County (C/CAG) for approval, and establish a Transportation Demand Management (TDM) program to mitigate the C/CAG project impact of generating more than 100 net new vehicle trips during the peak traffic hours. Implementation of TDM programs shall be made a condition of approval for all new development within the Project Site that generates 100 or more net new trips during the AM or PM peak hour. A summary of TDM strategies can be found in Table 4.N-45.”

4. Environmental Setting, Impacts, and Mitigation Measures
4.N Traffic and Circulation
Brisbane Baylands 4.N-107 ESA / 206069 Draft EIR June 2013
TABLE 4.N-29 INTERSECTION LEVEL OF SERVICE – CUMULATIVE WITHOUT PROJECT CONDITIONS
WITHOUT AND WITH GENEVA EXTENSION – WEEKDAY AM PEAK HOUR
Intersection
Cumulative Without Project, Without
Geneva Extension
Cumulative Without Project, With
Geneva Extension
Delaya LOSb Delay LOS
1 Geneva Avenue/Bayshore Boulevard 33 C 58 E
2 Guadalupe Canyon Parkway/Bayshore Boulevard
47 D 18 B
3 Valley Drive/Bayshore Boulevard 60 E 20 B
4 Old County Road/Bayshore Boulevard c 47 D 32 C
5 San Bruno Avenue/Bayshore Boulevard > 50 F(EB) > 50 F(EB)
6 Sierra Point Parkway/US 101 NB Ramps > 50 F(NB) > 50 F(EB)
7 Tunnel Avenue/Lagoon Way > 50 F(WB) > 50 F(WB)
8 Airport Boulevard/Lagoon Way > 50 F(WB) > 50 F(WB)
9 Beatty Road/Alana Way/US 101 SB Ramps
OR
Geneva Avenue/US 101 SB Ramps
> 50 F(SB) > 80 F
10 Alana Way/Harney Way/Thomas Mellon Drive
OR
Harney Way/Thomas Mellon Drive
> 50 F(WB) 34 C
11 Third Street/Jamestown Avenue 54 D 54 D
12 Tunnel Avenue/Bayshore Boulevard > 80 F > 80 F
13 Blanken Avenue/Tunnel Avenue 28 C 18 B
14 Blanken Avenue/Bayshore Boulevard > 80 F 36 D
15 Sunnydale Avenue/Bayshore Boulevard > 80 F > 80 F
16 Carter Street/Geneva Avenue > 80 F > 80 F
17 Mission Street/Geneva Avenue > 80 F > 80 F
18 Orange Street/Guadalupe Canyon Parkway > 50 F(EB) > 50 F(EB)
a Delay in seconds per vehicle. b Intersections operating at unacceptable level of service (LOS) conditions highlighted in bold. c Threshold of significance is LOS C for the intersection of Old County Road & Bayshore Boulevard per City of Brisbane General Plan.
SOURCE: Fehr & Peers, 2012

4. Environmental Setting, Impacts, and Mitigation Measures
4.N Traffic and Circulation
Brisbane Baylands 4.N-108 ESA / 206069 Draft EIR June 2013
TABLE 4.N-30 INTERSECTION LEVEL OF SERVICE – CUMULATIVE WITHOUT PROJECT CONDITIONS
WITHOUT AND WITH GENEVA EXTENSION – WEEKDAY PM PEAK HOUR
Intersection
Cumulative Without Project, Without
Geneva Extension
Cumulative Without Project, With
Geneva Extension
Delaya LOSb Delay LOS
1 Geneva Avenue/Bayshore Boulevard > 80 F 85 F
2 Guadalupe Canyon Parkway/Bayshore Boulevard
> 80 F 47 D
3 Valley Drive/Bayshore Boulevard 75 E 39 D
4 Old County Road/Bayshore Boulevard c > 80 F > 80 F
5 San Bruno Avenue/Bayshore Boulevard > 50 F(EB) > 50 F(EB)
6 Sierra Point Parkway/US 101 NB Ramps > 50 F(NB) > 50 F(WB)
7 Tunnel Avenue/Lagoon Way > 50 F(WB) > 50 F(WB)
8 Airport Boulevard/Lagoon Way > 50 F(EB) > 50 F(EB)
9 Beatty Road/Alana Way/US 101 SB Ramps
OR
Geneva Avenue/US 101 SB Ramps
> 50 F(WB) > 80 F
10 Alana Way/Harney Way/Thomas Mellon Drive
OR
Harney Way/Thomas Mellon Drive
> 50 F(EB) 26 C
11 Third Street/Jamestown Avenue > 80 F > 80 F
12 Tunnel Avenue/Bayshore Boulevard > 80 F 72 E
13 Blanken Avenue/Tunnel Avenue c 31 C 25 C
14 Blanken Avenue/Bayshore Boulevard > 80 F 35 D
15 Sunnydale Avenue/Bayshore Boulevard > 80 F > 80 F
16 Carter Street/Geneva Avenue > 80 F > 80 F
17 Mission Street/Geneva Avenue > 80 F > 80 F
18 Orange Street/Guadalupe Canyon Parkway 16 C(WB) 16 C(WB)
a Delay in seconds per vehicle. b Intersections operating at unacceptable level of service (LOS) conditions highlighted in bold. c Threshold of significance is LOS C for the intersection of Old County Road & Bayshore Boulevard per City of Brisbane General Plan.
SOURCE: Fehr & Peers, 2012
4. Environmental Setting, Impacts, and Mitigation Measures
4.N Traffic and Circulation
Brisbane Baylands 4.N-109 ESA / 206069 Draft EIR June 2013
Traffic Impact: Intersections
Impact 4.N-3: Would the Project result in a substantial increase in traffic under Cumulative With Project conditions at the study intersections?
Table 4.N-31 and Table 4.N-32 present a comparison of intersection LOS analysis for Cumulative Without Project and Cumulative With Project conditions for the AM and PM peak hours, respectively.
As shown in those tables, among the intersections analyzed in this document, the following four would operate acceptably under Cumulative With Project conditions during both AM and PM peak hour, and the cumulative impact would be less than significant:
2. Guadalupe Canyon Parkway & Bayshore Boulevard 3. Valley Drive & Bayshore Boulevard 10. Harney Way & Thomas Mellon Drive 13. Blanken Avenue & Tunnel Avenue 19. Tunnel Avenue & Geneva Avenue
Impact at San Bruno Avenue & Bayshore Boulevard (Intersection 5)
The unsignalized intersection of San Bruno Avenue/Bayshore Boulevard would operate at unacceptable peak hour levels of service on the critical stop sign-controlled approach both without and with Project Site development under all four development scenarios.18 However, the intersection would not meet the criteria for the Caltrans peak hour signal warrant, and each of the proposed development scenarios would add less than 5 percent of trips to the critical movement at the intersection. Therefore, Project Site development’s contribution to the unacceptable cumulative conditions would be less than considerable, and the cumulative impact would be less than significant.
Impact at Geneva Avenue & Bayshore Boulevard (Intersection 1)
At the signalized intersection of Geneva Avenue & Bayshore Boulevard, all four development scenarios would contribute considerably to a significant cumulative impact during the AM and PM peak hours (i.e., by degrading the intersection from LOS E to LOS F in the AM and contributing more than 5 percent of trips to the critical vehicle movements in the PM).
Conclusion: The cumulative impact of each development scenario would be significant at this intersection. Implementation of Mitigation Measure 4.N-3a below is recommended.
18 The eastbound left-turn movement incurs the most delay at this side street stop-controlled intersection, causing the
intersection operate below the LOS standard.
Impact Significance by Scenario (before Mitigation)
DSP DSP-V CPP CPP-V
SU SU SU SU
SU = Significant Unavoidable SM = Significant but Mitigable LTS = Less than Significant - = no impact

4. Environmental Setting, Impacts, and Mitigation Measures
4.N Traffic and Circulation
Brisbane Baylands 4.N-110 ESA / 206069 Draft EIR June 2013
TABLE 4.N-31 INTERSECTION LEVEL OF SERVICE – CUMULATIVE WITHOUT PROJECT AND CUMULATIVE WITH PROJECT CONDITIONS –
WEEKDAY AM PEAK HOUR
Intersection
Existing
Cumulative Without Project
Cumulative With DSP
Cumulative With DSP-V
Cumulative With CPP
Cumulative With CPP-V
Impact LOS after Mitigation Delaya LOSb Delay LOS Delay LOS Delay LOS Delay LOS Delay LOS
1 Geneva Avenue/ Bayshore Boulevard
25 C 58 E > 80 F > 80 F > 80 F > 80 F SU -
2 Guadalupe Canyon Parkway/ Bayshore Boulevard
15 B 18 B 21 C 21 C 19 B 19 B - -
3 Valley Drive/ Bayshore Boulevard
16 B 19 B 28 C 28 C 24 C 24 C - -
4 Old County Road/ Bayshore Boulevard
31 C 32 C 66 E 59 E 64 E 60 E SU -
5 San Bruno Avenue/ Bayshore Boulevard
29 D(EB) > 50 F(EB) > 50 F(EB) > 50 F(EB) > 50 F(EB) > 50 F(EB) LTS -
6 Sierra Point Parkway/ US 101 NB Ramps
20 C(NB) >50 F(EB) > 50 F(EB) > 50 F(EB) > 50 F(EB) > 50 F(EB) SU -
7 Lagoon Way/Tunnel Avenue <10 A > 50 F(WB) > 50 F(WB) > 50 F(WB) > 50 F(WB) > 50 F(WB) SU -
8 Lagoon Way/ Sierra Point Parkway
<10 A(WB) > 50 F(WB) > 50 F(WB) > 50 F(WB) > 50 F(WB) > 50 F(WB) SU -
9 Geneva Avenue/ US 101 SB Rampsc 10 B(EB) > 80 F > 80 F > 80 F > 80 F > 80 F SU -
10 Harney Way/ Thomas Mellon Drived <10 A 34 C 35 D 35 D 35 D 35 D - -
11 Jamestown Avenue/ Third Street
19 B 54 D 72 E 69 E 75 E 73 E SU -
12 Tunnel Avenue/ Bayshore Boulevard
27 C > 80 F > 80 F > 80 F > 80 F > 80 F SU -
13 Blanken Avenue/ Tunnel Avenuee <10 A 18 B 19 B 19 B 19 B 19 B - -
14 Blanken Avenue/ Bayshore Boulevard
<10 A 36 D 54 D 55 D 44 D 44 D - -
15 Sunnydale Avenue/ Bayshore Boulevard
19 B > 80 F > 80 F > 80 F > 80 F > 80 F SU -

4. Environmental Setting, Impacts, and Mitigation Measures
4.N Traffic and Circulation
Brisbane Baylands 4.N-111 ESA / 206069 Draft EIR June 2013
TABLE 4.N-31 (Continued) INTERSECTION LEVEL OF SERVICE – CUMULATIVE WITHOUT PROJECT AND CUMULATIVE WITH PROJECT CONDITIONS –
WEEKDAY AM PEAK HOUR
Intersection
Existing
Cumulative Without Project
Cumulative With DSP
Cumulative With DSP-V
Cumulative With CPP
Cumulative With CPP-V
Impact LOS after Mitigation Delaya LOSb Delay LOS Delay LOS Delay LOS Delay LOS Delay LOS
16 Geneva Avenue/ Carter Street
28 C > 80 F > 80 F > 80 F > 80 F > 80 F SU -
17 Geneva Avenue/ Mission Street
18 B > 80 F > 80 F > 80 F > 80 F > 80 F SU -
18 E. Market Street/ Orange Street
12 B(EB) > 50 F(EB) > 50 F(EB) > 50 F(EB) > 50 F(EB) > 50 F(EB) SU -
19 Tunnel Avenue/ Geneva Avenuef 32 C - -
a Delay in seconds per vehicle. b Intersections operating at unacceptable level of service (LOS) conditions highlighted in bold. c Year 2030 analysis includes signalization at Geneva Avenue & US 101 Southbound Ramps as part of the Geneva Avenue extension project. d Year 2030 analysis includes signalization at Harney Way & US 101 Northbound Ramps as part of the Harney Way widening project. e Year 2030 analysis includes signalization at Blanken Avenue & Tunnel Avenue. f Year 2030 analysis includes signalization at Tunnel Avenue & Geneva Avenue as part of the CPP-V. - = No Impact LTS = Less than Significant SM = Significant but Mitigable SU = Significant Unavoidable SOURCE: Fehr & Peers, 2012

4. Environmental Setting, Impacts, and Mitigation Measures
4.N Traffic and Circulation
Brisbane Baylands 4.N-112 ESA / 206069 Draft EIR June 2013
TABLE 4.N-32 INTERSECTION LEVEL OF SERVICE – CUMULATIVE WITHOUT PROJECT AND CUMULATIVE WITH PROJECT CONDITIONS –
WEEKDAY PM PEAK HOUR
Intersection
Existing
Cumulative Without Project
Cumulative With DSP
Cumulative With DSP-V
Cumulative With CPP
Cumulative With CPP-V
Impact LOS after Mitigation Delaya LOSb Delay LOS Delay LOS Delay LOS Delay LOS Delay LOS
1 Geneva Avenue/ Bayshore Boulevard
24 C > 80 F > 80 F > 80 F > 80 F > 80 F SU E
2 Guadalupe Canyon Parkway/ Bayshore Boulevard
13 B 47 D 48 D 47 D 48 D 47 D - -
3 Valley Drive/ Bayshore Boulevard
13 B 39 D 45 D 45 D 47 D 47 D - -
4 Old County Road/ Bayshore Boulevard
30 C > 80 F > 80 F > 80 F > 80 F > 80 F SU F
5 San Bruno Avenue/ Bayshore Boulevard
27 D(EB) > 50 F(EB) > 50 F(EB) > 50 F(EB) > 50 F(EB) > 50 F(EB) LTS -
6 Sierra Point Parkway/ US 101 NB Ramps
<10 A(NB) > 50 F(WB) > 50 F(WB) > 50 F(WB) > 50 F(WB) > 50 F(EB) SU F
7 Lagoon Way/Tunnel Avenue <10 A > 50 F(WB) > 50 F(SB) > 50 F(SB) > 50 F(SB) > 50 F(SB) SU F
8 Lagoon Way/ Sierra Point Parkway
12 B(NB) > 50 F(EB) > 50 F(EB) > 50 F(EB) > 50 F(EB) > 50 F(EB) SU F/Ei
9 Geneva Avenue/ US 101 SB Rampsc <10 A(SB) > 80 F > 80 F > 80 F > 80 F > 80 F SU D
10 Harney Way/ Thomas Mellon Drived <10 A 26 C 26 C 27 C 27 C 27 C - -
11 Jamestown Avenue/ Third Street
18 B > 80 F > 80 F > 80 F > 80 F > 80 F SU F
12 Tunnel Avenue/ Bayshore Boulevard
20 B 72 E > 80 F > 80 F > 80 F > 80 F SU F
13 Blanken Avenue/ Tunnel Avenuee <10 A 25 C 25 C 25 C 25 C 25 C - -
14 Blanken Avenue/ Bayshore Boulevard
11 B 35 D 54 D 53 D 50 D 49 D - -
15 Sunnydale Avenue/ Bayshore Boulevard
20 C > 80 F > 80 F > 80 F > 80 F > 80 F SU F

4. Environmental Setting, Impacts, and Mitigation Measures
4.N Traffic and Circulation
Brisbane Baylands 4.N-113 ESA / 206069 Draft EIR June 2013
TABLE 4.N-32 (Continued) INTERSECTION LEVEL OF SERVICE – CUMULATIVE WITHOUT PROJECT AND CUMULATIVE WITH PROJECT CONDITIONS –
WEEKDAY PM PEAK HOUR
Intersection
Existing
Cumulative Without Project
Cumulative With DSP
Cumulative With DSP-V
Cumulative With CPP
Cumulative With CPP-V
Impact LOS after Mitigation Delaya LOSb Delay LOS Delay LOS Delay LOS Delay LOS Delay LOS
16 Geneva Avenue/ Carter Street
31 C > 80 F > 80 F > 80 F > 80 F > 80 F SU -D
17 Geneva Avenue/ Mission Street/
20 C > 80 F > 80 F > 80 F > 80 F > 80 F SU F
18 E. Market Street/ Orange Street
<10 A 16 C(WB) 23 C(WB) 22 C(WB) 25 C(WB) 24 CWB) SM -
19 Tunnel Avenue/ Geneva Avenuef > 80 F - -
a Delay in seconds per vehicle. b Intersections operating at unacceptable level of service (LOS) conditions highlighted in bold. c Year 2030 analysis includes signalization at Geneva Avenue & US 101 Southbound Ramps as part of the Geneva Avenue extension project. d Year 2030 analysis includes signalization at Harney Way & US 101 Northbound Ramps as part of the Harney Way Widening project. e Year 2030 analysis includes signalization at Blanken Avenue & Tunnel Avenue. f Year 2030 analysis includes signalization at Tunnel Avenue & Geneva Avenue as part of the CPP-V. g No impact for DSP and DSP-V, SU for CPP and CPP-V. k LTS for DSP and DSP-V, SU for CPP and CPP-V. I LOS F for the DSP scenario; LOS E for the DSP-V, CPP, and CPP-V scenarios. - = No Impact LTS = Less than Significant SM = Significant but Mitigable SU = Significant Unavoidable
SOURCE: Fehr & Peers

4. Environmental Setting, Impacts, and Mitigation Measures
4.N Traffic and Circulation
Brisbane Baylands 4.N-114 ESA / 206069 Draft EIR June 2013
Mitigation
Mitigation Measure 4.N-3a:19 Prior to issuance of the first building occupancy permit for new development other than improvement or relocation of an existing use within the Project Site, the improvements required by Mitigation Measure 4.N-1a (which addressed Existing Plus Project conditions) shall be supplemented to account for cumulative traffic conditions. Thus, the full extent of improvements shall include the following:
The eastbound approach at the signalized intersection of Geneva Avenue & Bayshore Boulevard shall be restriped to create one additional through lane and to modify one of the existing two right-turn lanes to become a shared through/right-turn lane. In addition, the southbound approach shall be restriped to provide an additional exclusive left-turn pocket. Finally, the northbound approach shall be restriped to provide two additional lanes: an additional left-turn pocket and an added right-turn lane.
As a condition of approval for the first discretionary action taken for development within the Project Site, the applicant shall be required to initiate a corridor plan for Bayshore Boulevard in cooperation with Daly City and San Francisco to determine the suite of improvements necessary to resolve long-term cumulative traffic issues along the corridor. Because the effectiveness of such a corridor plan would necessitate participation by Daly City and San Francisco in recognition of increases in traffic along the Bayshore corridor that will be generated by future development within those two jurisdictions, Brisbane will also make its best efforts to assist the developer in securing the agreement of Daly City and San Francisco to participate in the corridor study and its implementation.
19 Mitigation Measure 4.N-1a provides for mitigation of Project Site development-related impacts in the Existing plus
Project condition, while this mitigation measure provides for mitigation in the Cumulative With Project condition. This mitigation measure is based on needed modification to the existing, baseline configuration of the intersection and does not assume that Mitigation Measure 4.N-1a is implemented.
Mitigation Measure Applicability by Scenario
DSP DSP-V CPP CPP-V
= measure applies - = measure does not apply

4. Environmental Setting, Impacts, and Mitigation Measures
4.N Traffic and Circulation
Brisbane Baylands 4.N-115 ESA / 206069 Draft EIR June 2013
Conclusion with Mitigation: Currently, Bayshore Boulevard is approximately 100 feet wide, with two lanes of traffic in each direction, two left-turn pockets for the northbound direction, one left-turn pocket and two right-turn pockets for the southbound direction, and a median. Parking is not allowed on either side of Bayshore Boulevard. Bayshore Boulevard is also a Class II bicycle lane south of Geneva Avenue, and a Class II bicycle lane north of Geneva Avenue is being proposed in the San Mateo County Comprehensive Bicycle and Pedestrian Plan (2011). It is possible to restripe the connection to accommodate this change through removal of the existing median or further widening to the east of its existing alignment.
Currently, the Geneva Avenue connection to the west side of Bayshore Boulevard is approximately 90 feet wide, with two lanes of traffic for the westbound direction, two left-turn lanes and two right-turn lanes for the eastbound approach, and a median 6 feet wide. As part of the Geneva Avenue extension project, Geneva Avenue between Bayshore Boulevard and the US 101 southbound ramps would be configured as a six-lane corridor (three lanes of traffic in each direction). Restriping the westbound approach to provide one through lane and one through/right-turn lane would allow the westbound through lanes to align with the inner two of the three receiving lanes on the extension of Geneva Avenue. Furthermore, removal of the median would make restriping the eastbound approach feasible without relocating the center line and compromising the turn movements of Muni 9AX buses.
Restriping the eastbound and southbound approaches as proposed in the above mitigation measure would improve intersection operations to acceptable levels at LOS D during the AM peak hour, but operations during the PM peak hour would remain unacceptable at LOS E. The poor PM peak hour operations would be due to substantial increase in northbound left-turn traffic. To provide the capacity to accommodate the northbound left-turn traffic, the northbound approach would be restriped by either removal of the existing median or widening to add the third left-turn pocket.
There would also be secondary impacts associated with all measures identified in Mitigation Measure 4.N-3a, including major right-of-way acquisition and safety concerns for pedestrians due to longer crosswalks and lack of a safety median. This secondary impact could be partially mitigated through pedestrian enhancements such as separated sidewalks along the length of Bayshore Boulevard; incorporating design elements that would reduce speeds to less than 30 miles per hour such as narrower travel lanes, landscape features, and more frequent signalization; and providing frequent (every 500 to 750 feet) safe crossing treatments for pedestrians. Given the proposed six-lane cross-section, use of traffic signals or “HAWK beacons” would be the likely safe crossing treatments. Buffered bike lanes could also be considered to mitigate the impact of increased traffic on bicyclists. All of the above are likely best addressed through the development of a corridor plan for Bayshore Boulevard.
While preparation and implementation of a corridor plan for Bayshore Boulevard would be the appropriate venue for determining the suite of improvements necessary to resolve long-term cumulative traffic issues along the corridor, the effectiveness of such a corridor plan would necessitate participation by Daly City and San Francisco in recognition of future increases in traffic along the Bayshore corridor that will be generated by future development in those two

4. Environmental Setting, Impacts, and Mitigation Measures
4.N Traffic and Circulation
Brisbane Baylands 4.N-116 ESA / 206069 Draft EIR June 2013
jurisdictions. While Brisbane believes that it would be beneficial for both Daly City and San Francisco to participate in such a study, it cannot require their participation. Brisbane will however, as a condition of approval, require the developer to initiate such a corridor study, and will also make its best efforts to assist the developer in securing the agreement of Daly City and San Francisco to participate in the corridor study and its implementation.
Therefore, even with inclusion of Mitigation Measure 4.N-3a, Project Site development impacts on the cumulative traffic conditions at the intersection of Geneva Avenue & Bayshore Boulevard would be significant and unavoidable based on the maximum allowable standard (LOS D).
Impact at Old County Road & Bayshore Boulevard (Intersection 4)
At the signalized intersection of Old County Road & Bayshore Boulevard, intersection LOS would deteriorate to unacceptable levels under Cumulative With Project conditions. All four proposed development scenarios would contribute considerably to this significant cumulative impact during the AM and PM peak hours (i.e., by contributing more than 5 percent of trips to the critical vehicle movements).
Conclusion: Operations at the intersection of Old County Road and Bayshore Boulevard would be reduced to unacceptable levels under all four development scenarios. This would result in a significant cumulative impact. Mitigation Measure 4.N-3b is recommended.
Mitigation
Mitigation Measure 4.N-3b:20 At the signalized intersection of Old County Road & Bayshore Boulevard,21 the eastbound approach shall be restriped to create one additional exclusive through lane. In addition, the southbound approach shall be restriped to create two additional lanes: an added exclusive left-turn pocket and an added through lane for the southbound approach. Eastbound Tunnel Avenue shall be widened to the east of its existing alignment to accommodate two receiving lanes for the southbound left and eastbound through traffic. These improvements shall be completed prior to issuance of the first building occupancy permit for new development other than improvement or relocation of an existing use within the Project Site.
Conclusion with Mitigation: For the AM peak hour, implementation of Mitigation Measure 4.N-3b would improve operations at Old County Road & Bayshore Boulevard (#4) to acceptable (LOS C) levels, reducing the impact to less than significant. In the PM peak hour, the mitigation would improve the operations to LOS E, which still exceeds the maximum allowable standard (LOS C) assigned for this intersection per the Brisbane General Plan. Therefore, even with
20 Mitigation Measure 4.N-1b provides for mitigation of Project Site development-related impacts in the Existing plus
Project condition, while this mitigation measure provides for mitigation in the Cumulative With Project condition. This mitigation measure is based on needed modification to the existing, baseline configuration of the intersection, and does not assume that Mitigation Measure 4.N-1b is implemented.
21 Existing Bayshore Boulevard at Old County Road is approximately 80 feet wide and includes two through lanes for each direction and a median. Dedicated right-turn yield lanes are currently provided at all four approaches.
Mitigation Measure Applicability by Scenario
DSP DSP-V CPP CPP-V
= measure applies - = measure does not apply

4. Environmental Setting, Impacts, and Mitigation Measures
4.N Traffic and Circulation
Brisbane Baylands 4.N-117 ESA / 206069 Draft EIR June 2013
inclusion of Mitigation Measure 4.N-3b, Project Site development impacts on the cumulative traffic conditions at the intersection of Old County Road & Bayshore Boulevard would be significant and unavoidable based on the maximum allowable standard (LOS C).
Impact at Tunnel Avenue & Bayshore Boulevard (Intersection 12)
At the signalized intersection of Tunnel Avenue & Bayshore Boulevard, all four proposed development scenarios would contribute considerably to a significant cumulative impact during the AM and PM peak hours (i.e., by contributing more than 5 percent of trips to the critical vehicle movements).
Mitigation
No feasible mitigation measures were identified to reduce the impact below a level of significance. Traffic signals on the Tunnel Avenue & Bayshore Boulevard intersection are under control of SFMTA and currently timed to give priority to transit movements. SFMTA has indicated that there may be slight adjustments to the traffic signal timing for intersections along the T-Third route that could be implemented to reduce auto delay at signalized intersections without degrading transit travel times. However, those improvements would not be sufficient to improve intersection operations to the acceptable levels.
Conclusion: Operations at the intersection of Tunnel Avenue and Bayshore Boulevard would be reduced to unacceptable levels under all four development scenarios. No feasible mitigation measure exists, and the cumulative impact would be significant and unavoidable.
Impact at Sunnydale Avenue & Bayshore Boulevard (Intersection 15)
At the signalized intersection of Sunnydale & Bayshore Boulevard, all four proposed development scenarios would contribute considerably to a significant cumulative impact during the AM and PM peak hours (i.e., by contributing more than 5 percent of trips to the critical vehicle movements).
Mitigation
No feasible mitigation measures were identified to reduce the impact below a level of significance. Traffic signals on the Sunnydale Avenue & Bayshore Boulevard intersection are under control of SFMTA and currently timed to give priority to transit movements. SFMTA has indicated that there may be slight adjustments to the traffic signal timing for intersections along the T-Third route that could be implemented to reduce auto delay at signalized intersections without degrading transit travel times. However, those improvements would not be sufficient to improve intersection operations to the acceptable levels.
Conclusion: Operations at the intersection of Sunnydale Avenue and Bayshore Boulevard would be reduced to unacceptable levels under all four development scenarios. No feasible mitigation measure exists, and the cumulative impact would be significant and unavoidable.

4. Environmental Setting, Impacts, and Mitigation Measures
4.N Traffic and Circulation
Brisbane Baylands 4.N-118 ESA / 206069 Draft EIR June 2013
Overall Conclusion for Impacts at Bayshore Boulevard Intersections
In addition to Mitigation Measures 4.N-3a and 4.N-3b, evaluation was made of the potential for widening Bayshore Boulevard to provide three travel lanes in each direction, turn pockets at each intersection, and sidewalk improvements, along with re-coordinating signal timing settings to provide more green time to the westbound and eastbound split phases and reduce green time for the northbound and southbound approaches to the increase in capacity on Bayshore Boulevard. Currently, the Bayshore Boulevard corridor is approximately 90 feet wide, with two lanes each direction and a median of approximately 20 feet. It would therefore be possible to restripe Bayshore Boulevard as proposed to provide six through lanes, three northbound and three southbound. Reconfiguring Bayshore Boulevard would require major right-of-way acquisition and result in secondary impacts pertaining to transit operations, pedestrian and bicycle circulation, and safety due to longer crossing distances. This secondary impact could be partially mitigated through pedestrian enhancements such as separated sidewalks along the length of Bayshore Boulevard; incorporating design elements that would reduce speeds to less than 30 miles per hour such as narrower travel lanes, landscape features, more frequent signalization; and providing frequent (every 500 to 750 feet) safe crossing treatments for pedestrians. Widening of Bayshore Boulevard would also require major construction costs as well as potential displacement of existing businesses.
While widening of Bayshore Boulevard and modifying signal timing would improve intersection operations to LOS D at the adversely affected intersections at Geneva Avenue & Bayshore Boulevard (#1) and Old County Road & Bayshore Boulevard (#4), restriping Bayshore Boulevard north of Geneva Avenue is infeasible due to right-of-way constraints associated with the T-Third LRT that terminates at the station just south of Sunnydale Avenue. Traffic signals on intersections at Sunnydale Avenue (#15) as well as Tunnel Avenue (#12) are under control of SFMTA and currently timed to give priority to transit movements. SFMTA has indicated that there may be slight adjustments to the traffic signal timing for intersections along the T-Third route that could be implemented to reduce auto delay at signalized intersections without degrading transit travel times. However, those improvements would not be sufficient to improve intersection operations to the acceptable levels.
With inclusion of Mitigation Measure 4.N-3a and Mitigation Measure 4.N-3b, Project Site development would result in significant impacts on the cumulative traffic conditions along Bayshore Boulevard south of Geneva Avenue (i.e. Geneva Avenue & Bayshore Boulevard and Old County Road & Bayshore Boulevard), but Project Site development impacts would remain significant and unavoidable for Bayshore intersections north of Geneva Avenue (i.e. Tunnel Avenue & Bayshore Boulevard [#12] and Sunnydale Avenue & Bayshore Boulevard [#15]). In addition, significant secondary impacts associated with Mitigation Measures 4.N-3a and 4.N-3b could be mitigated, but to an unspecified degree. Therefore, Project Site development impacts on the cumulative traffic operations at intersections on Bayshore Boulevard in the Project Site vicinity would remain significant and unavoidable.
Impact at Sierra Point Parkway & US 101 Ramps (Intersection 6)
At the intersection of Sierra Point Parkway & US 101 Ramps, Project Site development would contribute to significant cumulative traffic impacts in the AM and PM peak hours (i.e., the
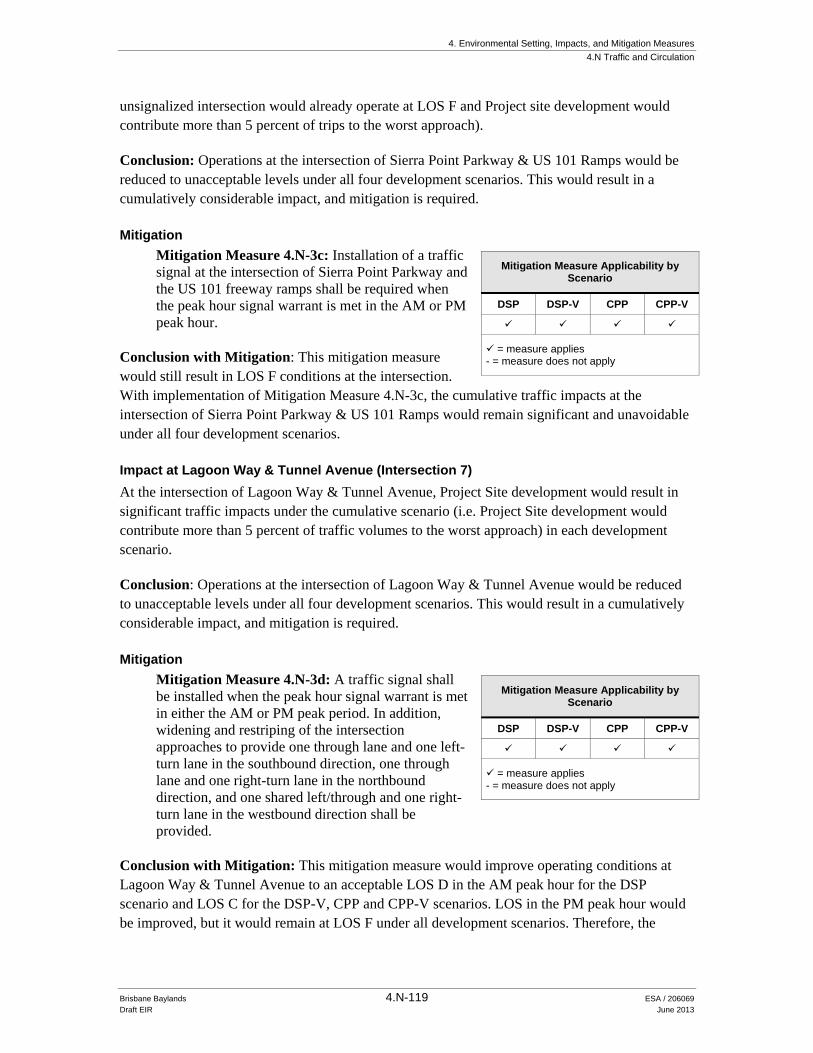
4. Environmental Setting, Impacts, and Mitigation Measures
4.N Traffic and Circulation
Brisbane Baylands 4.N-119 ESA / 206069 Draft EIR June 2013
unsignalized intersection would already operate at LOS F and Project site development would contribute more than 5 percent of trips to the worst approach).
Conclusion: Operations at the intersection of Sierra Point Parkway & US 101 Ramps would be reduced to unacceptable levels under all four development scenarios. This would result in a cumulatively considerable impact, and mitigation is required.
Mitigation
Mitigation Measure 4.N-3c: Installation of a traffic signal at the intersection of Sierra Point Parkway and the US 101 freeway ramps shall be required when the peak hour signal warrant is met in the AM or PM peak hour.
Conclusion with Mitigation: This mitigation measure would still result in LOS F conditions at the intersection. With implementation of Mitigation Measure 4.N-3c, the cumulative traffic impacts at the intersection of Sierra Point Parkway & US 101 Ramps would remain significant and unavoidable under all four development scenarios.
Impact at Lagoon Way & Tunnel Avenue (Intersection 7)
At the intersection of Lagoon Way & Tunnel Avenue, Project Site development would result in significant traffic impacts under the cumulative scenario (i.e. Project Site development would contribute more than 5 percent of traffic volumes to the worst approach) in each development scenario.
Conclusion: Operations at the intersection of Lagoon Way & Tunnel Avenue would be reduced to unacceptable levels under all four development scenarios. This would result in a cumulatively considerable impact, and mitigation is required.
Mitigation
Mitigation Measure 4.N-3d: A traffic signal shall be installed when the peak hour signal warrant is met in either the AM or PM peak period. In addition, widening and restriping of the intersection approaches to provide one through lane and one left-turn lane in the southbound direction, one through lane and one right-turn lane in the northbound direction, and one shared left/through and one right-turn lane in the westbound direction shall be provided.
Conclusion with Mitigation: This mitigation measure would improve operating conditions at Lagoon Way & Tunnel Avenue to an acceptable LOS D in the AM peak hour for the DSP scenario and LOS C for the DSP-V, CPP and CPP-V scenarios. LOS in the PM peak hour would be improved, but it would remain at LOS F under all development scenarios. Therefore, the
Mitigation Measure Applicability by Scenario
DSP DSP-V CPP CPP-V
= measure applies - = measure does not apply
Mitigation Measure Applicability by Scenario
DSP DSP-V CPP CPP-V
= measure applies - = measure does not apply

4. Environmental Setting, Impacts, and Mitigation Measures
4.N Traffic and Circulation
Brisbane Baylands 4.N-120 ESA / 206069 Draft EIR June 2013
cumulative traffic impacts at the intersection would be significant and unavoidable. Because Project Site development would contribute more than 5 percent of the traffic to the worst approach, its contribution would be cumulatively considerable.
Impact at Lagoon Way & Sierra Point Parkway (Intersection 8)
At the intersection of Lagoon Way & Sierra Point Parkway, Project Site development would result in significant traffic impacts under the cumulative scenario (i.e. Project Site development-related traffic would contribute more than 5 percent of traffic volumes to the worst approach) for each development scenario.
Conclusion: Operations at the intersection of Lagoon Way & Sierra Point Parkway would be reduced to unacceptable levels under all four development scenarios. This would result in a cumulatively considerable impact, and mitigation is required.
Mitigation
Mitigation Measure 4.N-3e: A traffic signal shall be installed when the peak hour signal warrant is met in either the AM or PM peak period. In addition, the Lagoon Way/Sierra Point Parkway intersection shall be widened and intersection approaches shall be restriped to provide two through lanes and one right-turn lane in the southbound direction, one through lane and two left-turn lanes in the northbound direction, and two left-turn lanes and one right-turn lane in the eastbound direction. Additional road widening on Lagoon Road & Sierra Point Parkway would also be required.
Conclusion with Mitigation: This mitigation measure would improve operating conditions at Lagoon Way & Sierra Point Parkway to an acceptable LOS C in the AM peak hour. LOS would be improved, but it would remain unacceptable at LOS F under the DSP scenario and LOS E under the DSP-V, CPP, and CPP-V scenarios in the PM peak hour. Even with the implementation of Mitigation Measure 4.N-3e, the cumulative traffic impacts at the intersection would be significant and unavoidable. Because Project Site development-related traffic would contribute more than 5 percent of traffic volumes to the worst approach, its contribution to the significant unavoidable impact is considered to be cumulatively considerable.
Impact at Geneva Avenue/US 101 SB Ramps (Intersection 9)
At the intersection of Geneva Avenue and the US 101 SB Ramps, development of the Project site would result in significant traffic impacts under the cumulative scenario (i.e. Project Site development would contribute more than 5 percent of traffic volumes to the eastbound critical movement) under each development scenario.
Conclusion: Operations at the intersection of Geneva Avenue & US 101 SB Ramps would be reduced to unacceptable levels under all four development scenarios. This would result in a cumulatively considerable impact, and mitigation is required.
Mitigation Measure Applicability by Scenario
DSP DSP-V CPP CPP-V
= measure applies - = measure does not apply
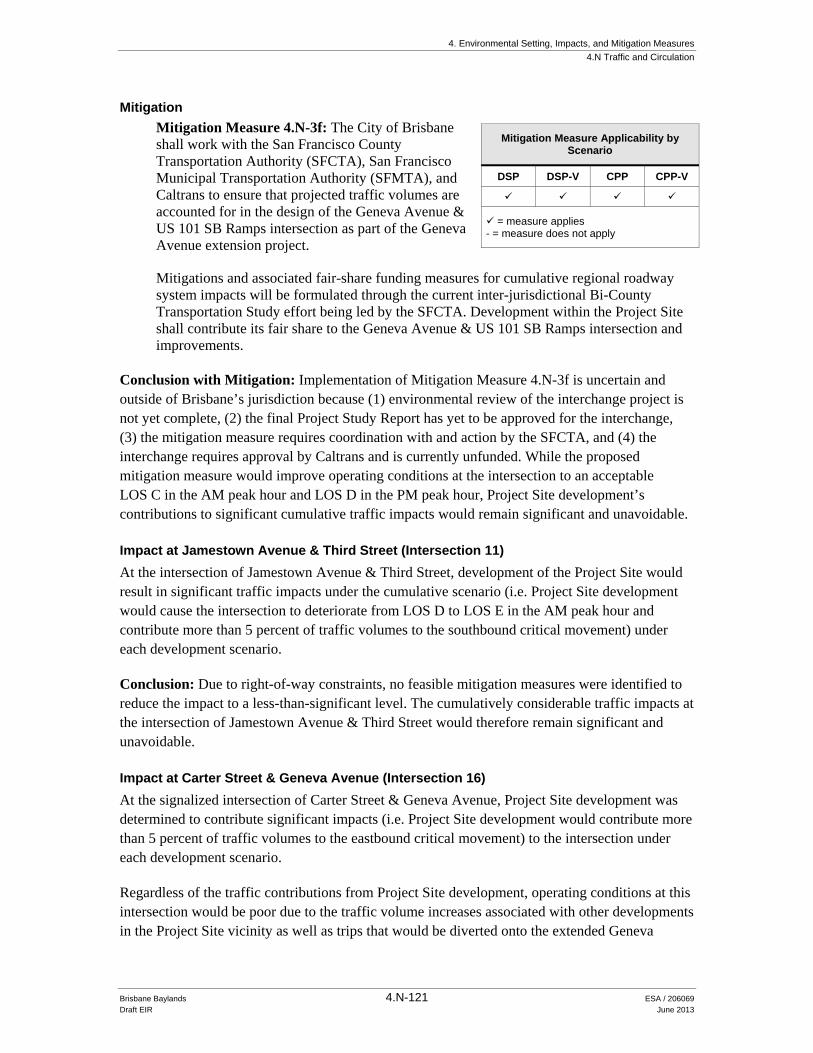
4. Environmental Setting, Impacts, and Mitigation Measures
4.N Traffic and Circulation
Brisbane Baylands 4.N-121 ESA / 206069 Draft EIR June 2013
Mitigation
Mitigation Measure 4.N-3f: The City of Brisbane shall work with the San Francisco County Transportation Authority (SFCTA), San Francisco Municipal Transportation Authority (SFMTA), and Caltrans to ensure that projected traffic volumes are accounted for in the design of the Geneva Avenue & US 101 SB Ramps intersection as part of the Geneva Avenue extension project.
Mitigations and associated fair-share funding measures for cumulative regional roadway system impacts will be formulated through the current inter-jurisdictional Bi-County Transportation Study effort being led by the SFCTA. Development within the Project Site shall contribute its fair share to the Geneva Avenue & US 101 SB Ramps intersection and improvements.
Conclusion with Mitigation: Implementation of Mitigation Measure 4.N-3f is uncertain and outside of Brisbane’s jurisdiction because (1) environmental review of the interchange project is not yet complete, (2) the final Project Study Report has yet to be approved for the interchange, (3) the mitigation measure requires coordination with and action by the SFCTA, and (4) the interchange requires approval by Caltrans and is currently unfunded. While the proposed mitigation measure would improve operating conditions at the intersection to an acceptable LOS C in the AM peak hour and LOS D in the PM peak hour, Project Site development’s contributions to significant cumulative traffic impacts would remain significant and unavoidable.
Impact at Jamestown Avenue & Third Street (Intersection 11)
At the intersection of Jamestown Avenue & Third Street, development of the Project Site would result in significant traffic impacts under the cumulative scenario (i.e. Project Site development would cause the intersection to deteriorate from LOS D to LOS E in the AM peak hour and contribute more than 5 percent of traffic volumes to the southbound critical movement) under each development scenario.
Conclusion: Due to right-of-way constraints, no feasible mitigation measures were identified to reduce the impact to a less-than-significant level. The cumulatively considerable traffic impacts at the intersection of Jamestown Avenue & Third Street would therefore remain significant and unavoidable.
Impact at Carter Street & Geneva Avenue (Intersection 16)
At the signalized intersection of Carter Street & Geneva Avenue, Project Site development was determined to contribute significant impacts (i.e. Project Site development would contribute more than 5 percent of traffic volumes to the eastbound critical movement) to the intersection under each development scenario.
Regardless of the traffic contributions from Project Site development, operating conditions at this intersection would be poor due to the traffic volume increases associated with other developments in the Project Site vicinity as well as trips that would be diverted onto the extended Geneva
Mitigation Measure Applicability by Scenario
DSP DSP-V CPP CPP-V
= measure applies - = measure does not apply

4. Environmental Setting, Impacts, and Mitigation Measures
4.N Traffic and Circulation
Brisbane Baylands 4.N-122 ESA / 206069 Draft EIR June 2013
Avenue for access to US 101, and for Project Site development-generated trips to and from the Daly City and Colma areas.
Conclusion: At the signalized intersection of Carter Street & Geneva Avenue, Project Site development would contribute to cumulatively considerable impacts under all development scenarios. Implementation of Mitigation Measure 4.N-3g below is therefore recommended.
Mitigation
Mitigation Measure 4.N-3g: Prior to the issuance of the first building occupancy permit for new development other than relocation or improvement of an existing use within the Project Site, signal timing settings at the Carter Street/Geneva Avenue intersection shall be modified by the City and County of San Francisco to provide longer green time on eastbound/westbound permitted movements and longer cycle length.
Conclusion with Mitigation: Implementation of this mitigation measure would improve delay conditions at the critical movements of eastbound through and northbound left movements, but it not enough to allow the intersection to operate at acceptable levels. In addition, implementation would require action by San Francisco that is not within Brisbane’s power to impose. Thus, although this mitigation measure is physically feasible, it is legally infeasible. As a result, impacts at the intersection of Carter Street/Geneva Avenue would remain significant and unavoidable under all Project Site development scenarios.
Impact at Geneva Avenue & Mission Street (Intersection 17)
At the intersection of Geneva Avenue & Mission Street, development of the Project Site would result in significant traffic impacts under the cumulative scenario (i.e. Project site development would more than 5 percent of traffic volumes to the eastbound critical movement) under each development scenario.
Conclusion: Due to right-of-way constraints, no feasible mitigation measures were identified to reduce the impact to a less-than-significant level. The cumulative traffic impact at the intersection of Geneva Avenue & Mission Street would therefore remain significant and unavoidable.
Impact at E. Market Street & Orange Street (Intersection 18)
At the unsignalized intersection of E. Market Street & Orange Street, development of the Project Site would contribute to significant cumulative traffic impacts in the AM peak hour with LOS F for any Project site development. Furthermore, the intersection would meet the criteria for the Caltrans peak hour signal warrant under all Project site development. Therefore, the impact on the intersection of E. Market Street & Orange Street is significant.
Conclusion: At the unsignalized intersection of E. Market Street & Orange Street, Project Site development would contribute to cumulatively considerable impacts under all development
Mitigation Measure Applicability by Scenario
DSP DSP-V CPP CPP-V
= measure applies - = measure does not apply

4. Environmental Setting, Impacts, and Mitigation Measures
4.N Traffic and Circulation
Brisbane Baylands 4.N-123 ESA / 206069 Draft EIR June 2013
scenarios in the AM peak hour. Implementation of Mitigation Measure 4.N-3h below is recommended.
Mitigation
Mitigation Measure 4.N-3h: A traffic signal shall be installed if determined to be safe when the hour signal warrant for the E. Market Street/Orange Street intersection is met in the PM peak hour.
Conclusion with Mitigation: Implementation of this mitigation measure would improve operating conditions at the intersection to an acceptable LOS A in the AM peak hour and reduce cumulative traffic impacts at the intersection of E. Market Street & Orange Street to below a less-than-significant level. However, prior to installation of a traffic signal, the full set of warrants should be investigated based on field-measured, rather than forecast, traffic data. Because the installation of signals can lead to certain types of collisions, regular monitoring of actual traffic conditions and accident data should be undertaken, along with timely reevaluation of the full set of warrants, prior to actual signalization of the intersection. Due to these considerations, it is uncertain that actual signalization of the intersection would occur, and mitigation of impacts at this intersection cannot therefore be guaranteed.
In addition, (1) this intersection is outside of Brisbane’s jurisdiction, within Daly City; and (2) there is currently no funding in place or any procedure that would guarantee the implementation of this suggested mitigation measure.
For these reasons, the cumulatively considerable impact at the intersection of E. Market Street & Orange Street would remain significant and unavoidable under all Project Site development scenarios.
Intersection Spacing along the Geneva Avenue Extension
As discussed under Impact 4.N-1, the Specific Plan prepared for the DSP and DSP-V scenarios proposes three intersections with full turning movements along the Geneva Avenue extension, including the roadway links between:
Bayshore Boulevard and “2nd Street” (approximately 600 feet between roadway centerlines):
“5th Street” and Tunnel Avenue, along either side of the Caltrain overpass (approximately 400 feet between roadway centerlines); and
“7th Street” and 8th Street west of US 101 (approximately 400 feet between roadway centerlines).
The close spacing of these intersections could cause traffic queuing up at one intersection along Geneva Avenue to back up into another intersection, even if each intersection met applicable LOS standards on its own. Such an interaction between two intersections would constitute a significant impact.
Mitigation Measure Applicability by Scenario
DSP DSP-V CPP CPP-V
= measure applies - = measure does not apply

4. Environmental Setting, Impacts, and Mitigation Measures
4.N Traffic and Circulation
Brisbane Baylands 4.N-124 ESA / 206069 Draft EIR June 2013
Conclusion: Because of the close spacing of certain intersections along the Geneva Avenue extension, traffic queuing up at one intersection along Geneva Avenue would back up into another intersection, creating congestion under the DSP and DSP-V development scenarios. Mitigation Measure 4.N-1g above was therefore recommended, and would ensure that significant impacts related to interactions between intersection operations do not occur under either Existing plus Project or Cumulative With Project conditions.
_________________________
Traffic Impact: Freeways
Impact 4.N-4: Would the Project’s contribution to future cumulative traffic impacts at freeway mainline segments be significant?
Freeway mainline level of service analysis was conducted for four locations on US 101 and freeway ramp analysis was prepared for six locations on US 101 under Cumulative Without Project conditions. For freeway mainline and ramp analyses, locations where Project Site development would result in a change from LOS D or better under Cumulative Without Project conditions to LOS E or LOS F, or a change from LOS E to LOS F, are identified as Project Site development impacts. At locations that would operate at LOS E or LOS F under Cumulative Without Project conditions and would continue to operate at LOS E or LOS F under Cumulative With Project conditions, trips associated with each of the proposed development scenarios, as a percentage of total traffic volumes on the facility, were reviewed to determine whether the increase would contribute considerably to total volumes on the facility.
Table 4.N-33 presents the results of the freeway mainline section analysis for Cumulative Without Project and Cumulative With Project conditions. None of the development scenarios would cause any freeway mainline segment to deteriorate from acceptable LOS D or better to LOS E or LOS F conditions.
Project Site development would also contribute cumulatively considerable amounts of traffic to three freeway mainline segments expected to operate at LOS E or LOS F under both Cumulative Without Project and Cumulative With Project conditions:
Weekday AM peak hour:
US 101 northbound mainline from Sierra Point Parkway to Harney Way/Geneva Avenue (LOS E to LOS E; DSP, DSP-V, CPP, and CPP-V scenarios)
US 101 northbound mainline from Harney Way/Geneva Avenue to Third Street/Bayshore Boulevard (LOS F to LOS F; all Project scenarios)
US 101 southbound from Harney Way/Geneva Avenue to Sierra Point Parkway (LOS F to LOS F; all Project scenarios)
Impact Significance by Scenario (before Mitigation)
DSP DSP-V CPP CPP-V
SU SU SU SU
SU = Significant Unavoidable SM = Significant but Mitigable LTS = Less than Significant - = no impact

4. Environmental Setting, Impacts, and Mitigation Measures
4.N Traffic and Circulation
Brisbane Baylands 4.N-125 ESA / 206069 Draft EIR June 2013
TABLE 4.N-33 MAINLINE SEGMENT LEVEL OF SERVICE –
CUMULATIVE WITHOUT PROJECT AND CUMULATIVE WITH PROJECT CONDITIONS
Mainline Segment
Cumulative Without Project
Cumulative With DSP
Cumulative With DSP-V
Cumulative With CPP
Cumulative With CPP-V
LOS V/Ca LOS V/C LOS V/C LOS V/C LOS V/C
Weekday AM Peak Hour
US 101
NB—Harney Way to Third/Bayshore F 1.01 F 1.05 F 1.04 F 1.06 F 1.06
NB—Sierra Point to Harney Way E 0.88 E 0.91 E 0.91 E 0.92 E 0.92
SB—Third/Bayshore to Harney Way F 1.19 F 1.31 F 1.30 F 1.30 F 1.30
SB—Harney/Geneva to Sierra Point F 1.14 F 1.16 F 1.16 F 1.16 F 1.16
Weekday PM Peak Hour
US 101
NB—Harney Way to Third/Bayshore F 1.12 F 1.23 F 1.22 F 1.24 F 1.24
NB—Sierra Point to Harney Way F 1.03 F 1.05 F 1.05 F 1.09 F 1.08
SB—Third/Bayshore to Harney Way F 1.12 F 1.15 F 1.16 F 1.20 F 1.20
SB—Harney/Geneva to Sierra Point F 0.93 F 0.97 F 0.97 F 0.99 F 0.99 Segments operating at Level of Service (LOS) F conditions highlighted in bold LOS determinations for freeway mainline segments were based on HCM 2000 LOS V/C Methodology per C/CAG guidelines.
SOURCE: Fehr and Peers, 2012
Weekday PM peak hour:
US 101 northbound mainline from Sierra Point Parkway to Harney Way/Geneva Avenue (LOS F to LOS F; all Project scenarios)
US 101 northbound mainline from Harney Way/Geneva Avenue to Third Street/Bayshore Boulevard (LOS F to LOS F; all Project scenarios)
US 101 southbound from Harney Way/Geneva Avenue to Sierra Point Parkway (LOS F to LOS F; all Project scenarios)
Conclusion: The cumulative contributions of Project Site development to LOS E or LOS F conditions at the three freeway mainline segments would be significant.
To minimize the potential for an increase in Project Site development-generated vehicles and Project Site development’s contribution to freeway mainline impacts, implementation of a TDM program (Mitigation Measure 4.N-13) would be required. With implementation of this mitigation measure, alternative modes would be encouraged, the use of single-occupant vehicles would be discouraged, and the impact of additional vehicles generated by development of the Project Site would be lessened. However, the impacts of Project Site development on freeway mainline operations would still remain significant. Implementation of Mitigation Measure 4.N-4 below is recommended.

4. Environmental Setting, Impacts, and Mitigation Measures
4.N Traffic and Circulation
Brisbane Baylands 4.N-126 ESA / 206069 Draft EIR June 2013
Mitigation
Mitigation Measure 4.N-4:The City of Brisbane, as part of the Geneva Avenue extension project, shall account for existing traffic, background traffic growth, and the most recent forecasts of traffic expected to be associated with each of several adjacent development projects, including development of the Project Site. Brisbane shall work with the San Francisco County Transportation Authority (SFCTA) and San Francisco Municipal Transportation Agency (SFMTA) to ensure projected traffic volumes are accounted for in the design of the Geneva Avenue Extension.
Mitigation measures and associated fair-share funding measures for cumulative regional roadway system impacts, including freeway segment impacts, will be formulated through the current inter-jurisdictional Bi-County Transportation Study update effort being led by the SFCTA. Development within the Project Site shall contribute its fair share to the Geneva Avenue extension project, based upon the SF-CHAMP model or such other model used by the SFCTA in the Bi-County Study. If the Bi-County Study is terminated prior to identification of required mitigations and adoption of fair share funding obligations, the City and County of San Francisco, the SFCTA, and the City of Brisbane shall meet and confer to establish an alternative method for determination of the respective fair shares of project costs, including amounts to be contributed by Project Site development, using the SF-CHAMP model or such other model agreed upon by the agencies.
Conclusion with Mitigation: While implementation of Mitigation Measures 4.N-13 and 4.N-4 would reduce this impact, Mitigation Measure 4.N-4 requires participation or and decisions by agencies over which Brisbane has no authority, and it is not within the City’s power to impose such mitigation. Thus, although Mitigation Measure 4.N-4 is physically feasible, it is legally infeasible. As a result, implementation of Mitigation Measure 4.N-4 cannot be guaranteed, and there can be no assurance that impacts would be reduced to a less-than-significant level. The impact would therefore remain significant and unavoidable under all four proposed development scenarios.
_________________________
Traffic Impact: DSP-V (Sold-Out Arena Event)
Impact 4.N-5: Would the Project (DSP-V scenario) result in a substantial increase in PM peak hour traffic at study intersections and freeway mainline segments that would operate unacceptably due to weekday evening events at the arena?
The impact analysis of arena events under Cumulative (2030) conditions with the DSP-V scenario assumed a weekday evening sold-out event at the approximately 17,000-seat arena.22 Although no specific program has been developed for events
22 Existing plus project arena impacts are evaluated as part of Impact 4.N-1. Mitigation for existing plus project arena
traffic is provided in Mitigation Measure 4.N-1f.
Mitigation Measure Applicability by Scenario
DSP DSP-V CPP CPP-V
= measure applies - = measure does not apply
Impact Significance by Scenario (before Mitigation)
DSP DSP-V CPP CPP-V
- SU - -
SU = Significant Unavoidable SM = Significant but Mitigable LTS = Less than Significant - = no impact

4. Environmental Setting, Impacts, and Mitigation Measures
4.N Traffic and Circulation
Brisbane Baylands 4.N-127 ESA / 206069 Draft EIR June 2013
at the arena, sold-out events with 17,000 attendees occurring during weekday evenings would likely be infrequent. Smaller-sized events during weekday evenings and events occurring during the day and on weekends would have fewer impacts due to the lower traffic volumes demands on the study area roadways.
Access to the arena would be via US 101, Bayshore Boulevard, Tunnel Avenue, and the improved roadway network at Geneva Avenue. The number of vehicles would vary by route and the size of the event.
During a weekday evening event, it is projected that approximately one half of vehicle trips generated by a sold-out arena event, or 2,267 vehicles, would arrive approximately 1 hour prior to an event beginning, likely between 5:00 and 6:00 PM, and therefore would coincide with the weekday PM peak hour. Project vehicle trips would be added to the following freeway facilities that would operate at LOS F during the weekday PM peak hour for the DSP-V scenario:
US 101 northbound from Sierra Point to Harney Way US 101 northbound off-ramp to Harney Way US 101 southbound from Bayshore/Third Street to Harney Way US 101 southbound off-ramp to Harney Way
Table 4.N-34 presents a comparison of intersection LOS operating conditions for developed Project site weekday PM peak hour conditions without a sold-out event to conditions with a sold-out event at the arena.
Traffic associated with a sold-out arena event would exacerbate traffic operations at 13 intersections that would operate at LOS E or LOS F conditions under the DSP-V scenario without an event:
Geneva Avenue & Bayshore Boulevard Old County Road & Bayshore Boulevard San Bruno Avenue & Bayshore Boulevard Sierra Point Parkway & US 101 Northbound Ramps Lagoon Way & Tunnel Avenue Lagoon Way & Sierra Point Parkway Geneva Avenue & US 101 Southbound Ramps Jamestown Avenue & Third Street Tunnel Avenue & Bayshore Boulevard Sunnydale Avenue & Bayshore Boulevard Geneva Avenue & Carter Street Geneva Avenue & Mission Street
At the intersection of Blanken Avenue and Bayshore Boulevard, a sold out even would increase weekday PM peak hour traffic from LOS D to LOS E.
Conclusion: Overall, because local streets and freeway facilities would experience increased congestion prior to an arena event, traffic impacts associated with the new arena under the DSP-V would be significant. Mitigation Measure 4.N-5 below is recommended.

4. Environmental Setting, Impacts, and Mitigation Measures
4.N Traffic and Circulation
Brisbane Baylands 4.N-128 ESA / 206069 Draft EIR June 2013
TABLE 4.N-34 INTERSECTION LEVEL OF SERVICE – PROJECT NO EVENT AND SOLD-OUT ARENA EVENT –
WEEKDAY PM PEAK HOUR – CUMULATIVE WITH DSP-V SCENARIO
Intersection
Cumulative With DSP-V No Event
Cumulative With DSP-V Sold-Out Event
Delaya LOSb Delay LOS
1 Geneva Avenue/Bayshore Boulevard > 80 F >80 F
2 Guadalupe Canyon Parkway/Bayshore Boulevard 47 D 46 D
3 Valley Drive/Bayshore Boulevard 45 D 53 D
4 Old County Road/Bayshore Boulevard > 80 F > 80 F
5 San Bruno Avenue/Bayshore Boulevard > 50 F(EB) > 50 F(EB)
6 Sierra Point Parkway/US 101 NB Ramps > 50 F(WB) > 50 F(WB)
7 Lagoon Way/Tunnel Avenue > 50 F(SB) > 50 F(SB)
8 Lagoon Way/Sierra Point Parkway > 50 F(EB) > 50 F(EB)
9 Geneva Avenue/US 101 SB Rampsc > 80 F > 80 F
10 Harney Way/Thomas Mellon Drived 27 C 27 C
11 Jamestown Avenue/Third Street > 80 F > 80 F
12 Tunnel Avenue/Bayshore Boulevard > 80 F > 80 F
13 Blanken Avenue/Tunnel Avenuee 25 C 26 C
14 Blanken Avenue/Bayshore Boulevard 53 D 58 E
15 Sunnydale Avenue/Bayshore Boulevard > 80 F > 80 F
16 Geneva Avenue/Carter Street > 80 F > 80 F
17 Geneva Avenue/Mission Street > 80 F > 80 F
18 E. Market Street/Orange Street 22 C(WB) 25 C(WB) a Delay in seconds per vehicle. b Intersections operating at unacceptable level of service (LOS) conditions highlighted in bold. c Year 2030 analysis includes signalization at Geneva Avenue & US 101 Southbound Ramps as part of the Geneva Avenue extension
project. d Year 2030 analysis includes signalization at Harney Way & US 101 Northbound Ramps as part of the Harney Way widening project. e Year 2030 analysis includes signalization at Blanken Avenue & Tunnel Avenue.
SOURCE: Fehr & Peers, 2012
Mitigation
Mitigation Measure 4.N-5: Prior to issuance of building occupancy permits for the arena, the operator shall develop and submit to the City a Transportation Management Plan for deploying traffic control officers in the Project Site vicinity to increase efficiency of pre- and post-event traffic, and for developing incentives to increase transit ridership to the arena, such as parking pricing policies, customer information strategies, and/or ticket/other related discounts with proof of payment for transit. Implementation of this plan shall be designed to speed vehicle entrance to and exit from the arena site, as well as maintain
Mitigation Measure Applicability by Scenario
DSP DSP-V CPP CPP-V
- - -
= measure applies - = measure does not apply

4. Environmental Setting, Impacts, and Mitigation Measures
4.N Traffic and Circulation
Brisbane Baylands 4.N-129 ESA / 206069 Draft EIR June 2013
orderly traffic operations and prevent turning movements that would intrude onto minor routes to and from the arena. Traffic control officers shall be provided on event dates to, at a minimum, facilitate traffic flow at the intersection of Valley Drive & Bayshore Boulevard, which would otherwise operate at LOS E conditions without manual traffic control by officers at the intersection with a sold-out arena event. Preparation and implementation of the plan shall be fully funded by the arena operator and shall be completed to the satisfaction of the City prior to opening day of the arena.
Conclusion with Mitigation: Implementing this mitigation measure would likely reduce automobile traffic to the arena and encourage transit usage. However, significant traffic delays would still likely occur at some of the adversely affected intersections. Therefore, even with the inclusion of Mitigation Measure 4.N-5, impacts on the study roadway network during a sold-out event at the arena would be significant and unavoidable under the DSP-V scenario.
_________________________
Conflict with Adopted Policies, Plans, or Programs Regarding Public Transit, Bikeways, or Pedestrian Facilities
Transit Conditions (Existing plus Project and Cumulative With Project)
Transit Impact: BART/Caltrain
Impact 4.N-6: Would the Project cause an increase in transit demand that could not be accommodated by train transit capacity (BART and Caltrain), or would require changes to Caltrain operations at the Bayshore Station and on the Bayshore/Brisbane four-track rail segment, resulting in unacceptable levels of transit service?
Regional Transit Screenlines
Existing and Cumulative Without Project regional transit screenlines are presented in Table 4.N-35. The contribution of Project Site development to existing and cumulative transit volumes at regional screenline locations is shown below for each Project Site development scenario. The regional screenline analysis was conducted for the following three screenline locations (see Table 4.N-36 [DSP], Table 4.N-37 [DSP-V], Table 4.N-38 [CPP], and Table 4.N-39 [CPP-V] for Project Site development screenline analysis):
BART East Bay (Transbay Tube): Project Site development’s contribution to the BART East Bay screenline (based on Transbay Tube transit ridership and capacity) reflects the forecasted volume of Project Site development-generated transit trips to and from the East Bay (approximately 10 to 11 percent of generated trips). The Existing and Cumulative Without Project transit volumes and capacity assumptions are derived from the CPHPS EIR.
BART South Bay (Daly City/Colma/South San Francisco): Project Site development’s contribution to the BART South Bay screenline is based on transit ridership and capacity on the BART line at the peak load point south of the Daly City Station (based on the Cumulative
Impact Significance by Scenario (before Mitigation)
DSP DSP-V CPP CPP-V
LTS LTS LTS LTS
SU = Significant Unavoidable SM = Significant but Mitigable LTS = Less than Significant - = no impact

4. Environmental Setting, Impacts, and Mitigation Measures
4.N Traffic and Circulation
Brisbane Baylands 4.N-130 ESA / 206069 Draft EIR June 2013
TABLE 4.N-35 EXISTING AND CUMULATIVE WITHOUT PROJECT REGIONAL TRAIN TRANSIT SCREENLINES
Existing – AM Peak Hour Cumulative Without Project – AM Peak Hour
Ridership Capacity Utilization Ridership Capacity Utilization
BART East Bay 18,064 14,686 123% BART East Bay 36,202 19,569 185%
BART South Bay 11,185 10,652 105% BART South Bay 12,416 13,951 89%
Caltrain South Bay 3,155 6,500 49% Caltrain South Bay 5,478 6,500 84%
Existing – PM Peak Hour Cumulative Without Project – PM Peak Hour
Ridership Capacity Utilization Ridership Capacity Utilization
BART East Bay 16,985 14,154 120% BART East Bay 30,268 19,655 154%
BART South Bay 9,545 10,375 92% BART South Bay 10,707 14,088 76%
Caltrain South Bay 3,420 6,500 53% Caltrain South Bay 5,442 6,500 84%
SOURCE: Fehr & Peers, 2012
TABLE 4.N-36 DSP CONTRIBUTION TO REGIONAL TRAIN TRANSIT SCREENLINES
Existing plus DSP – AM Peak Hour Increase Due to Project
Cumulative With DSP – AM Peak Hour
Project Share of
Cumulative Growth Ridership Capacity Utilization Ridership Capacity Utilization
BART East Bay 18,220 14,486 126% 0.9% 36,358 19,569 186% 0.9%
BART South Bay 11,327 10,652 106% 1.3% 12,558 13,951 90% 10%
Caltrain South Bay 3,510 6,500 54% 11% 5,819 6,500 90% 14%
Existing plus DSP – PM Peak Increase Due to Project
Cumulative With DSP – PM Peak Project Share of
Cumulative Growth Ridership Capacity Utilization Ridership Capacity Utilization
BART East Bay 17,140 14,154 121% 0.9% 30,423 19,655 155% 1.2%
BART South Bay 9,686 10,652 91% 1% 10,848 13,951 78% 11%
Caltrain South Bay 3,759 6,500 58% 10% 5,781 6,500 89% 14%
SOURCE: Fehr & Peers, 2012

4. Environmental Setting, Impacts, and Mitigation Measures
4.N Traffic and Circulation
Brisbane Baylands 4.N-131 ESA / 206069 Draft EIR June 2013
TABLE 4.N-37 DSP-V CONTRIBUTION TO REGIONAL TRAIN TRANSIT SCREENLINES
Existing plus DSP-V – AM Peak Increase Due to Project
Cumulative With DSP-V – AM Peak Project Share of
Cumulative Growth Ridership Capacity Utilization Ridership Capacity Utilization
BART East Bay 18,194 14,486 126% 0.7% 36,332 19,569 186% 0.7%
BART South Bay 11,315 10,652 106% 1.2% 12,546 13,951 90% 10%
Caltrain South Bay 3,467 6,500 53% 10% 5,790 6,500 89% 13%
Existing plus DSP-V – PM Peak Increase Due to Project
Cumulative With DSP-V – PM Peak Project Share of
Cumulative Growth Ridership Capacity Utilization Ridership Capacity Utilization
BART East Bay 17,116 14,154 121% 0.8% 30,399 19,655 155% 1.0%
BART South Bay 9,676 10,652 91% 1.4% 10,838 13,951 78% 10%
Caltrain South Bay 3,735 6,500 57% 9% 5,757 6,500 89% 13%
SOURCE: Fehr & Peers, 2012
TABLE 4.N-38 CPP CONTRIBUTION TO REGIONAL TRAIN TRANSIT SCREENLINES
Existing plus CPP – AM Peak Increase Due to Project
Cumulative With CPP – AM Peak Project Share of
Cumulative Growth Ridership Capacity Utilization Ridership Capacity Utilization
BART East Bay 18,239 14,486 126% 1.0% 36,377 19,569 186% 1.0%
BART South Bay 11,344 10,652 106% 1.4% 12,543 13,951 90% 9%
Caltrain 3,601 6,500 55% 14% 5,860 6,500 90% 15%
Existing plus CPP – PM Peak Increase Due to Project
Cumulative With CPP – PM Peak Project Share of
Cumulative Growth Ridership Capacity Utilization Ridership Capacity Utilization
BART East Bay 17,182 14,154 121% 1.2% 30,465 19,655 155% 1.5%
BART South Bay 9,724 10,652 91% 2% 10,886 13,951 78% 13%
Caltrain South Bay 3,922 6,500 60% 15% 5,872 6,500 90% 18%
SOURCE: Fehr & Peers, 2012

4. Environmental Setting, Impacts, and Mitigation Measures
4.N Traffic and Circulation
Brisbane Baylands 4.N-132 ESA / 206069 Draft EIR June 2013
TABLE 4.N-39 CPP-V CONTRIBUTION TO REGIONAL TRANSIT SCREENLINES
Existing plus CPP-V – AM Peak Increase Due to Project
Cumulative With CPP-V – AM Peak Project Share of
Cumulative Growth Ridership Capacity Utilization Ridership Capacity Utilization
BART East Bay 18,228 14,486 126% 0.9% 36,366 19,569 186% 0.9%
BART South Bay 11,334 10,652 106% 1.3% 12,535 13,951 90% 9%
Caltrain 3,573 6,500 55% 13% 5,836 6,500 90% 15%
Existing plus CPP-V – PM Peak Increase Due to Project
Cumulative With CPP-V – PM Peak Project Share of
Cumulative Growth Ridership Capacity Utilization Ridership Capacity
Utilization
BART East Bay 17,172 14,154 121% 1.1% 30,455 19,655 155% 1.4%
BART South Bay 9,715 10,652 91% 2% 10,877 13,951 78% 13%
Caltrain South Bay 3,897 6,500 60% 14% 5,851 6,500 90% 17%
SOURCE: Fehr & Peers, 2012
Without Project volumes and capacity as described in the CPHPS EIR) to account for Project Site transit trips to/from Daly City, Colma, and adjacent locations in the northern San Mateo County area. Based on the travel demand forecast, 20 percent of Project Site development-related trips would be to and from northern San Mateo County destinations. Based on that forecast, up to 10 percent of Project Site development -related transit trips would be made via BART (via a connection to the Project Site from the Balboa Park BART Station). Given the many transit services available at the Daly City BART Station, a significant portion of riders would enter and exit the BART system at that station and thus would not affect ridership volumes at the screenline to the south (where BART capacity is reduced because a portion of BART service terminates at the Daly City BART Station).
Caltrain: Project Site development’s contribution to the Caltrain South Bay screenline is based on transit ridership and capacity on the Caltrain line at the peak load point south of San Francisco. The increase in ridership under Cumulative Without Project conditions is based on the net increase in ridership described in the CPHPS EIR (including trips generated by the approved CPHPS development). Because the Project Site is located roughly at the peak load point, Project Site development-related trips would be dispersed, such that northbound and southbound Project Site development-related trips would not affect the peak load volume (i.e., passengers traveling to and from the south would occupy different trains from passengers traveling to and from the north). Given this dispersal, the maximum contribution of Project Site development to Caltrain peak-load volume would be about 600 PM peak hour riders (to and from the south) under the CPP scenario. The maximum Project contribution to the Caltrain peak load volume under the DPP scenario would be about 384 PM Peak Hour riders.
Impact on BART Capacity
The additional of transit ridership resulting from proposed Project Site development scenarios would contribute to regional train transit volumes that exceed capacity on the BART East Bay

4. Environmental Setting, Impacts, and Mitigation Measures
4.N Traffic and Circulation
Brisbane Baylands 4.N-133 ESA / 206069 Draft EIR June 2013
line (under Existing and Cumulative Without Project conditions) and on the BART South Bay line (under Cumulative Without Project conditions). However, the contribution of Project Site development would represent less than 2 percent of the forecasted increase in transit demand. The increase in Project Site development -related ridership demand would cause neither an unacceptable level of transit service nor an increase to transit demand greater than 2 percent.23 Therefore, Project site development’s contribution to the cumulative impact is less than significant. Impacts resulting from increased BART ridership demand on Muni service in the Geneva Avenue corridor, to/from the Balboa Park BART Station, are described separately in Impact 4.N-7.
Impact on Caltrain Capacity
Ridership volume with or without Project Site development is not forecasted to exceed capacity on the Caltrain line, based on the peak hour service levels operated by Caltrain as of April 2012 (five trains in each direction during the AM and PM peak hours),24 including those trains that currently pass the screenline without stopping at the Bayshore Station. This finding does not require an increase in the total number of trains operated by Caltrain.
Impact on Caltrain Operations at Bayshore Station and on Bayshore/Brisbane Four-Track Rail Segment
Under Existing conditions, Baby Bullet and Limited trains do not stop at the Bayshore Station, in part due to low ridership demand compared to other stations, as current ridership demand is less than 300 transit trips per day via Caltrain (inbound and outbound), and also due to the station location on one of the few four-track segments on the Caltrain line.
During most hours of operation, two trains per hour operate in both directions, with one Local train making all stops including the Bayshore Station and one Limited train that does not stop at the Bayshore Station. During peak commute periods, additional Baby Bullet trains provide two to three additional trains per hour in both directions, for a total of four to five trains per hour in the peak commute directions. Following electrification, which is scheduled for completion in 2019, Caltrain would operate six trains per peak hour per direction. Service at the Bayshore Station
23 As discussed in Section 4.N.4 in relation to transit use, project site development would have a significant effect on
the environment if it would:
Cause an increase in transit demand that: - could not be accommodated by adjacent transit capacity (i.e., would exceed 100-percent capacity), or - would necessitate changes to Caltrain operations at the Bayshore Station and on the Bayshore/Brisbane
four-track rail segment, resulting in unacceptable levels of transit service; or cause an increase of more than 2 percent in transit demand on transit lines where transit demand exceeds
100-percent capacity under Existing or Cumulative Without Project conditions; or cause a substantial increase in delays or operating costs such that significant adverse impacts in transit service
levels could result (e.g., require additional buses or trains due to project transit trips); or cause an onsite transit demand that would not be adequately served by adjacent transit service (i.e., project-
generated demand for transit service would be located more than one-third mile from transit service at the Caltrain stations).
24 The number of trains serving the Bayshore Station has remained at one per hour per direction since issuance of the NOP (December 2010). Thus, current schedules provide an appropriate baseline condition.

4. Environmental Setting, Impacts, and Mitigation Measures
4.N Traffic and Circulation
Brisbane Baylands 4.N-134 ESA / 206069 Draft EIR June 2013
without Project Site development is expected to remain the same as today, although no schedules have been finalized.
The provision of Baby Bullet service was made possible following the construction of several four-track segments on the Caltrain line, allowing Baby Bullet trains to pass Local trains at key points on the line. Under Existing conditions, four-track operation is limited to just three segments on the 75-mile Caltrain line, including the four-track Bayshore Station / Brisbane segment (approximately 2 miles in length, extending from the Tunnel portal just north of the Bayshore Station to the northern half of Brisbane Lagoon, within the Project Site).
Project Site development would generate a substantial increase in Caltrain ridership, ranging from about 6,000 daily riders under the DSP and DSP-V scenarios to over 10,000 daily riders under the CPP and CPP-V scenarios.25 This level of ridership exceeds that of most stations on the Caltrain line today. In addition, additional ridership demand via the Bayshore Station would be generated by the planned CPHPS project, while improved connectivity between Bayshore Boulevard and the Bayshore Station would allow for increased use of the Bayshore Station to accommodate transfers from the Muni T-line and San Bruno Avenue bus lines.
Given the increased ridership demand, changes to Caltrain operations would be required. For example, based on the level of service provided to other, high-ridership Caltrain stations, it is likely that all, or at least most, trains (including Baby Bullet trains) would stop at the Bayshore Station, and Caltrain would not continue its current use of the Bayshore Station’s four-track segment as a strategic “passing zone” for Baby Bullet service. This, however, would be part of a natural adjustment process of operational changes that Caltrain and other transit providers make in response to changes to ridership levels and would not represent an adverse effect on level of transit service.
In addition, the added Caltrain ridership would generate a substantial increase in “farebox” revenue for Caltrain (a beneficial impact). Based on the CPP and CPP-V scenario ridership forecasts, approximately three million annual trips would be made via Caltrain to/from the Bayshore Station, potentially generating over $10 million in annual revenue (while the DPP and DPP-V scenarios could generate over $6 million in annual revenue).
Conclusion: None of the proposed development scenarios would cause an increase in transit demand that could not be accommodated by train transit capacity (BART and Caltrain), nor would any of the proposed scenarios require changes to Caltrain operations at the Bayshore Station or on the Bayshore/Brisbane four-track rail segment. The baseline and cumulative impacts would be less than significant under all four development scenarios, and no mitigation is required.
_________________________
25 The increased transit ridership in the CPP and CPP-V scenarios would occur even though vehicle trips in those
scenarios are greater than for the DSP and DSP-V scenarios due to the greater capture of onsite home-work trips in the DSP and DSP-V scenarios.

4. Environmental Setting, Impacts, and Mitigation Measures
4.N Traffic and Circulation
Brisbane Baylands 4.N-135 ESA / 206069 Draft EIR June 2013
Transit Impact: San Francisco Muni/SamTrans Demand
Impact 4.N-7: Would the Project cause an increase in transit demand that could not be accommodated by San Francisco Muni or SamTrans transit capacity?
San Francisco Transit Screenlines
The San Francisco screenline analysis was conducted for four quadrant screenline locations within San Francisco: northeast, northwest, southeast, and southwest. Existing and Cumulative Without Project San Francisco transit screenlines are presented in Table 4.N-40. The contribution of Project Site development scenarios to existing and cumulative transit volumes at San Francisco screenline locations is shown in Table 4.N-41 (DSP scenario), Table 4.N-42 (DSP-V scenario), Table 4.N-43 (CPP scenario), and Table 4.N-44 (CPP-V scenario).
TABLE 4.N-40 EXISTING AND CUMULATIVE WITHOUT PROJECT SAN FRANCISCO TRANSIT SCREENLINES
AM Peak Hour
Existing Cumulative Without Project
Ridership Capacity Utilization Ridership Capacity Utilization
Northeast 1,882 3,764 50% 3,008 3,856 78%
Northwest 7,434 11,437 65% 8,949 11,932 75%
Southeast 4,248 6,340 67% 7,536 10,184 74%
Southwest 6,627 8,720 76% 7,674 10,097 76%
Total 20,191 30,261 67% 27,167 36,069 75%
PM Peak Hour
Existing Cumulative Without Project
Ridership Capacity Utilization Ridership Capacity Utilization
Northeast 1,886 3,627 52% 3,140 4,026 78%
Northwest 6,621 10,186 65% 8,155 10,873 75%
Southeast 4,668 7,073 66% 8,223 9,907 83%
Southwest 7,434 9,655 77% 8,829 10,767 82%
Total 20,609 30,540 67% 28,347 35,573 80%
SOURCE: City and County of San Francisco, 2010
Impacts would occur if volume exceeds 85 percent capacity at San Francisco screenlines (based on capacity with standing passengers).
Impact Significance by Scenario (before Mitigation)
DSP DSP-V CPP CPP-V
SU SU SU SU
SU = Significant Unavoidable SM = Significant but Mitigable LTS = Less than Significant - = no impact

4. Environmental Setting, Impacts, and Mitigation Measures
4.N Traffic and Circulation
Brisbane Baylands 4.N-136 ESA / 206069 Draft EIR June 2013
TABLE 4.N-41 DSP CONTRIBUTION TO SAN FRANCISCO TRANSIT SCREENLINES
AM Peak Hour
Project Share of Growth
Existing plus DSP Cumulative With DSP
Ridership Capacity Utilization Ridership Capacity Utilization
Northeast 2,252 3,764 60% 3,378 3,856 88% 25%
Northwest 7,548 11,437 66% 9,063 11,932 76%
Southeast 4,603 6,340 73% 7,891 10,184 77%
Southwest 6,684 8,720 77% 7,731 10,097 77%
Total 21,086 30,261 70% 28,062 36,069 78%
PM Peak Hour
Project Share of Growth
Existing plus DSP Cumulative With DSP
Ridership Capacity Utilization Ridership Capacity Utilization
Northeast 2,253 3,627 62% 3,507 4,026 87% 23%
Northwest 6,734 10,186 66% 8,268 10,873 76%
Southeast 5,021 7,073 71% 8,576 9,907 87% 17%
Southwest 7,490 9,655 78% 8,885 10,767 83%
Total 21,499 30,540 70% 29,237 35,573 82%
SOURCE: City and County of San Francisco, 2010
TABLE 4.N-42 DSP-V CONTRIBUTION TO REGIONAL TRANSIT SCREENLINES
AM Peak Hour
Project Share of Growth
Existing plus DSP-V Cumulative With DSP-V
Ridership Capacity Utilization Ridership Capacity Utilization
Northeast 2,220 3,764 59% 3,346 3,856 87% 23%
Northwest 7,538 11,437 66% 9,053 11,932 76%
Southeast 4,573 6,340 72% 7,861 10,184 77%
Southwest 6,679 8,720 77% 7,726 10,097 77%
Total 21,009 30,261 69% 27,985 36,069 78%
PM Peak Hour
Project Share of Growth
Existing plus DSP-V Cumulative With DSP-V
Ridership Capacity Utilization Ridership Capacity Utilization
Northeast 2,227 3,627 61% 3,481 4,026 86% 21%
Northwest 6,726 10,186 66% 8,260 10,873 76%
Southeast 4,996 7,073 71% 8,551 9,907 86% 17%
Southwest 7,487 9,655 78% 8,882 10,767 82%
Total 21,436 30,540 70% 29,174 35,573 82%
SOURCE: City and County of San Francisco, 2010

4. Environmental Setting, Impacts, and Mitigation Measures
4.N Traffic and Circulation
Brisbane Baylands 4.N-137 ESA / 206069 Draft EIR June 2013
TABLE 4.N-43 CPP CONTRIBUTION TO SAN FRANCISCO TRANSIT SCREENLINES
AM Peak Hour
Existing plus CPP Cumulative With CPP
Ridership Capacity Utilization Ridership Capacity Utilization
Northeast 2,137 3,764 57% 3,263 3,856 85%
Northwest 7,561 11,437 66% 9,076 11,932 76%
Southeast 4,694 6,340 74% 7,982 10,184 78%
Southwest 6,707 8,720 77% 7,754 10,097 77%
Total 21,099 30,261 70% 28,075 36,069 78%
PM Peak Hour
Project Share of Growth
Existing plus CPP Cumulative With CPP
Ridership Capacity Utilization Ridership Capacity Utilization
Northeast 2,173 3,627 60% 3,427 4,026 85% 19%
Northwest 6,764 10,186 66% 8,298 10,873 76%
Southeast 5,114 7,073 72% 8,669 9,907 88% 17%
Southwest 7,514 9,655 78% 8,909 10,767 83%
Total 21,565 30,540 71% 29,303 35,573 82%
SOURCE: City and County of San Francisco, 2010
TABLE 4.N-44 CPP-V CONTRIBUTION TO SAN FRANCISCO TRANSIT SCREENLINES
AM Peak Hour
Existing plus CPP-V Cumulative With CPP-V
Ridership Capacity Utilization Ridership Capacity Utilization
Northeast 2,121 3,764 56% 3,247 3,856 84%
Northwest 7,553 11,437 66% 9,068 11,932 76%
Southeast 4,666 6,340 74% 7,954 10,184 78%
Southwest 6,702 8,720 77% 7,749 10,097 77%
Total 21,042 30,261 70% 28,018 36,069 78%
PM Peak Hour
Project Share of Growth
Existing plus CPP-V Cumulative With CPP-V
Ridership Capacity Utilization Ridership Capacity Utilization
Northeast 2,158 3,627 60% 3,412 4,026 85% 18%
Northwest 6,757 10,186 66% 8,291 10,873 76%
Southeast 5,086 7,073 72% 8,641 9,907 87% 17%
Southwest 7,509 9,655 78% 8,904 10,767 83%
Total 21,510 30,540 70% 29,248 35,573 82%
SOURCE: City and County of San Francisco, 2010

4. Environmental Setting, Impacts, and Mitigation Measures
4.N Traffic and Circulation
Brisbane Baylands 4.N-138 ESA / 206069 Draft EIR June 2013
Impact on San Francisco Transit Screenline Capacity
Based on the anticipated trip distribution pattern, roughly one-fourth of trips under each of the development scenarios would be made to or from the southeastern quadrant of San Francisco (including the Mission Bay, Bernal Heights, Bayview, Hunters Point, and Candlestick Point districts). Trips associated with Project Site development would contribute to total transit volumes exceeding Muni’s capacity threshold of 85 percent at the Northeast and Southeast screenlines (based on the Year 2030 transit volumes and capacities at those screenlines as described in the CPHPS EIR). Tables 4.N-41 through 4.N-44 provide the Existing plus Project and Cumulative With Project transit volumes and screenline capacities. As shown, the contribution of Project Site development to Cumulative With Project transit ridership represents between 17 and 25 percent of the forecasted growth in transit ridership at those screenlines; therefore, the impact of all four Project Site development scenarios would be significant.
Impact on T-Line and San Bruno Avenue Transit Corridors
Peak ridership on the T-Line and San Bruno Avenue Muni routes is highest in the downtown San Francisco peak direction (i.e., northbound to downtown San Francisco during the AM peak period and southbound from downtown San Francisco during the PM peak period). The majority of transit trips between San Francisco and the Project Site would be in the “reverse peak” direction (i.e., southbound to the Project Site during the AM peak period and northbound from the Project Site during the PM peak period). Therefore, none of the proposed Project Site development scenarios would result in unacceptable levels of transit service or increased operating costs to the Muni T-line or San Bruno Avenue bus lines due to the anticipated pattern of Project Site development travel; therefore, the impact of all four development scenarios would be less than significant.
Impact on Geneva Avenue Transit Corridor
Project Site development would have a significant impact on transit capacity on the Geneva Avenue corridor, as follows:
Approximately 3,000 daily riders under the DSP and DSP-V scenarios, including approximately 350 PM peak hour riders (total for both directions)
Approximately 6,500 daily riders under the CPP and CPP-V scenarios, including approximately 550 PM peak hour riders (total for both directions).
Current service on that corridor consists of:
Muni Route 8X and 8BX service between the Sunnydale Station and the Balboa Park Station (8 peak hours in both directions)
Alliance Shuttle Service (six buses per day between the Sunnydale Station and the Balboa Park Station)
Implementation of the proposed Geneva BRT, as described in the SF-TEP (SFMTA, 2012) and CPHPS EIR (San Francisco Planning Department, 2009), would provide a significant increase in

4. Environmental Setting, Impacts, and Mitigation Measures
4.N Traffic and Circulation
Brisbane Baylands 4.N-139 ESA / 206069 Draft EIR June 2013
transit service and capacity on the Geneva Avenue corridor, with 12 peak hour buses (6 in each direction) operating between the Balboa Park BART Station and Hunters Point Shipyard.
Portions of the Geneva BRT would operate within an exclusive right-of-way, including segments within the Project Site. Funding for the Geneva BRT has not yet been obtained, with a portion of funding to be contingent on the timeline for redevelopment of Candlestick Point and Hunters Point.
Impact on SamTrans Service
As noted in Table 4.N-22, only 1 percent of Project Site transit riders are anticipated to use SamTrans service. This would result in 14 trips during the PM peak hour under the DSP and DSP-V development scenarios and 17 trips during the PM peak hour under the CPP and CPP-V scenarios. Otherwise, Project Site transit riders would be accommodated on the BART, Caltrain, and Muni systems. Given the projected low ridership on SamTrans, no significant impacts would result from Project Site development.
Conclusion: Transit ridership under all four proposed development scenarios would contribute to cumulatively significant impacts on Muni operations at San Francisco transit screenline locations and would result in significant impacts on San Francisco Muni transit service on the Geneva Avenue corridor. Mitigation Measure 4.N-7 below is recommended. No significant impact on SamTrans operations is anticipated.
Mitigation
Mitigation Measure 4.N-7: Prior to issuance of the first building occupancy permit for new development other than improvement of relocation of an existing use within the Project Site, the developer(s) of Project Site land uses shall work with the San Francisco Municipal Transportation Agency (SFMTA) to provide a fair-share contribution to capital costs for providing additional transit service to accommodate Project Site development-related ridership demand on San Francisco Muni transit corridors. In addition, provision shall be made for implementation of shuttle service between the Project Site and the Balboa Park BART Station in the Geneva Avenue corridor.
Conclusion with Mitigation: The inclusion of Mitigation Measure 4.N-7 would provide SFMTA with the ability to reduce impacts on transit capacity to a less-than-significant level under all four development scenarios if such funds were used to increase transit service to the Project Site. While payment of such mitigation fees is common for projects within San Francisco, how SFMTA would actually use such funds would be beyond Brisbane’s ability to control. Therefore, the implementation of this measure is uncertain, and the impact would be significant and unavoidable.
_________________________
Mitigation Measure Applicability by Scenario
DSP DSP-V CPP CPP-V
= measure applies - = measure does not apply

4. Environmental Setting, Impacts, and Mitigation Measures
4.N Traffic and Circulation
Brisbane Baylands 4.N-140 ESA / 206069 Draft EIR June 2013
Transit Impact: Transit Operations
Impact 4.N-8: Would the Project cause an increase in delays or operating costs resulting in substantial adverse effects on transit service levels (i.e., additional buses or trains could be required due to Project transit trips)?
As described above (Impact 4.N-6), none of the proposed Project Site development scenarios would cause transit ridership volume to exceed 100 percent of seated capacity on Caltrain, and although all scenarios would contribute to cumulative ridership exceeding 100 percent seated capacity on BART, Project Site development’s contribution to cumulative BART ridership under any of the Project Site development scenarios would represent less than 2 percent of the cumulative ridership increase26 and would not result in additional operating costs for Caltrain or BART that would exceed farebox revenue resulting from Project-generated trips.
As described above (Impact 4.N-7), all of the development scenarios would contribute to total transit volumes exceeding Muni’s capacity threshold of 85 percent at the Northeast and Southeast Muni screenlines. Project Site development’s contribution under all four scenarios to Cumulative With Project transit ridership represents between 17 and 24 percent of the forecasted growth in transit ridership at those screenlines.
Conclusion: Project Site development would cause an increase in delays or operating costs such that significant adverse impacts on Muni transit service levels could result (i.e., additional buses or trains could be required due to Project transit trips). This impact is addressed by Mitigation Measure 4.N-7 above, which provides that, prior to issuance of a building occupancy permit, the developer(s) of Project land uses shall work with SFMTA to provide a fair-share contribution to the capital costs for providing additional transit services to accommodate ridership demand on San Francisco Muni transit corridors. As noted above, however, while payment of such mitigation fees is common within San Francisco, how SFMTA would actually use such funds would be beyond Brisbane’s ability to control. Therefore, the implementation of this measure is uncertain, and the impact would be significant and unavoidable.
Conclusion with Mitigation: Because implementation of Mitigation Measure 4.N-7 is beyond the jurisdiction of the City of Brisbane, cumulative impacts on Muni transit service levels would be significant and unavoidable under all four development scenarios.
_________________________
26 As noted in Section 4.N.4, a two percent increase in ridership and resulting in increased operating costs for Caltrain
or BART that would exceed farebox revenue resulting from Project Site development-generated trips is the criterion used to determine whether a significant impact would result.
Impact Significance by Scenario (before Mitigation)
DSP DSP-V CPP CPP-V
SU SU SU SU
SU = Significant Unavoidable SM = Significant but Mitigable LTS = Less than Significant - = no impact

4. Environmental Setting, Impacts, and Mitigation Measures
4.N Traffic and Circulation
Brisbane Baylands 4.N-141 ESA / 206069 Draft EIR June 2013
Transit Impact: Onsite Demand
Impact 4.N-9: Would the Project cause an onsite transit demand that would not be adequately served by adjacent transit service for those proposed land uses that would be located more than one-third mile from the Caltrain and Muni T-line station(s)?
All four proposed development scenarios would generate a significant increase in baseline and cumulative transit demand on Caltrain and the Muni T-line, and some increase in demand on Muni San Bruno Avenue buses. However, access to those transit services would be limited to the northwestern corner of the Project Site, at the Bayshore Caltrain Station and Sunnydale Muni Station. Proposed land uses south of proposed Geneva Avenue and east of the Caltrain line would be located more than one-third mile from those station locations, with some proposed land uses located over one mile from those stations.
Although provision of the proposed Geneva Avenue BRT would accommodate a significant portion of trips, relying entirely on that line to accommodate transit demand to and from southern portions of the Project Site would be inadequate to accommodate anticipated transit demand.
Conclusion: Project Site development would cause an onsite transit demand that would not be adequately served by adjacent transit service for those proposed land uses that would be located more than one-third mile from the Caltrain and Muni T-line stations. This would result in significant baseline and cumulative impacts under all four proposed development scenarios. Mitigation Measure 4.N-9 below is recommended.
Mitigation
Mitigation Measure 4.N-9: Prior to issuance of the first building occupancy permit for any new development other than improvement or relocation of an existing use within the Project Site, a shuttle bus service plan shall be developed and approved by the City that provides convenient transit service between Project Site land uses located more than one-third mile from the Bayshore Caltrain Station or Sunnydale Muni Station to those stations. Shuttle service shall be implemented as described in the plan prior to occupancy of any qualifying Project Site land use other than improvement or relocation of an existing use within the Project Site.
This requirement shall also be included in any specific plan approved for development within the Project Site.
Conclusion with Mitigation: With the inclusion of Mitigation Measure 4.N-9, impacts on transit accessibility would be less than significant under all four proposed development scenarios. While the Specific Plan outlines shuttle service, this mitigation measure would ensure that onsite transit service to regional transit connections would be provided.
_________________________
Impact Significance by Scenario (before Mitigation)
DSP DSP-V CPP CPP-V
SM SM SM SM
SU = Significant Unavoidable SM = Significant but Mitigable LTS = Less than Significant - = no impact
Mitigation Measure Applicability by Scenario
DSP DSP-V CPP CPP-V
= measure applies - = measure does not apply
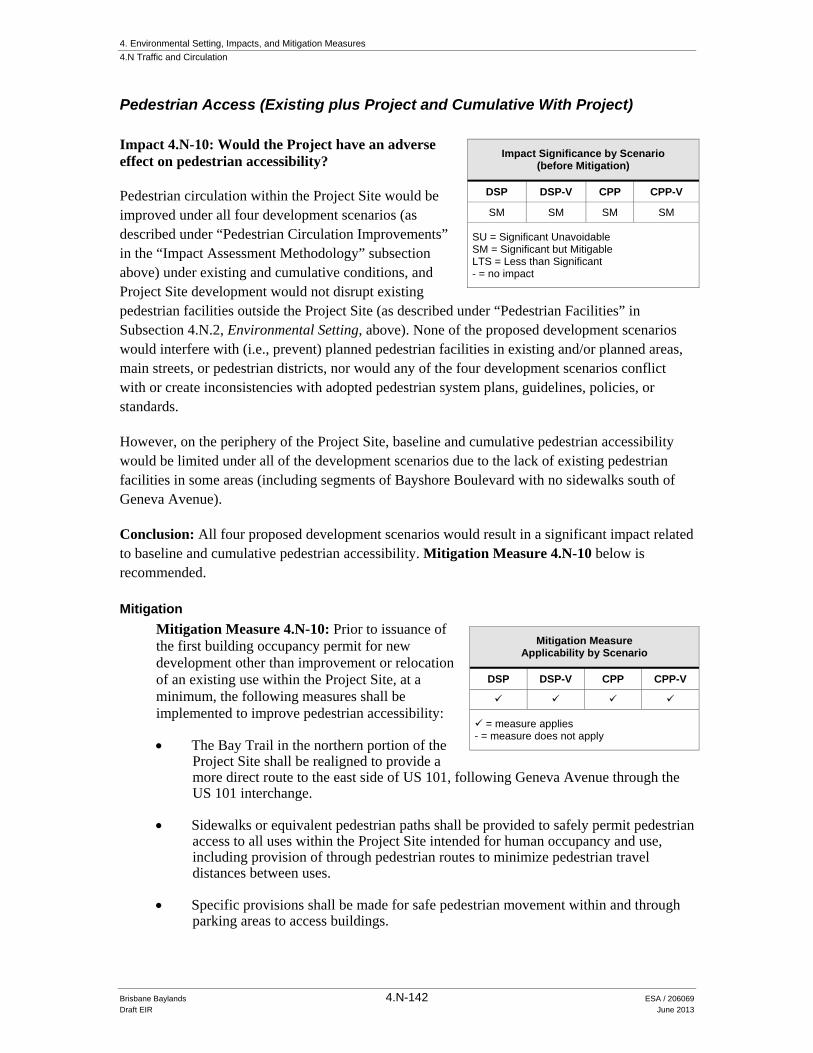
4. Environmental Setting, Impacts, and Mitigation Measures
4.N Traffic and Circulation
Brisbane Baylands 4.N-142 ESA / 206069 Draft EIR June 2013
Pedestrian Access (Existing plus Project and Cumulative With Project)
Impact 4.N-10: Would the Project have an adverse effect on pedestrian accessibility?
Pedestrian circulation within the Project Site would be improved under all four development scenarios (as described under “Pedestrian Circulation Improvements” in the “Impact Assessment Methodology” subsection above) under existing and cumulative conditions, and Project Site development would not disrupt existing pedestrian facilities outside the Project Site (as described under “Pedestrian Facilities” in Subsection 4.N.2, Environmental Setting, above). None of the proposed development scenarios would interfere with (i.e., prevent) planned pedestrian facilities in existing and/or planned areas, main streets, or pedestrian districts, nor would any of the four development scenarios conflict with or create inconsistencies with adopted pedestrian system plans, guidelines, policies, or standards.
However, on the periphery of the Project Site, baseline and cumulative pedestrian accessibility would be limited under all of the development scenarios due to the lack of existing pedestrian facilities in some areas (including segments of Bayshore Boulevard with no sidewalks south of Geneva Avenue).
Conclusion: All four proposed development scenarios would result in a significant impact related to baseline and cumulative pedestrian accessibility. Mitigation Measure 4.N-10 below is recommended.
Mitigation
Mitigation Measure 4.N-10: Prior to issuance of the first building occupancy permit for new development other than improvement or relocation of an existing use within the Project Site, at a minimum, the following measures shall be implemented to improve pedestrian accessibility:
The Bay Trail in the northern portion of the Project Site shall be realigned to provide a more direct route to the east side of US 101, following Geneva Avenue through the US 101 interchange.
Sidewalks or equivalent pedestrian paths shall be provided to safely permit pedestrian access to all uses within the Project Site intended for human occupancy and use, including provision of through pedestrian routes to minimize pedestrian travel distances between uses.
Specific provisions shall be made for safe pedestrian movement within and through parking areas to access buildings.
Impact Significance by Scenario (before Mitigation)
DSP DSP-V CPP CPP-V
SM SM SM SM
SU = Significant Unavoidable SM = Significant but Mitigable LTS = Less than Significant - = no impact
Mitigation Measure Applicability by Scenario
DSP DSP-V CPP CPP-V
= measure applies - = measure does not apply

4. Environmental Setting, Impacts, and Mitigation Measures
4.N Traffic and Circulation
Brisbane Baylands 4.N-143 ESA / 206069 Draft EIR June 2013
Sidewalks shall be provided along the Project Site frontage on Bayshore Boulevard between Sunnydale Avenue and Tunnel Avenue.
These minimum requirements, along with the equivalent of the facilities shown in Table 4.N-8, shall also be included within each specific plan approved within the Project Site.
Conclusion with Mitigation: Installing pedestrian facilities throughout the Project Site and along Bayshore Boulevard would improve pedestrian connectivity to and from the site, as Bayshore Boulevard intersects with Geneva and Tunnel Avenues, two major roads that lead directly into the Project Site. In addition, per the Brisbane 1994 General Plan, as the “spine of the community,” Bayshore Boulevard’s performance “…is key to traffic circulation and access in the City…” With the inclusion of Mitigation Measure 4.N-10, impacts related to pedestrian accessibility would be less than significant under all four proposed development scenarios.
_________________________
Bicycle Access (Existing plus Project and Cumulative With Project)
Impact 4.N-11: Would the Project have an adverse effect related to bicycle accessibility?
Bicycle circulation within the Project Site would be improved under all four development scenarios under existing and cumulative conditions, and Project Site development would not disrupt existing bicycle facilities outside the Project Site (as described under “Bicycle Facilities” in Subsection 4.N.2, Environmental Setting, above). As noted above, the Specific Plan prepared for the DSP and DSP-V scenarios proposes a bicycle circulation plan. While a comparably detailed plan has not yet been developed for the CPP and CPP-V scenarios, certain improvements proposed under the DSP and DSP-V scenarios would also be applicable to the CPP and CPP-V scenarios (see Table 4.N-7 above) since it is the intent of the CPP and CPP-V scenarios to make at least equal provision for alternative transportation modes within the Project Site as are provided by the DSP and DSP-V scenarios. A detailed bicycle circulation plan for the CPP and CPP-V would be specified as part of preparation of the required specific plan should either the CPP or CPP-V Concept Plan scenario be approved, which makes type of network improvements defined for the DSP and DSP-V scenarios a reasonable assumption for the CPP and CPP-V scenarios in this assessment.
None of the proposed Project Site development scenarios would interfere with (i.e., prevent) planned bicycle facilities, or conflict or create inconsistencies with adopted bicycle system plans, guidelines, policies, or standards. However, because the Specific Plan for the DSP and DSP-V scenarios does not include detailed requirements to both enhance the bicycling environment and maximize bicycle accessibility (e.g., requirements for the inclusion of bicycle parking near all destination points and recreational areas, and on roadways with high volumes), and the CPP and
Impact Significance by Scenario (before Mitigation)
DSP DSP-V CPP CPP-V
SM SM SM SM
SU = Significant Unavoidable SM = Significant but Mitigable LTS = Less than Significant - = no impact

4. Environmental Setting, Impacts, and Mitigation Measures
4.N Traffic and Circulation
Brisbane Baylands 4.N-144 ESA / 206069 Draft EIR June 2013
CPP-V Concept Plan scenarios do not include a detailed bicycle circulation plan at this time, significant impacts related to existing and cumulative bicycle accessibility could occur.
Conclusion: A significant impact related to existing and cumulative bicycle accessibility would occur under all four proposed development scenarios. Mitigation Measure 4.N-11 below is recommended.
Mitigation
Mitigation Measure 4.N-11: Prior to issuance of the first building occupancy permit for new development other than improvement or relocation of an existing use within the Project Site, roadways and trails shall provide for safe accessibility for bicycles to buildings and recreational areas throughout the Project Site, including connections to offsite bicycle routes and trails. In addition, Project Site land uses shall provide bicycle parking in appropriate areas (i.e., where they will get the most use, where security is maximized, and where pedestrian circulation is minimally affected by their presence).
The minimum standards contained in this mitigation measure, along with the equivalent bicycle access as that shown in Table 4.N-7, shall be included in any specific plan approved for development within the Project Site. In addition, details of Project Site development-provided bicycle parking spaces (number and location) shall be determined at the time when site-specific development projects are proposed pursuant to the adopted Specific Plan, and shall adhere to the following guidelines which shall also be included in any specific plan adopted for development within the Project Site:
Bicycle parking shall be placed within 50 feet of building and facility entrances, where it can be well-lit, clearly visible, and out of the primary travel path of pedestrians. Retail shopping centers and supermarkets shall include one Class I rack (covered bicycle locker for long-term parking) per 30 employees, and one Class II rack (able to secure both the frame and at least one wheel of a bicycle for short-term parking) per 6,000 square feet of retail space.
Parks and recreational fields normally shall include one Class I rack per 30 employees and one Class II rack per 9 users (during peak daylight times of peak season).
Transit centers normally shall include individual parking spaces equal to 2 percent of daily boardings (75 percent Class I and 25 percent Class II).
Conclusion with Mitigation: With the inclusion of Mitigation Measure 4.N-11, implementation impacts related to bicycle accessibility would be less than significant under all for proposed development scenarios.
_________________________
Mitigation Measure Applicability by Scenario
DSP DSP-V CPP CPP-V
= measure applies - = measure does not apply

4. Environmental Setting, Impacts, and Mitigation Measures
4.N Traffic and Circulation
Brisbane Baylands 4.N-145 ESA / 206069 Draft EIR June 2013
Construction (Existing plus Project and Cumulative With Project)
Impact 4.N-12: Would Project construction activities result in adverse effects on traffic flow or transit service, and/or interfere with pedestrian and bicycle circulation patterns?
Development of the Project Site would result in temporary traffic increases at and near the site over the course of the years it would take to build out the Project Site (with periods of activity and periods of no activity). The traffic impacts associated with construction under any of the Project Site development scenarios would be temporary and intermittent related to the delivery of materials and equipment, removal of debris, and daily commute trips for construction workers. Any construction traffic (especially truck traffic) occurring during typical commute hours (7:00 a.m. to 9:00 a.m., or 4:00 p.m. to 6:00 p.m.) would coincide with peak hour traffic, which could exacerbate adverse effects on traffic flow, transit services, and pedestrian and bicycle circulation. Construction staging is anticipated to occur on the Project Site.
Conclusion: Construction activities would result in significant impacts on existing and cumulative traffic flow and transit service and interfere with pedestrian and bicycle circulation patterns. Mitigation Measure 4.N-12 below is recommended.
Mitigation
Mitigation Measure 4.N-12: In conjunction with all construction permits, site-specific development projects shall develop, submit for City review and approval, and implement Construction Management Plans that specify measures that would reduce impacts on motor vehicle, bicycle, pedestrian, and transit circulation. The Construction Management Plans shall include, but not necessarily be limited to, the following:
Location of construction staging areas for materials, equipment, and vehicles.
Notification procedures for adjacent property owners and public safety personnel regarding when major deliveries, detours, and lane closures will occur.
Identification of haul routes for movement of construction vehicles that would minimize impacts on vehicular and pedestrian traffic, circulation and safety; and provision for monitoring surface streets used for haul routes so that any damage and debris attributable to the haul trucks can be identified and corrected by the project applicant.
Provisions for removal of trash generated by construction activity.
A process for responding to, and tracking, complaints pertaining to construction activity, including identification of an onsite complaint manager.
Impact Significance by Scenario (before Mitigation)
DSP DSP-V CPP CPP-V
SM SM SM SM
SU = Significant Unavoidable SM = Significant but Mitigable LTS = Less than Significant - = no impact
Mitigation Measure Applicability by Scenario
DSP DSP-V CPP CPP-V
= measure applies - = measure does not apply

4. Environmental Setting, Impacts, and Mitigation Measures
4.N Traffic and Circulation
Brisbane Baylands 4.N-146 ESA / 206069 Draft EIR June 2013
Conclusion with Mitigation: With the inclusion of Mitigation Measure 4.N-12, existing and cumulative construction-related impacts would be less than significant under all four proposed development scenarios.
_________________________
Conflict with an Applicable Congestion Management Program
Transportation Demand Management Program (C/CAG) (Existing plus Project and Cumulative With Project)
Impact 4.N-13: Would the Project conflict with an applicable congestion management program, including but not limited to level of service standards and travel demand measures, or other standards established by the county congestion management agency for designated roads or highways?
The City/County Association of Governments of San Mateo County (C/CAG) is the Congestion Management Agency for San Mateo County that develops the Congestion Management Program (CMP). As part of the land use element of the CMP, all projects that generate 100 or more net new trips during the AM or PM peak hour are required to mitigate the impacts of all net new trips. One of the possible ways to mitigate these trips is to implement Transportation Demand Management (TDM) plans that have the capacity to reduce the demand for new peak hour trips. Other mitigation measures include reducing the scope of the project to generate fewer than 100 peak hour trips or paying a one-time fee of $20,000 per peak hour trip to a TDM fund.
Development of the Project Site under any of the Project Site development scenarios would generate more than 100 vehicle trips during both the AM and PM peak hours. Therefore, per C/CAG guidelines, development of a TDM plan is required. Conformance with the C/CAG requirement would be met through development and implementation of a TDM program designed to reduce use of single-occupant vehicles and to increase the use of rideshare, transit, bicycle, and walk modes for trips to, from, and within the Project Site. As described above (see “Transportation Demand Management (TDM) Program” in the “Impact Assessment Methodology” subsection above), a preliminary (conceptual) TDM program has been developed as part of the Specific Plan prepared for the DSP and DSP-V scenarios. Because development is expected to occur in several phases, TDM plans would be prepared for each qualifying development project as it undergoes site-specific development review. Each qualifying development project would be required to mitigate the impacts of all net new trips. As described above, no trip reduction due to specific TDM measures was assumed in the trip generation calculation used in the analysis of traffic impacts resulting from Project Site development.
C/CAG has identified acceptable TDM measures with equivalent numbers of peak hour trip credits that will be granted with implementation of each measure, including, but not limited to, a shuttle program, employee parking cash-out, infill development, and a guaranteed ride home program.
Impact Significance by Scenario (before Mitigation)
DSP DSP-V CPP CPP-V
SM SM SM SM
SU = Significant Unavoidable SM = Significant but Mitigable LTS = Less than Significant - = no impact
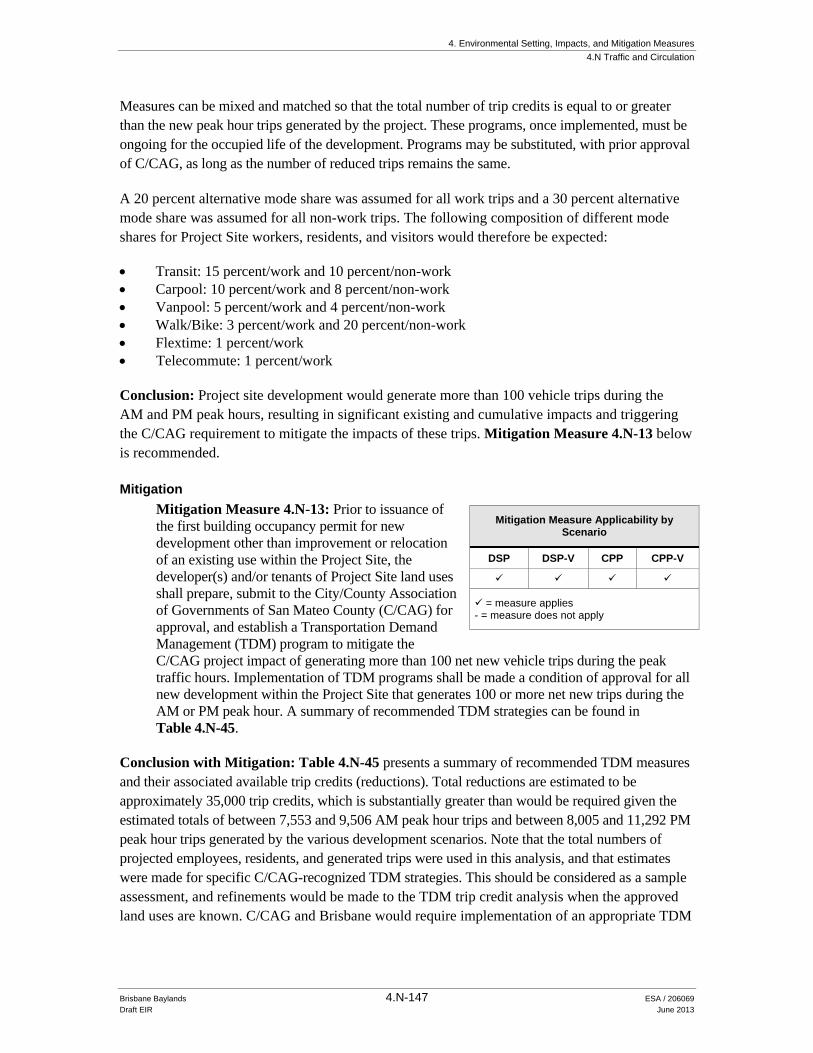
4. Environmental Setting, Impacts, and Mitigation Measures
4.N Traffic and Circulation
Brisbane Baylands 4.N-147 ESA / 206069 Draft EIR June 2013
Measures can be mixed and matched so that the total number of trip credits is equal to or greater than the new peak hour trips generated by the project. These programs, once implemented, must be ongoing for the occupied life of the development. Programs may be substituted, with prior approval of C/CAG, as long as the number of reduced trips remains the same.
A 20 percent alternative mode share was assumed for all work trips and a 30 percent alternative mode share was assumed for all non-work trips. The following composition of different mode shares for Project Site workers, residents, and visitors would therefore be expected:
Transit: 15 percent/work and 10 percent/non-work Carpool: 10 percent/work and 8 percent/non-work Vanpool: 5 percent/work and 4 percent/non-work Walk/Bike: 3 percent/work and 20 percent/non-work Flextime: 1 percent/work Telecommute: 1 percent/work
Conclusion: Project site development would generate more than 100 vehicle trips during the AM and PM peak hours, resulting in significant existing and cumulative impacts and triggering the C/CAG requirement to mitigate the impacts of these trips. Mitigation Measure 4.N-13 below is recommended.
Mitigation
Mitigation Measure 4.N-13: Prior to issuance of the first building occupancy permit for new development other than improvement or relocation of an existing use within the Project Site, the developer(s) and/or tenants of Project Site land uses shall prepare, submit to the City/County Association of Governments of San Mateo County (C/CAG) for approval, and establish a Transportation Demand Management (TDM) program to mitigate the C/CAG project impact of generating more than 100 net new vehicle trips during the peak traffic hours. Implementation of TDM programs shall be made a condition of approval for all new development within the Project Site that generates 100 or more net new trips during the AM or PM peak hour. A summary of recommended TDM strategies can be found in Table 4.N-45.
Conclusion with Mitigation: Table 4.N-45 presents a summary of recommended TDM measures and their associated available trip credits (reductions). Total reductions are estimated to be approximately 35,000 trip credits, which is substantially greater than would be required given the estimated totals of between 7,553 and 9,506 AM peak hour trips and between 8,005 and 11,292 PM peak hour trips generated by the various development scenarios. Note that the total numbers of projected employees, residents, and generated trips were used in this analysis, and that estimates were made for specific C/CAG-recognized TDM strategies. This should be considered as a sample assessment, and refinements would be made to the TDM trip credit analysis when the approved land uses are known. C/CAG and Brisbane would require implementation of an appropriate TDM
Mitigation Measure Applicability by Scenario
DSP DSP-V CPP CPP-V
= measure applies - = measure does not apply

4. Environmental Setting, Impacts, and Mitigation Measures
4.N Traffic and Circulation
Brisbane Baylands 4.N-148 ESA / 206069 Draft EIR June 2013
TABLE 4.N-45 PRELIMINARY ESTIMATES OF C/CAG
TRANSPORTATION DEMAND MANAGEMENT (TDM) TRIP CREDITS
C/CAG Number TDM Measure Amount Unit/Explanation
C/CAG Credit Rate
C/CAG Trip
Credits
1 Secure Bicycle Storage 200 Lockers 0.33 66
2 Showers/Clothes Lockers 10 Showers 10 100
2 Additional Credit for Shower Combination with Bicycle Lockers
1 5 5
3 Shuttle Program 120 Peak period seats 1 120
3 Additional Credit for Guaranteed Ride Home Program
120 1 120
4 Market Rate Parking Pricing for Employees 500 Paid spaces 2 1000
5 Transit Subsidies 17,259 Subsidized transit passes 1 17,259
7 Preferential Carpool Parking 250 Spaces 2 500
8 Preferential Vanpool Parking 25 Spaces 7 175
9 Vanpool Ridematching Service 20 Vanpools 7 140
10 Commute Assistance Center with TDM Coordinator Staffing
20 Multiple 1 20
11 Biannual Employee Commute Survey 1 Survey 3 3
12 Employee Parking Cash-Out 5,000 Employees offered parking cash-out
1 5,000
14 Telecommuting 100 Employees with company provided high-speed internet
0.33 33
15 Video Conferencing Centers 10 Centers 5 50
16 Compressed Work Week 2,000 Employees offered compressed work week
0.20 400
17 Flextime 2,000 Employees offered flextime 1 2,000
18 Live-Work Assistance 500 Employees offered local residential assistance
1 500
19 Preferential Hiring of Local Residents 250 Local residents hired 1 250
20 Onsite Amenities 25 Amenities 5 125
25 Guaranteed Ride Home Program 5,000 Employees offered guaranteed ride home
1 5,000
26 Additional Credit for Providing Ten or More TDM Program Measures
1 5 5
27 Develop Transportation Action Plan with the Transportation Management Association
1 10 10
29 Infill Development 5,350 2% of peak hour trips 2% 107
31 Transportation Management Association Participation (Alliance)
1 5 5
35 Develop Schools, Neighborhood-Serving Retail, and Childcare
25 Amenities 5 125
37 Pedestrian- and Bicycle-Friendly Streets 100 Street segments 5 500
39 Non-Motorized Connections 100 Connections 5 500
41 Street Design that Encourages Pedestrian and Bicycle Access
20 Streets 5 100
42 Information Boards/Kiosks 10 Kiosks 5 50
45 Locate Residential Development within 1/3 Mile of Rail
620 74% of peak hour residential trips
1 620
Total TDM Program Measures 34,888 SOURCE: UPC, 2011; CCAG, 2004

4. Environmental Setting, Impacts, and Mitigation Measures
4.N Traffic and Circulation
Brisbane Baylands 4.N-149 ESA / 206069 Draft EIR June 2013
program for the life of Project site development to reduce impacts on area roadways. With implementation of Mitigation Measure 4.N-13, the impact related to the C/CAG requirement would be less than significant.
Result in a Change in Air Traffic Patterns (Existing plus Project and Cumulative With Project)
Impact 4.N-14: Would the Project result in a change in air traffic patterns?
As noted in Section 4.G, Hazards and Hazardous Materials, the Project Site is located more than 2 miles from the nearest public airport, the San Francisco International Airport, or airstrip. Development under any of the proposed scenarios would not conflict with an airport land use plan nor present any other impact related to a public airport use or private airstrip.
Conclusion: No Project component would result in a change in air traffic patterns in either the existing or cumulative project scenarios. Therefore, there would be no impact. No mitigation is required.
_________________________
Substantially Increase Hazards (Existing plus Project and Cumulative With Project)
Impact 4.N-15: Would the Project substantially increase hazards due to a design feature (e.g., sharp curves or dangerous intersections) or incompatible uses?
Design of all proposed transportation and circulation features would be required to be consistent with the Brisbane General Plan and applicable City roadway design standards. The review of Specific Plan(s) proposed in fulfillment of General Plan requirements would provide for implementation of City roadway design standards. Site-specific development within the Project Site would also be subject to review and approval by the City. While each of the Project Site development scenarios would include installation of a circulation system, including roadways and pedestrian and bicycle facilities, the City’s development review process would ensure that applicable roadway and trail design standards are adhered to, and that safety hazards or incompatible uses are avoided.
Conclusion: Because detailed designs for roadway, pedestrian, or bicycle features for subsequent development within the Project Site would be reviewed as part of the City’s development review process and would be required to meet all applicable design standards, this impact would be less
Impact Significance by Scenario (before Mitigation)
DSP DSP-V CPP CPP-V
- - - -
SU = Significant Unavoidable SM = Significant but Mitigable LTS = Less than Significant - = no impact
Impact Significance by Scenario (before Mitigation)
DSP DSP-V CPP CPP-V
LTS LTS LTS LTS
SU = Significant Unavoidable SM = Significant but Mitigable LTS = Less than Significant - = no impact
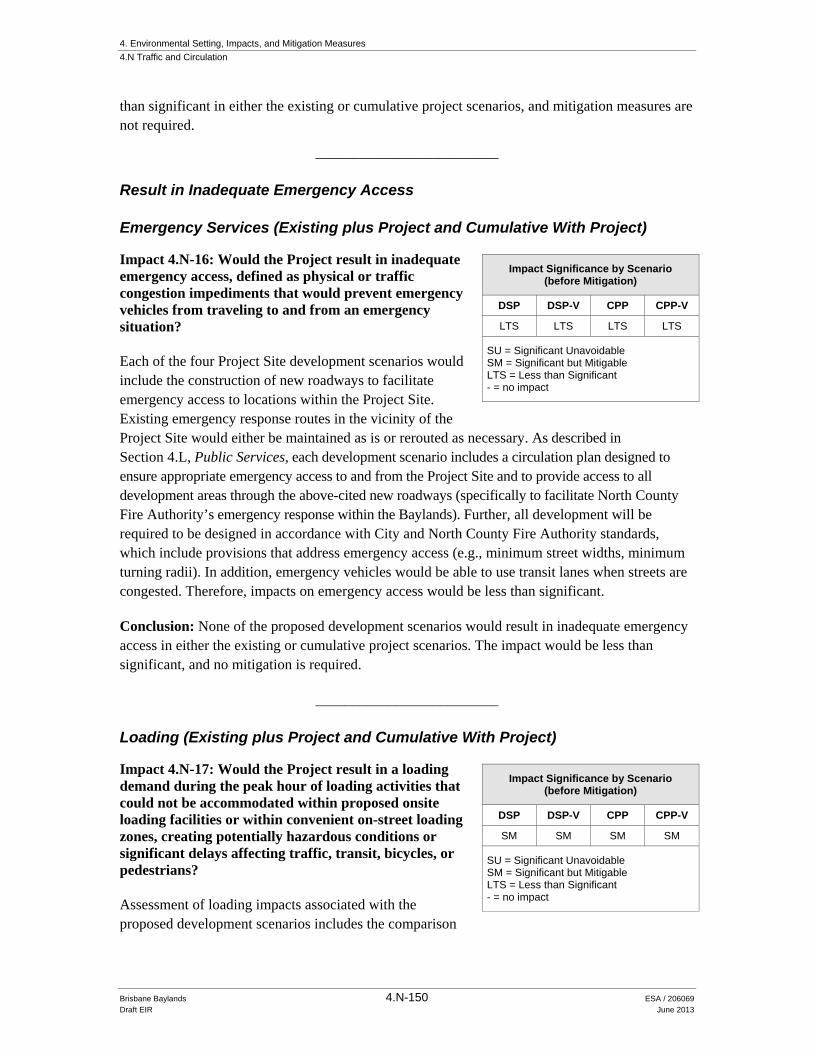
4. Environmental Setting, Impacts, and Mitigation Measures
4.N Traffic and Circulation
Brisbane Baylands 4.N-150 ESA / 206069 Draft EIR June 2013
than significant in either the existing or cumulative project scenarios, and mitigation measures are not required.
_________________________
Result in Inadequate Emergency Access
Emergency Services (Existing plus Project and Cumulative With Project)
Impact 4.N-16: Would the Project result in inadequate emergency access, defined as physical or traffic congestion impediments that would prevent emergency vehicles from traveling to and from an emergency situation?
Each of the four Project Site development scenarios would include the construction of new roadways to facilitate emergency access to locations within the Project Site. Existing emergency response routes in the vicinity of the Project Site would either be maintained as is or rerouted as necessary. As described in Section 4.L, Public Services, each development scenario includes a circulation plan designed to ensure appropriate emergency access to and from the Project Site and to provide access to all development areas through the above-cited new roadways (specifically to facilitate North County Fire Authority’s emergency response within the Baylands). Further, all development will be required to be designed in accordance with City and North County Fire Authority standards, which include provisions that address emergency access (e.g., minimum street widths, minimum turning radii). In addition, emergency vehicles would be able to use transit lanes when streets are congested. Therefore, impacts on emergency access would be less than significant.
Conclusion: None of the proposed development scenarios would result in inadequate emergency access in either the existing or cumulative project scenarios. The impact would be less than significant, and no mitigation is required.
_________________________
Loading (Existing plus Project and Cumulative With Project)
Impact 4.N-17: Would the Project result in a loading demand during the peak hour of loading activities that could not be accommodated within proposed onsite loading facilities or within convenient on-street loading zones, creating potentially hazardous conditions or significant delays affecting traffic, transit, bicycles, or pedestrians?
Assessment of loading impacts associated with the proposed development scenarios includes the comparison
Impact Significance by Scenario (before Mitigation)
DSP DSP-V CPP CPP-V
LTS LTS LTS LTS
SU = Significant Unavoidable SM = Significant but Mitigable LTS = Less than Significant - = no impact
Impact Significance by Scenario (before Mitigation)
DSP DSP-V CPP CPP-V
SM SM SM SM
SU = Significant Unavoidable SM = Significant but Mitigable LTS = Less than Significant - = no impact

4. Environmental Setting, Impacts, and Mitigation Measures
4.N Traffic and Circulation
Brisbane Baylands 4.N-151 ESA / 206069 Draft EIR June 2013
of the demand for the loading spaces to the minimum number of loading spaces specified in the Project description. (This comparison would be the same under existing and cumulative conditions due to the assumption of full buildout under all proposed development scenarios.) As indicated in Table 4.N-19 under “Impact Assessment Methodology” above, the demand for loading spaces was estimated based on the development program and the daily truck trip generation rates for 1,000 gross square feet of use, then converted to hourly demand.
There are not sufficient details (e.g., number and location of parking spaces) at this time to assess loading conditions in this Program EIR, but as site-specific development projects are proposed under the selected development scenario and required specific plan, loading (demand and supply) would be reviewed to ensure that demand would be met. Because there are no specific loading requirements in the Brisbane Municipal Code, however, a significant impact could result, and mitigation would be required.
Mitigation
Mitigation Measure 4.N-17: Each site-specific development project shall provide sufficient loading areas in appropriate locations such that loading activities, including loading vehicle queuing, will not block roadway or onsite parking area travel lanes, or bicycle or pedestrian facilities.
Conclusion with Mitigation: Table 4.N-45 Adherence to the performance standard set forth in Mitigation Measure 4.N-17 would ensure that significant impacts would not result from loading activities required for proposed development within the Project Site. The mitigation measure would reduce the significant impact to a less-than-significant level.
_________________________
References – Traffic and Circulation Caltrans, Caltrans Bicycle Program, http://www.dot.ca.gov/hq/tpp/offices/bike/bicycle_prgm.htm,
accessed September 18, 2007.
City/County Association of Governments of San Mateo County (CCAG), Revised C/CAG Guidelines for the Implementation of the Land Use Component of the Congestion Management Program, September 21, 2004.
Farran, Jose and Menaker, Paul, “Understanding the Major Event Traffic Engineering Paradigm,” presented at the Institute of Transportation Engineers District 6 Annual Meeting, 1997.
Institute of Transportation Engineers (ITE), Trip Generation, 8th Edition, 2008.
Recology, Responses to Data Requests, December 14, 2011.
Mitigation Measure Applicability by Scenario
DSP DSP-V CPP CPP-V
= measure applies - = measure does not apply

4. Environmental Setting, Impacts, and Mitigation Measures
4.N Traffic and Circulation
Brisbane Baylands 4.N-152 ESA / 206069 Draft EIR June 2013
San Francisco County Transportation Authority, Bayshore Intermodal Station Access Study, Draft Final Report, February 17, 2012.
San Francisco Planning Department, 2009. Candlestick Point-Hunters Point Shipyard Phase II Redevelopment Plan Project: Draft Environmental Impact Report. November 12.
San Francisco Planning Department, Transportation Impact Analysis Guidelines for Environmental Review, 2002.
Santa Clara Valley Transportation Authority, Bicycle Technical Guidelines,1999, p. 43.
Transportation Research Board, Highway Capacity Manual, updated 2000.
Universal Paragon Corporation (UPC), Draft Brisbane Baylands Specific Plan, February 2011, Chapter 6: Traffic and Circulation.