4q 2015 results - axiataaxiata.listedcompany.com/misc/axiata_presentation_4q2015.pdf4q 2015 results...
TRANSCRIPT

4Q 2015 Results
17 February 2016
Dato’ Sri Jamaludin Ibrahim, President & Group CEO
Chari TVT, Group CFO

4Q 2015 2
Executive summary: FinancialsStrong FY15 results due to strong performance by Dialog, Smart, Idea and M1, and forex
translation; positive momentum at XL and a challenging year Celcom.
FY15 registered highest PATAMI, driven by EBITDA growth, higher associates contribution, forex translation gains, tower
gain recognition by XL (in 3Q15), offset by higher depreciation arising from higher capex spend and some one-off
adjustments (in 4Q15).
• QoQ growth : Revenue 5.8% ; EBITDA 5.4% ; PATAMI -47.6%
• YoY growth : Revenue 11.4% ; EBITDA 11.1% ; PATAMI -22.0%
• FY growth : Revenue 6.3% ; EBITDA 4.1% ; PATAMI 8.0%
At constant currency, FY15 Group performance was mainly impact by Celcom and XL.
• QoQ growth : Revenue 3.0% ; EBITDA 2.4% ; PATAMI -49.0%
• YoY growth : Revenue 0.9% ; EBITDA 0.8% ; PATAMI -29.5%
• FY growth : Revenue -0.2% ; EBITDA -2.2% ; PATAMI 2.6%
Challenging year for Celcom, whilst XL’s transformation agenda continues to deliver promising results.
Data revenue grew 29.8%, as FY15 capex of RM4.9bn lays the foundation for mobile data leadership.
Strong cash balance of RM5.5bn, with gross debt/EBITDA rising to 2.25x post issuance of USD500m Sukuk.
Total dividend declared 20 sen including 8 sen interim dividend for FY15, translating into payout ratio of 85%.

4Q 2015 3
Key Group highlights (1/4):Celcom’s overall recovery was hampered by a flat growth market.
• Celcom’s overall recovery was hampered by a flat growth market.
• Despite this, for 4Q15 Celcom recorded its first positive revenue growth since a year ago,+1.0% QoQ mainly due to higher device sales.
• Celcom’s FY15 revenue, normalised EBITDA and normalised PATAMI growth is -5.1%, -7.7%,and -13.5%, respectively.
• FY15 PATAMI impacted significantly by one-off expense of RM53m and start-up losses ofRM71m in new ventures.
• FY15 service revenue declined by 6.8% primarily due to heightened competition.
• FY15 mobile data revenue and mobile internet revenue grew 20.7% and 48.0% respectively.
Note: Growth number based on results in local currency in respective operating markets
4Q 2015 4
Key Group highlights (2/4):XL’s transformation agenda is on track and continues to gain momentum.
Note: Growth number based on results in local currency in respective operating markets
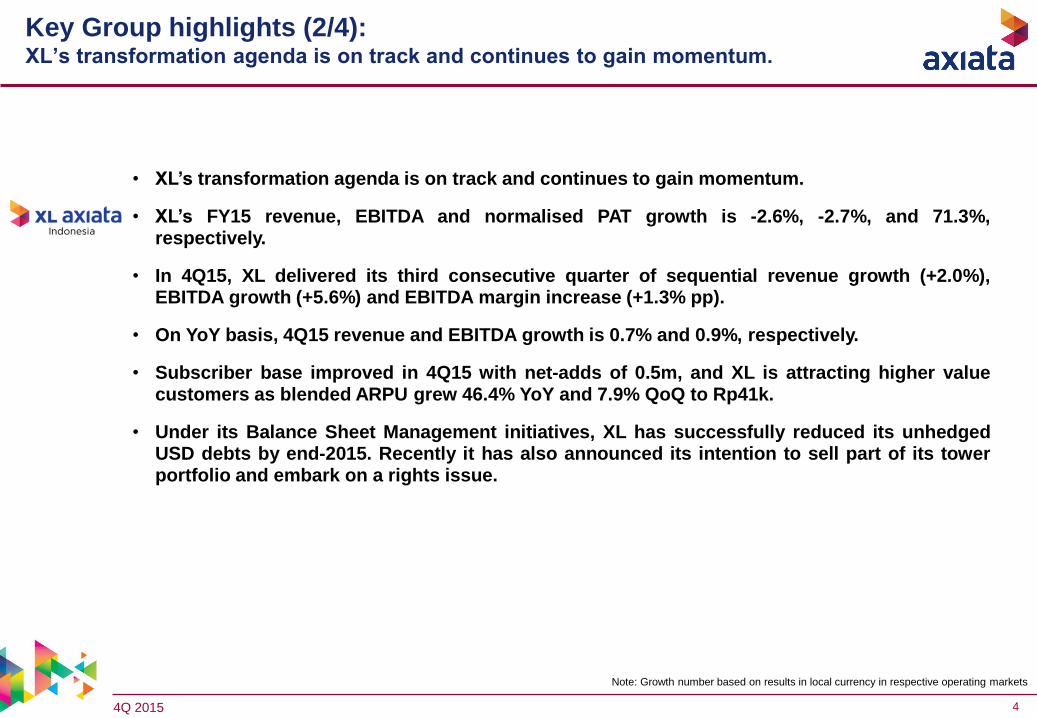
• XL’s transformation agenda is on track and continues to gain momentum.
• XL’s FY15 revenue, EBITDA and normalised PAT growth is -2.6%, -2.7%, and 71.3%,respectively.
• In 4Q15, XL delivered its third consecutive quarter of sequential revenue growth (+2.0%),EBITDA growth (+5.6%) and EBITDA margin increase (+1.3% pp).
• On YoY basis, 4Q15 revenue and EBITDA growth is 0.7% and 0.9%, respectively.
• Subscriber base improved in 4Q15 with net-adds of 0.5m, and XL is attracting higher valuecustomers as blended ARPU grew 46.4% YoY and 7.9% QoQ to Rp41k.
• Under its Balance Sheet Management initiatives, XL has successfully reduced its unhedgedUSD debts by end-2015. Recently it has also announced its intention to sell part of its towerportfolio and embark on a rights issue.
4Q 2015 5
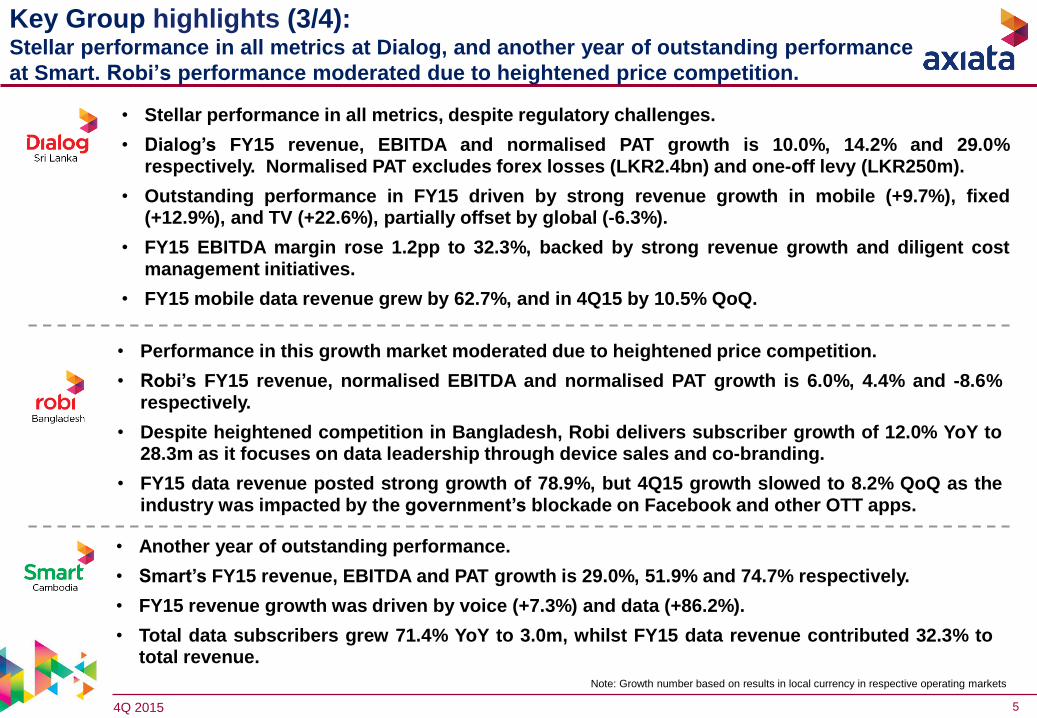
• Performance in this growth market moderated due to heightened price competition.
• Robi’s FY15 revenue, normalised EBITDA and normalised PAT growth is 6.0%, 4.4% and -8.6%respectively.
• Despite heightened competition in Bangladesh, Robi delivers subscriber growth of 12.0% YoY to28.3m as it focuses on data leadership through device sales and co-branding.
• FY15 data revenue posted strong growth of 78.9%, but 4Q15 growth slowed to 8.2% QoQ as theindustry was impacted by the government’s blockade on Facebook and other OTT apps.
Key Group highlights (3/4):Stellar performance in all metrics at Dialog, and another year of outstanding performance
at Smart. Robi’s performance moderated due to heightened price competition.
Note: Growth number based on results in local currency in respective operating markets
• Stellar performance in all metrics, despite regulatory challenges.
• Dialog’s FY15 revenue, EBITDA and normalised PAT growth is 10.0%, 14.2% and 29.0%respectively. Normalised PAT excludes forex losses (LKR2.4bn) and one-off levy (LKR250m).
• Outstanding performance in FY15 driven by strong revenue growth in mobile (+9.7%), fixed(+12.9%), and TV (+22.6%), partially offset by global (-6.3%).
• FY15 EBITDA margin rose 1.2pp to 32.3%, backed by strong revenue growth and diligent costmanagement initiatives.
• FY15 mobile data revenue grew by 62.7%, and in 4Q15 by 10.5% QoQ.
• Another year of outstanding performance.
• Smart’s FY15 revenue, EBITDA and PAT growth is 29.0%, 51.9% and 74.7% respectively.
• FY15 revenue growth was driven by voice (+7.3%) and data (+86.2%).
• Total data subscribers grew 71.4% YoY to 3.0m, whilst FY15 data revenue contributed 32.3% tototal revenue.

4Q 2015 6
Key Group highlights (4/4):Idea and M1 contributed significantly to Axiata PATAMI (FY15: 20.6% vs. FY14: 16.4%).
Note: Growth number based on results in local currency in respective operating markets
• Strong YTD revenue, EBITDA and PAT growth of 14.5%, 21.5% and 11.2% respectively.YTD Idea has contributed RM368.8m to Axiata PATAMI (+51.6%).
• FY15 revenue, EBITDA and PAT growth of 7.5%, 1.9% and 1.5% respectively. M1 hascontributed RM157.8m to Axiata PATAMI (+8.6%). M1 recommended a final dividend of 8.3cents per share, taking full year payout to a total of 15.3 cents per share.
Associates

4Q 2015 7
RM mn 4Q15 FY15
QoQ
Growth
YoY
growth
FY15
growth
Revenue 5,360 19,883 5.8% 11.4% 6.3% -0.2%
EBITDA 1,964 7,284 5.4% 11.1% 4.1% -2.2%
EBITDA margin % 36.6% 36.6% -0.2pp -0.1pp -0.8pp -0.8pp
PAT 515 2,636 -46.1% -16.9% 11.3% 5.5%
Normalised PAT 391 2,135 -30.5% -19.5% -8.5% -14.7%
PATAMI 467 2,554 -47.6% -22.0% 8.0% 2.6%
Normalised PATAMI 414 2,071 -19.8% -11.1% -8.2% -14.2%
ROIC % - 7.7% - - -1.3pp 7.7%
ROCE % - 6.7% - - -0.9pp 6.6%
Capex 1,411 4,880 19.0% 11.3% 21.5%
Operating Free
Cash Flow*
-3 1,051 -100.7% -102.0% -36.5%
*OFCF= EBITDA- Capex- Net Interest-Tax
Financial highlights
% of revenue 26.3%
% of revenue NM
Note: Group normalised items as per slide #7, NM – Not material
FY15 growth
(constant
currency)
FinancialsStrong FY15 results due to strong performance by Dialog, Smart, Idea and M1, and forex
translation; positive momentum at XL and a challenging year Celcom.
24.5%
5.3%

4Q 2015 8
Normalised Group PATAMI: FY14 → FY15Normalised performance lower by 8.2% due to Celcom and XL.
2,365 2,256 2,071 2,554 56 117 48 185 400 83
FY
20
14
FO
RE
X L
os
s
Ga
in o
n d
isp
os
al
of
SIM
XL
ga
in o
nd
isp
os
al
of
tow
ers
No
rma
lise
dF
Y2
014
Op
era
tio
ns
No
rma
lise
dF
Y2
015
XL
ga
in o
nd
isp
os
al
of
tow
ers
FO
RE
X
& O
thers
FY
20
15
FY15 Normalised itemFY14 Normalised item
Normalised Growth: -8.2%
FY Growth +8.0%
RM Million
Underlying operational
performance
Norm PATAMI FY2014 FY Growth Rates Norm PATAMI FY2015
Celcom 1,722 Celcom 1,308
XL 0.3 XL (87)
Dialog 136 Dialog 189
Robi 172 Robi 183
Smart 92 Smart 188
Associates & Others 133 Associates & Others 290
GROUP 2,256 GROUP 2,071
-24.1%
-29000.0%
+38.9%
+6.3%
+104.3%
+118.4%-8.2%
(-414)
(-87)
(+53)
(+11)
(+96)
(+156)
(-185)
Norm. PATAMI FY14 Norm. PATAMI FY15
*SIM – Samart I-Mobile Public Co Ltd
FY
14
FY
15
FY
15
FY
14*
4Q 2015 9
139
379 244
431
(3)
1,655
1,051
4Q14 1Q15 2Q15 3Q15 4Q15 FY14 FY15
500 651
521 678
553
2,982
2,404
4Q14 1Q15 2Q15 3Q15 4Q15 FY14 FY15
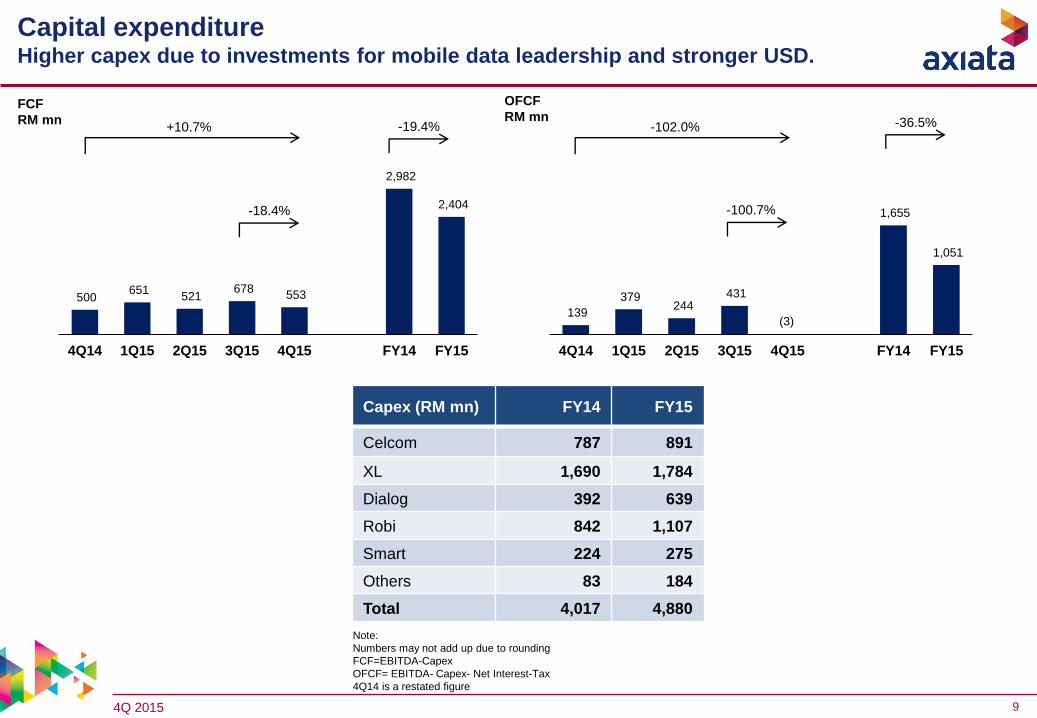
Capital expenditureHigher capex due to investments for mobile data leadership and stronger USD.
Note:
Numbers may not add up due to rounding
FCF=EBITDA-Capex
OFCF= EBITDA- Capex- Net Interest-Tax
4Q14 is a restated figure
FCF
RM mn
OFCF
RM mn+10.7% -102.0%
-18.4% -100.7%
-36.5%-19.4%
Capex (RM mn) FY14 FY15
Celcom 787 891
XL 1,690 1,784
Dialog 392 639
Robi 842 1,107
Smart 224 275
Others 83 184
Total 4,017 4,880

4Q 2015 10
1.99 2.04 2.03 1.92
2.25
1.25 1.23 1.25 1.311.49
31-Dec-14 31-Mar-15 30-Jun-15 30-Sep-15 30-Dec-15
Gross debt to EBITDA Net debt to EBITDA
Group statements of financial position Gross debt to EBITDA rises to 2.25x due to USD500m Sukuk drawdown; 67.3% of USD
debt is hedged.
Group borrowings Group cash balance
5,116 5,654 5,447
4,357
5,511
31-Dec-14 31-Mar-15 30-Jun-15 30-Sep-15 30-Dec-15
Cash and BankRM' Million
In million Loan Currency USD LC Total (RM)
USD 859 - 3,687
Sub-total 859 - 3,687
USD 725 3,110
RM 4,526 4,526
IDR (mn) 14,045,883 4,487
BDT 8,317 455
SLR 2,629 78
PKR 1,204 49
Sub-Total 725 12,706
Total Group 1,584 16,393
Hold co & Non OpCo
OpCos
RM Million Currency Amount
USD & Other FCY 1,798
Local (RM) 443
Sub-total 2,241
USD 374
Local (RM) 1,535
Local (ex-RM) 1,362
Sub-total 3,270
Total Group 5,511
Hold co & Non OpCo
OpCos
31-Dec-15 31-Dec-15
4Q 2015 11
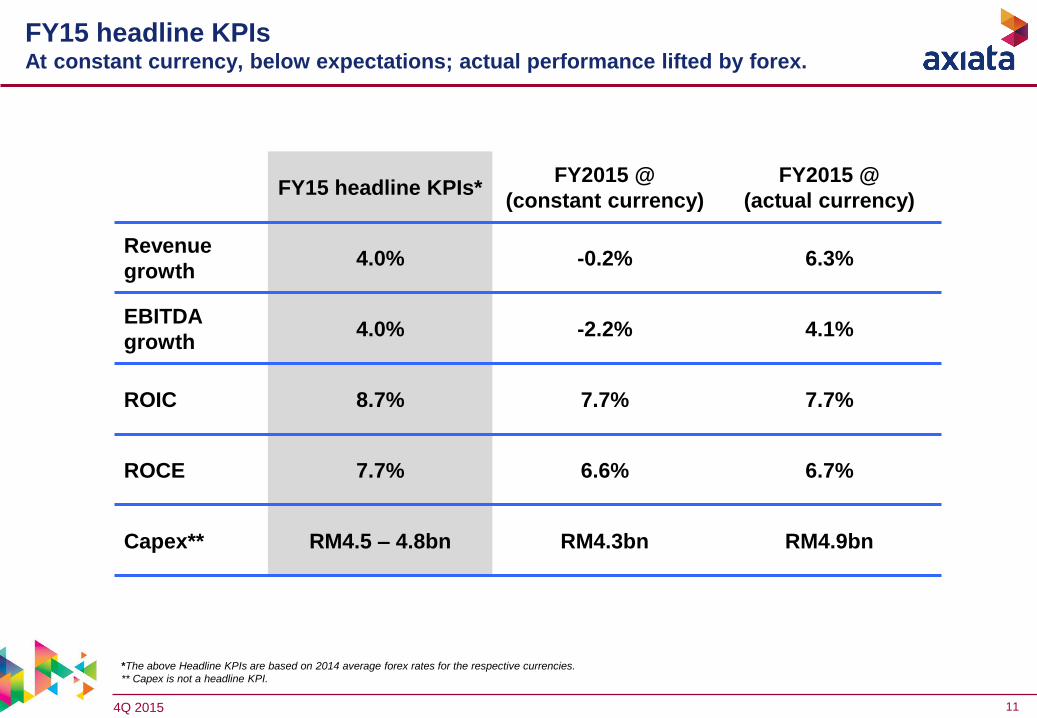
FY15 headline KPIs At constant currency, below expectations; actual performance lifted by forex.
FY15 headline KPIs*FY2015 @
(constant currency)
FY2015 @
(actual currency)
Revenue
growth4.0% -0.2% 6.3%
EBITDA
growth 4.0% -2.2% 4.1%
ROIC 8.7% 7.7% 7.7%
ROCE 7.7% 6.6% 6.7%
Capex** RM4.5 – 4.8bn RM4.3bn RM4.9bn
*The above Headline KPIs are based on 2014 average forex rates for the respective currencies.
** Capex is not a headline KPI.

4Q 2015 12
30%
60%
70%75%
84% 85%
0%
10%
20%
30%
40%
50%
60%
70%
80%
90%
2010 2011 2012 2013 2014 2015
Proposed dividendDividend payout ratio increased marginally to 85% - subject to shareholders’ approval.
DPR
DPS = 10 sen
DPS = 19 sen
DPS = 22 sen
DPS = 22 senDPS = 20 sen
* Includes special dividend of 12 sen,
** Subject to shareholders’ approval
**
DPS = 35 sen*

4Q 2015 13
FY16 headline KPIsModerate BAU growth, with consolidation of Ncell in 2H16.
Headline KPIs(based on Bloomberg* estimate in mid-Oct 2015 for 2016 forex)
Headline KPIs(based on constant currency)
Revenue growth12.2% 9.8%
EBITDA growth16.0% 13.7%
ROIC6.8% 6.6%
ROCE6.1% 6.0%
Capex **RM5.7bn RM5.5bn
*1 USD = RM4.20
** Capex is not a headline KPI

4Q 2015 14
Key opportunities and challenges for FY16
Opportunities
Recovery at Celcom.
Successful implementation to ‘Rise up the Ladder’ for XL.
Organic and inorganic growth in edotco.
Synergistic benefits from Ncell acquisition and Robi-Airtel merger.
Committed investments in data leadership driving data growth.
Challenges
Spectrum reallocation in Malaysia i.e. pricing and fee structure uncertainty.
SIM registration in Bangladesh, Indonesia and Cambodia.
Heightened competition in Malaysia, Bangladesh and Cambodia.
Sluggish macroeconomic conditions in Malaysia and Indonesia.
Currency volatility and global macroeconomic headwinds.

4Q 2015 15
Appendix

4Q 2015 16
Group revenue: FY14 → FY15 FY15 revenue growth mainly from Robi (data and device sales), Dialog (mobile and TV)
and Smart (data and voice).
18,712
19,883
391 181 435 538
319 89
Rev
enu
e
FY2
014
Ce
lco
m XL
Dia
log
Ro
bi
Sma
rt
Mu
ltin
et
&
Oth
ers
Rev
enu
e
FY2
015
FY14 Revenue FY15 RevenueFY movement
RM Million
Revenue growth: +6.3%
Revenue FY2014 FY Growth Rates Revenue FY2015
Celcom 7,729 Celcom 7,338
XL 6,476 XL 6,657
Dialog 1,686 Dialog 2,121
Robi 2,085 Robi 2,623
Smart 588 Smart 907
Multinet & Others 148 Multinet & Others 237
GROUP 18,712 GROUP 19,883
-5.1%+2.8%
+25.8%
+25.8%
+54.4%
+60.1%
+6.3%
(-391)(+181)(+435)
(+538)
(+319)(+89)
(+1,171)
Revenue FY14 Revenue FY15
FY
14
FY
15

4Q 2015 17
Group EBITDA: FY14 → FY15FY15 EBITDA growth mainly due to Smart (data and voice revenue), Robi (reversal of one-
off provision) and Dialog (data and voice revenue).
6,999 7,284
398
45 160
165 201
112
EB
ITD
A
FY2
014
Ce
lco
m XL
Dia
log
Ro
bi
Sma
rt
Mu
ltin
et
&
Oth
ers
EB
ITD
A
FY2
015
FY14 EBITDA FY15 EBITDAFY movement
RM Million
EBITDA growth: +4.1%
EBITDA FY2014 FY Growth Rates EBITDA FY2015
Celcom 3,117 Celcom 2,719
XL 2,468 XL 2,513
Dialog 524 Dialog 684
Robi 779 Robi 944
Smart 250 Smart 451
Multinet & Others (139) Multinet & Others (27)
GROUP 6,999 GROUP 7,284
-12.8%+1.8%
+30.7%
+21.2%
+80.6%+80.6%
+4.1%
(-398)
(+45)
(+160)
(+165)
(+201)(+112)
(+285)
EBITDA FY14 EBITDA FY15
FY
14
FY
15

4Q 2015 18
Group PATAMI: FY14 → FY15FY15 PATAMI increased mainly due XL’s tower gain, higher associates contribution and
forex gain.
2,365 2,554 429 145 53 17 96 413
PA
TA
MI
FY2
014
Ce
lco
m XL
Dia
log
Ro
bi
Sma
rt
Ass
oci
ate
s &
Oth
ers
PA
TA
MI
FY2
015
FY14 PATAMI FY15 PATAMIFY movement
RM Million
PATAMI growth: +8.0%
PATAMI FY2014 FY Growth Rates PATAMI FY2015
Celcom 1,720 Celcom 1,291
XL (152) XL (7)
Dialog 135 Dialog 82
Robi 170 Robi 187
Smart 92 Smart 188
Associates & Others 400 Associates & Others 813
GROUP 2,365 GROUP 2,554
-24.9%
+95.2%-39.1%
+10.0%
+104.6%
+103.0%
+8.0%
(-429)(+145)(-53)
(+17)(+96)
(+413)
(+189)
PATAMI FY14 PATAMI FY15
FY
14
FY
15

4Q 2015 19
399 376 328 333 255
1,702
1,291
477 452 424 407 449
2,004 1,732
4Q14 1Q15 2Q15 3Q15 4Q15 FY14 FY15
PATAMI Normalisation
768 710 663 677 666
3,099 2,716
832 772 750 737 809
3,323 3,068
4Q14 1Q15 2Q15 3Q15 4Q15 FY14 FY15
EBITDA Normalisation
1,953 1,923 1,802 1,801 1,819
7,742 7,345
4Q14 1Q15 2Q15 3Q15 4Q15 FY14 FY15
Celcom: financial performance Positive QoQ growth at revenue, normalised EBITDA and normalised PATAMI.
* Normalisation excludes holding company charge, impact of Edotco disposal, Escape, Celcom Planet, Employee Wish Pllan, Sukuk interest
Revenue (RM mn) Data revenue as a % of total revenue
EBITDA* (RM mn) & margins (%)
Normalised
EBITDA
Margin
42.6% 40.1% 41.6% 40.9% 44.5%
PATAMI* (RM mn) & margins (%)
Normalised
PATAMI
Margin
24.4% 23.5% 23.5% 22.6% 24.7%
Service
revenue 92.9% 90.2% 93.0% 93.7% 90.5% 93.5% 91.8%
25% 26% 27%29% 29%
22%
28%
4Q14 1Q15 2Q15 3Q15 4Q15 FY14 FY15
42.9% 41.8% 25.9% 23.6%

4Q 2015 20
Celcom: financial performanceFY15 capex of RM900m is below budget of RM1.1bn.
^ OPEX and EBITDA Margin excludes holding company charge, impact of Edotco disposal, Escape and Employee Wish Pllan
Operating Expenses^
31 Dec 14 31 Mar 15 30 June 15 30 Sept 15 31 Dec 15
Capex 845 186 344 558 885
Cash and Cash Equivalents 2,032 2,537 1,506 1,312 1,535
Gross Debt 5,026 4,986 5,037 4,482 4,526
Net Assets -1,074 -700 -1,472 -1,133 -878
Gross Debt / Equity (x) n/m n/m n/m n/m n/m
Gross Debt / EBITDA (x) 1.5 1.6 1.7 1.5 1.5
% of Revenue 4Q14 1Q15 2Q15 3Q15 4Q15 FY14 FY15
Direct Expenses 27.7% 29.8% 27.6% 27.4% 27.4% 27.6% 28.1%
Sales and Marketing 6.1% 6.3% 7.5% 6.7% 7.3% 7.1% 7.0%
Network Cost 10.6% 9.6% 13.3% 14.1% 11.5% 10.2% 12.1%
Staff Cost 7.5% 7.3% 5.7% 5.4% 4.5% 7.6% 5.8%
Bad Debts 0.9% 0.5% 0.3% 0.2% 0.1% 0.5% 0.3%
Others 4.6% 6.3% 4.0% 5.2% 4.8% 4.1% 5.1%
Total Expenses 57.4% 59.9% 58.4% 59.1% 55.5% 57.1% 58.2%
Normalised EBITDA Margin 42.6% 40.1% 41.6% 40.9% 44.5% 42.9% 41.8%
Depreciation & Amortisation 10.2% 10.2% 12.0% 11.7% 12.8% 9.7% 11.7%
Financial Position (RM mn)

4Q 2015 21
47%
53% 55%59% 59%
4Q14 1Q15 2Q15 3Q15 4Q15
Celcom: operational performanceOperational metrics impacted by heightened competition.
Subscribers (‘000)
MOU/sub (min) Smartphone penetration (%)
ARPU* (RM)
* ARPU re-stated to exclude inbound roaming revenue
87 86 86 84 85 89
85
34 33 32 32 31 35 31
45 44 43 42 42
45 43
4Q14 1Q15 2Q15 3Q15 4Q15 FY14 FY15
Postpaid Prepaid Blended
296 284 286 285 300 287 289
178 168 169 161 151
194 162
203 193 195 189 185
213
191
4Q14 1Q15 2Q15 3Q15 4Q15 FY14 FY15
Postpaid Prepaid Blended
2,804 2,739 2,851 2,802 2,803
10,165 9,540 9,489 9,707 9,447
12,968 12,279 12,340 12,509 12,250
4Q14 1Q15 2Q15 3Q15 4Q15
Postpaid Prepaid
4Q 2015 22
34
(758)
(93)
344 481
(804)
(25)
216
(34)118
(10) (22)30 51
4Q14 1Q15 2Q15 3Q15 4Q15 FY14 FY15
PAT Normalisation
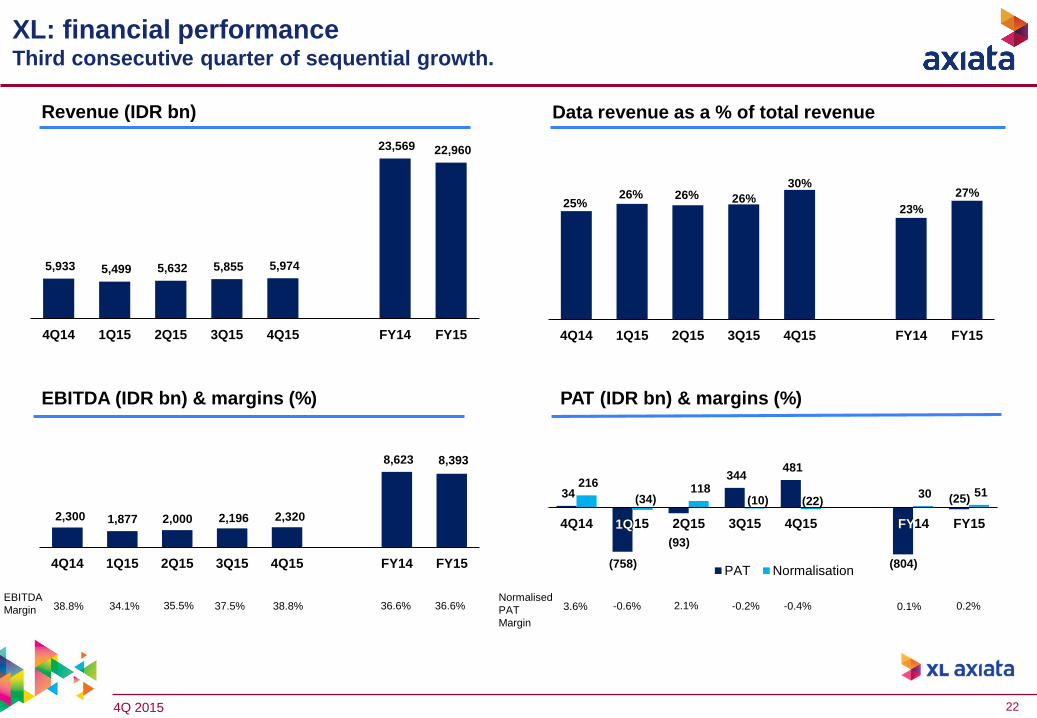
XL: financial performanceThird consecutive quarter of sequential growth.
Revenue (IDR bn) Data revenue as a % of total revenue
EBITDA (IDR bn) & margins (%)
EBITDA
Margin 38.8% 34.1% 35.5% 37.5% 38.8%
PAT (IDR bn) & margins (%)
1Q
Normalised
PAT
Margin
3.6% -0.6% 2.1% -0.2% -0.4%
5,933 5,499 5,632 5,855 5,974
23,569 22,960
4Q14 1Q15 2Q15 3Q15 4Q15 FY14 FY15
25%26% 26% 26%
30%
23%
27%
4Q14 1Q15 2Q15 3Q15 4Q15 FY14 FY15
2,300 1,877 2,000 2,196 2,320
8,623 8,393
4Q14 1Q15 2Q15 3Q15 4Q15 FY14 FY15
36.6% 36.6%
FY
0.1% 0.2%

4Q 2015 23
XL: financial performanceTransformation programme drives EBITDA margin up to 38.8% in 4Q15, from 34.1% in
1Q15.
Operating Expenses
31 Dec 14 31 Mar 15 30 Jun 15 30 Sept 15 31 Dec 15
Capitalised Capex 5,749 1,211 2,890 4,330 4,848
Cash and Cash Equivalents 6,951 6,853 5,500 3,644 3,312
Gross Debt 29,628 30,268 29,198 27,049 26,953
Net Assets 13,961 13,283 13,242 13,620 14,092
Gross Debt / Equity (x) 2.1 2.3 2.2 2.0 1.9
Gross Debt / EBITDA (x) 3.4 3.6 3.5 3.2 3.2
% of Revenue 4Q14 1Q15 2Q15 3Q15 4Q15 FY14 FY15
Direct Expenses 13.3% 13.0% 9.2% 9.1% 9.3% 14.2% 10.1%
Sales and Marketing 6.9% 4.2% 4.5% 5.2% 5.7% 6.0% 4.9%
Network Cost 32.9% 40.8% 42.0% 40.3% 38.7% 34.9% 40.4%
Staff Cost 4.7% 4.6% 4.8% 4.7% 4.8% 4.9% 4.7%
Others incl. discount 3.5% 3.2% 4.0% 3.1% 2.7% 3.3% 3.2%
Total Expenses 61.2% 65.9% 64.5% 62.5% 61.2% 63.4% 63.4%
EBITDA Margin 38.8% 34.1% 35.5% 37.5% 38.8% 36.6% 36.6%
Depreciation & Amortisation 30.1% 32.6% 31.6% 28.7% 31.5% 29.0% 31.1%
Financial Position (IDR bn)

4Q 2015 24
423 425 428 431 437
59,220 51,722
45,555 41,038 41,465
59,643
52,147
45,98341,469 41,902
4Q14 1Q15 2Q15 3Q15 4Q15
Postpaid Prepaid
XL: operational performancePositive subscriber net adds in 4Q15, and improved subscriber mix boosts ARPU.
MOU/sub (min) Smartphone penetration (%)
ARPU (IDR ‘000)Subscribers (‘000)
27%
33%36%
39%42%
4Q14 1Q15 2Q15 3Q15 4Q15
116 104 104 108 110
118 107
27 27 31 38 41
25 34
28 28 32
38 41
26
34
(14)
(4)
6
16
26
36
-
20
40
60
80
100
120
140
160
180
4Q14 1Q15 2Q15 3Q15 4Q15 FY14 FY15
Postpaid Prepaid Blended
73 64 63 56 60
76 60
125 121 130
108 94
132 116
124 121 129
108 94
126 114
-
20
40
60
80
100
120
140
-
50
100
150
200
4Q14 1Q15 2Q15 3Q15 4Q15 FY14 FY15
Postpaid Prepaid Blended
4Q 2015 25
5,494 5,978 5,919 6,314 5,613
20,895 23,824
4Q14 1Q15 2Q15 3Q15 4Q15 FY14 FY15
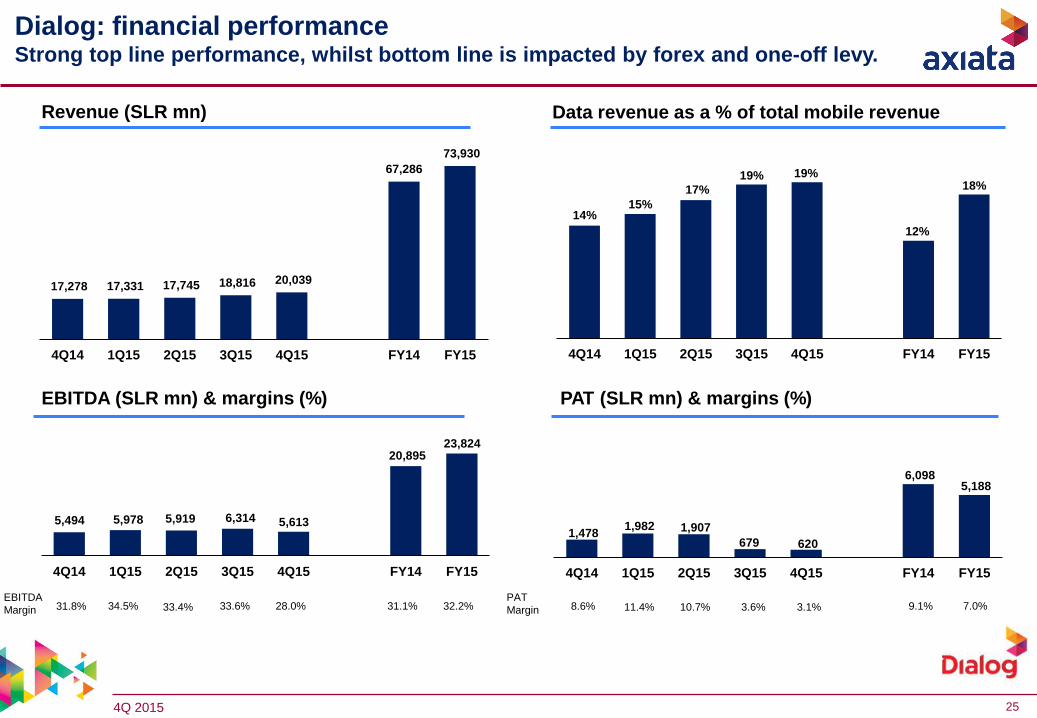
Dialog: financial performanceStrong top line performance, whilst bottom line is impacted by forex and one-off levy.
Revenue (SLR mn) Data revenue as a % of total mobile revenue
EBITDA (SLR mn) & margins (%)
EBITDA
Margin 31.8% 34.5% 33.4% 33.6% 28.0%
PAT (SLR mn) & margins (%)
PAT
Margin 8.6% 11.4% 10.7% 3.6% 3.1%
17,278 17,331 17,745 18,816 20,039
67,286
73,930
4Q14 1Q15 2Q15 3Q15 4Q15 FY14 FY15
14%15%
17%
19% 19%
12%
18%
4Q14 1Q15 2Q15 3Q15 4Q15 FY14 FY15
31.1% 32.2%
1,478 1,982 1,907
679 620
6,098 5,188
4Q14 1Q15 2Q15 3Q15 4Q15 FY14 FY15
9.1% 7.0%

4Q 2015 26
Dialog: financial performance4Q15 EBITDA margin declined 5.4% pp to 28.2% due to increased marketing initiatives,
higher employee incentives and one-off levy.
¹ Capex excludes Customer Premises Equipment investments and spectrum acquisition & license renewal
Operating Expenses
31 Dec 14 31 Mar 15 30 Jun 15 30 Sept 15 31 Dec 15
Capex¹ 13,630 1,740 5,276 8,959 19,577
Cash and Cash Equivalents² 8,736 11,481 7,542 8,208 4,429
Gross Debt 27,874 28,169 24,542 26,187 22,910
Net Assets 44,832 46,773 47,643 48,285 47,317
Gross Debt / Equity (x) 0.6 0.6 0.5 0.5 0.5
Gross Debt / EBITDA (x) 1.3 1.2 1.0 1.1 1.0
% of Revenue 4Q14 1Q15 2Q15 3Q15 4Q15 FY14 FY15
Direct Expenses 27.7% 28.0% 29.6% 29.0% 28.5% 28.5% 28.8%
Sales and Marketing 13.5% 12.3% 13.1% 13.3% 15.5% 12.8% 13.6%
Network Cost 12.6% 10.9% 9.9% 10.1% 10.5% 12.5% 10.3%
Staff Cost 8.5% 8.1% 8.0% 7.8% 9.9% 8.5% 8.5%
Bad debts 0.5% 0.8% 1.1% 1.0% 1.1% 1.3% 1.0%
Others 5.4% 5.3% 4.9% 5.2% 6.3% 5.3% 5.5%
Total Expenses 68.2% 65.5% 66.6% 66.4% 71.8% 69.0% 67.7%
EBITDA Margin 31.8% 34.5% 33.4% 33.6% 28.2% 31.1% 32.2%
Depreciation & Amortisation 19.4% 19.0% 19.8% 18.8% 20.1% 19.3% 19.4%
Financial Position (SLR mn)

4Q 2015 27
Dialog: operational performanceStrong subscriber net adds and ARPU growth.
MOU/sub (min) Smartphone penetration* (%)
ARPU (SLR)Subscribers (‘000)
19%
22%25%
28%30%
4Q14 1Q15 2Q15 3Q15 4Q15
1,085 1,030 1,094 1,087 1,115 1,098 1,082
266 266 253 283 290 260 273
356 352 346 372 378
350 362
-
50
100
150
200
250
300
350
400
450
-
200
400
600
800
1,000
1,200
1,400
1,600
1,800
4Q14 1Q15 2Q15 3Q15 4Q15 FY14 FY15
Postpaid Prepaid Blended
544 494 493 490 484
560 490
107 106 110 110 103 107 107
149 144 148 148
140 149 145
-
20
40
60
80
100
120
140
160
-
100
200
300
400
500
600
700
800
4Q14 1Q15 2Q15 3Q15 4Q15 FY14 FY15
Postpaid Prepaid Blended
1,075 1,085 1,112 1,135 1,141
8,464 8,722 9,030 9,177 9,731
9,540 9,807 10,142 10,312 10,872
4Q14 1Q15 2Q15 3Q15 4Q15
Postpaid Prepaid

4Q 2015 28
Robi: financial performanceSolid performance despite heightened competition.
Revenue (BDT mn) Data revenue as a % of total revenue
EBITDA (BDT mn) & margins (%) PAT (BDT mn) & margins (%)
EBITDA
Margin 33.9% 37.4% 36.7% 36.0% 35.9% PAT
Margin 6.9% 7.6% 7.3% 8.4% 7.3%
Normalised
EBITDA
Margin
37.0%Normalised
PAT
Margin
7.8%
1. Normalisation excludes impact of edotco carve out in 3Q15
39.7% 8.0%
13,324 12,163 12,952 13,409 13,871
49,423 52,395
4Q14 1Q15 2Q15 3Q15 4Q15 FY14 FY15
8%
10%
9%10%
10%
6%
10%
4Q14 1Q15 2Q15 3Q15 4Q15 FY14 FY15
4,523 4,554 4,749 4,832 4,979
18,913 19,113
5,323 5,127
19,753
4Q14 1Q15 2Q15 3Q15 4Q15 FY14 FY15
EBITDA Normalisation
38.3% 36.5%
37.7%
913 927 939 1,131
1,006
4,397 4,004
1,075 1,078
4,020
4Q14 1Q15 2Q15 3Q15 4Q15 FY14 FY15
PAT Normalisation
8.9% 7.6%
7.7%
4Q 2015 29
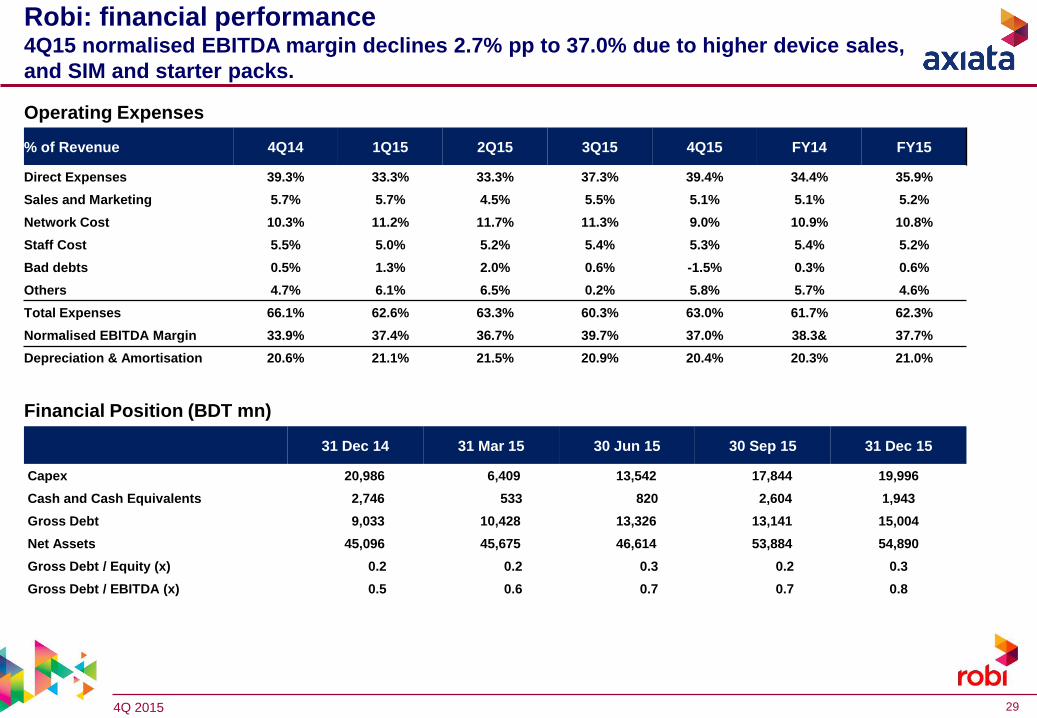
Operating Expenses
31 Dec 14 31 Mar 15 30 Jun 15 30 Sep 15 31 Dec 15
Capex 20,986 6,409 13,542 17,844 19,996
Cash and Cash Equivalents 2,746 533 820 2,604 1,943
Gross Debt 9,033 10,428 13,326 13,141 15,004
Net Assets 45,096 45,675 46,614 53,884 54,890
Gross Debt / Equity (x) 0.2 0.2 0.3 0.2 0.3
Gross Debt / EBITDA (x) 0.5 0.6 0.7 0.7 0.8
% of Revenue 4Q14 1Q15 2Q15 3Q15 4Q15 FY14 FY15
Direct Expenses 39.3% 33.3% 33.3% 37.3% 39.4% 34.4% 35.9%
Sales and Marketing 5.7% 5.7% 4.5% 5.5% 5.1% 5.1% 5.2%
Network Cost 10.3% 11.2% 11.7% 11.3% 9.0% 10.9% 10.8%
Staff Cost 5.5% 5.0% 5.2% 5.4% 5.3% 5.4% 5.2%
Bad debts 0.5% 1.3% 2.0% 0.6% -1.5% 0.3% 0.6%
Others 4.7% 6.1% 6.5% 0.2% 5.8% 5.7% 4.6%
Total Expenses 66.1% 62.6% 63.3% 60.3% 63.0% 61.7% 62.3%
Normalised EBITDA Margin 33.9% 37.4% 36.7% 39.7% 37.0% 38.3& 37.7%
Depreciation & Amortisation 20.6% 21.1% 21.5% 20.9% 20.4% 20.3% 21.0%
Financial Position (BDT mn)
Robi: financial performance4Q15 normalised EBITDA margin declines 2.7% pp to 37.0% due to higher device sales,
and SIM and starter packs.

4Q 2015 30
189 195
234
203 202 202 217
150 141 138 131 123
164 146
150 142 139
132 123
164
147
4Q14 1Q15 2Q15 3Q15 4Q15 FY14 FY15
Postpaid Prepaid Blended
252
106
335 304 289
260 259
155 149 143 140 134 160
141
157 149 144 142 136
161
143
4Q14 1Q15 2Q15 3Q15 4Q15 FY14 FY15
Postpaid Prepaid Blended
Robi: operational performanceHeightened competition continuous to erode ARPU.
MOU/sub (min) Smartphone penetration (%)
ARPU (BDT)
* SME billing base reclassified from postpaid to prepaid from 1Q15 onwards.
147*
208*
141*
219*
140*188*
136*
203*
Subscribers (‘000)
137*
219*
131*
190*
- SME subbase reclassification reported to BTRC from July 15 onwards
533 634 759 158 170
24,756 25,655 26,609 28,215 28,147
25,289 26,289 27,368 28,373 28,317
4Q14 1Q15 2Q15 3Q15 4Q15
Postpaid Prepaid
839*
27,534*
992*
27,325*
130*
235*
123*
187*
12%12%
16%17%
20%
4Q14 1Q15 2Q15 3Q15 4Q15
139*
220*
132*
192*
152*
192*

4Q 2015 31
Average Rate
FY2014
Average Rate
Q3'15
Average Rate
Q3'15
Average Rate
FY2015
QoQ
Appreciation/
(Depreciation)
against MYR
FY Appreciation/
(Depreciation)
against MYR
QoQ
Appreciation/
(Depreciation)
against USD
FY Appreciation/
(Depreciation)
against USD
(%) (%) (%) (%)
INDONESIAN RUPIAH, IDR 0.000276 0.000292 0.000311 0.000291 6.51 5.43 0.68 (11.56)
SRI LANKA RUPEE, LKR 0.025060 0.029878 0.030124 0.028667 0.82 14.39 (4.69) (4.05)
BANGLADESHI TAKA, BDT 0.042180 0.052158 0.054606 0.050062 4.69 18.69 (1.03) (0.45)
US DOLLAR, USD 3.271991 4.048323 4.282427 3.900961 5.78 19.22 0.00 0.00
SINGAPORE DOLLAR, SGD 2.582457 2.911296 3.042696 2.836184 4.51 9.83 (1.20) (7.88)
PAKISTAN RUPEE, PKR 0.032406 0.039367 0.040825 0.037952 3.70 17.11 (1.97) (1.77)
INDIAN RUPEE, INR 0.053616 0.062295 0.064976 0.060762 4.30 13.33 (1.40) (4.94)
Local Currency
FY15 all OpCos currencies appreciated against RM
Sources :
Actual rate - Bloomberg 2014 & 2015
4Q153Q15
