4q & fy 2019 results conference call - esprinet
TRANSCRIPT

4Q & FY 2019 RESULTS CONFERENCE CALL
February 14, 2020

2
Forward looking statement
This presentation may contain forward-looking statements that are subject to risks and uncertainties,including those pertaining to the anticipated benefits to be realized from the proposals described herein.Forward-looking statements may include, in particular, statements about future events, future financialperformance, plans, strategies, expectations, prospects, competitive environment, regulation, supply anddemand. Esprinet has based these forward-looking statements on its view and assumptions with respect tofuture events and financial performance. Actual financial performance could differ materially from thatprojected in the forward-looking statements due to the inherent uncertainty of estimates, forecasts andprojections, and financial performance may be better or worse than anticipated. Given these uncertainties,readers should not put undue reliance on any forward-looking statements. The information contained in thispresentation is subject to change without notice and Esprinet does not undertake any duty to update theforward-looking statements, and the estimates and the assumptions associated with them, except to theextent required by applicable laws and regulations.

3
TODAY SPEAKERS
Alessandro CattaniChief Executive Officer
Valerio CasariChief Financial Officer

4
2019 Keywords
Esprinet outperforms the market and confirms its Leadership in Southern Europe with a market share >26%
✓ Sales 3,951.9 M€ +10.7% on 2018
✓ +12.7% in Italy
✓ +6.3% in Spain
LEADERSHIP
Improvements in Strategic Initiatives
✓ Portugal
✓ High added value segments(Advanced Solutions, Xaas, Outsourcing)
✓ White Goods
STRATEGIC INITIATIVES
Structural improvement of the Value creation KPIs
✓ EBIT 42.0 M€, +3% on 2018 EBIT adj. and 72% on EBIT
✓ CCC: 24 days, best result of the last 16 quarters
✓ ROCE: 9.8% (9.4% in 2018)
✓ Profitability targets achieved
VALUE CREATION

5
Main achievements of a strong 2019
✓ Financial targets achieved
✓Customer satisfaction program fully in place
✓Gross profit % on commoditized products (PC & Phones) stabilized
✓Constant improvement in inventory and in payables management
✓ Strong reduction of factoring utilization on customers
✓ Sport Technology clean-up completed
✓Mid-term target projects gaining traction: Portugal, White Goods, Advanced Solutions
✓Buy back plan almost completed
✓Clear ‘investor friendly’ strategy deployed

6
2019 Results
€/M 2018 FY 2019 Q1 2019 Q2 2019 Q3 2019 Q4 2019 FY
SALES 3,571.2 875,5 842,0 893,6 1.340,8 3,951.9
yoy +12% +11% +16% +6% +11%
EBIT as reported 23.7 6,7 7,2 6,7 21,4 42,0
yoy +26% +30% +62% +147% +77%
31/12/18 31/03/19 30/06/19 30/09/19 31/12/19
Cash Conversion Cycle Days 27 27 28 26 24
ROCE 9.4% 8.1% 8.3% 8.3% 9.8%
Factoring quarter-end (M€) 596.7 360.0 334.0 311.3 480.1
NFP ‘as reported’ (M€) (241.0) 247.1 183.1 183.6 (286.7)
NFP pre-IFRS 16 (M€) (241.0 ) 68.6 90.0 92.8 (381.1)
13th consecutive quarter of yoy Sales growthStrong EBIT growth even net of IFRS 16 effect
5th consecutive quarter of ROCE sequentially above WACC162.3 M€ of factoring utilization reduction at year end (-27.2%)

7
FY 2019 (Pre-IFRS 16)
• Reported net sales at 3,951.9 M€ increased +11% comparedto prior-year.
• Overall gross profit was up +3% at 176.2 M€ (4.46% on Sales compared to 4.80% in 2018).
• Disciplined cost structure as personnel costs up modest +5% and other operating costs down -13% (+6% on a like-for-like basis or pre-IFRS16).
• EBIT pre-IFRS 16 at 39.0 M€ down -5% compared to prior-year Recurring EBIT.
• EBIT % at 0.99% compared to 1.15% in 2018.
M/€ FY2018 % Var.
Pre-IFRS16
Sales from contracts with customers 3.951,9 3.951,9 3.571,2 11%
Cost of goods sold excl. factoring/securitisation 3.771,0 3.771,0 3.394,9 11%
Financial cost of factoring/securisation 4,6 4,6 4,9 -6%
Gross Profit 176,3 176,2 171,4 3%
Gross Profit % 4,46% 4,46% 4,80%
Personnel costs 64,1 64,1 61,1 5%
Other operating costs 56,5 (11,9) 68,4 64,7 -13%
EBITDA 55,7 11,9 43,7 45,7 22%
EBITDA % 1,41% 1,11% 1,28%
Depreciation and amortisation 4,7 4,7 4,7 0%
IFRS 16 Right of Use depreciation 8,9 8,9 - - n/s
Recurring EBIT 42,1 3,0 39,0 41,0 3%
Recurring EBIT % 1,07% 0,99% 1,15%
Non recurring costs 0,0 0,0 17,2 n/s
EBIT 42 3,0 39,0 23,7 77%
Recurring EBIT % 1,07% 0,99% -0,66%
IFRS 16 interest expenses on leases 5,4 5,4 - - n/s
Other financial (income) expenses 4,2 4,2 3,6 18%
Foreign exchange (gains) losses 1,7 1,7 1,0 73%
Profit before income taxes 30,8 (2,4) 33,1 19,1 60%
Income taxes 8,7 (0,5) 9,2 5,0 74%
Net income 22,1 (1,9) 24,0 14,1 56%
FY2019

8
Working Capital Metrics
Idays (Inventory Days): 4-qtr average of (quarter-end Inventory / quarterly Sales * 90)DSO (Days of Sales Outstanding): 4-qtr average of (quarter-end Trade Receivables / quarterly Sales * 90)DPO (Days of Purchases Outstanding): 4-qtr average of (quarter-end Trade Payables / quarterly Cost of Sales * 90)
• Cash conversion cycle stood at 24 days sequentially improving by 4 days(1):
Idays = 46.7 (-2.8)DSO = 38.3 (+3.2)DPO = (61.4) (+4.2)Tot = 23.6 (-3.7)
• Compared to Q4 2018 metrics, Idays decreased -2.8 days, DSO increased +3.2 days and DPO increased +4.2 days for a total improvement of 3.7 days from 27.3 to 23.6 days.
44 46 46 44 43 43 45 48
51 54
52 51 49 48 48 47 47
31 31 32 35 36 37 38 38 36 35 35 35 35 37 38 37 38
50 50 52 53 52 52 52 53 55 55 57 56 57 58 58 58 61
26 27 27 26
28 28
31 32 32
34
30 29
27 27 28
26
24
0
5
10
15
20
25
30
35
40
0
10
20
30
40
50
60
70
2015 Q4 2016 Q1 2016 Q2 2016 Q3 2016 Q4 2017 Q1 2017 Q2 2017 Q3 2017 Q4 2018 Q1 2018 Q2 2018 Q3 2018 Q4 2019 Q1 2019 Q2 2019 Q3 2019 Q4
Idays DSO DPO Cash Cycle Days
Best quarter in last 3 years
9
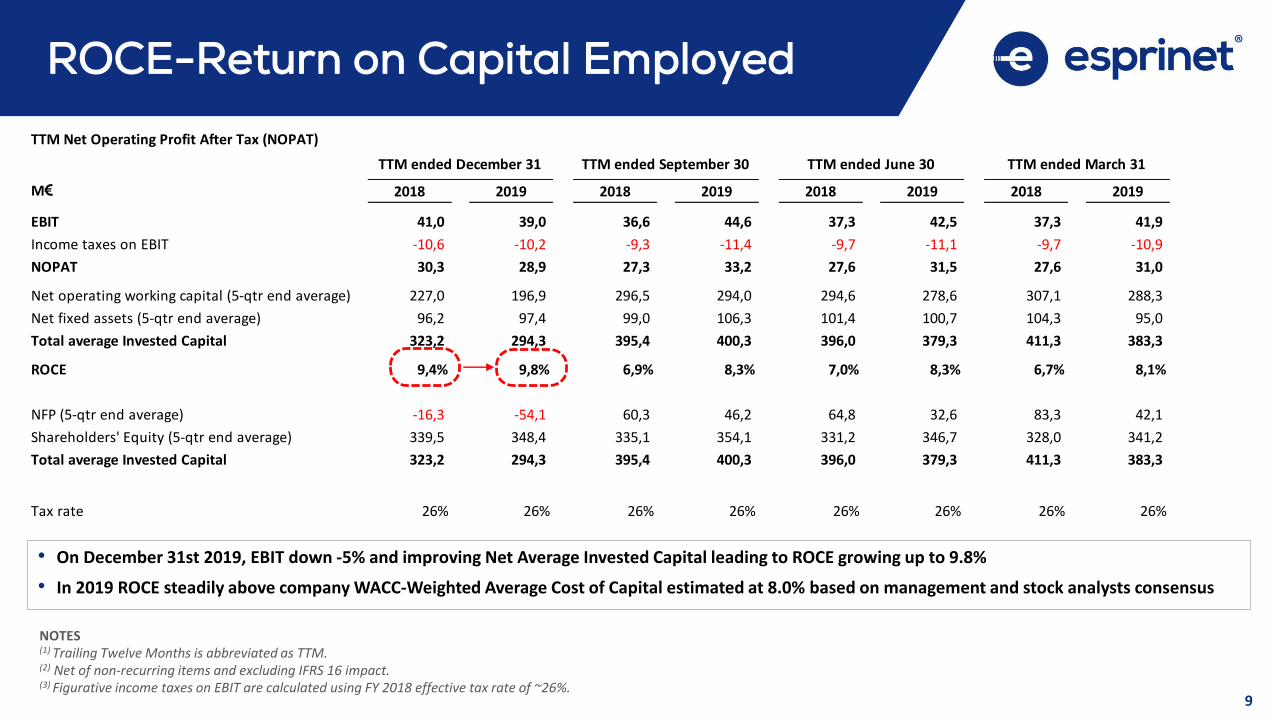
ROCE-Return on Capital Employed
NOTES(1) Trailing Twelve Months is abbreviated as TTM.(2) Net of non-recurring items and excluding IFRS 16 impact.(3) Figurative income taxes on EBIT are calculated using FY 2018 effective tax rate of ~26%.
TTM Net Operating Profit After Tax (NOPAT)
M€ 2018 2019 2018 2019 2018 2019 2018 2019
EBIT 41,0 39,0 36,6 44,6 37,3 42,5 37,3 41,9
Income taxes on EBIT -10,6 -10,2 -9,3 -11,4 -9,7 -11,1 -9,7 -10,9
NOPAT 30,3 28,9 27,3 33,2 27,6 31,5 27,6 31,0
Net operating working capital (5-qtr end average) 227,0 196,9 296,5 294,0 294,6 278,6 307,1 288,3
Net fixed assets (5-qtr end average) 96,2 97,4 99,0 106,3 101,4 100,7 104,3 95,0
Total average Invested Capital 323,2 294,3 395,4 400,3 396,0 379,3 411,3 383,3
ROCE 9,4% 9,8% 6,9% 8,3% 7,0% 8,3% 6,7% 8,1%
NFP (5-qtr end average) -16,3 -54,1 60,3 46,2 64,8 32,6 83,3 42,1
Shareholders' Equity (5-qtr end average) 339,5 348,4 335,1 354,1 331,2 346,7 328,0 341,2
Total average Invested Capital 323,2 294,3 395,4 400,3 396,0 379,3 411,3 383,3
Tax rate 26% 26% 26% 26% 26% 26% 26% 26%
TTM ended March 31TTM ended September 30 TTM ended June 30TTM ended December 31
• On December 31st 2019, EBIT down -5% and improving Net Average Invested Capital leading to ROCE growing up to 9.8%
• In 2019 ROCE steadily above company WACC-Weighted Average Cost of Capital estimated at 8.0% based on management and stock analysts consensus

10
ROCE evolution up to Q4 2019
11,4%
10,1%
8,8%
10,9%
8,5%
7,7%7,2% 7,6%
6,7%
7,0%
6,9%
9,4%
8,1%8,4% 8,4%
9,8%
0,0%
1,0%
2,0%
3,0%
4,0%
5,0%
6,0%
7,0%
8,0%
9,0%
10,0%
11,0%
12,0%
0
50.000
100.000
150.000
200.000
250.000
300.000
350.000
400.000
450.000
2016 Q1 2016 Q2 2016 Q3 2016 Q4 2017 Q1 2017 Q2 2017 Q3 2017 Q4 2018 Q1 2018 Q2 2018 Q3 2018 Q4 2019 Q1 2019 Q2 2019 Q3 2019 Q4
Average Capital Employed last 5 quarters NOPAT Adj last 4 quarters ROCE
Rebound from historical low of 6.7% in Q1 2018.
Seasonal spike improving from 9.4% to 9.8%.
Above Corporate WACC along 2019.

11
A solid foundation
We have created a solid foundation ready to
✓ finance organic growth and/or any acquisition with an high strategic value …
✓ face turbulences on the financial markets …
✓develop business models with greater added-value both in terms of the complexity of products sold as well as service content provided to customers and vendors …

12
Leadership: Sales by Geography
Strong market share growth in a growing market
2019 Market Value(*)
ITALY
8,022 M€ (+7.6% on 2018)
SPAIN
5,561 M€ (+6.3% on 2018)
PORTUGAL
1,344 M€ (+7.9% on 2018)
(*) Source: Context
€/M FY 2019 FY 2018 ∆ %
Italy 2.495,6 2.214,7 13%
Spain 1.383,7 1.300,2 6%
Portugal 38,5 30,2 27%
UE 20,0 17,5 14%
Extra-UE 14,1 8,6 64%
Sales from contracts with customers 3.951,9 3.571,2 11%

13
Leadership: Sales by Products
Positive performances for high margin segments
✓ Printing SALES of 418.3 M€, +6.4% on 2018 in a substantially flat market.
✓ Advanced Solutions +6.5% growth in Advanced Solutions sales, net of 2018 positive effect from a major public tender win.
✓ White Goods sales (+50%) are gaining traction and slightly increased Gross profit.
✓ Gaming sales +47% thanks also to the acquisition of 4Side, the exclusive distributor for Italy of Activision Blizzard products.
FY 2019 % FY 2018 % ∆ %
PC (notebook, tablet, desktop, monitor) 1.375,4 34,8% 1.212,8 34,0% 13%
Printing devices and supplies 418,3 10,6% 393,1 11,0% 6%
Other IT products 244,9 6,2% 237,9 6,7% 3%
Total IT Clients 2.038,6 51,6% 1.843,8 51,6% 11%
Hardware (networking, storage, server & others) 407,4 10,3% 409,0 11,5% 0%
Software, Services, Cloud 153,6 3,9% 146,8 4,1% 5%
Total Advanced Solutions 560,9 14,2% 555,7 15,6% 1%
Smartphones 1.106,3 28,0% 997,4 27,9% 11%
White goods 55,8 1,4% 37,2 1,0% 50%
Gaming hardware and software 43,3 1,1% 29,5 0,8% 47%
Other consumer electronics products 191,0 4,8% 152,5 4,3% 25%
Total Consumer Electronics 1.396,4 35,3% 1.216,6 34,1% 15%
Adjustments (44,1) -1,1% (44,9) -1,3% -2%
Sales from contracts with customers(*) 3.951,9 100,0% 3.571,2 100,0% 11%
(*) Net of IFRS 15 and other adjustments as of -44,1 M€ (-44,9 M€ in 2018)

14
LEADERSHIP: Sales by Customer
Strong performance in each segment
✓ The Group has consolidated an absolute leadership position on Retailers & e-Tailers.
✓ The Professional IT Resellers segment, represents the area in which the Group intends to increase investments in 2020, in particular by benefiting from projects aimed at improving customer satisfaction.
(*) Net of IFRS 15 and other adjustments as of -44,0 M€ (-47,7 M€ in 2018)
€/M FY 2019 FY 2018 ∆ %
Retailer/e-tailer 1.933,3 1.661,7 16%
IT Reseller 2.062,5 1.957,1 5%
Adjustments -44,0 -47,7
Sales from contracts with customers(*) 3.951,9 3.571,2 11%

15
Drill down on two Strategic Initiatives
Executing on higher margin product segments
Advanced Solutions
✓ +6.5% growth in Advanced Solutions sales, net of 2018 positive effect from a major public tender win.
XaaS
✓ 19.7 M€, + 42% compared to 2018 almost exclusively attributable to sales of "Cloud" solutions
✓ The Group is developing plans and activities aimed at creating a structural control not only of the Cloud markets but also of printing services ("MPS-Managed Print Services") and workplace management (“Device as a Service").
€/MFY
2019
FY
2018∆ %
Advanced Solutions 560,9 555,7 1%
XaaS ("Everything as a Service") 19,7 13,9 42%

16
Profitability and dividends since listing
Strong Investor Focus
✓ 440 M€ of cumulated net profit since going public in 2001.
✓ 108 M€ of cumulated dividends paid (pending 2019 dividend decision).
✓ Historical stable flow of profitability since 2001 even in market downturns.
✓ Strong financial discipline to enable a 25% pay-out dividend policy.
2001-19 Pay-out ratio (Dividends/Consolidated net income)

FINANCIALS

18
Balance Sheet Highlights
M€ 31.12.19 31.12.18
Net operating working capital (121.0) 10.4
Goodwill 90.7 90.6
Other fixed assets 120.4 27.9
Other current assets/liabilities (2.4) (12.7)
Other non-current assets/liabilities (16.9) (14.4)
Net invested capital 70.8 101.9
Long-term financial liabilities 61.0 12.8
Short-term financial liabilities (1) 35.9 138.3
Lease liabilities 94.4 -
Cash and cash equivalents (463.8) (381.3)
Other (14.4) (11.9)
Net financial debt (286.7) (241.0)
Net equity 357.5 342.9
Total sources 70.8 101.9
NOTES(1) Includes 72,1 M€ at December 31, 2018 reclassified from long-term debt due to covenant breach on Syndicated Senior Term Loan.
BS at December 31, 2019
• At December 31, 2019 Group net equity was357.5 M€. At the same date the Group had 90.7 M€ of goodwill resulting in a Net tangible equity of 266.8 M€.
• The Net Financial Position was a positive 286.7 M€ (improving by 45.6 million compared to 241.0 M€ million at 31 December 2018).
• It includes € 94.4 million of financial liabilities for leases not present as at 31 December 2018 as a result of the first-time adoption of IFRS 16.
• The improvement in the Net Financial Position, neutralising the IFRS 16 effect, amounted to 140.0 M€ mainly due to the reduction in the year-end levels of NWC (negative by 121.0 M€).
• The net financial debt at 31 December 2019 is positively affected by a number of factors as (i) the level of utilization of ‘without–recourse’ sales of trade receivables (factoring and securitization programs) (ii) the stronger than average financial support by vendors.

19
Finance costs
• FX risk (e.g. ‘transactional risk’) identified and mapped by the Board within annual ERM-Enterprise Risk Management review on February 2019.
• Current strategy based on ‘risk tolerance’.
• Total net finance costs increase of 6.7 M€ mainly due to:- 0.6 M€ of increase in up-front arrangement fees
amortization;- 5.4 M€ of interests on leases;- 0.4 M€ of derivatives expenses;- 0.7 M€ increase in net exchange losses.
• Increase in banking fees mainly due to 0.8 M€ of one-off effect arising from the early repayment of Syndicated Senior Loan occurred on September26, 2019.
• Interests on leases of 5.4 M€ due to IFRS 16 first adoption.
• Derivatives expenses almost entirely due to termination of ‘hedging” IRS on repaid Senior Loan.
• Exchange losses of 1.7 M€ related to unfavourableeffect of USD strengthen on purchases (~3% of total).
• Interest expenses on bank financing decrease of 0.7 M€ due both to lower average financial debtand cost of funding.
M€
Interest expenses on LT borrowings 2.069 2.706 (637)
Interest expenses on ST facilities 375 381 (6)
Other interest expenses 19 52 (33)
Up-front fees amortisation 1.392 730 662
IAS 19 expenses/losses 68 57 11
IFRS 16 interest expenses on leases 5.401 - 5.401
Derivatives expenses 531 113 418
Total financial expenses 9.855 4.039 5.816
Interest income from banks (109) (34) (75)
Interest income from others (136) (195) 59
Interest income on business combination - (229) 229
Other (3) (2) (1)
Total financial income (248) (460) 196
Net financial expenses 9.607 3.579 6.012
Net foreign exchange (profit)/losses 1.665 962 703
Finance costs, net 11.272 4.541 6.715
FY 2019 FY 2018 Var.

20
Factoring/Securitisation utilisation
• The Group runs a number of ‘without-recourse’ factoring and securitisation of TR programs.
• Factoring mostly involving big Retailers both in Italy and Spain
• Programs are wholly ‘IFRS-compliant’ since they realise full transfer of risks and benefits to the assignees thus involving de-consolidation of underlying assets.
• Due to better T&Cs negotiated with customers that are part of the programs, the overall positive impact on Net Financial Position at 31 December 2019 coming from the anticipated sales of receivables falls to 480.1 M€ compared to 596.7 M€ at 31 December 2018 (-116.6 M€).
596.7 M€
480.1 M€
0
100.000
200.000
300.000
400.000
500.000
600.000
700.000
2015 Q1 2015 Q2 2015 Q3 2015 Q4 2016 Q1 2016 Q2 2016 Q3 2016 Q4 2017 Q1 2017 Q2 2017 Q3 2017 Q4 2018 Q1 2018 Q2 2018 Q3 2018 Q4 2019 Q1 2019 Q2 2019 Q3 2019 Q4

CLOSING REMARKS

22
Moving forward: 2020 guidelines
Moderate top-line growth as focus keeps being ROCE
performance
Improvements in GP % as result of mix and efforts on
customer satisfaction
Further improvements in Working Capital management
ROCE steadily above Weighted Average Cost of Capital (8.0%)

23
Upcoming event
Follow us
March 24, 2020Board of Directors
2019 FULL YEAR RESULTS

Q & A

IR TEAM
ESPRINET S.p.A.Tel. +39 02 40496.1 - [email protected]
IR Top ConsultingIR Advisor
T +39 02 45473884Maria Antonietta Pireddu, [email protected]
Federico Nasta, [email protected]