4q & full year 2017 results & strategy update … · bernard looney thank you lamar. ......
TRANSCRIPT

BP 4Q & FULL YEAR 2017 RESULTS & STRATEGY UPDATE 32
4Q & FULL YEAR 2017 RESULTS & STRATEGY UPDATE
Group Chief Executive
Bob Dudley
BP 4Q & FULL YEAR 2017 RESULTS & STRATEGY UPDATE
Chief Executive, Upstream
Bernard Looney
Thank you Lamar. And good morning ladies and gentlemen.
Today I will provide an update on the five year plan we laid out last year, with a summaryof what we delivered in 2017, and what this means for our plan to 2021 and beyond.
32
BP 4Q & FULL YEAR 2017 RESULTS & STRATEGY UPDATE 33
Upstream strategySAFETY STRATEGY
core value#1
(1) 2016-2021 compound annual growth rate (2) Free cash flow proxy = Underlying RCPBIT+DD&A+EWO-Organic capital expenditure, at $55/bbl Brent 2017 real
QUALITY EXECUTION
GROWING GAS AND ADVANTAGED OIL
RETURNS LED GROWTH
$13-14bn5%productionCAGR1
capital expenditurep.a. to 2021
free cashflow2 in 2021
KEY METRICS
$13-14bn
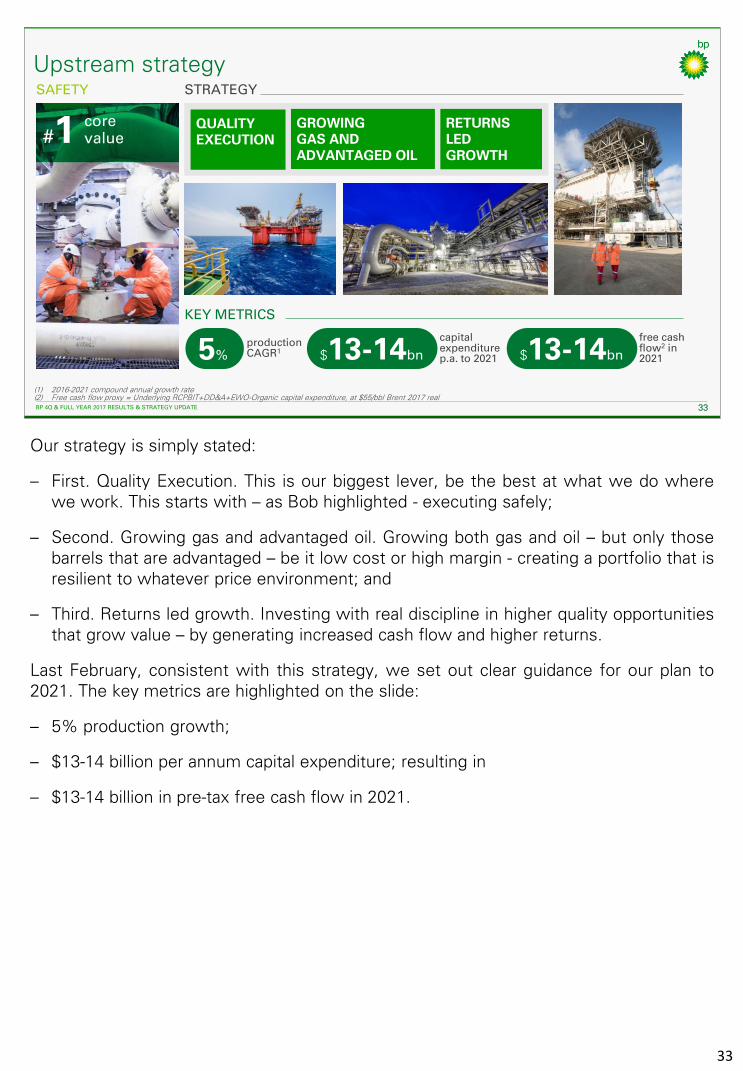
Our strategy is simply stated:
– First. Quality Execution. This is our biggest lever, be the best at what we do wherewe work. This starts with – as Bob highlighted - executing safely;
– Second. Growing gas and advantaged oil. Growing both gas and oil – but only thosebarrels that are advantaged – be it low cost or high margin - creating a portfolio that isresilient to whatever price environment; and
– Third. Returns led growth. Investing with real discipline in higher quality opportunitiesthat grow value – by generating increased cash flow and higher returns.
Last February, consistent with this strategy, we set out clear guidance for our plan to2021. The key metrics are highlighted on the slide:
– 5% production growth;
– $13-14 billion per annum capital expenditure; resulting in
– $13-14 billion in pre-tax free cash flow in 2021.
33

BP 4Q & FULL YEAR 2017 RESULTS & STRATEGY UPDATE 34
Continued track record of delivery
(1) From 2015 base(2) Reported Upstream production. CAGR = compound annual growth rate(3) Free cash flow proxy = Underlying RCPBIT+DD&A+EWO-Organic capital expenditure, at $55/bbl Brent 2017 real. 2017 at actual prices
2017 DELIVERYFEBRUARY 2017 GUIDANCE
800mboed major project production1 in 2020 7 start-ups on schedule and under budget
>500mboed production capacity1
$13-14bn p.a. organiccapital expenditure
organic capital expenditure$13.8bn
5% productionCAGR2 2016-21
productiongrowth212%
Stronger long term growth
exploration successand new access 3FIDs
$13-14bn free cash flow in 20213 $6.9bn
free cashflow3
In 2017, we took significant steps towards these goals with a very strong year ofdelivery.
First - at the beginning of the year - we set out ambitious plans to start up seven majorprojects. All seven were successfully delivered - on average on schedule and underbudget.
In total - from the beginning of 2016 to the end of 2017 - we installed more than 500thousand barrels of oil equivalent per day production capacity from our major projects. Avery significant year of delivery as we march towards our 2020 guidance of 800thousand barrels per day.
Second – we grew production 12% versus 2016. This was ahead of our plan withproduction growth accelerated into 2017. Underlying growth was 8%.
Third – we said we would maintain discipline and invest between $13-14 billion oforganic capital per annum. In 2017 - we invested $13.8 billion of organic capital.Importantly we continue to maintain a laser focus on the efficiency of our spend and Iwill share more on this later.
Fourth - all this helped us generate $6.9 billion pre-tax free cash flow – an increase ofaround $8.5 billion on 2016.
Finally, we made 3 final investment decisions and took a number of steps to strengthenour portfolio for long term value growth. Examples include:
– Azerbaijan, where we agreed a 25 year extension to the ACG production sharingagreement, out to 2049. We also extended the In Amenas production sharingcontract in Algeria;
– Brazil, where we accessed the prolific Santos basin, and signed a letter of intent withPetrobras to jointly identify and evaluate business opportunities;
34

– On the other side of the Atlantic, where we accessed new acreage inCote d’Ivoire, and just last month, in Sao Tome and Principe; and
– In Norway, where our Aker BP joint venture continued its remarkablegrowth through acquiring Hess Norge.
We also had a good year of exploration, announcing six discoveries acrossSenegal, Egypt, Trinidad and the UK North Sea. We discovered around onebillion barrels of oil equivalent for the year which is our largest discoveredresource in exploration since 2004 – with Yakaar in Senegal the industry’sbiggest discovery of the year.
34
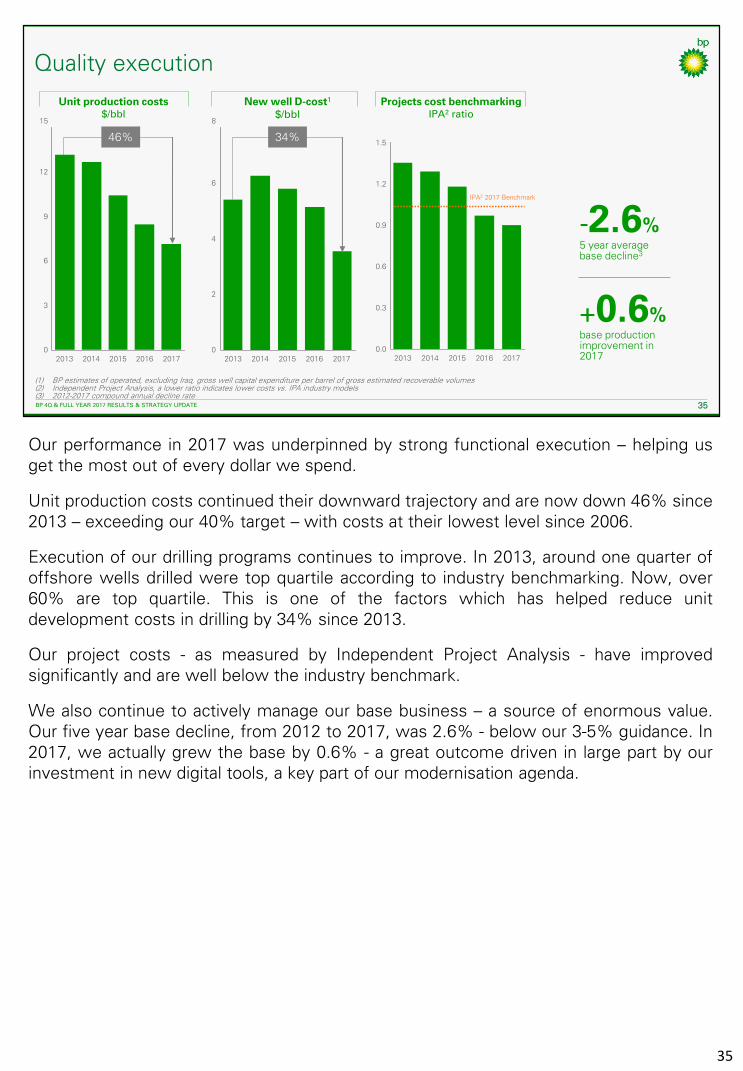
Our performance in 2017 was underpinned by strong functional execution – helping usget the most out of every dollar we spend.
Unit production costs continued their downward trajectory and are now down 46% since2013 – exceeding our 40% target – with costs at their lowest level since 2006.
Execution of our drilling programs continues to improve. In 2013, around one quarter ofoffshore wells drilled were top quartile according to industry benchmarking. Now, over60% are top quartile. This is one of the factors which has helped reduce unitdevelopment costs in drilling by 34% since 2013.
Our project costs - as measured by Independent Project Analysis - have improvedsignificantly and are well below the industry benchmark.
We also continue to actively manage our base business – a source of enormous value.Our five year base decline, from 2012 to 2017, was 2.6% - below our 3-5% guidance. In2017, we actually grew the base by 0.6% - a great outcome driven in large part by ourinvestment in new digital tools, a key part of our modernisation agenda.
BP 4Q & FULL YEAR 2017 RESULTS & STRATEGY UPDATE 35
Quality execution
Projects cost benchmarkingIPA2 ratio
Unit production costs$/bbl
New well D-cost1
$/bbl
+0.6%base production improvement in 2017
-2.6%5 year average base decline3
0.0
0.9
1.2
0.6
1.5
0.3
2016201520142013 2017
IPA2 2017 Benchmark
8
6
2
4
020172016201520142013
34%
6
3
15
9
0
12
20142013 2016 20172015
46%
(1) BP estimates of operated, excluding Iraq, gross well capital expenditure per barrel of gross estimated recoverable volumes(2) Independent Project Analysis, a lower ratio indicates lower costs vs. IPA industry models(3) 2012-2017 compound annual decline rate
35
BP 4Q & FULL YEAR 2017 RESULTS & STRATEGY UPDATE 36
(1) 2016-2025 average pre-tax operating cash flow per barrel at flat $52/bbl
High quality growth extended
BP net production from major projectsmboed
400
0
600
800
200
201820172016 20192015 2020 2021
1000 Appraise/Design
Construction
Operating
West Nile Delta –Taurus/Libra
Trinidad Onshore Compression
Quad 204
Persephone
Juniper
Khazzan Phase 1
Zohr
In Salah Southern Fields
Thunder Horse Water Injection
Point Thomson
Angola LNG
In Amenas Compression
Thunder Horse South Expansion
Atoll Phase 1
Clair Ridge
Constellation
Shah Deniz 2
West Nile Delta – Giza/Fayoum
Taas Expansion
Angelin
Culzean
Thunder Horse North West Expansion
Western Flank B
2017 2018
KG D6 R-Series
Tangguh Expansion
Alligin
Atlantis Phase 3
Vorlich
Zinia 2
Mad Dog Phase 2
Cassia Compression
KG D6 D55
KG D6 Satellites
Khazzan Phase 2
Tortue Phase 1
2016 2017 2018
2019 2020 2021
900mboedby 2021
35%greater cash margins than 2015 base1
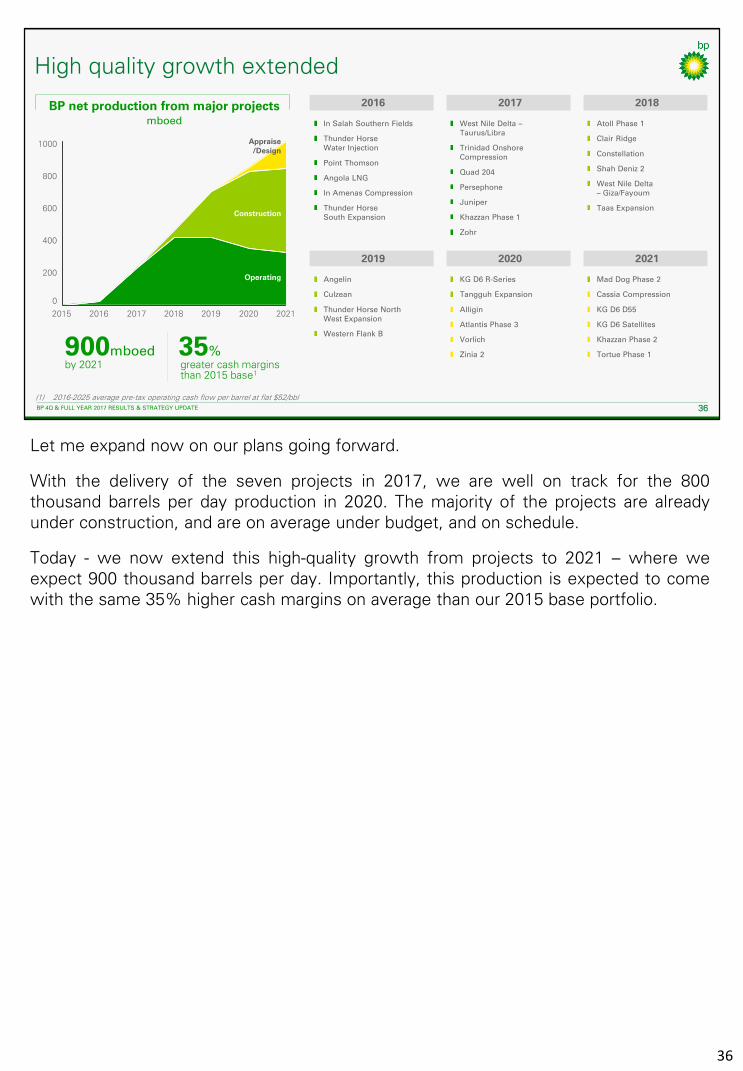
Let me expand now on our plans going forward.
With the delivery of the seven projects in 2017, we are well on track for the 800thousand barrels per day production in 2020. The majority of the projects are alreadyunder construction, and are on average under budget, and on schedule.
Today - we now extend this high-quality growth from projects to 2021 – where weexpect 900 thousand barrels per day. Importantly, this production is expected to comewith the same 35% higher cash margins on average than our 2015 base portfolio.
36

BP 4Q & FULL YEAR 2017 RESULTS & STRATEGY UPDATE 37
Confidence in free cash flow growth
(1) 2016-2021 compound annual growth rate (2) From 2015 base(3) Free cash flow proxy = Underlying RCPBIT+DD&A+EWO-Organic capital expenditure, 2021 at $55/bbl Brent 2017 real
2018 2021
Production 5-7% 5% CAGR1
6 potentialStronger long
term growthFIDs
Capitalexpenditure $13-14bn
Majorprojects 6 900mboed2start-ups
Free cash flow – pre-tax3
$bn
underlying growth
$12-13bn
2016 2017 2021
13-14
Turning to our ambition for free cash flow – in 2018 we intend to build on last year’sdelivery with another year of disciplined growth.
We expect underlying production growth of 5-7%. Reported growth will be lower thanthis due to portfolio effects, including the expiry of the ADMA concession, and ourdilution in Pan American Energy, ACG and the Magnus field.
We expect our organic capital expenditure in 2018 to be $12-13 billion – below ourguidance – while maintaining our growth targets. This is driven by improved capitalproductivity - not an absence of growth options. It is about getting more out of eachdollar with a disciplined focus on returns. We said we would make the changes stick –whatever the oil price – and we are committed to doing that and continuing to push forfurther improvement.
We expect to start-up around six major projects, and take a number of final investmentdecisions on projects including developments in Oman, India, Trinidad, and the NorthSea. High quality projects that we expect to further underpin growth through 2021 andbeyond.
Taking these together, we expect pre-tax free cash flow in 2018 to be higher than 2017without any help from oil price. This underpins our confidence in the progress we aremaking to deliver our target of $13-14 billion in free cash flow by 2021.
37

BP 4Q & FULL YEAR 2017 RESULTS & STRATEGY UPDATE 38
High quality growth options
Average 2018-25 pre-tax operating cash per barrel at equivalent price to 2015 actuals
Bubble size = net resources
Pre-FID hopper - projects and new wellsIRR (%)
20
40
0
Resources (bn boe)
Pre-FID major projects hopper
>40%
4bn boe
Development cost below DD&A
Accre
tiv
e t
o c
ash
marg
ins
Average unit DD&A
20
15
ave
rag
e
op
era
tin
g c
ash
/ b
bl
Now to the longer term. As we shared in Baku in 2016, we firmly believe we have thecapacity for quality growth out to 2030 – without the need for acquisitions. That beliefonly strengthens with time as we interrogate each barrel, and importantly continue toimprove our functional performance.
To help - let me start with some numbers. Let’s look at the middle of the next decade –2025.
As you would expect, our base will decline over that period – and for now we remainwith our traditional 3-5% guidance.
Let’s take a scenario whereby we wished to overcome this decline and to grow by –let’s say 1% from 2021 to 2025. In that scenario we expect to progress around 4 billionbarrels. To maintain quality, each barrel must continue to meet our hurdle rates.
Today, we know from our detailed Area Development Plans that we have 6 billionbarrels in our hopper that exceed our 15% IRR investment hurdle. As a reminder ourhurdle rates are 15% for greenfield and 20% for brownfield / infill at $60 per barrel. This6 billion barrels is more than enough for growth – in both volume and importantly,returns. And, none of this depends on future exploration success.
Beyond this – we have another 2 billion barrels that sit between 10 and 15% that wewill continue to optimise.
So we have a very large set of diversified investment opportunities that give usconfidence that we can grow this business, while growing returns, without the need fora major acquisition.
On the right – you can see how we test each investment decision to ensure it isaccretive to cash margin per barrel, or DD&A, or both. This is all about driving higherreturns into our business.
38

BP 4Q & FULL YEAR 2017 RESULTS & STRATEGY UPDATE 39
Gas
Growth options to 2025
ALASKA | Liberty
CANADA | Pike
GULF OF MEXICO
• Atlantis Ph.3
• Thunder Horse South Expansion 2
• Mad Dog Southwest Extension
• Tigris
TRINIDAD
• Cassia Compression
• Savannah
• SEQB - Macadamia
NORTH SEA
• Clair South
• Seagull
• Alligin
• Vorlich
RUSSIA | Turonian
AZERBAIJAN | Azeri Central East
EGYPT | West Nile Delta Phase 2
MAURITANIA & SENEGAL
• Tortue Phase 1
• Tortue FFD
ANGOLA
• Zinia 2
• B31 PAJ
INDIA
• KG D6 D55
• KG D6 Satellites
LATIN AMERICA | PAEG
OMAN | Khazzan Phase 2
Oil
AUSTRALIA
• Browse
• Lambert Deep
• South Goodwyn
NORWAY | AkerBP
L48
• Haynesville
• San Juan
• MidCon
• Greater Green River
Let me now add a little colour.
The map shows a number of the identified options which extend growth through to2025 – orange being gas, and green, oil.
Two high margin oil basins with price leverage are the Gulf of Mexico and the North Sea.In our plans right now, the combined production of these two basins will be higher in2025 than they are today, without any new exploration. We intend to deliver this throughsome but not all of the projects you see listed on this slide, and in field drillingopportunities. We have identified around 130 operated high margin wells we expect todrill by 2025. A real testament to the deep incumbent positions we have in these basinsand the materiality of the options that creates.
Oman Khazzan and the L48 are examples of huge gas resource bases with long, steadycash flows.
The Khazzan project has competitive development costs – around two thirds below ouraverage, and competitive cash margins. The combined scope of phase one and twoinvolves drilling about 300 wells with a plateau of around 180 thousand barrels per daynet, which we can expect to maintain throughout the next decade.
In the Lower 48, we have around 40 TCF of identified resources. Within this, we haveidentified around 1,300 wells we can drill in high quality plays with rates of return aboveour 20% hurdle. We have a further 3,000 wells that sit just below the hurdle rate thatwe continue to work. This gives us the option to grow production from around 300thousand barrels of oil equivalent today, to in excess of 400 thousand barrels by 2025 –all dependent upon investment levels. The opportunities include advantaged oil plays inthe Mid Continent and Greater Green River, and highly economic natural gas plays in theHaynesville and San Juan basins.
39

And we will continue to explore – in pursuit of gas and advantaged oil – butwith real discipline. The objective is to discover barrels which are betterthan the barrels we have today, as well as to keep our facilities full.
Our innovative alliance with Kosmos is expected to continue to build aleading position on the Africa Transform Margin. This year, we plan toconduct tests in the Santos Basin in Brazil, and in Nova Scotia, as well asexplore near our hubs in the Gulf of Mexico, Trinidad, North Sea, Egypt andIndonesia.
I hope this gives you a sense of the confidence we have in the resourcebase, and in the ability of the resource base to sustain quality growththrough the next decade.
39

Before ending – I would like to update you on our ‘modernisation and transformation’agenda which we discussed last February.
The benefits are now coming through to the bottom line, materially improvingperformance, as well as changing how it feels to work in the Upstream.
APEX – our production optimisation tool – has now been deployed in 21 assets across 7regions. It acts like the digital twin of our production systems. Since deploying APEX,engineers have added more than 30 thousand barrels per day of point in time productionthrough optimisation of well operating parameters. What used to take hours now takesminutes – with more than 15-fold reductions in production simulation run-times.
In our Lower 48 business we co-developed a pad optimisation mathematical model witha Silicon valley start-up. This is the first time it has been applied in the Oil and Gasindustry. When initially deployed on 180 wells and five pads, it reduced emissions by74%, increased production by 20%, and reduced costs by 22%.
Using machine learning - we aim to deliver more effective and focused inspectionprogrammes. We used 40 years of historical inspection, operating and weather datafrom 1,300 miles of piping to help predict where corrosion is and isn’t likely tooccur. This is helping improve reliability, increase production and increase the efficiencyof our inspections.
We are also harnessing the power of continuous improvement. In our Global OperationsOrganisation, 2,700 separate projects were completed last year, saving or mitigatingaround $330 million and adding or protecting around 55 thousand barrels per day ofproduction.
There are lots more examples – as you can see on the slide.
Overall, I remain excited by both the delivery – but importantly – the potential in thisagenda. As we said in Baku – there is more to come.
BP 4Q & FULL YEAR 2017 RESULTS & STRATEGY UPDATE 40
Value from modernisation and transformation
Supercomputing power doubled in 2017
Applying big data analytics in Lower 48
Finding a field in a field in the Gulf of Mexico
Reliability monitoring Optimising production
Global operations continuous improvement
2,700 individualprojects
$330mvaluecreated
55mboed production
200mmboe
reduction in venting74%
increase in production20%
reduced costs22%
9,000 trillioncalculations per second
40 million 30mboed
Machine intelligence informing business decisions
40 years
Acoustic sensing
30
new barrels identified in Atlantis using BP proprietary imaging algorithms
calculations per day on 400 pieces of Atlantis equipment using Plant Operations Advisor
wells in Azerbaijan with fibre optic sensing capability to detect sand
of data helping predict corrosion to drive more effective inspection programmes
Rapid field development in Oman
12Xproductivity gains using Siraaj optimisation tool
from APEX production system digital twin

BP 4Q 2017 RESULTS 41BP 4Q & FULL YEAR 2017 RESULTS & STRATEGY UPDATE 41
SAFETY
Upstream key messagesSTRATEGY
RETURNS LEDGROWTH
QUALITYEXECUTION
GROWING GAS AND ADVANTAGED OIL
12%productiongrowth 7 project
start-ups
46%
unit productioncost reduction vs 2013
free cashflow$6.9bn
2017 DELIVERY
core value#1
(1) 2016-2021 compound annual growth rate (2) Free cash flow proxy = Underlying RCPBIT+DD&A+EWO-organic capital expenditure, at $55/bbl Brent 2017 real. 2017 at actual prices
$13-14bn5%productionCAGR1
capital expenditurep.a. to 2021
free cashflow2 in 2021
KEY METRICS
$13-14bn
In summary, our strategy is clear, and it is working.
2017 has been a very strong year of delivery, with progress on all of our key metrics.2021 delivery has been materially de-risked and we are ahead of plan.
We continue to underpin growth beyond this, with a growing discovered resource base,laser focus on the efficiency of our capital spend, and an ambitious agenda to transformthe way we work.
Thank you for listening. And let me now handover to Tufan.
41